
Regularized Generalized Logistic Item Response Model

1
IPN—Leibniz Institute for Science and Mathematics Education, Olshausenstraße 62, 24118 Kiel, Germany
2
Centre for International Student Assessment (ZIB), Olshausenstraße 62, 24118 Kiel, Germany
Information 2023, 14(6), 306; https://doi.org/10.3390/info14060306
Submission received: 24 April 2023
/
Revised: 22 May 2023
/
Accepted: 23 May 2023
/
Published: 26 May 2023
(This article belongs to the Special Issue Advances in Data and Network Sciences Applied to Computational Social Science)
Abstract
:Item response theory (IRT) models are factor models for dichotomous or polytomous variables (i.e., item responses). The symmetric logistic or probit link functions are most frequently utilized for modeling dichotomous or polytomous items. In this article, we propose an IRT model for dichotomous and polytomous items using the asymmetric generalistic logistic link function that covers a lot of symmetric and asymmetric link functions. Compared to IRT modeling based on the logistic or probit link function, the generalized logistic link function additionally estimates two parameters related to the asymmetry of the link function. To stabilize the estimation of item-specific asymmetry parameters, regularized estimation is employed. The usefulness of the proposed model is illustrated through simulations and empirical examples for dichotomous and polytomous item responses.
1. Introduction
Item response theory (IRT) models [1,2,3,4] are a popular statistical method for analyzing dichotomous and polytomous random variables. IRT models can be classified into the area of multivariate statistics, which summarize a high-dimensional contingency table with a few latent factor variables of interest. Of particular interest is the application of IRT models in educational large-scale assessment (LSA; [5]), such as the program for international student assessment (PISA; [6]), which assesses the ability of students on test items in different cognitive domains, such as mathematics, reading, and science, across a wide range of countries all over the world.
In this article, we focus on unidimensional IRT models. These models are used for scaling cognitive test data to obtain a single unidimensional summary score [7]. Let be the vector of I polytomous random variables (i.e., items) with . A unidimensional IRT model [4] is a statistical model for the multivariate probability distribution for , where
The unidimensional latent variable follows a standard normal distribution with a density function , although this assumption can be weakened [8,9]. Conditional item response probabilities are defined as , where is a vector of the unknown item parameters of item i. Note that a local independence assumption is imposed in (1), which means that item responses and are conditionally independent for all item pairs given the latent ability variable . This property justifies the statement that the multivariate contingency table is summarized by a unidimensional latent variable .
The item parameters of the unidimensional IRT model in Equation (1) can be estimated by the (marginal) maximum likelihood (ML) using an expectation maximization (EM) algorithm [10,11]. The estimation can also involve a multi-matrix design in which only a subset of items is administered to each student [12,13]. In the likelihood formulation of (1), non-administered items are skipped in the multiplication terms in (1).
For dichotomous items, one often uses the abbreviated notation . The function is also referred to as the item response function (IRF). A popular choice of is the two-parameter logistic (2PL; [14]) model defined by , where denotes the logistic link function, is the item discrimination parameter, and is the item difficulty parameter. A simplified version of the 2PL model is the Rasch model [15,16], which constrains the item discriminations across items, leading to the IRF . A further alternative is the two-parameter probit (2PP; [2]) model that employs the standard normal distribution function (i.e., the probit link function).
There is increasing interest among researchers to use more flexible IRFs. In particular, the 2PL and 2PP models employ symmetric link functions. A variety of IRFs with asymmetric link functions have been proposed [17,18,19,20,21,22,23,24,25,26,27,28]. These kinds of models might be desirable if items do not follow the simple 2PL or 2PP models. In this article, we focus on item response modeling based on the generalized logistic link function [29]. This link function has been previously applied in [30] utilizing ML estimation, while [31] proposed a Markov chain Monte Carlo (MCMC) estimation approach. In this article, we thoroughly study ML estimation for the generalized logistic IRT model for dichotomous and polytomous item responses. Moreover, we also propose a regularized ML estimation approach aiming to stabilize the item parameter estimates.
The rest of the article is structured as follows. In Section 2, we introduce the IRT model based on the generalized logistic link function. Moreover, we propose the regularized estimation approach and discuss the application of this link function to polytomous items. Section 3 includes two simulation studies investigating the performance of estimating the generalized logistic IRT model for dichotomous items. Section 4 contains two empirical examples of datasets with dichotomous and polytomous items, respectively. Finally, the paper closes with a discussion in Section 5.
2. Item Response Modeling Based on the Generalized Logistic Link Function
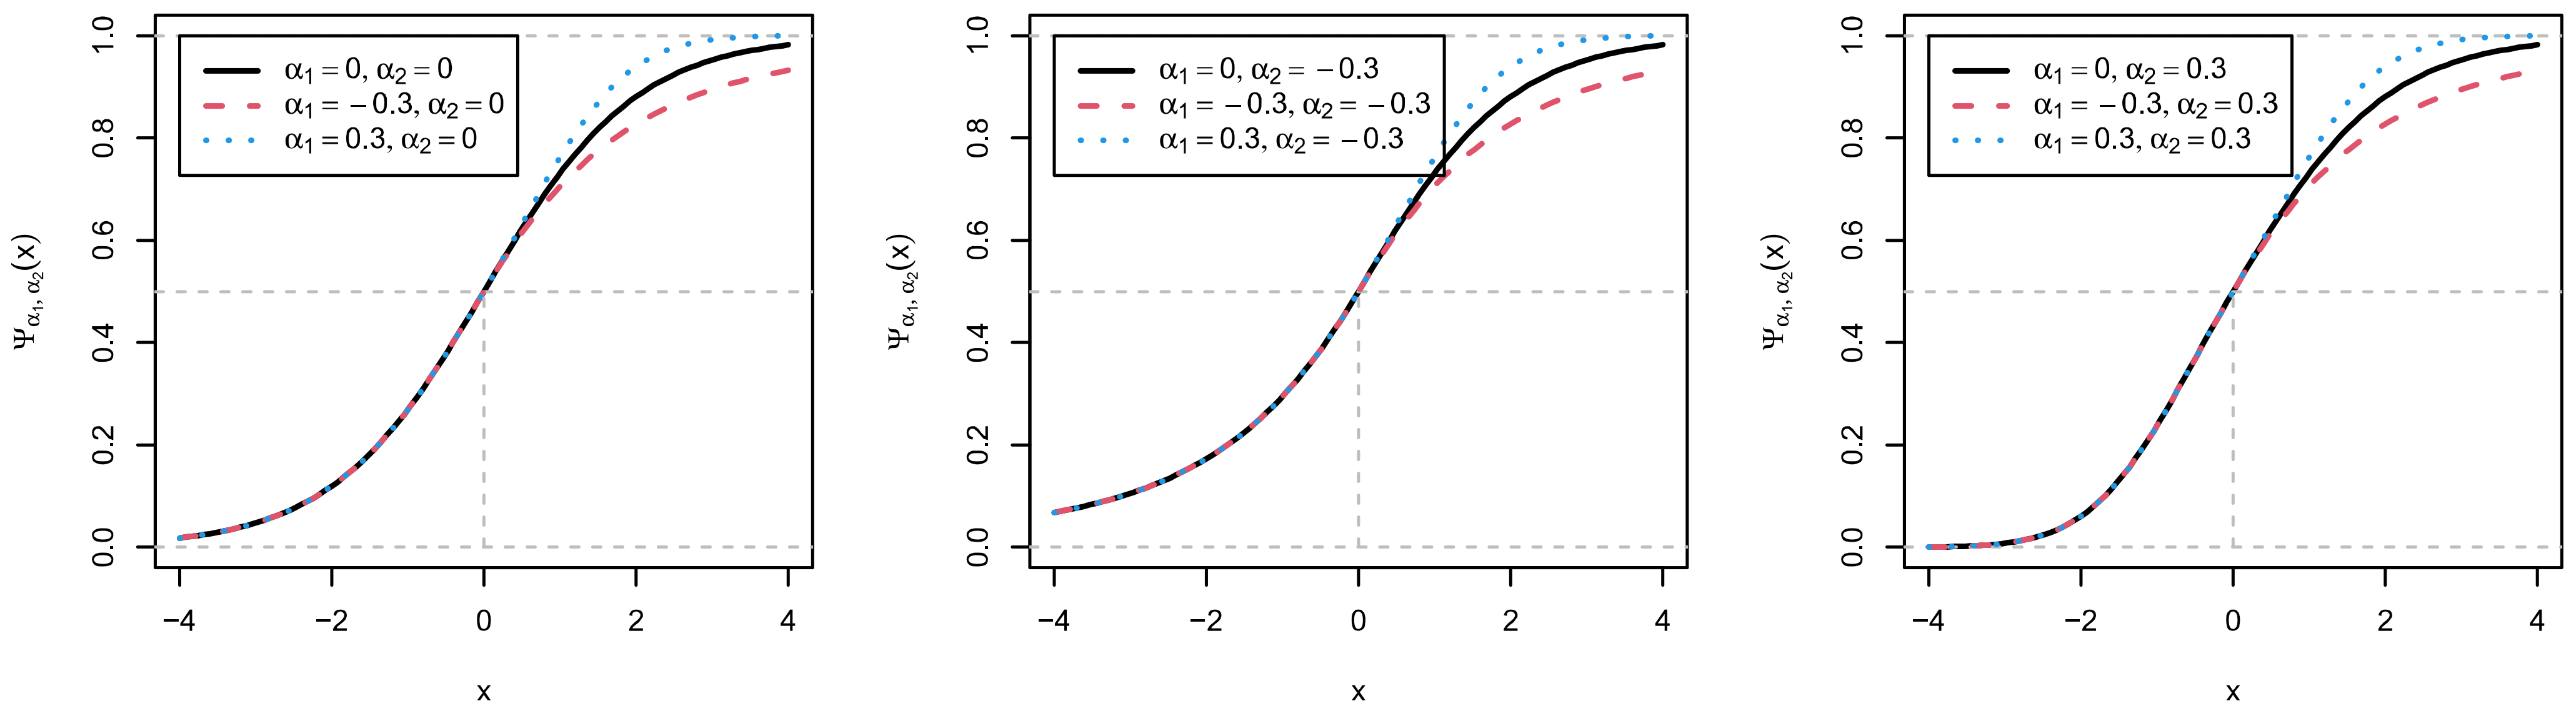
The generalized logistic IRT model relies on the generalized logistic link function proposed by Stukel [29]. For the real-valued asymmetry parameters and , the link function is defined by
where is defined by
The logistic link function is obtained with . The probit link function is approximately obtained with . More generally, symmetric link functions are obtained for , while asymmetry is introduced by imposing . The cloglog and loglog link functions [32] can also be well approximated by particular parameter values of and [31].
Figure 1 displays the generalized logistic link function for different values of and . It can be seen that governs the upper tail of the link function (i.e., ), and values different from 0 indicate deviations from the logistic link function. For positive values (i.e., ), the link function more quickly reaches the upper asymptote of one compared to the logistic link function , while there is slower convergence to the upper asymptote for negative values of . Moreover, the parameter models the deviations from the logistic link function in the lower tail of the link function (i.e., for ).
The generalized logistic link function defined in (3) can be used to define an IRF for a dichotomous item by
where is the vector of item parameters for item i. In (4), it is assumed that the shape parameters and are item-specific, but it might be desirable for parsimony reasons to constrain them to be equal across items.
Zhang et al. [31] proposed an MCMC estimation approach. In this approach, the factor variable must also be sampled, and parameter estimation can sometimes become computationally tedious. Therefore, ML estimation is always a viable alternative and computationally efficient for unidimensional IRT models, which is the reason for pursuing the ML estimation approach in this paper.
In [31], it was argued that a lower bound of must be imposed for and in order to ensure proper posterior distribution. To ensure a sufficiently stable estimation from experiences in previous research [30], we also bounded the and parameters by one. To this end, we transformed the bounded asymmetry parameters for and , which lie in the interval , into an unbounded parameter space using the Fisher transformation [33]
where denote the unbounded transformed parameters of the generalized logistic link function. The inverse Fisher transformation maps unbounded parameters to bounded parameters by means of the transformation
In ML estimation of the generalized logistic IRT model for dichotomous item responses, the vector of item parameters for item i is defined as . For the item response data for N persons and I items, we define the log-likelihood function l based on (1) by
for item responses of person p, and is the vector that collects the item parameters of all items . The log-likelihood function can be numerically maximized to obtain the item parameter estimates . In IRT software, the EM algorithm is frequently utilized [11,34].
2.1. Regularized Estimation
Estimating the shape parameters and (or and in the transformed parameter space) item by item might require large sample sizes and harms the precision of the estimated item parameters. On the other hand, constraining all shape parameters to be equal across items might be too restrictive, and this assumption might be violated by real-world item response data. As a compromise, the variability in shape parameters can be reduced by employing regularized ML estimation with fused ridge-type penalty functions [35].
Battauz proposed such a regularized estimation approach for the three-parameter [36] and four-parameter [37] logistic IRT models. In this paper, we propose the same approach for regularizing the and parameter estimates. The fused ridge penalty function is defined by
In regularized ML estimation, one maximizes the penalized log-likelihood function defined by
Using the penalty function in (8) implies that normal priors for with a common mean and a variance are imposed for (see [37]). Importantly, by only considering the differences in pairs of item parameters, the means are not explicitly estimated.
It is evident that the optimization of also involves the unknown regularization parameter . The k-fold cross-validation approach is used for obtaining the optimal regularization parameter . The dataset is divided into k groups, and the parameters of the model are estimated on folds leaving one fold out to evaluate the cross-validation error. This is performed by leaving one fold out in turn for each value of the regularization parameter . In this article, the error was evaluated using the negative log-likelihood function [37]. The smallest cross-validation error determines the choice of . In practice, or is frequently chosen.
2.2. Polytomous Items
The estimation approach based on the generalized logistic link function can also be applied to polytomous items with values [38]. We model conditional item response probabilities for which a score of at least k is obtained by
The item response probabilities for a category k are defined by
using the probabilities defined in (10) and . Note that (10) includes item-specific intercept parameters, while the item discrimination and the shape parameters and are constrained to be equal for all categories of item i in (10). Additionally, note that (10) and (11) can be interpreted as a generalization of the graded response model [39].
3. Simulation Studies
3.1. Simulation Study 1: Estimation of Common and Asymmetry Parameters
3.1.1. Method
First, in Simulation Study 1, the performance of ML estimation of the generalized logistic IRT model for dichotomous items is investigated when the data-generating model (DGM) assumes the common shape parameters and across the items. In the simulation, items were chosen. The item discrimination parameters and item difficulty parameters can be found in Table A1 in Appendix A. For the shape parameters, four different DGMs of combinations of and were studied. In the first condition (DGM1), we assumed , which corresponds to the logistic link function. In this case, applying the generalized logistic IRT model in favor of the 2PL model would not be necessary. The second condition (DGM2) corresponded to and , while the third condition (DGM3) resulted by choosing and . Obviously, the deviation from the logistic link function was more severe in DGM3 than in DGM2. In the fourth DGM (DGM4), we chose and to accommodate the guessing effects in IRFs.
Four different sample sizes, N, were chosen (i.e., 500, 1000, 2000, 4000) to represent the typical conditions in small-scale and large-scale studies that involve cognitive items. The latent variable was simulated using a standard normal distribution.
We estimated item parameters with two models. First, in Model M3 (we start with M3 for notational consistency with Simulation Study 2 and the empirical examples), we estimated the nonregularized generalized logistic IRT model with an equality constraint of and across all items ; that is, and for all . In the second model (Model M4), we used the 2PL model, which employs the logistic IRF that can be obtained by setting in the generalized logistic link function.
In total, 1500 replications were conducted in each simulation condition. We assessed the performance of parameter estimates for biases and the root mean square error (RMSE). To provide simple summary statistics across the parameter groups, we averaged the absolute biases and RMSE values across items for the same item parameter groups (i.e., the , , a, and b parameters). For a fair comparison between the misspecified 2PL model (Model M4) in DGM2 and DGM3 with the more complex generalized logistic IRT model, we employed the root integrated squared error (RISE; [40,41]) between an estimated IRF and a true data-generating IRF . The RISE statistic for item i is defined by
3.1.2. Results
Table 1 displays the (average) absolute bias (Bias) and (average) RMSE of the estimated model parameters. Overall, biases in the parameter estimates were very small and practically vanished in large sample sizes, such as . Moreover, the RMSE decreased with the increasing sample size, which is empirical evidence for the consistency property of ML estimates. The results turned out to be similar across the four different data-generating models. Notably, the RMSE values were larger for more asymmetric IRFs in DGM3 compared to DGM2. DGM4 performed similarly to DGM3 when the roles of the and were reversed.
In Table 2, the average root integrated square error (RISE) between the estimated item and true item response function is displayed as a function of the sample size N for IRT models using the generalized logistic link (Model M3) and the logistic link (Model M4) functions, respectively. It turned out that there are minor efficiency losses in terms of the RISE when the logistic link function (Model M4) corresponds to the data-generating model DGM1, which did not involve asymmetric item response functions. In contrast, in the data-generating models DGM2, DGM3, and DGM4, the symmetric logistic link function is misspecified, and the RISE for estimates based on the generalized logistic link function (Model M3) was smaller across all sample sizes. From these results, it can be concluded that the additional cost to the efficiency loss when applying the more complex generalized logistic IRT model is compensated for by less biased item response function estimates. For large sample sizes, the bias in the 2PL model outweighs the smaller variability in the estimated IRF.
3.2. Simulation Study 2: Estimation of Item-Specific and Asymmetry Parameters
3.2.1. Method
In Simulation Study 2, the DGM assumes the item-specific shape parameters and . As in Simulation Study 1, 20 items were employed in the simulation. The data-generating item parameters can be found in Table A1 in Appendix A.
In addition to Models M3 (i.e., joint and parameters) and M4 (i.e., the logistic link function), additional analysis models were specified. In Model M1, the generalized logistic IRT model was estimated without a regularization approach (i.e., nonregularized estimation). In Model M2, we employed regularized estimation with an optimal regularization parameter by using k-fold cross-validation utilizing the cross-validated log-likelihood value. In Model M6, we report the parameter estimates of the regularized estimation using a fixed regularization parameter .
In this simulation, we consider the sample sizes , 2000, and 4000. We did not simulate a sample size because larger sample sizes are certainly required for item-specific estimation of the generalized logistic IRT model.
In k-fold cross-validation, folds were used. A grid of 33 values was chosen: 0.000010, 0.000015, 0.000022, 0.000033, 0.000049, 0.000073, 0.000108, 0.000161, 0.000240, 0.000356, 0.000530, 0.000788, 0.001172, 0.001743, 0.002593, 0.003857, 0.005736, 0.008532, 0.012690, 0.018874, 0.028072, 0.041753, 0.062102, 0.092367, 0.137382, 0.204336, 0.303920, 0.452035, 0.672336, 1.0, 2.0, 5.0, and 10.0. Values between 0.000010 and 1.0 were equidistantly chosen on a logarithmic scale.
In total, 1500 replications were conducted. The absolute average bias and average RMSE are reported for the groups of item parameters. Moreover, the performance of the different models is also assessed with the RISE statistic (see (12)).
3.2.2. Results
Table 3 presents the average absolute bias and average RMSE for different analysis models as a function of sample size N. It can be seen that biases only vanish for the nonregularized (Model M1) and optimally regularized (Model M2) models. However, the variability in terms of the RMSE was much lower in Model M3, which assumes the joint shape parameters and or a regularized estimation with a relatively large regularization parameter (Model M6). Hence, it is up to the researcher whether the bias or RMSE matters for parameter estimates when choosing from among the different modeling alternatives.
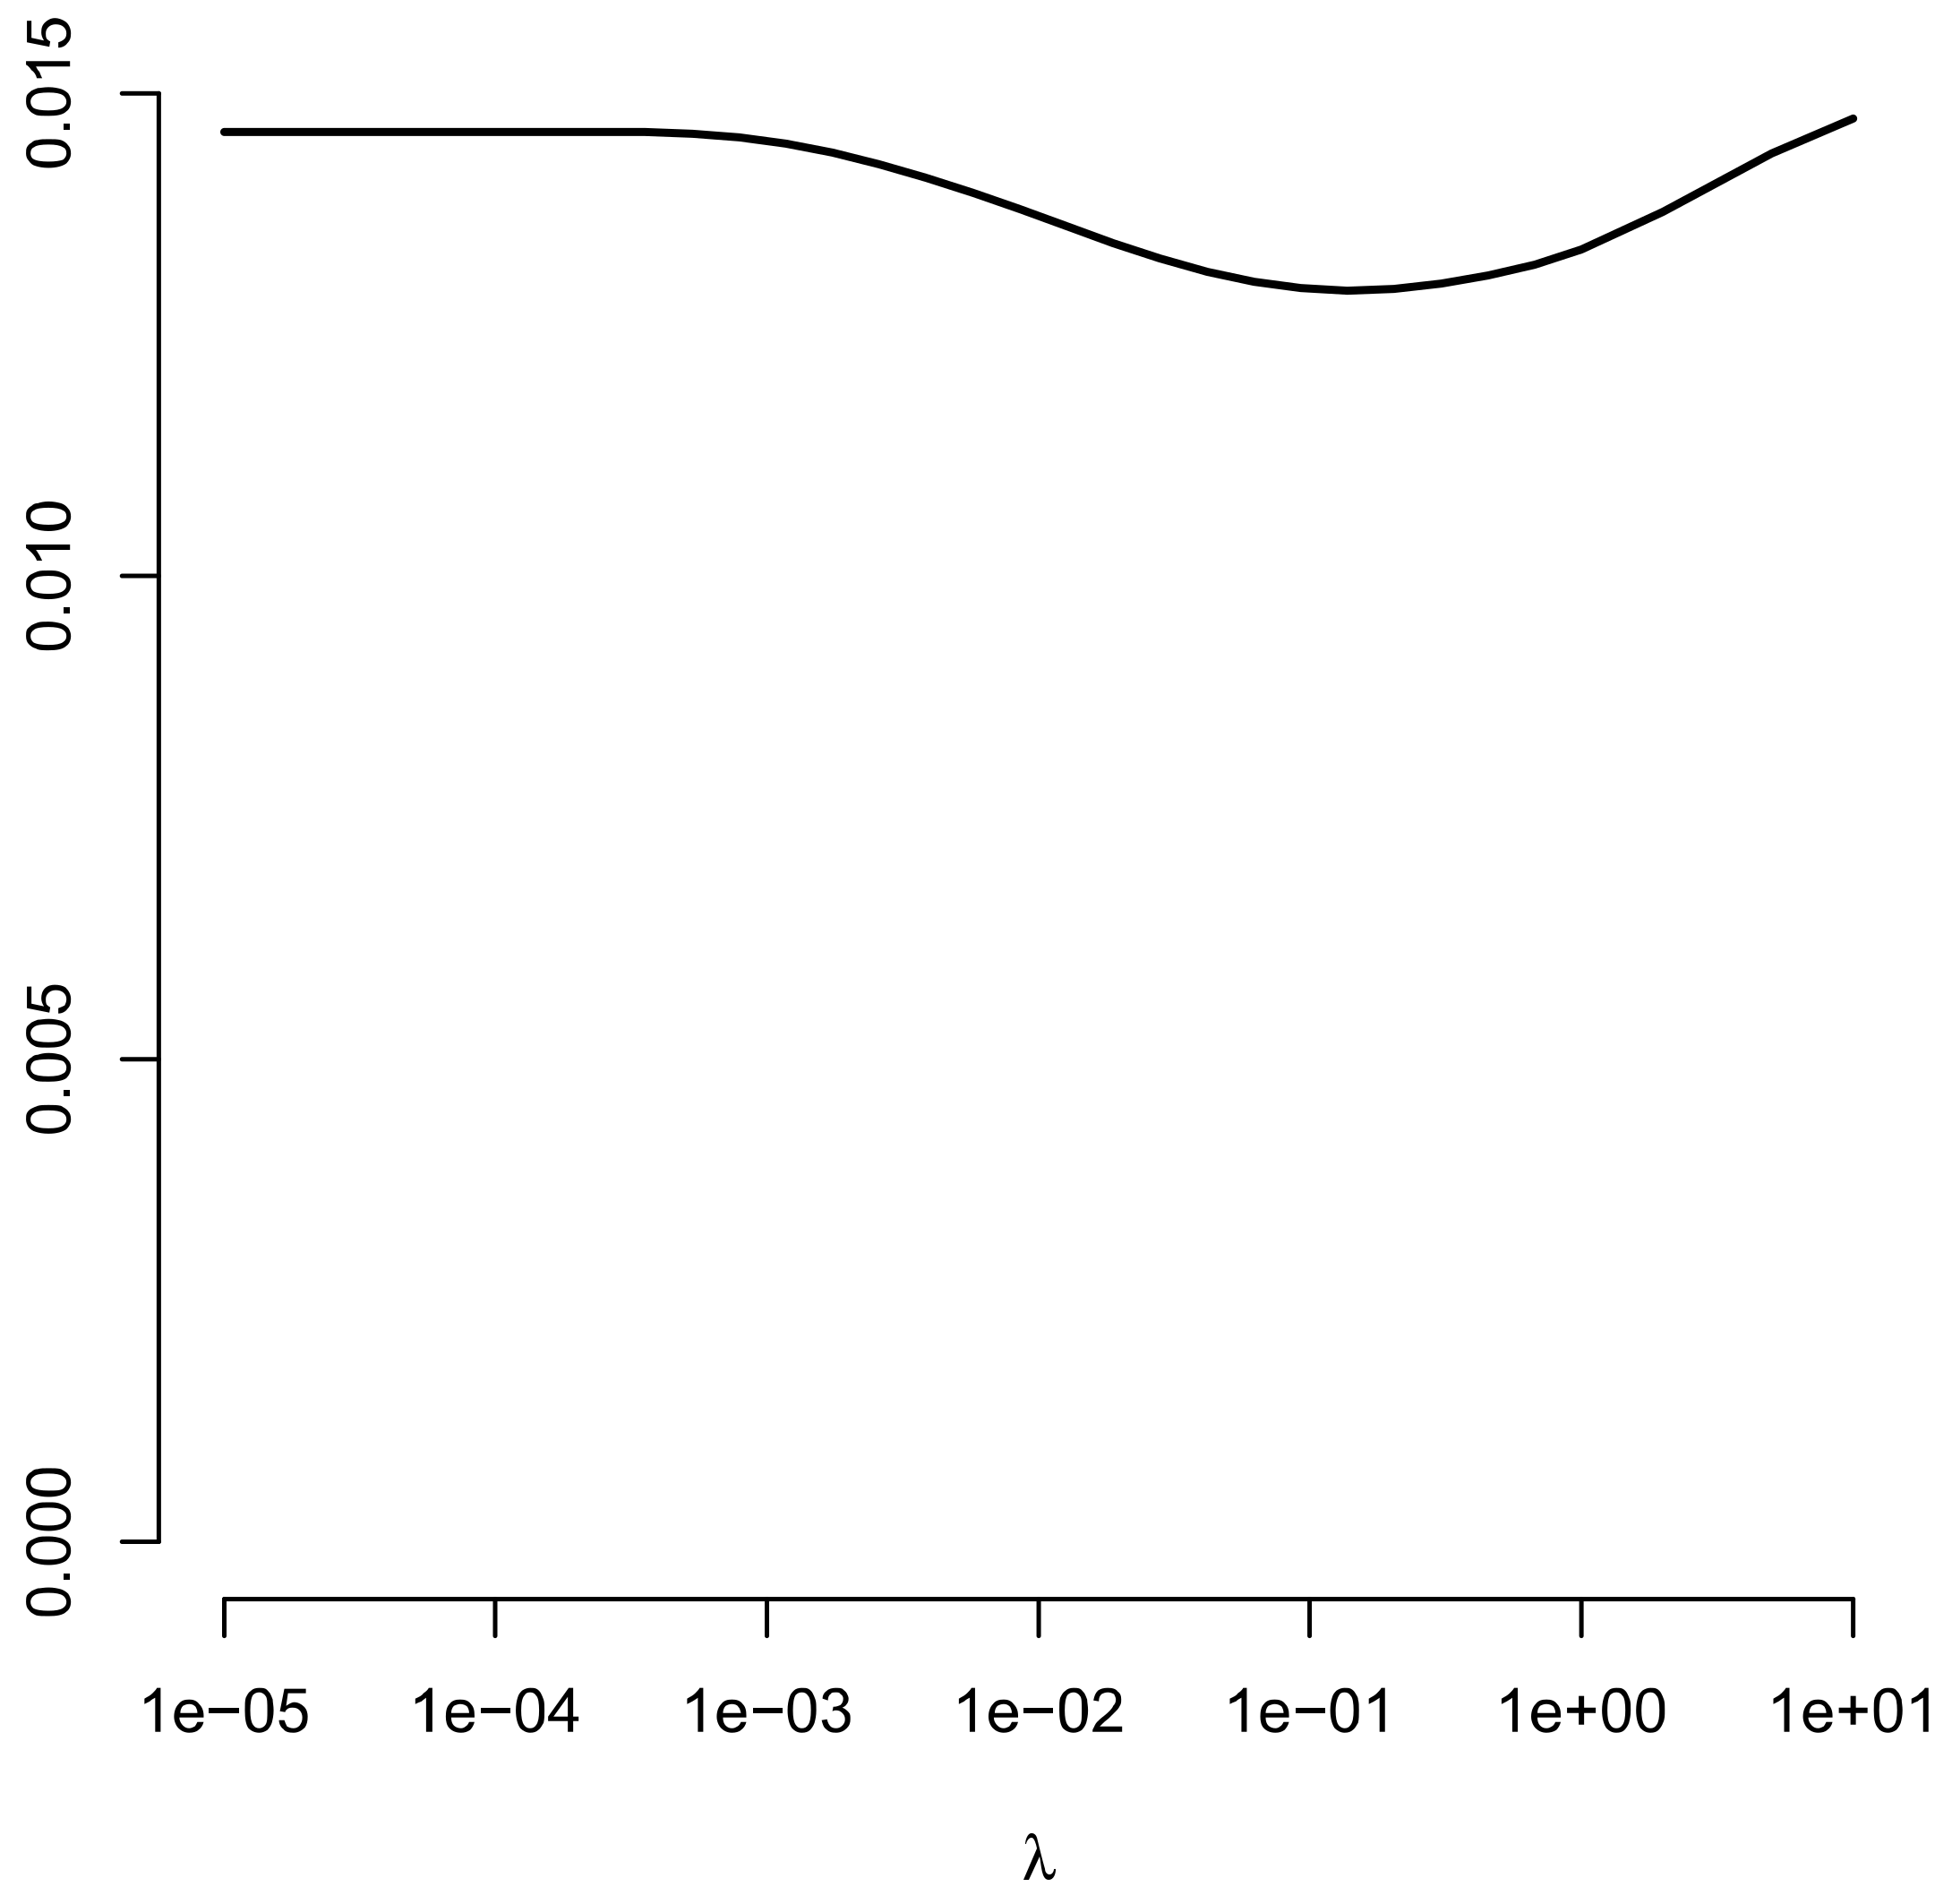
Figure 2 displays the average RISE as a function of the regularization parameter . A regularization parameter of about 0.20 minimizes the RISE statistic. Notably, this value is much larger than the optimal regularization parameter selected by the cross-validated log-likelihood function. In the subsequent table, Table Figure 2, we report a slightly larger regularization parameter .
Table 4 displays the RISE for different analysis models as a function of the sample size N. As it was also evident in Figure 2, an appropriate fixed regularization parameter can lead to smaller RISE values than an optimally selected regularization parameter based on the cross-validated log-likelihood. Nevertheless, it must be emphasized that all models that utilize the generalized logistic link function outperformed the misspecified logistic 2PL model (Model M4) for all sample sizes. This was also the case for Models M1 and M2, which resulted in highly variable item parameter estimates.
4. Empirical Examples
4.1. PISA 2006 Reading Dataset: Dichotomous Items
4.1.1. Method
We now apply the generalized logistic IRT model to the program for international student assessment (PISA; [44]) study. Ten countries were selected from the PISA 2006 study [44] in the reading domain. The ten countries were: Austria (AUT), Switzerland (CHE), Czech Republic (CZE), Germany (DEU), Finland (FIN), Japan (JPN), South Korea (KOR), Norway (NOR), Poland (POL), and Sweden (SWE).
In this analysis, we only used those students who had a reading test in the PISA 2006 study. For each country, 27 or 28 items were valid and used in the subsequent analysis. A total of 10 items were multiple-choice, while 18 items were constructed response or short response items. Seven polytomous items were dichotomously rescored, while only the largest category was treated as correct.
The used sample sizes per country in the analysis varied between and (, ). The average number of students per item varied across countries between 1337.7 and 2261.3 (, ). Sampling weights were not taken into account in the analysis because the two-stage stratified clustered sampling design would require a modified computation of the Akaike information criterion (AIC; [45,46]).
Five different analysis models were specified. In the first model, Model M1, the asymmetry parameters and were assumed to be item-specific and nonregularized. Model M2 estimated the item parameters by using the optimal regularization parameter via maximization of the cross-validated log-likelihood. In Model M3, the joint and parameters across items were assumed. Models M4 and M5 employed the logistic and probit link functions, respectively.
In Model M7, we fitted the three-parameter logistic (3PL; [47]) IRT model that also includes an item difficulty, an item discrimination, and a pseudo-guessing parameter. In Model M8, the three-parameter logistic model with residual heterogeneity (3PLRH; [23,25,30]) was fitted, which extends the 2PL model by including an asymmetry parameter. In Model M9, the four-parameter logistic (4PL; [48,49,50]) model was specified, which includes item difficulty, item discrimination, guessing, and slipping parameters.
All models were separately estimated for each country because this example did not focus on country comparisons but rather on comparing different IRT modeling alternatives. All IRT models were estimated using the sirt::xxirt() function in the R package sirt [43].
4.1.2. Results
In Table 5, the AIC is presented for all countries for Models M1, M3, M4, and M5. For all countries except for FIN and SWE, the generalized logistic IRT model with item-specific and parameters better fit the data than the 2PL model (Model M5). However, only for Finland (FIN), the constrained generalized logistic IRT model (Model M3) was the best-fitting model among the competitive IRT models. For six countries, the 3PLRH model (Model M8) was the best-fitting model, while for three countries, the 4PL model (Model M9) was the frontrunner among the models. Interestingly, in nine of the ten countries, the generalized logistic IRT model outperformed the 3PL model. Moreover, in all countries, the 4PL model outperformed the 3PL model. Additionally, the IRT model with the logistic link function fitted the datasets for all countries better than the IRT model with the probit link function. Hence, from a sole statistical perspective, the generalized IRT model or alternative IRT models should be preferred over the operationally used 2PL model [51] because of a better model fit.
In Table 6, the summary statistics of the estimated asymmetry parameters and are presented. The joint parameter from Model M3 ranged between and (, ) and was mostly negative. In contrast, the joint parameter from Model M3 was positive and ranged between 0.09 and 0.36 (, ). Overall, almost no differences in the summary statistics between the nonregularized and regularized estimations were observed.
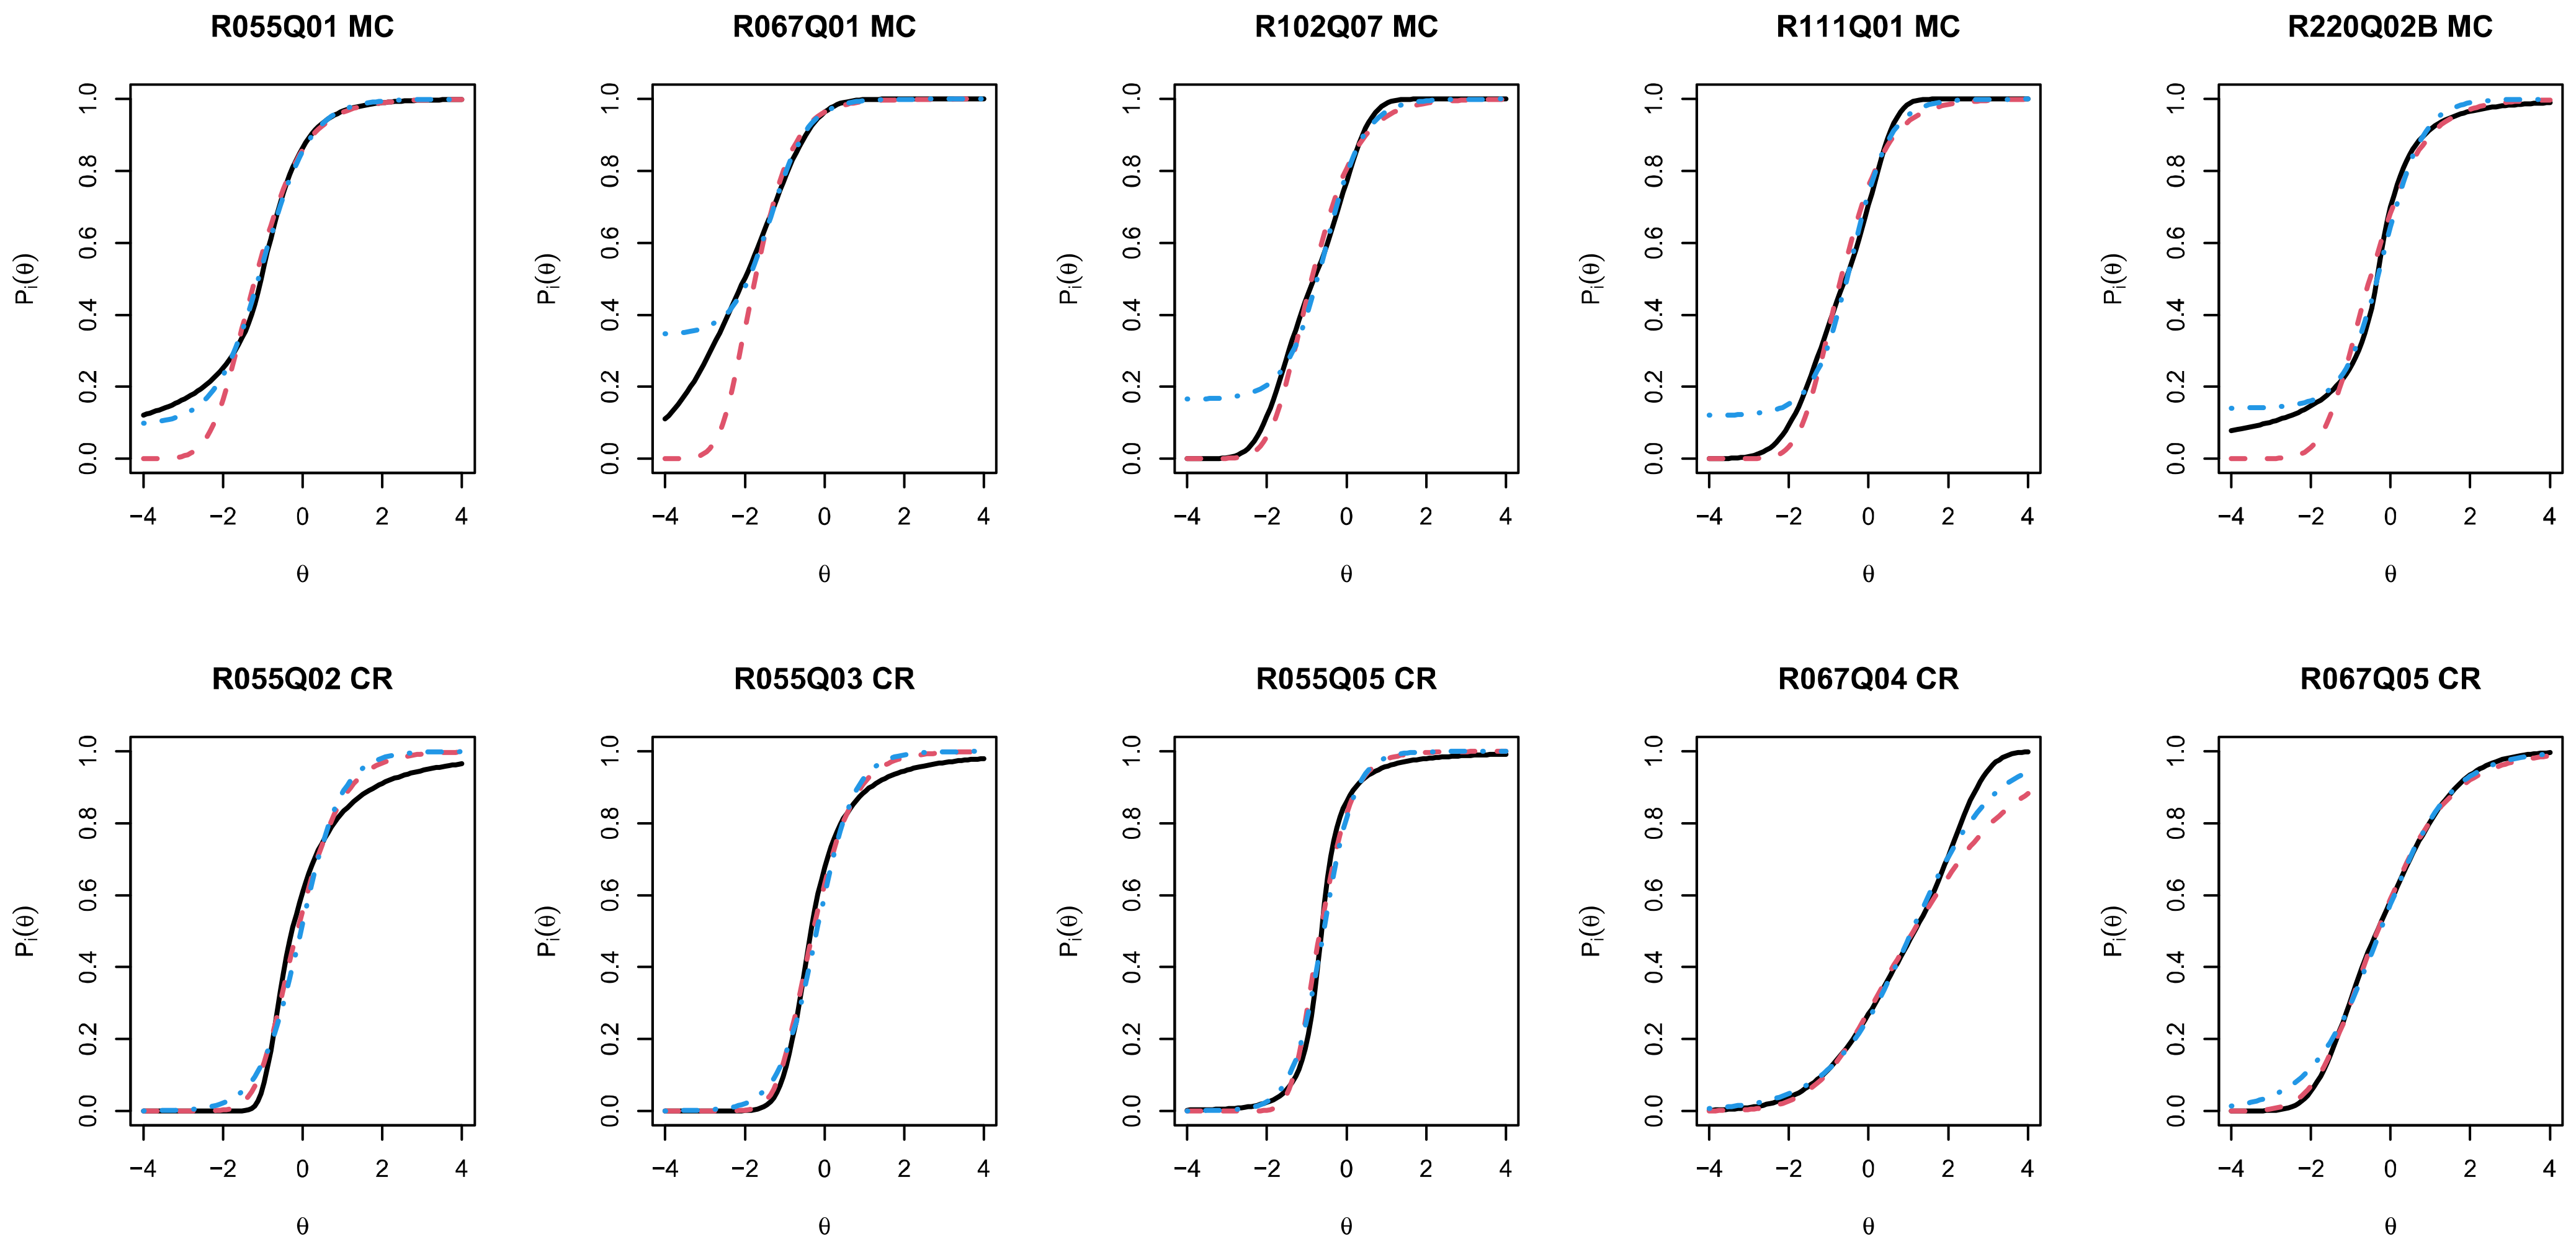
Figure 3 displays the estimated IRFs for the five MC items and five CR items for Germany (DEU) based on the nonregularized generalized logistic IRT model (Model M1), the 2PL model employing the logistic IRF (Model M4), and the 3PL model (Model M7). There is evidence of asymmetry in the IRF (i.e., for items R055Q02, R055Q03, and R067Q04) and guessing behavior (i.e., for items R055Q01 and R067Q01). Interestingly, the estimated IRF of the 3PL model also substantially differs from the generalized logistic IRT model. The item parameters for the generalized logistic IRT model (Model M1) of all 28 items for Germany can be found in Table A2 in Appendix B. In conclusion, the generalized logistic IRT model can more flexibly capture the functional form of the IRF.
4.2. ASTI Dataset: Polytomous Items
4.2.1. Method
In this example, the nonregularized and the regularized generalized logistic item response model is applied to questionnaire data. The adult self-transcendence inventory (ASTI; [52,53]) is a self-report scale measuring the complex target construct of wisdom. The items can be assigned to five dimensions: non-attachment (NA; 4 items), presence in the here-and-now and growth (PG; 6 items), peace of mind (PM; 4 items), self-knowledge and integration (SI; 4 items), and self-transcendence (ST; 7 items). The items had three or four response categories.
A dataset with responses to the ASTI questionnaire has been made available in the MPsychoR package as the data object ASTI [54,55]. It contains polytomous item responses from 1215 respondents.
The polytomous generalized logistic IRT model described in Section 2.2 was applied. The same five analysis models as in the PISA 2006 reading example (see Section 4.1) were specified. In Model M1, the asymmetry parameters and were assumed to be item-specific and nonregularized. Model M2 estimated the item parameters by using the optimal regularization parameter via maximization of the cross-validated log-likelihood function. Model M3 assumed the joint and parameters across the items. Models M4 and M5 utilized the logistic and probit link functions, respectively (see also [56]). Unidimensional IRT models were separately fitted to each of the five dimensions.
4.2.2. Results
In Table 7, the AIC values are displayed for the four different models M1, M2, M3, and M4 are displayed. The most complex Model M1 was preferred for scales PG and ST in which the asymmetry parameters and were made item-specific. Model M3, which assumed the joint shape parameters and , resulted in the best model fit for scales PM and SI. The graded response model with the logistic link function (Model M4) was selected by AIC for the NA scale. Interestingly, the logistic link function always resulted in a better model fit compared to the probit link function.
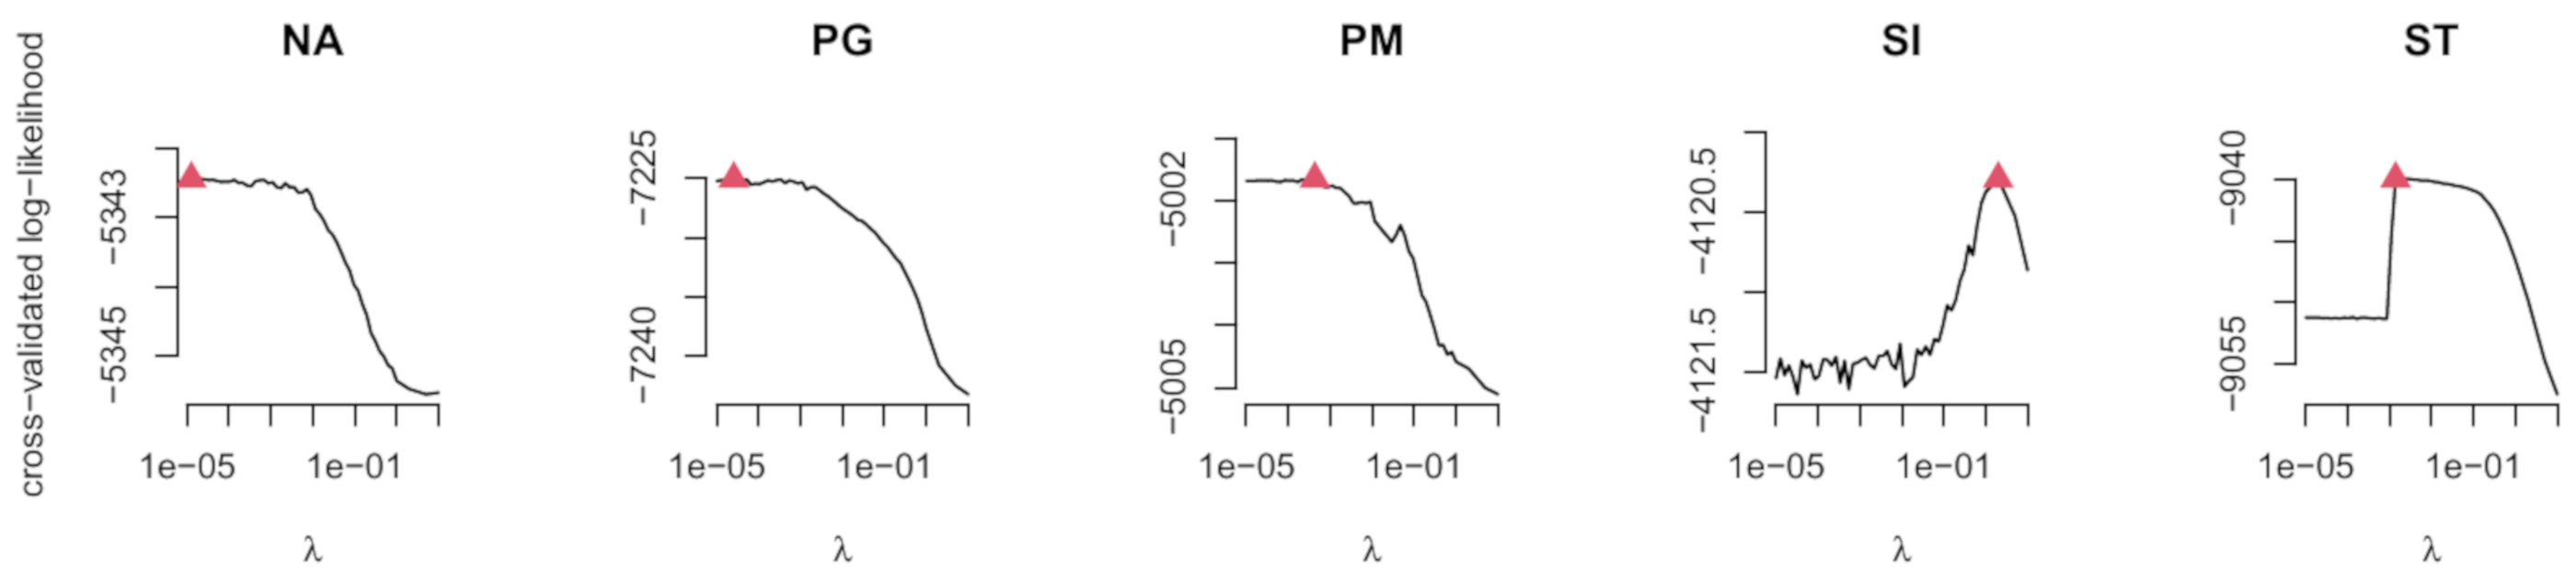
Figure 4 displays the cross-validated log-likelihood values for the five different ASTI scales. The maximum value of the cross-validated log-likelihood function is indicated by a red triangle. It can be seen that the optimal value was lowest for the NA and PG scales and largest for the SI scale.
In Table 8, the summary statistics for the and parameters are presented. Overall, the means of and were relatively similar in Models M1 and M2, which utilized nonregularized and regularized estimation, respectively. Substantial differences in standard deviations for the parameter were observed for scales SI and ST. These scales had the largest optimal regularization parameter (see Figure 4), which supports the plausibility of these differences. Note that, except for Model M3 for the PG scale, all of the estimated and parameters were (on average) negative.
5. Discussion
In this article, nonregularized and regularized maximum likelihood estimations of the generalized logistic IRT model for dichotomous and polytomous items were investigated. It was shown that parameter estimates were practically unbiased in large samples, and variability decreased with larger sample sizes. Moreover, this was present in the simulation, and the empirical examples that used regularized estimation were able to stabilize parameter estimates.
It should be emphasized that the variability of the estimated item parameters in the generalized logistic IRT model can be noteworthy, even in very large sample sizes such as . However, as in the three-parameter or four-parameter logistic IRT models, this is likely the case due to the large dependency among the four different item parameters. Nevertheless, estimated item response functions can still be relatively precise, which demonstrates the finding of stable item response functions despite the unstable estimation of item parameters [57]. Using complex IRT models might be preferable when the primary goal is deriving an optimal scoring rule that maximizes the extent of the extracted information from the observed item responses [58,59].
In applications, it is likely that item response functions typically differ for constructed response items and multiple-choice items. It might be interesting and parsimonious to separately estimate and for the two item formats but make them equal for items of the same item format. By estimating this, the guessing or slipping effects can be modeled by the generalized logistic IRT model.
As pointed out by an anonymous reviewer, it would be vital also to compare the generalized logistic IRT model to other IRT models, such as the three- or four-parameter logistic models, in the simulation studies. It might well be the case that despite quite different functional forms of utilized IRT models, there would not be negligible differences in the fitted item response functions of different types of IRT models.
There is a recent discussion about whether distributional assumptions must be taken for granted in ordinal factor analysis for analyzing polytomous items [60]. Most often, ordinal factor analysis in structural equation modeling software relies on the limited-information estimation method that utilizes tetrachoric or polychoric correlations [61]. Using polychoric correlations implies that one assumes an underlying normally distributed variable for each item (i.e., a latent normality assumption; [62,63,64]). It is argued in [60] that the distributional assumption for the underlying latent variable must be known by the researcher and cannot be identified from data. It is important to emphasize that the issue of non-identification is coupled with the goal of using limited information methods and computing a latent correlation matrix (i.e., polychoric correlations or correlations adapted to other pre-specified marginal distributions). To put this in other words, those researchers base the ordinal factor analysis on a normal copula model. When applying the generalized logistic IRT model (i.e., the generalized logistic link function) for exploratory or confirmatory factor analysis, residual distributions different from the normal distribution can be identified. In this case, simply no substantial knowledge is required for factor-analyzing ordinal data if there is enough data available for empirical identification.
As has been demonstrated in the PISA example dataset, other classes of flexible item response functions [48,65,66,67,68,69,70,71,72] can be considered as an alternative to the generalized logistic IRT model. These IRT models might even outperform the generalized logistic IRT model. However, it has been argued that analysis models should not be mainly chosen for statistical reasons in the operational practice in educational large-scale assessment studies [30,73,74,75,76]. This poses issues in test linking [77,78,79,80] if the preferred scoring model were a misspecified IRT model [81,82].
Appropriate linking methods should be applied that are relatively robust to model misspecifications (see [83]).
Funding
This research received no external funding.
Informed Consent Statement
Informed consent was obtained from all subjects involved in this study.
Data Availability Statement
The PISA 2006 dataset is available at https://www.oecd.org/pisa/pisaproducts/database-pisa2006.htm (accessed on 23 April 2023). The ASTI dataset is included in the R package MPsychoR and can be accessed within R by data(ASTI, package=’MPsychoR’).
Conflicts of Interest
The author declares no conflict of interest.
Abbreviations
The following abbreviations are used in this manuscript:
| 2PL | two-parameter logistic |
| 2PP | two-parameter probit |
| 3PL | three-parameter logistic |
| 3PLRH | three-parameter logistic with residual heterogeneity |
| 4PL | four-parameter logistic |
| AIC | Akaike information criterion |
| DGM | data-generating model |
| IRF | item response function |
| IRT | item response theory |
| LSA | large-scale assessment |
| MCMC | Markov chain Monte Carlo |
| ML | maximum likelihood |
| PISA | program for international student assessment |
| RMSE | root mean square error |
| SD | standard deviation |
Appendix A. Item Parameters Used in the Simulation Studies
Table A1 displays the item parameters that were used in the two simulation studies. The item parameters for Simulation Study 2 are exactly displayed in this table. The asymmetry parameters for the upper tail of the item response functions ranged between and (, ). The asymmetry parameters for the lower tail of the item response functions ranged between and (, ). The item discrimination parameters ranged between and (, ), while the item difficulty parameters ranged between and (, ).
For Simulation Study 1 (see Section 3.1.1), only the item discrimination parameters and item difficulty parameters are displayed in Table A1.

Table A1.
Used item parameters in Simulation Studies 1 and 2.
| Item | ||||
|---|---|---|---|---|
| 1 | −0.2 | −0.4 | 2.3 | −1.4 |
| 2 | −0.1 | 0.5 | 1.1 | −0.1 |
| 3 | −0.3 | 0.4 | 1.8 | −0.6 |
| 4 | −0.3 | 0.0 | 2.2 | −0.9 |
| 5 | −0.1 | 0.0 | 1.8 | −1.9 |
| 6 | 0.3 | 0.6 | 0.5 | 0.7 |
| 7 | −0.1 | 0.5 | 1.0 | −0.5 |
| 8 | −0.3 | 0.1 | 1.5 | 0.6 |
| 9 | 0.0 | 0.2 | 1.1 | 0.2 |
| 10 | −0.1 | 0.4 | 1.5 | −1.5 |
| 11 | 0.0 | 0.1 | 1.6 | −1.3 |
| 12 | 0.2 | 0.1 | 0.7 | 1.3 |
| 13 | −0.3 | 0.1 | 0.9 | 2.5 |
| 14 | −0.1 | −0.3 | 1.7 | −0.6 |
| 15 | −0.2 | 0.6 | 0.8 | 2.3 |
| 16 | 0.1 | 0.3 | 1.1 | 0.4 |
| 17 | −0.1 | 0.7 | 1.4 | −0.4 |
| 18 | −0.1 | 0.6 | 1.8 | −0.8 |
| 19 | −0.4 | −0.2 | 2.1 | −1.2 |
| 20 | −0.5 | −0.1 | 2.3 | 0.1 |
Appendix B. Estimated Item Parameters in the PISA 2006 Reading Dataset for Germany
Table A2 contains estimated item parameters of 28 items for the PISA 2006 reading dataset for Germany for the nonregularized generalized logistic IRT model (Model M1).
Table A2.
Estimated item parameters in the PISA 2006 reading dataset for Germany (DEU) in the nonregularized generalized logistic item response model (Model M1).
Table A2.
Estimated item parameters in the PISA 2006 reading dataset for Germany (DEU) in the nonregularized generalized logistic item response model (Model M1).
| Item | Type | Maxpts | ||||
|---|---|---|---|---|---|---|
| R055Q01 | MC | 1 | −0.11 | −0.95 | 1.99 | −1.04 |
| R055Q02 | CR | 1 | −0.46 | 0.93 | 1.84 | −0.27 |
| R055Q03 | CR | 2 | −0.48 | 0.22 | 2.61 | −0.34 |
| R055Q05 | CR | 1 | −0.52 | −0.28 | 4.82 | −0.63 |
| R067Q01 | MC | 1 | 0.49 | 0.08 | 0.97 | −2.01 |
| R067Q04 | CR | 2 | 0.87 | 0.21 | 0.78 | 1.16 |
| R067Q05 | CR | 2 | 0.13 | 0.65 | 0.97 | −0.34 |
| R102Q04A | CR | 1 | 0.28 | 0.96 | 1.22 | 0.28 |
| R102Q05 | CR | 1 | −0.98 | −0.20 | 1.98 | 0.35 |
| R102Q07 | MC | 1 | 0.80 | 0.74 | 1.04 | −0.82 |
| R104Q01 | CR | 1 | 0.50 | −0.85 | 1.79 | 0.00 |
| R104Q02 | CR | 1 | 0.49 | 1.00 | 0.27 | −0.46 |
| R104Q05 | CR | 2 | 0.38 | 1.00 | 0.43 | −0.46 |
| R111Q01 | MC | 1 | 0.43 | −0.52 | 1.12 | 1.40 |
| R111Q02B | CR | 2 | −0.11 | 0.92 | 1.37 | −0.64 |
| R111Q06B | CR | 2 | 0.14 | 0.45 | 1.55 | −1.43 |
| R219Q01E | CR | 1 | 0.99 | −0.52 | 2.38 | −0.80 |
| R219Q01T | CR | 1 | 0.98 | −0.68 | 3.00 | −0.47 |
| R219Q02 | CR | 1 | 0.86 | −0.68 | 2.56 | −0.32 |
| R220Q01 | CR | 1 | 0.98 | 0.12 | 1.47 | −2.62 |
| R220Q02B | MC | 1 | −0.99 | −0.33 | 2.89 | −0.40 |
| R220Q04 | MC | 1 | −0.80 | −0.43 | 1.86 | −0.10 |
| R220Q05 | MC | 1 | −0.91 | −0.84 | 1.00 | 2.10 |
| R220Q06 | MC | 1 | −0.98 | −0.65 | 2.30 | −0.25 |
| R227Q01 | MC | 1 | 0.14 | −0.39 | 0.78 | −0.01 |
| R227Q02T | MC | 2 | 0.12 | 0.33 | 1.07 | 0.26 |
| R227Q03 | CR | 1 | −0.38 | −0.18 | 3.32 | −0.47 |
| R227Q06 | CR | 1 | 0.26 | −0.57 | 2.25 | −0.04 |
Note. Type = item format; CR = constructed response (or short response); MC = multiple-choice; Maxpts = maximum score per item.
References
- van der Linden, W.J.; Hambleton, R.K. (Eds.) Handbook of Modern Item Response Theory; Springer: New York, NY, USA, 1997. [Google Scholar] [CrossRef]
- De Ayala, R.J. The Theory and Practice of Item Response Theory; Guilford Publications: New York, NY, USA, 2022. [Google Scholar]
- Bock, R.D.; Moustaki, I. Item response theory in a general framework. In Handbook of Statistics; Rao, C.R., Sinharay, S., Eds.; Elsevier: Amsterdam, The Netherlands, 2007; Volume 26 Psychometrics, pp. 469–513. [Google Scholar] [CrossRef]
- Yen, W.M.; Fitzpatrick, A.R. Item response theory. In Educational Measurement; Brennan, R.L., Ed.; Praeger Publishers: Westport, UK, 2006; pp. 111–154. [Google Scholar]
- Rutkowski, L.; von Davier, M.; Rutkowski, D. (Eds.) A Handbook of International Large-Scale Assessment: Background, Technical Issues, and Methods of Data Analysis; Chapman Hall/CRC Press: London, UK, 2013. [Google Scholar] [CrossRef]
- OECD. PISA 2009. Technical Report; OECD: Paris, France, 2012; Available online: https://bit.ly/3xfxdwD (accessed on 24 April 2023).
- Berezner, A.; Adams, R.J. Why large-scale assessments use scaling and item response theory. In Implementation of Large-Scale Education Assessments; Lietz, P., Cresswell, J.C., Rust, K.F., Adams, R.J., Eds.; Wiley: New York, NY, USA, 2017; pp. 323–356. [Google Scholar] [CrossRef]
- Casabianca, J.M.; Lewis, C. IRT item parameter recovery with marginal maximum likelihood estimation using loglinear smoothing models. J. Educ. Behav. Stat. 2015, 40, 547–578. [Google Scholar] [CrossRef]
- Xu, X.; von Davier, M. Fitting the Structured General Diagnostic Model to NAEP Data; (Research Report No. RR-08-28); Educational Testing Service: Princeton, NJ, USA, 2008. [Google Scholar] [CrossRef]
- Bock, R.D.; Aitkin, M. Marginal maximum likelihood estimation of item parameters: Application of an EM algorithm. Psychometrika 1981, 46, 443–459. [Google Scholar] [CrossRef]
- Aitkin, M. Expectation maximization algorithm and extensions. In Handbook of Item Response Theory; van der Linden, W.J., Ed.; CRC Press: Boca Raton, FL, USA, 2016; Volume 2: Statistical Tools, pp. 217–236. [Google Scholar] [CrossRef]
- von Davier, M. Imputing proficiency data under planned missingness in population models. In A Handbook of International Large-Scale Assessment: Background, Technical Issues, and Methods of Data Analysis; Rutkowski, L., von Davier, M., Rutkowski, D., Eds.; Chapman Hall/CRC Press: London, UK, 2013; pp. 175–201. [Google Scholar] [CrossRef]
- Frey, A.; Hartig, J.; Rupp, A.A. An NCME instructional module on booklet designs in large-scale assessments of student achievement: Theory and practice. Educ. Meas. 2009, 28, 39–53. [Google Scholar] [CrossRef]
- Birnbaum, A. Some latent trait models and their use in inferring an examinee’s ability. In Statistical Theories of Mental Test Scores; Lord, F.M., Novick, M.R., Eds.; MIT Press: Reading, MA, USA, 1968; pp. 397–479. [Google Scholar]
- Rasch, G. Probabilistic Models for Some Intelligence and Attainment Tests; Danish Institute for Educational Research: Copenhagen, Denmark, 1960. [Google Scholar]
- von Davier, M. The Rasch model. In Handbook of Item Response Theory; van der Linden, W.J., Ed.; CRC Press: Boca Raton, FL, USA, 2016; Volume 1: Models, pp. 31–48. [Google Scholar] [CrossRef]
- Azevedo, C.L.; Bolfarine, H.; Andrade, D.F. Bayesian inference for a skew-normal IRT model under the centred parameterization. Comput. Stat. Data Anal. 2011, 55, 353–365. [Google Scholar] [CrossRef]
- Bazán, J.L.; Bolfarine, H.; Branco, M.D. A skew item response model. Bayesian Anal. 2006, 1, 861–892. [Google Scholar] [CrossRef]
- Bazán, J.L.; Branco, M.D.; Bolfarine, H. Extensions of the skew-normal ogive item response model. Braz. J. Probab. Stat. 2014, 28, 1–23. [Google Scholar] [CrossRef]
- Bazán, J.L.; Flores, A.S.E.; Azevedo, C.L.N.; Dey, D.K. Revisiting the Samejima–Bolfarine–Bazán IRT models: New features and extensions. Braz. J. Probab. Stat. 2023, 37, 1–25. [Google Scholar] [CrossRef]
- Bolfarine, H.; Bazán, J.L. Bayesian estimation of the logistic positive exponent IRT model. J. Educ. Behav. Stat. 2010, 35, 693–713. [Google Scholar] [CrossRef]
- Bolt, D.M.; Liao, X. Item complexity: A neglected psychometric feature of test items? Psychometrika 2022, 87, 1195–1213. [Google Scholar] [CrossRef]
- Lee, S.; Bolt, D.M. An alternative to the 3PL: Using asymmetric item characteristic curves to address guessing effects. J. Educ. Meas. 2018, 55, 90–111. [Google Scholar] [CrossRef]
- Molenaar, D.; Dolan, C.V.; De Boeck, P. The heteroscedastic graded response model with a skewed latent trait: Testing statistical and substantive hypotheses related to skewed item category functions. Psychometrika 2012, 77, 455–478. [Google Scholar] [CrossRef] [PubMed]
- Molenaar, D. Heteroscedastic latent trait models for dichotomous data. Psychometrika 2015, 80, 625–644. [Google Scholar] [CrossRef] [PubMed]
- Samejima, F. Departure from normal assumptions: A promise for future psychometrics with substantive mathematical modeling. Psychometrika 1997, 62, 471–493. [Google Scholar] [CrossRef]
- Samejima, F. Logistic positive exponent family of models: Virtue of asymmetric item characteristic curves. Psychometrika 2000, 65, 319–335. [Google Scholar] [CrossRef]
- Shim, H.; Bonifay, W.; Wiedermann, W. Parsimonious asymmetric item response theory modeling with the complementary log-log link. Behav. Res. Methods 2023, 55, 200–219. [Google Scholar] [CrossRef]
- Stukel, T.A. Generalized logistic models. J. Am. Stat. Assoc. 1988, 83, 426–431. [Google Scholar] [CrossRef]
- Robitzsch, A. On the choice of the item response model for scaling PISA data: Model selection based on information criteria and quantifying model uncertainty. Entropy 2022, 24, 760. [Google Scholar] [CrossRef]
- Zhang, J.; Zhang, Y.Y.; Tao, J.; Chen, M.H. Bayesian item response theory models with flexible generalized logit links. Appl. Psychol. Meas. 2022, 46, 382–405. [Google Scholar] [CrossRef]
- Agresti, A. Categorical Data Analysis; John Wiley & Sons: New York, NY, USA, 2012; Volume 792. [Google Scholar] [CrossRef]
- Fisher, R.A. Frequency distribution of the values of the correlation coefficient in samples from an indefinitely large population. Biometrika 1915, 10, 507–521. [Google Scholar] [CrossRef]
- Hanson, B. IRT Parameter Estimation Using the EM Algorithm; Technical Report. 2000. Available online: https://bit.ly/3i4pOdg (accessed on 24 April 2023).
- van Erp, S.; Oberski, D.L.; Mulder, J. Shrinkage priors for Bayesian penalized regression. J. Math. Psychol. 2019, 89, 31–50. [Google Scholar] [CrossRef]
- Battauz, M.; Bellio, R. Shrinkage estimation of the three-parameter logistic model. Brit. J. Math. Stat. Psychol. 2021, 74, 591–609. [Google Scholar] [CrossRef] [PubMed]
- Battauz, M. Regularized estimation of the four-parameter logistic model. Psych 2020, 2, 269–278. [Google Scholar] [CrossRef]
- Nering, M.L.; Ostini, R. Handbook of Polytomous Item Response Theory Models; Taylor & Francis: Boca Raton, FL, USA, 2011. [Google Scholar] [CrossRef]
- Samejima, F. Graded response model. In Handbook of Item Response Theory; van der Linden, W.J., Hambleton, R.K., Eds.; Springer: New York, NY, USA, 1997; pp. 85–100. [Google Scholar]
- Douglas, J.; Cohen, A. Nonparametric item response function estimation for assessing parametric model fit. Appl. Psychol. Meas. 2001, 25, 234–243. [Google Scholar] [CrossRef]
- Sueiro, M.J.; Abad, F.J. Assessing goodness of fit in item response theory with nonparametric models: A comparison of posterior probabilities and kernel-smoothing approaches. Educ. Psychol. Meas. 2011, 71, 834–848. [Google Scholar] [CrossRef]
- R Core Team. R: A Language and Environment for Statistical Computing; R Core Team: Vienna, Austria, 2023; Available online: https://www.R-project.org/ (accessed on 15 March 2023).
- Robitzsch, A. sirt: Supplementary Item Response Theory Models; R Package Version 3.13-151; R Core Team: Vienna, Austria, 2023; Available online: https://github.com/alexanderrobitzsch/sirt (accessed on 23 April 2023).
- OECD. PISA 2006. Technical Report; OECD: Paris, France, 2009; Available online: https://bit.ly/38jhdzp (accessed on 24 April 2023).
- Lumley, T.; Scott, A. AIC and BIC for modeling with complex survey data. J. Surv. Stat. Methodol. 2015, 3, 1–18. [Google Scholar] [CrossRef]
- Trendtel, M.; Robitzsch, A. A Bayesian item response model for examining item position effects in complex survey data. J. Educ. Behav. Stat. 2021, 46, 34–57. [Google Scholar] [CrossRef]
- Lord, F.M.; Novick, R. Statistical Theories of Mental Test Scores; Addison-Wesley: Reading, MA, USA, 1968. [Google Scholar]
- Culpepper, S.A. The prevalence and implications of slipping on low-stakes, large-scale assessments. J. Educ. Behav. Stat. 2017, 42, 706–725. [Google Scholar] [CrossRef]
- Loken, E.; Rulison, K.L. Estimation of a four-parameter item response theory model. Brit. J. Math. Stat. Psychol. 2010, 63, 509–525. [Google Scholar] [CrossRef]
- Robitzsch, A. Four-parameter guessing model and related item response models. Math. Comput. Appl. 2022, 27, 95. [Google Scholar] [CrossRef]
- OECD. PISA 2015. Technical Report; OECD: Paris, France, 2017; Available online: https://bit.ly/32buWnZ (accessed on 24 April 2023).
- Levenson, M.R.; Jennings, P.A.; Aldwin, C.M.; Shiraishi, R.W. Self-transcendence: Conceptualization and measurement. Int. J. Aging Hum. Dev. 2005, 60, 127–143. [Google Scholar] [CrossRef]
- Koller, I.; Levenson, M.R.; Glück, J. What do you think you are measuring? A mixed-methods procedure for assessing the content validity of test items and theory-based scaling. Front. Psychol. 2017, 8, 126. [Google Scholar] [CrossRef]
- Mair, P. MPsychoR: Modern Psychometrics with R; R Package Version 0.10-8; R Core Team: Vienna, Austria, 2020; Available online: https://CRAN.R-project.org/package=MPsychoR (accessed on 18 June 2020).
- Mair, P. Modern Psychometrics with R; Springer: Berlin/Heidelberg, Germany, 2018. [Google Scholar] [CrossRef]
- Forero, C.G.; Maydeu-Olivares, A. Estimation of IRT graded response models: Limited versus full information methods. Psychol. Methods 2009, 14, 275–299. [Google Scholar] [CrossRef] [PubMed]
- Ogasawara, H. Stable response functions with unstable item parameter estimates. Appl. Psychol. Meas. 2002, 26, 239–254. [Google Scholar] [CrossRef]
- Ramsay, J.; Wiberg, M.; Li, J. Full information optimal scoring. J. Educ. Behav. Stat. 2020, 45, 297–315. [Google Scholar] [CrossRef]
- Ramsay, J.; Li, J.; Wiberg, M. Better rating scale scores with information–based psychometrics. Psych 2020, 2, 347–369. [Google Scholar] [CrossRef]
- Grønneberg, S.; Foldnes, N. Factor analyzing ordinal items requires substantive knowledge of response marginals. Psychol. Methods 2022. Epub ahead of print. [Google Scholar] [CrossRef]
- Muthén, B. A general structural equation model with dichotomous, ordered categorical, and continuous latent variable indicators. Psychometrika 1984, 49, 115–132. [Google Scholar] [CrossRef]
- Foldnes, N.; Grønneberg, S. On identification and non-normal simulation in ordinal covariance and item response models. Psychometrika 2019, 84, 1000–1017. [Google Scholar] [CrossRef]
- Foldnes, N.; Grønneberg, S. The sensitivity of structural equation modeling with ordinal data to underlying non-normality and observed distributional forms. Psychol. Methods 2022, 27, 541–567. [Google Scholar] [CrossRef]
- Robitzsch, A. Why ordinal variables can (almost) always be treated as continuous variables: Clarifying assumptions of robust continuous and ordinal factor analysis estimation methods. Front. Educ. 2020, 5, 589965. [Google Scholar] [CrossRef]
- Bolt, D.M.; Deng, S.; Lee, S. IRT model misspecification and measurement of growth in vertical scaling. J. Educ. Meas. 2014, 51, 141–162. [Google Scholar] [CrossRef]
- Duncan, K.A.; MacEachern, S.N. Nonparametric Bayesian modelling for item response. Stat. Model. 2008, 8, 41–66. [Google Scholar] [CrossRef]
- Falk, C.F.; Cai, L. Semiparametric item response functions in the context of guessing. J. Educ. Meas. 2016, 53, 229–247. [Google Scholar] [CrossRef]
- Feuerstahler, L.M. Metric transformations and the filtered monotonic polynomial item response model. Psychometrika 2019, 84, 105–123. [Google Scholar] [CrossRef] [PubMed]
- Feuerstahler, L. Flexible item response modeling in R with the flexmet package. Psych 2021, 3, 447–478. [Google Scholar] [CrossRef]
- Liang, L.; Browne, M.W. A quasi-parametric method for fitting flexible item response functions. J. Educ. Behav. Stat. 2015, 40, 5–34. [Google Scholar] [CrossRef]
- Ramsay, J.O. A comparison of three simple test theory models. Psychometrika 1989, 54, 487–499. [Google Scholar] [CrossRef]
- Rossi, N.; Wang, X.; Ramsay, J.O. Nonparametric item response function estimates with the EM algorithm. J. Educ. Behav. Stat. 2002, 27, 291–317. [Google Scholar] [CrossRef]
- Brennan, R.L. Misconceptions at the intersection of measurement theory and practice. Educ. Meas. 1998, 17, 5–9. [Google Scholar] [CrossRef]
- Camilli, G. IRT scoring and test blueprint fidelity. Appl. Psychol. Meas. 2018, 42, 393–400. [Google Scholar] [CrossRef]
- Hemker, B.T. To a or not to a: On the use of the total score. In Essays on Contemporary Psychometrics; van der Ark, L.A., Emons, W.H.M., Meijer, R.R., Eds.; Springer: Cham, Switzerland, 2023; pp. 251–270. [Google Scholar] [CrossRef]
- Robitzsch, A.; Lüdtke, O. Some thoughts on analytical choices in the scaling model for test scores in international large-scale assessment studies. Meas. Instrum. Soc. Sci. 2022, 4, 9. [Google Scholar] [CrossRef]
- Battauz, M. Multiple equating of separate IRT calibrations. Psychometrika 2017, 82, 610–636. [Google Scholar] [CrossRef] [PubMed]
- Kolen, M.J.; Brennan, R.L. Test Equating, Scaling, and Linking; Springer: New York, NY, USA, 2014. [Google Scholar] [CrossRef]
- Lee, W.C.; Lee, G. IRT linking and equating. In The Wiley Handbook of Psychometric Testing: A Multidisciplinary Reference on Survey, Scale and Test; Irwing, P., Booth, T., Hughes, D.J., Eds.; Wiley: New York, NY, USA, 2018; pp. 639–673. [Google Scholar] [CrossRef]
- Sansivieri, V.; Wiberg, M.; Matteucci, M. A review of test equating methods with a special focus on IRT-based approaches. Statistica 2017, 77, 329–352. [Google Scholar] [CrossRef]
- Fischer, L.; Rohm, T.; Carstensen, C.H.; Gnambs, T. Linking of Rasch-scaled tests: Consequences of limited item pools and model misfit. Front. Psychol. 2021, 12, 633896. [Google Scholar] [CrossRef] [PubMed]
- Zhao, Y.; Hambleton, R.K. Practical consequences of item response theory model misfit in the context of test equating with mixed-format test data. Front. Psychol. 2017, 8, 484. [Google Scholar] [CrossRef]
- Robitzsch, A. A comparison of linking methods for two groups for the two-parameter logistic item response model in the presence and absence of random differential item functioning. Foundations 2021, 1, 116–144. [Google Scholar] [CrossRef]
Figure 1.
Generalized logistic link function for different combinations of asymmetry parameter values and .
Figure 1.
Generalized logistic link function for different combinations of asymmetry parameter values and .

Figure 2.
Simulation Study 2: Average root integrated square error (RISE) between estimated item and true item response function as a function of the regularization parameter for a sample size .
Figure 2.
Simulation Study 2: Average root integrated square error (RISE) between estimated item and true item response function as a function of the regularization parameter for a sample size .

Figure 3.
Example PISA 2006 Reading: Estimated item response functions for five multiple-choice (MC) and five constructed response (CR) items for Germany (DEU) using the nonregularized generalized logistic IRT model (Model M1; displayed with solid black lines), the two-parameter logistic (2PL) IRT model (Model M4; displayed with dashed red lines), and the three-parameter logistic (3PL) IRT model (Model M7; displayed with dashed-dotted blue lines).

Figure 4.
Example ASTI: Cross-validated log-likelihood values in regularized estimation for the five ASTI scales as a function of the regularization parameter .
Figure 4.
Example ASTI: Cross-validated log-likelihood values in regularized estimation for the five ASTI scales as a function of the regularization parameter .

Table 1.
Simulation Study 1: (Average) absolute bias and (average) root mean square error (RMSE) of parameter estimates from Model M3 (M3: joint and ) as a function of sample size N and for four different data-generating models DGM1, DGM2, DGM3, and DGM4.
Table 1.
Simulation Study 1: (Average) absolute bias and (average) root mean square error (RMSE) of parameter estimates from Model M3 (M3: joint and ) as a function of sample size N and for four different data-generating models DGM1, DGM2, DGM3, and DGM4.
| DGM | Par | Bias | RMSE | ||||||
|---|---|---|---|---|---|---|---|---|---|
| 500 | 1000 | 2000 | 4000 | 500 | 1000 | 2000 | 4000 | ||
| DGM1: , | 0.019 | 0.008 | 0.004 | 0.002 | 0.094 | 0.060 | 0.038 | 0.026 | |
| 0.025 | 0.012 | 0.004 | 0.003 | 0.145 | 0.091 | 0.061 | 0.040 | ||
| a | 0.008 | 0.004 | 0.003 | 0.001 | 0.268 | 0.181 | 0.126 | 0.086 | |
| b | 0.021 | 0.009 | 0.005 | 0.003 | 0.175 | 0.117 | 0.080 | 0.056 | |
| DGM2: , | 0.005 | 0.006 | 0.002 | 0.000 | 0.089 | 0.061 | 0.042 | 0.029 | |
| 0.044 | 0.025 | 0.010 | 0.003 | 0.177 | 0.116 | 0.073 | 0.051 | ||
| a | 0.012 | 0.003 | 0.003 | 0.003 | 0.264 | 0.179 | 0.123 | 0.087 | |
| b | 0.020 | 0.009 | 0.005 | 0.002 | 0.169 | 0.113 | 0.078 | 0.055 | |
| DGM3: , | 0.007 | 0.002 | 0.000 | 0.002 | 0.112 | 0.077 | 0.053 | 0.037 | |
| 0.056 | 0.024 | 0.012 | 0.007 | 0.195 | 0.123 | 0.083 | 0.056 | ||
| a | 0.011 | 0.007 | 0.006 | 0.002 | 0.282 | 0.197 | 0.136 | 0.094 | |
| b | 0.022 | 0.010 | 0.005 | 0.003 | 0.173 | 0.117 | 0.081 | 0.056 | |
| DGM4: , | 0.057 | 0.024 | 0.011 | 0.006 | 0.169 | 0.104 | 0.069 | 0.046 | |
| 0.027 | 0.009 | 0.004 | 0.003 | 0.189 | 0.128 | 0.085 | 0.060 | ||
| a | 0.011 | 0.006 | 0.003 | 0.002 | 0.313 | 0.215 | 0.149 | 0.104 | |
| b | 0.032 | 0.013 | 0.008 | 0.003 | 0.202 | 0.130 | 0.088 | 0.061 | |
Note. DGM = data-generating model; Par = parameter.
Table 2.
Simulation Study 1: Average root integrated square error (RISE) between estimated item and true item response function as a function of sample size N for the generalized logistic link (Model M3) and the logistic link (Model M4) function and for four different data-generating models DGM1, DGM2, DGM3, and DGM4.
| DGM | Model | N | |||
|---|---|---|---|---|---|
| 500 | 1000 | 2000 | 4000 | ||
| DGM1: , | M3: joint and | 0.027 | 0.019 | 0.014 | 0.010 |
| M4: logistic link (2PL) | 0.026 | 0.018 | 0.013 | 0.009 | |
| DGM2: , | M3: joint and | 0.028 | 0.019 | 0.014 | 0.010 |
| M4: logistic link (2PL) | 0.032 | 0.026 | 0.022 | 0.020 | |
| DGM3: , | M3: joint and | 0.028 | 0.020 | 0.014 | 0.010 |
| M4: logistic link (2PL) | 0.038 | 0.032 | 0.029 | 0.027 | |
| DGM4: , | M3: joint and | 0.028 | 0.020 | 0.014 | 0.010 |
| M4: logistic link (2PL) | 0.036 | 0.030 | 0.027 | 0.025 | |
Note. DGM = data-generating model.
Table 3.
Simulation Study 2: (Average) absolute bias and (average) root mean square error (RMSE) of parameter estimates as a function of sample size N.
Table 3.
Simulation Study 2: (Average) absolute bias and (average) root mean square error (RMSE) of parameter estimates as a function of sample size N.
| Par | Model | Bias | RMSE | ||||
|---|---|---|---|---|---|---|---|
| 1000 | 2000 | 4000 | 1000 | 2000 | 4000 | ||
| M1: and item-specific, nonregularized | 0.072 | 0.051 | 0.037 | 0.454 | 0.365 | 0.286 | |
| M2: and item-specific, regularized with | 0.077 | 0.055 | 0.040 | 0.411 | 0.349 | 0.283 | |
| M6: and item-specific, regularized with | 0.141 | 0.140 | 0.137 | 0.167 | 0.158 | 0.152 | |
| M3: joint and | 0.149 | 0.149 | 0.150 | 0.169 | 0.159 | 0.155 | |
| M1: and item-specific, nonregularized | 0.086 | 0.061 | 0.036 | 0.532 | 0.440 | 0.346 | |
| M2: and item-specific, regularized with | 0.113 | 0.074 | 0.038 | 0.496 | 0.428 | 0.343 | |
| M6: and item-specific, regularized with | 0.259 | 0.249 | 0.235 | 0.289 | 0.268 | 0.248 | |
| M3: joint and | 0.273 | 0.272 | 0.272 | 0.302 | 0.287 | 0.280 | |
| a | M1: and item-specific, nonregularized | 0.116 | 0.063 | 0.036 | 0.571 | 0.401 | 0.284 |
| M2: and item-specific, regularized with | 0.098 | 0.058 | 0.036 | 0.535 | 0.391 | 0.282 | |
| M6: and item-specific, regularized with | 0.195 | 0.185 | 0.174 | 0.283 | 0.244 | 0.217 | |
| M3: joint and | 0.211 | 0.211 | 0.212 | 0.287 | 0.253 | 0.235 | |
| b | M1: and item-specific, nonregularized | 0.018 | 0.013 | 0.007 | 0.151 | 0.111 | 0.082 |
| M2: and item-specific, regularized with | 0.025 | 0.016 | 0.008 | 0.149 | 0.110 | 0.082 | |
| M6: and item-specific, regularized with | 0.046 | 0.042 | 0.037 | 0.124 | 0.092 | 0.071 | |
| M3: joint and | 0.050 | 0.049 | 0.048 | 0.126 | 0.095 | 0.077 | |
Note. Par = parameter.
Table 4.
Simulation Study 2: Average root integrated square error (RISE) between estimated item and true item response function as a function of sample size N.
Table 4.
Simulation Study 2: Average root integrated square error (RISE) between estimated item and true item response function as a function of sample size N.
| N | |||
|---|---|---|---|
| Model | 1000 | 2000 | 4000 |
| M1: and item-specific, nonregularized | 0.027 | 0.020 | 0.015 |
| M2: and item-specific, regularized with | 0.026 | 0.020 | 0.015 |
| M6: and item-specific, regularized with | 0.022 | 0.017 | 0.013 |
| M3: joint and | 0.023 | 0.018 | 0.015 |
| M4: logistic link (2PL) | 0.029 | 0.025 | 0.023 |
Table 5.
Example PISA 2006 Reading: Akaike information criterion (AIC) for model comparisons for ten selected countries.
Table 5.
Example PISA 2006 Reading: Akaike information criterion (AIC) for model comparisons for ten selected countries.
| Model | AUT | CHE | CZE | DEU | FIN | JPN | KOR | NOR | POL | SWE |
|---|---|---|---|---|---|---|---|---|---|---|
| M1: and item-specific, nonregularized | 41,134 | 63,611 | 48,878 | 40,663 | 36,300 | 52,888 | 39,937 | 39,918 | 46,768 | 37,446 |
| M3: joint and | 41,151 | 63,657 | 48,953 | 40,719 | 36,263 | 53,024 | 39,959 | 39,986 | 46,800 | 37,440 |
| M4: logistic link (2PL) | 41,159 | 63,691 | 48,976 | 40,763 | 36,294 | 53,074 | 39,993 | 40,017 | 46,807 | 37,453 |
| M5: probit link (2PP) | 41,167 | 63,692 | 48,999 | 40,769 | 36,315 | 53,088 | 40,023 | 40,025 | 46,813 | 37,459 |
| M7: three-parameter logistic (3PL) | 41,155 | 63,682 | 48,955 | 40,759 | 36,297 | 53,016 | 39,982 | 39,981 | 46,777 | 37,455 |
| M8: 3PL & residual heterogeneity (3PLRH) | 41,114 | 63,587 | 48,888 | 40,630 | 36,269 | 52,877 | 39,903 | 39,892 | 46,741 | 37,421 |
| M9: four-parameter logistic (4PL) | 41,127 | 63,607 | 48,861 | 40,652 | 36,291 | 52,877 | 39,935 | 39,915 | 46,735 | 37,435 |
Note. Models with minimal AIC value are printed in bold font.
Table 6.
Example PISA 2006 Reading: Summary of estimated and parameters in different models for ten selected countries.
Table 6.
Example PISA 2006 Reading: Summary of estimated and parameters in different models for ten selected countries.
| Par | Model | AUT | CHE | CZE | DEU | FIN | JPN | KOR | NOR | POL | SWE |
|---|---|---|---|---|---|---|---|---|---|---|---|
| Model M3 | −0.05 | 0.01 | −0.10 | −0.04 | −0.15 | −0.15 | −0.20 | −0.09 | −0.01 | −0.03 | |
| Mean of Model M1 | −0.18 | −0.14 | −0.36 | −0.14 | −0.31 | −0.23 | −0.36 | −0.22 | −0.09 | −0.08 | |
| Mean of Model M2 | −0.18 | −0.14 | −0.36 | −0.14 | −0.31 | −0.22 | −0.36 | −0.22 | −0.09 | −0.08 | |
| of Model M1 | 0.43 | 0.45 | 0.40 | 0.55 | 0.41 | 0.54 | 0.40 | 0.49 | 0.56 | 0.54 | |
| of Model M2 | 0.43 | 0.45 | 0.41 | 0.52 | 0.41 | 0.53 | 0.40 | 0.49 | 0.56 | 0.54 | |
| Model M3 | 0.12 | 0.33 | 0.10 | 0.36 | 0.25 | 0.21 | 0.09 | 0.22 | 0.17 | 0.23 | |
| Mean of Model M1 | 0.03 | 0.17 | −0.14 | 0.16 | 0.03 | 0.17 | −0.10 | 0.16 | −0.04 | 0.17 | |
| Mean of Model M2 | 0.03 | 0.17 | −0.14 | 0.18 | 0.03 | 0.17 | −0.10 | 0.16 | −0.04 | 0.18 | |
| of Model M1 | 0.69 | 0.65 | 0.69 | 0.65 | 0.72 | 0.68 | 0.81 | 0.75 | 0.65 | 0.69 | |
| of Model M2 | 0.69 | 0.65 | 0.70 | 0.62 | 0.72 | 0.67 | 0.81 | 0.75 | 0.65 | 0.68 |
Note. Par = parameter; = standard deviation; M1 = and item-specific, nonregularized; M2 = and item-specific, regularized with ; M3 = joint and ; = optimal regularization parameter obtained with the cross-validated log-likelihood function.
Table 7.
Example ASTI: Akaike information criterion (AIC) for model comparisons for the five ASTI scales.
Table 7.
Example ASTI: Akaike information criterion (AIC) for model comparisons for the five ASTI scales.
| Model | NA | PG | PM | SI | ST |
|---|---|---|---|---|---|
| M1: and item-specific, nonregularized | 10,681 | 14,449 | 10,009 | 8249 | 18,116 |
| M3: joint and | 10,680 | 14,464 | 10,007 | 8248 | 18,125 |
| M4: logistic link | 10,679 | 14,463 | 10,033 | 8261 | 18,150 |
| M5: probit link | 10,687 | 14,467 | 10,045 | 8269 | 18,179 |
Table 8.
Example ASTI: Summary of estimated and parameters in different models for the five ASTI scales.
Table 8.
Example ASTI: Summary of estimated and parameters in different models for the five ASTI scales.
| Par | Description | NA | PG | PM | SI | ST |
|---|---|---|---|---|---|---|
| Model M3 | −0.20 | −0.12 | −0.55 | −0.25 | −0.22 | |
| Mean of Model M1 | −0.33 | −0.53 | −0.70 | −0.29 | −0.30 | |
| Mean of Model M2 | −0.33 | −0.53 | −0.70 | −0.26 | −0.34 | |
| of Model M1 | 0.45 | 0.40 | 0.37 | 0.15 | 0.39 | |
| of Model M2 | 0.45 | 0.40 | 0.37 | 0.13 | 0.43 | |
| Model M3 | −0.07 | 0.13 | −0.39 | −0.60 | −0.25 | |
| Mean of Model M1 | −0.21 | −0.38 | −0.29 | −0.68 | −0.15 | |
| Mean of Model M2 | −0.21 | −0.38 | −0.30 | −0.60 | −0.41 | |
| of Model M1 | 0.26 | 0.78 | 0.76 | 0.23 | 0.60 | |
| of Model M2 | 0.26 | 0.78 | 0.75 | 0.04 | 0.34 |
Note. Par = parameter; = standard deviation; M1 = and item-specific, nonregularized; M2 = and item-specific, regularized with ; M3 = joint and ; = optimal regularization parameter obtained with the cross-validated log-likelihood function; NA = non-attachment; PG = presence in the here-and-now and growth; PM = peace of mind; SI = self-knowledge and integration; ST = self-transcendence.
Disclaimer/Publisher’s Note: The statements, opinions and data contained in all publications are solely those of the individual author(s) and contributor(s) and not of MDPI and/or the editor(s). MDPI and/or the editor(s) disclaim responsibility for any injury to people or property resulting from any ideas, methods, instructions or products referred to in the content. |
© 2023 by the author. Licensee MDPI, Basel, Switzerland. This article is an open access article distributed under the terms and conditions of the Creative Commons Attribution (CC BY) license (https://creativecommons.org/licenses/by/4.0/).
Share and Cite
MDPI and ACS Style
Robitzsch, A. Regularized Generalized Logistic Item Response Model. Information 2023, 14, 306. https://doi.org/10.3390/info14060306
AMA Style
Robitzsch A. Regularized Generalized Logistic Item Response Model. Information. 2023; 14(6):306. https://doi.org/10.3390/info14060306
Chicago/Turabian StyleRobitzsch, Alexander. 2023. "Regularized Generalized Logistic Item Response Model" Information 14, no. 6: 306. https://doi.org/10.3390/info14060306
Note that from the first issue of 2016, this journal uses article numbers instead of page numbers. See further details here.