Article

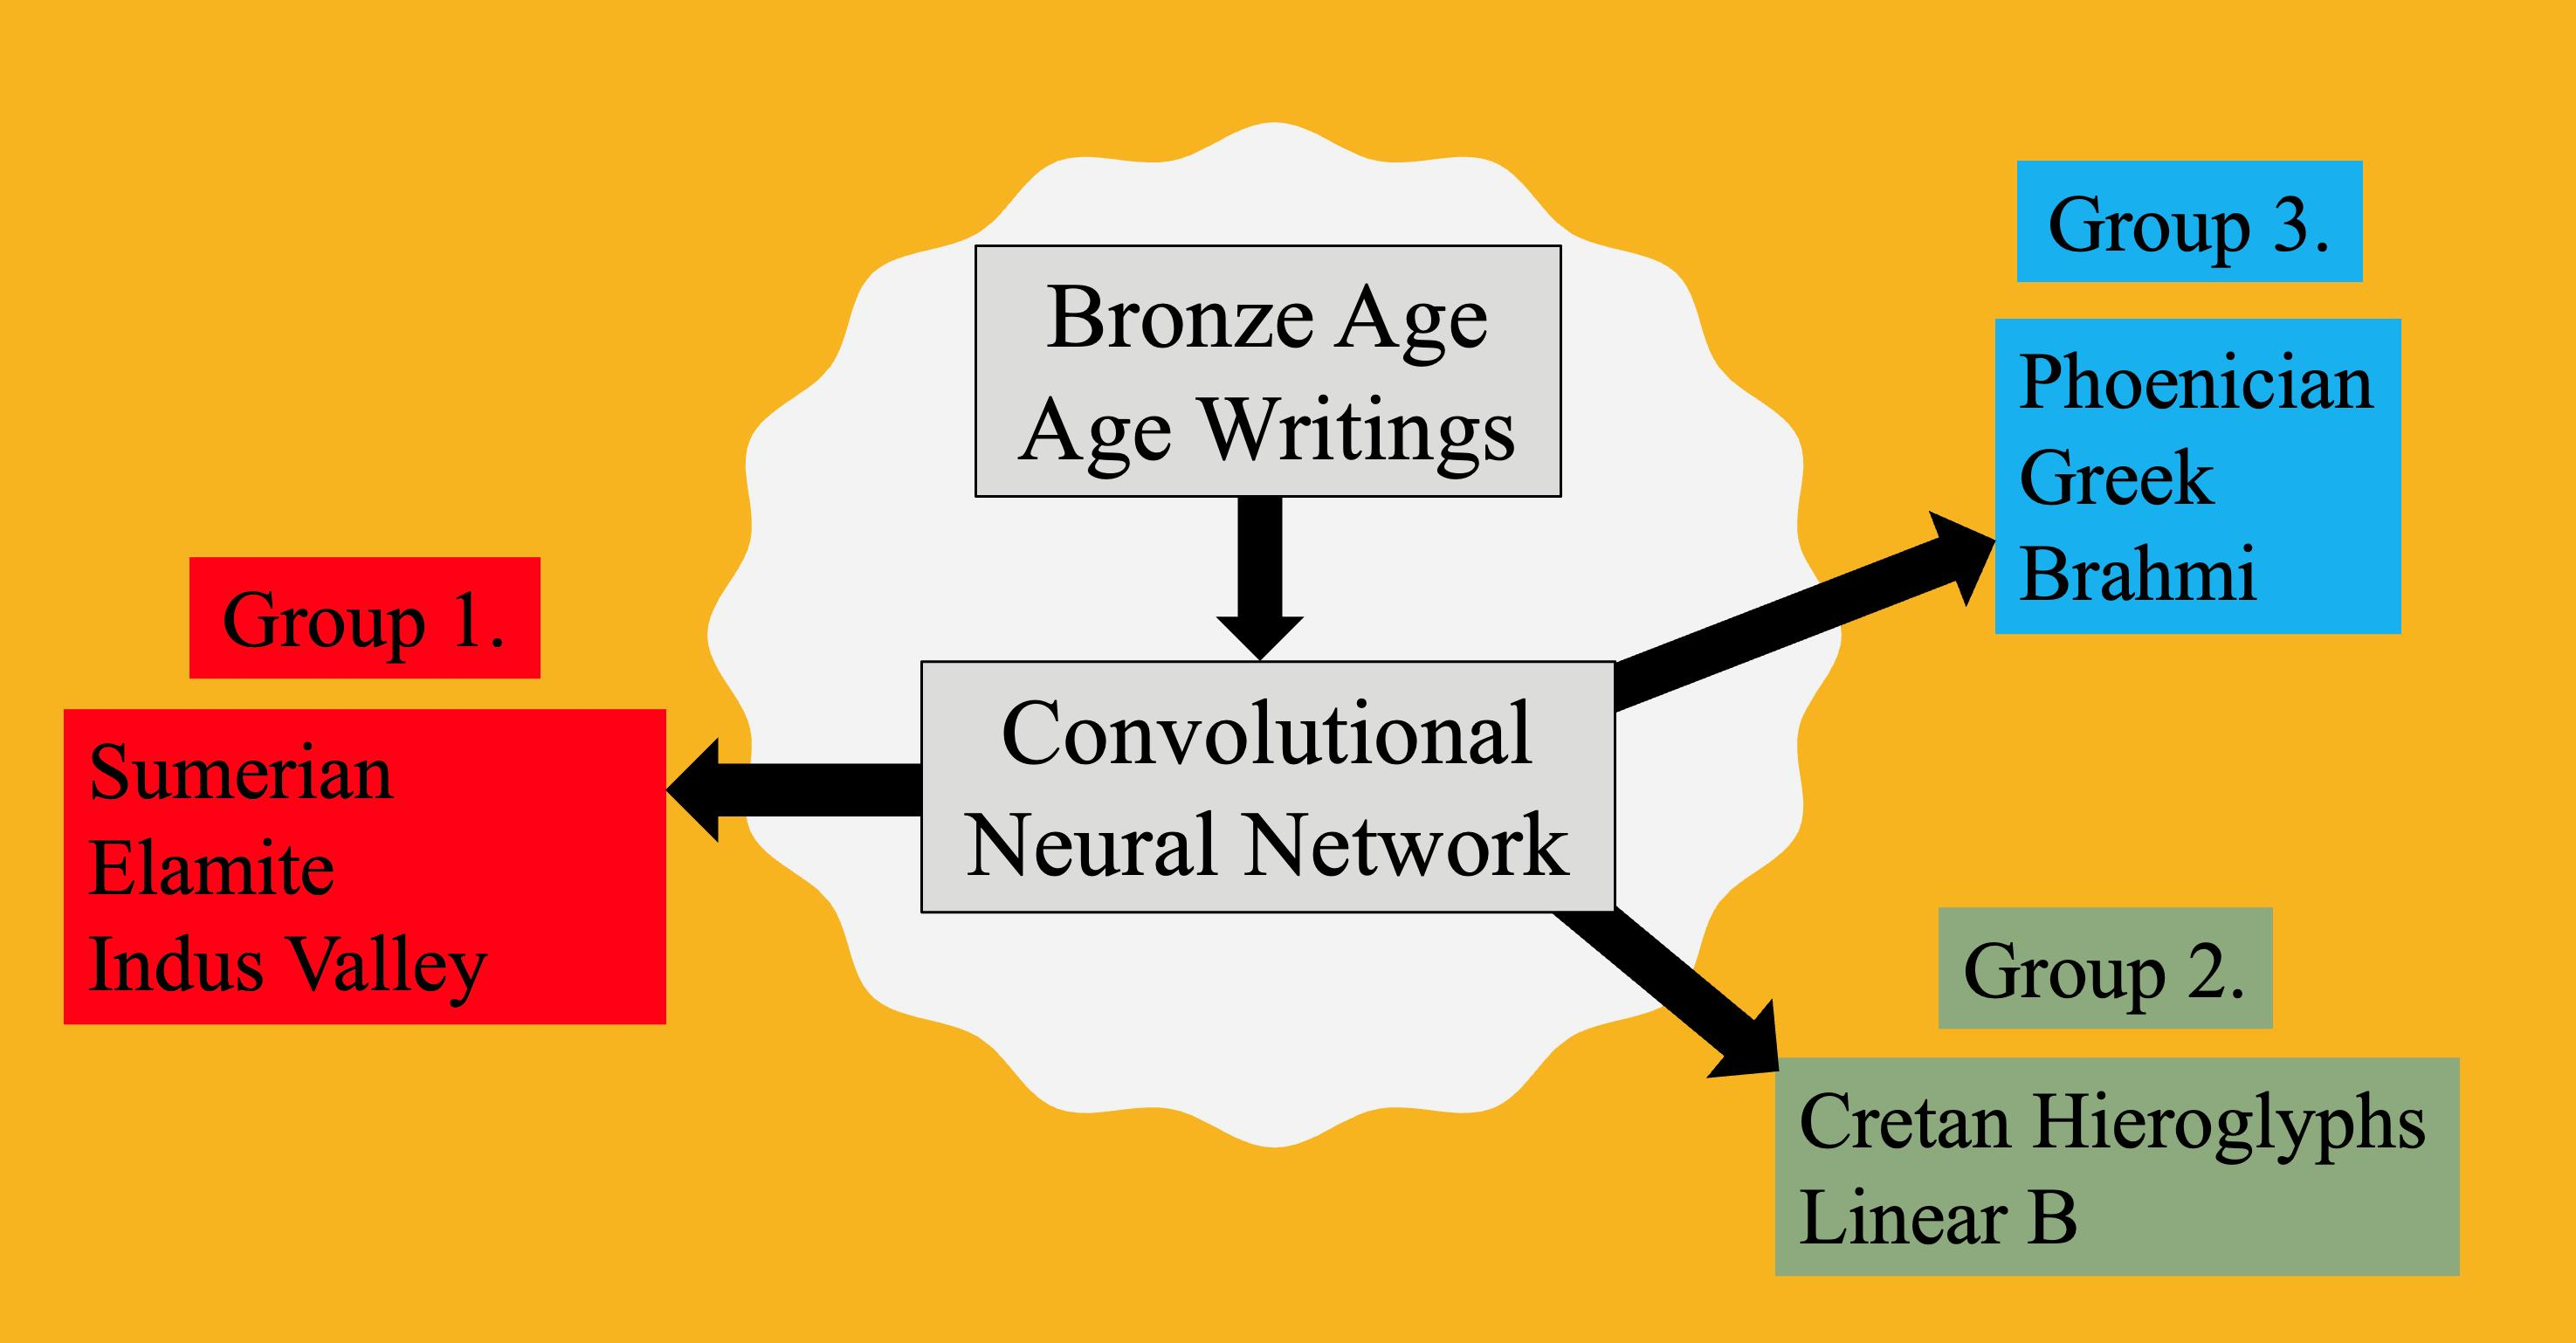
Convolutional Neural Networks Analysis Reveals Three Possible Sources of Bronze Age Writings between Greece and India †

School of Computing, College of Engineering, University of Nebraska-Lincoln, Lincoln, NE 68588, USA
*
Author to whom correspondence should be addressed.
This paper is an extended version of our paper published in the 23rd International Database Engineering and Applications Symposium, IDEAS 2019, Athens, Greece, 10–12 June 2019.
Information 2023, 14(4), 227; https://doi.org/10.3390/info14040227
Submission received: 7 February 2023 / Revised: 4 April 2023 / Accepted: 4 April 2023 / Published: 7 April 2023
(This article belongs to the Special Issue International Database Engineered Applications)

Abstract

:
This paper analyzes the relationships among eight ancient scripts from between Greece and India. We used convolutional neural networks combined with support vector machines to give a numerical rating of the similarity between pairs of signs (one sign from each of two different scripts). Two scripts that had a one-to-one matching of their signs were determined to be related. The result of the analysis is the finding of the following three groups, which are listed in chronological order: (1) Sumerian pictograms, the Indus Valley script, and the proto-Elamite script; (2) Cretan hieroglyphs and Linear B; and (3) the Phoenician, Greek, and Brahmi alphabets. Based on their geographic locations and times of appearance, Group (1) may originate from Mesopotamia in the early Bronze Age, Group (2) may originate from Europe in the middle Bronze Age, and Group (3) may originate from the Sinai Peninsula in the late Bronze Age.

Graphical Abstract

1. Introduction

In this paper, we use data mining methods to analyze the relationships among eight Bronze Age scripts from between Greece and India, namely the Brahmi script [1], Cretan hieroglyphs [2], the Greek alphabet [3], the Indus Valley script [4,5,6,7,8], the Linear B syllabary [9], the Phoenician alphabet [10,11,12], the proto-Elamite script [13,14], and Sumerian pictographs [15].
We are interested in testing the hypothesis that these eight scripts had a single origin. This is probable given that the eight scripts originate from geographic locations along an east–west line between India and Greece, as is shown in Figure 1.
We are going to test this hypothesis by applying data mining to the scripts. The data mining method that we have chosen for this study is a convolutional neural networks analysis. Convolutional neural networks have previously been applied to the recognition of various signs, including alphabets, but they have not been used in a multiscript analysis.
The novel idea in our approach is to first train separate convolutional neural networks to recognize various scripts (see Section 5.1 for a review of works that are related to this first phase). Then, in the second phase, we pass one script’s signs into another’s convolutional neural network. The sign ‘recognized’ by the convolutional neural network can be considered the closest to the input sign. If the two scripts are related to each other, then a one-to-one mapping may be found between the signs of the two scripts. If the two scripts are not related to each other, then there will be no one-to-one mapping.
Our study is motivated by a desire to contribute to the decipherment of ancient, Bronze Age scripts, especially the Indus Valley script [8]. Decipherment can be greatly facilitated by understanding the precise relationships among these ancient scripts. A one-to-one mapping of the signs of an undeciphered and a deciphered script would suggest phonetic values for the signs of the undeciphered script because the visual forms and the phonetic values of the signs tend to change simultaneously and gradually.
The outline of the paper is as follows. Section 2 introduces the eight ancient scripts that are to be compared and classified. Section 3 presents the machine learning software algorithms used to learn and group together the various signs. Section 4 describes the major findings of our study. Section 5 analyses the results and compares them with related work. Finally, Section 6 presents some open problems.

2. Data Source

We used the following ancient scripts as data sources.
  • Brahmi, which has an unknown origin, was an abugida script in India and was written left-to-right [1]. We used 34 of the signs from the Brahmi script, as shown in Figure 2.
2.
Cretan hieroglyphs also have an unknown origin. Cretan hieroglyphs were used between 2100 to 1700 BCE [2], that is, mainly contemporaneously with Linear A, but both were superseded by Linear B. We used 22 signs from the Cretan hieroglyphs, as shown in Figure 3.
3.
Starting around 800 BCE, the ancient Greek alphabet had several variants according to various local Greek dialects [3]. We used all 27 letters of the Greek alphabet, as shown in Figure 4.
4.
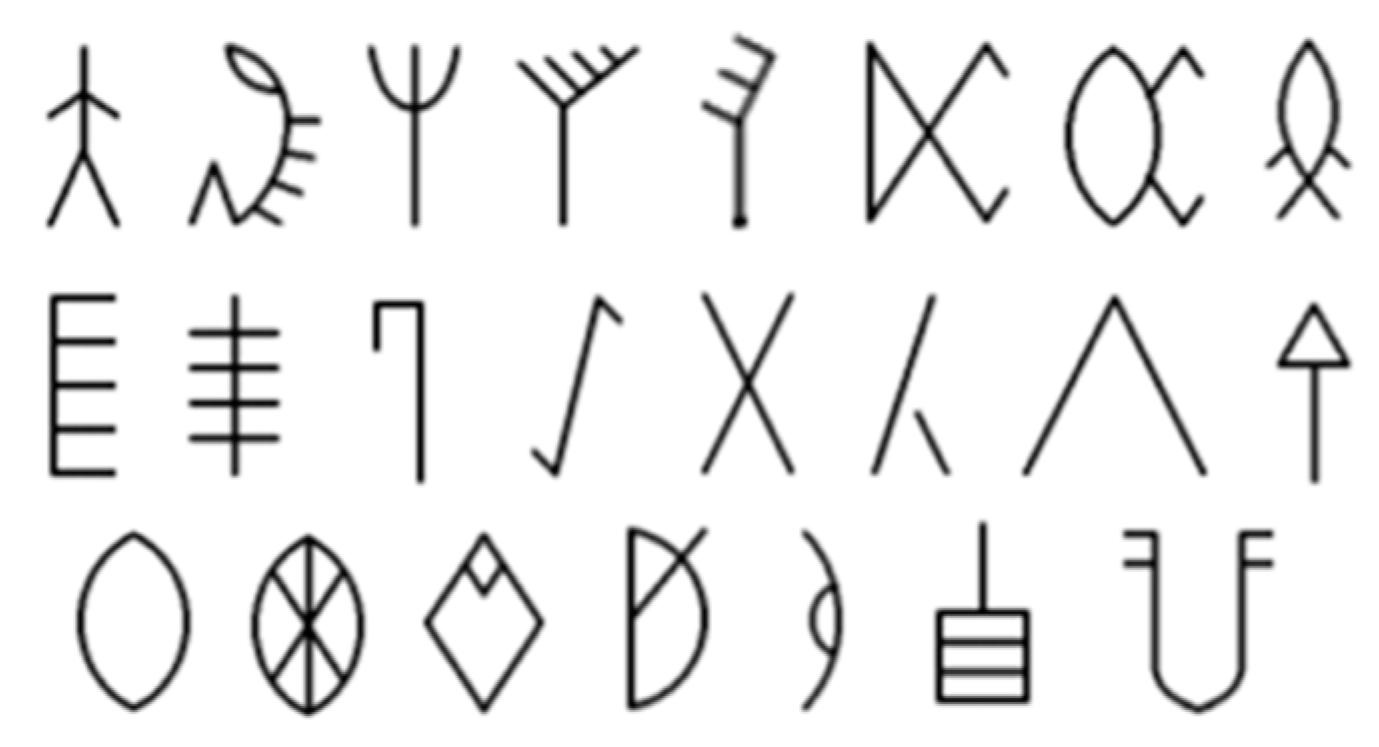
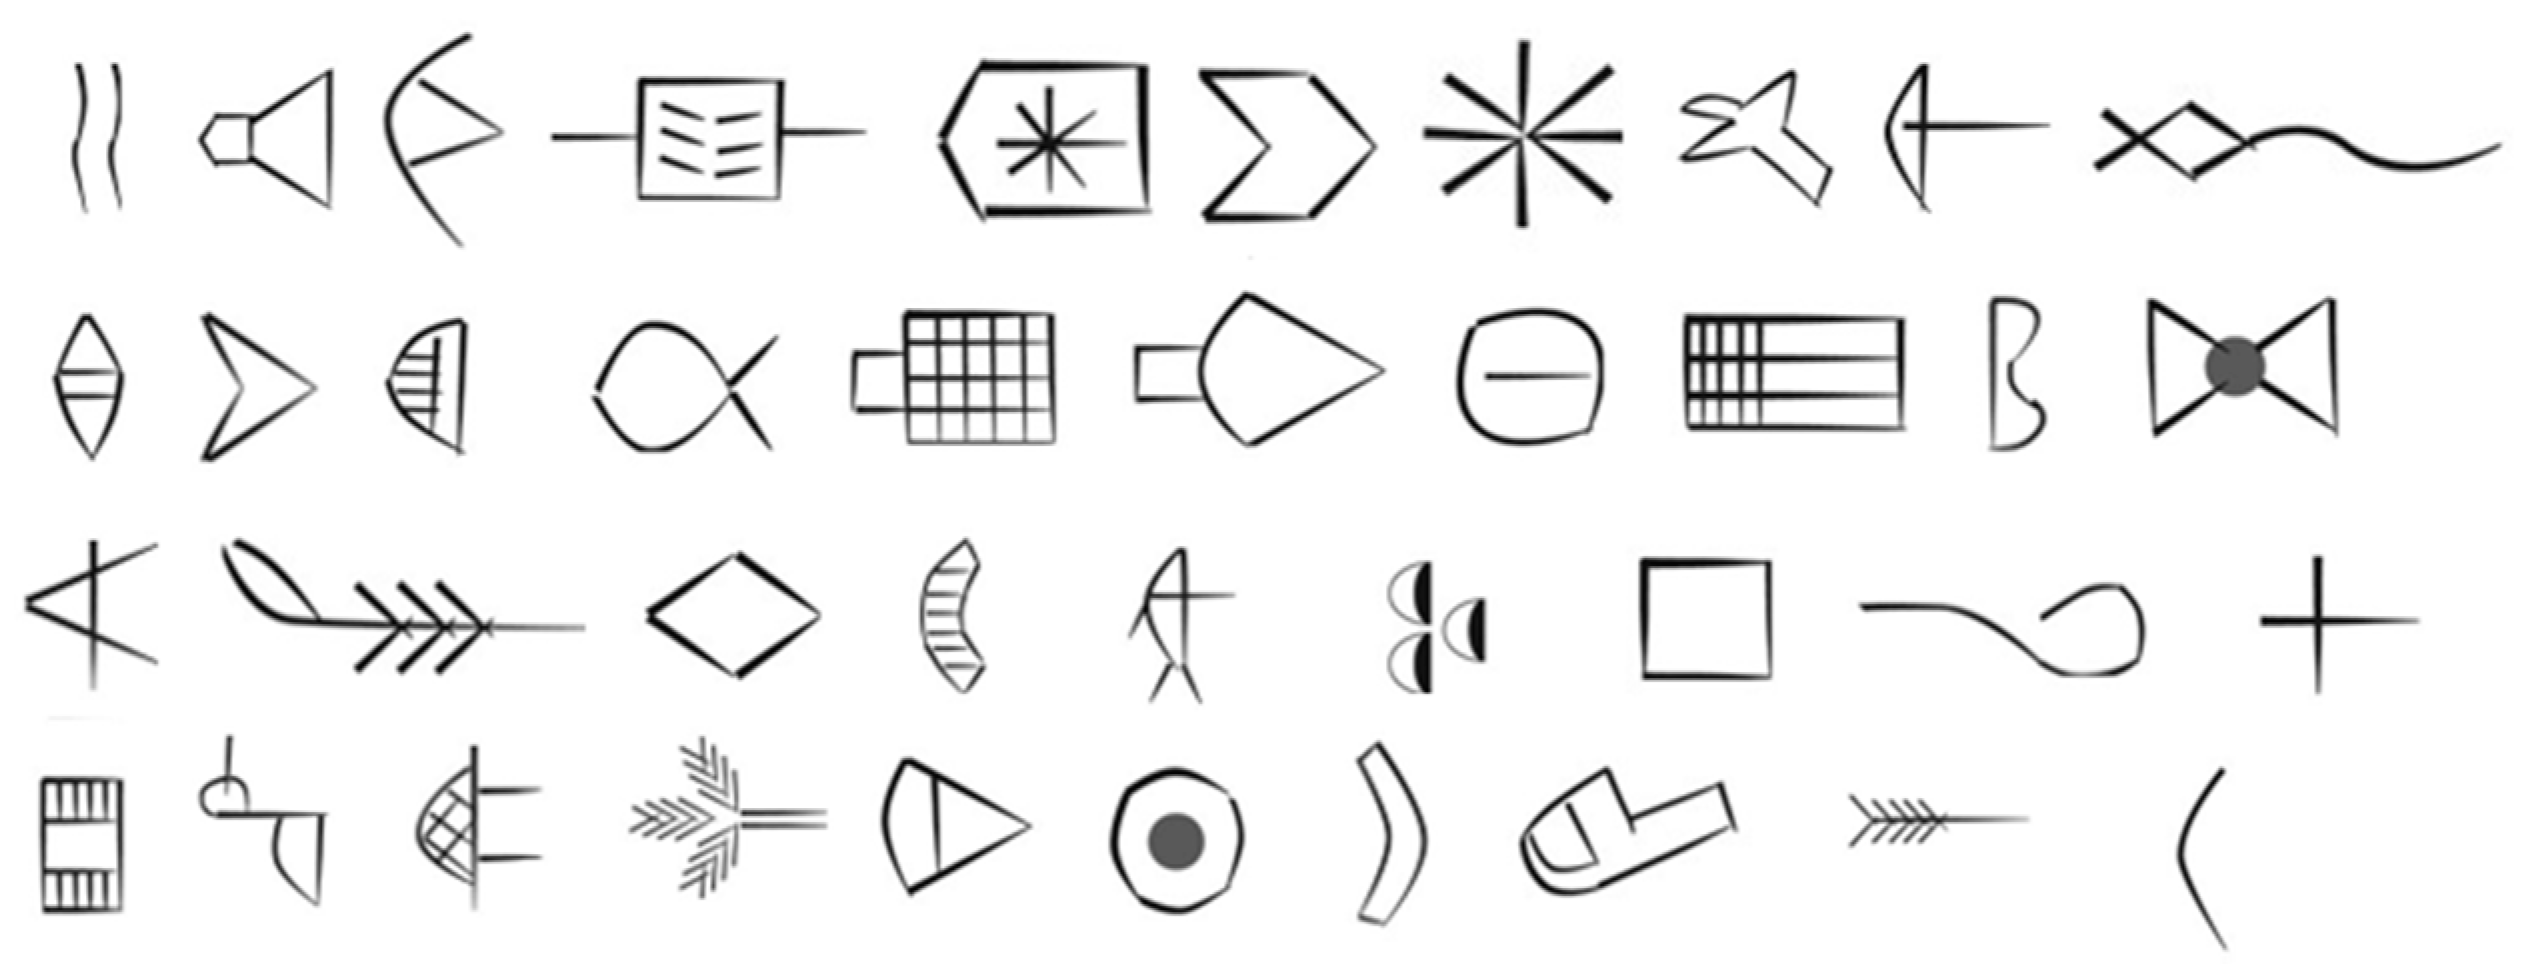
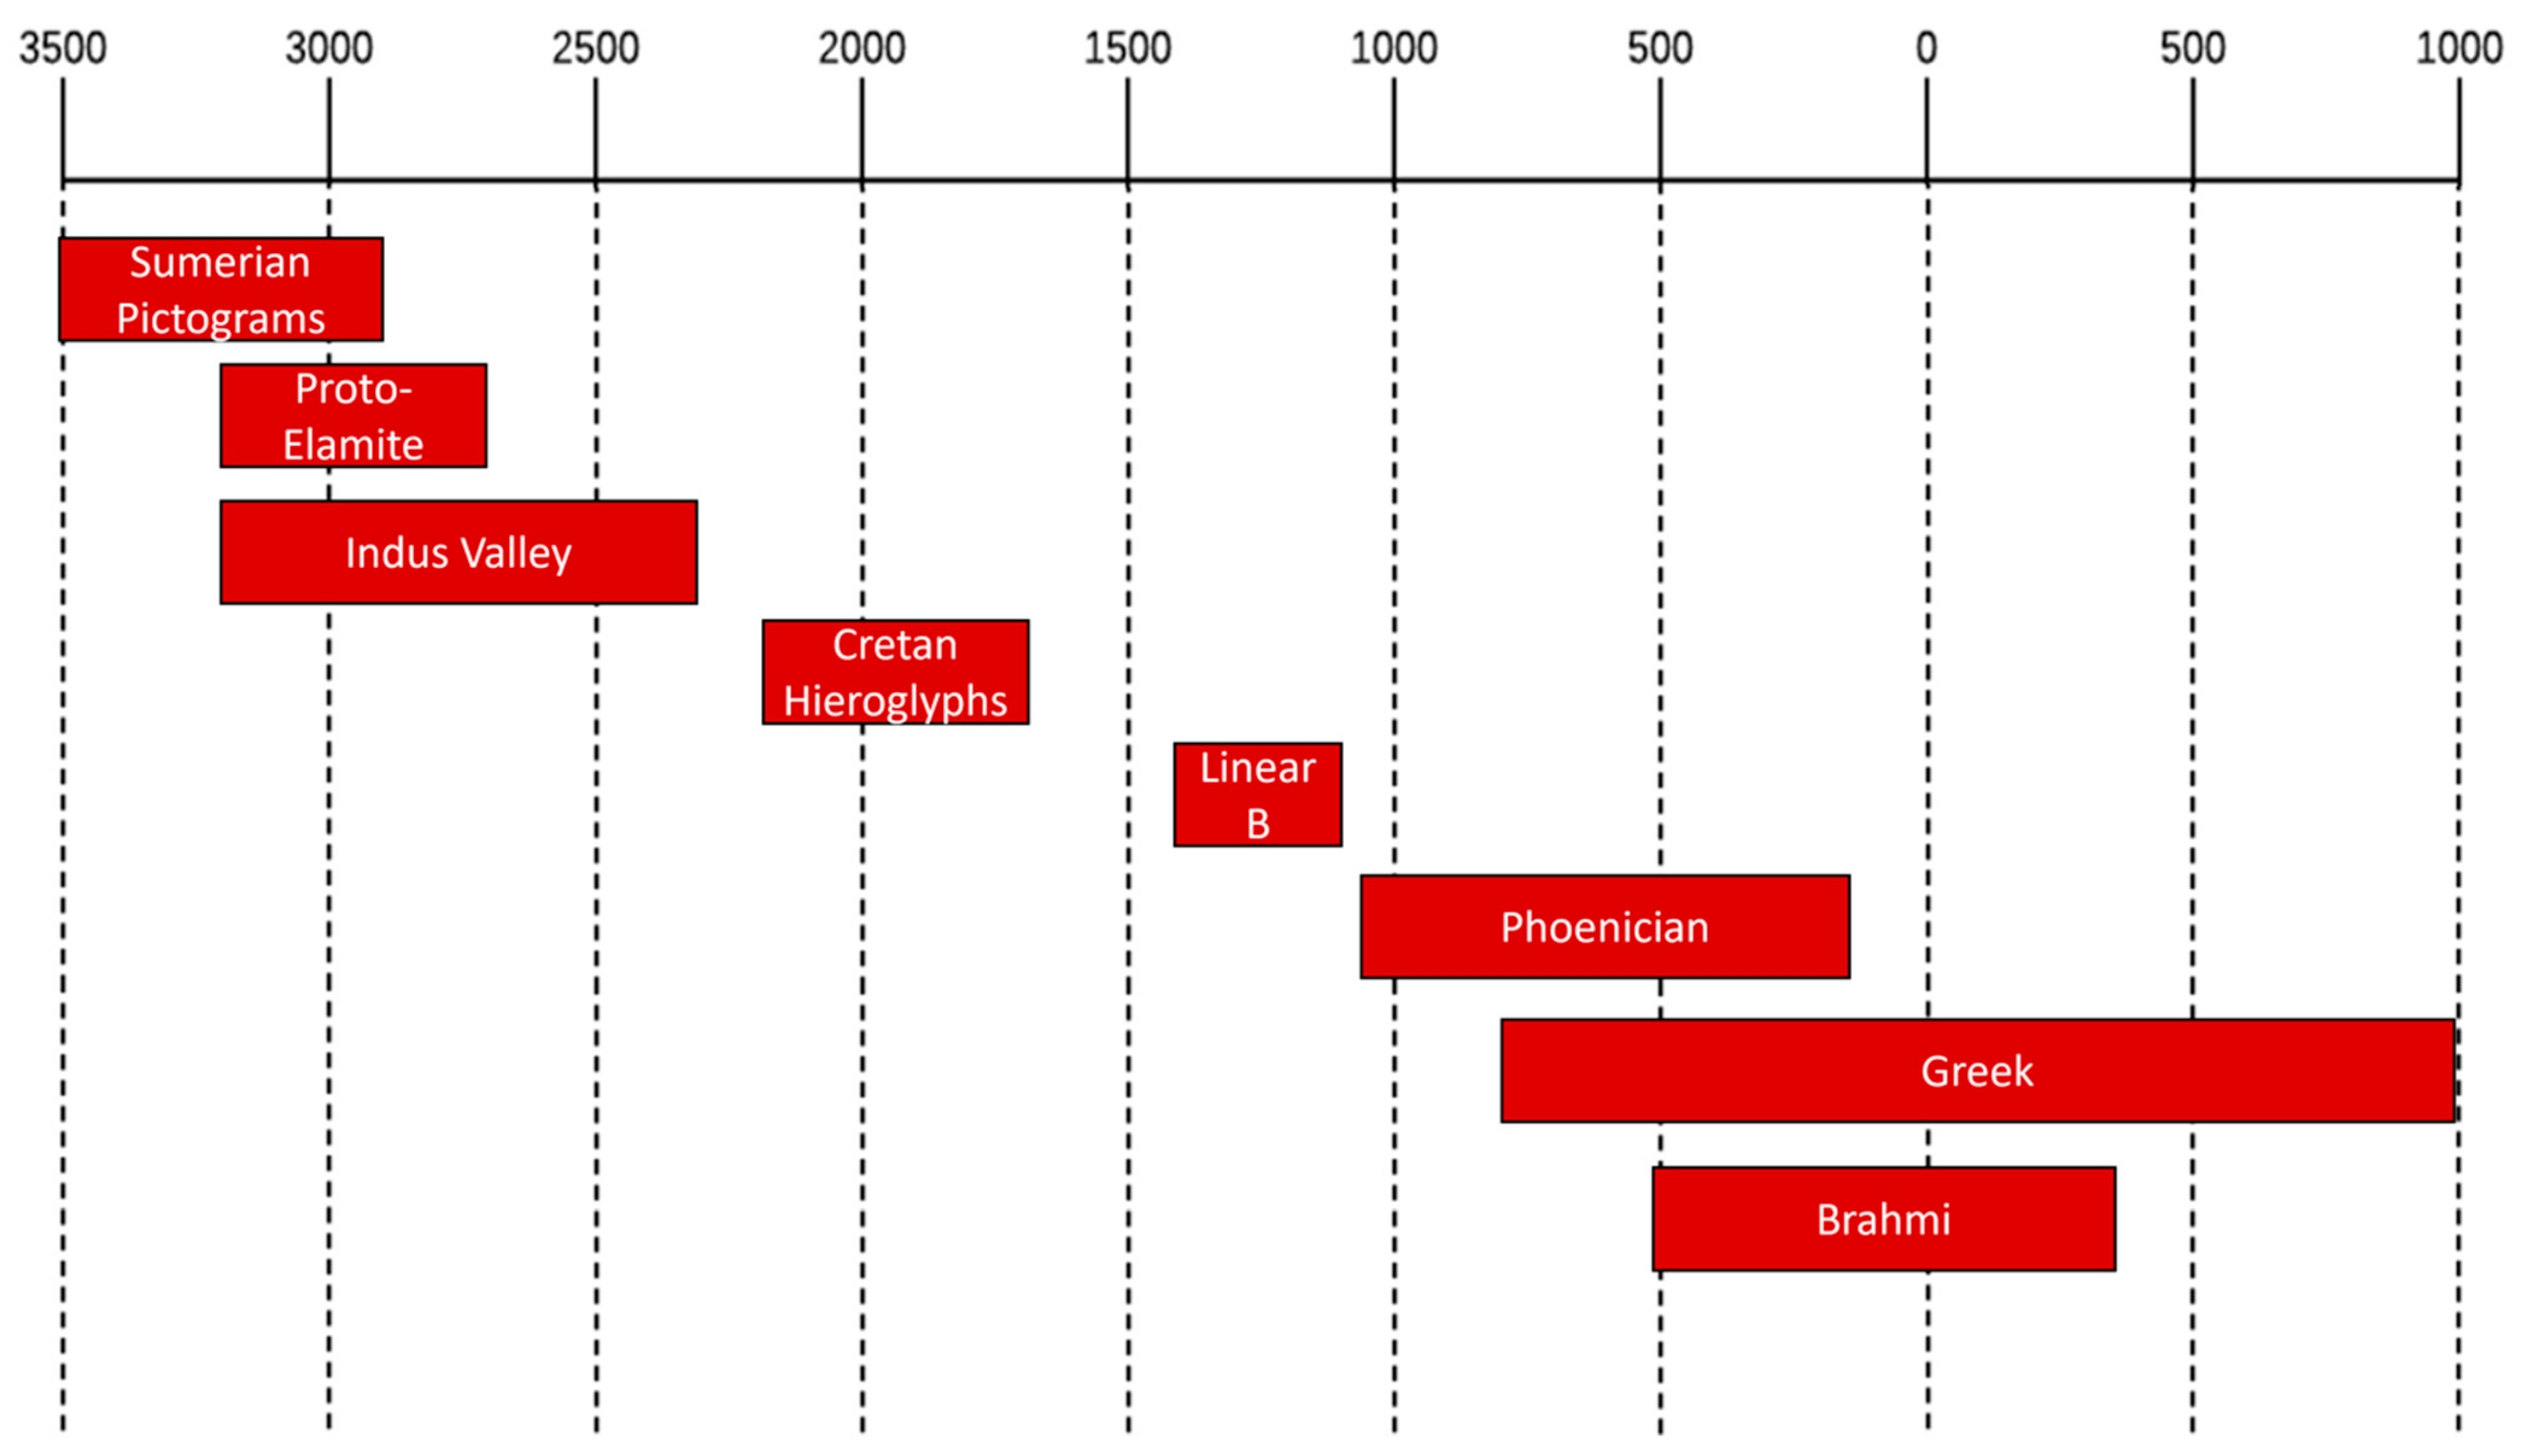
The Indus Valley script was in use in what is today Pakistan and India from around 2400 BCE to 1900 BCE [4,5,6,7,8]. Its writing direction was mainly right-to-left, although there are some left-to-right and boustrophedon writing examples, too. Remarkably, the Indus Valley script has over 700 different signs. Since only those signs that occur at least three times seem significant, we used only the 23 most frequent Indus Valley script signs, as shown in Figure 5.
5.
The Mycenaean Greeks used the Linear B script, which is an adaptation of the earlier Linear A that was used by the Minoans. In 1952, Michael Ventris succeeded in determining that Linear B was the older written form of the Greek language that was written using syllabic signs [9]. We used 20 signs from Linear B, as shown in Figure 6.
6.
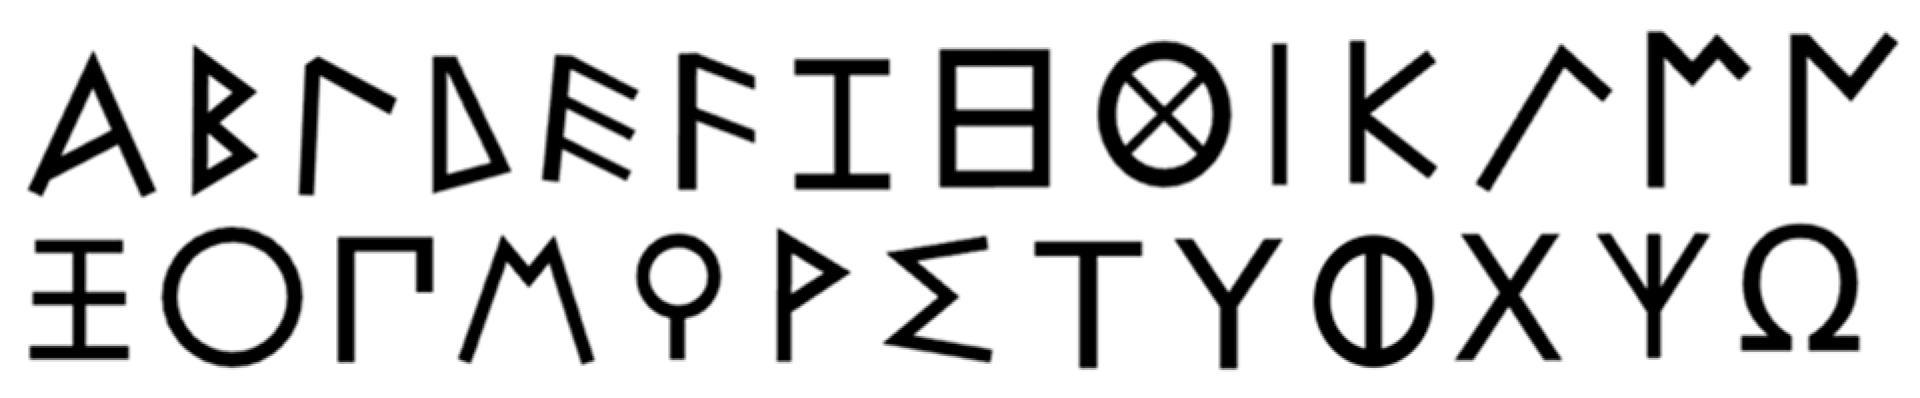
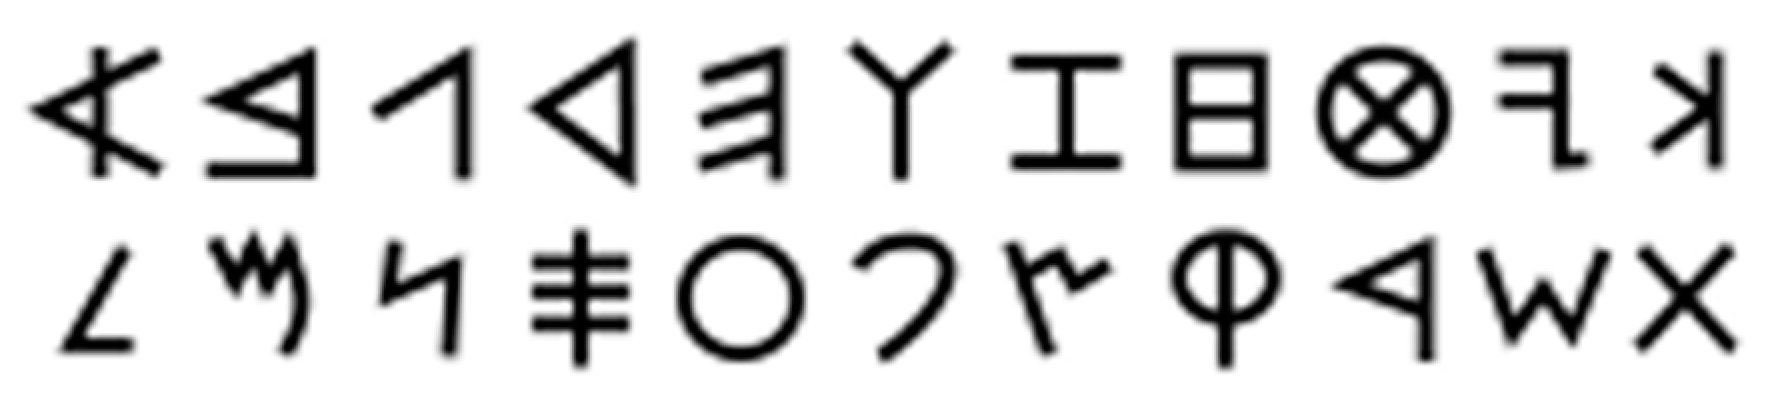
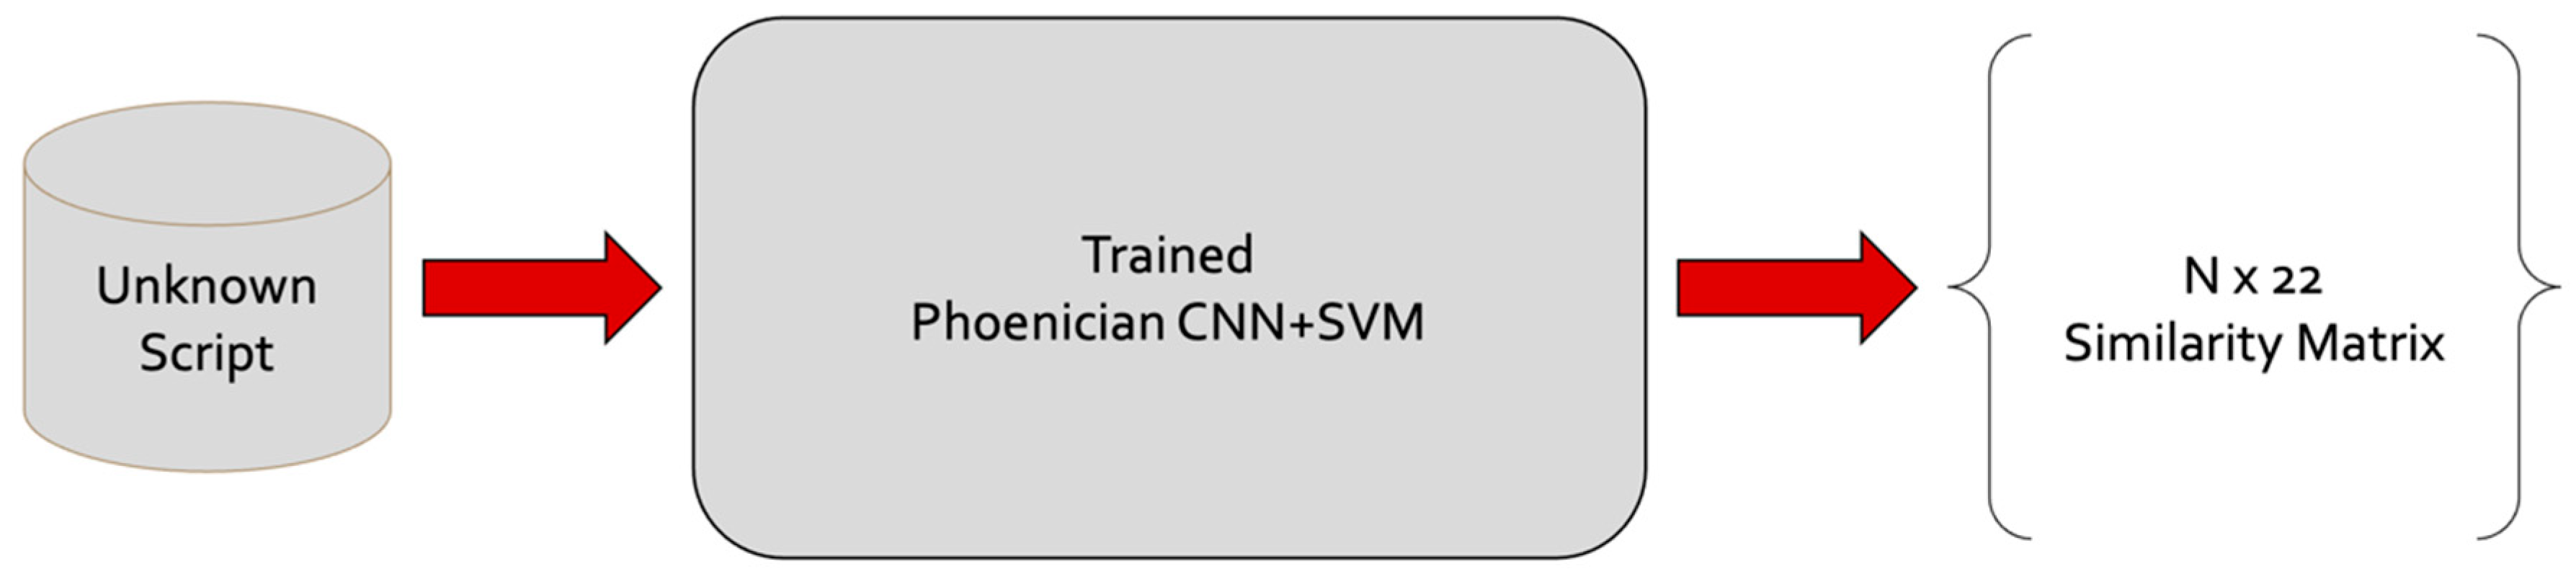
Beginning around 1200 BCE, the Phoenician alphabet was written on clay tablets [10]. According to some proposals, the Phoenician alphabet may be derived from Egyptian hieroglyphs [11], but its development may also have been influenced by Linear B [12]. Since the 22 Phoenician alphabet letters originally denoted only consonants, it is classified as an abjad. Phoenician texts also usually run right-to-left. We used all 22 Phoenician alphabet letters, as shown in Figure 7.
7.
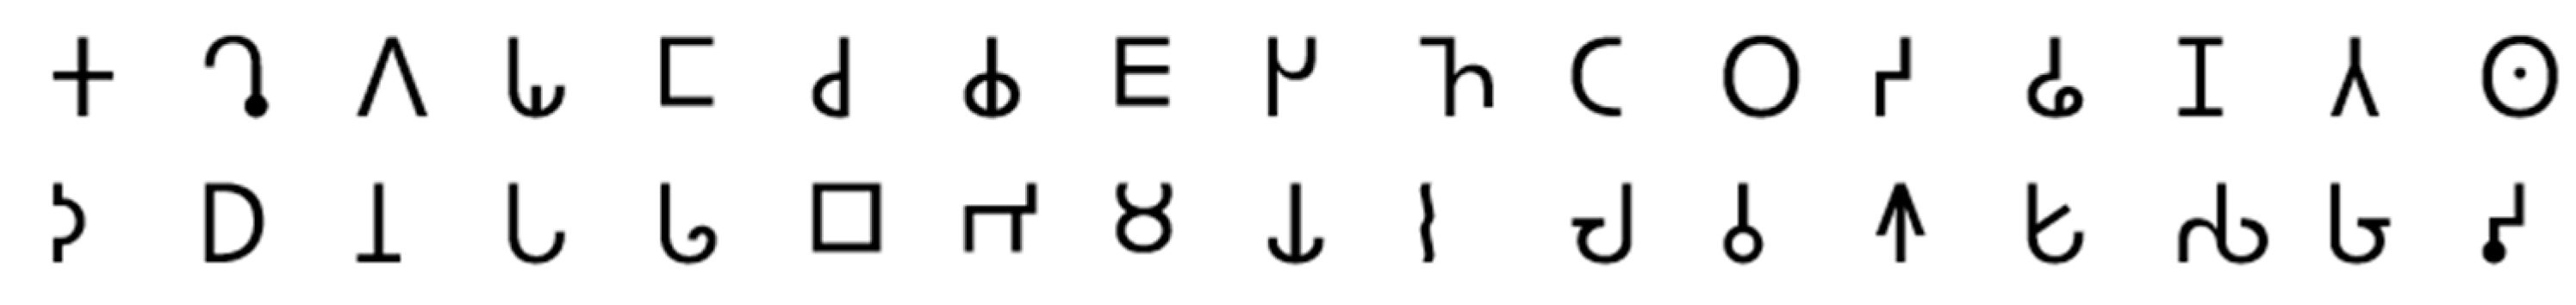
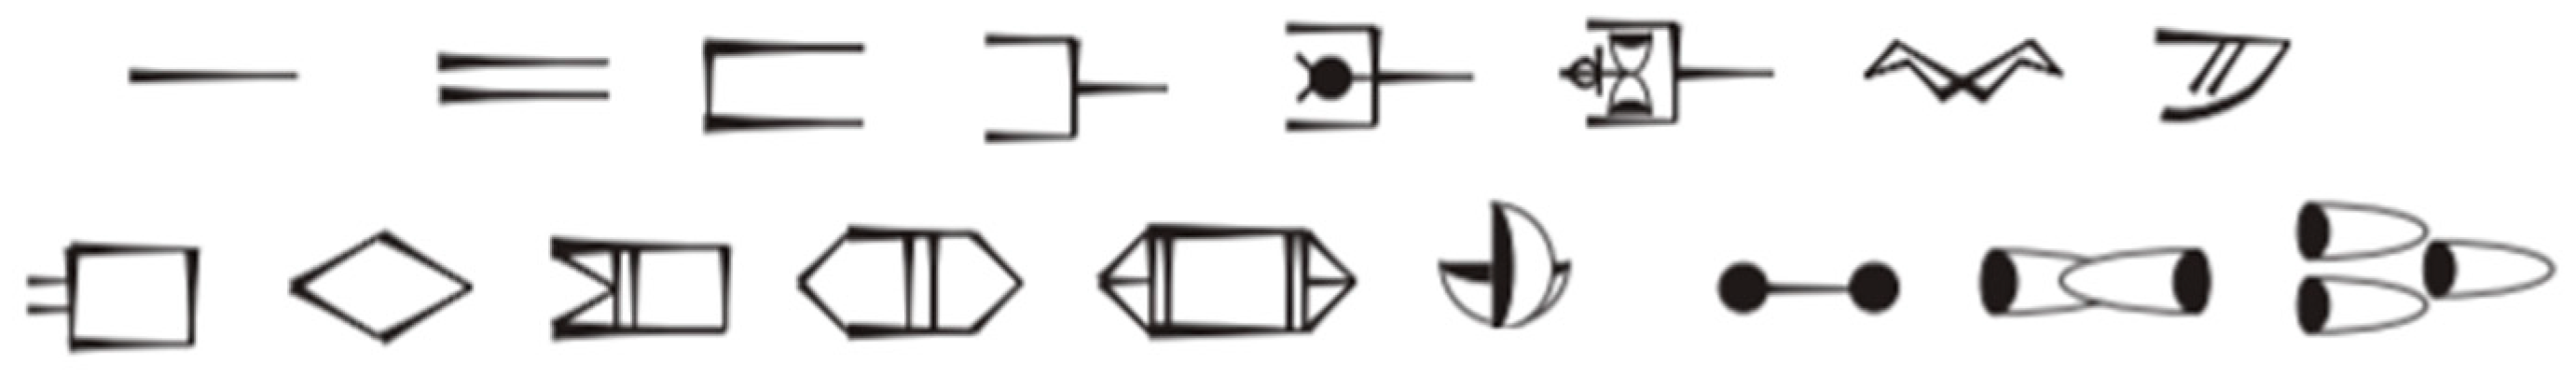
The proto-Elamite script existed primarily in the region that today is Iran during the fourth millennium BCE [13]. The proto-Elamite script had almost two thousand signs, but most of those signs were used infrequently [14]. Currently, the proto-Elamite script is currently undeciphered. We used 17 signs from the proto-Elamite script, as shown in Figure 8.
8.
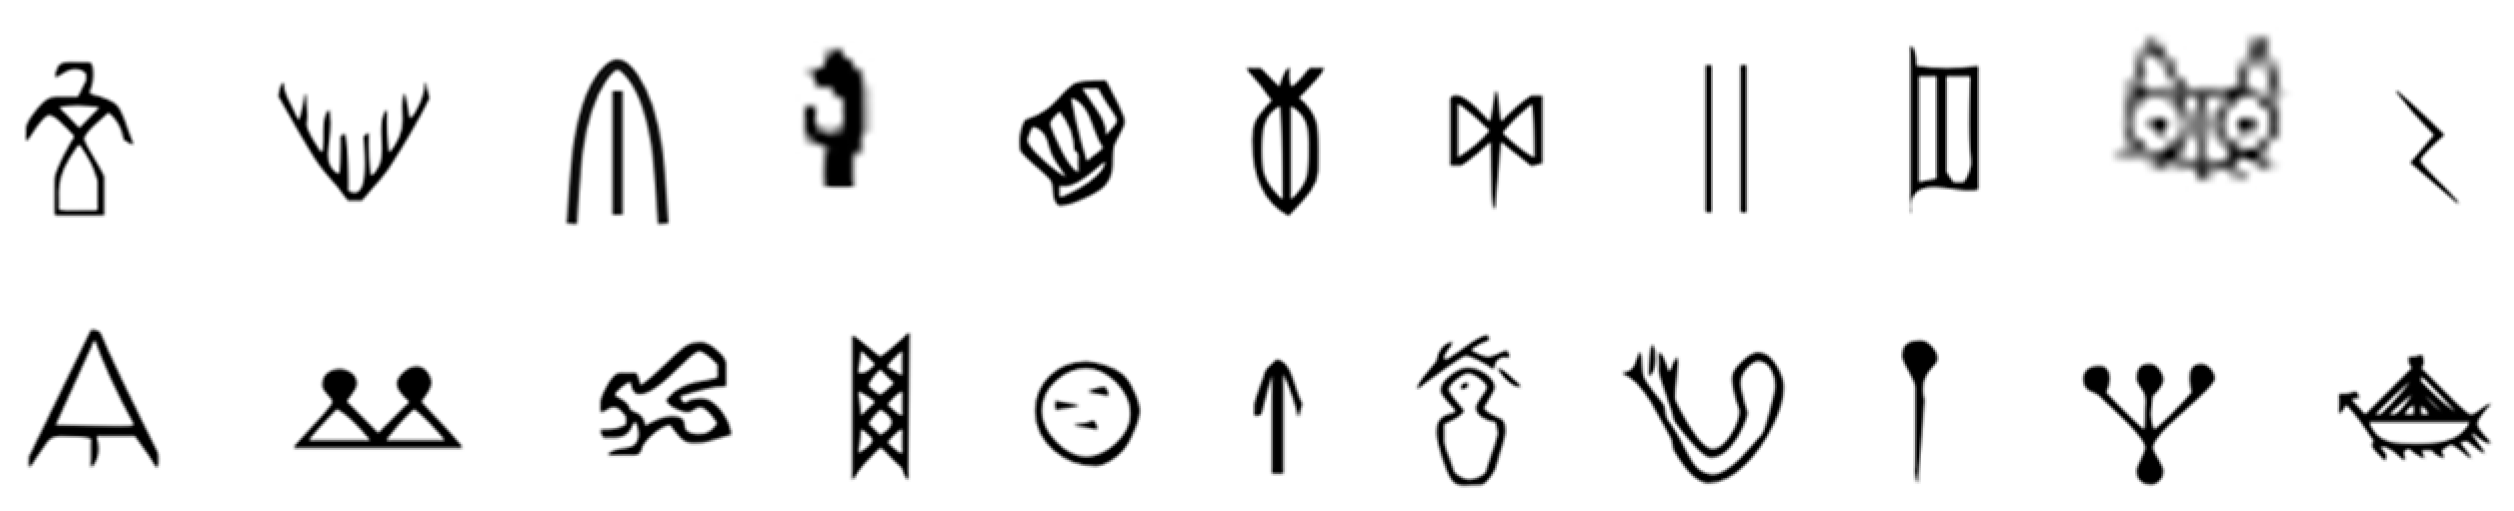
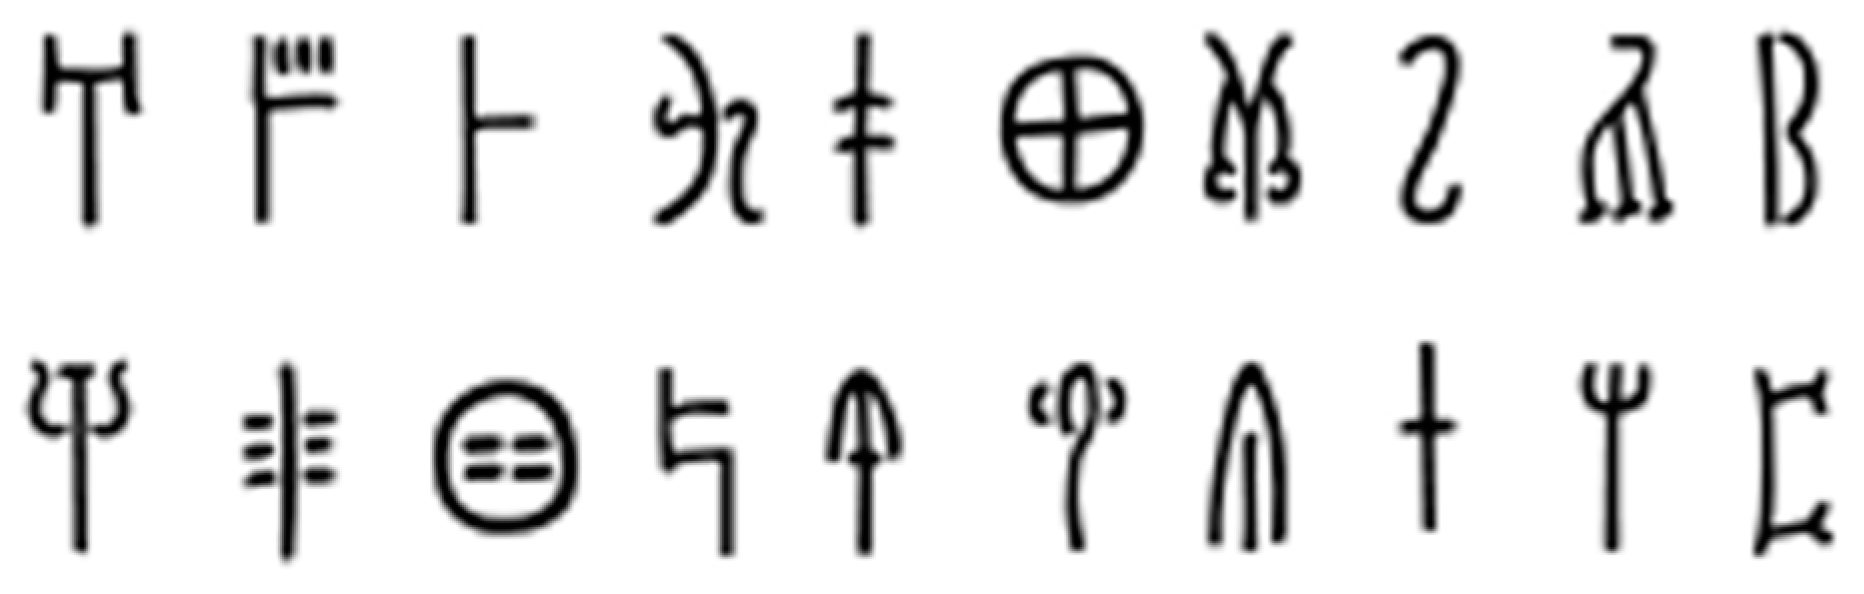
Sumerian pictograms were a novel development and were mostly logographic, according to researchers. They were formed in the fourth millennium BCE, but they developed into cuneiform signs, which were used over several millennia until the first century [15]. The Sumerian language is distantly related to the Dravidian and Uralic languages [16,17]. We used 34 signs from the Sumerian pictograms, as shown in Figure 9.
Figure 10 gives a timeline of the eight scripts mentioned above. The Sumerian pictograms were used only for a few hundred years and then gradually developed into the cuneiform script that was used by later cultures over three thousand years. It is important to consider this timeline and the locations together with the similarity of the scripts in order to identify ancestor–successor relationships. Figure 1 shows a map of the approximate locations of the scripts compared in this paper. Neural networks can identify similarities in the scripts, but they are unaware of the timeline or the locations in which the various scripts were used.
Another consideration is the orientation of the signs. For example, in the Sumerian pictograms, the signs initially stood upright, while in later times they had been rotated 90 degrees. Figure 9 shows this later stage, after the signs had been rotated. This rotation is obvious for some signs, such as the bird sign, which is the second from the right in the last row of Figure 9. One of the advantages of neural networks is that they can learn to recognize signs regardless of their orientation. However, to achieve this rotation independence, the training examples need to include several rotated versions of the same sign.
Another consideration is the vertical mirror symmetry of the signs. Many ancient scripts were written in a boustrophedon style. This meant that the writer wrote the first line from left-to-write, then reversed the direction to right-to-left in the second line, and then kept switching the direction for each successive line of the inscription. As an aid to the reader, the boustrophedon inscriptions often used a vertical mirror-symmetric version of the usual sign. For example, instead of an E, they might use an Information 14 00227 i050. These two forms of the letter E are considered allographs of each other and should be treated as a single letter during script comparisons. Neural networks can also learn to recognize mirror-symmetric signs if the training examples include mirror-symmetric examples of the signs.
We took MNIST as a model for preprocessing the data and built a database [18]. We used 780 training images and 120 validation images, a total of 900 hand-drawn or computer-distorted images for each sign. The size of each grayscale image was 50 × 50 pixels.

3. Experimental Design

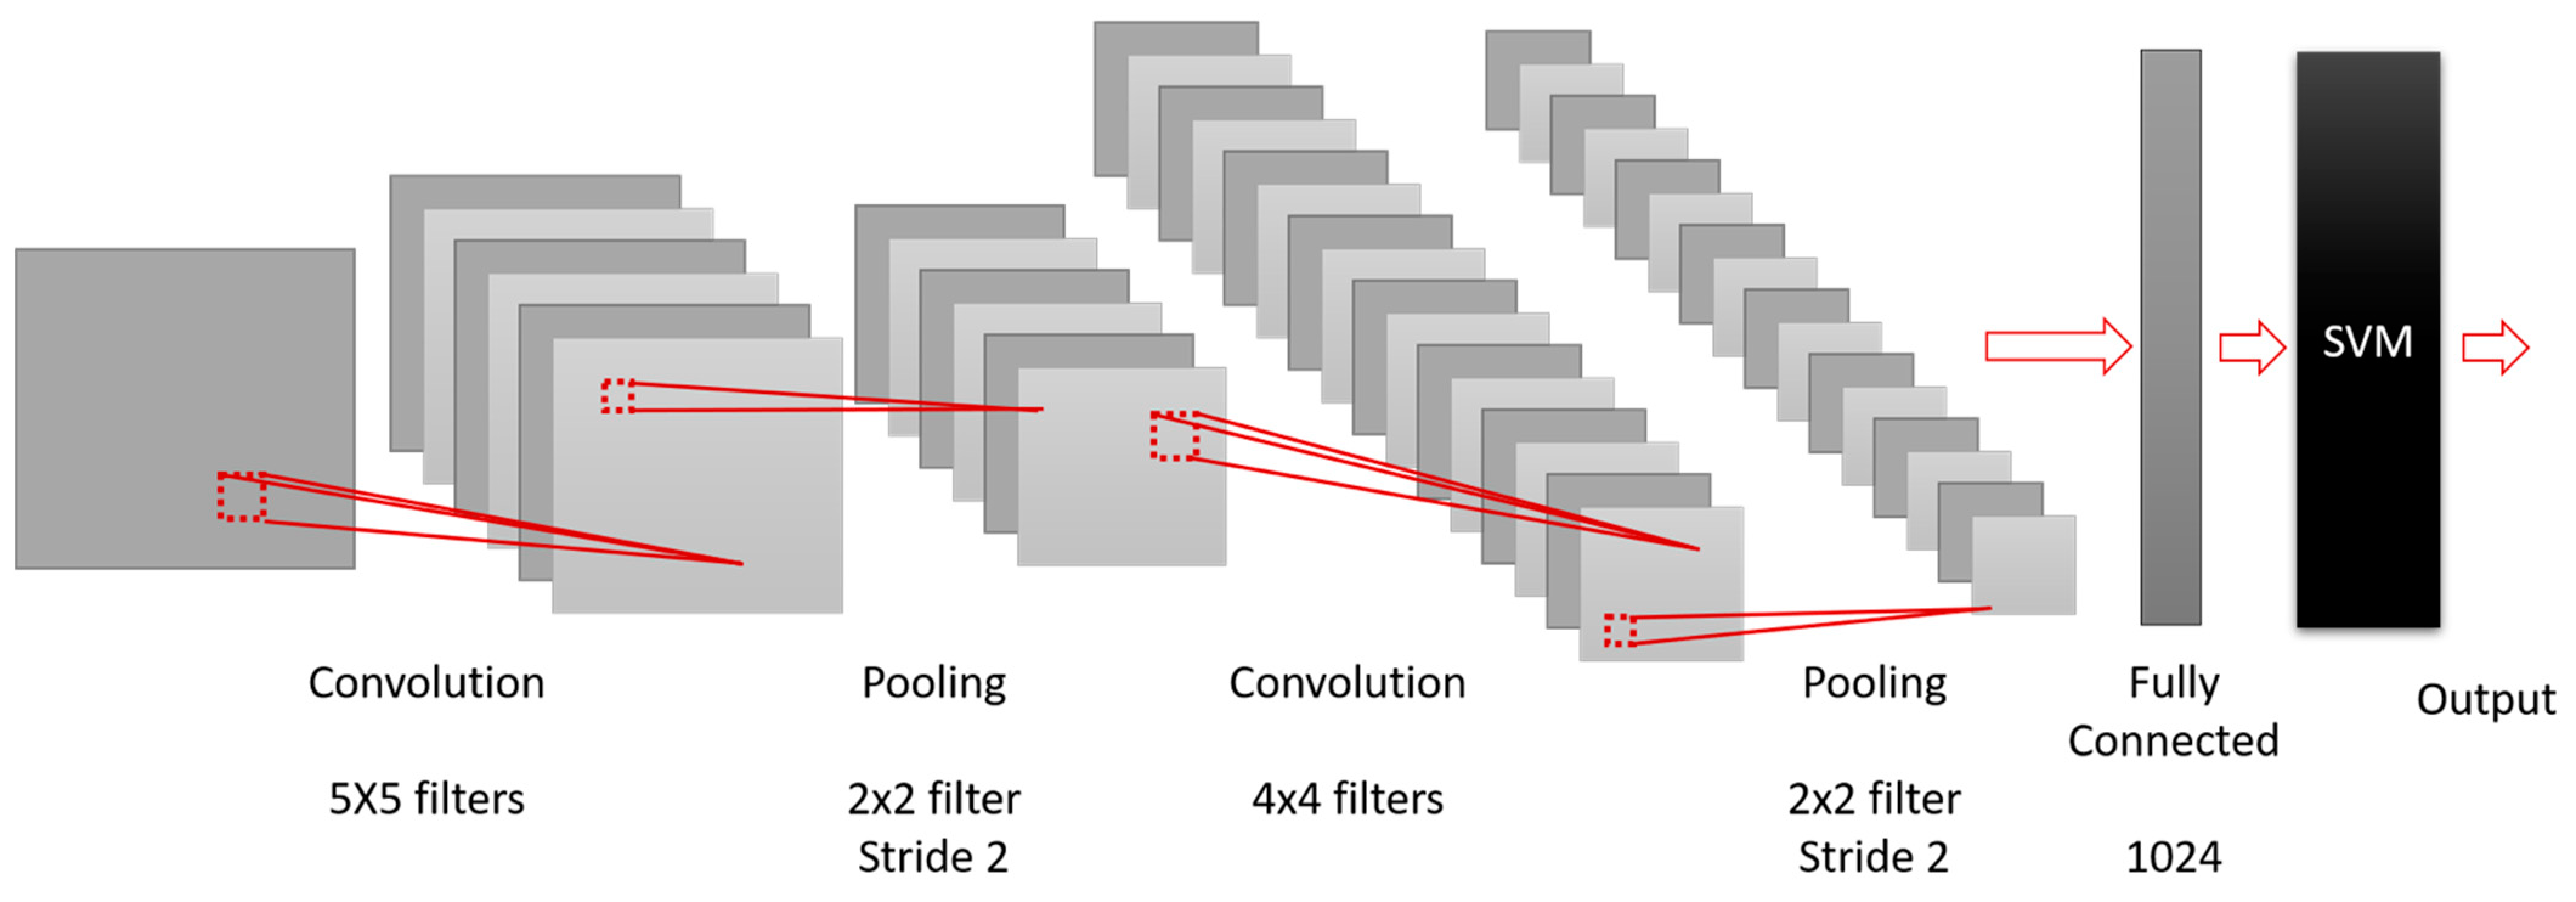
3.1. Design of the CNN

Python and TensorFlow together with a Keras wrapper were used to build neural networks with different accuracy levels depending on the learned script. We used a convolutional neural network (CNN) architecture similar to the architecture of LeNet [19], though with some changes that are illustrated below in Figure 11. The primary difference between LeNet and our network is that a support vector machine (SVM) was added at the end. The addition of an SVM was also effectively used in [20].
We first reduced the input images to 46 × 46 pixels by applying 5 × 5 filters. Second, we further cut the size of the images to 23 × 23 pixels using a pooling layer. Third, by another set of convolution filters, the images were reduced to 20 × 20 pixels. Fourth, another pooling produced 10 × 10 pixels. Fifth, the images passed a layer that had 1024 fully connected neurons. The output of the neurons was fed into the SVM, which we further detail in the next section.
We added to the convolution layers rectified linear unit (ReLU) activation functions, which produced a linear value with a slope of one when x > 0. The 2 × 2 filters picked for the feature map the maximum of the four quadrants’ values. Max pooling was applied by the pooling layers.
Overfitting was avoided by a 0.4 drop rate. A small 0.001 learning rate was used by the Adam optimizers [21] within the convolutional neural networks.

3.2. Design of the SVM

We used a Python library package and Python for the development of the support vector machine in the software architecture described in Figure 11. Within the last layer of Figure 11, we used L2-SVM for multiclass classification, which is considered better than Softmax, which is a common alternative [22]. The L2-SVM optimized the sum of the squared errors using the following function, where the vector variable w has the dimension N, ξi are the slack variables, and C is the penalty parameter.
Minimize:
1 2 | | w | | 2 + C 2 i = 1 N ξ i 2
Subject to:
y i x i w + b 1 ξ i        i = 1 , , N
where b is a bias term.

3.3. The Sign Classifier

Figure 12 shows the scheme according to which the trained and validated classifiers for the eight scripts were used to test the similarity of any pair of scripts. Figure 12 specifically shows how the N signs of any one of the seven other scripts (called the ‘unknown script’ in the diagram) can be compared with the 22 letters of the Phoenician alphabet.
After passing in the ‘unknown scripts’ to each of the trained and validated script classifiers, the scheme in Figure 12 yielded 56 N × M dimensional similarity matrices, where N and M are the number of different signs in the two scripts. A strength measure between a pair of scripts can be defined in either of the following two ways.
  • The average of all considers all the of signs by averaging the maximum probability matches between the input signs and the trained script signs. If an input sign had a low correlation with all of the trained signs, then the average of all value would be lowered.
  • The selective average takes the average of only those pairs of signs which have a higher than 75 percent (or other chosen threshold) similarity match.
There are two advantages to the second approach. The first advantage is that the selective average yields a higher measure compared with the average of all. The second advantage is that we can, if we want, also simultaneously obtain the number of input signs which have a pair in the trained script with a similarity threshold above 75 percent.

3.4. Generation of Classification Dendrograms

As was described in Section 3.3, there are two different ways to obtain a strength measure between a pair of scripts. Furthermore, it is convenient to consider the number of input signs for which there is a trained sign with an above 75 percent similarity. The different measures lead to two different algorithms for the generation of classification trees or dendrograms.
  • Similarity classification dendrograms: The weighted pair group method with arithmetic mean (WPGMA) algorithm was used to create a dendrogram as follows. We repeatedly merged those sets of scripts that were most similar according to the similarity matrix. The similarity matrix was updated after each merge. The update requires that the most similar script sets, x and y, are merged into the union xy of the two sets. This means merging the corresponding two rows into one row and the corresponding two columns into one column in the similarity matrix. In addition, the distance to another set, z and xy, is updated using the following equation:
d ( x y ) , z = d x , z + d y , z 2
The similarity is taken to be the negative of the distance.
2.
Hierarchical classification dendrograms: In generating a hierarchal tree, it is assumed that some scripts have an ancestor–descendant relationship. This requires a modification of the WPGMA algorithm, but must also consider the periods during which the scripts were used. If x and y are the most similar to each other, that is, they can be considered to be closest script pair, and x’s period of use preceded y’s period of use, or vice versa, then we consider x to be an ancestor or parent of y. Algorithm 1 was built on this idea.
Algorithm 1 Time-Based Descendant Tree
1: Create parent node P
2: Create a node for each script
3: for all Closest Script Pairs Sx and Sy do
4: if Sx.Time > Sy.Time then
5:  Parent of Sx is P
6:  Parent of Sy is Sx
7: else
8:  Parent of Sy is P
9:  Parent of Sx is Sy
10: for all Singleton Scripts Sz do
11: Parent of Sz is P
12: return Tree

4. Experimental Results

The three main ideas that we have presented above are the creation of the dataset, the design of the classifiers for each script and their use in a scheme to generate a script similarity matrix, and the algorithm for the generation of the hierarchical dendrograms. These three components must all work smoothly together to create a satisfying result. Table 1 shows the accuracy of the individual classifiers for each script. The classifiers of each script reached over 97 percent accuracy at 100 epochs.
To validate the automatic identification of ancestor–descendant relationships, we conducted an experiment in which scripts were grouped as follows: Known Origin, i.e., scripts that are used for validation by showing that we can reproduce established results, and Unknown Origin. Below are some specific examples that fall within these two categorizations.
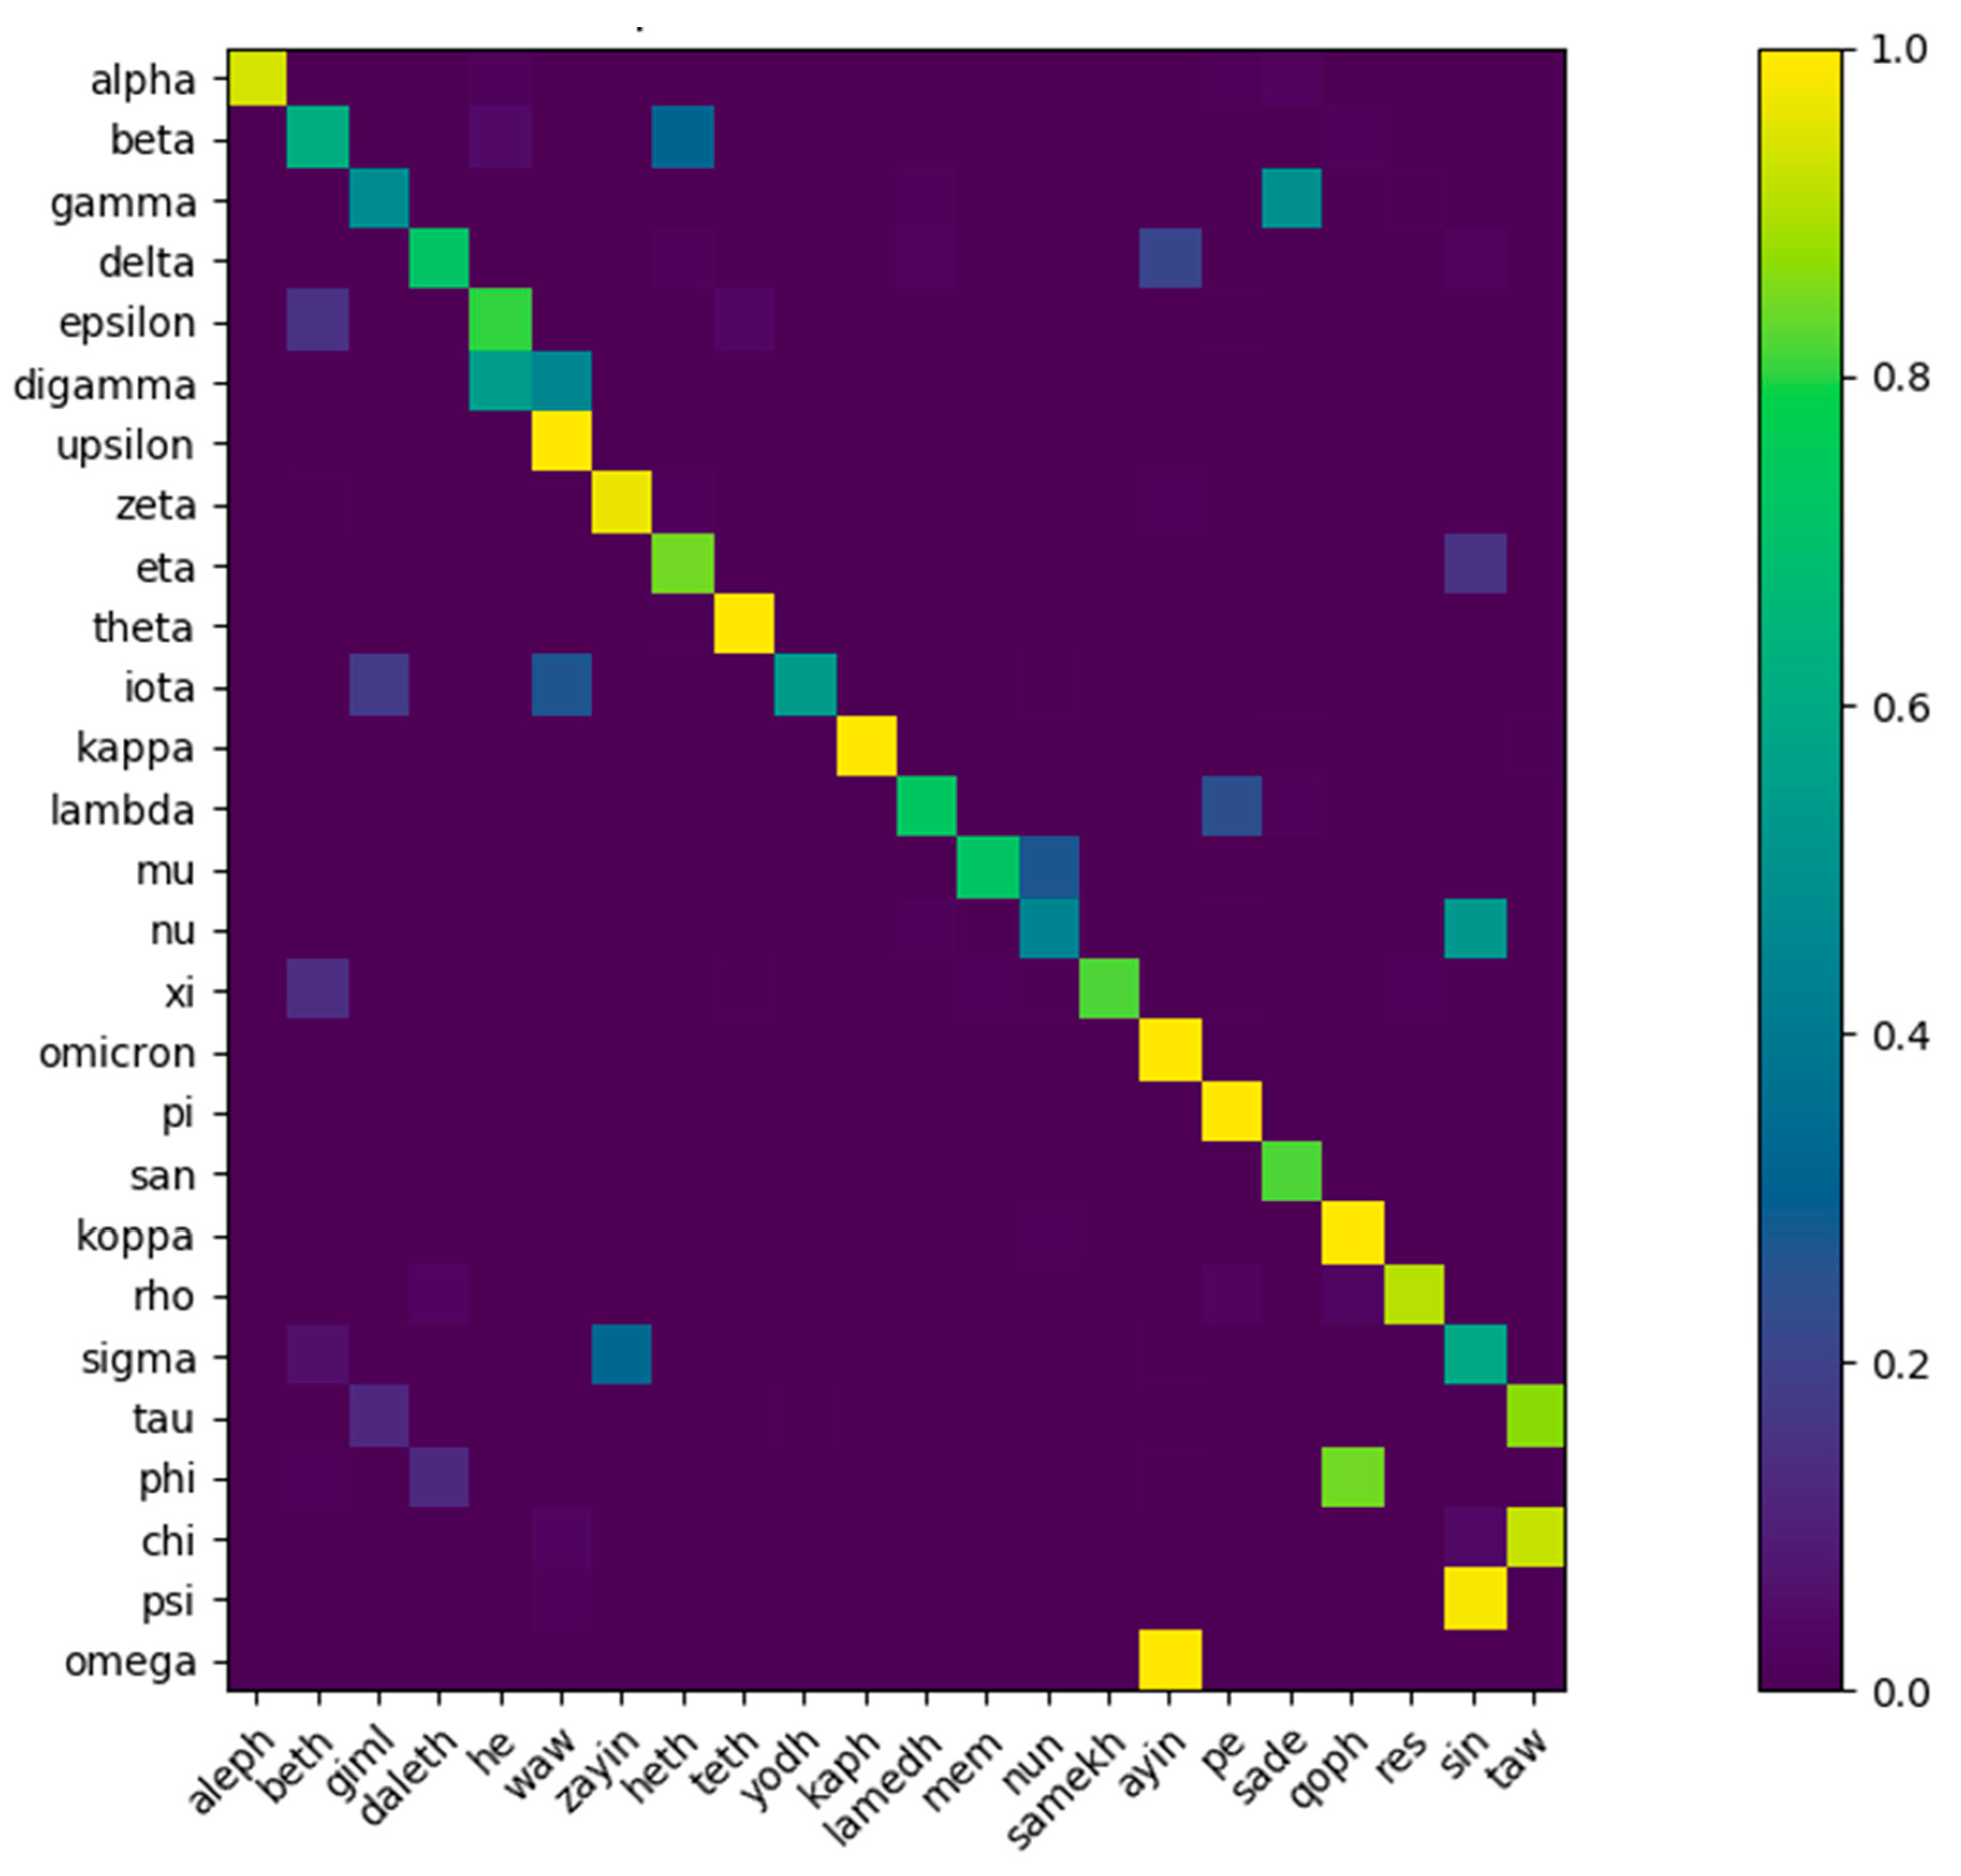
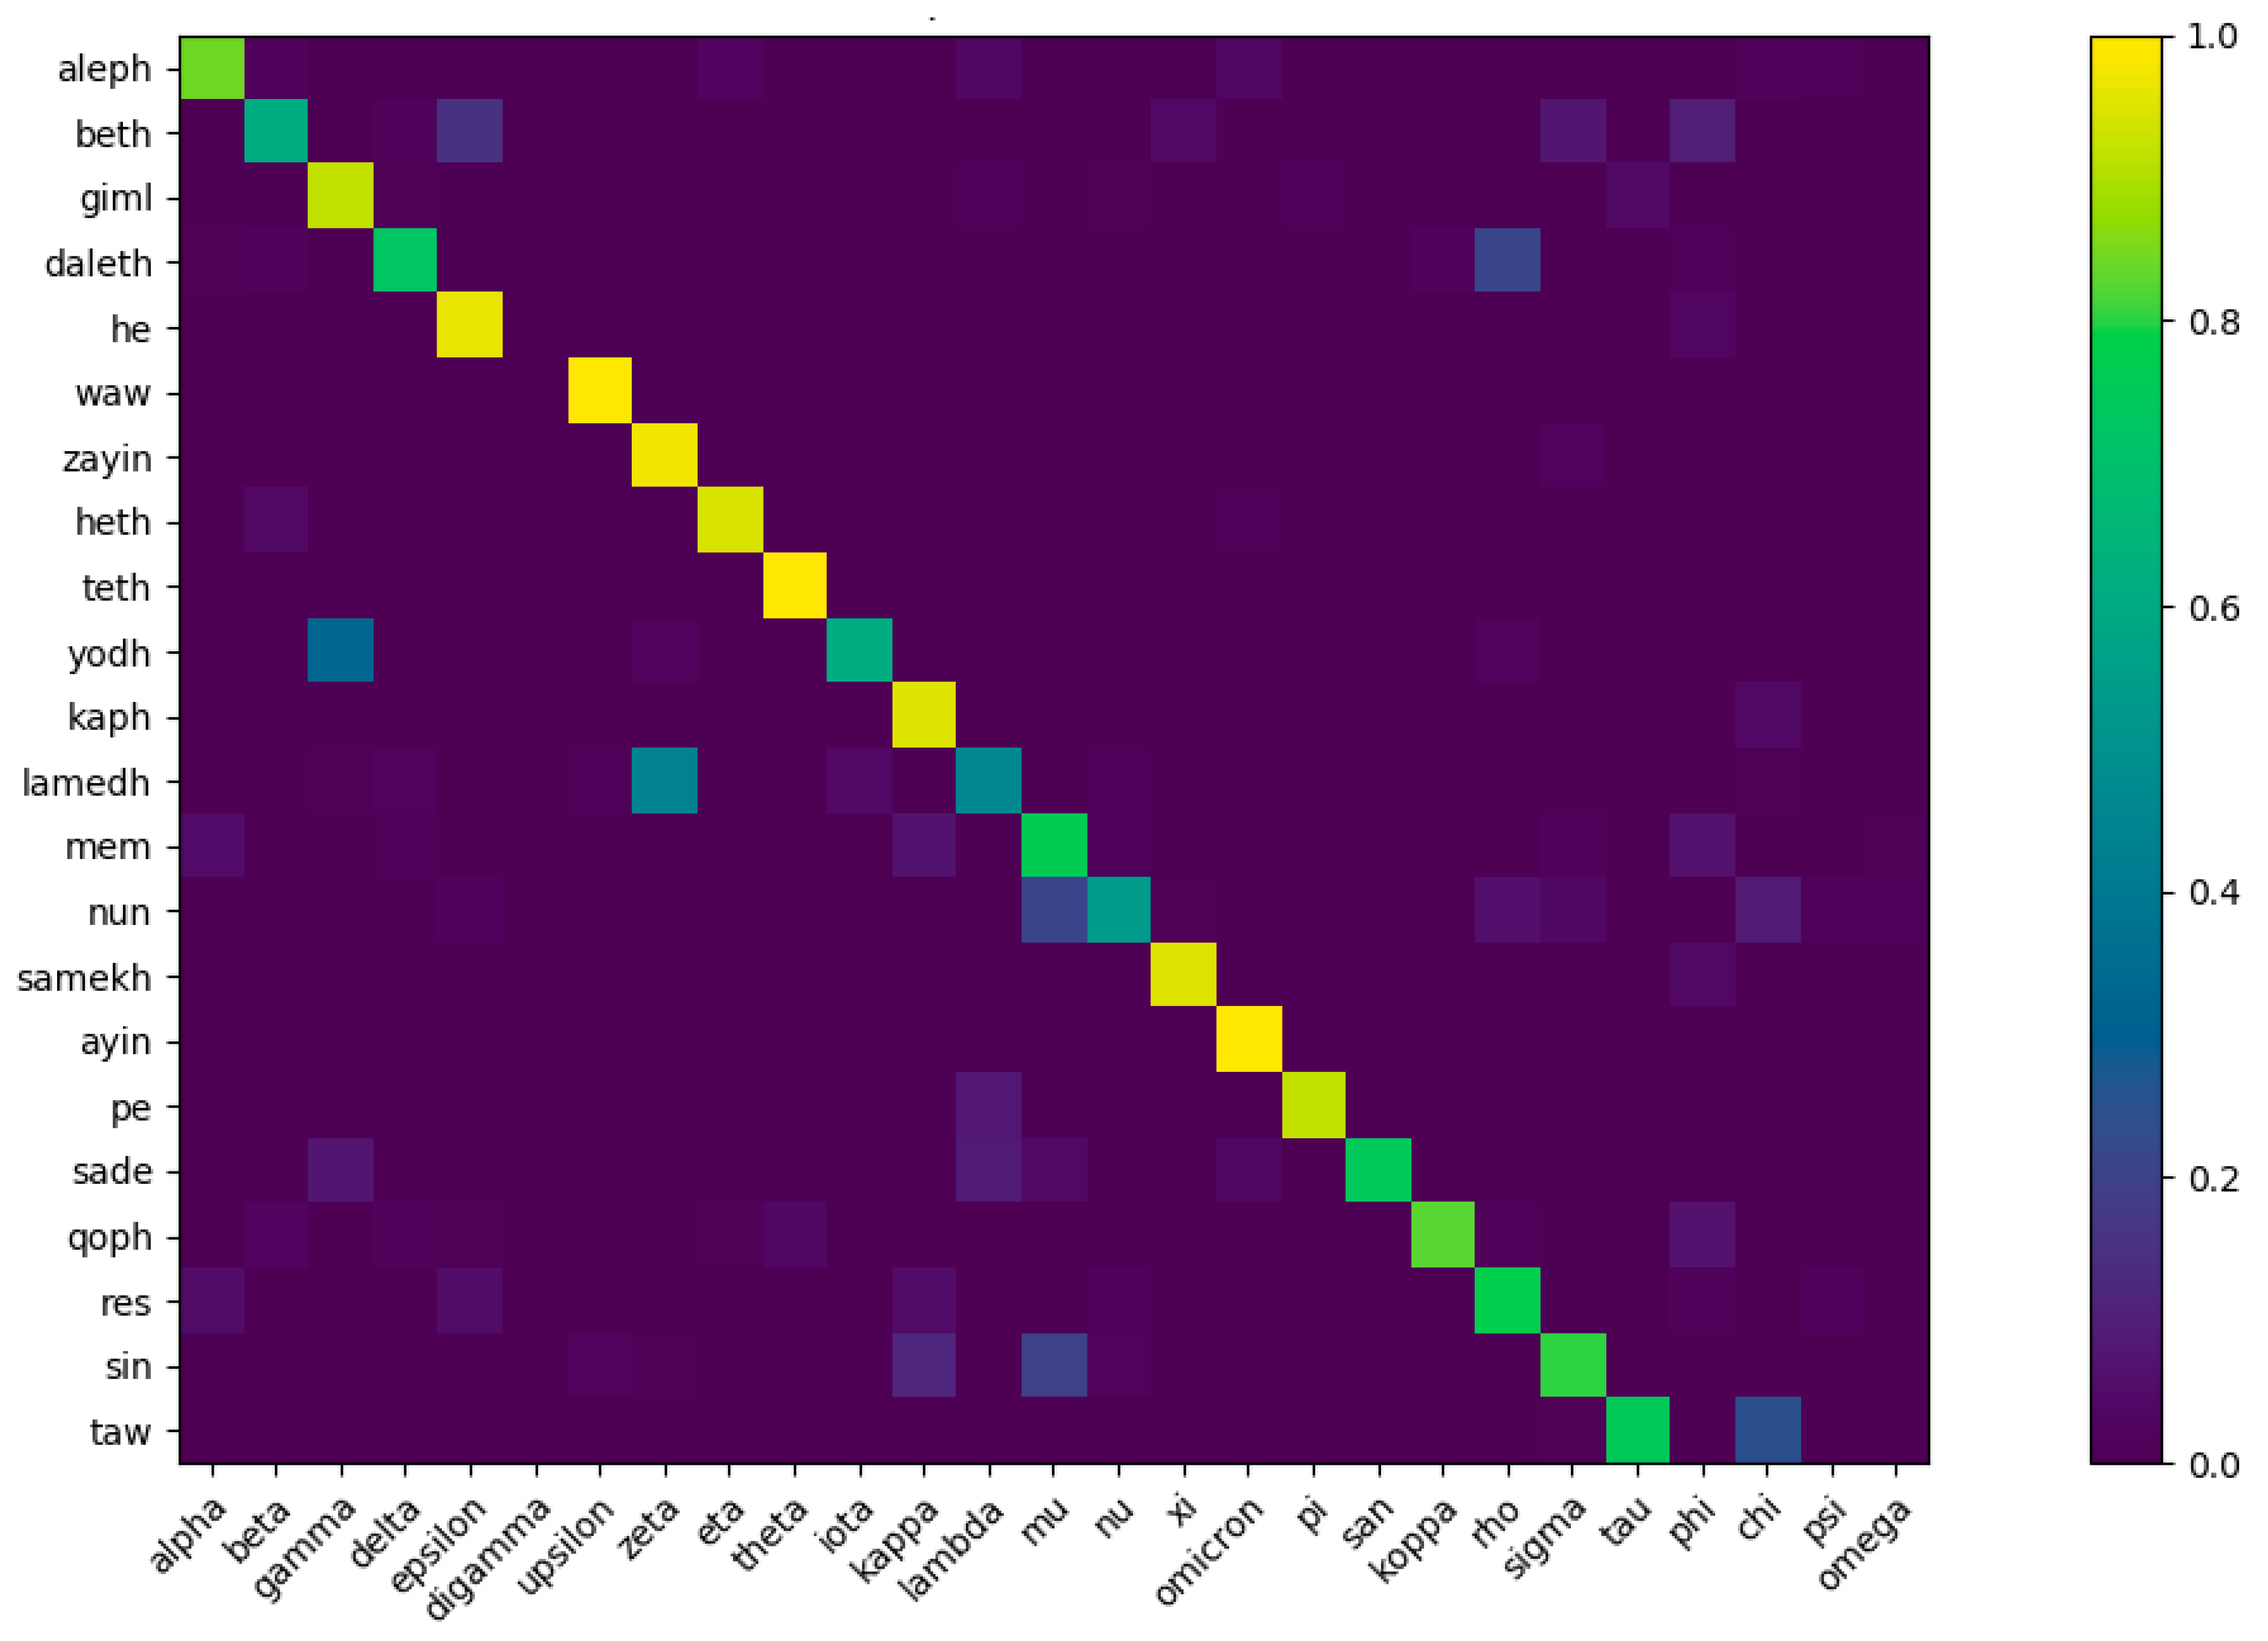
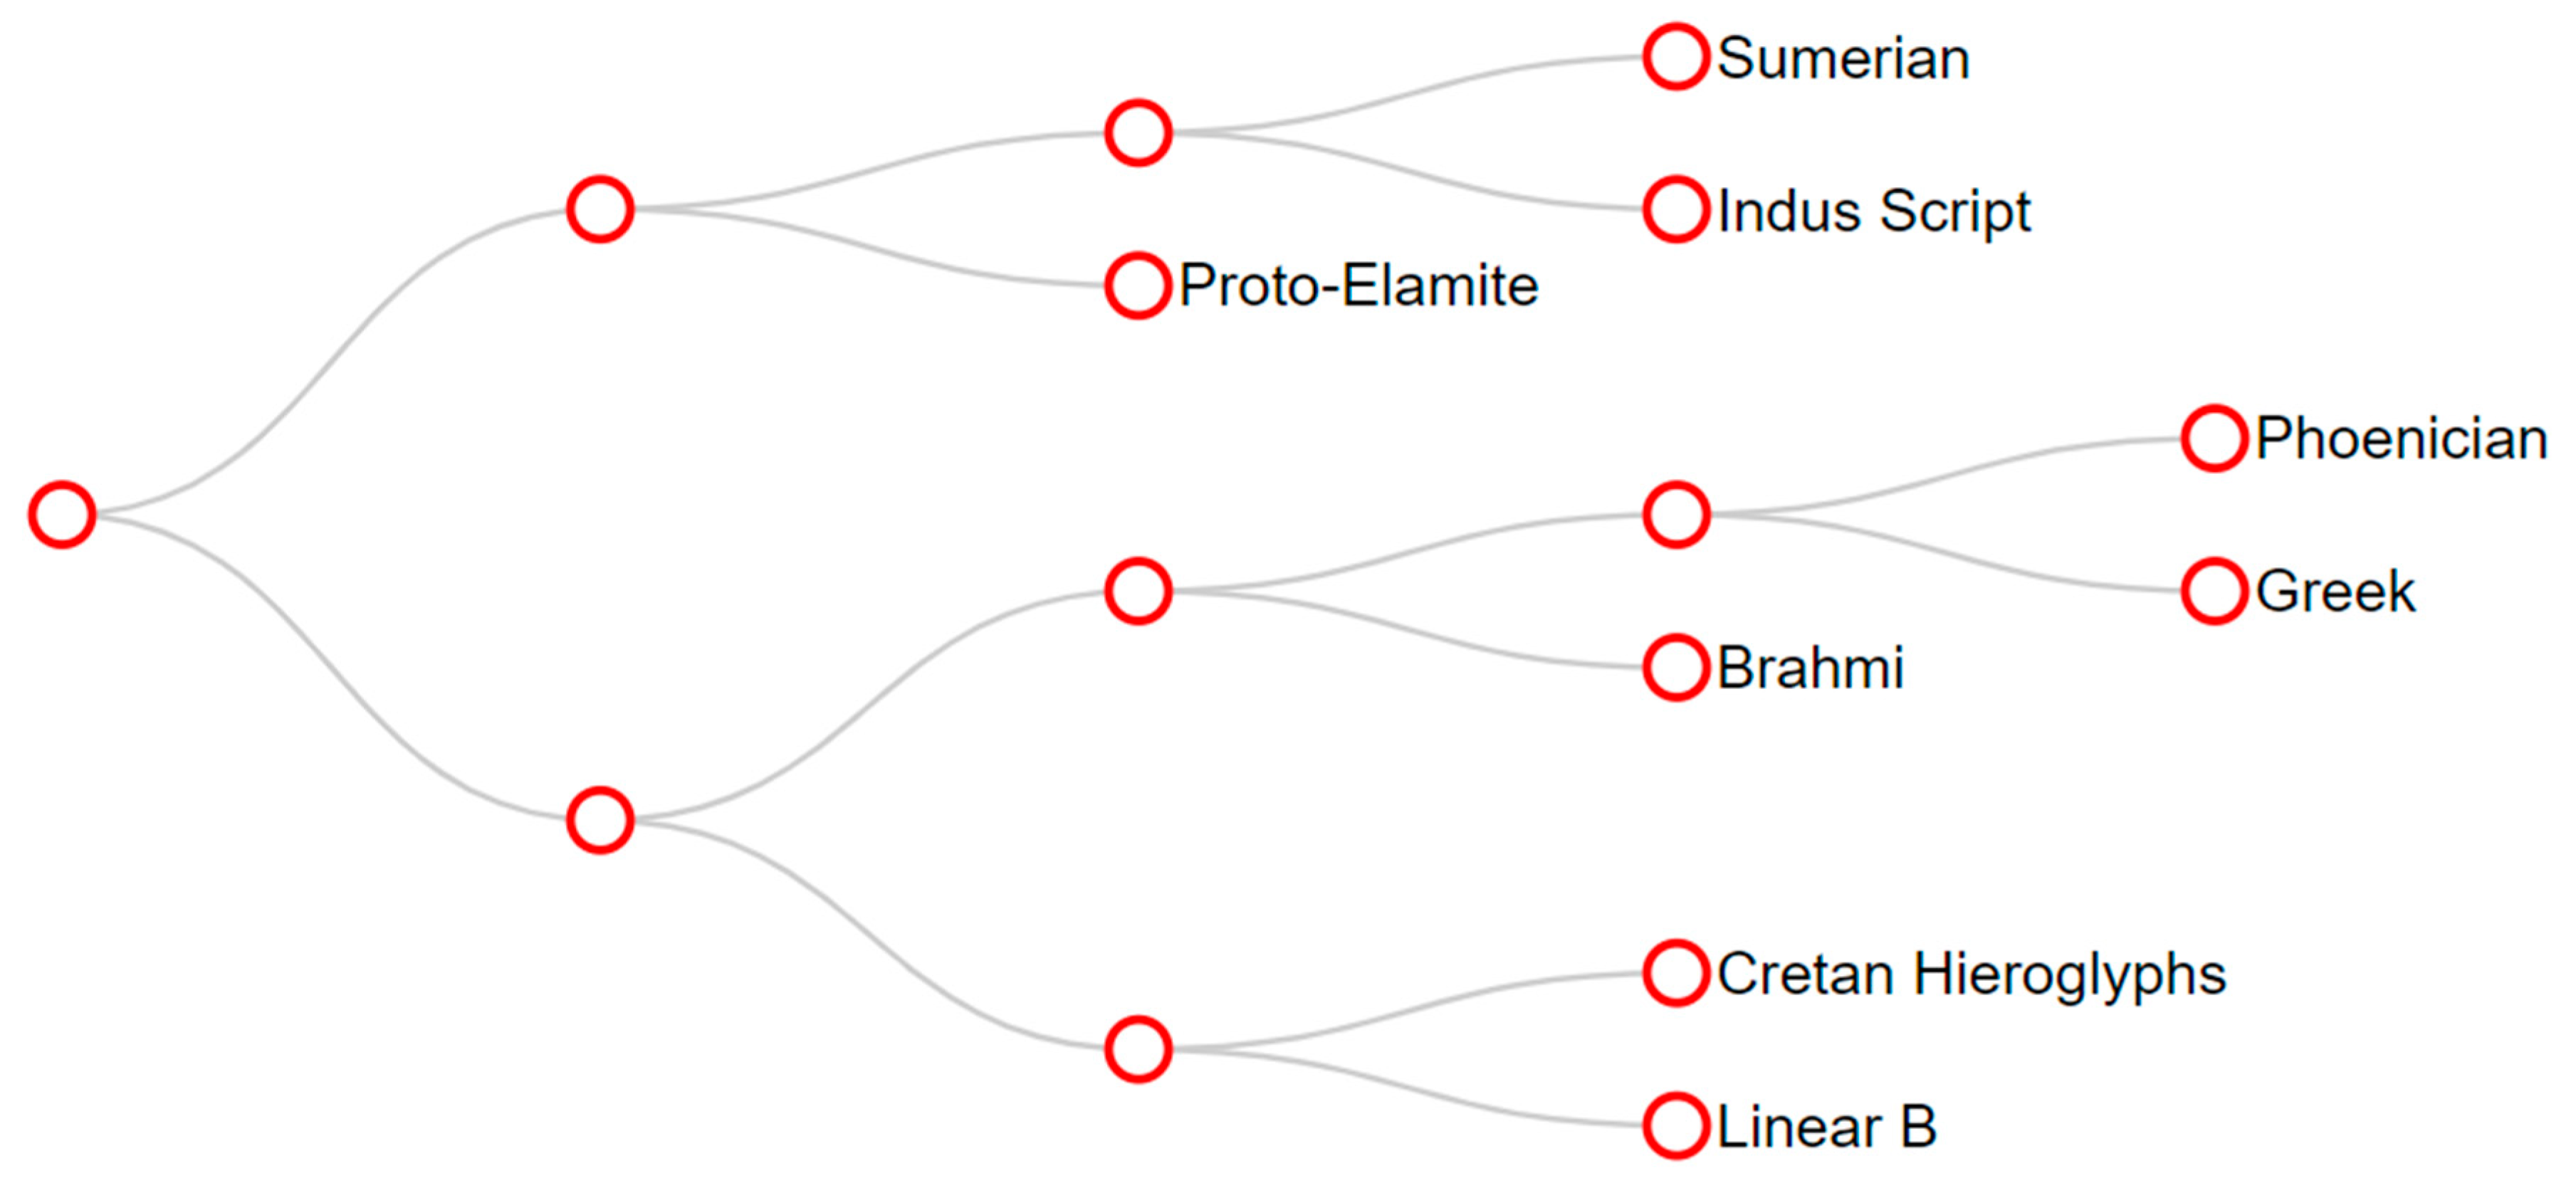
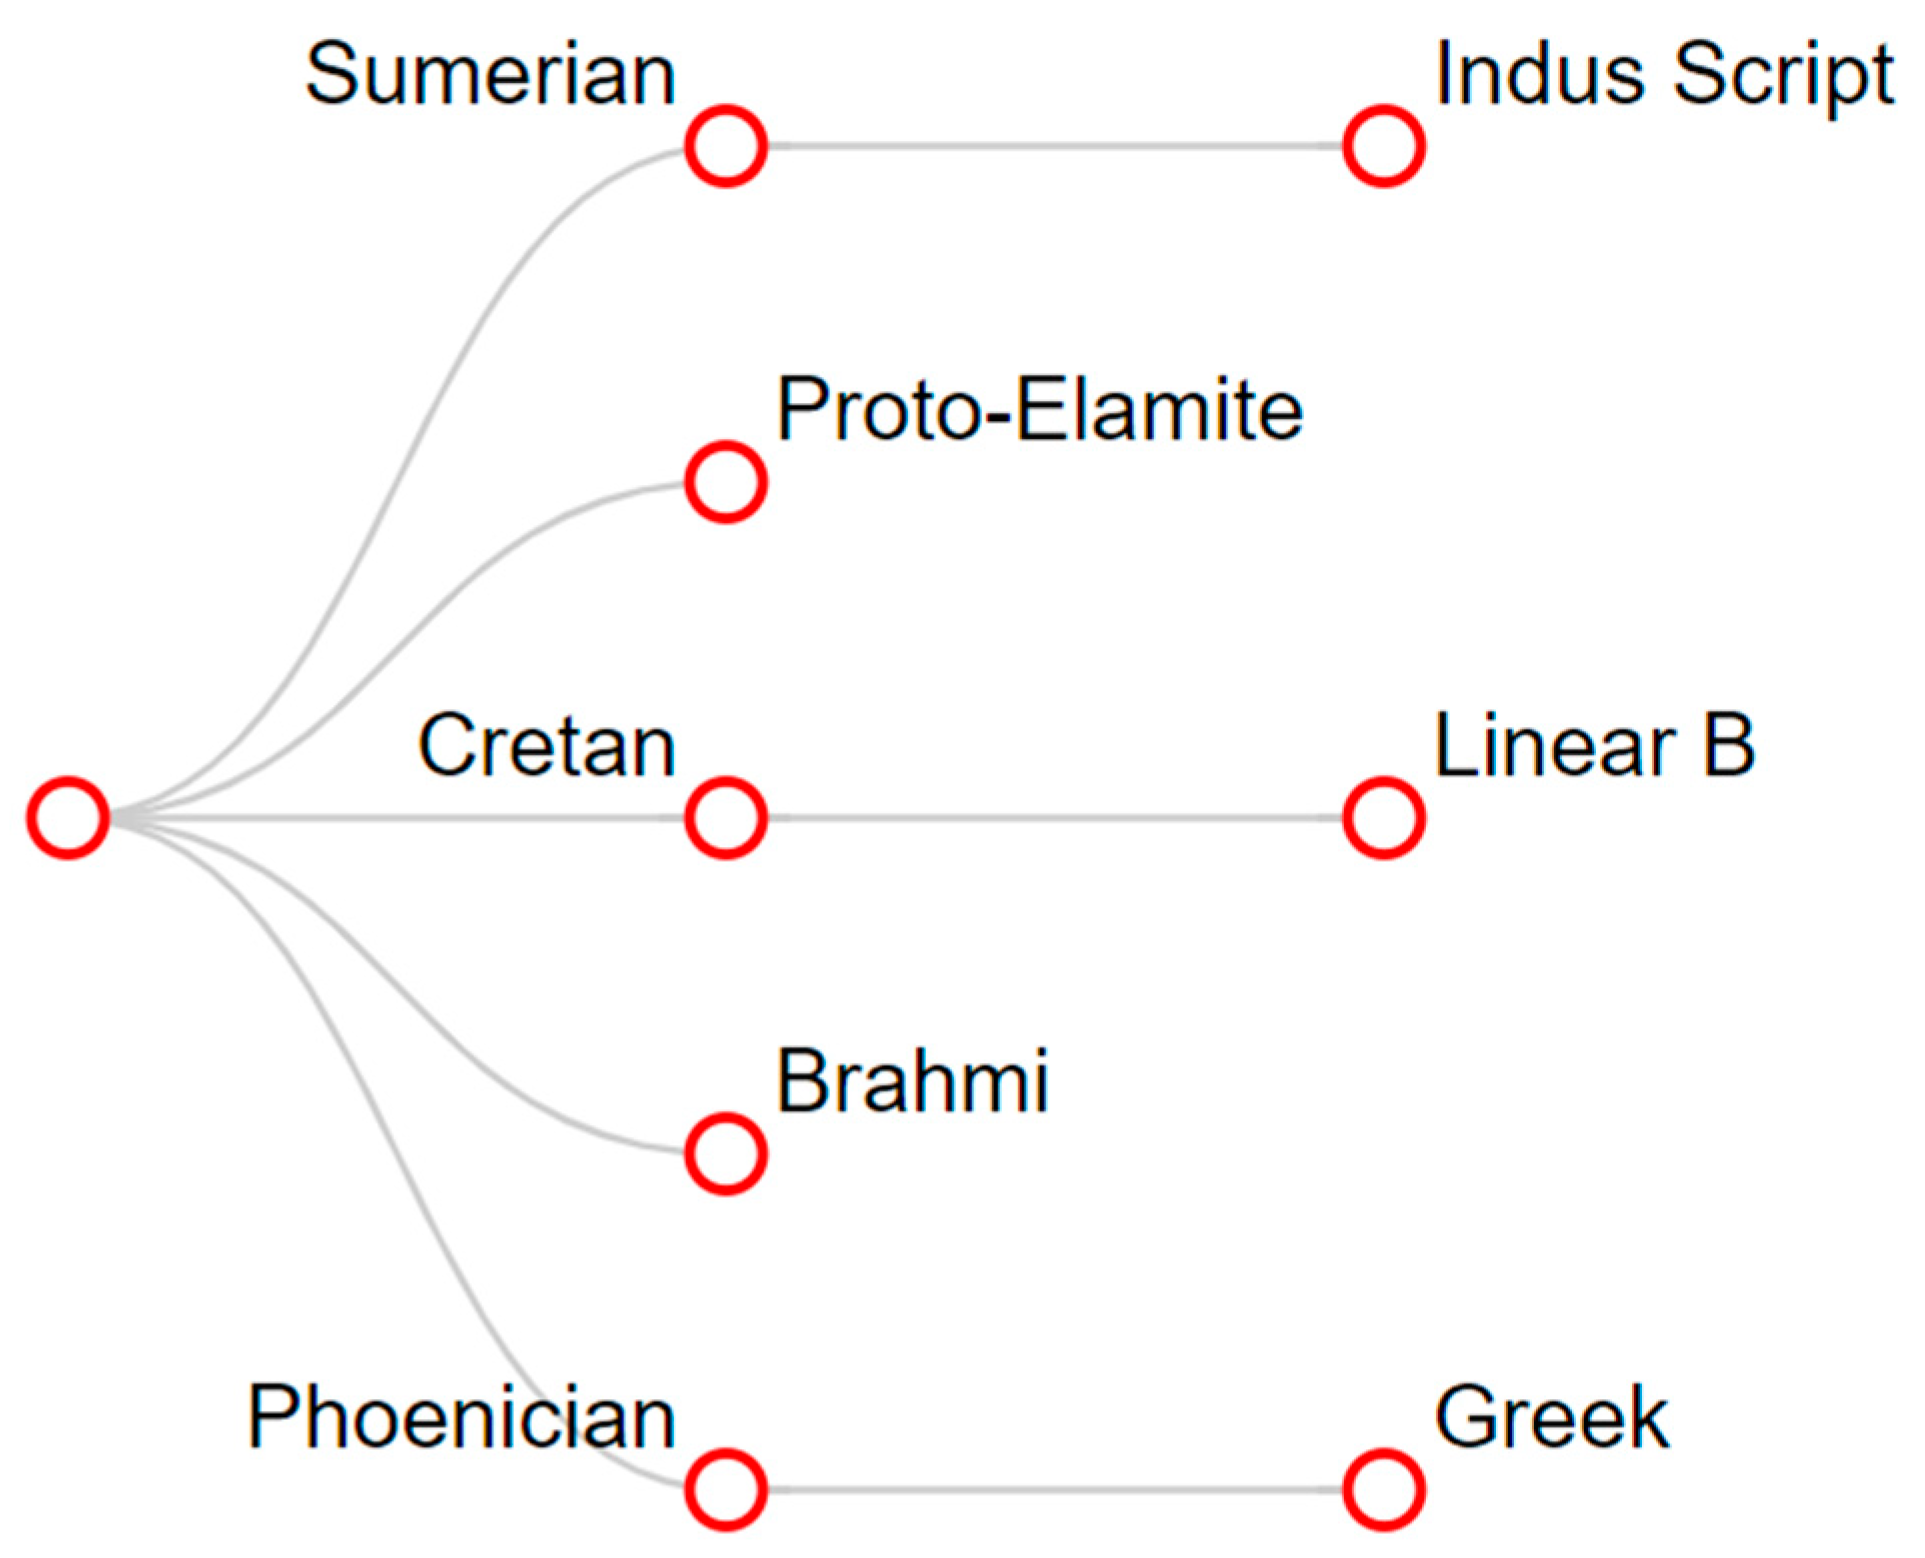
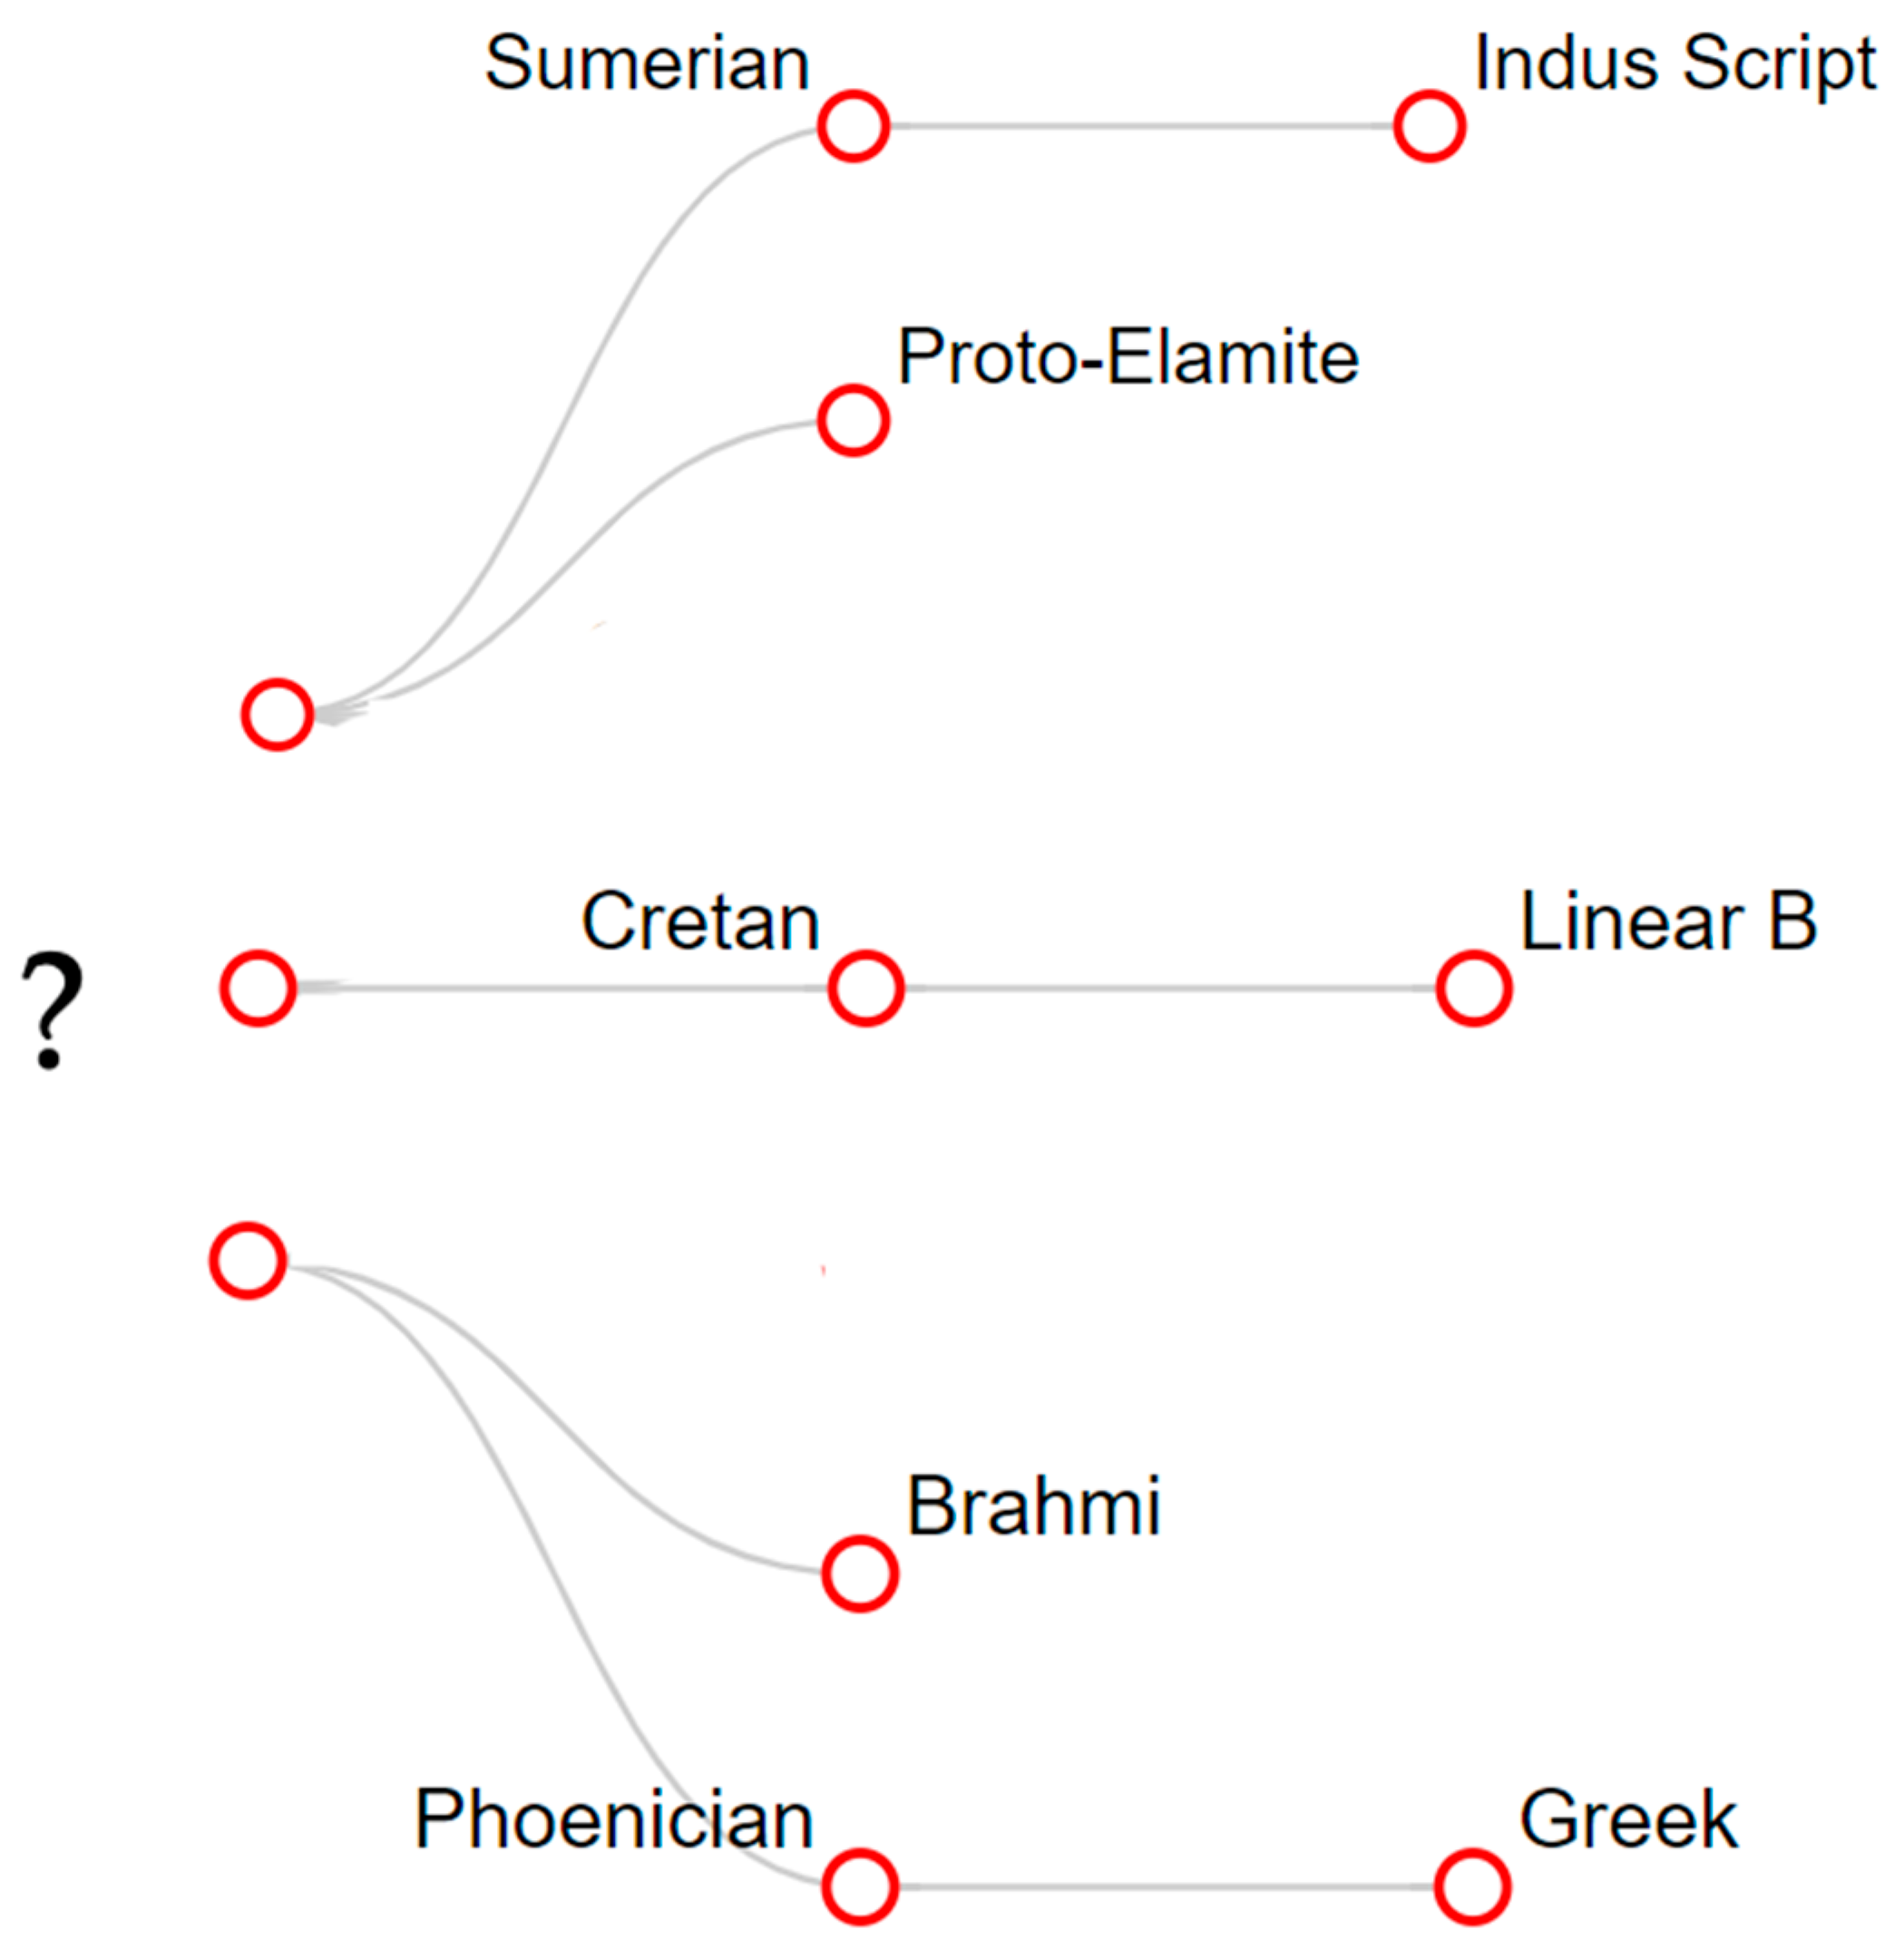
  • Known Origin: It is well-known that the Phoenician alphabet was adopted by the ancient Greeks, who extended it by four letters that are specific to the Greek alphabet, as is shown in Table 2. It is also known to be an ancestor of Aramaic, which is an ancestor of Brahmi. By transitivity, Phoenician is an ancestor of Brahmi too. In addition, Cretan hieroglyphics are often said to be an ancestor of the Linear B script.
  • Unknown Origin: Sumerian pictographs have no known ancestors. A similar situation holds for the proto-Elamite and Indus Valley scripts.
We can validate Phoenician as the ancestor of Greek by passing the letter of the Greek alphabet into the classifier that was trained to recognize the Phoenician alphabet, or vice versa. Figure 13 and Figure 14 show the heatmaps for the Phoenician and the Greek alphabets. The heatmaps were generated from the similarity matrices and show high similarities along the main diagonal. This proves that there is an almost perfect one-to-one function between the letters of the Phoenician and Greek alphabets. Moreover, this mapping matches our original expectations.
After this validation step, we were able to continue with confidence to test the relationship between other pairs of scripts with an unknown relationship. Whenever our CNN+SVM finds an almost one-to-one mapping between two scripts, we can be confident that the two scripts have an ancestor–descendant relationship such as that between the Phoenician and Greek alphabets. Table 3 records the number of signs which have over 75 percent correlation from among the pairs of the eight scripts.
Our CNN+SVM predictor method discovered some previously unrecognized ancestor–descendant relationships. The heatmap in Figure 15 illustrates that there is also an almost perfect one-to-one function between Sumerian pictograms and Indus Valley signs.

5. Discussion of the Results

Figure 16 and Figure 17 show the classifications and the hierarchical dendrograms that were generated from among the scripts using the similarity matrices.
In addition to verifying the known origins, the classification dendrogram reveals some new information. The most interesting seems to be that shown by the two main branches in Figure 16. The first branch is composed of proto-Elamite, Sumerian pictographs, and the Indus Valley script, while the second major branch is composed of the remaining scripts.
The hierarchical tree of Figure 17 takes into consideration the time intervals during which the scripts were used. Figure 17 considers Greek to be a Phoenician descendant, while Linear B is a descendant of Cretan hieroglyphs. Interestingly, Sumerian pictographs are identified as ancestors of the Indus Valley script signs. Figure 17 shows no known ancestor for proto-Elamite or Brahmi. The most tentative aspect of Figure 16 and Figure 17 is the assumption of a common origin of all the scripts. This is only because the algorithm is designed to draw the best tree to explain the development of these eight scripts from a single source. The existence of a single source is only a hypothesis built into the algorithms that generated the classification trees. In fact, it is rather unlikely that a single unidentified source would spread independently in five different directions, as is shown in Figure 17. It is more plausible that the unknown source spread in two separate directions, as indicated by the two main branches of Figure 16.
A possible criticism of the above methodology is that the scripts are assumed to be related a priori. Of course, that may not necessarily be the case. There could have been independent developments in writing taking place in various regions of the world. By dropping the built-in assumption that there must be a single source for all eight ancient scripts, it is possible to obtain an alternative classification that is consistent with the timeline of use of these scripts and all the script similarity information that we obtained, but which allows for three different inventions and the spreading of ancient writing as shown in Figure 18. Figure 18 shows a classification forest with three roots instead of a classification tree with only one root.
The three groups that we obtained correspond to the red, orange, and blue set of scripts shown in Figure 10. The red scripts are the earliest scripts and are located near each other, as is shown in Figure 10. These correspond to the first group in Figure 18. It is possible that ancient traders spread the Sumerian script to the Indus Valley via a sea route. There are also many similarities between the two locations, such as in architecture and food production [23]. Moreover, Sumerian inscriptions called the Indus Valley Civilization Meluhha. This name may be related to the present-day region of Baluchistan [8].
The orange scripts are the middle two scripts in Figure 10, and these correspond to the second group in Figure 18. The location of Cretan hieroglyphs and Linear B overlap. It is possible that Cretan hieroglyphs developed into Linear A, which was also used by the Minoan civilization, and then Linear A developed into Linear B after the Mycenaean conquest of Crete. The Linear B script may then have spread to other Mycenaean areas.
Finally, the blue scripts are the three most recent scripts in Figure 10, and these correspond to the third group in Figure 18. The locations of the ancient Greek alphabet, the Phoenician alphabet, and the Brahmi script are farther apart. Of these three, the Phoenician alphabet is the oldest and may have originated in the Bronze Age as a descendant of proto-Sinaitic, which was invented in the Sinai Peninsula under the influence of Egyptian hieroglyphs [11]. The Phoenician alphabet could also have been spread by traders [24]. The analysis of ancient weight measures shows that there was an ancient version of the Silk Road between Greece and India in the Bronze Age [25].
Clearly, the smaller values in Table 3 mean that there are fewer pairs of signs with a one-to-one match between the two scripts. Since there is no established threshold value for saying that two scripts are related, we presented different possible solutions in Figure 16, Figure 17 and Figure 18. Nevertheless, if script S1 is an ancestor of script Sn, then there has to be a chain of temporally overlapping scripts Si and Si+1 for 1 <= i <= n, such that Si is an ancestor of Si+1. The red scripts have this overlap. The orange scripts do not have this overlap, but we obtain an overlap if we add the missing Linear A script. Finally, the blue scripts also have an overlap.
However, there appears to be a time gap between the latest red and the earliest orange script, and no additional script is known to have existed that can bridge this time gap. Hence, the red and the orange scripts seem to be independent developments. Similarly, there is a time gap between the latest orange and the earliest blue scripts in Figure 1. Therefore, these also appear to be independent developments. Hence, Figure 18 seems to be the best solution.
To better analyze the relationships among the eight scripts, we introduced a new assumption. We assumed that if script x’s maximum connection is to another script, y, then x and y are related scripts. The relationship could be either because of an ancestor–descendant relationship or because of a common ancestor. The reason for this assumption is that while some scripts change significantly over time, they always stay most like those scripts with which they share a recent common ancestor. Implicitly, being closest to a particular script matters more than the actual number of similarities between the scripts.
As an example, suppose that Table 4 is a simple estimate of vocabulary similarities among six languages ranging from 10 (most similar) to 1 (least similar). To aid the analysis, the maximum value in each column and row is highlighted by a color. Our assumption allows the grouping together of Arabic and Hebrew, which are Semitic languages, English and German, which belong of the Germanic branch of the Indo-European languages, and Finnish and Hungarian, which are Uralic languages that diverged thousands of years ago. Hence, our assumption led to a grouping that corresponds to the usual classification of language families. The clustering algorithm ignored some values that may have arisen due to word borrowings such as the value 4 between Hebrew and German.
Similarly, the existence of three separate sources for the eight scripts is implied by a rearrangement of Table 3, as is shown in Table 5. In Table 5, the maximum non-diagonal values in each column and row are highlighted. The columns and rows highlighted in red form the cluster that is associated with the first branch in Figure 18, the columns and rows highlighted in orange form the cluster that is associated with the second branch in Figure 18, and the columns and rows highlighted in blue form the cluster that is associated with the third branch in Figure 18. The red scripts may have originated in Mesopotamia and were likely logographic, the orange scripts may have originated in Europe, and the blue scripts may be traced back to the Egyptian hieroglyphs, which is likely to have influenced the development of the proto-Sinaitic script that is an ancestor of the Phoenician alphabet. Figure 18 seems to present a logical explanation of the development of writing originating from three different locations, although some cross-influence among the three groups cannot be ruled out. These cross-influences would include such things as word borrowings.
The grouping of the scripts is not intended to imply that the languages are related. For example, the Latin alphabet is used to write many different modern languages that belong to complete different language families. Therefore, similarity between languages is independent from the similarity of the scripts. Only after a decipherment can we say whether the languages are related to each other.
There are some even more advanced character-recognition algorithms beyond our convolutional neural networks. However, the convolutional neural network we used was already able to accurate perform character recognition. The main problem addressed in this paper was the comparison of characters from different scripts, rather than character recognition within a single script. The character comparison also gave high similarity measures for related signs, as is shown in the heat maps of Figure 14, Figure 15 and Figure 16. Low character comparison values were obtained only when the signs were not related to each other.

5.1. Related Work

Sir Alexander Cunningham assumed that the Indus Valley seals were imports. He and other scholars also thought that Brahmi may have been a descendant of the Indus Valley Script [26,27] and that it may have expressed a Dravidian language [8,28,29].
A weakness of these proposals is the large time gap between the latest Indus Valley and the earliest Brahmi script inscriptions, which are likely from the time of Ashoka’s Empire in the 3rd century BCE, although some authors assume around 500 BCE for the beginning of this script. Salomon [30] has proposed a Phoenician alphabet origin of the Brahmi script. This latter proposal agrees more closely with our proposal in Figure 16, where Brahmi and Phoenician are placed in the same branch of the script evolution tree.
The proto-Elamite script also reflects a Dravidian language, according to the Elamo–Dravidian hypothesis. McAlpin [31] thinks that the Elamo–Dravidian language family also includes the underlying language of the Indus Valley script. McAlpin’s theory agrees with our proposal in Figure 16, which places the proto-Elamite script, the Indus Valley script, and Sumerian pictograms in the same branch of the script evolution tree. Relationships among these three are also suggested by archaeological evidence of connections among the Elamite, Indus Valley, and Sumerian civilizations [8,24].
Farmer et al. [32] question whether the Indus Valley Script reflects a language. They propose that it is more like the clan names/signs on heraldic coats of arms or the symbols of various gods. Regardless of whether it is a language, its apparent similarity to the Sumerian pictographs suggests that it is a descendant of the latter. Since the Indus Valley script inscriptions are rather short, they may not represent a full language. That is also the case for the proto-cuneiform writing in Mesopotamia dating from about 3300 BCE. In these proto-cuneiform inscriptions, the signs record calculations concerning products such as beer, and various occupations.

5.2. Machine Learning

Convolutional neural networks have been used for a long time for optical character recognition [33]. Convolutional neural networks and support vector machines have been applied to an increasing number of scripts. For example, Elleuch et al. [20] applied another combination of CNN and SVM to the recognition of Arabic letters. He et al. [34] and Yang et al. [35] used CNNs for handwritten Chinese character recognition. Arora et al. [36] compared neural networks and support vector machines using the Devanagari script, which is a Brahmi descendant. However, these earlier works did not apply CNNs to generate various script classification dendrograms, as in the current paper, and in the preliminary conference papers of the authors [37,38]. The authors also applied non-neural network-based techniques to identify allographs within the Indus Valley script [39].
Some recent works have used a feature vector-based analysis instead of neural networks to decipher Cretan hieroglyphic [40], Linear A [41], and Old Hungarian inscriptions [42], and to investigate the reading direction of the Phaistos Disk [43]. Other promising computer-based methods for the analysis of scripts are described in [44,45]. It remains to be seen whether neural networks can also be used for the decipherment of scripts.

6. Conclusions and Open Problems

The invention of writing was a major milestone, although the exact time and circumstances, as well as the details of its early spread, remain mostly a mystery. In this paper, we have presented some strong arguments for several surprising ancestor–descendant relationships among some of the oldest known scripts. We plan to expand this work to many more scripts to explore ancient script families. Future work will go beyond the region of the Near East and the Mediterranean Sea to other likely independent script families in America, East Asia, and other regions.

Author Contributions

Conceptualization, S.D. and P.Z.R.; methodology, S.D. and P.Z.R.; investigation, S.D. and P.Z.R.; writing—original draft preparation, S.D. and P.Z.R.; writing—review and editing, S.D. and P.Z.R. All authors have read and agreed to the published version of the manuscript.

Funding

This research received no external funding.

Institutional Review Board Statement

Not applicable.

Informed Consent Statement

Not applicable.

Data Availability Statement

Not applicable.

Conflicts of Interest

The authors declare no conflict of interest.

References

  1. Salomon, R. Indian Epigraphy: A Guide to the Study of Inscriptions in Sanskrit, Prakrit, and the other Indo-Aryan Languages; Oxford University Press: Oxford, UK, 1998. [Google Scholar]
  2. Olivier, J.-P. Cretan writing in the second millennium BCE. World Archaeol. 1986, 17, 377–389. [Google Scholar] [CrossRef]
  3. Cook, B.F. Greek Inscriptions; University of California Press: Berkeley, CA, USA, 1987; Volume 5. [Google Scholar]
  4. Mahadevan, I. The Indus Script: Texts, Concordance and Tables, Memoirs; Archaeological Survey of India: Delhi, India, 1977; Volume 77.
  5. Joshi, J.P.; Parpola, A. Corpus of Indus Seals and Inscriptions. vol. 1, Collections in India. In Annales Academiae Scientiarum Fennicae; Series B; Suomalainen Tiedeakatemia: Helsinki, Finland, 1987; Volume 239. [Google Scholar]
  6. Shah, S.G.M.; Parpola, A. Corpus of Indus Seals and Inscriptions, vol 2. Collections in Pakistan. In Annales Academiae Scientiarum Fennicae; Series B; Suomalainen Tiedeakatemia: Helsinki, Finland, 1991; Volume 240. [Google Scholar]
  7. Parpola, A.; Pande, B.M.; Koskikallio, P. Corpus of Indus Seals and Inscriptions, Vol. 3. New Material, Untraced Objects, and Collections Outside India and Pakistan; Suomalainen Tiedeakatemia: Helsinki, Finland, 2010. [Google Scholar]
  8. Parpola, A. Deciphering the Indus Script; Cambridge University Press: Cambridge, UK, 2009. [Google Scholar]
  9. Chadwick, J. The Decipherment of Linear B; Cambridge University Press: Cambridge, UK, 1958. [Google Scholar]
  10. Fischer, S.R. History of Writing; Reaktion Books: London, UK, 2004. [Google Scholar]
  11. Colless, B.E. The origin of the alphabet: An examination of the Goldwasser hypothesis. Antig. Oriente 2014, 12, 71–104. [Google Scholar]
  12. Revesz, P.Z. Bioinformatics evolutionary tree algorithms reveal the history of the Cretan Script Family. Int. J. Appl. Math. Inform. 2016, 10, 67–76. [Google Scholar]
  13. Englund, R.K. The Proto-Elamite script. In The World’s Writing Systems; Daniels, P.T., Bright, W., Eds.; Oxford University Press: Oxford, UK, 1996; pp. 160–164. [Google Scholar]
  14. Dahl, J.L. Complex graphemes in Proto-Elamite. Cuneif. Digit. Libr. J. 2005, 4. Available online: https://cdli.mpiwg-berlin.mpg.de/articles/cdlj/2005-3 (accessed on 3 April 2023).
  15. Labat, R.; Malbran-Labat, F. Manuel D’épigraphie Akkadienne: Signes, Syllabaire, Idéogrammes, Librairie Orientaliste Paul Geuthner; Enlarged édition (1 avril 2002). Available online: https://www.amazon.fr/Manuel-dépigraphie-akkadienne-Syllabaire-Idéogrammes/dp/2705335838 (accessed on 3 April 2023).
  16. Parpola, S. Etymological Dictionary of the Sumerian Language. J. Indo-Eur. Stud. 2022, 3, 247–252. [Google Scholar]
  17. Revesz, P.Z. Sumerian contains Dravidian and Uralic substrates associated with the Emegir and Emesal dialects. WSEAS Trans. Inf. Sci. Appl. 2019, 16, 8–30. [Google Scholar]
  18. LeCun, Y.; Cortes, C.; Burges, C. MNIST Handwritten Digit Database. Available online: http://yann.lecun.com/exdb/mnist/ (accessed on 5 April 2019).
  19. LeCun, Y.; Bottou, L.; Bengio, Y.; Haffner, P. Gradient-based learning applied to document recognition. Proc. IEEE 1998, 86, 2278–2324. [Google Scholar] [CrossRef] [Green Version]
  20. Elleuch, M.; Tagougui, N.; Kherallah, M. A novel architecture of CNN based on SVM classifier for recognizing Arabic handwritten script. Int. J. Intell. Syst. Technol. Appl. 2016, 15, 323–340. [Google Scholar]
  21. Kingma, D.P.; Ba, J. Adam: A method for stochastic optimization. In Proceedings of the 3rd International Conference on Learning Representations, San Diego, CA, USA, 7–9 May 2015. [Google Scholar]
  22. Yann, M.L.; Tang, Y. Learning deep convolutional neural networks for X-ray protein crystallization image analysis. In Proceedings of the Thirtieth AAAI Conference on Artificial Intelligence, Phoenix, AZ, USA, 12–17 February 2016; AAAI Press: Palo Alto, CA, USA, 2016; pp. 1373–1379. [Google Scholar]
  23. Collon, D. Mesopotamia and the Indus: The evidence of the seals. In The Indian Ocean in Antiquity; The British Museum and Kegan Paul International: London, UK; New York, NY, USA, 1996; pp. 209–225. [Google Scholar]
  24. Howard, M.C. Transnationalism in Ancient and Medieval Societies: The Role of Cross-Border Trade and Travel; McFarland: Jefferson, NC, USA, 2014. [Google Scholar]
  25. Revesz, P.Z. Data science applied to discover ancient Minoan-Indus Valley trade routes implied by common weight measures. In Proceedings of the 26th International Database Engineered Applications Symposium (IDEAS), Budapest, Hungary, 22–24 August 2022; ACM Press: New York, NY, USA, 2022; pp. 150–155. [Google Scholar]
  26. Rao, R.P.; Yadav, N.; Vahia, M.N.; Joglekar, H.; Adhikari, R.; Mahadevan, I. Entropic evidence for linguistic structure in the Indus script. Science 2009, 324, 5931. [Google Scholar] [CrossRef] [PubMed] [Green Version]
  27. Rao, R.P.; Yadav, N.; Vahia, M.N.; Joglekar, H.; Adhikari, R.; Mahadevan, I. A Markov model of the Indus Script. Proc. Natl. Acad. Sci. USA 2009, 106, 13685–13690. [Google Scholar] [CrossRef] [PubMed] [Green Version]
  28. Wells, B.K. Epigraphic Approaches to Indus Writing; Oxbow Books: Oxford, UK, 2011. [Google Scholar]
  29. Zide, A.R.; Zvelebil, K.V. (Eds.) The Soviet Decipherment of the Indus Valley Script: Translation and Critique. In Janua Linguarum. Series Practica; de Gruyter Mouton: Berlin, Germany, 1976; Volume 156. [Google Scholar] [CrossRef]
  30. Salomon, R. On the origin of the early Indian scripts. J. Am. Orient. Soc. 1995, 115, 271–279. [Google Scholar] [CrossRef]
  31. McAlpin, D.W. Proto-Elamo-Dravidian: The evidence and its implications. Trans. Am. Philos. Soc. 1981, 71, 1–155. [Google Scholar] [CrossRef] [Green Version]
  32. Farmer, S.; Sproat, R.; Witzel, M. The collapse of the Indus-script thesis: The myth of a literate Harappan civilization. Electron. J. Vedic Stud. 2016, 11, 19–57. [Google Scholar]
  33. Jaderberg, M.; Simonyan, K.; Vedaldi, A.; Zisserman, A. Reading text in the wild with convolutional neural networks. Int. J. Comput. Vis. 2016, 116, 1–20. [Google Scholar] [CrossRef] [Green Version]
  34. He, M.; Zhang, S.; Mao, H.; Jin, L. Recognition confidence analysis of hand-written Chinese character with CNN. In Proceedings of the 13th International Conference on Document Analysis and Recognition, Nancy, France, 23–26 August 2015; IEEE: Piscataway, NJ, USA, 2015; pp. 61–65. [Google Scholar]
  35. Yang, W.; Jin, L.; Liu, M. Chinese character-level writer identification using path signature feature, DropStroke and deep CNN. In Proceedings of the 13th International Conference on Document Analysis and Recognition, Nancy, France, 23–26 August 2015; IEEE: Piscataway, NJ, USA, 2015; pp. 546–550. [Google Scholar]
  36. Arora, S.; Bhattacharjee, D.; Nasipuri, M.; Malik, L.; Kundu, M.; Basu, D.K. Performance comparison of SVM and ANN for handwritten Devnagari character recognition. arXiv 2010, arXiv:1006.5902. [Google Scholar]
  37. Daggumati, S.; Revesz, P.Z. Data mining ancient script image data using convolutional neural networks. In Proceedings of the 22nd International Database Engineering and Applications Symposium, Villa San Giovanni, Italy, 18–20 June 2018; ACM Press: New York, NY, USA, 2018; pp. 267–272. [Google Scholar]
  38. Daggumati, S.; Revesz, P.Z. Data mining ancient scripts to investigate their relationships and origins. In Proceedings of the 23rd International Database Engineering and Applications Symposium, Athens, Greece, 10–12 June 2019; ACM Press: New York, NY, USA, 2019; pp. 209–218. [Google Scholar]
  39. Daggumati, S.; Revesz, P.Z. A method of identifying allographs in undeciphered scripts and its application to the Indus Valley Script. Humanit. Soc. Sci. Commun. 2021, 8, 50. [Google Scholar] [CrossRef]
  40. Revesz, P.Z. A translation of the Arkalochori Axe and the Malia Altar Stone. WSEAS Trans. Inf. Sci. Appl. 2017, 14, 124–133. [Google Scholar]
  41. Revesz, P.Z. Establishing the West-Ugric language family with Minoan, Hattic and Hungarian by a decipherment of Linear, A. WSEAS Trans. Inf. Sci. Appl. 2017, 14, 306–335. [Google Scholar]
  42. Revesz, P.Z. Decipherment challenges due to tamga and letter mix-ups in an Old Hungarian runic inscription from the Altai Mountains. Information 2022, 13, 422. [Google Scholar] [CrossRef]
  43. Revesz, P.Z. Experimental evidence for a left-to-right reading direction of the Phaistos Disk. Mediterr. Archaeol. Archaeom. 2022, 22, 79–96. [Google Scholar]
  44. Hosszú, G. Scriptinformatics: Extended Phenetic Approach to Script Evolution; Nap Kiadó: Budapest, Hungary, 2021. [Google Scholar]
  45. Tóth, L.; Hosszú, G.; Kovács, F. Deciphering Historical Inscriptions Using Machine Learning Methods. In Proceedings of the 10th International Conference on Logistics, Informatics and Service Sciences, Beijing, China, 23 February 2020; Liu, S., Bohács, G., Shi, X., Shang, X., Huang, A., Eds.; Springer: Singapore, 2020; pp. 419–435. [Google Scholar] [CrossRef]
Figure 1. The approximate locations of the eight ancient scripts. The legend is as follows: B—Brahmi, C—Cretan hieroglyphs, E—Elamite, G—Greek, I—Indus Valley, L -Linear B, P—Phoenician, and S—Sumerian. Red indicates the three earliest scripts, orange the middle two scripts, and blue the three most recent of the eight ancient scripts. Source of background map: https://upload.wikimedia.org/wikipedia/commons/f/f3/Map_of_Eurasia.png (accessed on 2 February 2023).
Information 14 00227 g001
Figure 2. The 34 Brahmi signs used in this study.
Information 14 00227 g002
Figure 3. The 22 Cretan hieroglyphs used in this study.
Information 14 00227 g003
Figure 4. The 27 ancient Greek alphabet letters.
Information 14 00227 g004
Figure 5. The 23 Indus Valley script signs used in this study.
Information 14 00227 g005
Figure 6. The 20 Linear B signs used in this study.
Information 14 00227 g006
Figure 7. The 22 Phoenician alphabet letters used in this study.
Information 14 00227 g007
Figure 8. The 17 proto-Elamite signs used in this study.
Information 14 00227 g008
Figure 9. The 34 Sumerian Pictograms used in this study.
Information 14 00227 g009
Figure 10. A timeline of the eight ancient scripts analyzed in this study.
Information 14 00227 g010
Figure 11. The classifier architecture.
Information 14 00227 g011
Figure 12. The scheme of comparing any ‘unknown script’ (which can be any of the other scripts with N signs) with the letters of the Phoenician alphabet.
Information 14 00227 g012
Figure 13. The heatmap generated when Greek letters were passed into the Phoenician letter classifier.
Information 14 00227 g013
Figure 14. The heatmap generated when Phoenician letters were passed into the Greek letter classifier.
Information 14 00227 g014
Figure 15. The heatmap generated when Sumerian pictograms were passed into the trained Indus Valley script classifier.
Information 14 00227 g015
Figure 16. Classification dendrogram generated using the WPGMA algorithm.
Information 14 00227 g016
Figure 17. Hierarchical dendrogram generated by considering ancestor–descendant relationships.
Information 14 00227 g017
Figure 18. A modified classification that does not insist on a single source for all eight scripts.
Information 14 00227 g018
Table 1. Validation accuracy for the eight scripts after 25, 50, 75, and 100 epochs of training.
Script255075100
Brahmi Script95.0998.1598.2499.35
Cretan Hieroglyphs91.0992.8494.4797.53
Greek Alphabet93.4996.2697.2398.63
Indus Valley Script93.5095.7096.8598.23
Linear B Script91.1993.1596.4299.48
Phoenician Alphabet93.1894.7795.3697.52
Proto-Elamite Script91.9394.5597.0599.09
Sumerian Pictograms90.7993.2196.9497.40
Table 2. Adaptation of the Phoenician alphabet to the Greek alphabet, including four extra letters.
Phoenician LetterPhoenician NameGreek LetterGreek Name
Information 14 00227 i001alephInformation 14 00227 i002alpha
Information 14 00227 i003bethInformation 14 00227 i004beta
Information 14 00227 i005gimlInformation 14 00227 i006gamma
Information 14 00227 i007dalethInformation 14 00227 i008delta
Information 14 00227 i009heInformation 14 00227 i010epsilon
Information 14 00227 i011wawInformation 14 00227 i012 or Information 14 00227 i013digamma or upsilon
Information 14 00227 i014zayinInformation 14 00227 i015zeta
Information 14 00227 i016hethInformation 14 00227 i017eta
Information 14 00227 i018tethInformation 14 00227 i019theta
Information 14 00227 i020yodhInformation 14 00227 i021iota
Information 14 00227 i022kaphInformation 14 00227 i023kappa
Information 14 00227 i024lamedhInformation 14 00227 i025lambda
Information 14 00227 i026memInformation 14 00227 i027mu
Information 14 00227 i028nunInformation 14 00227 i029nu
Information 14 00227 i030samekhInformation 14 00227 i031xi
Information 14 00227 i032ayinInformation 14 00227 i033omicron
Information 14 00227 i034peInformation 14 00227 i035pi
Information 14 00227 i036sadeInformation 14 00227 i037san
Information 14 00227 i038qophInformation 14 00227 i039koppa
Information 14 00227 i040resInformation 14 00227 i041rho
Information 14 00227 i042sinInformation 14 00227 i043sigma
Information 14 00227 i044tawInformation 14 00227 i045tau
Information 14 00227 i046phi
Information 14 00227 i047chi
Information 14 00227 i048psi
Information 14 00227 i049omega
Table 3. The number of signs with over 75 percent correlation between pairs of various scripts.
BrahmiCretan
Hieroglyphs
GreekIndus ValleyLinear BPhoenicianProto-Elam.Sumerian Pictograms
Brahmi342983926
Cretan Hieroglyphs2224520626
Greek 9426972227
Indus Valley8592349420
Linear B3207420905
Phoenician9622992237
Proto-Elamite222403173
Sumerian Pictograms6672057339
Table 4. Grouping of six languages highlighting maximal non-diagonal values in each column and row. Semitic languages are highlighted in green, Indo-European languages in blue, and Uralic languages in yellow.
ArabicHebrewEnglish GermanFinnishHungarian
Arabic 82111
Hebrew8 2411
English22 921
German149 23
Finish1122 4
Hungarian11134
Table 5. Highlighting of the maximal non-diagonal values in each column and row of Table 3. The Phoenician alphabet and its descendants are highlighted in blue, the Cretan-origin scripts are highlighted in orange, and the Mesopotamian-origin scripts are highlighted in red.
BrahmiGreekPhoenicianCretan
Hieroglyphs
Linear BIndus
Valley
Proto-Elam.Sumerian Pictograms
Brahmi 9923826
Greek9 2247927
Phoenician922 69937
Cretan Hieroglyphs246 20526
Linear B37920 405
Indus Valley89954 420
Proto-Elamite223204 3
Sumerian Pictograms67765203
Disclaimer/Publisher’s Note: The statements, opinions and data contained in all publications are solely those of the individual author(s) and contributor(s) and not of MDPI and/or the editor(s). MDPI and/or the editor(s) disclaim responsibility for any injury to people or property resulting from any ideas, methods, instructions or products referred to in the content.

