Article

Automatic Identification and Geo-Validation of Event-Related Images for Emergency Management

1
Department of Mathematics, Computer Science and Physics, University of Udine, Via delle Scienze 206, 33100 Udine, Italy
2
Polytechnic of Turin, Corso Duca Degli Abruzzi 24, 10129 Torino, Italy
*
Author to whom correspondence should be addressed.
Information 2023, 14(2), 78; https://doi.org/10.3390/info14020078
Submission received: 7 January 2023 / Revised: 24 January 2023 / Accepted: 26 January 2023 / Published: 28 January 2023
(This article belongs to the Special Issue Computer Vision, Pattern Recognition and Machine Learning in Italy)

Abstract

:
In recent years, social platforms have become integrated in a variety of economic, political and cultural domains. Social media have become the primary outlets for many citizens to consume news and information, and, at the same time, to produce and share online a large amount of data and meta-data. This paper presents an innovative system able to analyze visual information shared by citizens on social media during extreme events for contributing to the situational awareness and supporting people in charge of coordinating the emergency management. The system analyzes all posts containing images shared by users by taking into account: (a) the event class and (b) the GPS coordinates of the geographical area affected by the event. Then, a Single Shot Multibox Detector (SSD) network is applied to select only the posted images correctly related to the event class and an advanced image processing procedure is used to verify if these images are correlated with the geographical area where the emergency event is ongoing. Several experiments have been carried out to evaluate the performance of the proposed system in the context of different emergency situations caused by earthquakes, floods and terrorist attacks.

1. Introduction

Within a relatively short time span, social platforms have intruded into all parts of life with potentially profound consequences. They have become integrated in a variety of economic, political and cultural domains and have reconfigured the entire media system, transforming older forms of communication and changing the information landscape. Social media, in fact, have become the primary outlets for many citizens to consume news and information, and, at the same time, to produce and share online content (the so-called User Generated Content (UGC) and User Distributed Content (UDC)), both in ordinary and extraordinary times [1]. In this paper, the exploitation of social media content produced during extreme events, such as natural or manmade disasters, is investigated.
Several studies have demonstrated that social media use rises during extraordinary situations as people seek immediate and up-to-date news [2], especially when official sources provide information too slowly or are unavailable. In addition, as the recent catastrophic events, from the devastating California fires to the Ecuador earthquake, or the terrorist attacks [3] in Nice (2016), Brussels (2016), Paris (2015–2018), Strasbourg (2018) or Vienna (2020) have clearly confirmed, social platforms—most notably Twitter and Facebook—represent the primary place citizens turn to interact with others and spread first-hand information more quickly than traditional news sources.
During extraordinary situations, social media enable citizens to play at least three roles: (i) first responders/volunteers; (ii) citizen journalists/reporters; and (iii) social activists [4]. These practices provide an up-to-date picture of what is happening on the ground in a specific area, and could represent a useful resource for emergency operators to organize the rescue operations in a more accurate way. As explained in [5], in fact, oftentimes, individuals experiencing the event first-hand are on the scene of the disaster and can provide updates more quickly than traditional news sources and disaster response organizations. In this sense, some scholars have used the definition of “citizens as sensors”, as non-specialist creators of geo-referenced information that contribute to crisis situation awareness [6]. Despite a lot of evident potentials of analyzing in real-time visual information coming directly from the area where the event is in progress, there are also a lot of challenges using this source of data because in some cases the posts of citizens report untrue data such as images that refer to previous events [7], images not related to the event described in the post [8,9], etc.
Given the increasing availability of data and meta-data produced and distributed online by people affected by disasters, our study aims to develop an innovative system that enables the use of grassroots information as a source for emergency management. In particular, it collects and analyses visual data produced and shared on Twitter, a popular social micro-blogging platform widely spread internationally, for contributing to the general understanding of what has happened and supporting officials to coordinate and execute a response.
This paper presents a smart system, called Automatic Social Media Interpretation System (ASMIS), for the automatic analysis of visual content shared by users on Twitter during an emergency event (Figure 1). With the support of advanced image processing techniques and deep learning algorithms, the system is able to automatically select posts containing visual data which are related to a given type of emergency event (e.g., a flood, an earthquake, a terrorist attack, etc.). The final goal of the system is to provide to the emergency operators selected images that, after an automatic geo-validation performed by a matching procedure with street view data, can be used to have a quick overview of the event thus better organize the rescue operations.
The ASMIS system presents several novelties compared to the current state-of-the-art in the field of emergency management systems based on computer vision [10] and social data [11,12,13,14,15]:
It exploits not only the keywords used within the tweets, but also the images shared by users during and immediately after the extreme event, selecting only the most appropriate ones and discarding those deemed uninformative and useless;
Contrary to other emergency management systems which are focused only on data coming from devices controlled by public authority (e.g., police, military, etc.), it uses social media as an intelligent “geosensor” network to monitor extreme events and to create a sort of crowd-sourced mapping which is pivotal to support the coordination efforts of the humanitarian relief services (i.e., Civil Protection, Red Cross and so on);
It has been designed by an original pipeline and represents a system that uses data produced by citizens: (a) to help the authorities to allow a more accurate situational awareness, (b) to take informed and better decisions during emergencies and (c) to respond quickly and efficiently.
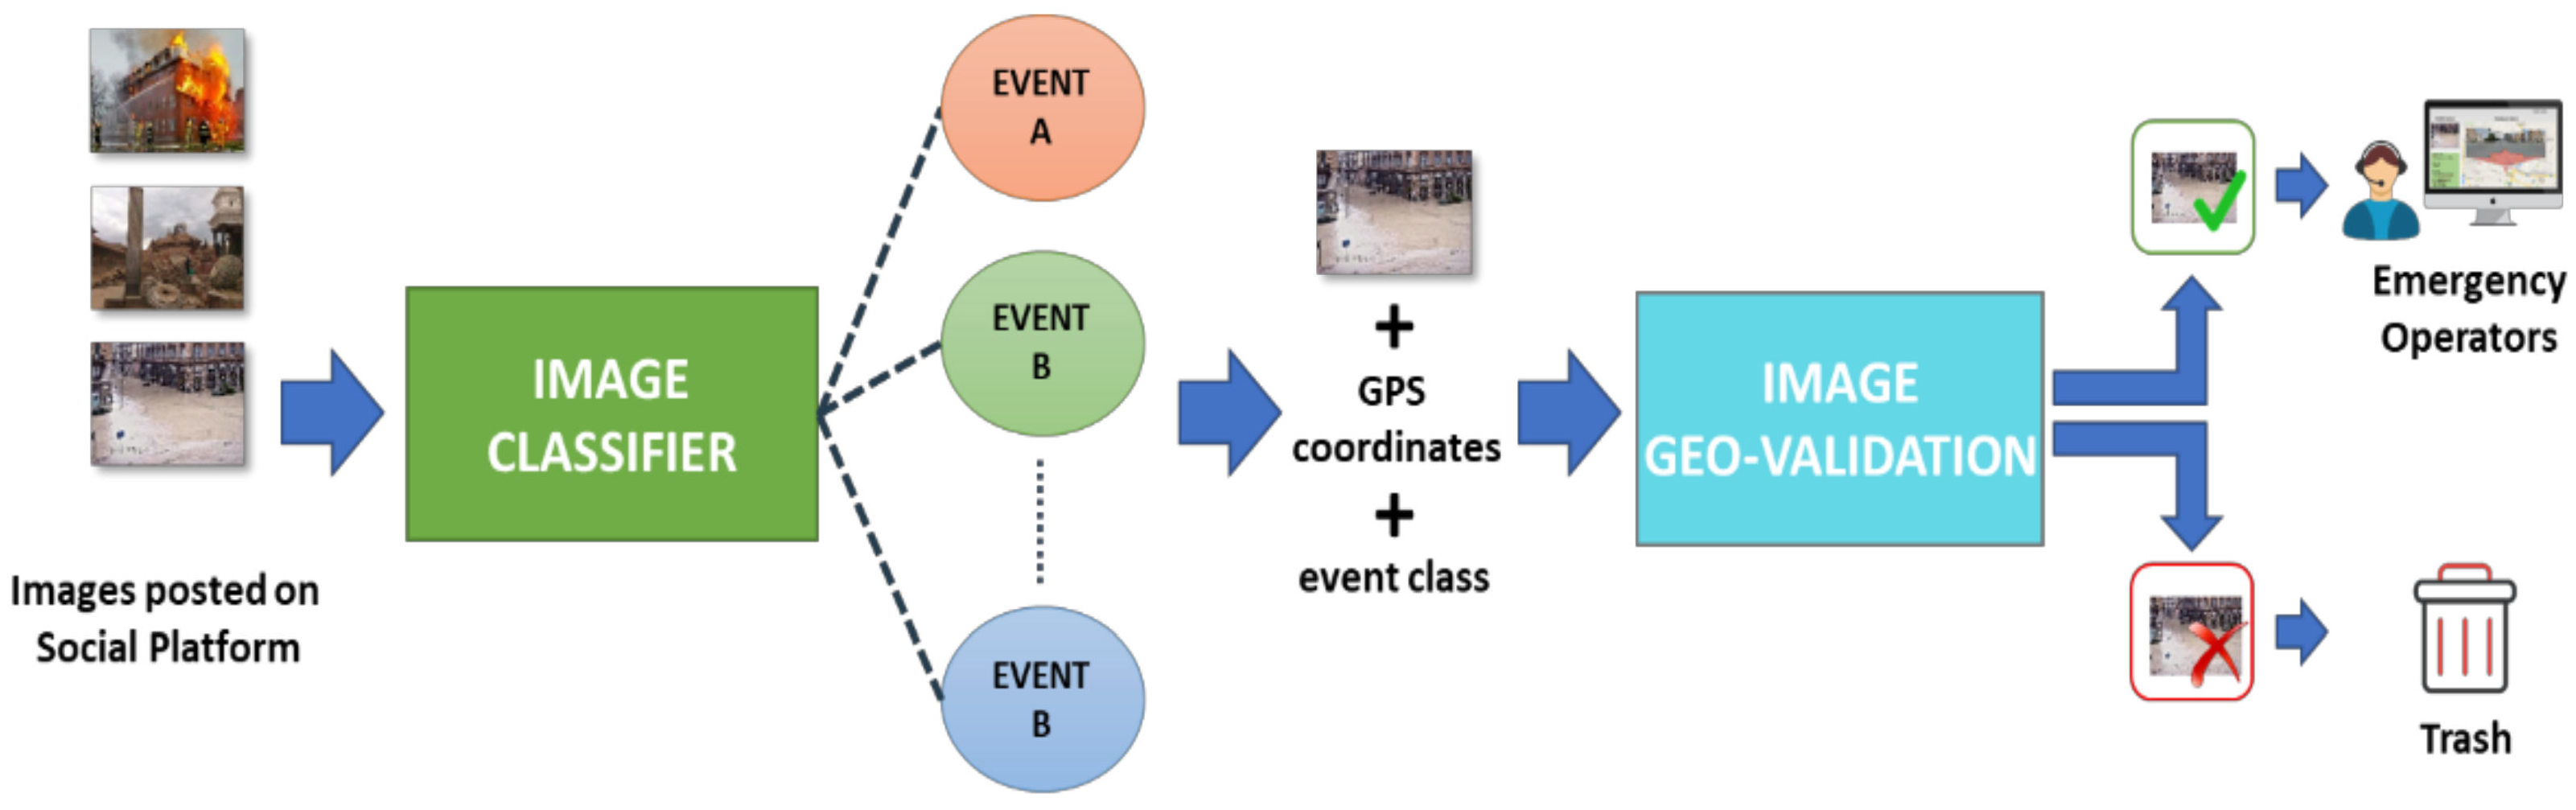
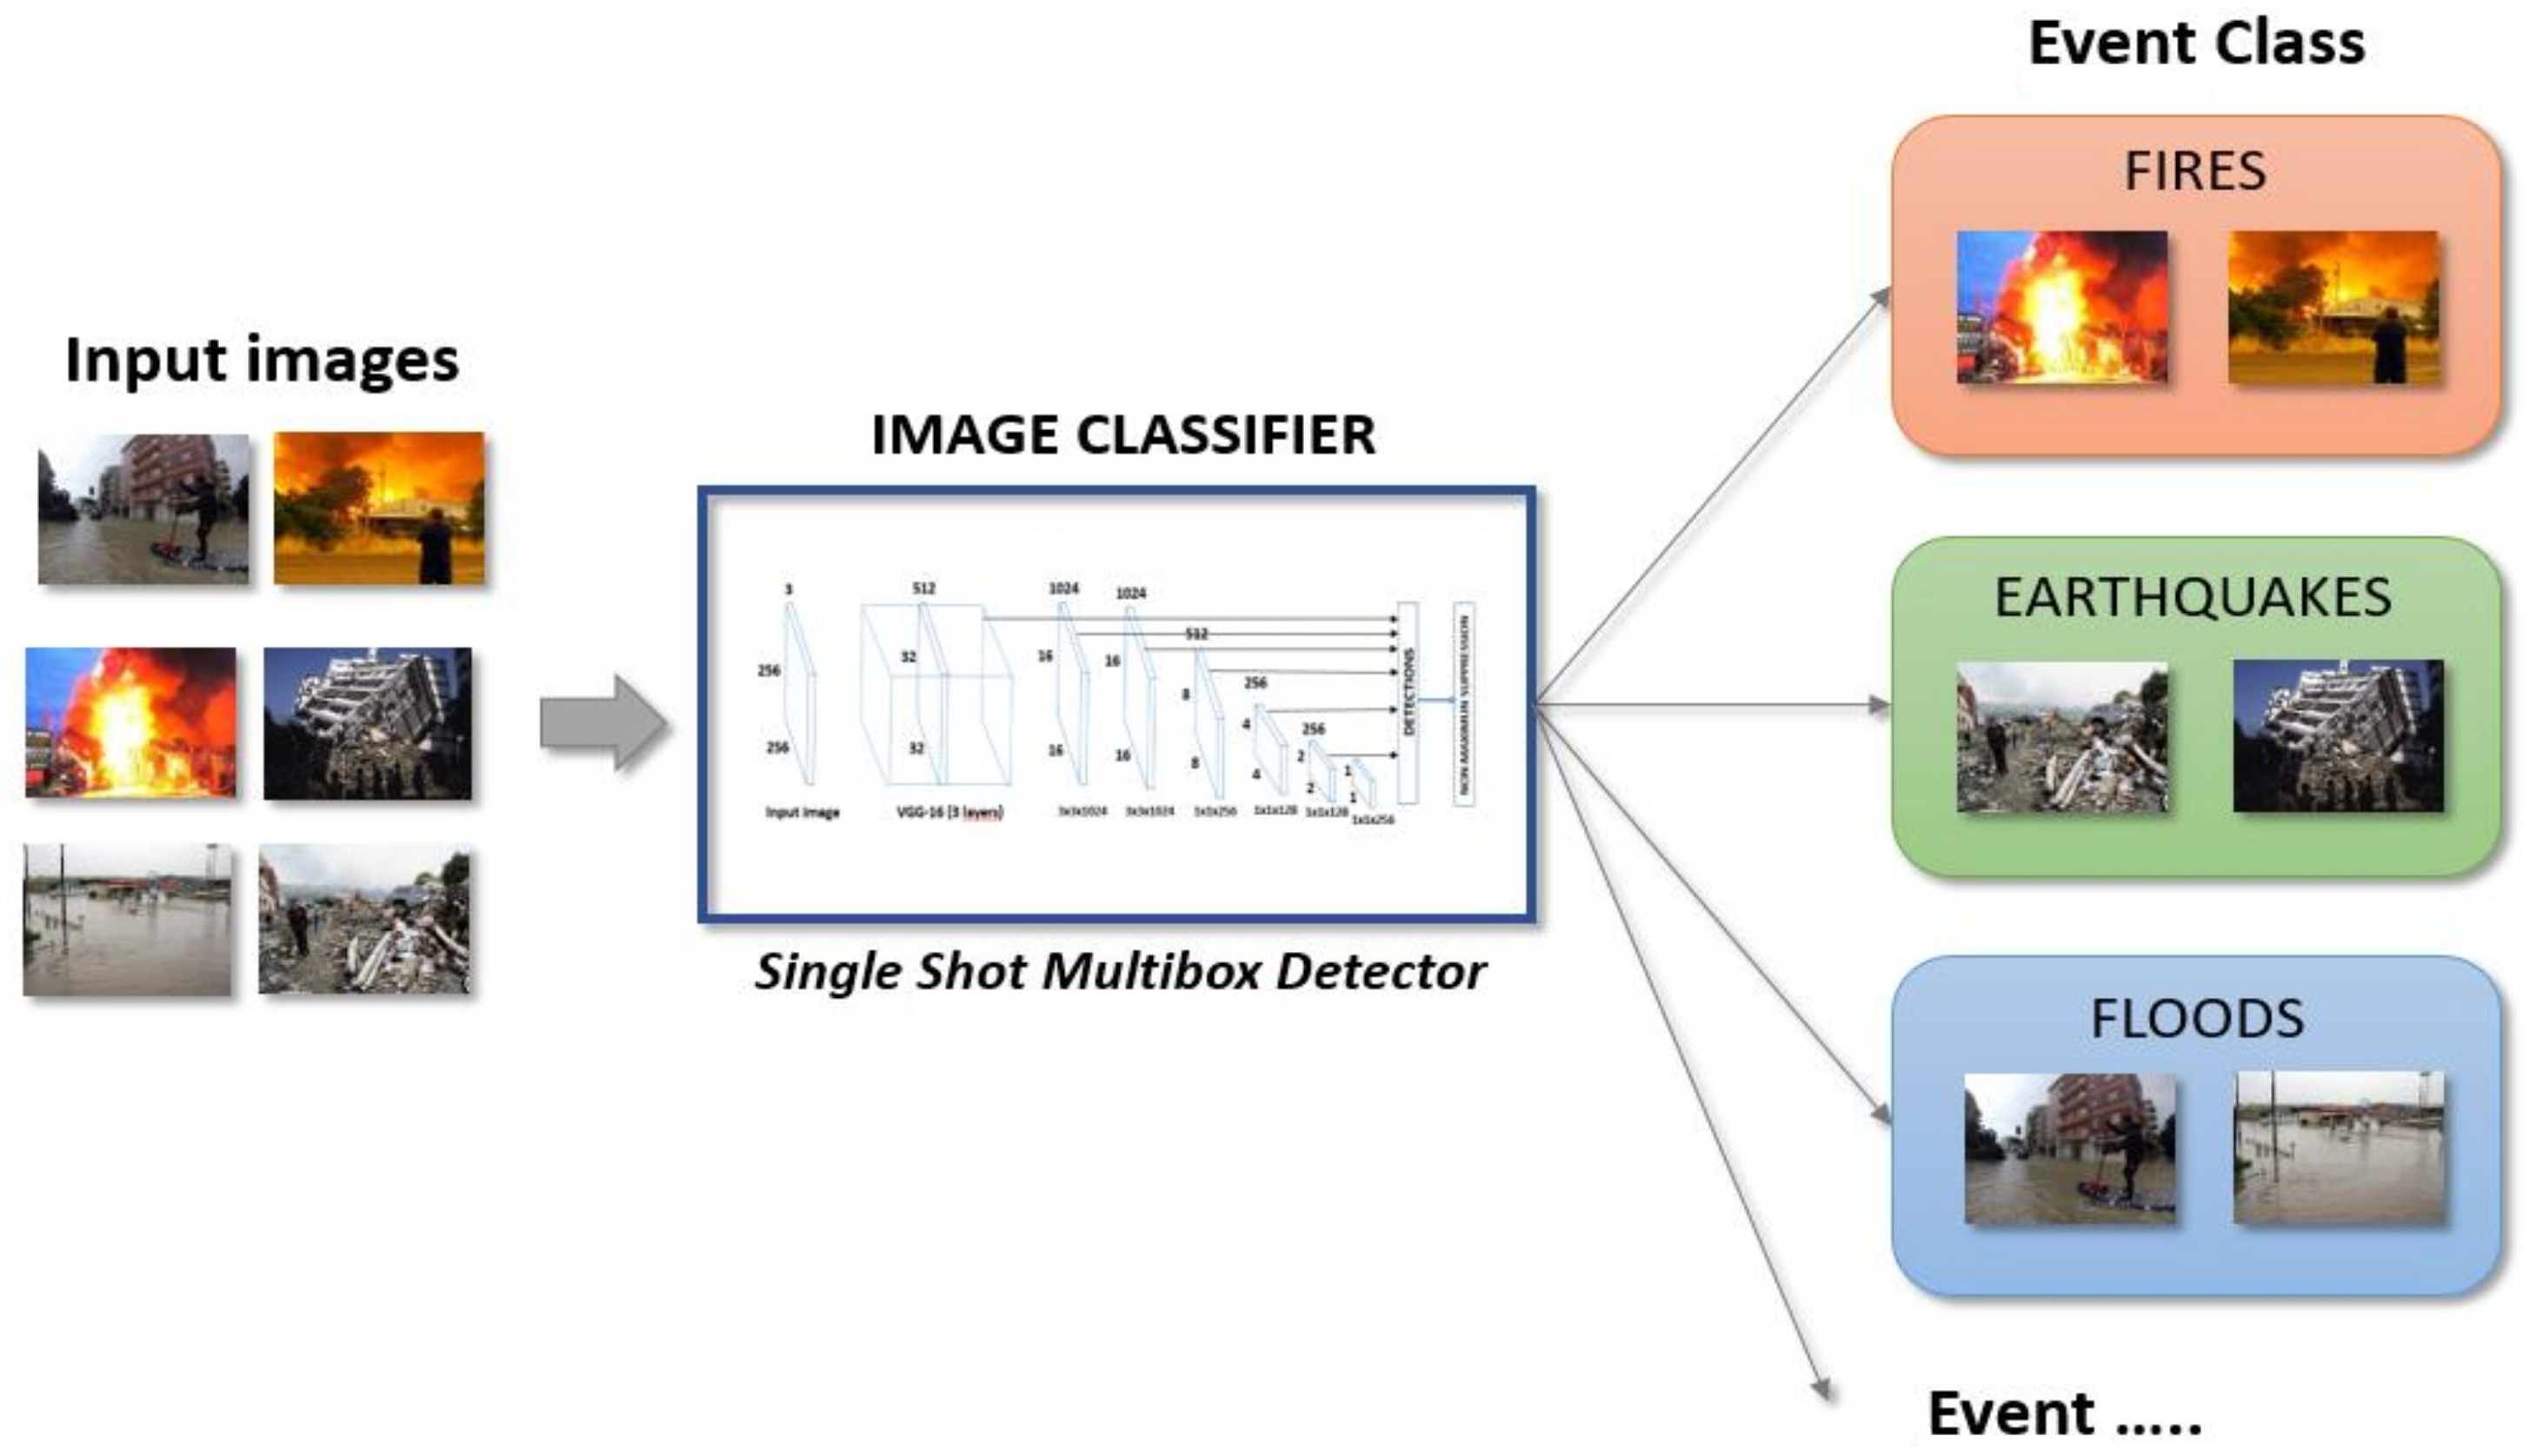
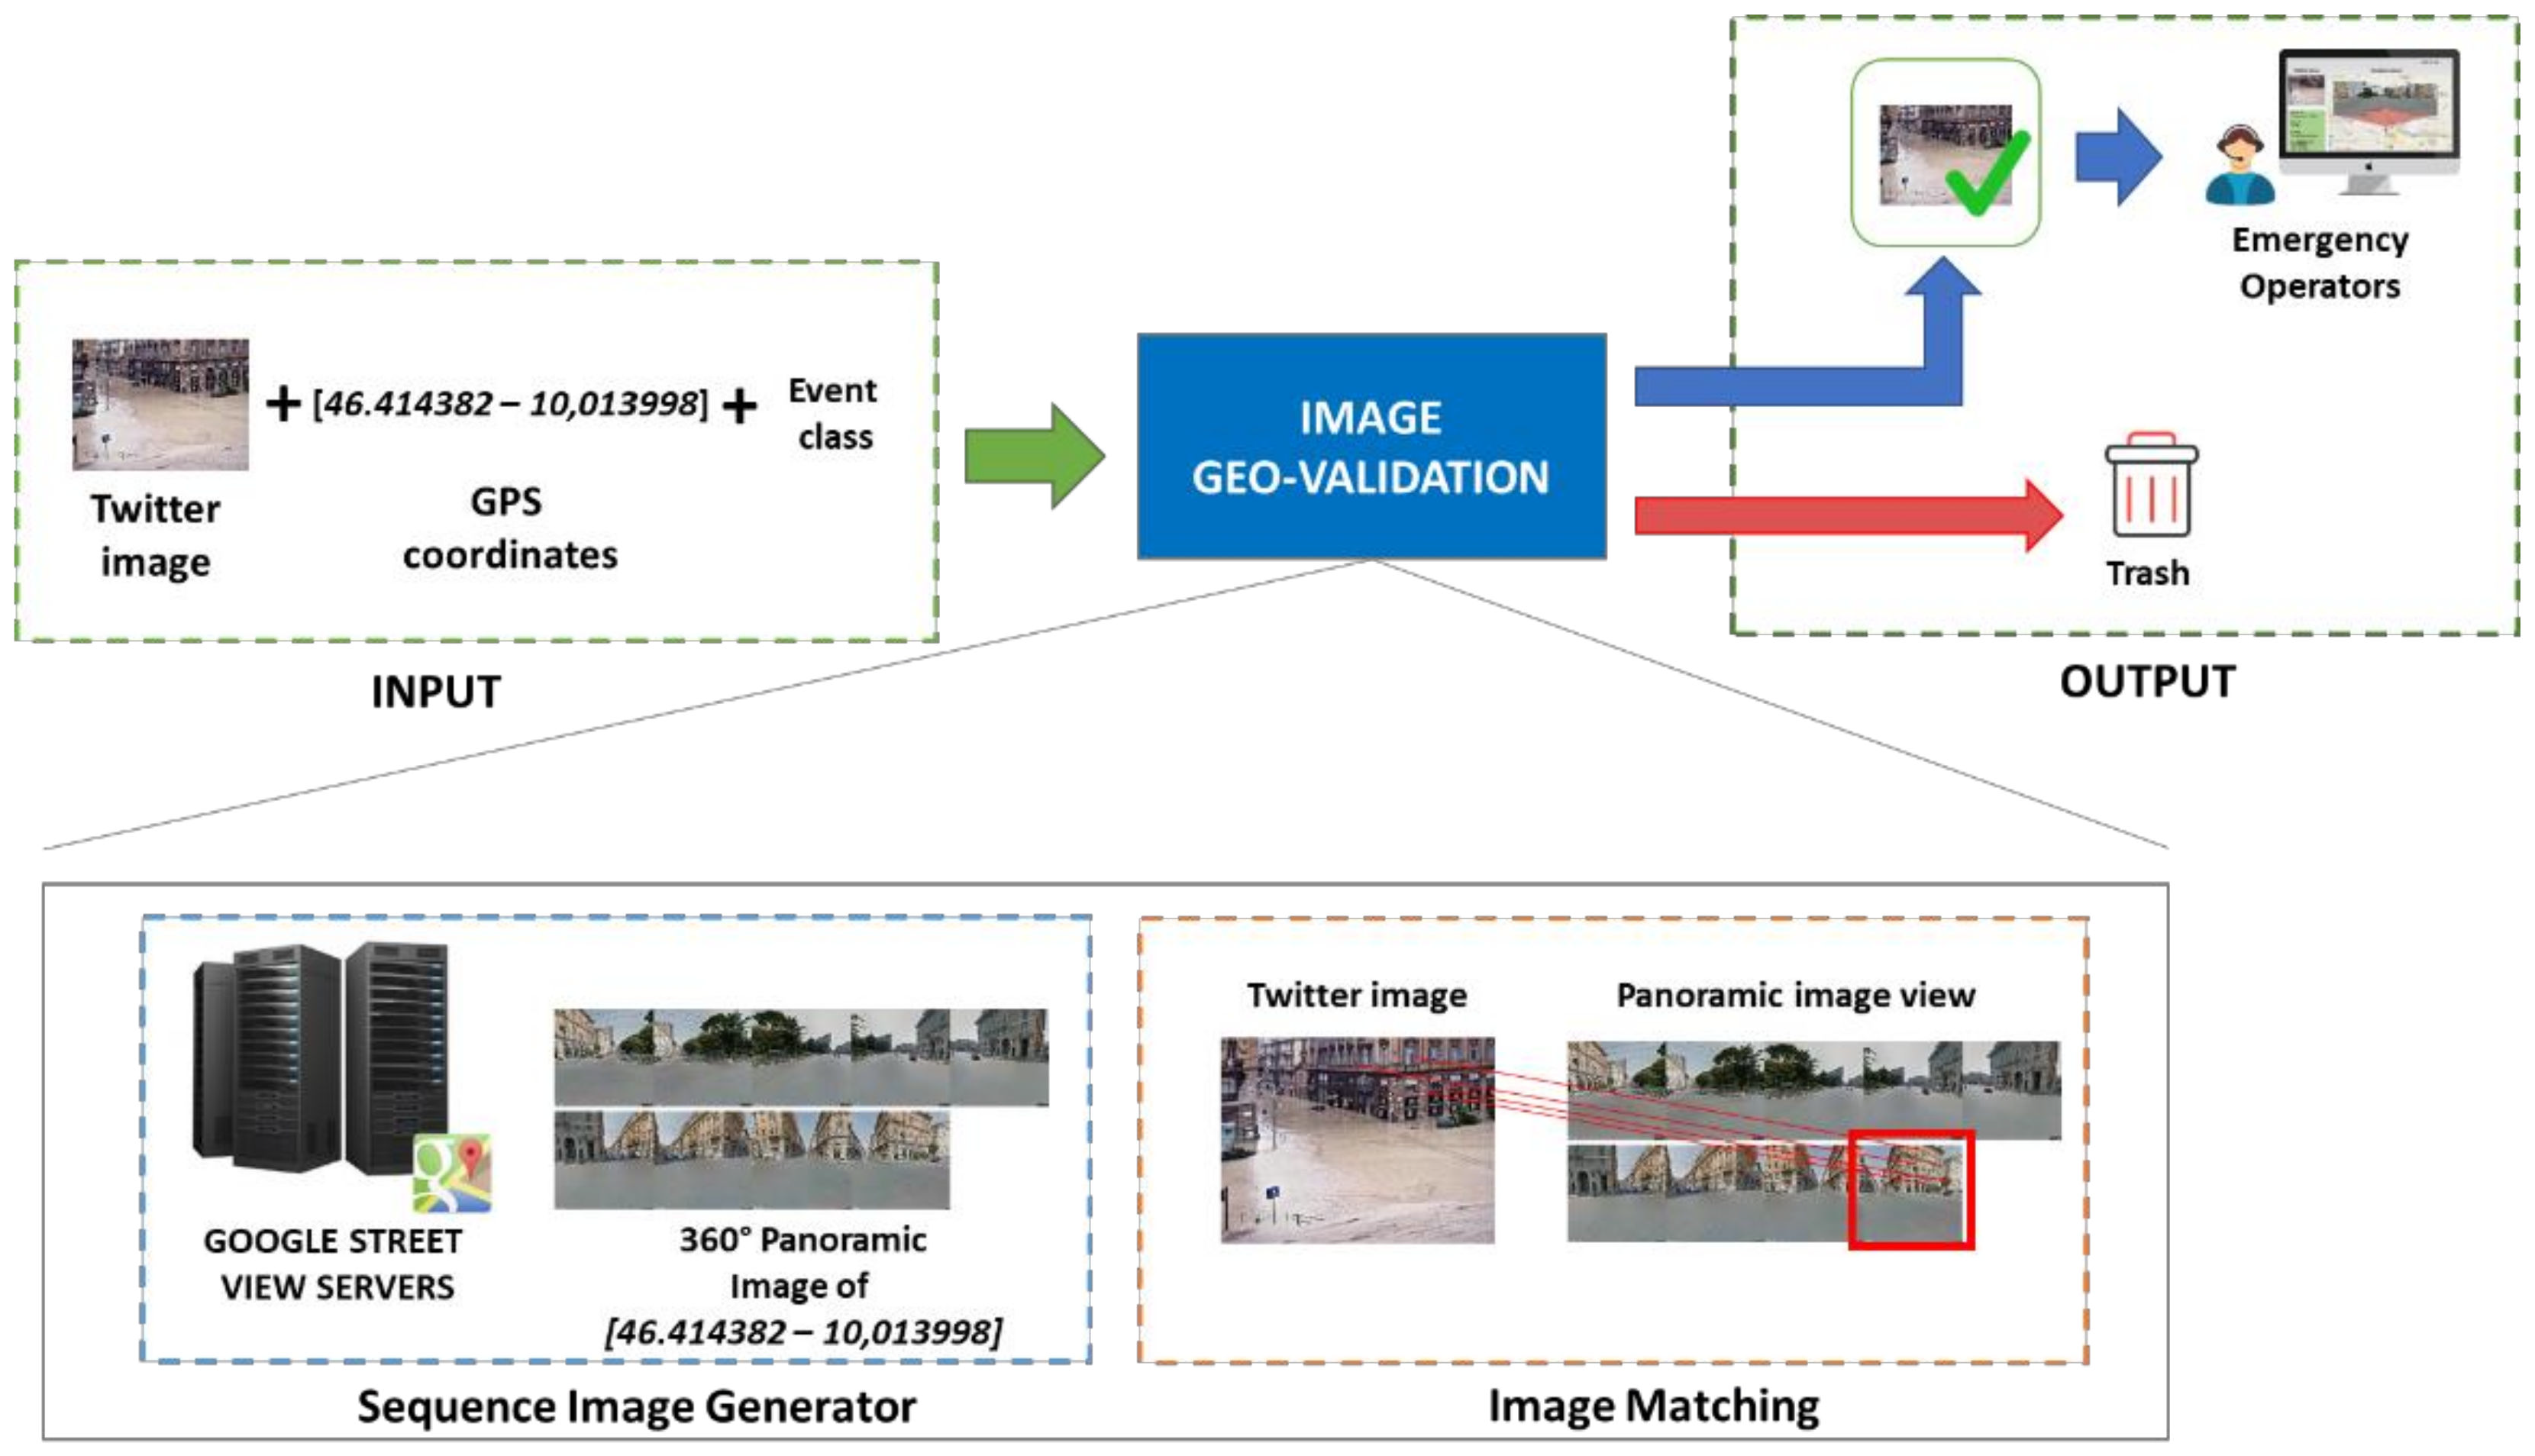
The system automatically detects the event class of the posted image and matches its GPS coordinates with those of the geographical area where the event occurs;
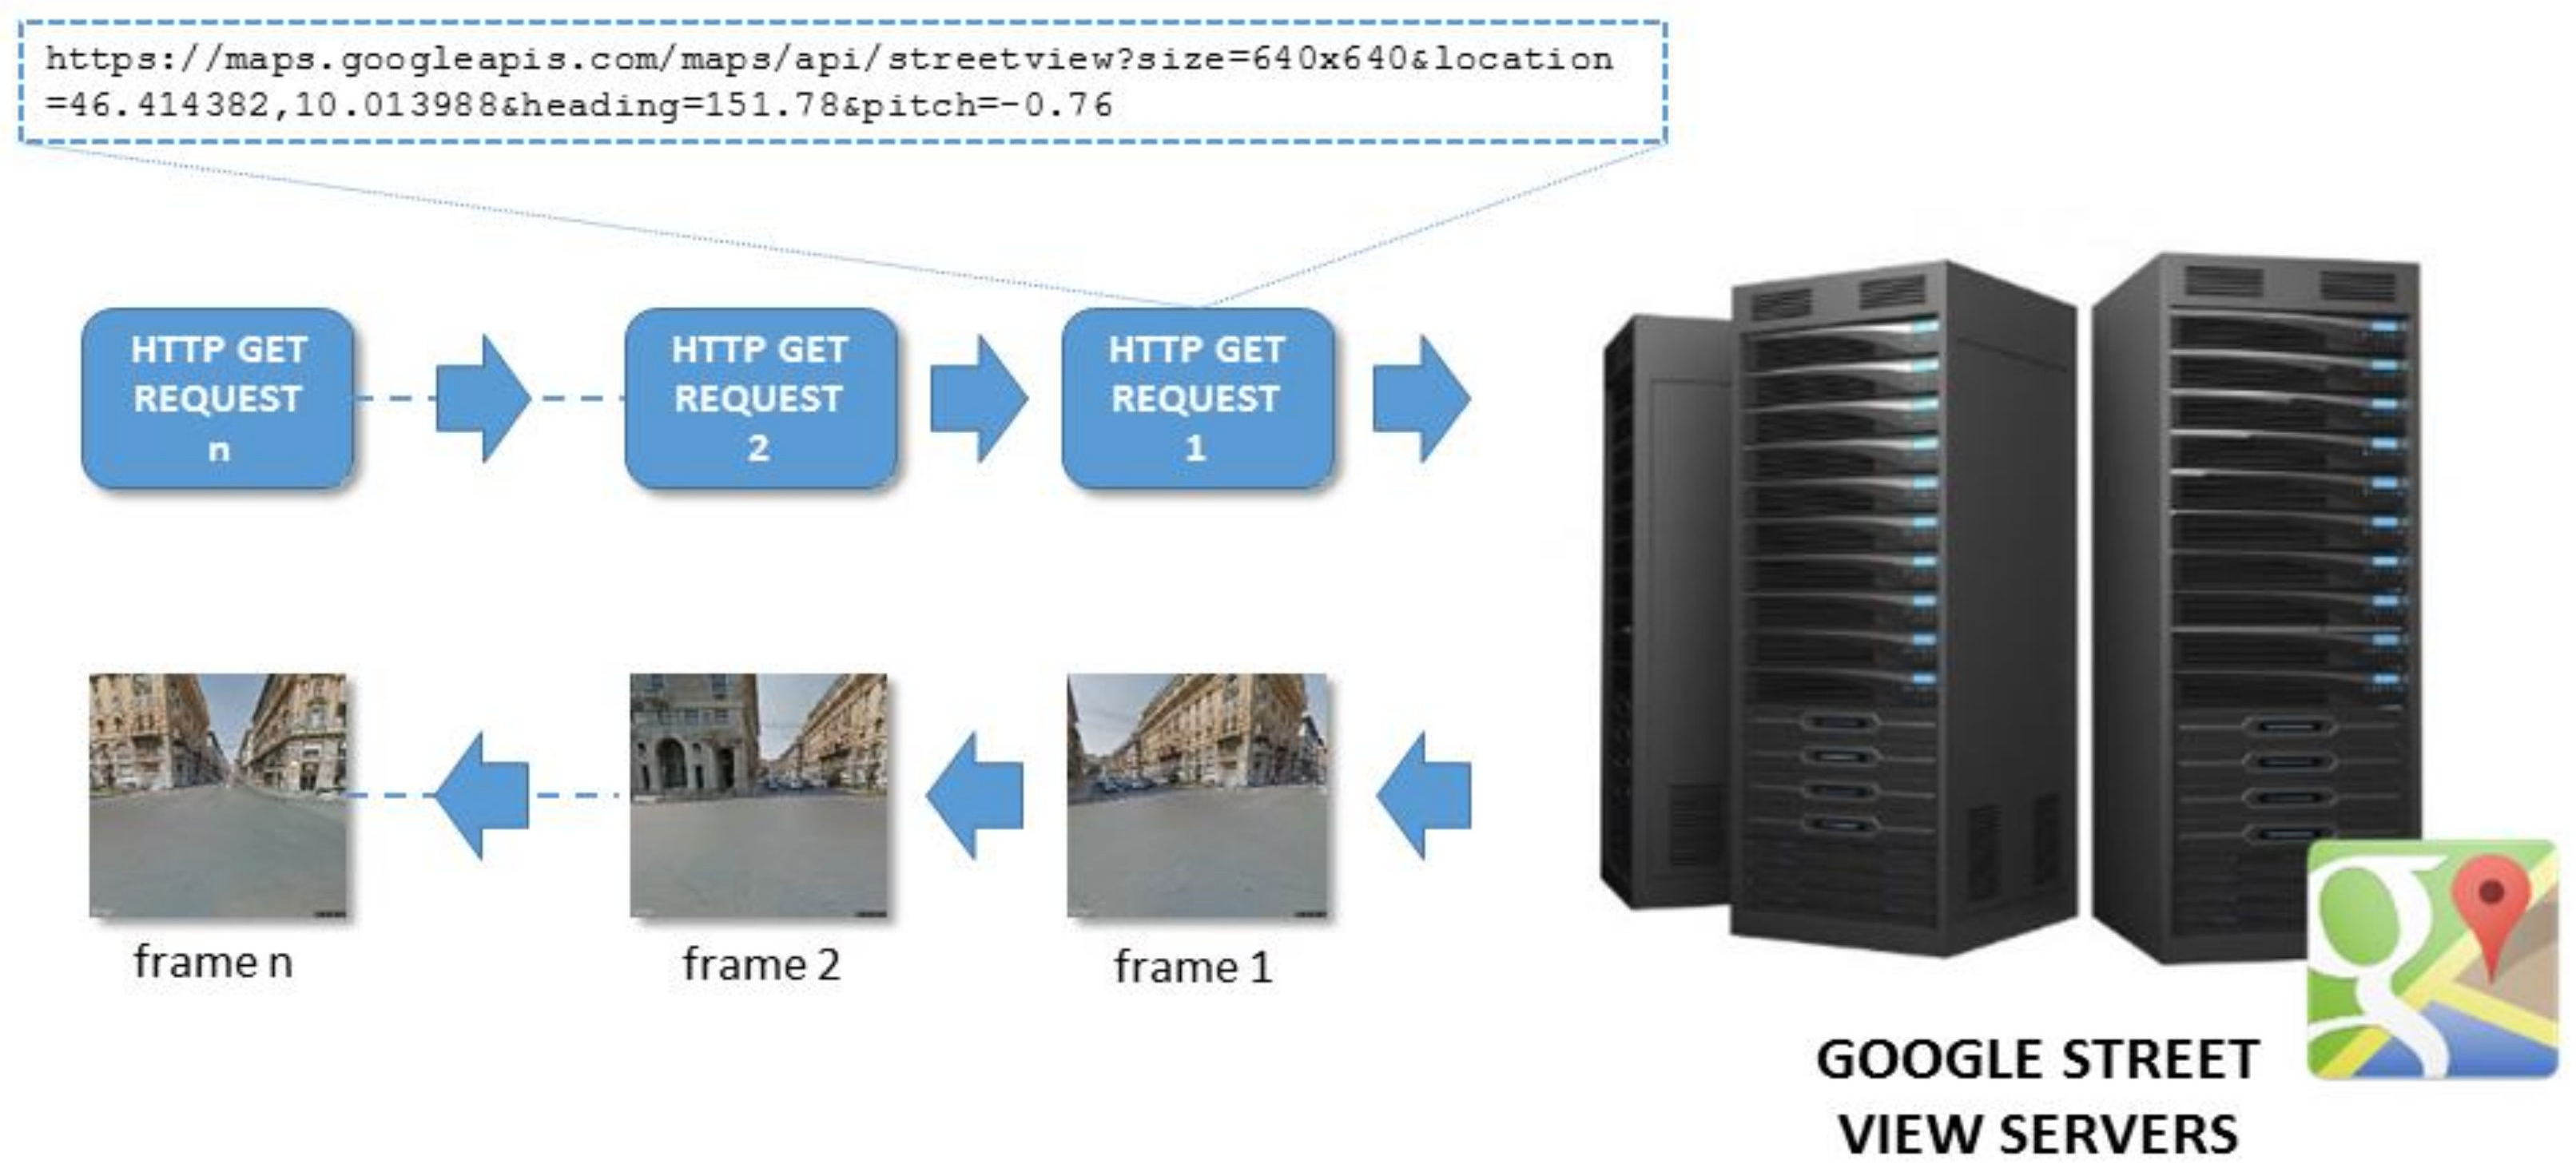
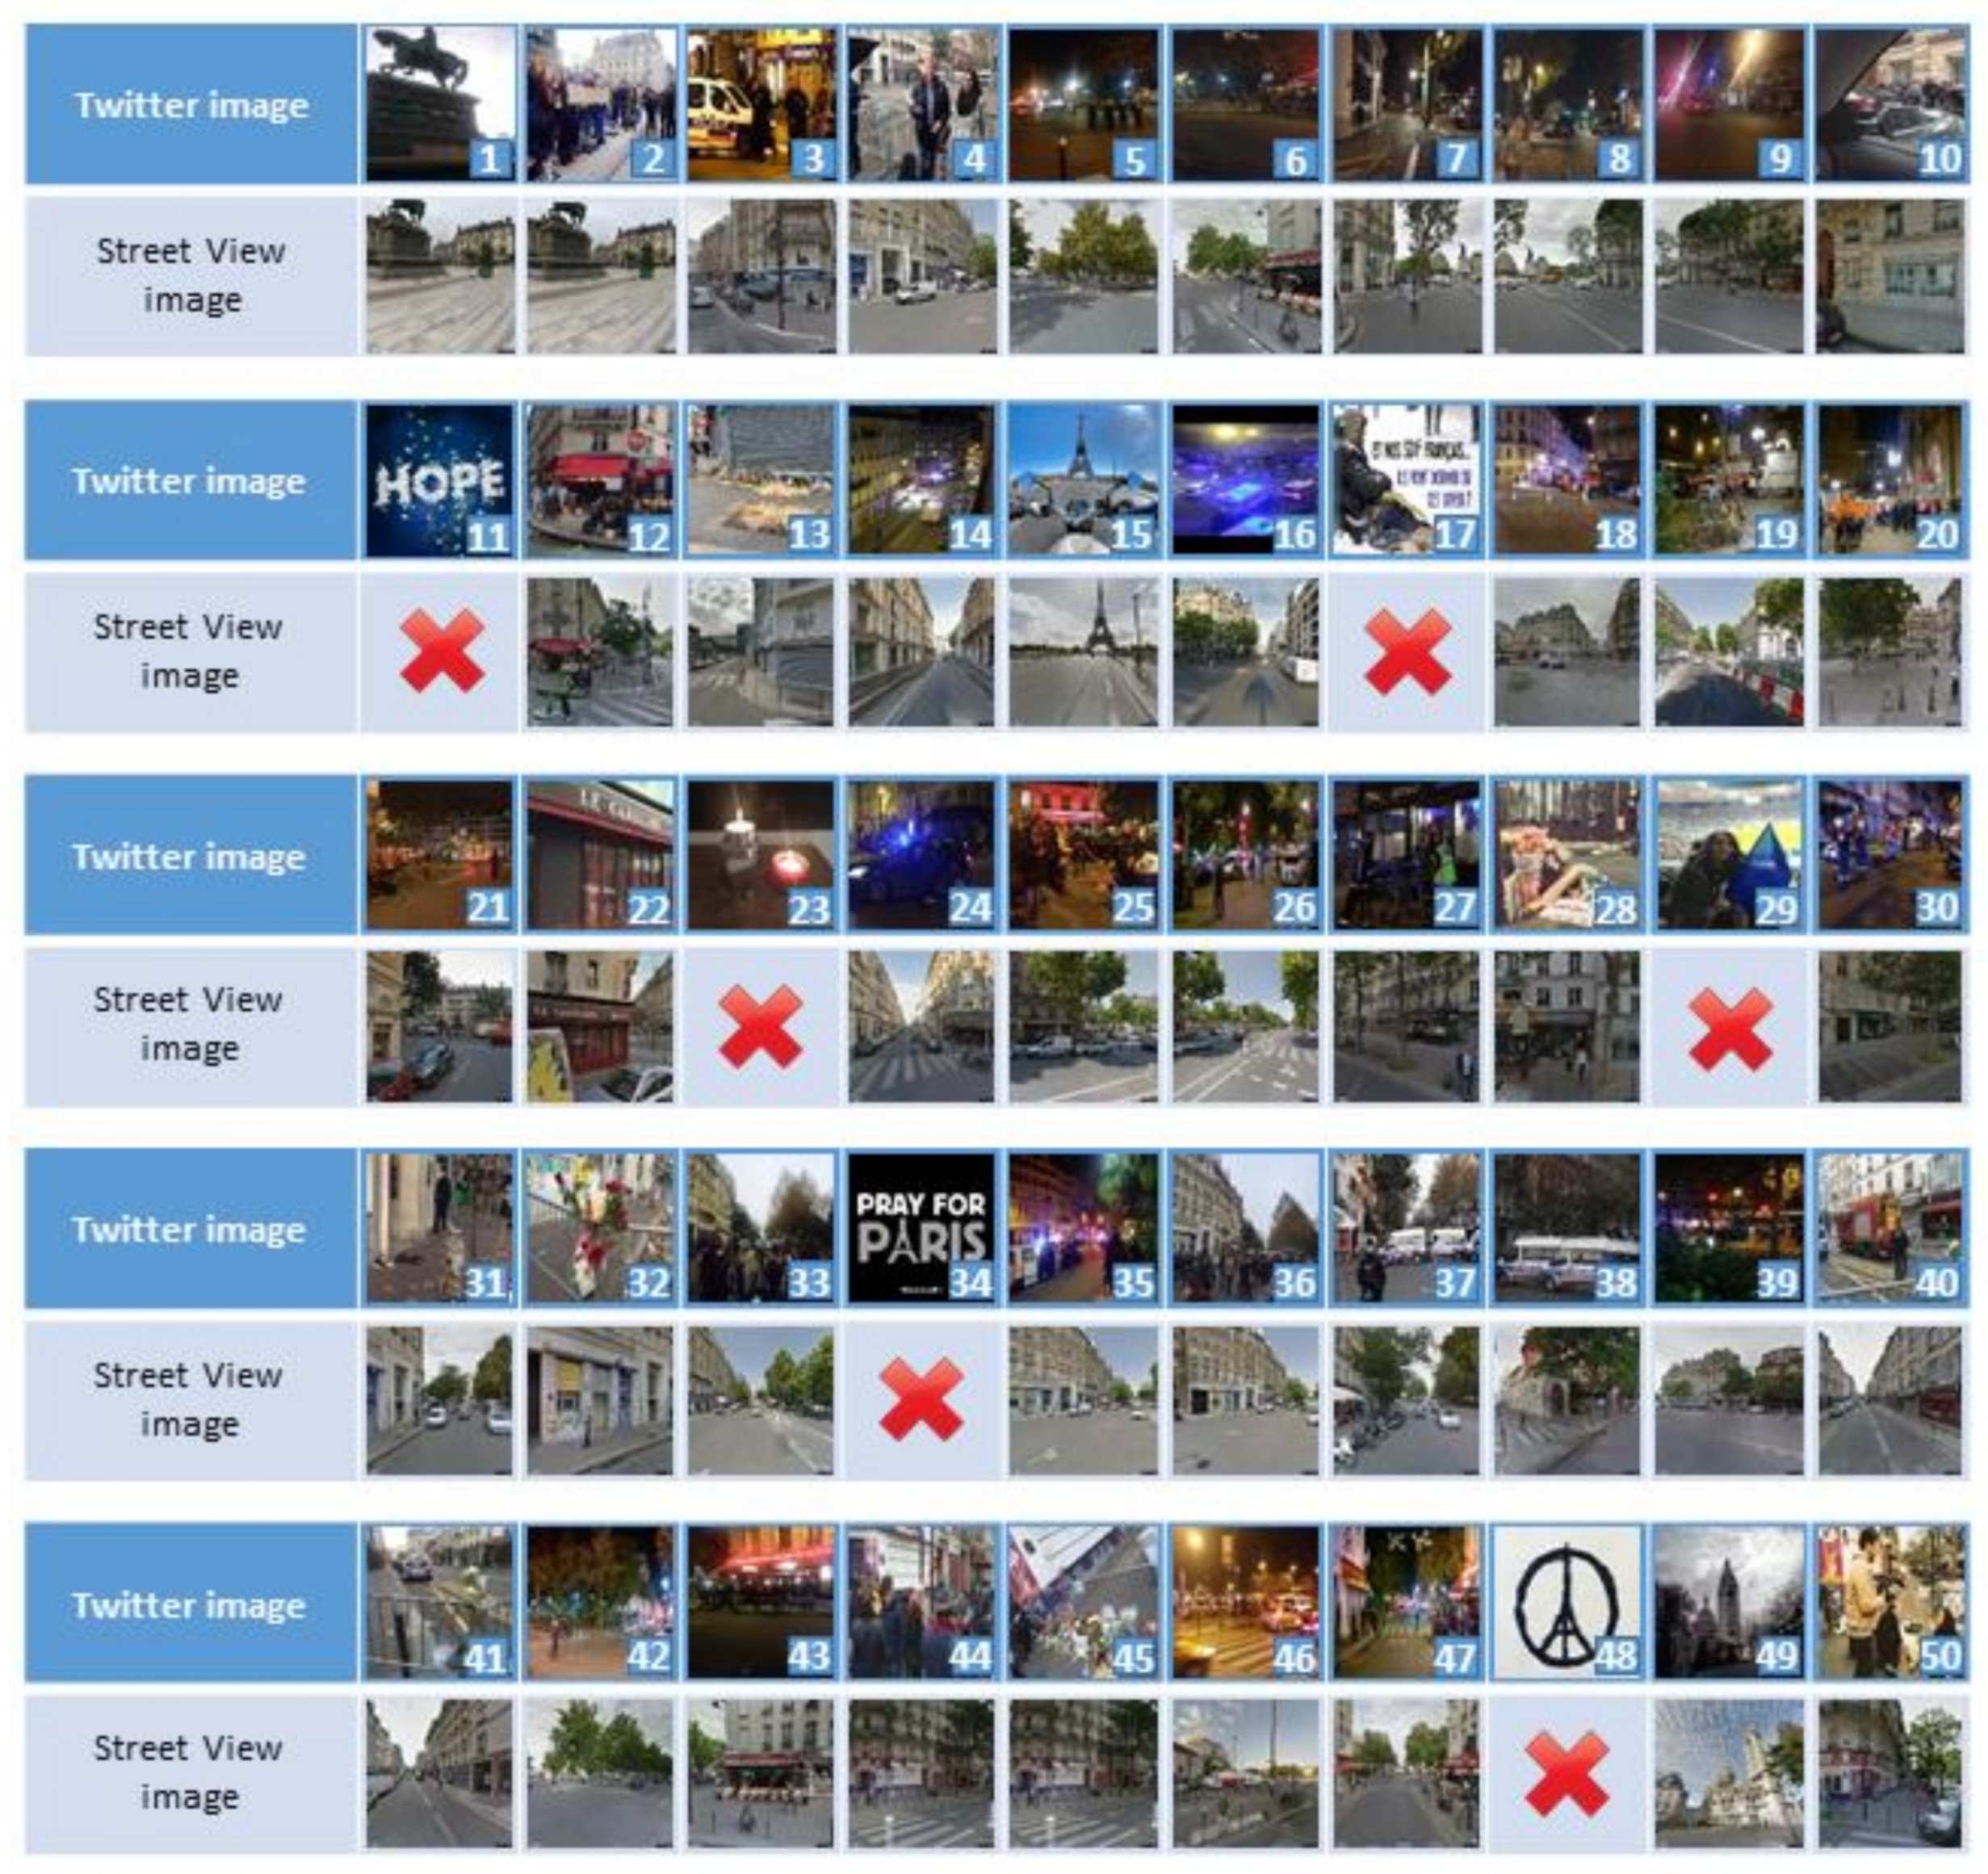
Since not all posts contain useful images, the system is able to match the input image with available images acquired from Google Street View Map or local datasets of the interesting geographical area to select only images correlated with the ongoing event.
The rest of the paper is structured as follows. In Section 2, we will provide a state-of-the-art overview of the existing emergency management systems based on social data. In Section 3, we will illustrate the main components of our system and, in Section 4, the experimental results will be presented.

2. Related Works

Social media and video/photo-sharing applications are playing an increasingly important role during and in the aftermath of an extraordinary situation. Numerous case studies show how citizens and public institutions are using them to spread and gather specific information and to support recovery actions. So far, several systems have been developed to satisfy emergency management needs by extracting and analyzing the content shared by users on social media platforms. The development of the so-called “Social Emergency Management Systems” [16] has represented a real paradigm shift in the literature on this topic because usually, in the case of disasters, citizens have always been considered as people to be rescued rather than active participants. Social platforms instead promote a two-way (or, to be more precise, multi-directional) communication environment, supporting interaction between citizens and emergency coordinators, and provide additional perspective on a certain situation. Moreover, especially when official sources make available relevant information too slowly, people turned to social media in order to obtain time-sensitive and unique information [17]. They have changed the information dissemination pathways in crisis and enabled the ways in which emergencies are tracked to be transformed.
In general terms, the literature reveals how eyewitness content provides an up-to-date line of communication and offers unique and relevant crisis information such as locating involved friends, sharing personal safety status, indicating collapsed buildings and requesting intervention from professionals. Although scholars are now engaging in a growing volume of research in this field, it should be pointed out that the vast majority of existing studies and research related to the exploitation of social content for situational awareness and emergency management purposes is focused on Twitter, probably due to the specific affordances of the platform [16,17]. Most of the approaches used in these studies show an event detection mechanism based on the extraction of textual data (see, for example Ref. [18]) and metadata information, such as time and date of the tweet, GPS coordinates, URLs shared, etc. (see, for example Ref. [19]), to identify and process messages coming from the public during a crisis.
One of the most popular platforms centered on a bottom-up approach is Twitcident [20], a Web-based system developed at the Delft University of Technology in the Netherlands. Twitcident works by first monitoring local emergency broadcasts for an incident. Then, once an incident is reported, it sifts through local tweets and funnels helpful logistical information directly to first responders. It cuts through Twitter’s noise, and focuses on the most relevant aspects of an incident, using specific filters to reveal a disaster’s location, the amount of damaged reported and if casualties have been suffered.
Another initiative by U.S. Geological Survey (USGS) has developed a platform called TED (Twitter Earthquake Detector) that can filter place, time and keywords to identify possible earthquakes and gather geo-located tweets about shaking, using a short-term-average, long-term-average algorithm [21].
Havas et al. [22] present an architecture able to integrate user-generated data from social media and targeted crowdsourcing activities with remotely sensed data (satellite images). Posted images are not analyzed to verify their truthfulness.
A further system that mines microblogs in real-time is ESA (Emergency Situation Awareness via Microbloggers), which is able to extract and visualize data related to incidents and to evaluate the impact on the community. In this way, it can equip the right authorities and the general public with situational awareness [23]. Moreover, a solution has also been proposed for real-time detection of small-scale incidents in microblogs, based on a machine-learning algorithm which combines text classification and semantic enrichment of microblogs [24].
An additional system worth mentioning is AIDR (Artificial Intelligence for Disaster Response), a platform designed to perform machine learning classification of the tweets that people post during disasters, using a set of user-defined categories of information (e.g., “needs”, “damage”, etc.) [25].
Lagerstrom et al. [26] present a system for image classification to support emergency situation awareness. In particular, the authors investigate image classification in the context of a bush fire emergency in the Australian state of NSW, where images associated with tweets during the emergency were used to train and test classification approaches. No geo-validation has been performed on the analyzed images.
Kumar et al. [27] presents a deep multi-modal neural network for informative Twitter content classification during emergencies, while Johnson et al. [28] present a study to evaluate the performance of transfer learning to classify hurricane-related images posted on Twitter.
One of the main limitations of the majority of existing systems is that they usually examine the social platform as a stand-alone information source. However, in more recent times, systems capable of combing grassroots data with official sources of information have also been developed. For example, Ref. [29] combine Federal Emergency Management Agency reports with related terms found in tweet messages, while Ref. [30] suggest a ranking and clustering method of tweets called the GeoCONAVI (Geographic CONtext Analysis for Volunteered Information) approach. The GeoCONAVI system integrates authoritative data sources with Volunteered Geographic Information (VGI) extracted by tweets and uses spatio-temporal clustering to support scoring and validation. Nevertheless, it is important to underline that even in the systems where the geo-social content is integrated with GIS data from various sources, this accomplishment usually needs an “a posteriori” analysis of the tweets mostly based on classification [31,32], natural language processing methods [33] or machine learning techniques [34]. Such “a posteriori” analysis, however, adds critical time overheads that delay the effective and timely response to an emergency.
The ASyEM (Advanced System for Emergency Management) [16] is able to aggregate two different kinds of data: (1) text data shared online through Twitter by citizens during or immediately after the disaster and (2) data acquired by smart sensors (i.e., cameras, microphones, acoustic arrays, etc.) distributed in the environment. The main limit of the ASyEM is that it cannot correctly work in the absence of distributed sensors in the environment’s area. The main severe restriction is that most existing systems based on tweet mining do not take into account visual items (images, video, etc.), an integral and significant category of content shared by users to convey a richer message [35]. Visual items in fact are particularly important in the context of disaster management because they give precious additional insights into the event by providing to the operators a more accurate situational awareness of the event. To overcome this limitation, we developed the ASMIS system, which takes advantages of the existing works and enriches them through the collection and automated analysis of images shared on Twitter. Moreover, through geo-location validation of images, the system is able also to discharge uninformative and useless images.

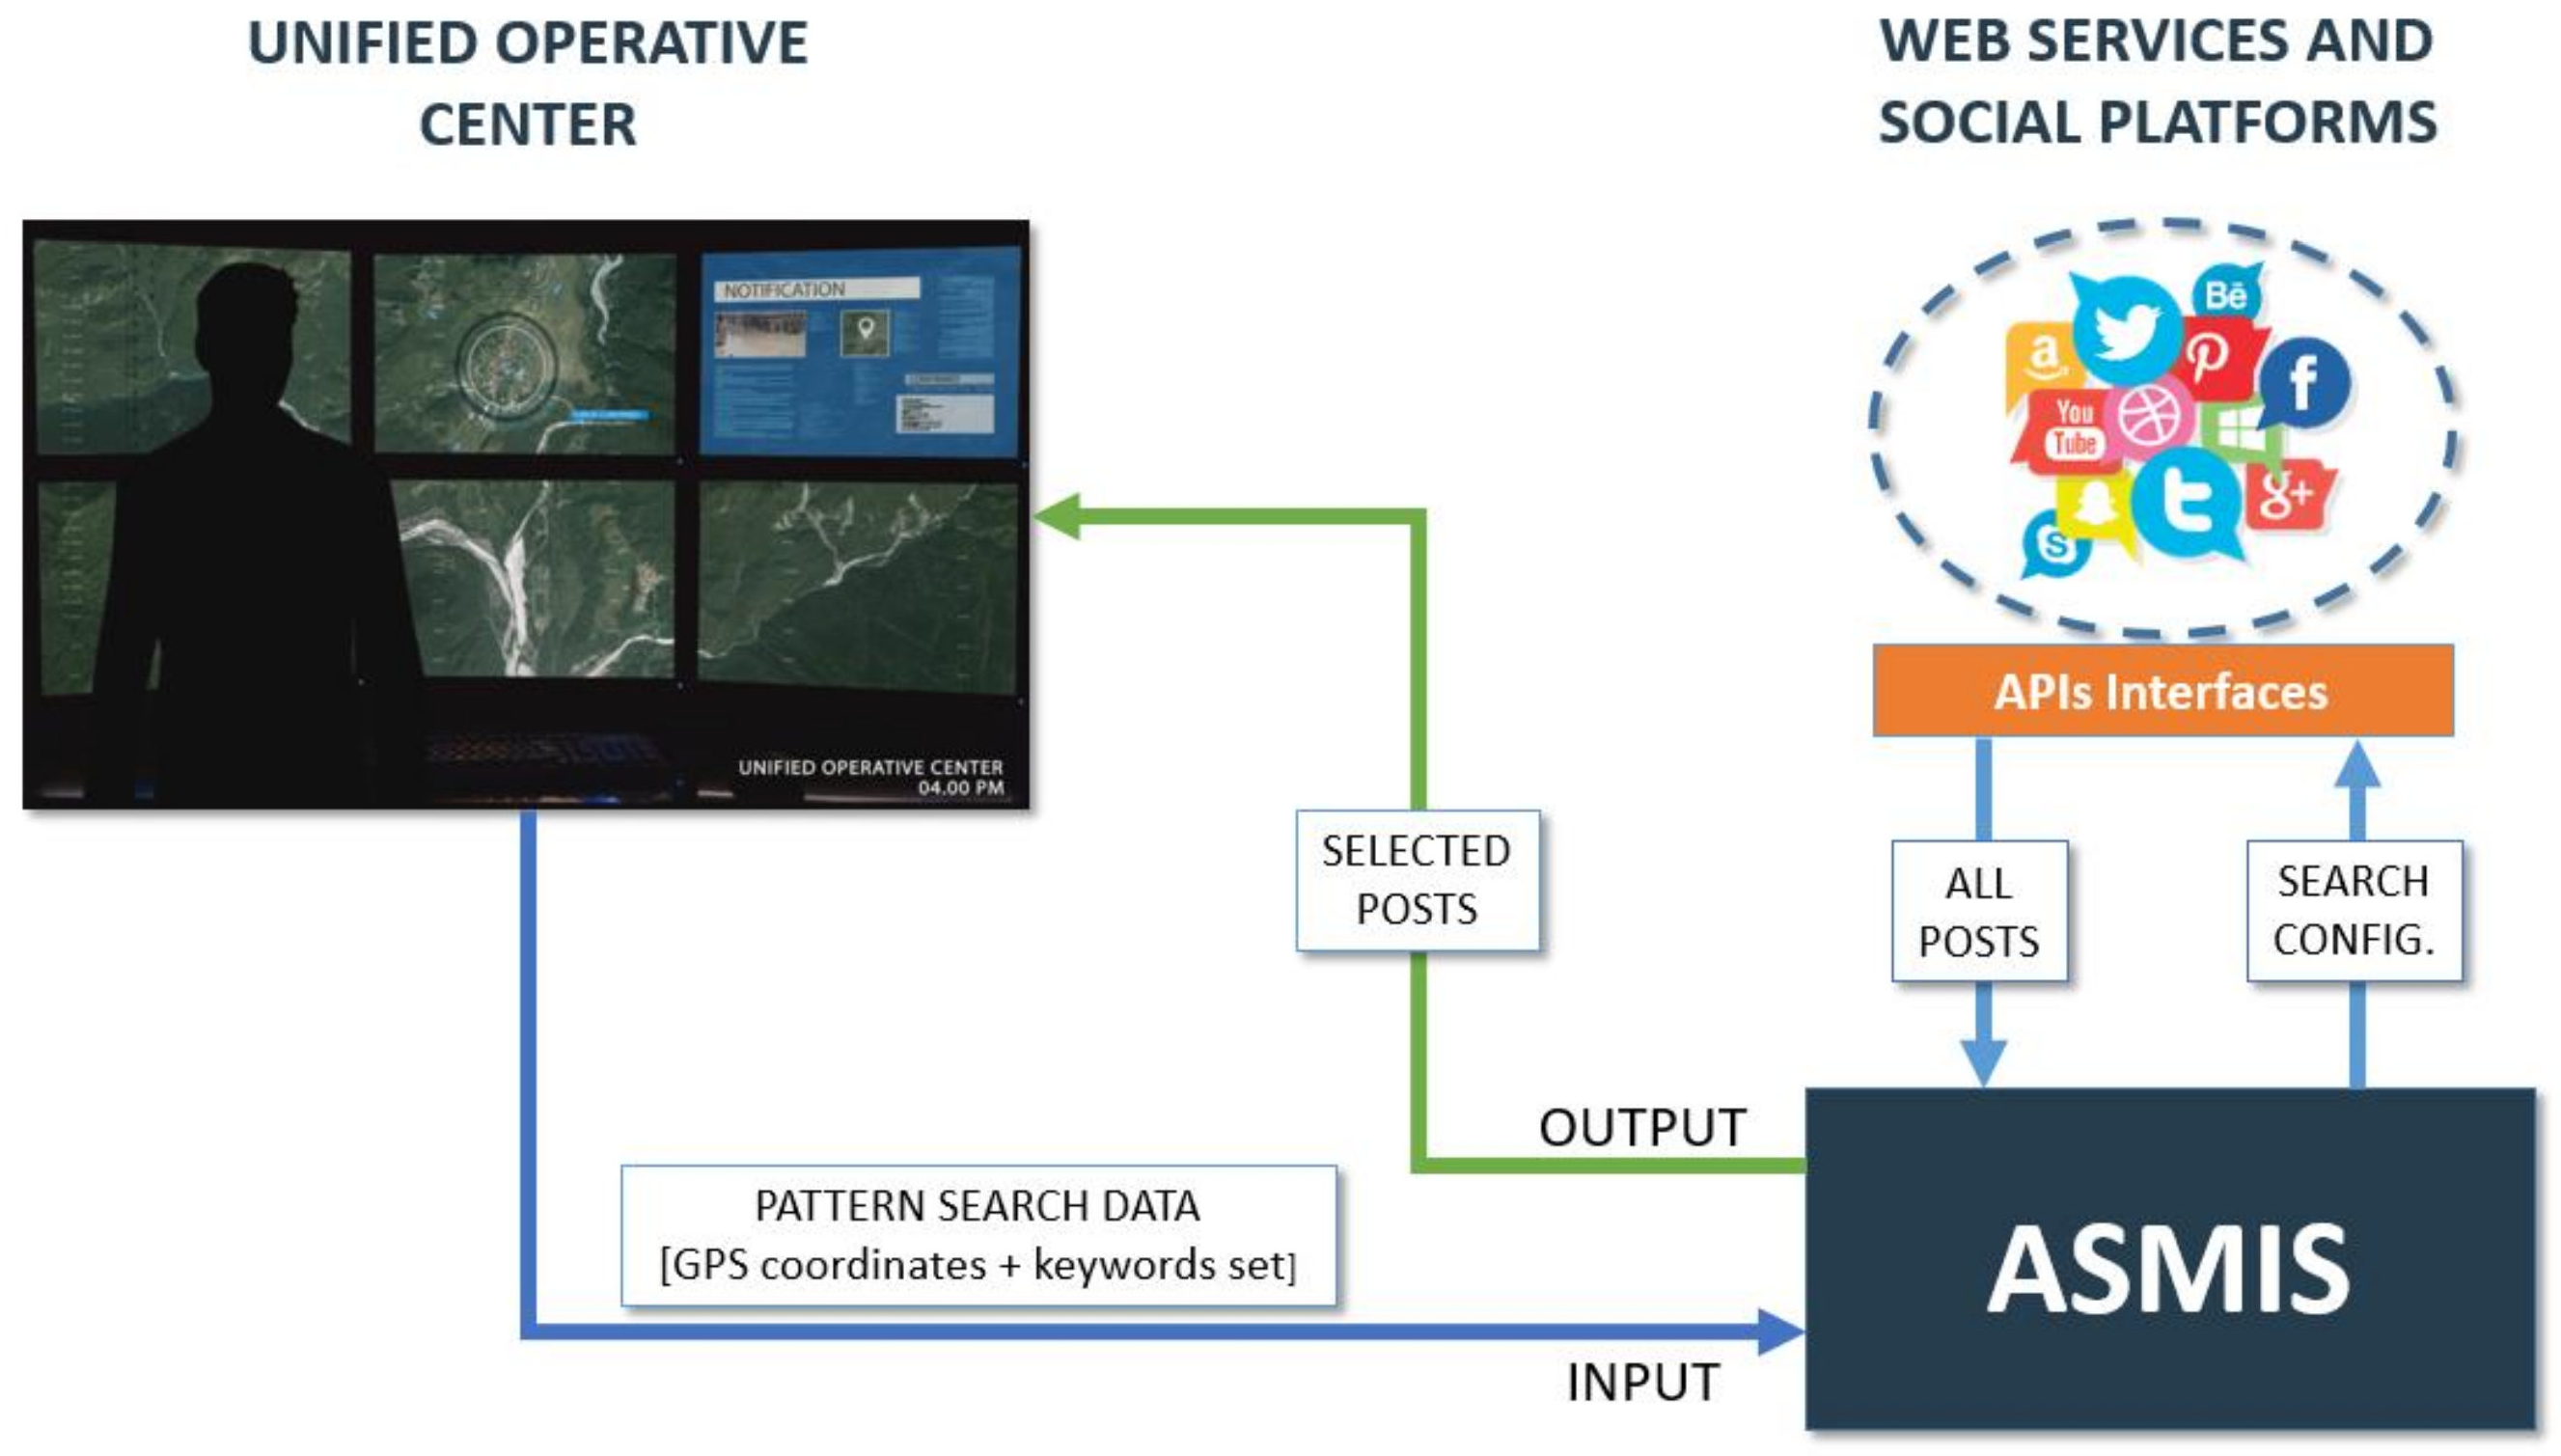
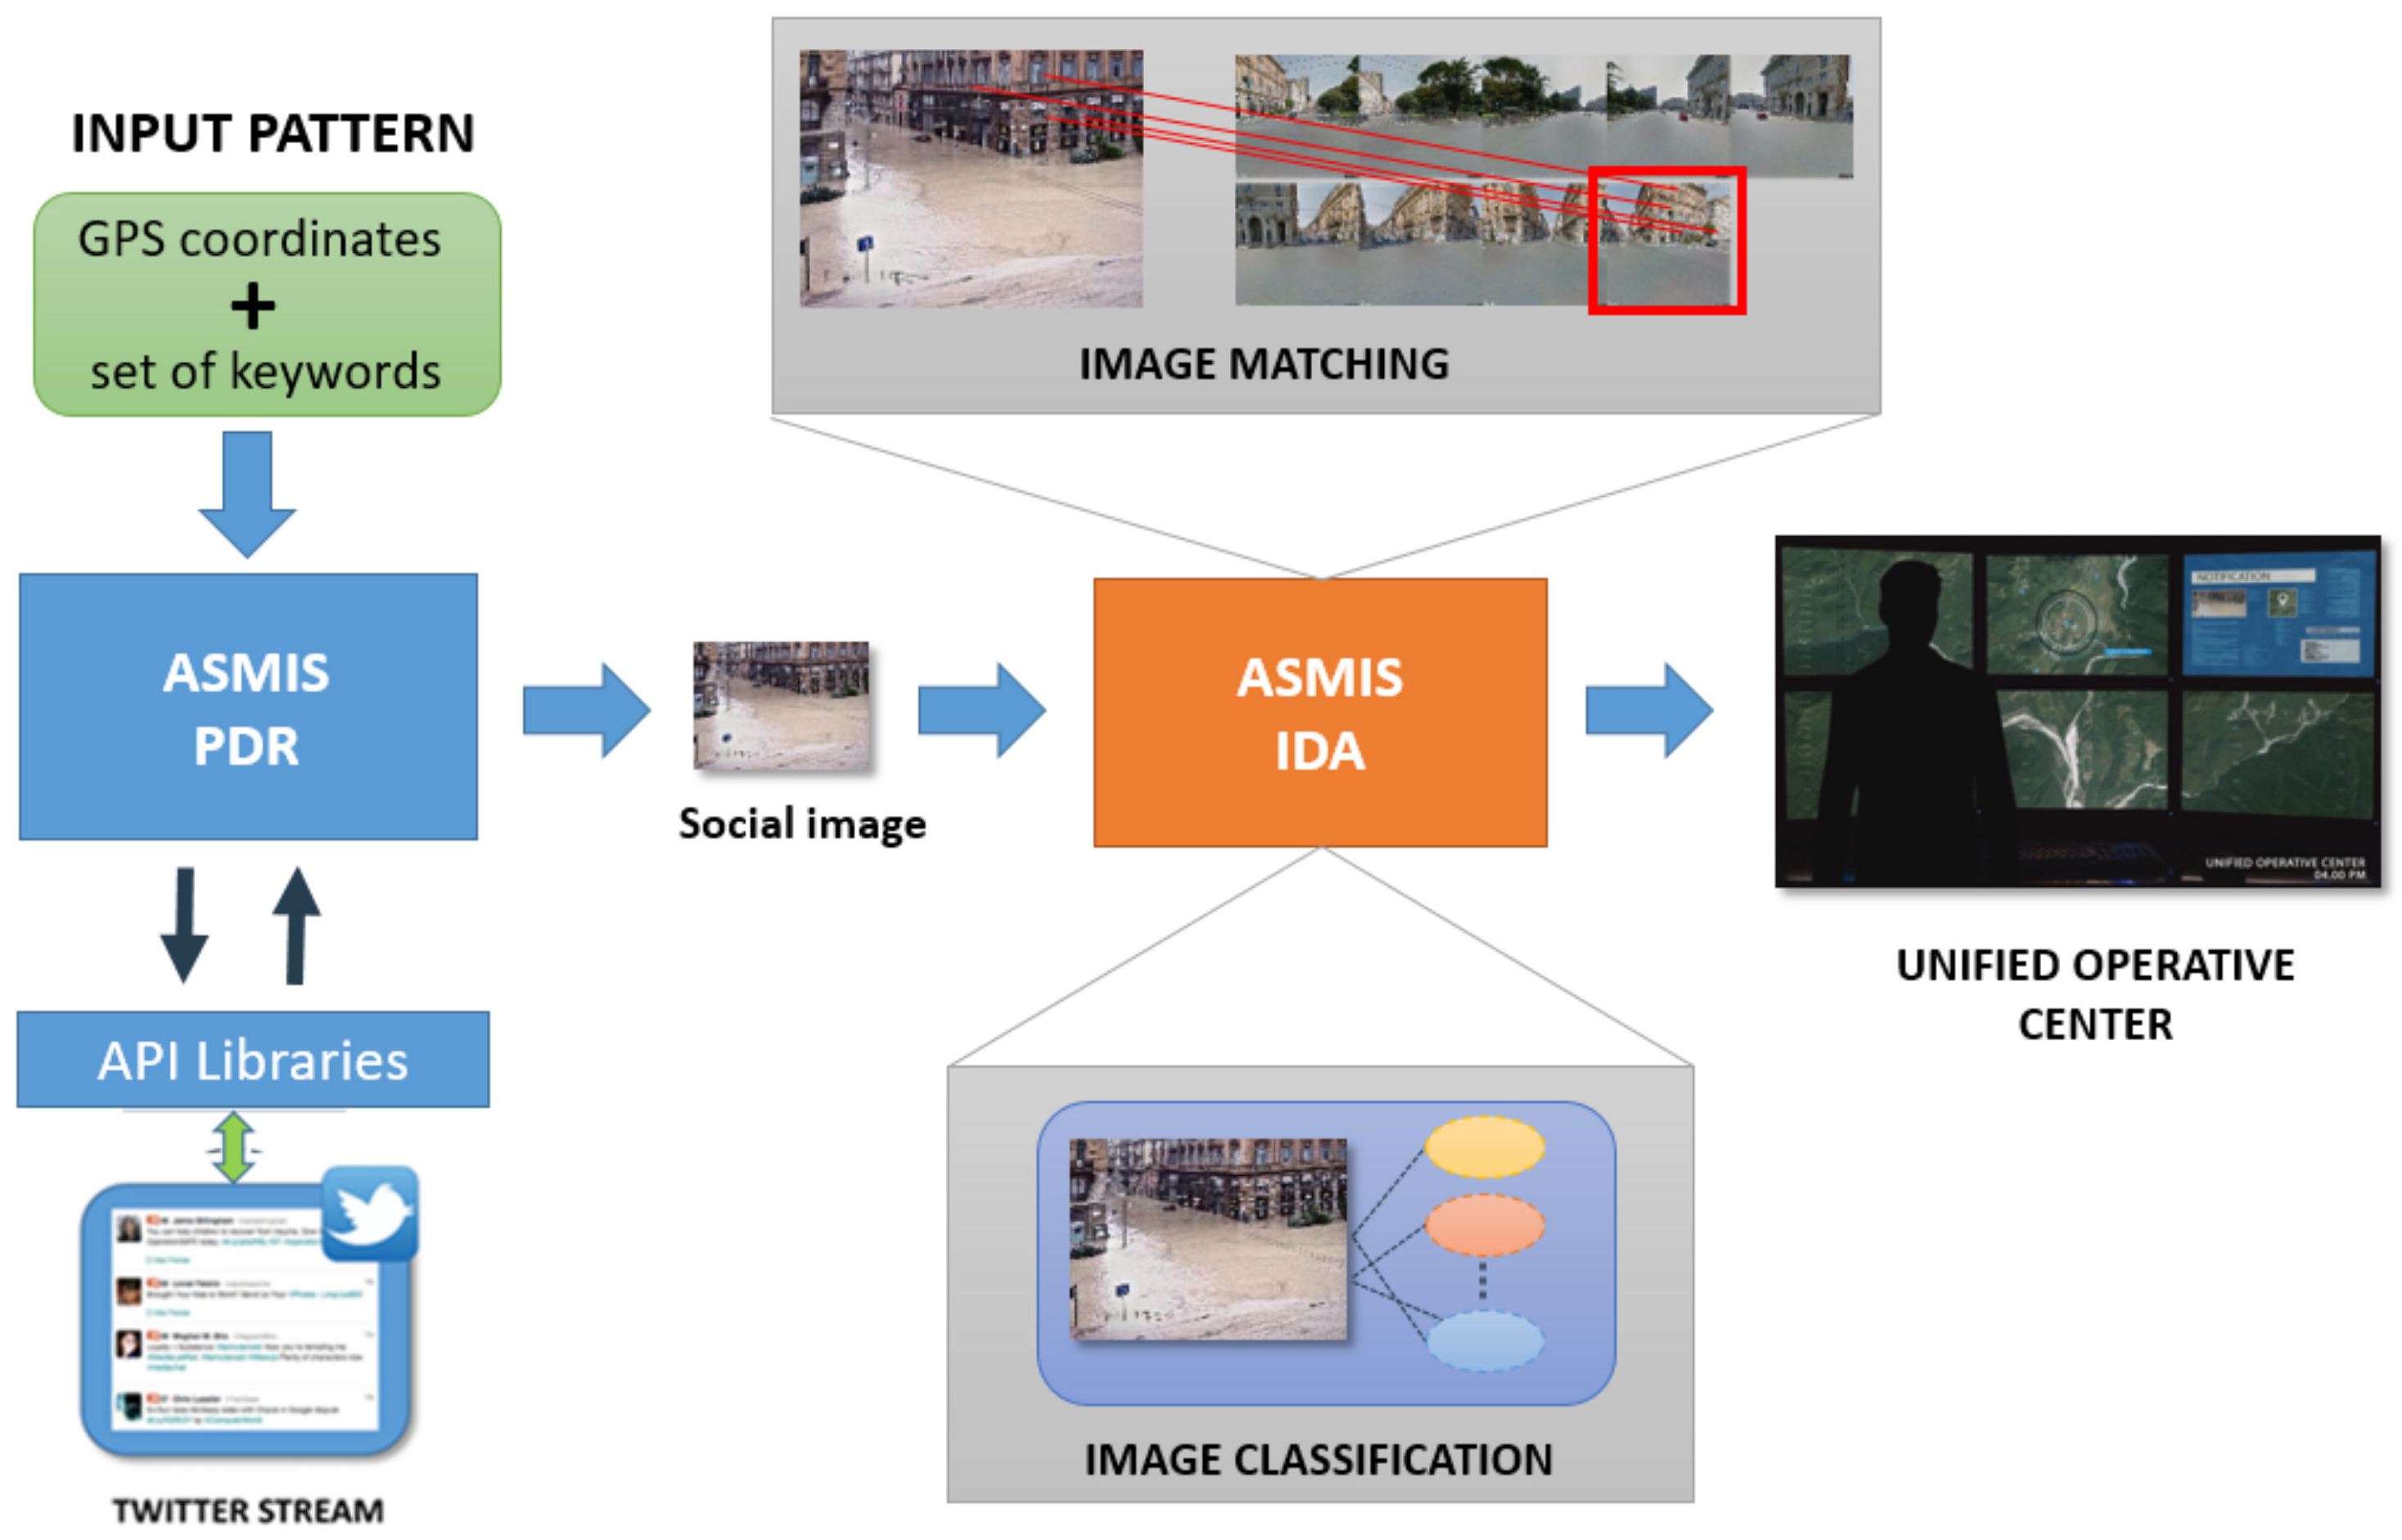
3. The Automatic Social Media Interpretation System (ASMIS)

The ASMIS system has been expressly designed for situational awareness applications. In particular, it is focused on the analysis of visual content shared by users on Twitter during an emergency situation or a crisis event, and it is able to classify the type of event and perform geo-location validation. The choice to focus on Twitter is based on several reasons strictly linked to the platform’s specific affordances: the instantaneous nature of tweets, which makes the platform particularly suitable for rapid communications; the architecture of the platform and some specific technical features, which contribute to a widespread dissemination of information (i.e., the possibility to share content using hashtags (#), an annotation format to indicate the core meaning of the tweet through a single keyword and to promote focused discussions, even among people who are not in direct contact with each other); the prevailing public nature of the great majority of the accounts, which makes it easier to conduct analyses that aim to retrace the spread of communication flows within the platform and makes the use of tweets for research purposes less critical from an ethical point of view; and the fact that the platform provides an API (Application Programming Interface) that can be used to access, retrieve and analyze data programmatically.
The logical architecture of the ASMIS system is illustrated in Figure 2. The system is able to present to the operator accurate information on how the event is evolving by collecting useful visual data shared by users from the emergency area (and automatically discharging uninformative ones). The ASMIS system is composed of two main modules: (a) the Post Data Retriever (PDR) and (b) the Image Data Analyzer (IDA). The PDR module is in charge of retrieving the content shared by users on Twitter during a given emergency event. It uses specific APIs to establish a connection with the social platform in order to extract in real-time the data stream produced by the users.
The IDA module uses a deep neural network, an improved version of the Single Shot Multibox Detector (SSD) network [36], for classifying all the input images, thus discarding uninformative or meaningless images. The principal advantage of the use of this network in the proposed system is to avoid the use of datasets containing tens of thousands of training images (for certain types of disaster events, many images are not always available for network training) and to avoid the explicit selection and computation of a set of visual features since these are effectively computed in the SSD layers. The features for the classification layer are automatically computed by the convolutional components, thus avoiding the problem of searching for the best feature class, and providing a new class of features especially suited for a specific task. The SSD is trained by using images retrieved from past events. Then, it is applied to classify each input image retrieved from social user posts in order to select images belonging to the class of the ongoing emergency event. Afterwards, the classification process is followed by an image analysis process in which the geo-located images retrieved from the social platform are compared with the corresponding images obtained from Google Street View or from other available databases at the same geographical coordinates. Interesting features such as SIFT, SURF, ORB and FAST [37,38,39,40] have been analyzed in order to find the more suitable for the image matching process. Finally, selected images combined with the most relevant information contained in the post (e.g., the text shared, the user’s profile, etc.), are sent to emergency operators in order to have a better overview and awareness of what is happening in the observed geographical area.

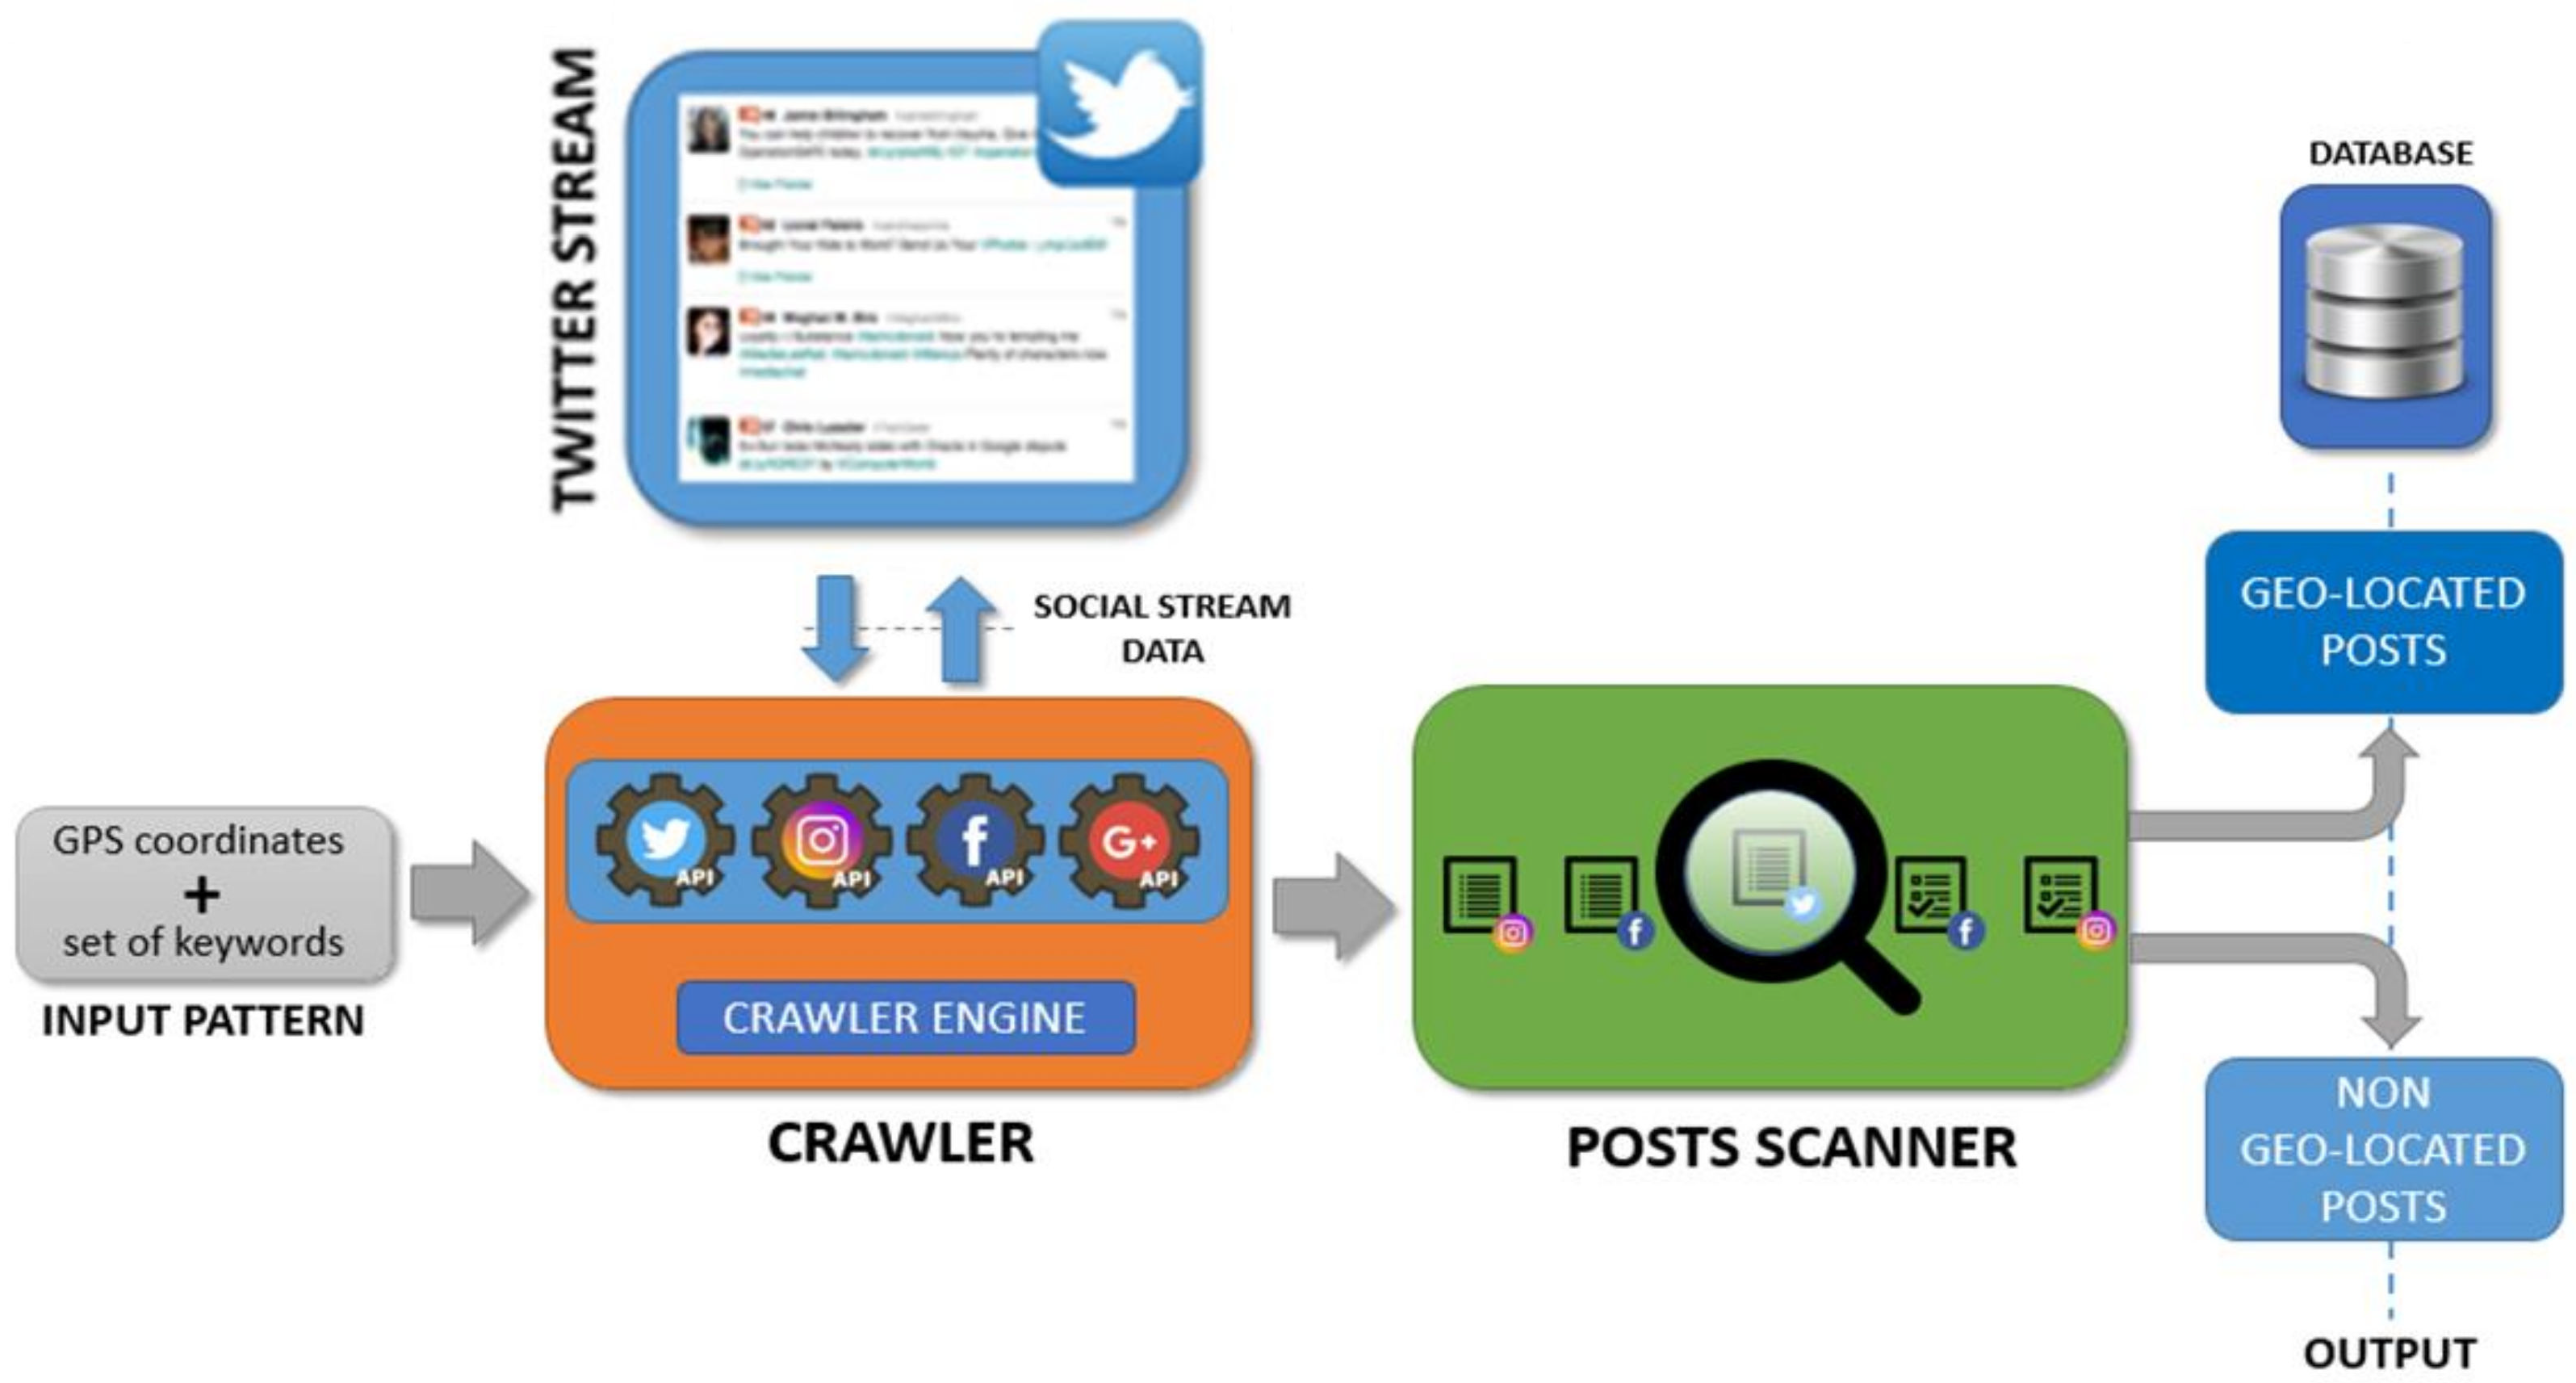
3.1. Post Data Retrieval

The PDR module is in charge of extracting interesting posts shared by users on Twitter. The module is hosted on an Apache server and implemented with the Python programming language. An overview of the logical architecture of the PDR module is shown in Figure 3.
In order to analyze the images shared by users related to an emergency event, the basic workflow of the PDR module can be thought of as follows: a pattern P is a vector containing the GPS coordinate of the center of a geographical circular area Ci (where the event occurs) and radius Ri, and a set of specific keywords related to the emergency event (e.g., the keywords flood, inundation, river, alert, etc. can be considered as representative for the type of event [16]) is given in input to the system by the operator.
P = G P S l o n g i t u d e ,   l a t i t u d e ,   R i ,   f l o o d ,   i n u n d a t i o n ,  
A set of significant keywords for specific emergency events has been created considering other works in this research field; for example, during the emergency event that occurred in Florida due to the “Irma” Hurricane, the most popular keywords used by users on Twitter were “HurricaneIrma”, “IrmaHurricane”, Irma2017”, etc.
The crawler extracts from the social stream only the posts containing one of the input keywords and geolocation information related to the geographical area Ci. Spider software (i.e., an automatic software tool able to analyze the World Wide Web typically for indexing purposes) [16] is configured in such a way that the input stream is filtered by taking into account only geo-located posts. By considering the Twitter social platform, the spider software has been implemented by using Tweepy (Tweepy: http://tweepy.readthedocs.io (accessed on 2 January 2023)), a Python library for accessing the Twitter API. According to the Social APIs in use, the selection of a geographical area from which to extract tweets can be achieved by considering the GPS coordinates of the interested area where the event is occurring. For example, Twitter requires as input a bounding box of GPS coordinates [longitude, latitude] corresponding to the bottom-left and the top-right corners of a rectangular geographical region. Nevertheless, to make this operation easier and the location of the interesting area more accurate, the PDR module considers a circular region (with center and radius given by the operator, see Figure 4). All retrieved posts are then analyzed by a post scanner algorithm which selects only those posts which contain at least one keyword contained in P. However, the amount of data might be unmanageable. To allow a quick analysis of the visual data and to avoid the consumption of large amount of memory, all posts are stored into a graph database. The Neo4J graph database is used as it is highly scalable and robust [41]. Each post includes all the information regarding the user profile, the shared text message and all the multimedia content attached.

3.2. Image Data Analyzer

The IDA module is composed of two sub-modules: Image Classifier and Image Geo-validation (Figure 5). The first one classifies the images retrieved from the PDR module according to the class of the event they represent. For example, an image which represents a swollen river should be classified as an image related to a flood event and not to an earthquake or a fire event. All images, classified as belonging to the interesting class of event, will be processed by the Image Geo-validation which is in charge of evaluating if it is meaningful for the given event. An image matching procedure is exploited in order to find valid matches between input images and images retrieved from Google Street View or from available local datasets. The goal is to verify if it has really been taken from the location it shares.

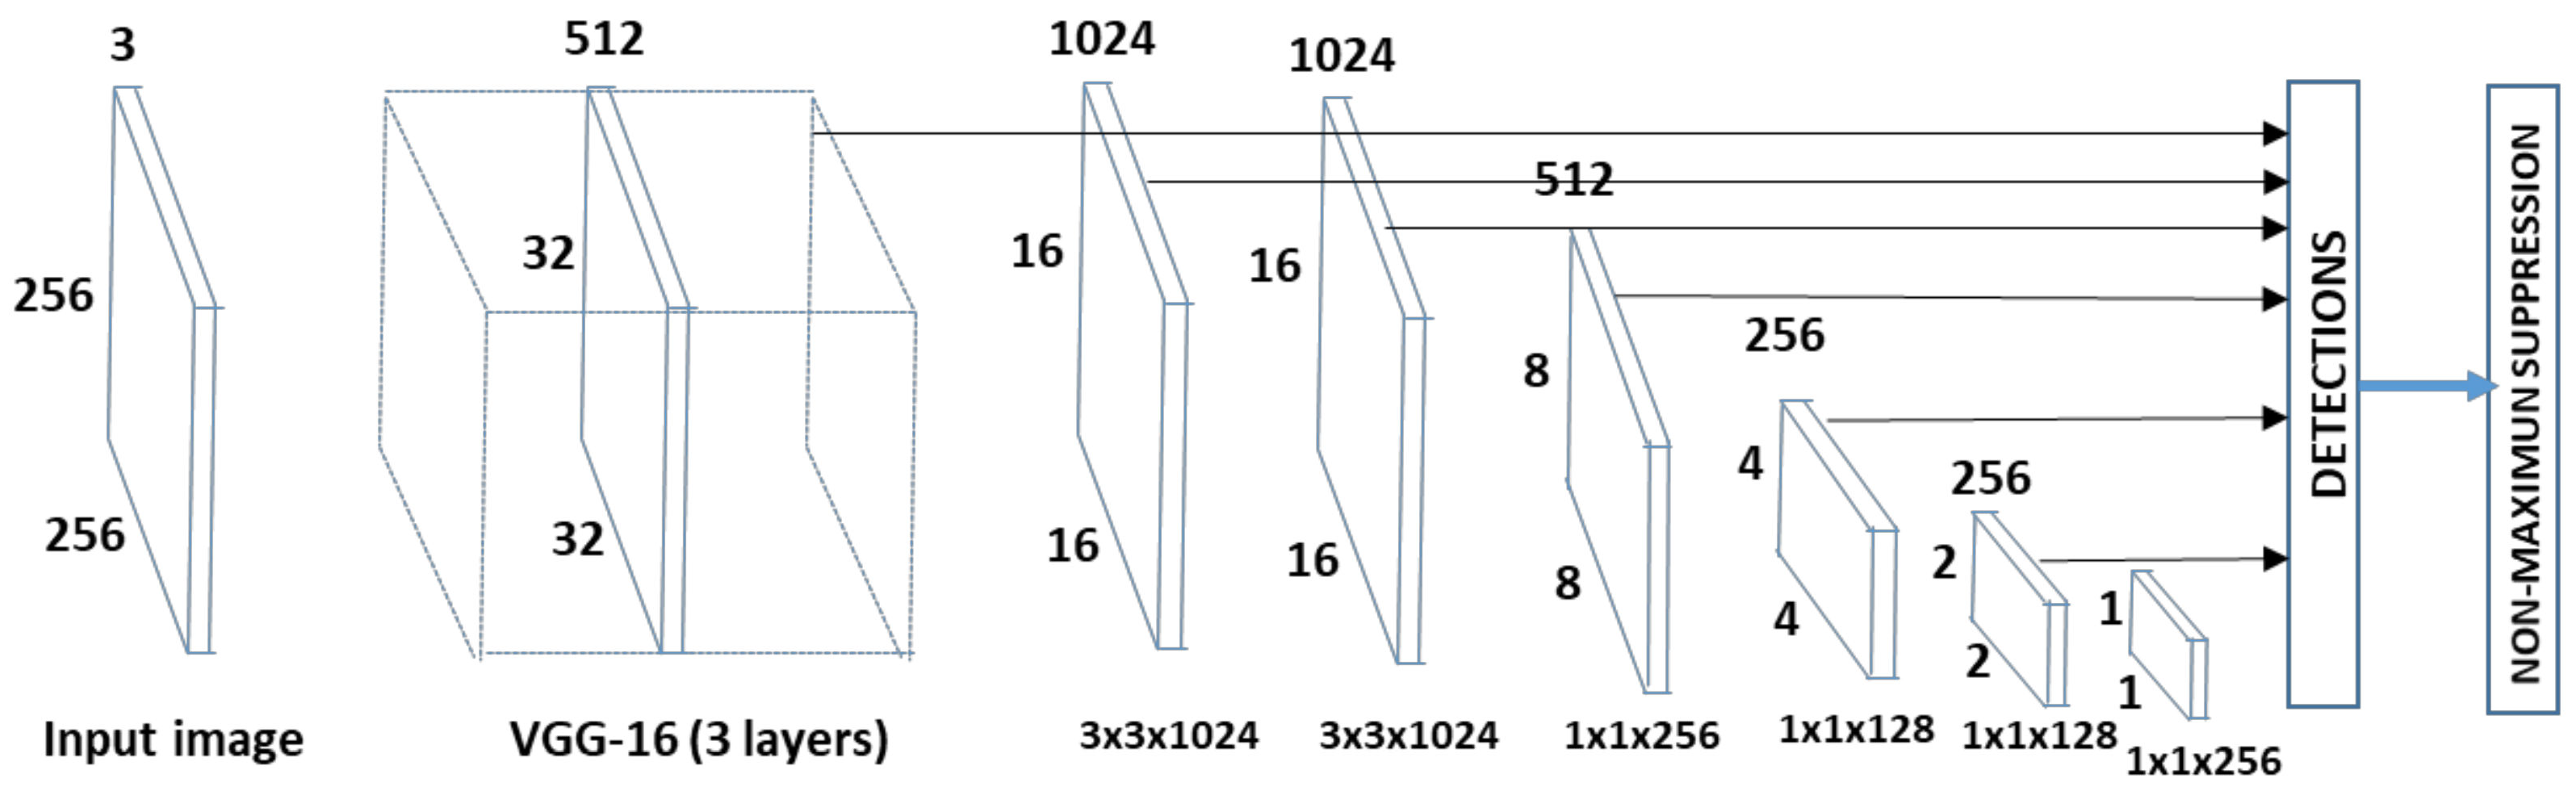
3.2.1. Image Classifier

The image classifier is in charge of selecting images according to the class of interesting event (Figure 6).
To reach this goal, a SSD network has been used (Figure 7) [42]. The main characteristic of the SSD network is that, once a model has been chosen, it is truncated before the classification layers and additional convolutional feature layers are added at the end of the network. The size of the additional layers decreases progressively allowing predictions at multiple scales, and each of them can produce a fixed set of predictions by using convolutional filters. The applied SSD uses a feed-forward convolutional neural network that produces a collection of events and a score indicating the presence of event class instances in the input image. The shallow network layers are based on a standard deep architecture: the VGG 31 [43]. In particular, according with the results shown in [44], a model characterized by 31 layers, learning rate 0.001, max-epoch 400, validation frequency 400 and mini batch size 256 has been applied to increase sensitivity and accuracy of classification.
A dataset composed of about 4000 images belonging to four event classes (flooding, earthquake, fire, terrorist attacks) has been created. The Multimodal Crisis Dataset (CrisisMMD) [40] has been considered for images belong to the classes of flooding, earthquake and fire, while regarding the images referring to terrorist attacks these have been collected from the web and from the Cross-View Time Dataset [45].

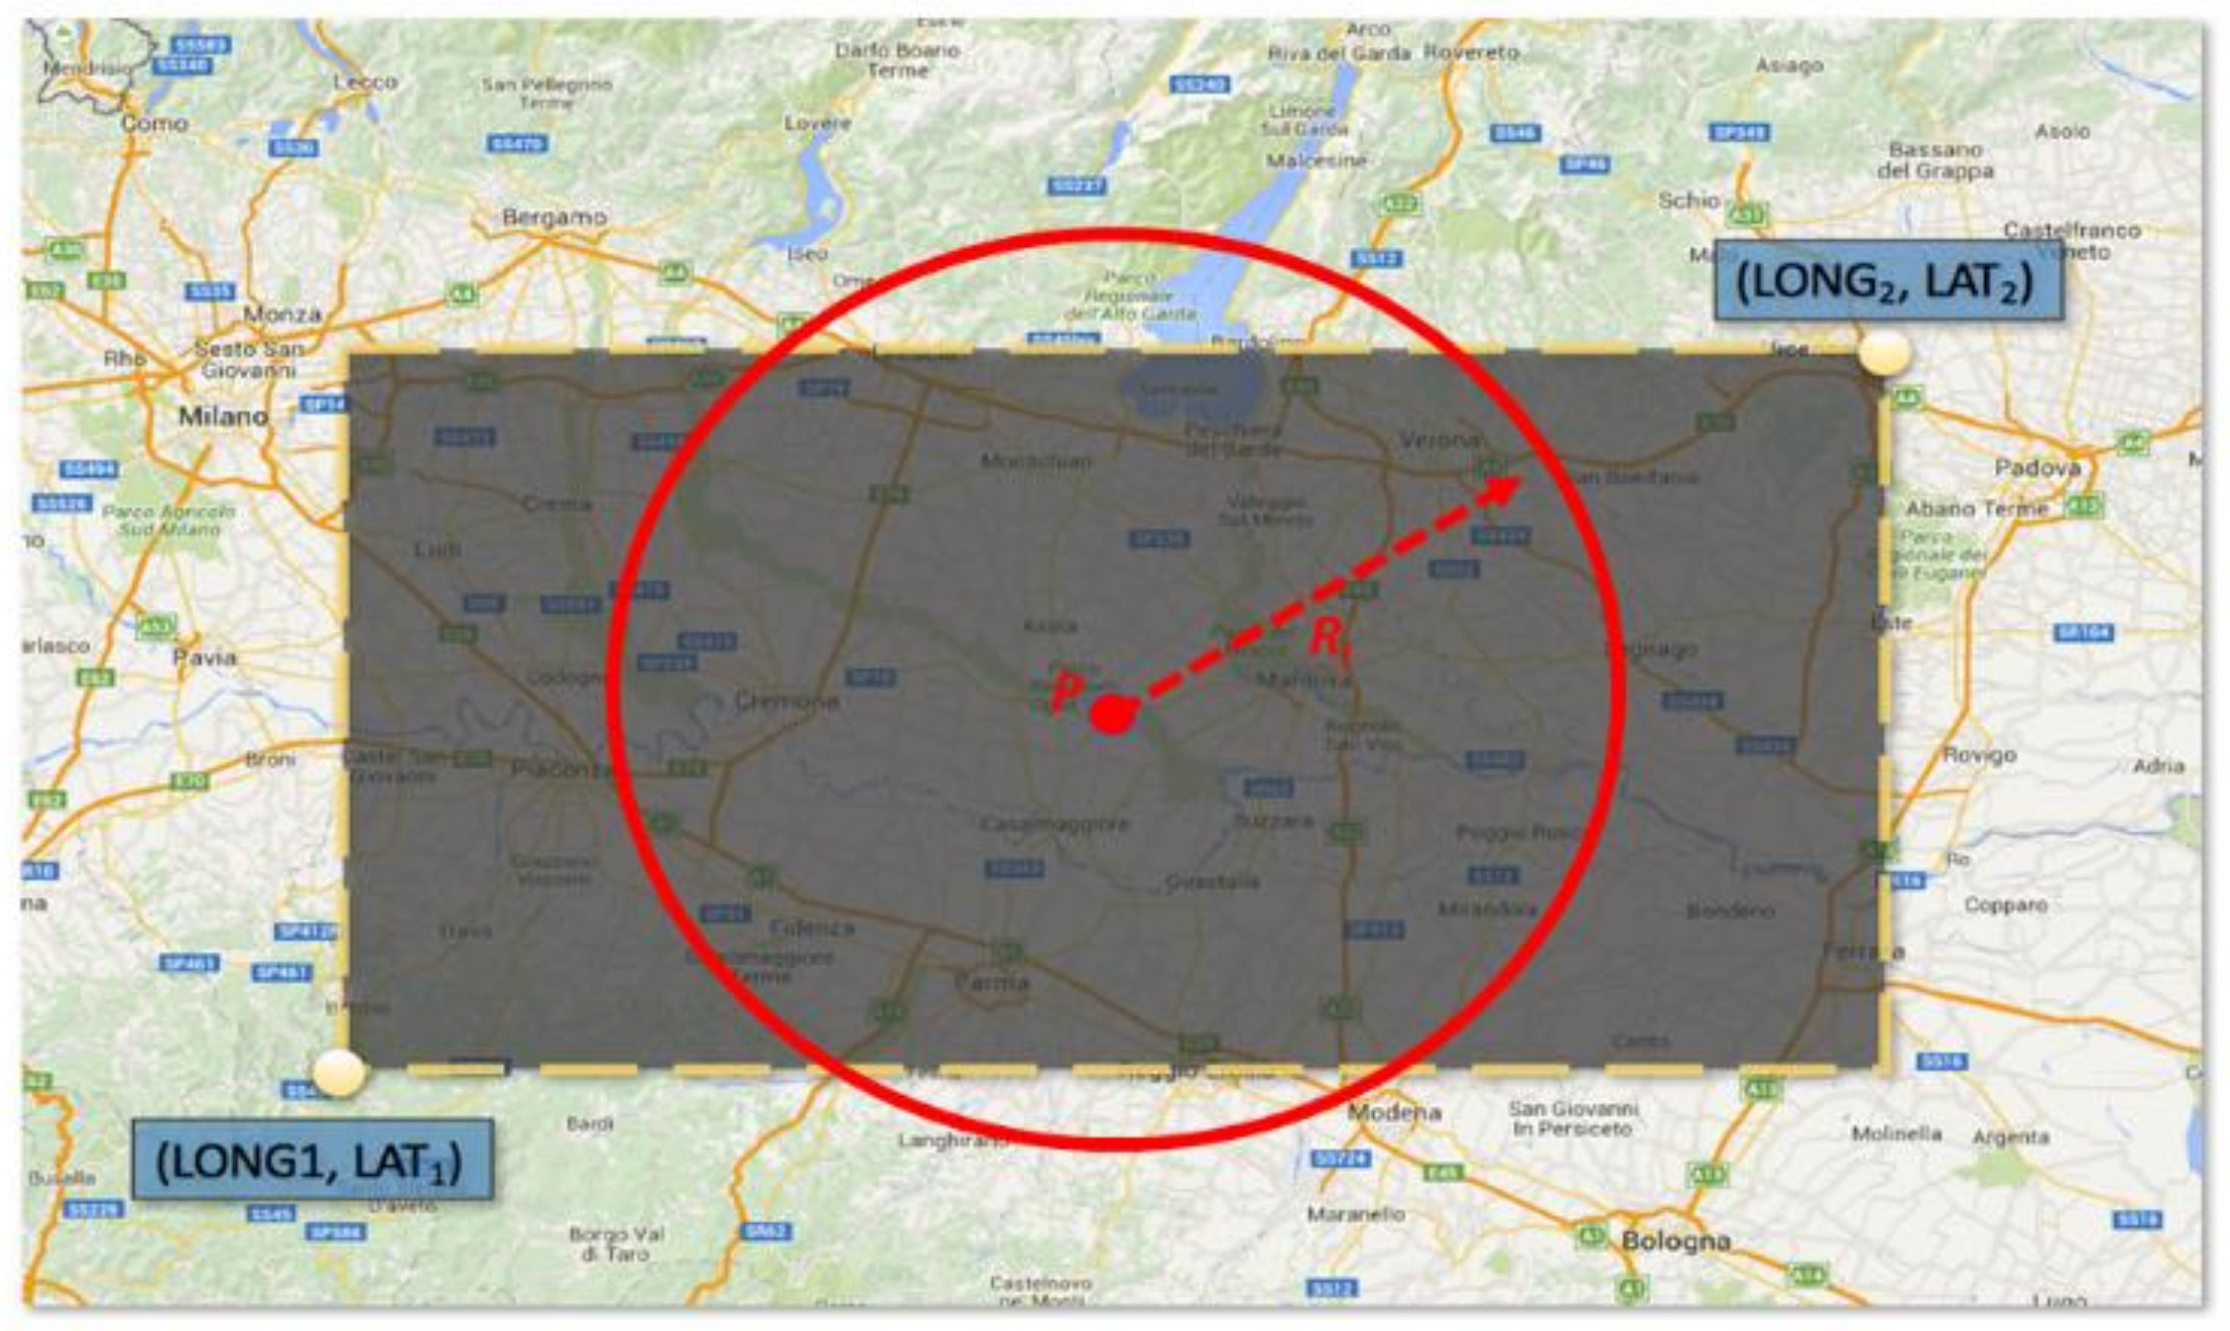
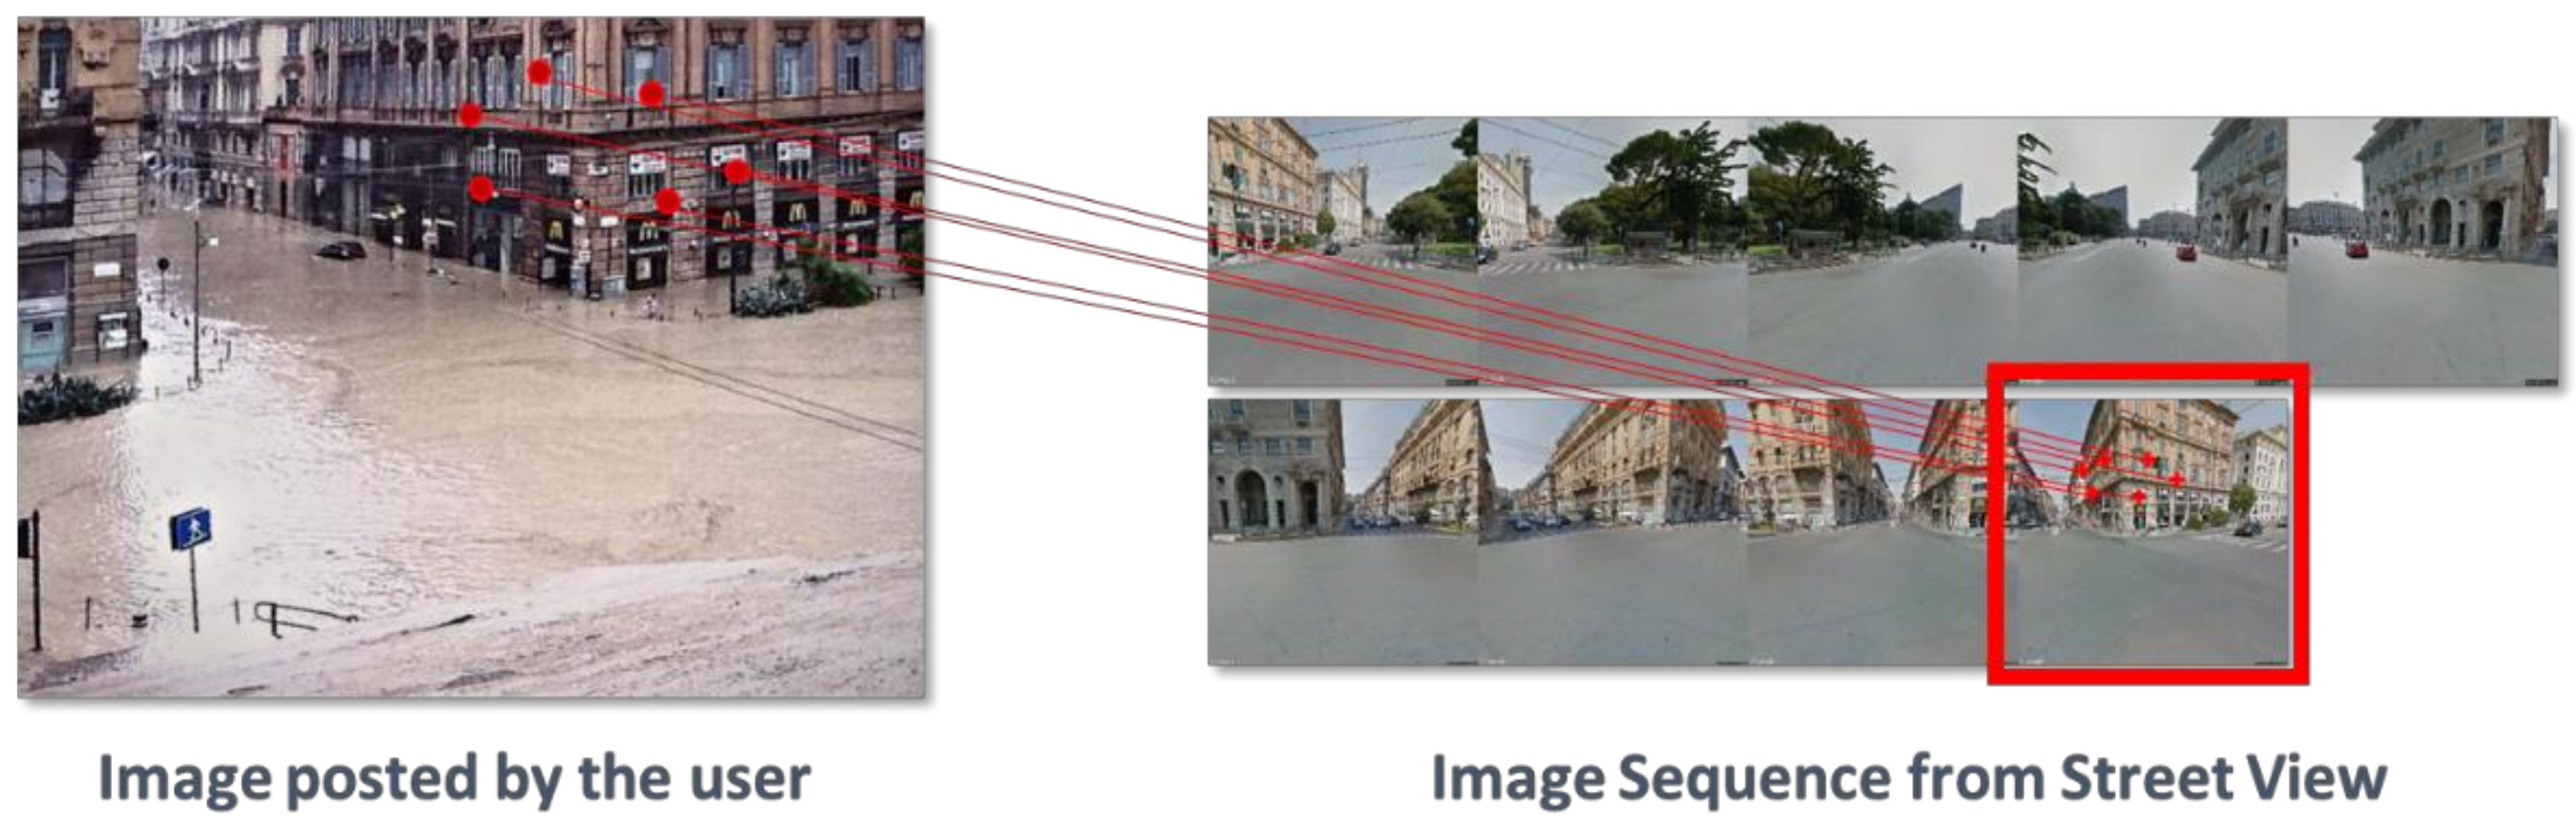
3.2.2. Image Geo-Validation

Images shared by users during an event could be a useful resource for emergency operators in order to get more detailed information of what is happening in a specific area. Nevertheless, not all images shared by users are related to the event itself. For example, Figure 8 shows three different images retrieved from Twitter during the earthquake that occurred in 2016 in central Italy. These images were collected by the PDR module because the text shared on the Twitter post included the hashtag #terremoto (#earthquake), which was one of the keywords given in input to the system to detect images belonging to this event class.
It is worth noting that the left image is not related to an earthquake as it represents a flooding. Instead, the image on the right has the meaning since it refers in some way to the Italian earthquake although it is not useful for the goal we want to achieve as it does not represent a public street (the matching with Street View is not possible). Finally, the middle image is completely related to the event itself and fully reflects the type of images we want to retrieve. The Image Geo-validation submodule is composed of two main components: Sequence Image Generator (SIG) and Image Matching (IM) (Figure 9).
The SIG module (Figure 10) exploits geo-located information included in the user’s post to create a sequence of images acquired with different field of views around the interesting location. Each single frame—that composes the image sequence—is retrieved from Google Street View servers (through HTTP GET requests) or from a local dataset.
The SIG module needs as input different parameters to regulate the “quality” of the frame to retrieve, e.g., the size, the pitch, the zoom, the number of images as well as the latitude and longitude coordinates. Moreover, the camera of the Google Street View application is moved in the left or right direction along the vertical axis. In this way, by moving the camera 40 degrees to the right (or to the left), it is possible to retrieve respectively 9 images. As a result, the pairwise images are overlapped by about 40% thus allowing the creation of an image sequence representing the interesting area (Figure 11). Then, an image matching procedure is applied to compare the image posted by the users with each single frame that composes the extracted image sequence. In this way, it is possible to verify if posted images have been effectively taken in that place. At the same time, it is possible to overcome problems related to the geo-location information attached to each post. In fact, the position shared by users while posting some content may not always be accurate due to the fact that the GPS signal is not always available and, in many cases, the device in use could get the position through a Wi-Fi network or Cell-ID.
The matching procedure extracts from the input image and from the image sequence specific key points, and it searches for possible correspondences. The Euclidean distance measure is computed between pairs of key points in order to detect the best candidate image among the image sequence extracted from Street View. Moreover, in order to overcome the problem of outliers, the M-estimator SAmple Consensus (MSAC) [46] is applied to estimate geometric transformation from matching point pairs. The MSAC is an iterative method to estimate parameters of a mathematical model from a set of observed data that contains outliers, when outliers are to be accorded no influence on the values of the estimates. Among the most diffused techniques which allow local features to be identified and extracted from an image, several tests have been performed by considering Scale Invariant Features Transform (SIFT) [38], Speed-up Robust Feature (SURF) [38], Binary Robust Invariant Scalable Key points (BRISK) [38] and Oriented FAST and Rotated BRIEF (ORB) [40] descriptors. The goal is to select the best feature descriptor to find robust matches between images. BRISK and ORB were the worst due to the lower number of correct matches that could be found. SIFT was the best one considering the number of features extracted and correctly matched, while SURF showed good results although in some cases the matches were not very accurate (Figure 12).

4. Experimental Results

Several experiments have been carried out to evaluate each single module which composes the ASMIS system in the context of different emergency situations caused by earthquakes, floods, hurricanes, clashes and terrorist attacks. Tests have been classified into two main groups: (1) tests performed during the event and (2) tests performed after the event. The proposed system was implemented by using the Python programming language (3.9.5 version) and OpenCV 3.4.10 framework. The implementation of the SSD network is based on Keras, the Python Deep learning API. Finally, the running environment was Intel Core i9-9900T, 16M cache, up to 4.40 GHz, 64 GB of RAM and a GPU NVIDIA GeForce 1070 Ti [47,48].

4.1. Data Acquisition and PDR Module Performance

We tested the system with about 60 different searches: on average, searches lasted about 36 h each and were performed considering both disaster events (earthquakes, floods, etc.) and common places (e.g., famous streets), in order to retrieve the highest number of images coming from known places. Mainly, posts were retrieved using the native language of the country where the event occurred although the collection of tweets in many cases was obtained using the input set of keywords in the English language.
As shown in Table 1, searches allowed collection of about 1.135K tweets on different types of events, out of which about 38.5% were geo-located. Moreover, the system retrieved about 129,721 images. In this case, about 64.5% of them were geo-located. As explained in Section 3.2.2 (Image Geo-validation), we considered both tweets which share GPS information and tweets which contain the address of the position where the tweet was shared, although in the latter case they were not always accurate. The matching procedure is able to correct the location error by searching the best match into a set of contiguous images extracted from Street View.
Table 2 shows the type, the location, the search duration, the number and the multimedia content of tweets retrieved by the PDR module by analyzing four different events occurring in 2015: the flooding in the French Riviera, the clashes in Milan during the Expo, the terrorist attacks in Paris and Hurricane Patricia occurring in Mexico. The system retrieved 10,135 images of which 4578 geo-located.
First, we can see how the total number of tweets retrieved does not depend on the duration of the search. For example, comparing the terrorist attacks and the Riviera flood events that occurred in France, we can see that the last one collected a lower number of tweets although the duration of the search was the same. Another observation could be related to the type of event: in fact, the number of shared tweets depends on the type and the gravity of the event. In addition, the geographical area where the event occurs may also affect the results. Twitter is one of the most popular and widespread social platforms although there are some regions where it is not completely used. Finally, results depend also on the set of keywords which are used as input to the search: if generic keywords are used, the retrieved tweets could be inaccurate. For example, if the keyword “earthquake” is used as input to search for an earthquake event, it is almost certain that the search will give as output a lot of tweets although they could include unnecessary information. In order to face these problems, ASMIS is able to retrieve only tweets which describe the event. For this purpose, the hashtag trend is considered in order to optimize the ongoing searches. In order to compute the hashtag trend, the histogram of the most used hashtag shared in posts associated with flooding events is considered. For example, in the case of flooding events in Italy we used a set of hashtags opportunely selected by considering the analysis performed on a dataset of about 300,000 tweets posted by users during past flood events in Italy (i.e., the flood occurring in Sardinia in 2013, in Genoa in 2011 and several others) and considered as representative for floods. The set was composed by the following hashtags, namely #emergenza, #allertameteo and #maltempo (in English #emergency, #weatheralert, #badweather).

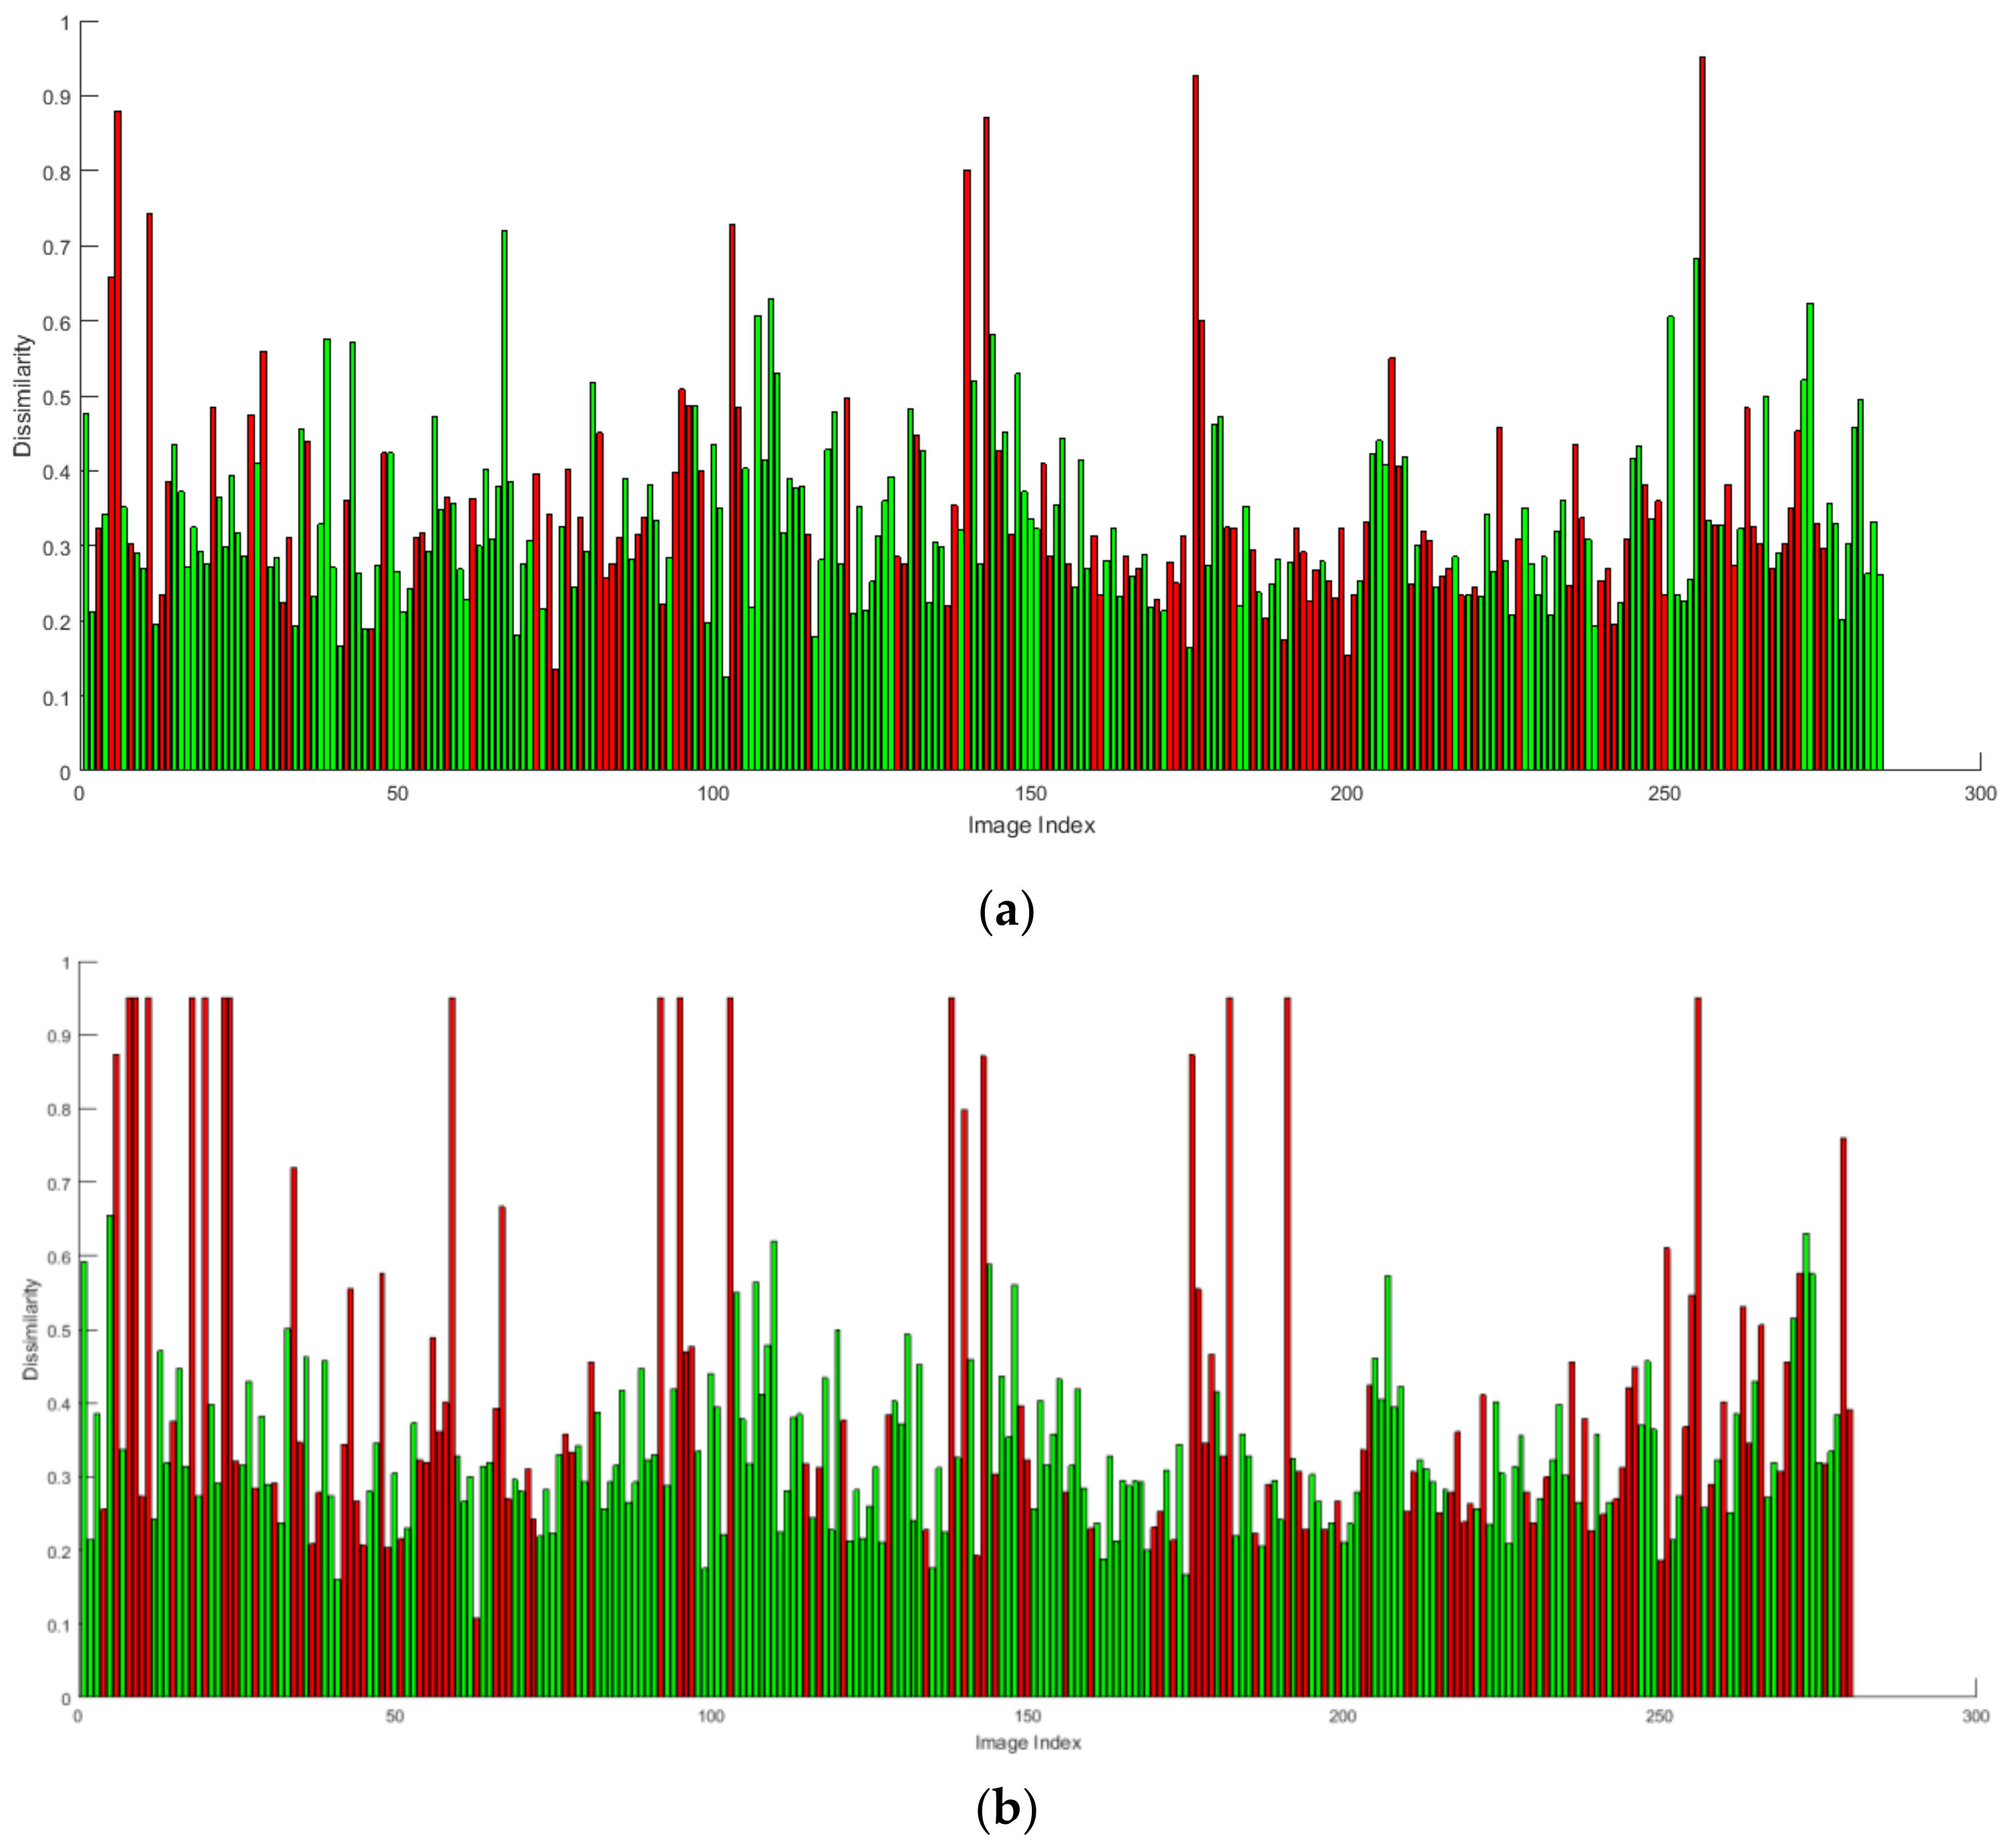
4.2. IDA Module Performance

The evaluation of the IDA module was performed in three steps. In the first, the event classification accuracy was computed by using random sets of images coming from the four different events as in Table 2. In the second, all data of the considered emergency situations (as exploited in Table 1) are analyzed to measure the effectiveness of the system. Finally, the performances of the image matching procedure in terms of positive match, false matches and negative matches are computed.
The following well-known metrics were computed to highlight the goodness of the obtained results, i.e., Precision (P), Recall (R), F-measure (F1) and Accuracy (A):
P = T P T P + F P
R = T P T P + F N
F 1 = 2 R P P + R
A = T P + T N T P + T N + F P + F N
where TP, TN, FP and FN represent true positive, true negative, false positive and false negative, respectively. In this context, P points out the level of probabilistic proximity between a recognized event and its membership class and R highlights the sensitivity level of the event classification; finally, F1 and A measure, respectively, the effectiveness and the accuracy of the event classifier.
By considering the images of all selected emergency situations as in Table 1, the IDA module shows good classification performance (TP = 90,827, TN = 9657, FP = 16,345, FN = 12,892): P = 0.84, R = 0.87 and F1 = 0.85. The system reaches an accuracy of A = 0.78. By considering the images coming from the four different events as in Table 2, the IDA module shows remarkable classification performance (TP = 7354, TN = 983, FP = 975, FN = 823): P = 0.88, R = 0.90 and F1 = 0.89. The system reaches an accuracy of A = 0.82. In particular, the following per-event classification results were obtained: (a) flood—P = 0.88, R = 0.90 and F1 = 0.88; (b) clashes—P = 0.88, R = 0.90 and F1 = 0.89; (c) terrorist attack—P = 0.89, R = 0.90 and F1 = 0.89; (d) hurricane—P = 0.87, R = 0.89 and F1 = 0.88.
Moreover, it is worth noting that about 40% of the collected tweets have been considered by the system as geo-located posts and only about 30% of them contains images.
The following keywords have been used during the experiments for the different classes of events: (a) flooding (#flood, # floods, #flooding, #flashflood, #rain, #weather, #disaster, #climatecrisis), (b) clashes in Milan (#clashes, #clashesexpo, #violence, #stone, #protests), (c) terrorist attacks in Paris (#terrorism, #terrorist, #attacks, #paris, #parisattacks, #bataclan, #police), (d) Hurricane Patricia in Mexico (#hurricane, #hurricanepatricia, #climatecrisis, #tropicalstorm, #storm, #wake, #disaster, #emergency). By considering the 4578 geo-located images, extracted from geo-located tweets coming from the four different events as in Table 2, the IDA module shows remarkable image matching performance (TP = 28,214, TN = 687, FP= 623, FN = 447): P = 0.81, R = 0.86 and F1 = 0.83. The system reaches an accuracy of A = 0.77.
Considering the processing time required by the IDA module, it is worth noting that the analysis of a single geo-located tweet containing images requires on the used computational platform about 5 msec for the classification, and about 100 msec for the feature extraction and matching process.
In order to show the results of the IDA module, we outline its functioning by analyzing the tweets during the terrorist attacks in Paris in 2015 (Figure 13). On the evening of 13 November 2015 and precisely between 10.00 and 11.00 p.m., a series of terrorists’ attacks occurred in the French capital. The attacks, claimed by the Islamic State of Iraq and Syria terrorism group, was constituted of mass shootings, suicide bombings and hostage-taking at four locations in Paris. About 130 people were killed by the attackers. The search on the given event was started in the evening—about an hour after the first attacks—and it lasted for 24 h. This example is the one that gave the most significant results in terms of number of images (about 6258) retrieved in 24h.
Nevertheless, the proposed SSD network classified 1246 images as belonging to the given event, only 278 of which with GPS coordinates. Considering that the event occurred between 10.00 PM and 11.00 PM, the retrieved images were taken during the night. Nevertheless, results are very good. The IDA module shows remarkable classification performance (TP = 985, TN = 145, FP= 63, FN = 53): P = 0.91, R = 0.94 and F1= 0.92 with an accuracy of A = 0.89 and good image matching performances (TP = 177, TN = 41, FP = 36, FN = 24): P = 0.81, R = 0.88 and F1= 0.84 with an accuracy of A = 0.78. Plots in Figure 14a,b show the results obtained by analyzing the images through SIFT and SURF descriptors: green bars represent true matches while red bars represent false matches (discharged images). It is worth noting that better results were obtained by using SIFT descriptor. The SIFT descriptor is able to correctly match 177 images (about 63%). Of the remaining 101 images, 65 were not found even though they represented areas in the event territory and 36 were correctly discarded as irrelevant to the event.
Moreover, analyzing the images that the system discarded, we can explain this behavior due to three significant problems (see Figure 15): (i) many images were taken from the top of a building thus there were not Street View images which could be used to perform the matching procedures (left images), (ii) many images captured emergency operators’ cars with flashing lights thus reducing their quality (right image), and finally, (iii) many images were taken in motion thus they were quite blurry (bottom image).

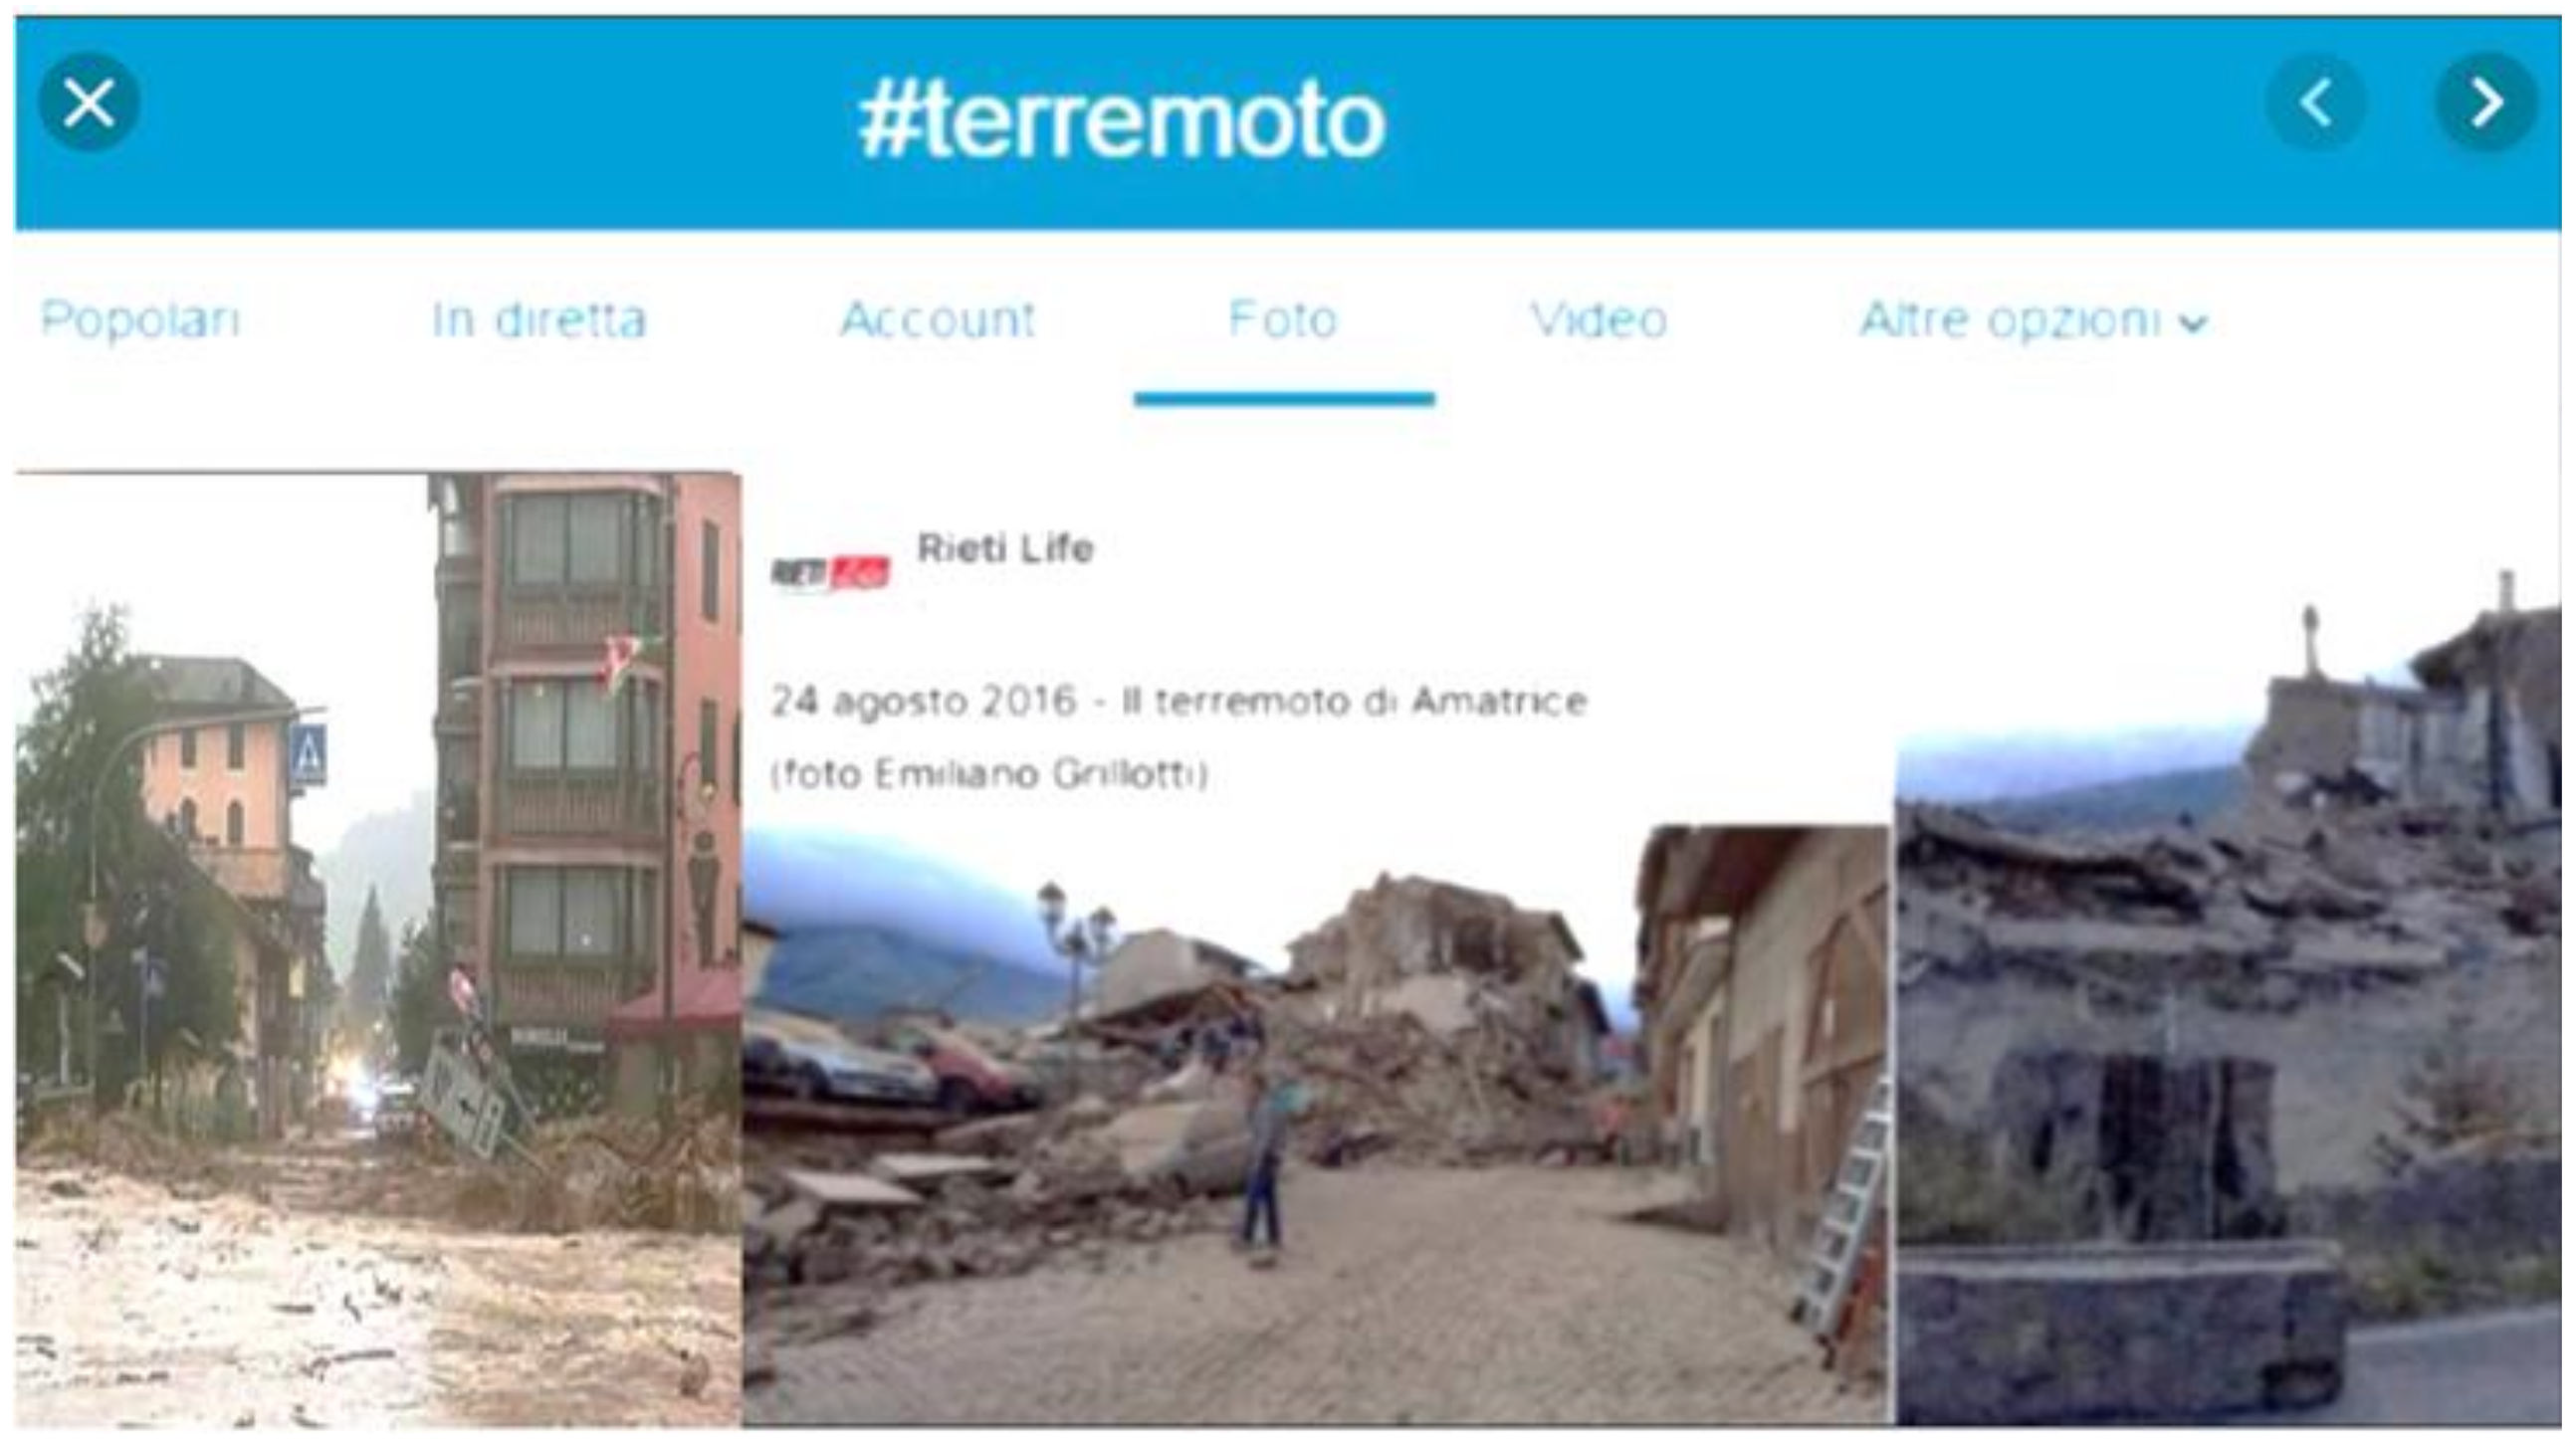
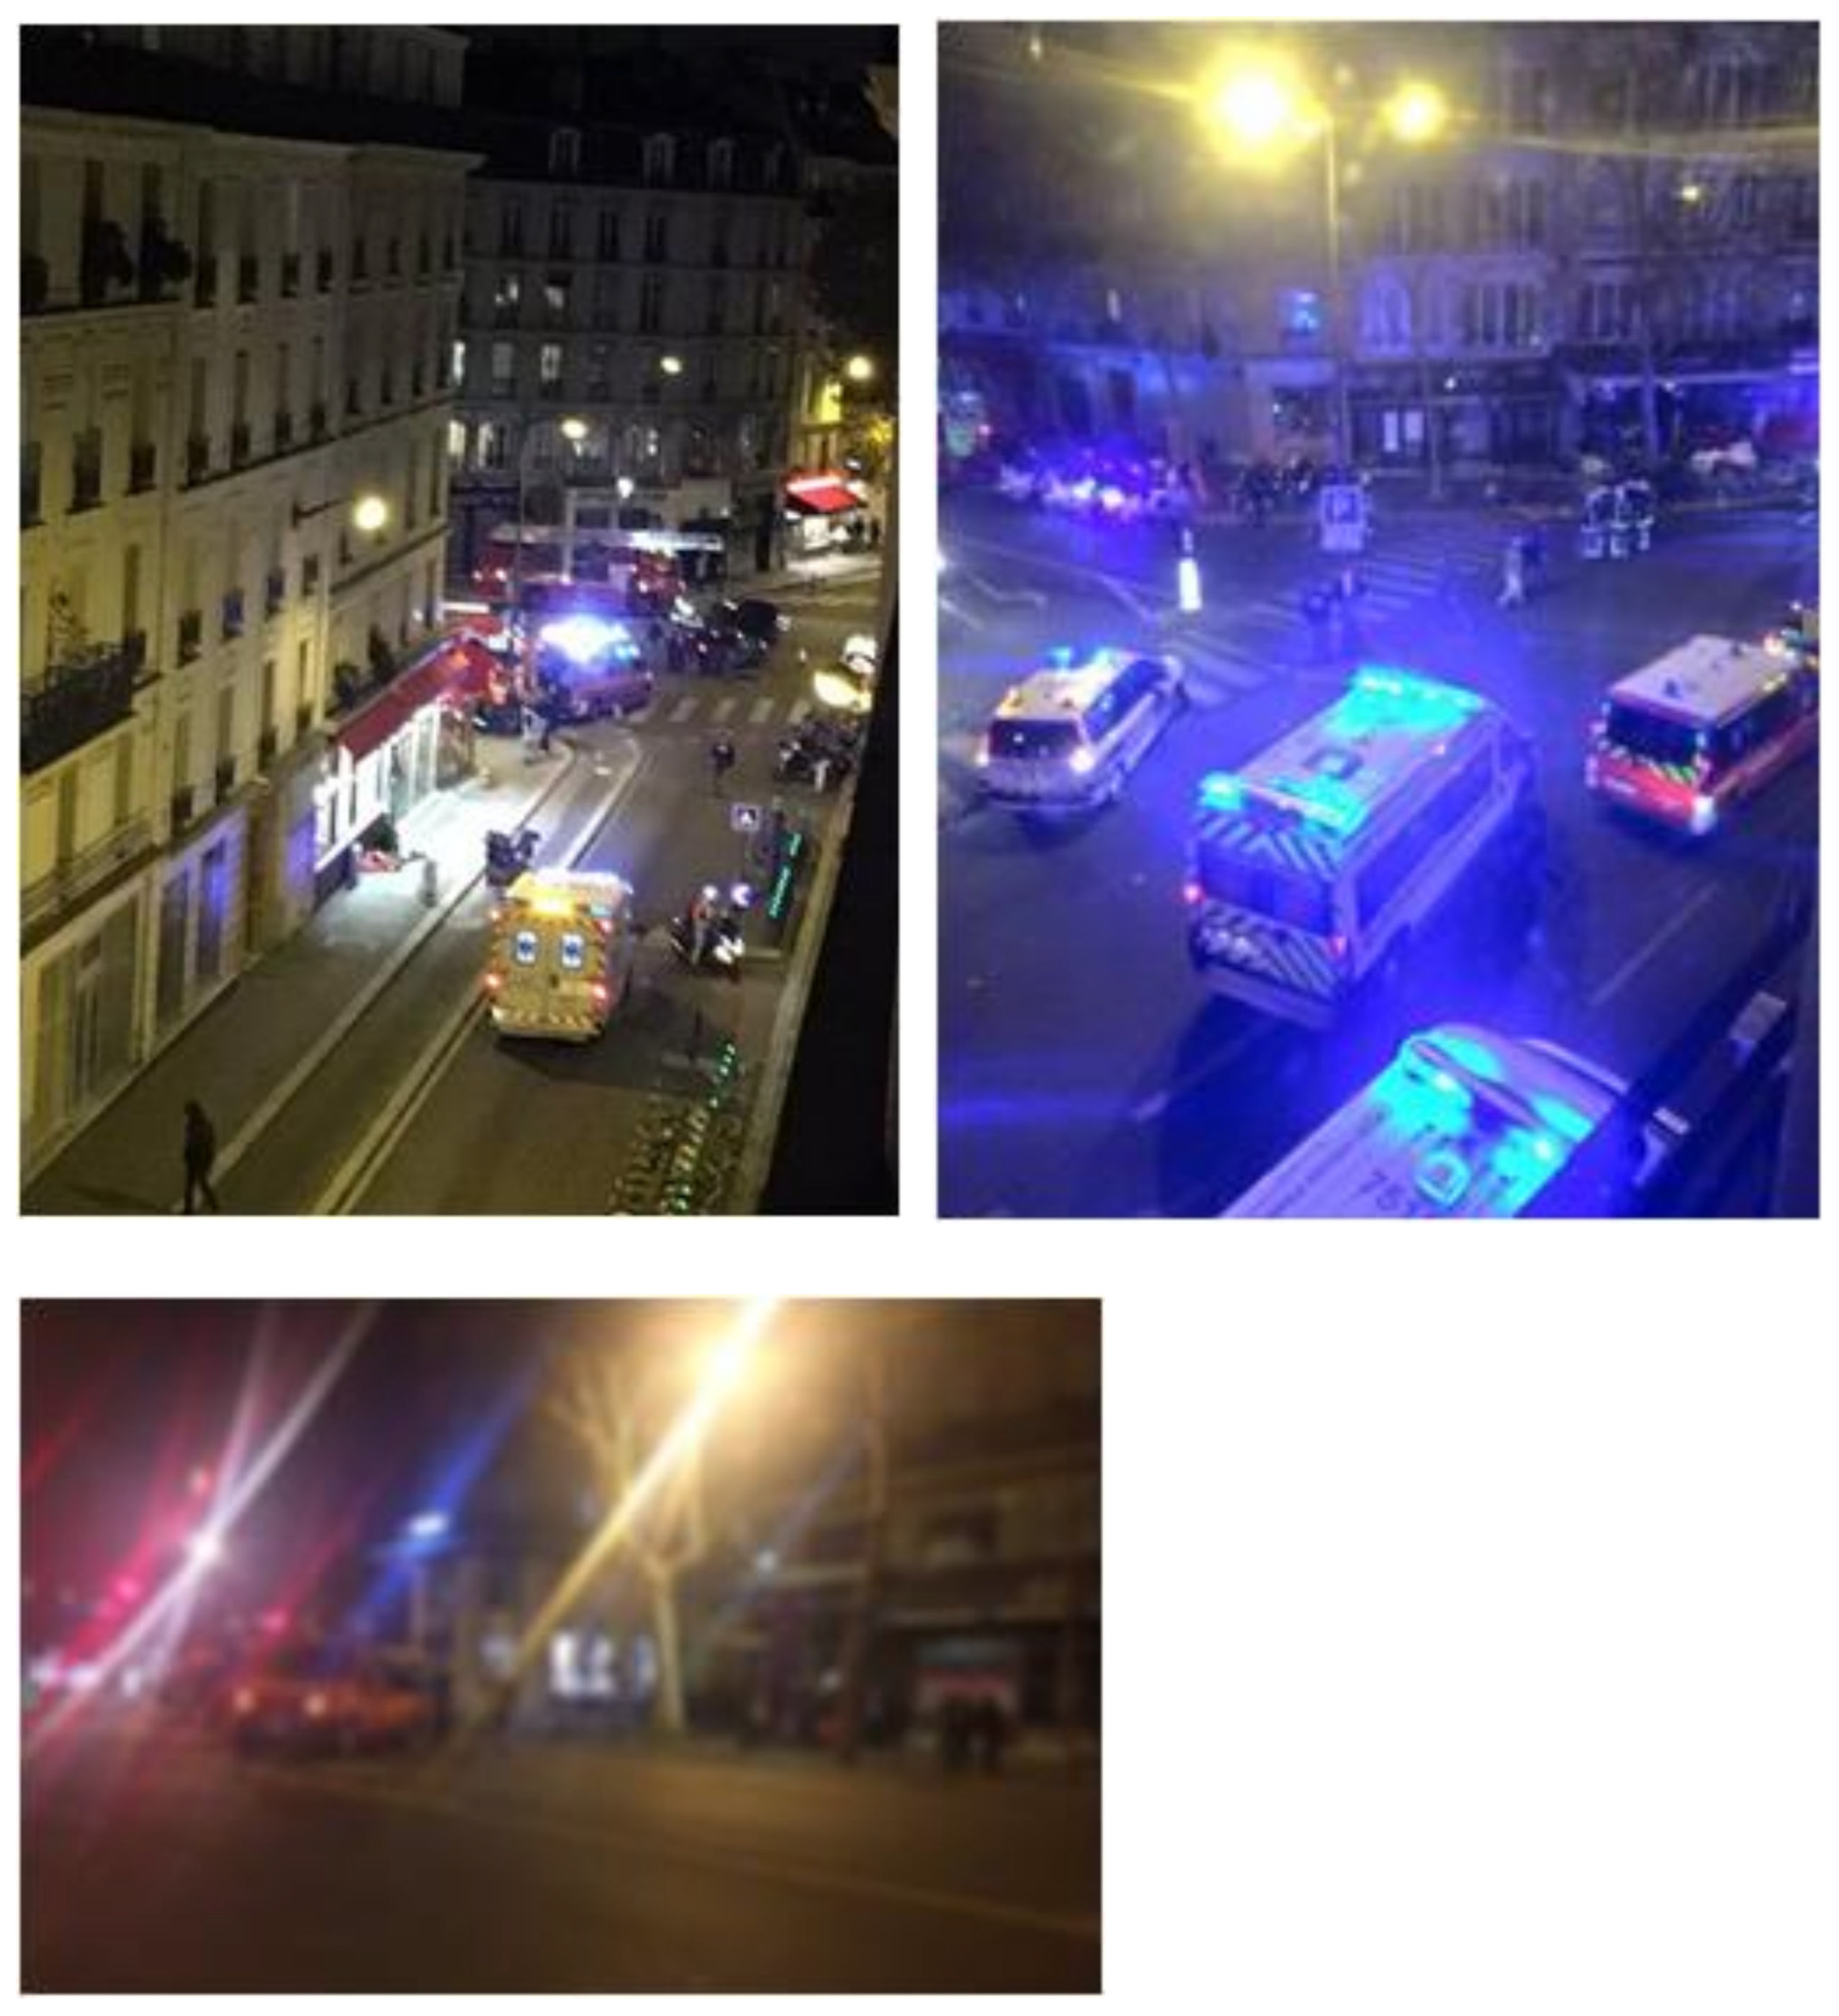
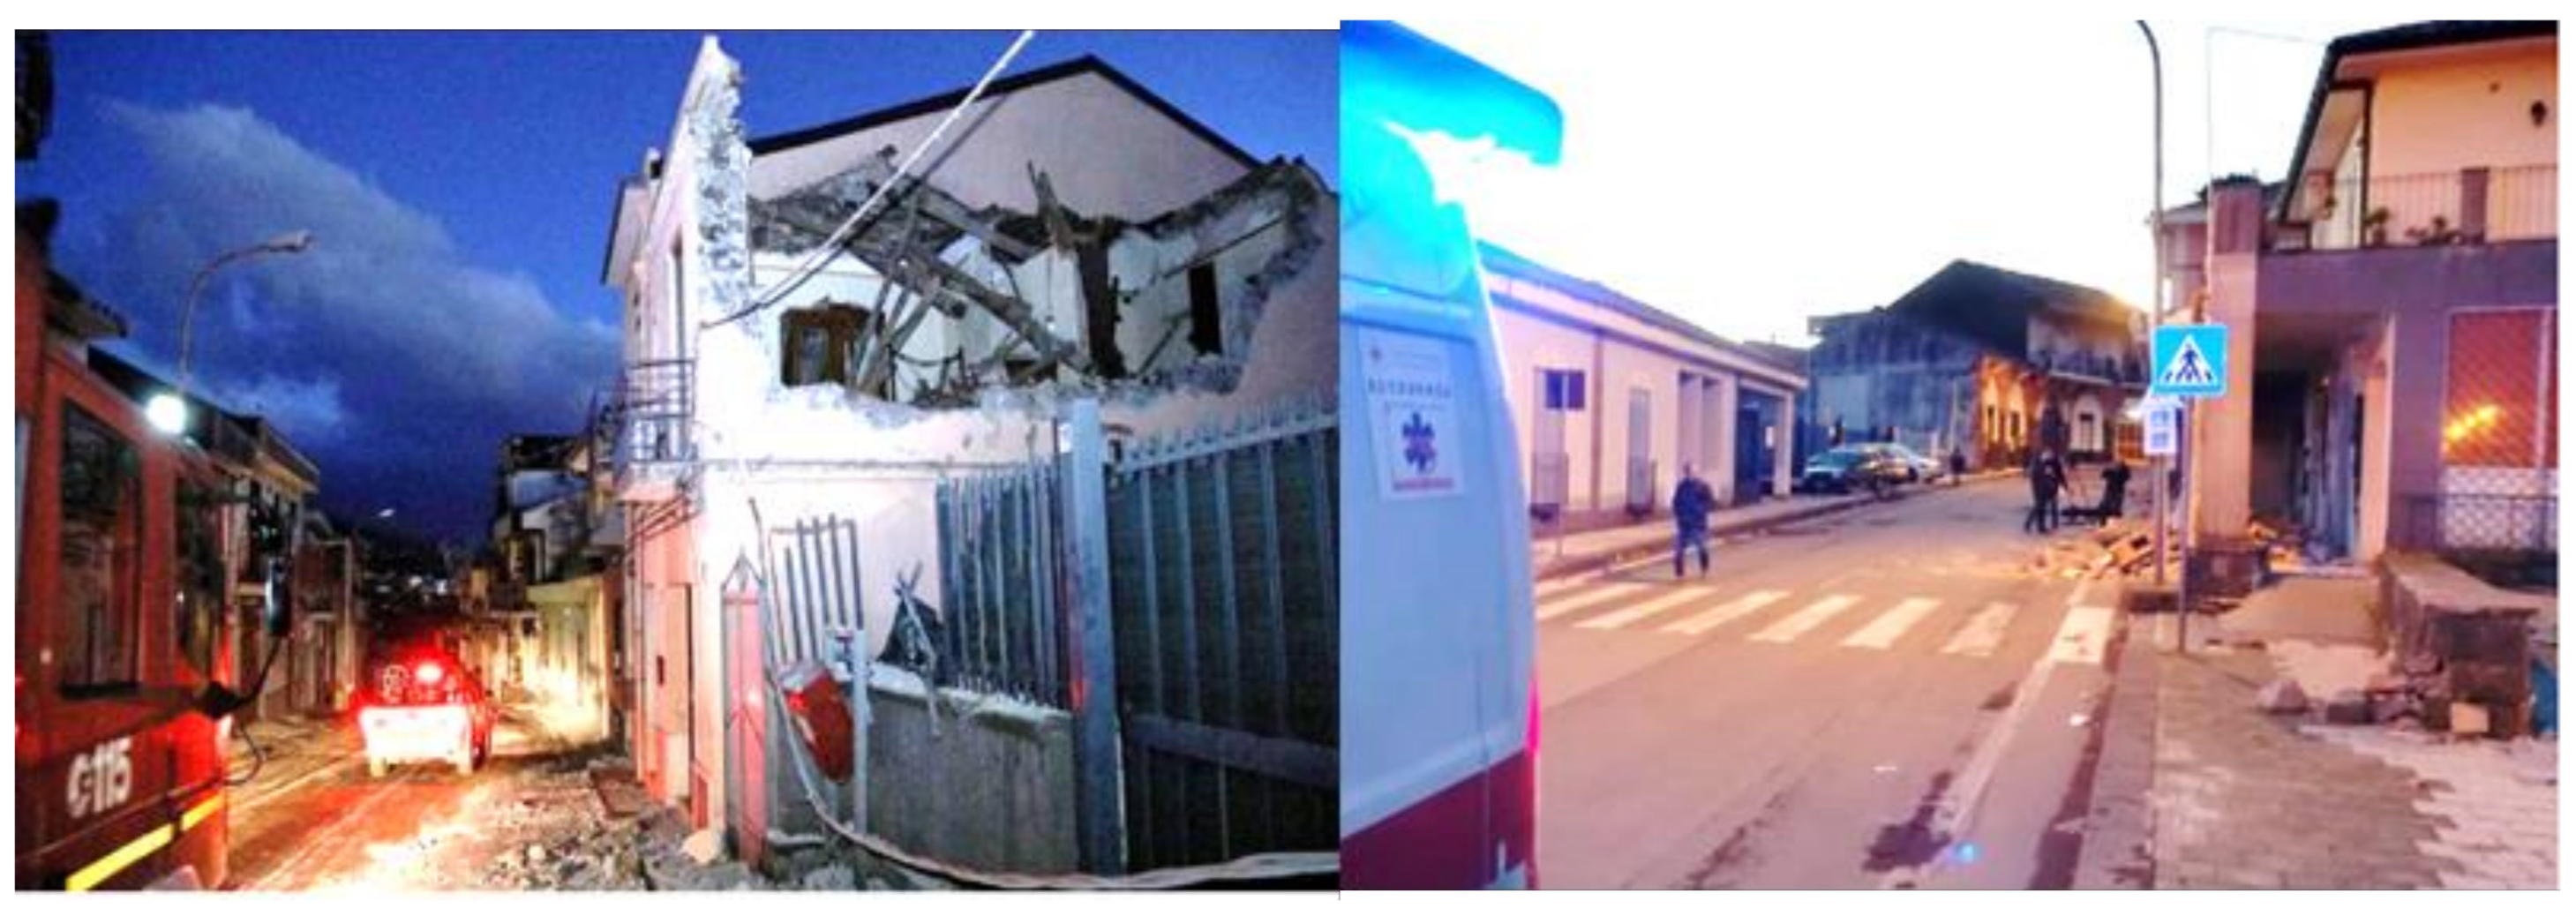
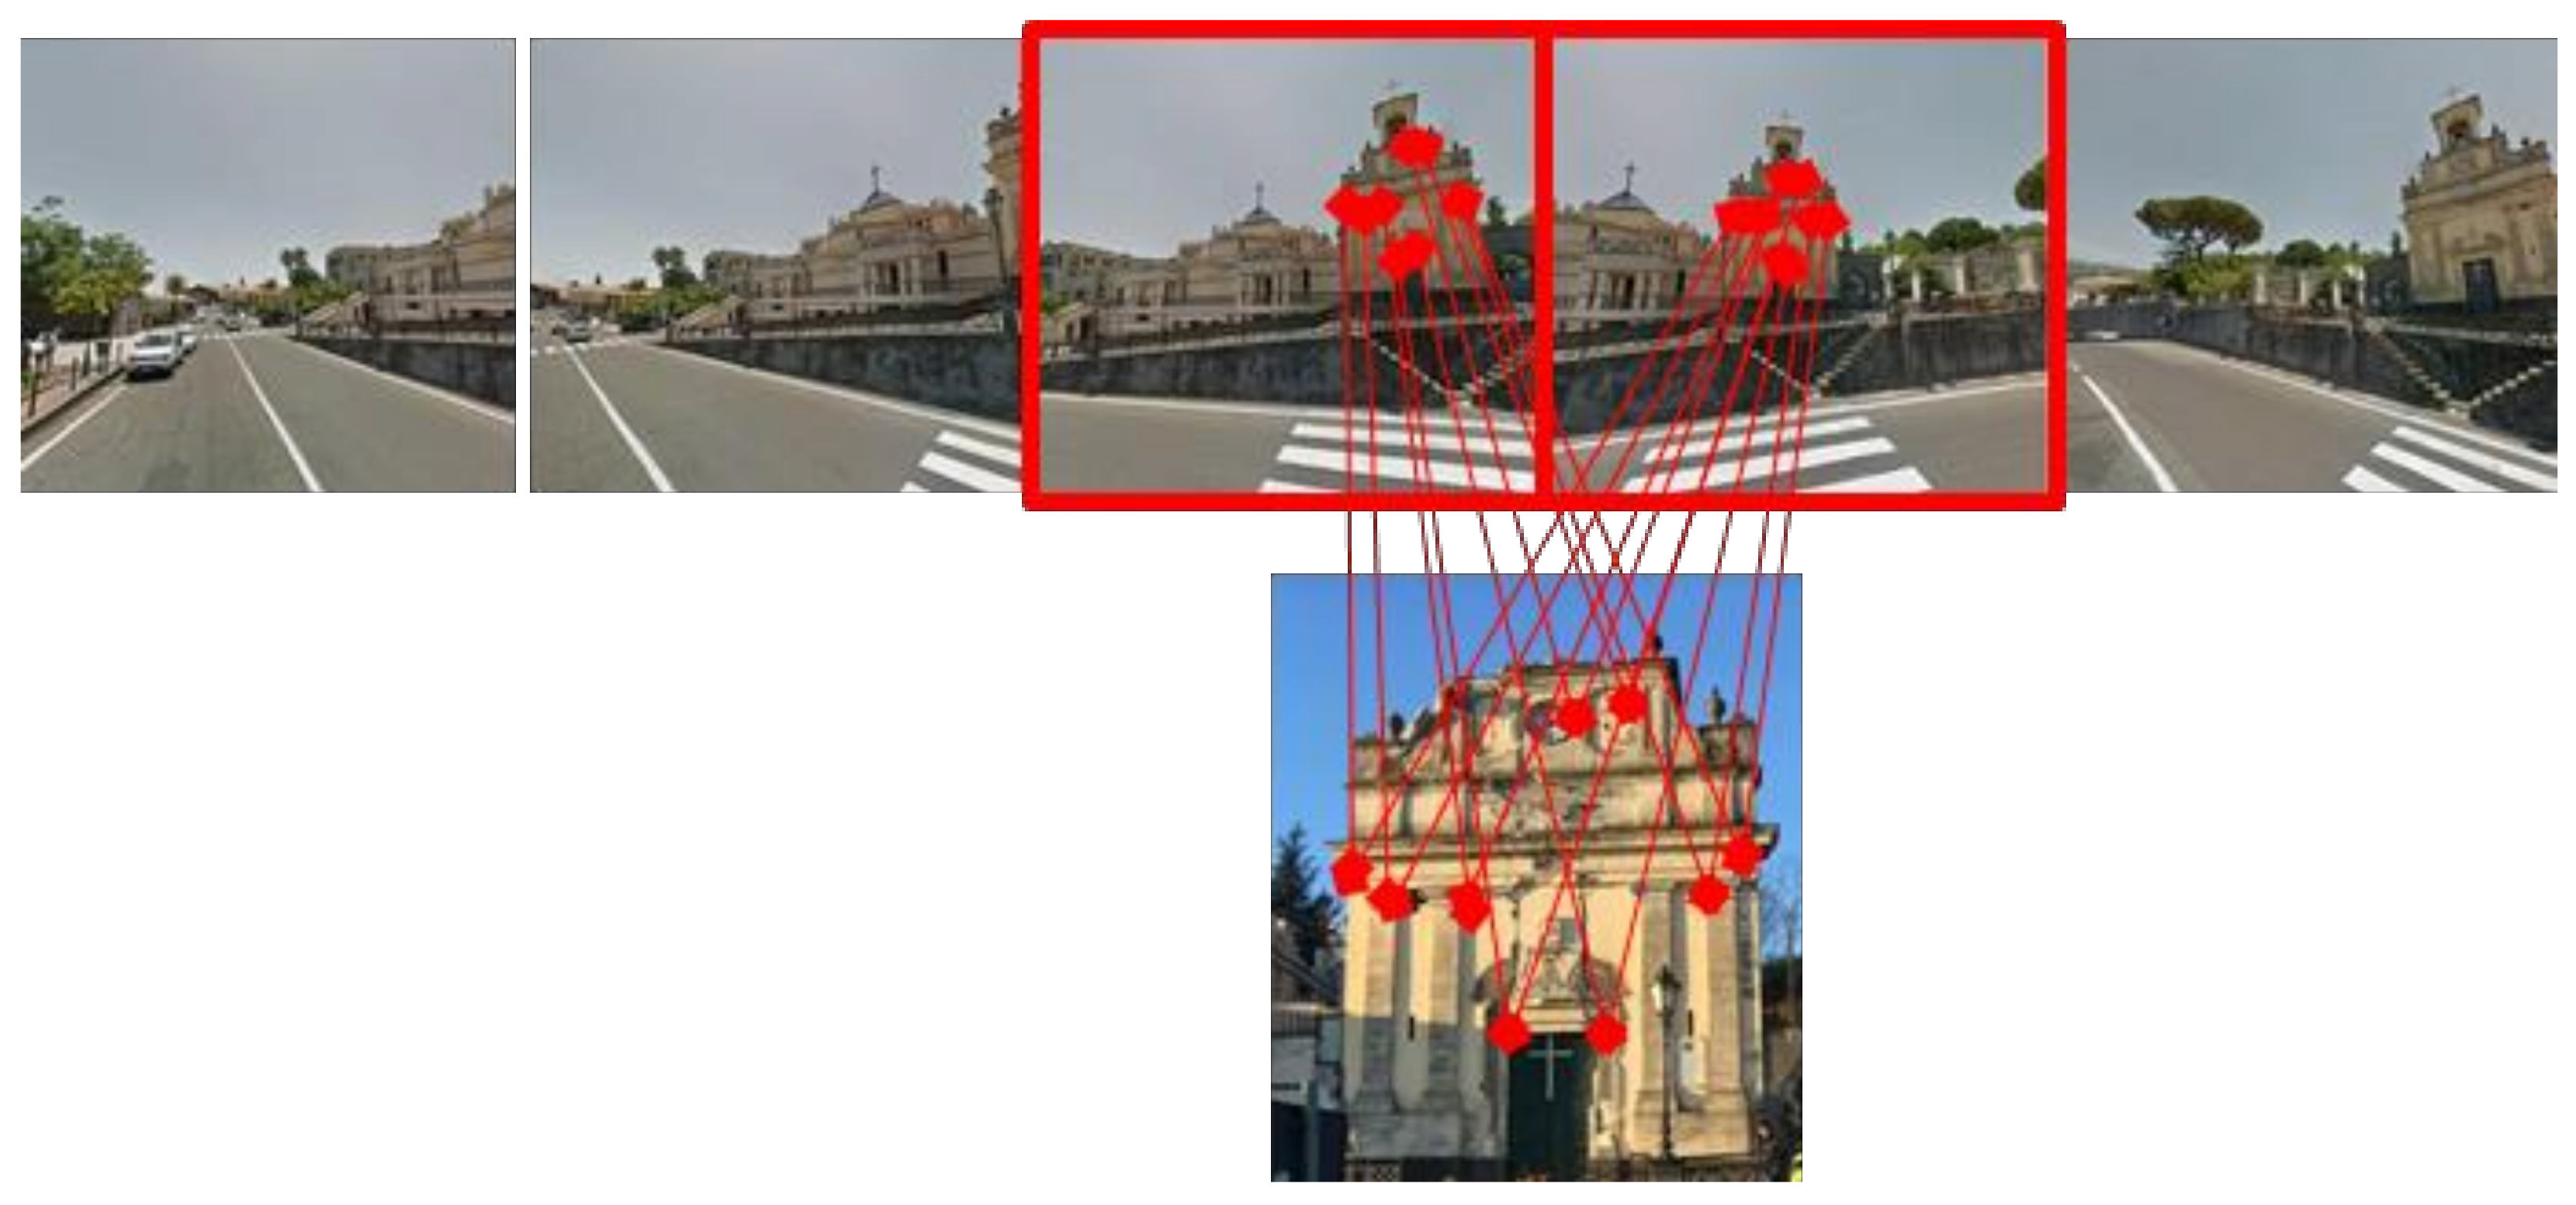
4.3. Running Example

In order to show the capability of the system to manage an earthquake event, a running example is pointed out. Several posts from the Twitter platform recorded during the 2018 Italy earthquake (that hit the areas of south Italy) were used to test the ASMIS system by classifying the disaster event and locating its consequences on a top view map of the area. In Figure 16, some examples of the images shared by users are shown.
During the event, the PDR module extracted several posts containing images. The input of the PDR module was an event pattern P composed of the GPS coordinates of a geographical area of interest (i.e., the area of Fleri, Zafferana Etnea, Catania) and a set of keywords, e.g.,
P = G P S 37 , 39 ,   19 N ;   15 ,   5 ,   52 E ,   10   K m ,   # terremoto
In particular, 2576 posts were collected by the system: 172 posts contained images of which 56 with GPS info. All these images are processed in order to classify them and evaluate if they are meaningful for the event of interest (earthquake). In this regard, each input image is compared with the corresponding image sequence retrieved from Google Street View to verify if it has been really taken from the location it shares. The matching procedure has been able to correctly validate 43 images (about 76%). Of the remaining 13 images, 7 were not found even though they represented areas in the event territory and 6 were correctly discarded as irrelevant to the event.
Figure 17 presents an example of an image collected from the posts (the Church of Fleri, Zafferana Etnea, Catania) and the match with the image sequence of the same location.

4.4. Discussion

Results obtained by testing the system are very promising. A total number of 60 searches were conducted with a total of about 1.135K tweets retrieved. Despite only 38.5% of them being geo-located, the system was able to correctly identify the specific area where a given event is occurring by analyzing only tweets achieved during the first twenty time windows. The time window depends on the type of event and is defined by the operator. Moreover, this behavior can be strictly connected to the type of event analyzed. For example, an earthquake or a terrorist attack could produce a large number of tweets in a reduced interval of time. Conversely, a flood or a hurricane event could spread the tweets over a broader timeframe. An accuracy of about 89% was achieved by analyzing the posts during the terrorist attacks in Paris in 2015, while an accuracy of about 82% was achieved by analyzing the images retrieved on four different emergency situations. This means that about eight images of ten are evaluated as meaningful by the system for each type of event analyzed.
Nevertheless, the system also showed some limitations. The first one is given by the geo-location information (in particular, addresses) attached to each tweet: in many cases they were inaccurate thus not allowing the retrieval of the Google Street View image sequence. In this regard, the retrieved Twitter images were discarded although they could be significant for the given event. These images are maintained in a local database for further inspection by operators. Another limitation is related to the characteristics of the images themselves: the proposed system shows good results when the matching process occurs with images rich in details and with good resolution [49,50]. On the contrary, low-quality images are often discarded. Other constraints are related to the perspective of the images retrieved. For example, if an image is taken from the top of a building, it is very difficult to find similar Street View images with true matches. Another limitation is related to the performance of the image analysis procedure. For each image retrieved from Twitter and the corresponding view retrieved from Street View, the matching procedure provides a feature extraction and a matching process. As previously explained, we performed tests using SIFT and SURF descriptors, while ORB and FAST were discarded since they produce results less accurate. Considering the processing time which includes the features extraction and matching process, SURF performed better than SIFT [38]. On average, SURF allowed the processing of an image in just 100 msec, while SIFT descriptor took about 80% more time [39]. Nevertheless, SIFT performed better in terms of number of matches finding an average of about 50 matches per image. The number decreased to 15 with the SURF descriptor.

5. Conclusions

The outcomes emerging from our test scenario highlight the effectiveness of the ASMIS system and the great opportunities derived from the analysis of the tweets published online by city dwellers during and in the immediate aftermath of extraordinary events, such as earthquakes, floods, terrorist attacks, etc. The results are very promising and demonstrate not only the value of bottom-up communication practices and UGC production, but also the capability of the system of verifying their trust by matching the visual content shared within the tweets with the corresponding images retrieved from Google Street View.
In contrast to other emergency management platforms, ASMIS allows potentially relevant images to be identified and their geo-location validated, if they were taken in a public space, thus enabling citizens involved in the event to play an active role in all phases of the emergency. The data extracted from the Twitter platform and matched with the Google Street View images in fact provide geo-verified information and can be used to coordinate on-site relief and volunteer activities.
ASMIS tries to overcome some of the main barriers (i.e., inaccuracy and unreliability) connected to the use of citizen-generated content for gathering information, enhancing in this way situational awareness and supporting decision-making. In the future, ASMIS could be further developed with the implementation of other kinds of visual data coming from different social platforms and messaging applications in order to allow the entire system to achieve best efficiency. Another possible future improvement of the system could be to try to match the visual content of discharged tweets with pre-defined labeled data sets of the same event class in order to acquire additional info. Then, the classification network can be trained with few-shot learning algorithms able to reduce the complexity of the training process. Furthermore, it is reasonable to suppose that, as people will acquire greater digital skills, they will be able to provide more accurate and detailed content and information, which in turn will ensure greater system reliability and guarantee a more precise intervention.

Author Contributions

Conceptualization, G.L.F., M.F. and M.V.; methodology, G.L.F. and M.V.; software, M.V. and A.F.; validation, M.V. and A.F. All authors have read and agreed to the published version of the manuscript.

Funding

This research received no external funding.

Acknowledgments

This work was supported by the Departmental Strategic Plan (PSD) of the University of Udine—Interdepartmental Project on Artificial Intelligence (2020-25).

Conflicts of Interest

The authors declare no conflict of interest.

References

  1. Blake, J.S. News in a Digital Age: Comparing the Presentation of News Information over Time and Across Media Platforms; Rand Corporation: Santa Monica, CA, USA, 2019. [Google Scholar]
  2. Houston, J.B.; Hawthorne, J.; Perreault, M.; Park, E.H.; Hode, M.G.; Halliwell, M.R.; McGowen, S.E.T.; Davis, R.; Vaid, S.; McElderry, J.A.; et al. Social media and disasters: a functional framework for social media use in disaster planning, response, and research. Disasters 2014, 39, 1–22. [Google Scholar] [CrossRef]
  3. Bruns, A.; Hanusch, F. Conflict imagery in a connective environment: audiovisual content on Twitter following the 2015/2016 terror attacks in Paris and Brussels. Media Cult. Soc. 2017, 39, 1122–1141. [Google Scholar] [CrossRef] [Green Version]
  4. Scifo, S.; Salman, Y. Citizens’ involvement in emergency preparedness and response: A comparative analysis of media strategies and online presence in Turkey, Italy and Germany. Interact. Stud. Commun. Cult. 2015, 6, 179–198. [Google Scholar] [CrossRef] [PubMed] [Green Version]
  5. Farinosi, M.; Treré, E. Challenging mainstream media, documenting real life and sharing with the community: An analysis of the motivations for producing citizen journalism in a post-disaster city. Glob. Media Commun. 2014, 10, 73–92. [Google Scholar] [CrossRef] [Green Version]
  6. Graham, M.; Zook, M.; Boulton, A. Augmented Reality in Urban Places. In Machine Learning and the City: Applications in Architecture and Urban Design; Carta, S., Ed.; Wiley: Hoboken, NJ, USA, 2022; pp. 341–366. [Google Scholar]
  7. Wang, B.; Zhuang, J. Rumor response, debunking response, and decision makings of misinformed Twitter users during disasters. Nat. Hazards 2018, 93, 1145–1162. [Google Scholar] [CrossRef]
  8. Forati, A.M.; Ghose, R. Examining Community Vulnerabilities through multi-scale geospatial analysis of social media activity during Hurricane Irma. Int. J. Disaster Risk Reduct. 2022, 68, 102701. [Google Scholar] [CrossRef]
  9. Alam, F.; Ofli, F.; Imran, M. Descriptive and visual summaries of disaster events using artificial intelligence techniques: case studies of Hurricanes Harvey, Irma, and Maria. Behav. Inf. Technol. 2020, 39, 288–318. [Google Scholar] [CrossRef]
  10. Lopez-Fuentes, L.; van de Weijer, J.; González-Hidalgo, M.; Skinnemoen, H.; Bagdanov, A.D. Review on computer vision techniques in emergency situations. Multimed. Tools Appl. 2018, 77, 17069–17107. [Google Scholar] [CrossRef] [Green Version]
  11. Elmhadhbi, L.; Karray, M.H.; Archimède, B.; Otte, J.N.; Smith, B. An Ontological Approach to Enhancing Information Sharing in Disaster Response. Information 2021, 12, 432. [Google Scholar] [CrossRef]
  12. Iglesias, C.; Favenza, A.; Carrera, A. A Big Data Reference Architecture for Emergency Management. Information 2020, 11, 569. [Google Scholar] [CrossRef]
  13. Reuter, A.C.; Kaufhold, M.A. Fifteen years of social media in emergencies: A retrospective review and future directions for crisis informatics. J. Contingencies Crisis Manag. 2018, 26, 41–57. [Google Scholar] [CrossRef] [Green Version]
  14. Kaufhold, M.A.; Bayer, M.; Reuter, C. Rapid relevance classification of social media posts in disasters and emergencies: A system and evaluation featuring active, incremental and online learning. Inf. Process. Manag. 2020, 57, 102–132. [Google Scholar] [CrossRef]
  15. Kaufhold, M.A.; Rupp, N.; Reuter, C.; Habdank, M. Mitigating information overload in social media during conflicts and crises: design and evaluation of a cross-platform alerting system. Behav. Inf. Technol. 2020, 39, 319–342. [Google Scholar] [CrossRef]
  16. Foresti, G.L.; Farinosi, M.; Vernier, M. Situational awareness in smart environments: socio-mobile and sensor data fusion for emergency response to disasters. J. Ambient. Intell. Humaniz. Comput. 2015, 6, 239–257. [Google Scholar] [CrossRef]
  17. Martínez-Rojas, M.; Pardo-Ferreira, M.D.C.; Rubio-Romero, J.C. Twitter as a tool for the management and analysis of emergency situations: A systematic literature review. Int. J. Inf. Manag. 2018, 43, 196–208. [Google Scholar] [CrossRef]
  18. Simon, T.; Goldberg, A.; Adini, B. Socializing in emergencies—A review of the use of social media in emergency situations. Int. J. Inf. Manag. 2015, 35, 609–619. [Google Scholar] [CrossRef] [Green Version]
  19. Rudra, K.; Ganguly, N.; Goyal, P.; Ghosh, S. Extracting and Summarizing Situational Information from the Twitter Social Media during Disasters. ACM Trans. Web 2018, 12, 1–35. [Google Scholar] [CrossRef]
  20. Boersma, K.; Diks, D.; Ferguson, J.; Wolbers, J. From reactive to proactive use of social media in emergency response: A critical discussion of the Twitcident Project. In Emergency and Disaster Management: Concepts, Methodologies, Tools, and Applications; Information Resources Management Association, Ed.; IGI Global: Hershey, PA, USA, 2019; pp. 602–618. [Google Scholar]
  21. Robinson, B.; Power, R.; Cameron, M. A Sensitive Twitter Earthquake Detector. In Proceedings of the 22nd International Conference on World Wide Web, Rio de Janeiro, Brazil, 13–17 May 2013; pp. 999–1002. [Google Scholar]
  22. Havas, C.; Resch, B.; Francalanci, C.; Pernici, B.; Scalia, G.; Fernandez-Marquez, J.L.; Van Achte, T.; Zeug, G.; Mondardini, M.R.; Grandoni, D.; et al. E2mC: Improving Emergency Management Service Practice through Social Media and Crowdsourcing Analysis in Near Real Time. Sensors 2017, 17, 2766. [Google Scholar] [CrossRef] [PubMed] [Green Version]
  23. Yin, J.; Karimi, S.; Robinson, B.; Cameron, M. ESA: Emergency Situation Awareness via Microbloggers. In Proceedings of the International Conference on Information and Knowledge Management (CIKM), Maui, HI, USA, 29 October–2 November 2012. [Google Scholar]
  24. Schulz, A.; Ristoski, P.; Paulheim, H. I See a Car Crash: Real-time Detection of Small Scale Incidents in Microblogs. In Proceedings of the International Conference on Social Media and Linked Data for Emergency Response (SMILE), Montpellier, France, 26–30 May 2013. [Google Scholar]
  25. Alam, F.; Imran, M.; Ofli, F. Online Social Media Image Processing Using AIDR 2.0: Artificial Intelligence for Digital Response. In Proceedings of the IEEE Conference on Computer Vision and Pattern Recognition (CVPR), Honolulu, HI, USA, 21–26 July 2017. [Google Scholar]
  26. Lagerstrom, R.; Arzhaeva, Y.; Szul, P.; Obst, O.; Power, R.; Robinson, B.; Bednarz, T. Image Classification to Support Emergency Situation Awareness. Front. Robot. AI 2016, 3, 54. [Google Scholar] [CrossRef] [Green Version]
  27. Kumar, A.; Singh, J.P.; Dwivedi, Y.K.; Rana, N.P. A deep multi-modal neural network for informative Twitter content classification during emergencies. Ann. Oper. Res. 2020, 319, 791–822. [Google Scholar] [CrossRef]
  28. Johnson, M.; Murthy, D.; Roberstson, B.; Smith, R.; Stephens, K. DisasterNet: Evaluating the Performance of Transfer Learning to Classify Hurricane-Related Images Posted on Twitter. In Proceedings of the Hawaii International Conference on System Sciences, Maui, HI, USA, 7–10 January 2020. [Google Scholar] [CrossRef]
  29. Ogie, R.I.; James, S.; Moore, A.; Dilworth, T.; Amirghasemi, M.; Whittaker, J. Social media use in disaster recovery: A systematic literature review. Int. J. Dis. Risk Reduct. 2022, 70, 102783. [Google Scholar] [CrossRef]
  30. Poorazizi, M.E.; Hunter, A.J.; Steiniger, S. A Volunteered Geographic Information Framework to Enable Bottom-Up Disaster Management Platforms. ISPRS Int. J. Geo-Inf. 2015, 4, 1389–1422. [Google Scholar] [CrossRef] [Green Version]
  31. McKitrick, M.K.; Schuurman, N.; Crooks, V.A. Collecting, analyzing, and visualizing location-based social media data: review of methods in GIS-social media analysis. Geojournal 2022, 88, 1035–1057. [Google Scholar] [CrossRef]
  32. Zhang, H.; Pan, J. CASM: A Deep-Learning Approach for Identifying Collective Action Events with Text and Image Data from Social Media. Sociol. Methodol. 2019, 49, 1–57. [Google Scholar] [CrossRef]
  33. Shriya, G.; Raychaudhuri, D. Identification of Disaster-Related Tweets Using Natural Language Processing. In Proceedings of the International Conference on Recent Trends in Artificial Intelligence, IOT, Smart Cities & Applications (ICAISC-2020), Hyderabad, India, 26 May 2020. [Google Scholar]
  34. Kabir, Y.; Madria, S. A Deep Learning Approach for Tweet Classification and Rescue Scheduling for Effective Disaster Management. In Proceedings of the 27th ACM International Conference on Advances in Geographic Information Systems (SIGSPATIAL), Chicago, IL, USA, 5–8 November 2019; pp. 269–278. [Google Scholar] [CrossRef] [Green Version]
  35. Thomas, C.; McCreadie, R.; Ounis, I. Event tracker: A text analytics platform for use during disasters. In Proceedings of the 42nd International ACM SIGIR Conference on Research and Development Information Retrieval, Paris, France, 21–25 July 2019; pp. 1341–1344. [Google Scholar]
  36. Liu, W.; Anguelov, D.; Erhan, D.; Szegedy, C.; Reed, S.; Fu, C.Y.; Berg, A.C. SSD: Single shot multibox detector. In Proceedings of the 14th European Conference on Computer Vision (ECCV), Amsterdam, The Netherlands, 8–16 October 2017; pp. 21–37. [Google Scholar]
  37. Lowe, D.G. Distinctive Image Features from Scale-Invariant Keypoints. Int. J. Comput. Vis. 2004, 60, 91–110. [Google Scholar] [CrossRef]
  38. Bay, H.; Tuytelaars, T.; Van Gool, L. Surf: Speeded up robust features. In Proceedings of the European Conference on Computer Vision (ECCV), Graz, Austria, 7–13 May 2006; pp. 404–417. [Google Scholar]
  39. Calonder, M.; Lepetit, V.; Strecha, C.; Fua, P. BRIEF: Binary robust independent elementary features. In Proceedings of the 11th European Conference on Computer Vision (ECCV), Heraklion, Greece, 5–11 September 2010; pp. 778–792. [Google Scholar]
  40. Rublee, E.; Rabaud, V.; Konolige, K.; Bradski, G.R. ORB: An efficient alternative to SIFT or SURF. In Proceedings of the 13th International Conference on Computer Vision (ICCV), Barcelona, Spain, 6–13 November 2011. [Google Scholar]
  41. Neo4j, Official Website. The World’s Leading Graph Database (2017). Available online: https://neo4j.com/ (accessed on 2 January 2023).
  42. Liu, W.; Anguelov, D.; Erhan, D.; Szegedy, C.; Reed, S.; Fu, C.Y.; Berg, A.C. Ssd: Single shot multibox detector. In Proceedings of the European Conference on Computer Vision (ECCV), Amsterdam, The Netherlands, 11–14 October 2016; pp. 21–37S. [Google Scholar]
  43. Setiawan, W.; Utoyo, M.I.; Rulaningtyas, R. Reconfiguration layers of convolutional neural network for fundus patches classification. Bull. Electr. Eng. Inform. 2021, 10, 383–389. [Google Scholar] [CrossRef]
  44. Ofli, F.; Alam, F.; Imran, M. Analysis of Social Media Data using Multimodal Deep Learning for Disaster Response. In Proceedings of the 17th International Conference on Information Systems for Crisis Response and Management (ISCRAM), Blacksburg, VI, USA, 23 May 2020. [Google Scholar]
  45. Padilha, R.; Salem, T.; Workman, S.; Andalo, F.A.; Rocha, A.; Jacobs, N. Content-Aware Detection of Temporal Metadata Manipulation. IEEE Trans. Inf. Forensics Secur. 2022, 17, 1316–1327. [Google Scholar] [CrossRef]
  46. Barath, D.; Cavalli, L.; Pollefeys, M. Learning to Find Good Models in RANSAC. In Proceedings of the IEEE Conference on Computer Vision and Pattern Recognition, New Orleans, LA, USA, 19–24 June 2022; pp. 15744–15753. [Google Scholar]
  47. Micheloni, C.; Rani, A.; Kumar, S.; Foresti, G.L. A balanced neural tree for pattern classification. Neural Netw. 2012, 27, 81–90. [Google Scholar] [CrossRef]
  48. Abpeykar, S.; Ghatee, M.; Foresti, G.L.; Micheloni, C. An Advanced Neural Tree Exploiting Expert Nodes to Classify High-Dimensional Data. Neural Netw. 2020, 124, 20–38. [Google Scholar] [CrossRef] [PubMed]
  49. Piciarelli, C.; Avola, D.; Pannone, D.; Foresti, G.L. A Vision-Based System for Internal Pipeline Inspection. IEEE Trans. Ind. Informa. 2018, 15, 3289–3299. [Google Scholar] [CrossRef]
  50. Boinee, P.; De Angelis, A.; Foresti, G.L. Meta Random Forests. Int. J. Comput. Intell. 2005, 3, 138–147. [Google Scholar]
Figure 1. General overview of the ASMIS system for automatic analysis of visual content shared by users on Twitter during emergency events.
Information 14 00078 g001
Figure 2. Logical architecture of the ASMIS system for automatic analysis of visual content shared by users on Twitter, including the PDR (Post Data Retriever) module and the IDA (Image Data Analyzer) module.
Information 14 00078 g002
Figure 3. Logical architecture of the PDR module.
Information 14 00078 g003
Figure 4. Example of a rectangular geographical region used by the Twitter social platform and the proposed circular interesting region.
Information 14 00078 g004
Figure 5. Logical architecture of the IDA module with the two main sub-modules: the Image Classifier and the Image Geo-validation.
Information 14 00078 g005
Figure 6. The Single Shot Multibox Detector (SSD) network used for event class detection.
Information 14 00078 g006
Figure 7. The Single-Shot Multibox Detector (SSD) network used for event type classification [37].
Information 14 00078 g007
Figure 8. Three different images retrieved from Twitter during the Italian earthquake in 2016 (#terremoto means # earthquake).
Information 14 00078 g008
Figure 9. Logical architecture of the Image Geo-validation submodule. It identifies if an image is retrieved from a true location belongs to the monitored event.
Information 14 00078 g009
Figure 10. The Sequence Image Generator creates a sequence of images acquired with different field of views around the interesting location by extracting frames from Google Street View.
Information 14 00078 g010
Figure 11. An example of the matching procedure between the image posted by the user and the image sequence extracted from Street View.
Information 14 00078 g011
Figure 12. Examples of SIFT and SURF keypoint matching on images posted by users. (a,b) SIFT finds 26 correct matches and SURF finds 3 correct matches and one wrong, (c,d) SIFT finds 23 correct matches and SURF finds 4 correct matches, (e,f) SIFT finds 27 correct matches and SURF finds 4 correct matches.
Information 14 00078 g012
Figure 13. Some examples of images retrieved on Twitter during terrorist attacks occurring in Paris (2015) and the corresponding images retrieved from Google Street View. The red X indicates that the ASMIS system was unable to find a correct match.
Information 14 00078 g013
Figure 14. Results obtained by matching the images using (a) SIFT and (b) SURF descriptors. Green bars represent true matches while red bars represent false matches (discharged images).
Information 14 00078 g014
Figure 15. An example of images retrieved from Twitter during terrorists’ attacks which have not been correctly matched by the ASMIS system due to low quality.
Information 14 00078 g015
Figure 16. Some examples of images posted on the Twitter platform during the 2018 Italy earthquake in Catania area, Sicily.
Information 14 00078 g016
Figure 17. Result of the matching procedure applied to the image posted by the user and the image sequence extracted from Street View.
Information 14 00078 g017
Table 1. General overview of results obtained by testing the system with 60 searches.
Total Number of SearchesTotal Number of TweetsTotal Number of GL TweetsTotal Number of ImagesTotal Number of GL Images
601135K437K129K83K
Table 2. Description of the considered events and the related parameters. First column indicates the name of the event, the second and third columns indicate, respectively, the location and the geographical areas, the fourth column the search time in hours, and the fifth and sixth columns indicate, respectively, the number of collected tweets containing images and the number of geo-located tweets with images.
Event TypeLocationGeographical AreaSearch
Time (Hour)
Number of TweetsGeolocated Tweets
FloodFrance RivieraFrance3625,2255411
ClashMilanItaly2496358421
Terrorist
attack
ParisFrance3699,93291,526
HurricaneMexicoMexico2432,4563256
Disclaimer/Publisher’s Note: The statements, opinions and data contained in all publications are solely those of the individual author(s) and contributor(s) and not of MDPI and/or the editor(s). MDPI and/or the editor(s) disclaim responsibility for any injury to people or property resulting from any ideas, methods, instructions or products referred to in the content.

