Article

CSK-CNN: Network Intrusion Detection Model Based on Two-Layer Convolution Neural Network for Handling Imbalanced Dataset

1
Institute of Cloud Computing and Big Data, China Academy of Information and Communications Technology, Beijing 100191, China
2
School of Electronic Engineering, Beijing University of Posts and Telecommunications, Beijing 100876, China
3
School of Computer Science, Beijing University of Posts and Telecommunications, Beijing 100876, China
*
Author to whom correspondence should be addressed.
Information 2023, 14(2), 130; https://doi.org/10.3390/info14020130
Submission received: 27 December 2022 / Revised: 2 February 2023 / Accepted: 13 February 2023 / Published: 16 February 2023
(This article belongs to the Special Issue Advances in Computing, Communication & Security)

Abstract

:
In computer networks, Network Intrusion Detection System (NIDS) plays a very important role in identifying intrusion behaviors. NIDS can identify abnormal behaviors by analyzing network traffic. However, the performance of classifier is not very good in identifying abnormal traffic for minority classes. In order to improve the detection rate on class imbalanced dataset, we propose a network intrusion detection model based on two-layer CNN and Cluster-SMOTE + K-means algorithm (CSK-CNN) to process imbalanced dataset. CSK combines the cluster based Synthetic Minority Over Sampling Technique (Cluster-SMOTE) and K-means based under sampling algorithm. Through the two-layer network, abnormal traffic can not only be identified, but also be classified into specific attack types. This paper has been verified on UNSW-NB15 dataset and CICIDS2017 dataset, and the performance of the proposed model has been evaluated using such indicators as accuracy, recall, precision, F1-score, ROC curve, AUC value, training time and testing time. The experiment shows that the proposed CSK-CNN in this paper is obviously superior to other comparison algorithms in terms of network intrusion detection performance, and is suitable for deployment in the real network environment.

1. Introduction

With the rapid development of computer network, human beings increasingly rely on the network to process information such as work, study and life. Network security has become particularly important [1,2]. As a proactive security protection technology, intrusion detection has attracted more and more scholars’ attention and research. Honey pot blocks the attacker from the network with knowing the information analysis to block the intruder [3]. According to the different sources of analysis data, intrusion detection system(IDS) can be divided into host-based IDS (HIDS) and network-based IDS (NIDS).
HIDS mainly protects the host by monitoring logs and system calls, while NIDS protects network devices by analyzing the communications that occur on network devices. At present, NIDS is the most widely used, mainly including rule-based misuse detection (MIDS) and statistics-based anomaly detection (AIDS). The former identifies abnormal behavior by matching existing attack rules. This method can accurately identify known attacks, but cannot detect new network attacks. The latter can identify by detecting the characteristics of network flow or the distribution deviating from normal behavior, which is helpful to identify unknown intrusions. The proposed CSK-CNN in this paper using two-layer CNN and Cluster-SMOTE + K-means to process imbalanced data (CSK-CNN) to realize network intrusion detection is an anomaly detection algorithm based on statistics.
Machine learning algorithms are widely used in statistical network anomaly detection. Machine learning algorithms, such as support vector machine (SVM) [4], K-means [5], XGBoost [6], random forest (RF) [7], distinguish between normal and abnormal network behaviors through feature engineering. However, with the increase of network anomaly intrusion types and data volume, traditional machine learning algorithms, as shallow learning methods, are difficult to capture important information, have weak generalization ability, and are not suitable for network intrusion detection with large amounts of data.
In recent years, deep learning algorithms that can fully mine and extract potential features between data have attracted attention. Deep learning models, including Convolutional neural networks (CNN) [8], Recurrent neural networks (RNN) [9], and Long short term memory (LSTM) [10], have been applied to network intrusion detection, and experiments show that they have good performance on large datasets.
However, network intrusion detection still has some problems. For example, it generally performs well in distinguishing between normal and abnormal network behaviors, but it does not perform well in detecting specific attack types. In addition, the performance in the classification of imbalanced datasets is not good, and the detection rate drops significantly on small type datasets. Therefore, this paper focuses on solving the multi classification problem of imbalanced datasets in large-scale network intrusion detection.
The datasets with obviously uneven distribution of different classes of samples are called imbalanced datasets. Among them, the class with a large number of samples is called majority class, on the contrary called minority class. In the real network world, due to the uneven distribution of normal samples and abnormal samples, the classification of network traffic is essentially an imbalanced classification problem. At present, there are four main methods to deal with imbalanced datasets, including data core method, algorithm core method, cost sensitive method and integration method. In this paper, we use data core method to solve the problem of imbalanced data in network intrusion detection. This method is realized by adding or reducing datasets of different categories in imbalanced data.
The main contributions of this paper are summarized as follows:
(1)
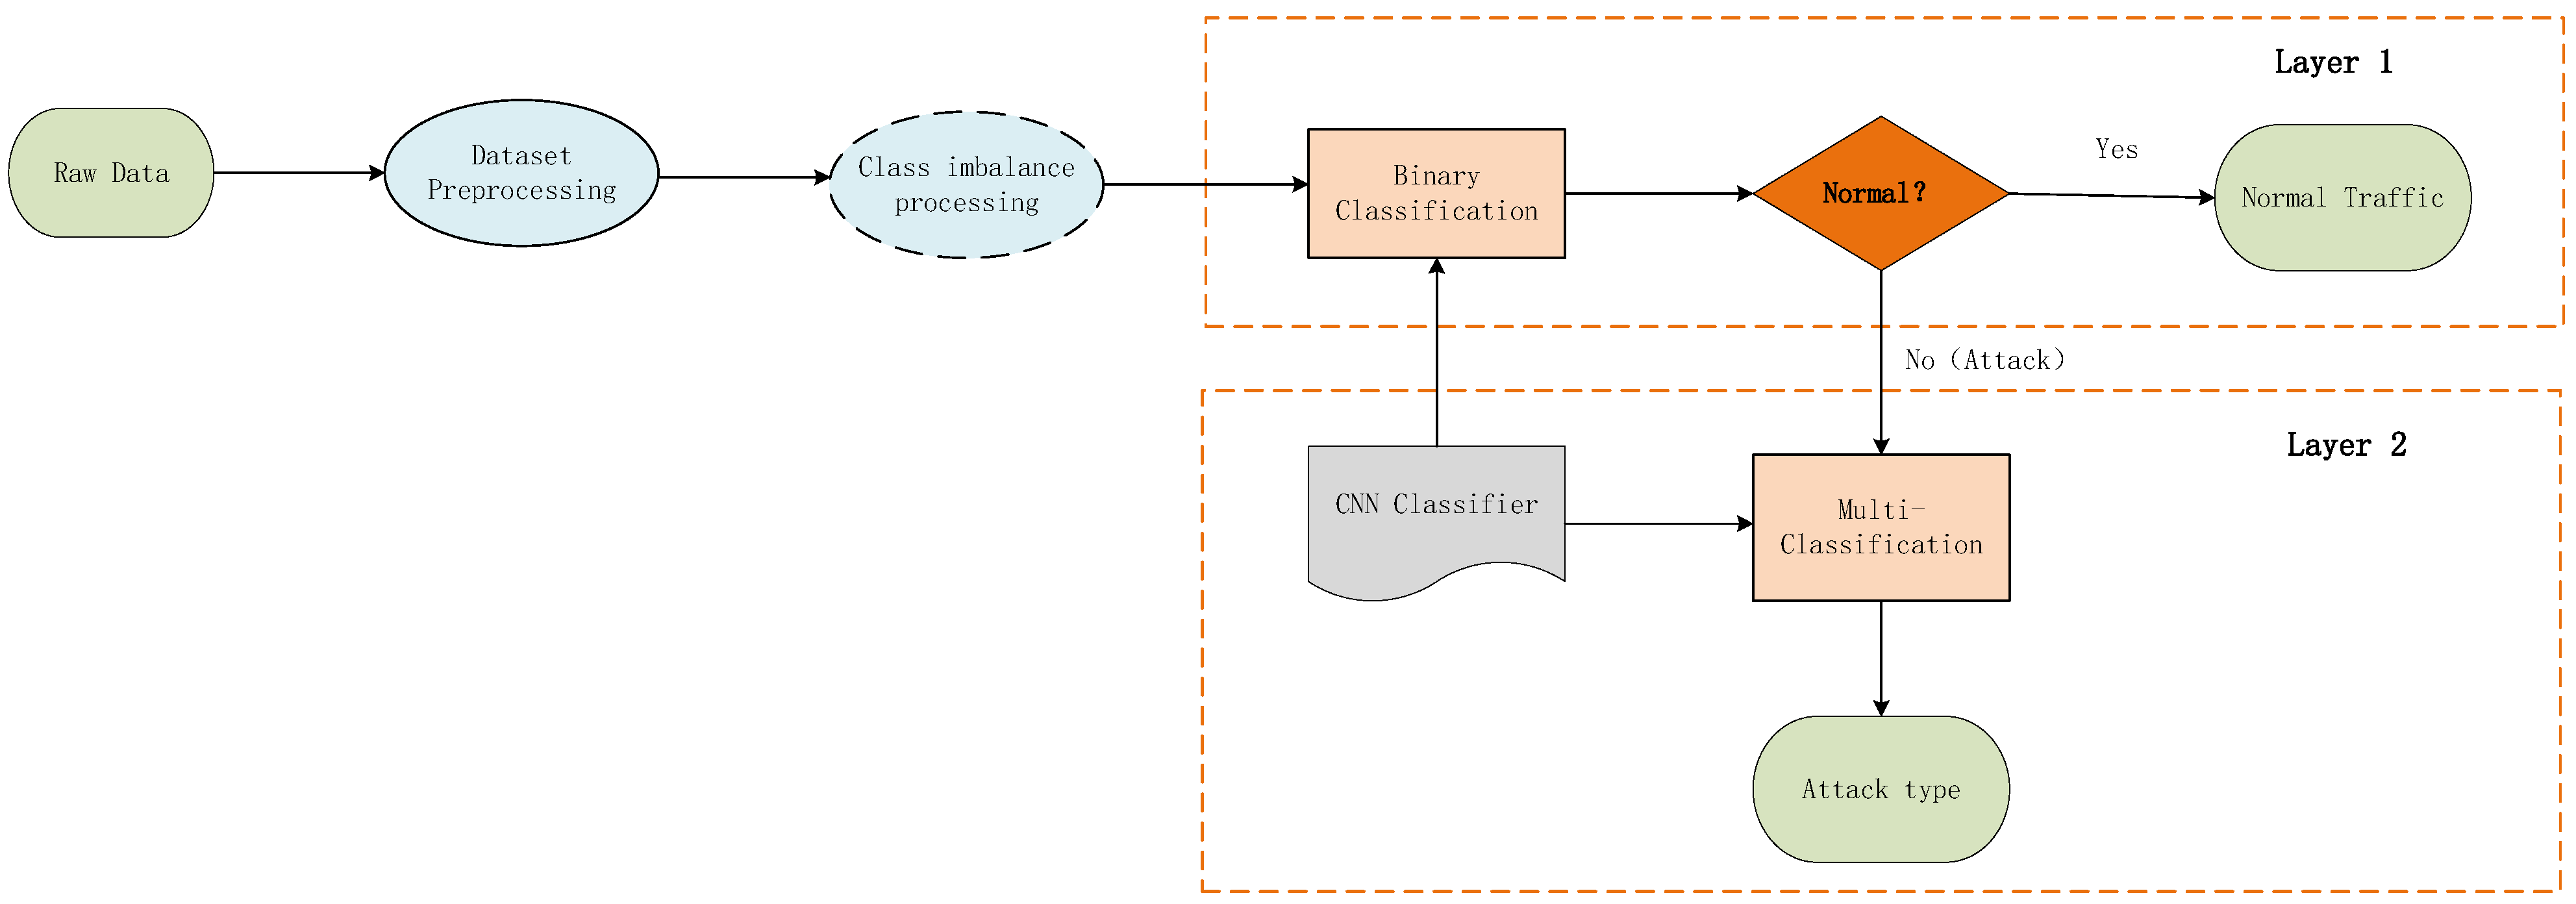
This paper proposes a network intrusion detection model CSK-CNN, which combines the imbalance processing algorithm Cluster-SMOTE + K-means and two-layer CNN algorithm, and has a high detection rate in identifying imbalanced datasets. CSK-CNN is an anomaly based network intrusion detection model, which uses two-layer CNN to identify and classify network intrusion behaviors: Layer 1 uses binary classification to identify normal traffic and abnormal traffic. Layer 2 uses multiple classification to classify abnormal traffic into specific attack categories.
(2)
In this paper, we propose a novel method, CSK algorithm, to deal with class imbalanced datasets on large datasets. This method first uses Cluster-SMOTE to oversample the training samples for minority classes, and then uses K-means to under sample the training samples for majority classes, finally making the training sample classes balanced. This method can not only avoid a large amount of time and space waste caused by over sampling, as well as over fitting, but also avoid the loss of important sample information caused by random under sampling. Experiments show that the anomaly detection rate is significantly improved in minority classes.
(3)
This paper uses accuracy, recall, precision, F1 score, ROC curve, AUC value, training time and testing time to evaluate the proposed CSK-CNN model, and compares the performance of four imbalanced class processing algorithms (SMOTE, ROS, ADASYN, RUS + SMOTE, K-means + SMOTE) and two machine learning classification algorithms (RF and MLP). The experimental results show that the CSK-CNN model proposed in this paper is effective in dealing with large-scale imbalanced network intrusion detection, and its performance is better than other algorithms. Therefore, CSK-CNN, the accurate and efficient network anomaly intrusion detection method proposed in this paper, can be deployed in the real world network environment.
The rest of the article is arranged as follows: The second part mainly introduces the related work of neural network algorithm and class imbalance dataset algorithm in the field of network intrusion detection. The third part introduces the CSK-CNN algorithm and preprocessing method proposed in this paper. The fourth part introduces the experimental process and discusses the experimental results. Finally, the fifth part summarizes the article.

2. Related Work

Since 2000, machine learning algorithms have been widely used in network intrusion detection. Koroniotis et al. [11] proposed the role of machine learning algorithm in network forensics mechanism based on network flow identifier, which can track suspicious activities of botnets. The experiment on UNSW-NB15 dataset shows that the flow identifier using machine learning algorithm can effectively detect and track botnet attacks. Jiang et al. [12] put forward the PSO-Xgboost model. First, build a classification model through Xgboost, and then use the PSO algorithm to adaptively search the optimal structure of Xgboost. Experiments show that the overall classification accuracy of PSO-Xgboost model is higher than Xgboost, Random Forest, Bagging, Adaboost and other models. With the proliferation of network traffic data, traditional machine learning algorithms also show deficiencies. For example, machine learning, as a shallow learning algorithm, relies too much on feature selection, and its performance on large datasets is average.
Since Hinton et al. put forward the concept of deep learning, deep learning has been widely used in various fields. Aljbali et al. [13] proposed an anomaly detection method based on bidirectional short-term memory algorithm (Bi LSTM). Experiments on UNSW-NB15 dataset show that Bi LSTM algorithm is superior to other machine learning and deep learning models in accuracy, precision, F1 score and recall. Andresini et al. [14] proposed a method to analyze abnormal behaviors in network traffic using convolutional neural networks (CNN). The network flow is represented as a 2D image by performing a combination of nearest neighbor search and clustering processes, and the image is used to train the 2D CNN architecture. Yin et al. [15] proposed a deep learning method for intrusion detection using recurrent neural networks (RNN-IDS), and studied the performance of the model in binary classification and multi class classification, as well as the impact of the number of neurons and different learning rates on the performance of the proposed model. Faker et al. [16] proposed an intrusion detection system based on K-means homogeneity metric feature selection, and used deep feedforward neural network (DNN), RF and gradient lifting tree (GBT) for binary and multi classification. Experimental results show that this method performs well in processing large datasets.
At present, many methods have been proposed to solve the class imbalance problem of network intrusion detection. Sun et al. [17] used the hybrid network model (DL-IDS) of convolutional neural network (CNN) and short-term memory network (LSTM) for intrusion detection, and used the category weight optimization method to solve the impact of class imbalance dataset on model performance. The verification on CICIDS2017 dataset shows that the overall accuracy of multi classification is 98.67%, and the accuracy of each attack type is above 99.50%. Zhang et al. [18] proposed a flow based IDS method, which uses Gaussian mixture model (GMM) and SMOTE to deal with class imbalance in network data. Gupta et al. [19] proposed a LIO-IDS model based on Long Short Term Memory (LSTM) and improved one-to-one algorithm to deal with frequent and infrequent network intrusions, that is, imbalanced datasets. Experiments on NSL-KDD, CIDS-001 and CICIDS2017 datasets show that LIO-IDS has the advantages of high attack detection rate and fast computing time. Abdulhammed et al. [20] used the unified distributed balanced Uniform Distributed Based Balancing (UDBB) method to build a machine learning based network intrusion detection system (NIDS). The experimental results on CICIDS2017 dataset show that UDBB can effectively alleviate the problem of imbalanced data distribution, and the multi classification accuracy can reach 99.6%. Table 1 lists some related literature that contain ML-based and DL-based methods.
In order to solve the problem of imbalanced data distribution on large-scale network intrusion detection systems, this paper proposes a CSK-CNN model that combines two-layer CNN and imbalanced dataset processing algorithm Cluster-SMOTE + K-means. This paper verifies the anomaly detection rate of the model in Layer 1 and the multiple attack identification rate in Layer 2 on UNSW-NB15 and CICIDS2017 datasets respectively.

3. Proposed Methods

The CSK-CNN architecture proposed in this paper is used to detect abnormal network behavior. This architecture combines the two-layer CNN algorithm and the class imbalance processing algorithm CSK (Cluster-SMOTE + K-means). A new class imbalance data processing algorithm CSK is proposed, which combines the use of Cluster-SMOTE algorithm for over sampling on minority classes and K-means algorithm based under sampling on majority classes. CSK-CNN is an anomaly based NIDS with a two-layer classification structure: Layer 1 and Layer 2. Layer 1 uses CNN binary classification to identify normal network traffic and abnormal network traffic. Then send the identified abnormal network traffic to the Layer 2. Layer 2 uses CNN multiple classification to classify abnormal network traffic into their respective attack categories. Therefore, the CSK-CNN model proposed in this paper can not only identify exceptions, but also distinguish attack types. In particular, the Layer 2 is multiple classifiers that distinguish attack categories are as important as classifiers in the Layer 1 of identifying attacks, because in the real world, only when we know the exact categories of intrusion attacks can we choose appropriate defense technologies to defend against attacks. Figure 1 shows the working mode of the proposed CSK-CNN model. Details are described below.

3.1. Dataset Preprocessing

Dataset preprocessing In this paper, the dataset preprocessing of network intrusion detection mainly includes three parts: feature reduction, quantification, and normalization. In the feature deletion part, first of all, we delete redundant and meaningless features. In the UNSW-NB15 dataset, we delete six features: “srcip”, “sport”, “dsport”, “dstip”, “ltime” and “stime”, reducing the UNSW-NB15 feature dimension from 47 to 41. In addition, we observed the original dataset and found that the characteristic values of the samples with “srcip” and “dstip” of 0 are identical, but the corresponding labels are different. Therefore, we deleted these invalid sample data with “srcip” and “dstip” of 0. In the CICIDS2017 dataset, we deleted six features: “Flow ID”, “Source IP”, “Source Port”, “Destination IP”, “Protocol”, and “Time stamp”, reducing the feature dimension from 84 to 77.
Quantization is achieved by converting the classified value of each nominal feature into a numerical value. There are three “proto”, “state” and “service” nominal features in the UNSW-NB15 dataset. The feature dimension of UNSW-NB15 changes from 41 to 73 through the one pot coding quantization method. The class labels of the two datasets can also be converted into quantifiable values using the One pot encoding method. CICIDS2017 dataset does not contain nominal features, so only class tags are required for one pot coding quantization. Quantization is very important because it can solve the nominal features that cannot be directly processed by machine learning algorithms. Because the final feature dimensions of these two datasets are not many, 77 and 73 respectively, and the model training time is within an acceptable range, this paper does not perform feature selection separately.
After quantization, we need to standardize all the numerical features, and use the standardized function StandardScaler() to change each feature into data with a mean value of 0 and a variance of 1. Standardization is very important for data pre-processing. On the one hand, the standardized data and the original data maintain the same linear relationship, and the training process will not be affected by different feature median ranges; On the other hand, it is helpful to improve the convergence speed and accuracy of the model.

3.2. Class Imbalance Preprocessing

In a real network, the number of samples for a specific abnormal traffic may be very small, which will greatly affect the performance of our model. In particular, it is difficult for minority class samples to find the correct class boundary, which makes it difficult to classify by defining the class region and boundary. Therefore, this paper proposes an algorithm CSK to solve the class imbalance dataset, that is, it combines the Cluster-SMOTE over sampling and K-means clustering based under sampling methods. This method not only solves the problem of information redundancy, time and space waste caused by only using random over sampling, but also solves the problem of information loss caused by only using random under sampling under the condition that the total amount of training data remains unchanged. Pseudo code visible Algorithm 1 of CSK algorithm proposed in this paper.
First, define the average sample quantity I of each category after resampling, as shown in Formula (1):
I = I n t N C  
where, N is the total number of samples in the training set, and C is the number of categories.

3.2.1. Over Sampling Process Based on Cluster-SMOTE

When the number of samples is less than I r e s a m p l e , we use the Cluster-SMOTE algorithm proposed by Cieslak et al. [21] to over sample the minority samples to I r e s a m p l e . In order to estimate the region and boundary of minority samples, Cluster-SMOTE algorithm applies typical K-means clustering method to each minority sample. Then SMOTE method is used in each cluster to form a new sample set by reinserting composite samples in each cluster. This method can improve the performance of SMOTE when the boundary of a few sets is unclear, as shown in Formulas (2) and (3):
K j = K m e a n s I i   ,   C
K j = S M O T E K j , I r e s a m p l e C
where, C represents the number of clusters divided, K j is the number of samples per cluster after K-means algorithm, and K j is the number of samples per cluster after sampling on SMOTE.

3.2.2. Under Sampling Process Based on K-Means Clustering

For the number of samples more than I r e s a m p l e , we use K-means based clustering algorithm to under sample the majority samples to I r e s a m p l e . The principle of this method is to initialize k cluster centers, count the samples under each cluster class based on the distance between the calculated samples and the center point, and iteratively realize that the distance between the samples and the center of the cluster class to which they belong is the minimum objective. The objective function is shown in Formula (4):
a r g m i n C   J C = k = 1 K x i C k x i μ i   2 2
where, K is the number of samples in a cluster, and x is a sample point in the cluster, μ Represents the center of mass in the cluster, C k represents the feature vector of each sample point, and i represents each feature of the component point x .
Algorithm 1 CSK
Input:
Training set I = I i , i = 1 , 2 , , C
C = the total number of classes;
I = N ;  # the total number of samples
Output:
a balanced training set needed I ;
1: I r e s a m p l e = I n t N C
2: for i ⬅ 1 to C do
3:  if I i < I r e s a m p l e then
4:    K j = K m e a n s I i   ,   C  # Use K-means to cluster I i into C clusters,
5:    j = 1 , 2 , , C
6:   for j ⬅ 1 to C do
7:     K j = S M O T E K j , I r e s a m p l e C  # Use SMOTE to oversample K j
8:   end for
9:    I i = C o n c a t e n a t e K j
10:  end if
11:   I = C o n c a t e n a t e I i
12:  if I i > I r e s a m p l e then
13:    K j = K m e a n s I i   ,   C  # Use K-means to cluster I i into C clusters,
14:    j = 1 , 2 , , C
15:   for j ⬅ 1 to C do
16:     K j = R e s a m p l e K j , I r e s a m p l e C  # Randomly select I r e s a m p l e C samples from K j
17:   end for
18:    I i = C o n c a t e n a t e K j
19:  end if
20:   I = C o n c a t e n a t e I i
21: end for
22: return I

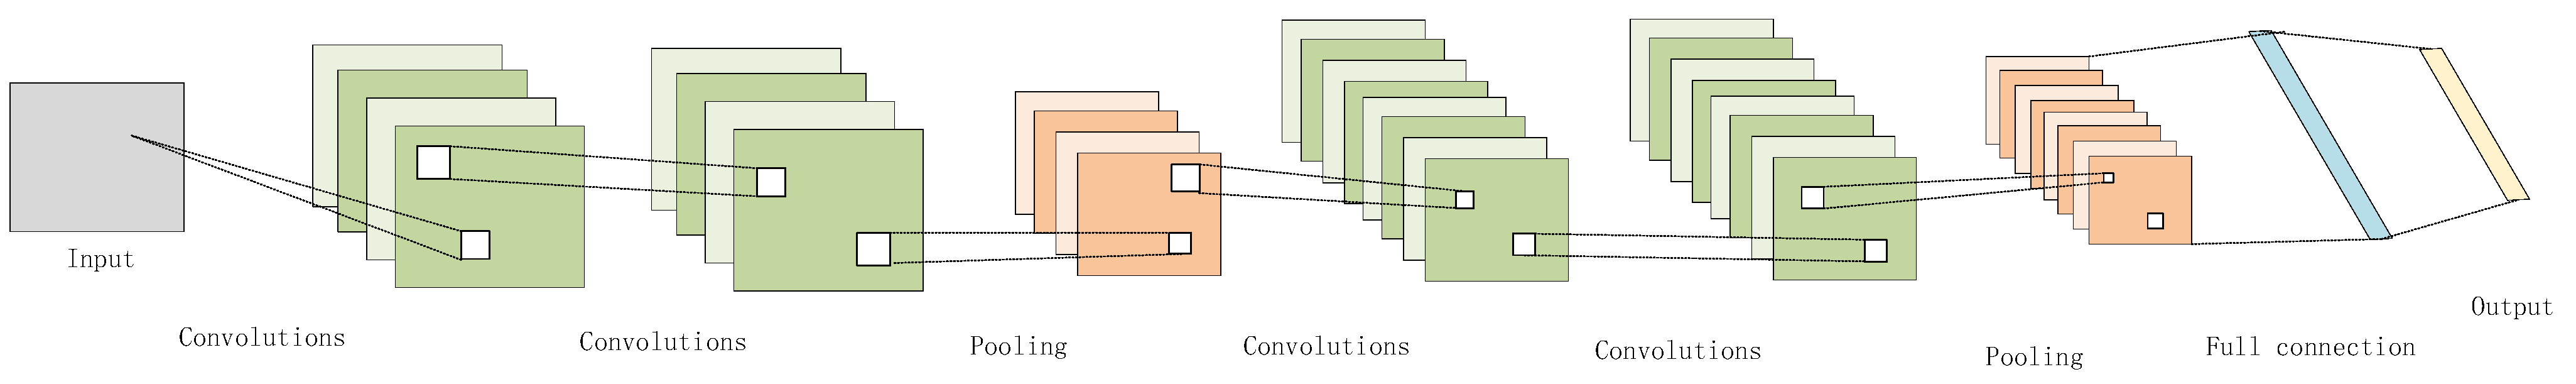
3.3. Convolutional Neural Network

Convolution neural network is a kind of feedforward neural network, which has become one of the research focuses in many scientific fields. Convolutional neural network has the characteristics of local feature perception and parameter sharing, and can effectively classify network traffic from hierarchical structure.
Convolutional neural network mainly includes convolution layer, pooling layer and full connection layer. In general, convolution layer is used to extract local features, pooling layer prevents over fitting by reducing the number of parameters, and full connection layer integrates local features to form complete features. In this paper, 1D convolutional neural network is used for network intrusion detection. The network structure is shown in Figure 2, including eight layers of networks, namely, four layers of convolutional layer, two layers of pooling layer and two layers of full connection layer. First, the input information is automatically extracted through convolution operation. Assuming the Layer 1 is convolution layer, then l The calculation formula of x j l is shown in Formula (5):
x j l = f i M j x j l 1 w i j l + b j l  
where, x j l is the j th output feature of layer l , f x is a nonlinear activation function, reLU function is used in this paper, and is a convolution operation. The current feature is obtained by convolution operation on all associated features of layer l 1 through convolution kernel w , and b is an offset parameter. The nonlinear operation of activation function can not only better map features and remove redundant information, but also enhance the expression ability of convolutional neural network.
After the convolution layer, the dimension of the input data becomes higher and higher, and many parameters will be generated, which will not only greatly increase the difficulty of network training, but also cause the phenomenon of over fitting. Therefore, the dimension is reduced by pooling the layer data. The essence of pooling layer is under sampling. There are two common pooling operations, max pooling and mean pooling. This paper adopts the maximum pooling method.
The last is the full connection layer. The convolution layer and pooling layer in front are equivalent to feature engineering work. The full connection layer is equivalent to weighting features to form complete features. The last full connection layer will play a classifier role in the entire neural network through the softmax function.

4. Experimental Results and Analysis

The CSK-CNN intrusion detection model proposed in this paper is developed under Windows 10 operating system and Intel (R) Core (TM) i7-8700K processor environment. On UNSW-NB15 and CICIDS2017 datasets, experiments were conducted using python programming language to verify the effectiveness of CSK-CNN intrusion detection method.

4.1. Dataset Description

The UNSW-NB15 dataset [22] was created by the Cyber Range Lab of the Australian Cyber Security Center (ACCS) and is mainly used to generate normal traffic and attack traffic in the real world. The dataset contains more than 2.54 million network traffic samples, involving one normal category and nine attack categories. Each sample has 49 features, and the last two columns are the binary label and attack type label. After data preprocessing, the dataset includes 2,204,107 normal samples and 281,896 abnormal samples. It can be seen that there is a serious imbalance in the dataset, which is suitable for evaluating the CSK algorithm proposed in this paper. On the UNSW-NB15 dataset, we split all the datasets into the training set, verification set and test set with a ratio of 7:1:2. The detailed data distribution of each category is shown in Table 2.
The CICIDS2017 dataset was developed by the Canadian Institute of Network Security at the end of 2017 by generating and capturing network traffic that lasts for five days. Sharafaldin et al. [23] used the B-profile system to simulate normal and abnormal behaviors on the network. The dataset consists of eight CSV files, including 2,273,097 normal samples and 557,646 attack samples, including one normal category and 14 attack categories. It is suitable for use as a dataset to verify the class imbalance processing algorithm proposed in this paper. Among them, each sample has a total of 78 features, and the last column is a type label. The CICIDS2017 dataset is split in the same way as the UNSW-NB15 dataset. The detailed data distribution of each category is shown in Table 3.

4.2. Evaluation Matrix

This paper uses six performance indicators to evaluate the proposed model: Accuracy (Acc), Recall, Precision, F1-score, false alarm rate (FAR), and receiver operating characteristic curve (ROC). For each type, we treat the samples as positive and the other samples as negative.
Acc refers to the percentage of correctly classified samples in the total number of samples, as shown in Formula (6).
A c c = T P + T N T P + T N + F P + F N
Recall refers to the percentage of correctly classified positive samples in the total number of positive samples, also known as true positive rate (TPR) or detection rate (DR), as shown in Formula (7).
R e c a l l = T P T P + F N
Precision refers to the percentage of positive samples among the samples classified as positive by the model, as shown in Formula (8).
P r e c i s i o n = T P T P + F P
F1-score is the harmonic average of Recall and Precision, as shown in Formula (9).
F 1 - s c o r e = 2 P r e c i s i o n R e c a l l P r e c i s i o n + R e c a l l
FAR is the false alarm rate, which refers to the percentage of negative samples wrongly classified as positive, as shown in Formula (10).
F A R = F P F P + T N
where TP indicates the number of positive samples correctly identified, FN represents the number of negative samples incorrectly marked, FP represents the number of positive samples incorrectly marked, and TN represents the number of negative samples correctly identified. The confusion matrix of the proposed CSK-CNN in this paper is shown in Appendix A.
In multi classification, in order to more reasonably evaluate the classification performance of the model on the imbalanced dataset, the weighted averaging method, macro averaging macro averaging method and micro averaging micro averaging method are used to calculate and display each type.

4.3. Hyperparameters for Convolution Neural Network

Convolution neural network involves the selection of multiple hyperparameters, such as the number of convolution cores, learning rate, number of iterations, mini-batch-size, etc. Each hyperparameter directly affects the classification result of the model. After the hyperparameter is adjusted, the hyperparameters of the convolutional neural network model in this paper are shown in Table 4.
The number of convolution cores of the four convolution layers is 32-32-64-64. The pooled layer uses the maximum pooling method with a sliding window of 2 × 2 and a step size of 2 to sample the parameters of the convolution layer twice, and uses a drop out layer with a parameter of 0.2 behind each pooled layer to prevent over fitting. Finally, the full connection layer uses 128 nodes for connection, and the number of nodes in the output layer is the number of categories. Except that the output layer uses Softmax as the activation function, other layers use ReLU. The optimization algorithm uses the best “Nadam” [24], the learning rate is set to 0.008, the number of iterations is set to 100, and mini-batch-size is set to 2048.

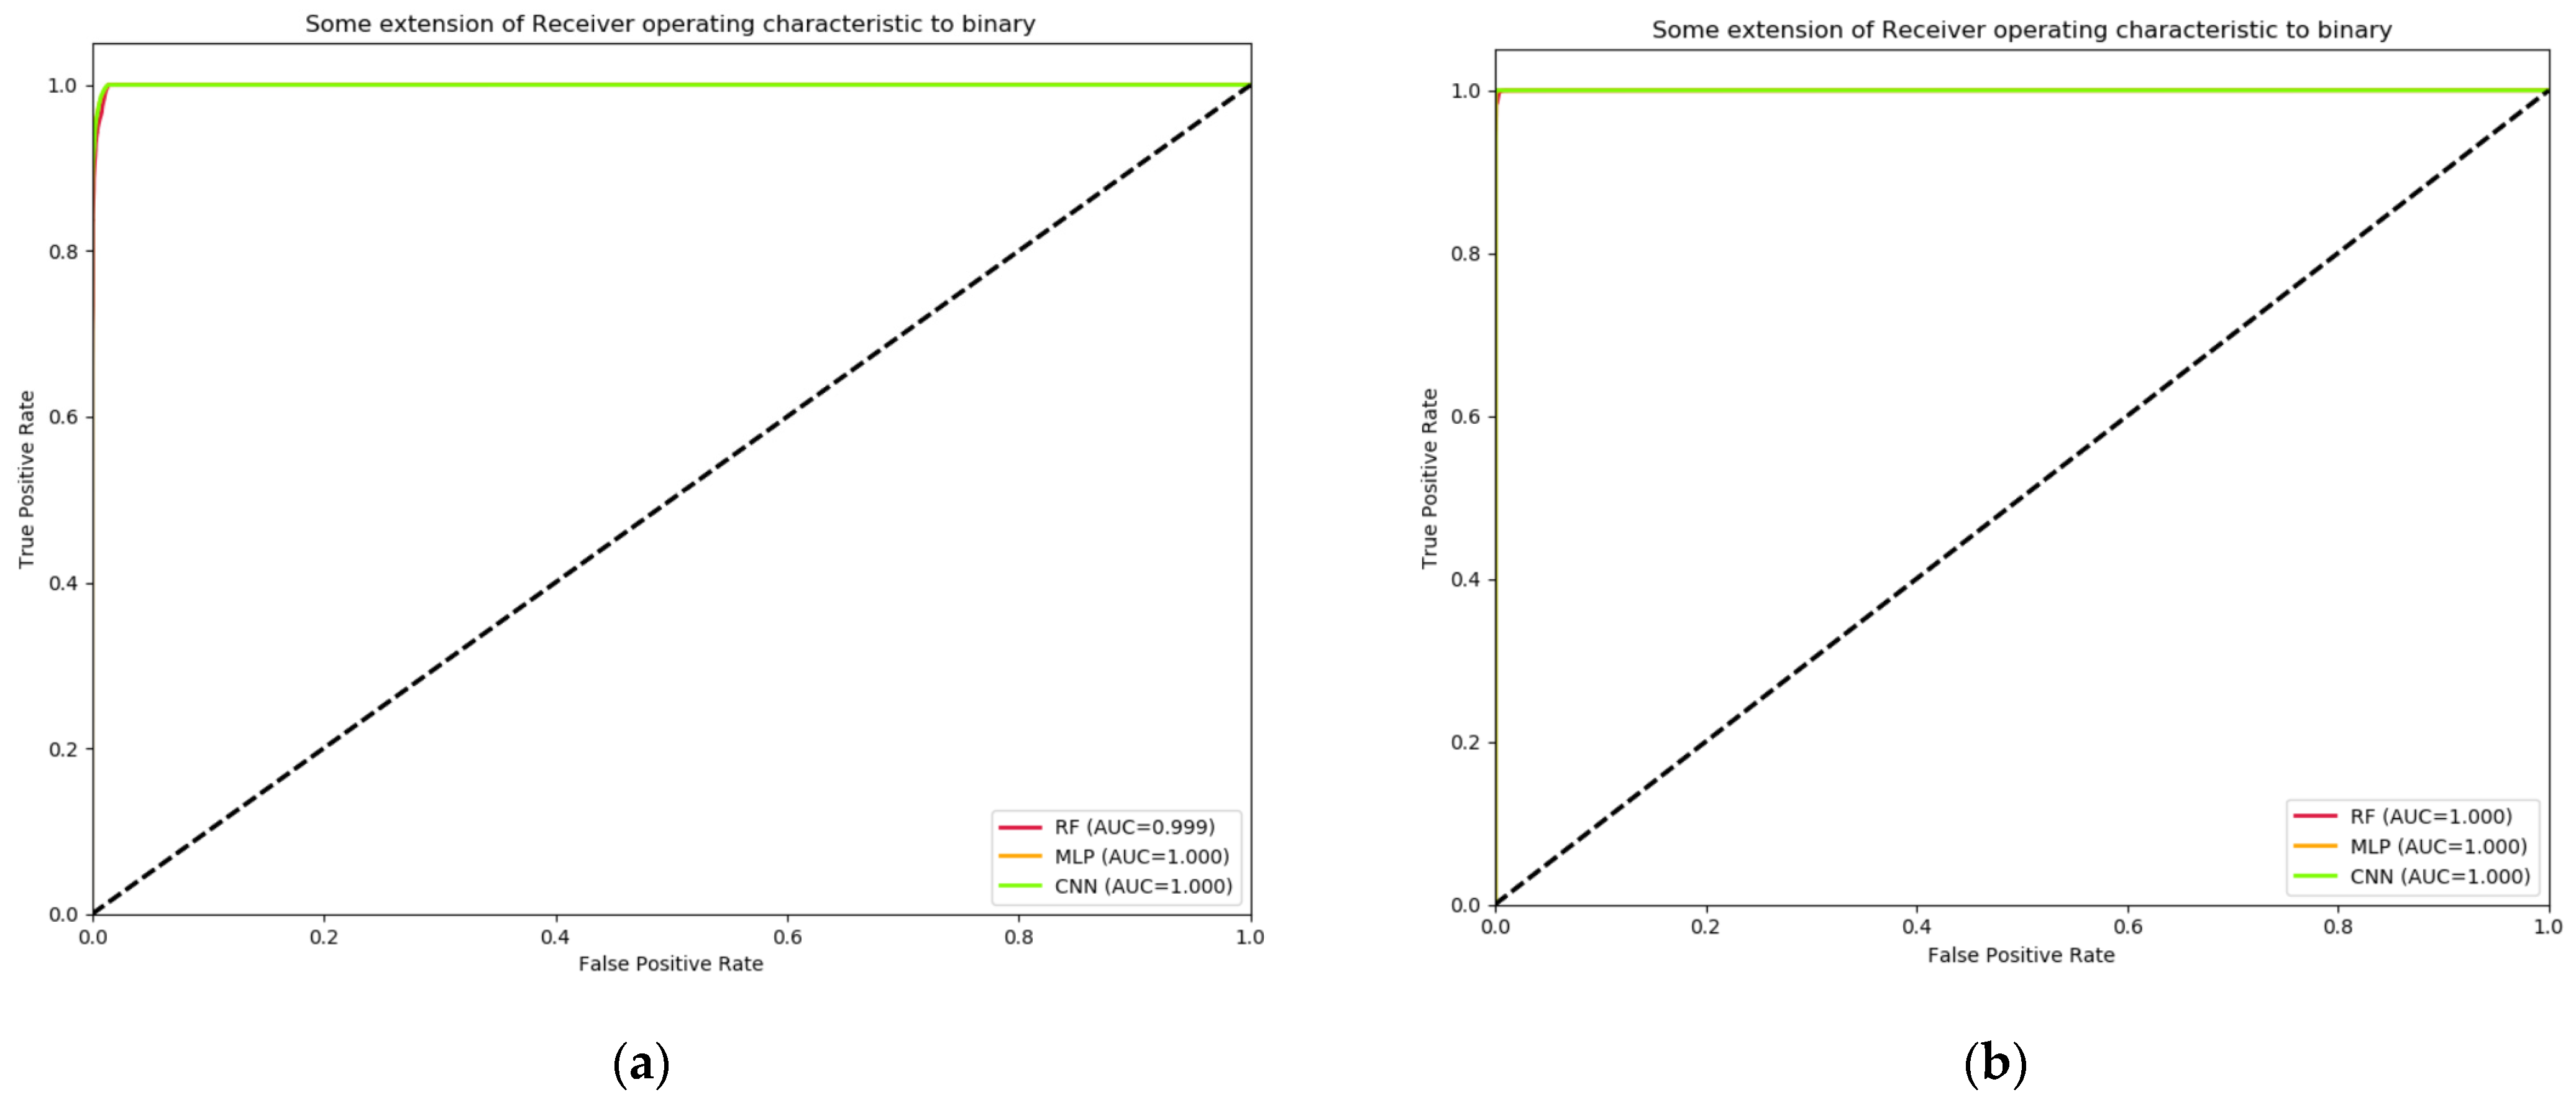
4.4. Layer 1: Binary Classification Results

The binary classification experiments in Layer 1, in order to prove the effectiveness of the CSK algorithm proposed in this paper, this paper compares five different class imbalance processing algorithms, namely SMOTE, ROS, ADASYN, RUS + SMOTE, K-means + SMOTE. The last two algorithms use RUS and K-means for under sampling respectively. In addition, in order to prove the validity of the proposed one-dimensional CNN model, this paper compares two machine learning classification algorithms, namely, random forest (RF) and Multi-Layer Perceptron (MLP). RF is the most representative method in the integration algorithm. For fair comparison, the default parameters are used in this paper, and the super parameters are not specially adjusted. As a typical neural network, MLP uses 128, 64 and 32 neural units to set three hidden layers.
Table 5 shows the binary classification results on UNSW-NB15 dataset. We can observe that the performance of the combined algorithm of under sampling and over sampling is significantly better than that of other class imbalance processing algorithms. The CSK-CNN model proposed in this paper obtains the best classification results, with Acc, Recall, FAR, Precision, F1 score reaching 99.14%, 98.70%, 0.80%, 94.03%, 96.31% respectively. Except Recall, other indicators are optimal. For MLP model, CSK algorithm is better than RUS + SMOTE algorithm in other indicators except that the Recall indicator is 0.56% lower than RUS + SMOTE algorithm. RF is the same. Except for the Recall index, other indexes of the CSK algorithm are optimal. Among them, the Recall index of the RUS + SMOTE algorithm is optimal, reaching 99.99%.
In terms of calculation time, it can be seen from Table 5, Table 6, Table 7 and Table 8 that the training time of the classification model using the combined algorithm of under sampling and over sampling, such as RUS + SMOTE, K-means + SMOTE, and CSK, is significantly lower than that of the single over sampling algorithm, because the number of samples in the training set of the combined algorithm is lower than that of the single over sampling algorithm. Among them, the classification of CNN models takes the longest time and the RF is the shortest, which is due to the complexity of the number of CNN model layers.
Figure 3 shows the binary ROC curve on UNSW-NB15 and CICIDS2017 datasets. As shown in Figure 3a,b, it can be seen intuitively and clearly that the performances of the three classification algorithms are not different, and the AUC value of the area under the ROC curve is close to 1.
Table 6 shows the binary classification results on CICIDS2017 dataset. Similarly, we can observe that the performance of the combined algorithm of under sampling and over sampling is significantly better than that of other class imbalance processing algorithms. The CSK-CNN model proposed in this paper obtains the best classification results, with Acc, Recall, FAR, Precision, and F1 score reaching 99.94%, 99.96%, 0.06%, 99.76%, and 99.86% respectively. In addition to Recall, other indicators are optimal, and the Recall of SMOTE algorithm is optimal, reaching 99.98%. For MLP model, CSK algorithm is the best except that Recall index is 0.1% lower than RUS + SMOTE. For RF model, the evaluation indexes of CSK algorithm are superior to other imbalance processing algorithms.

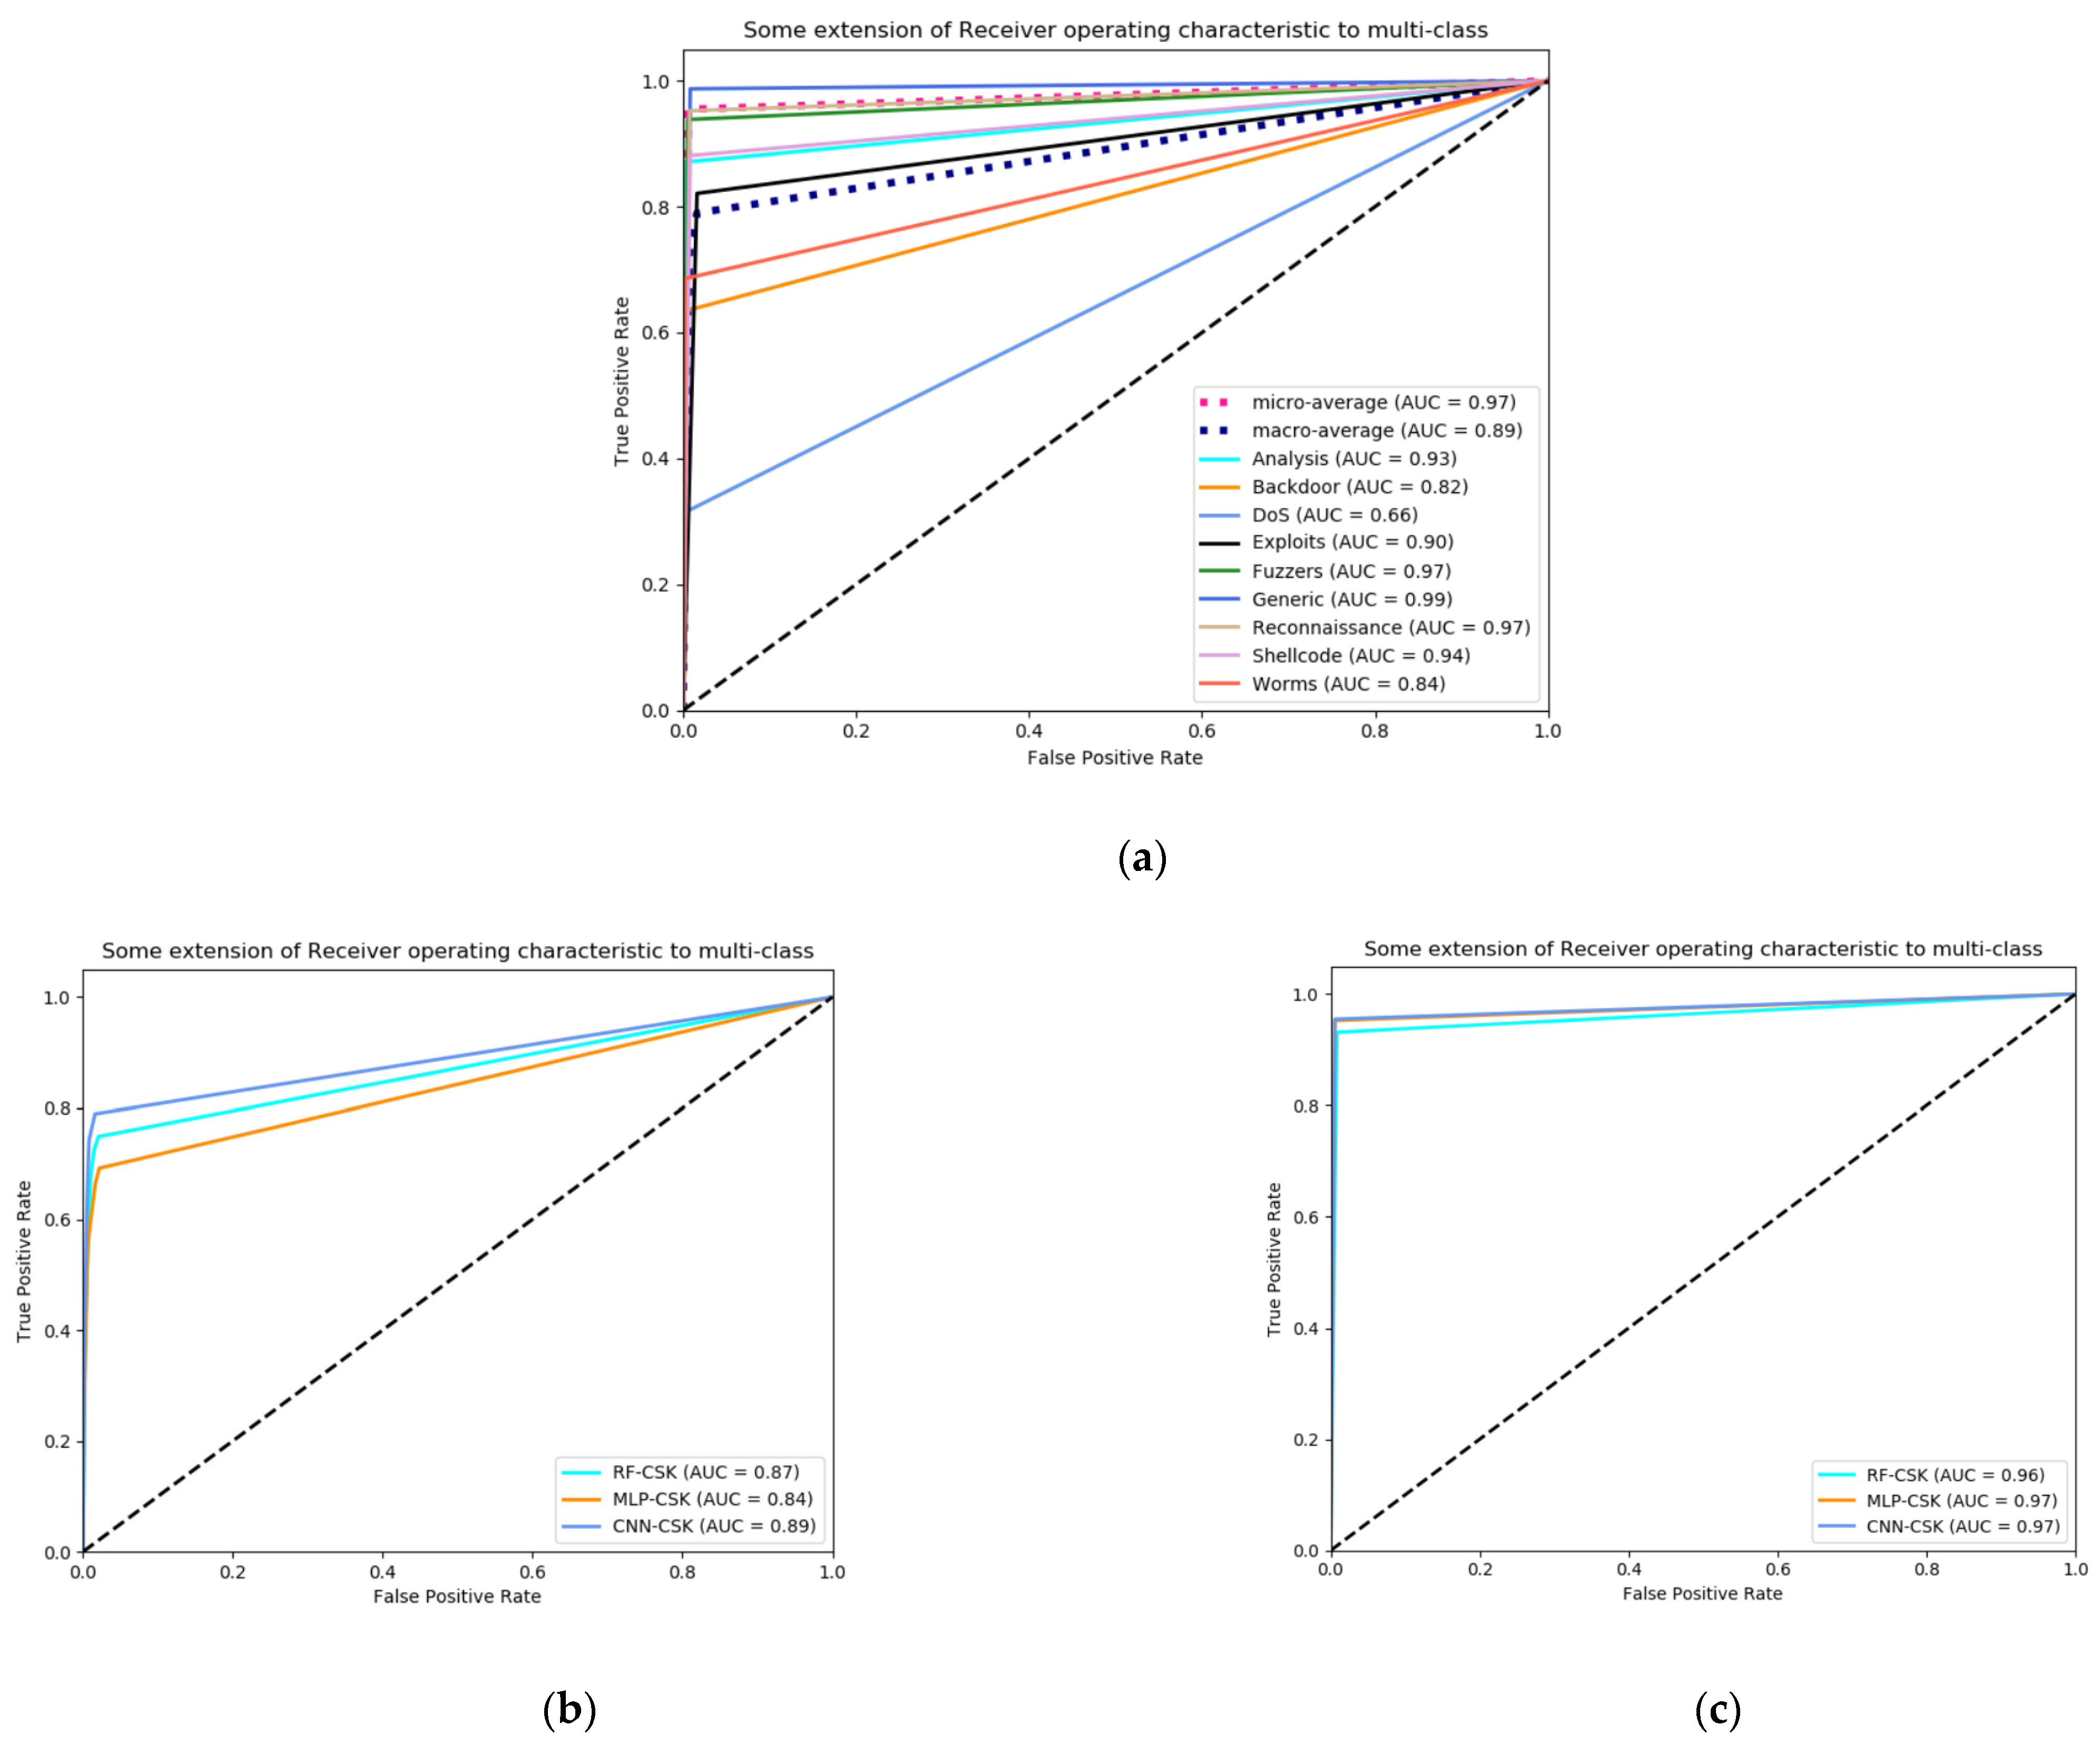
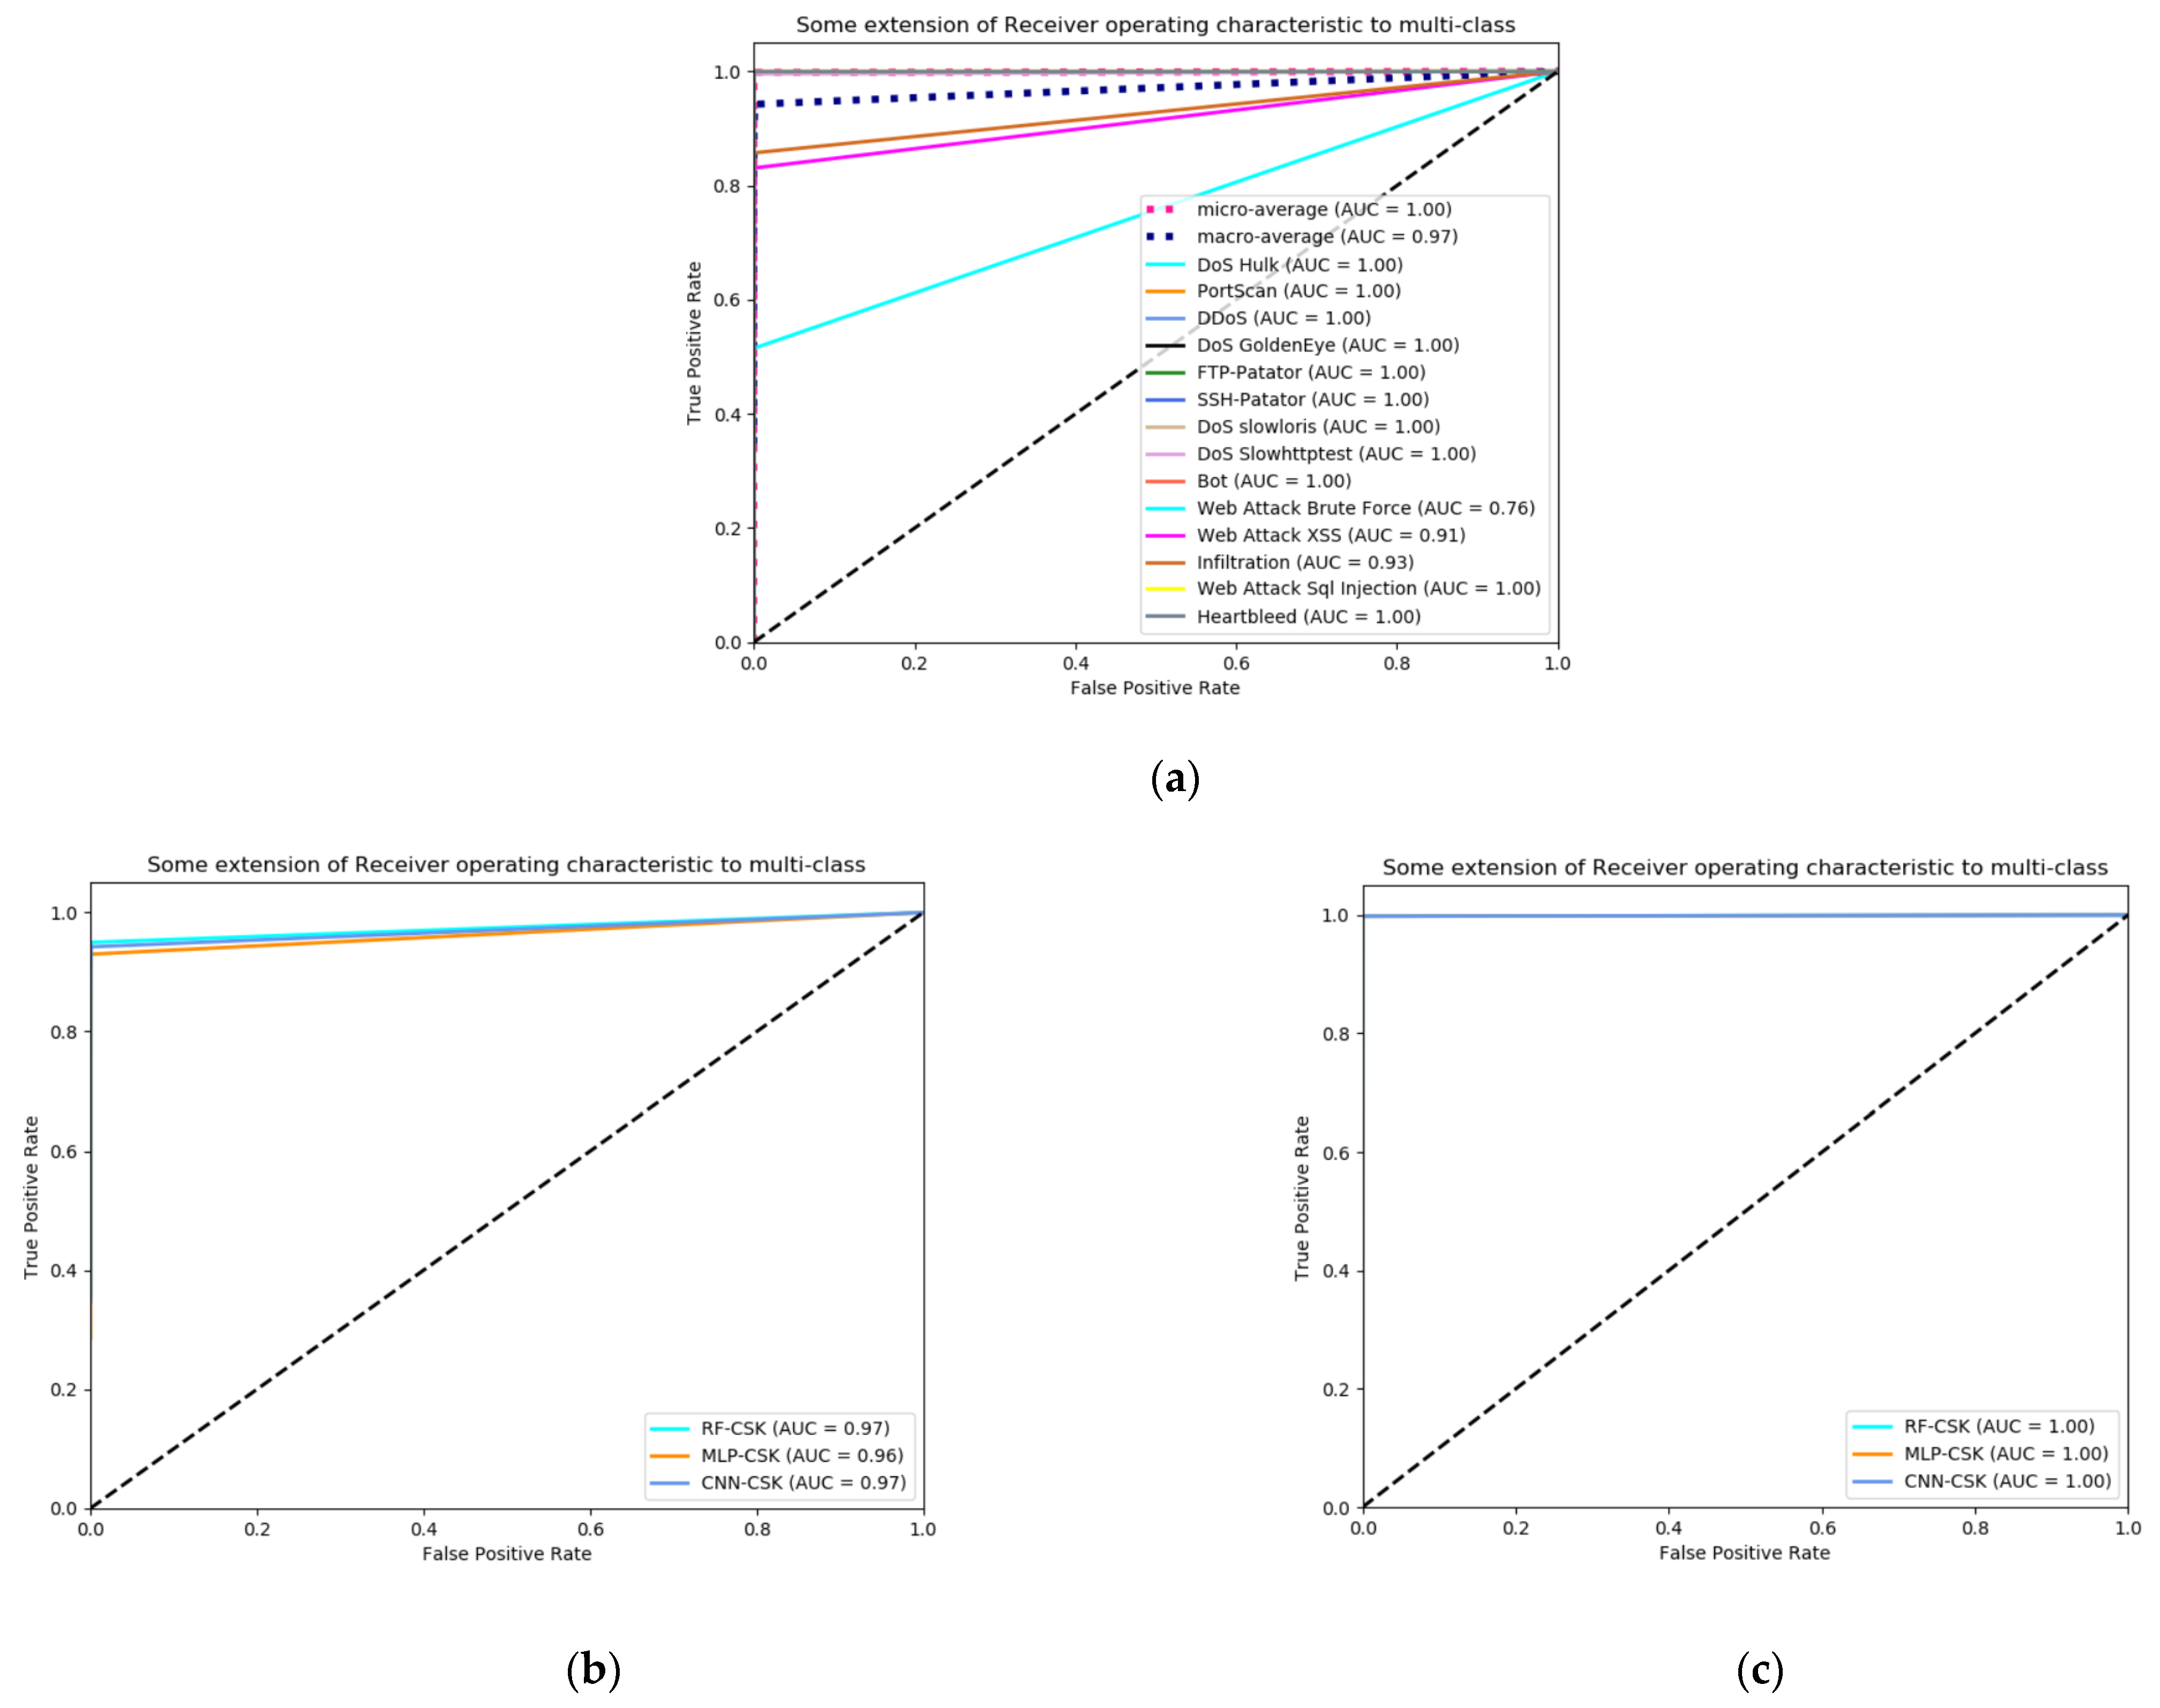
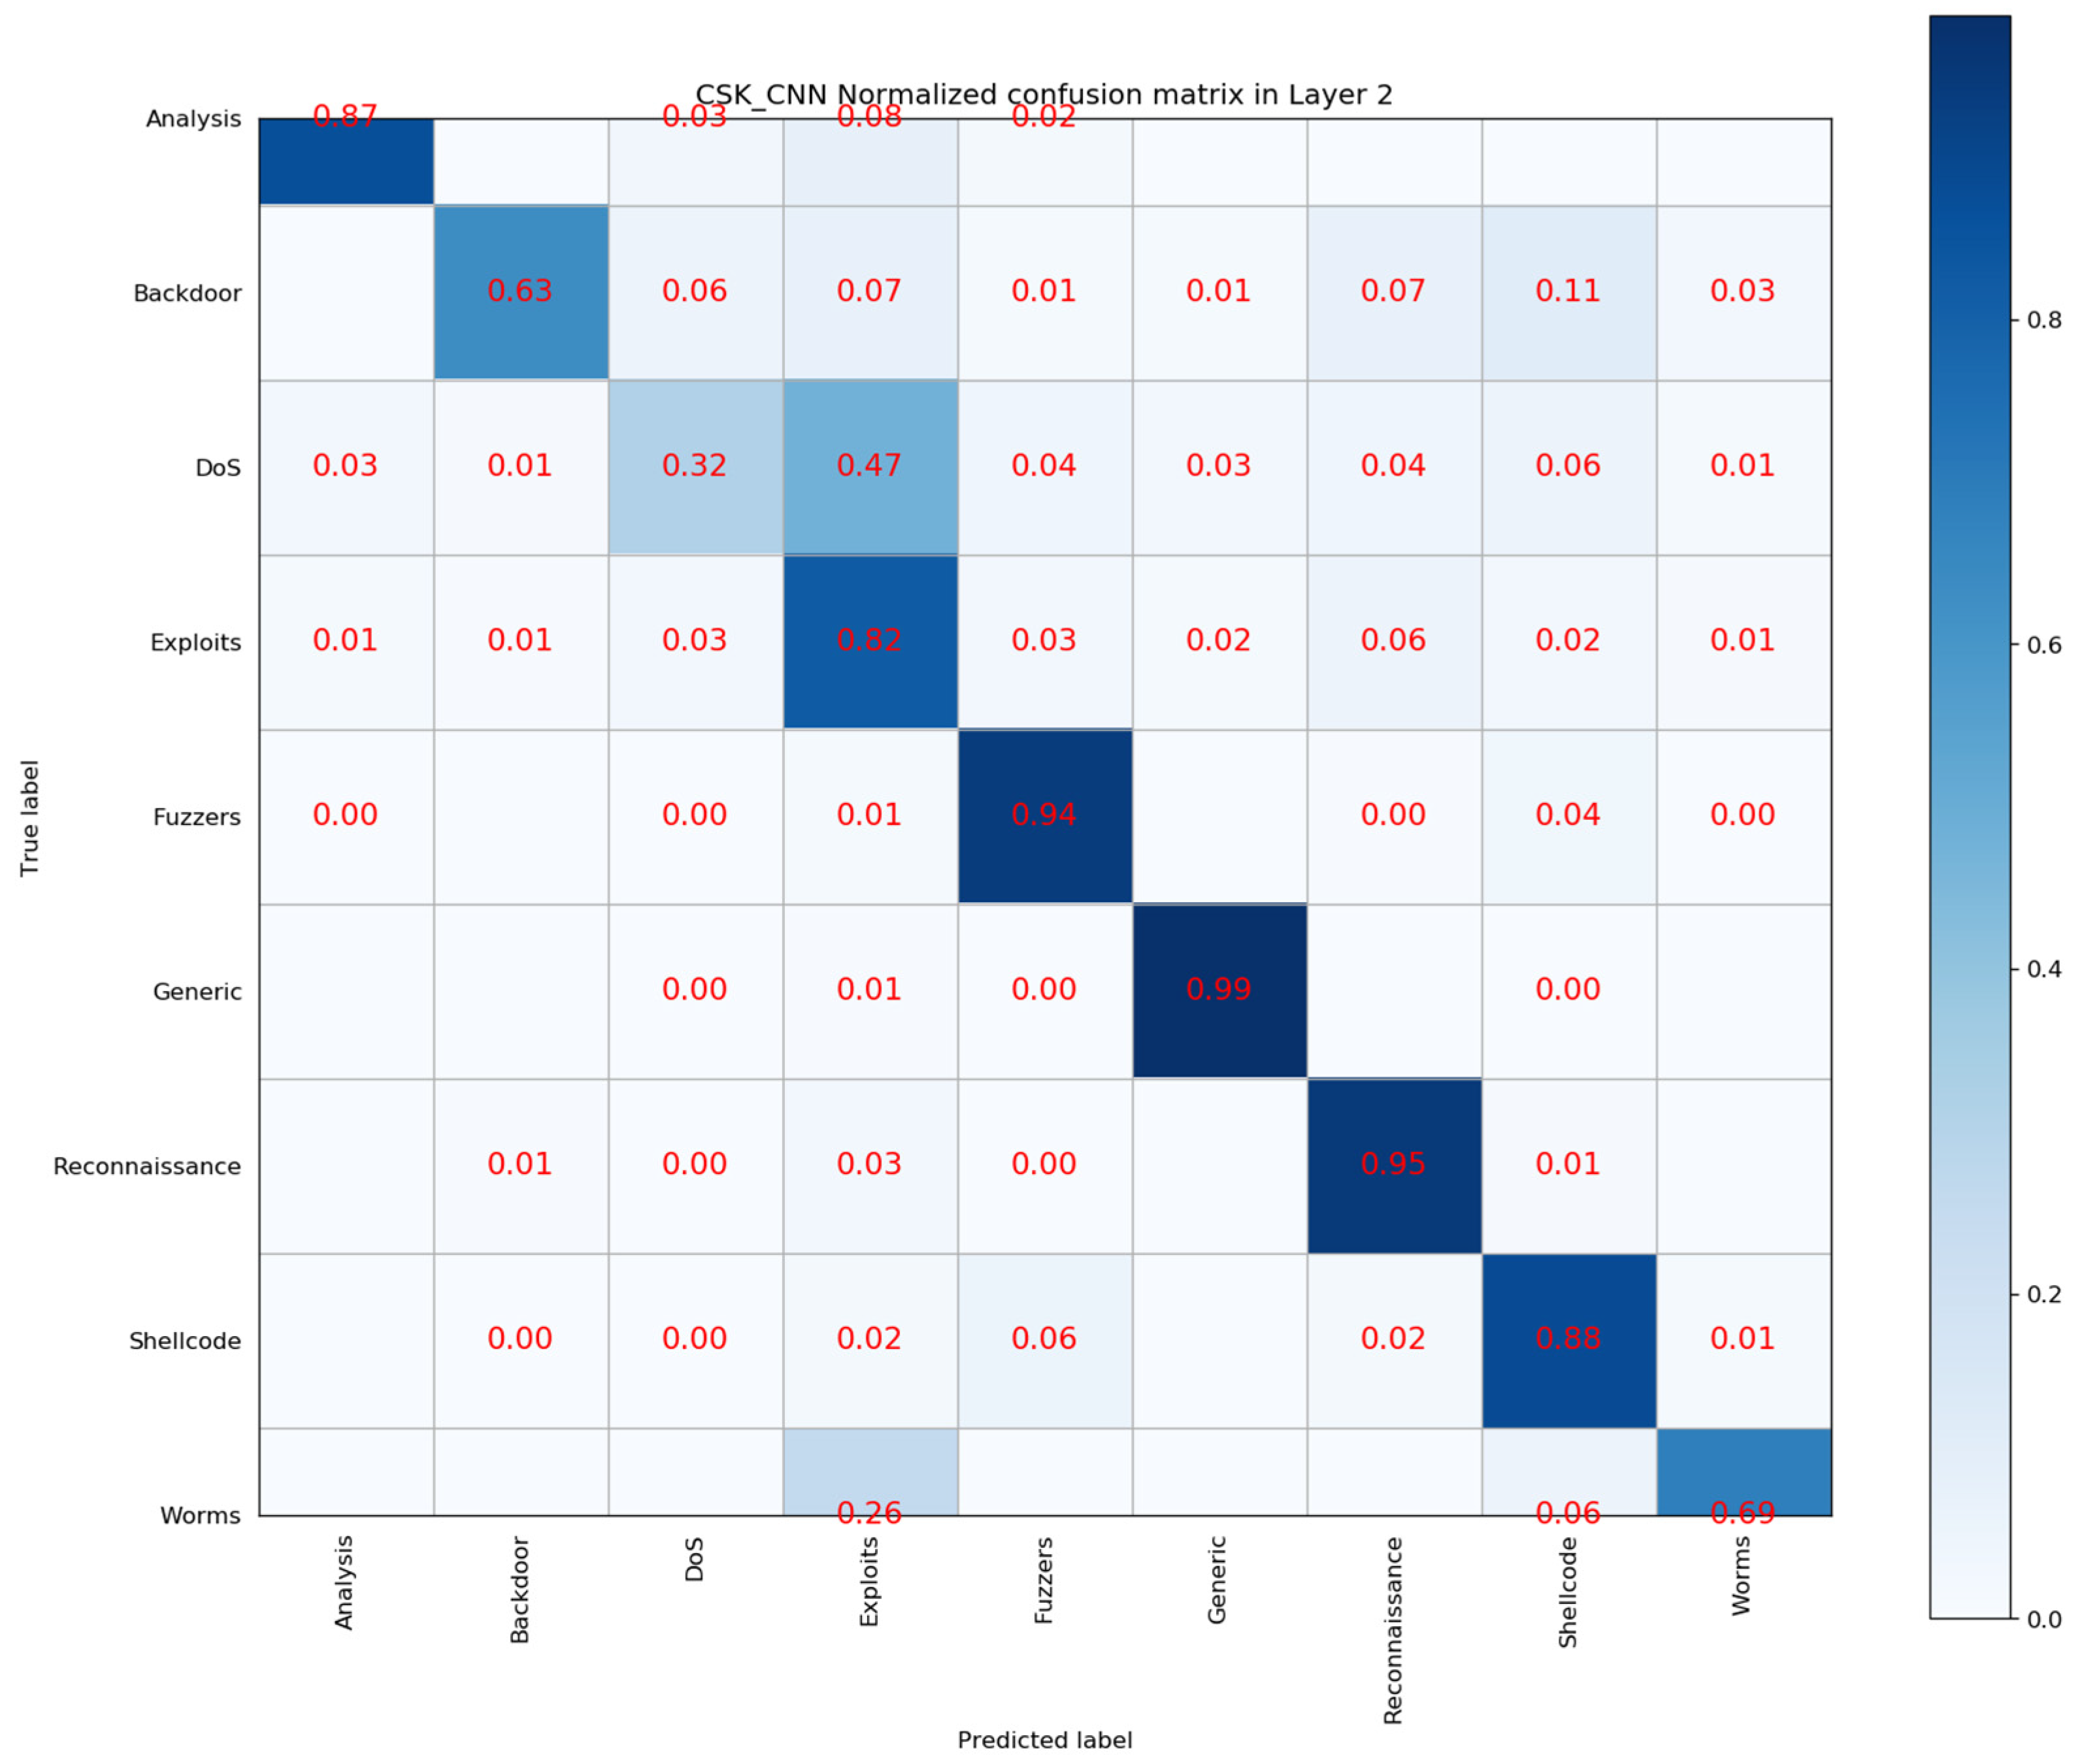
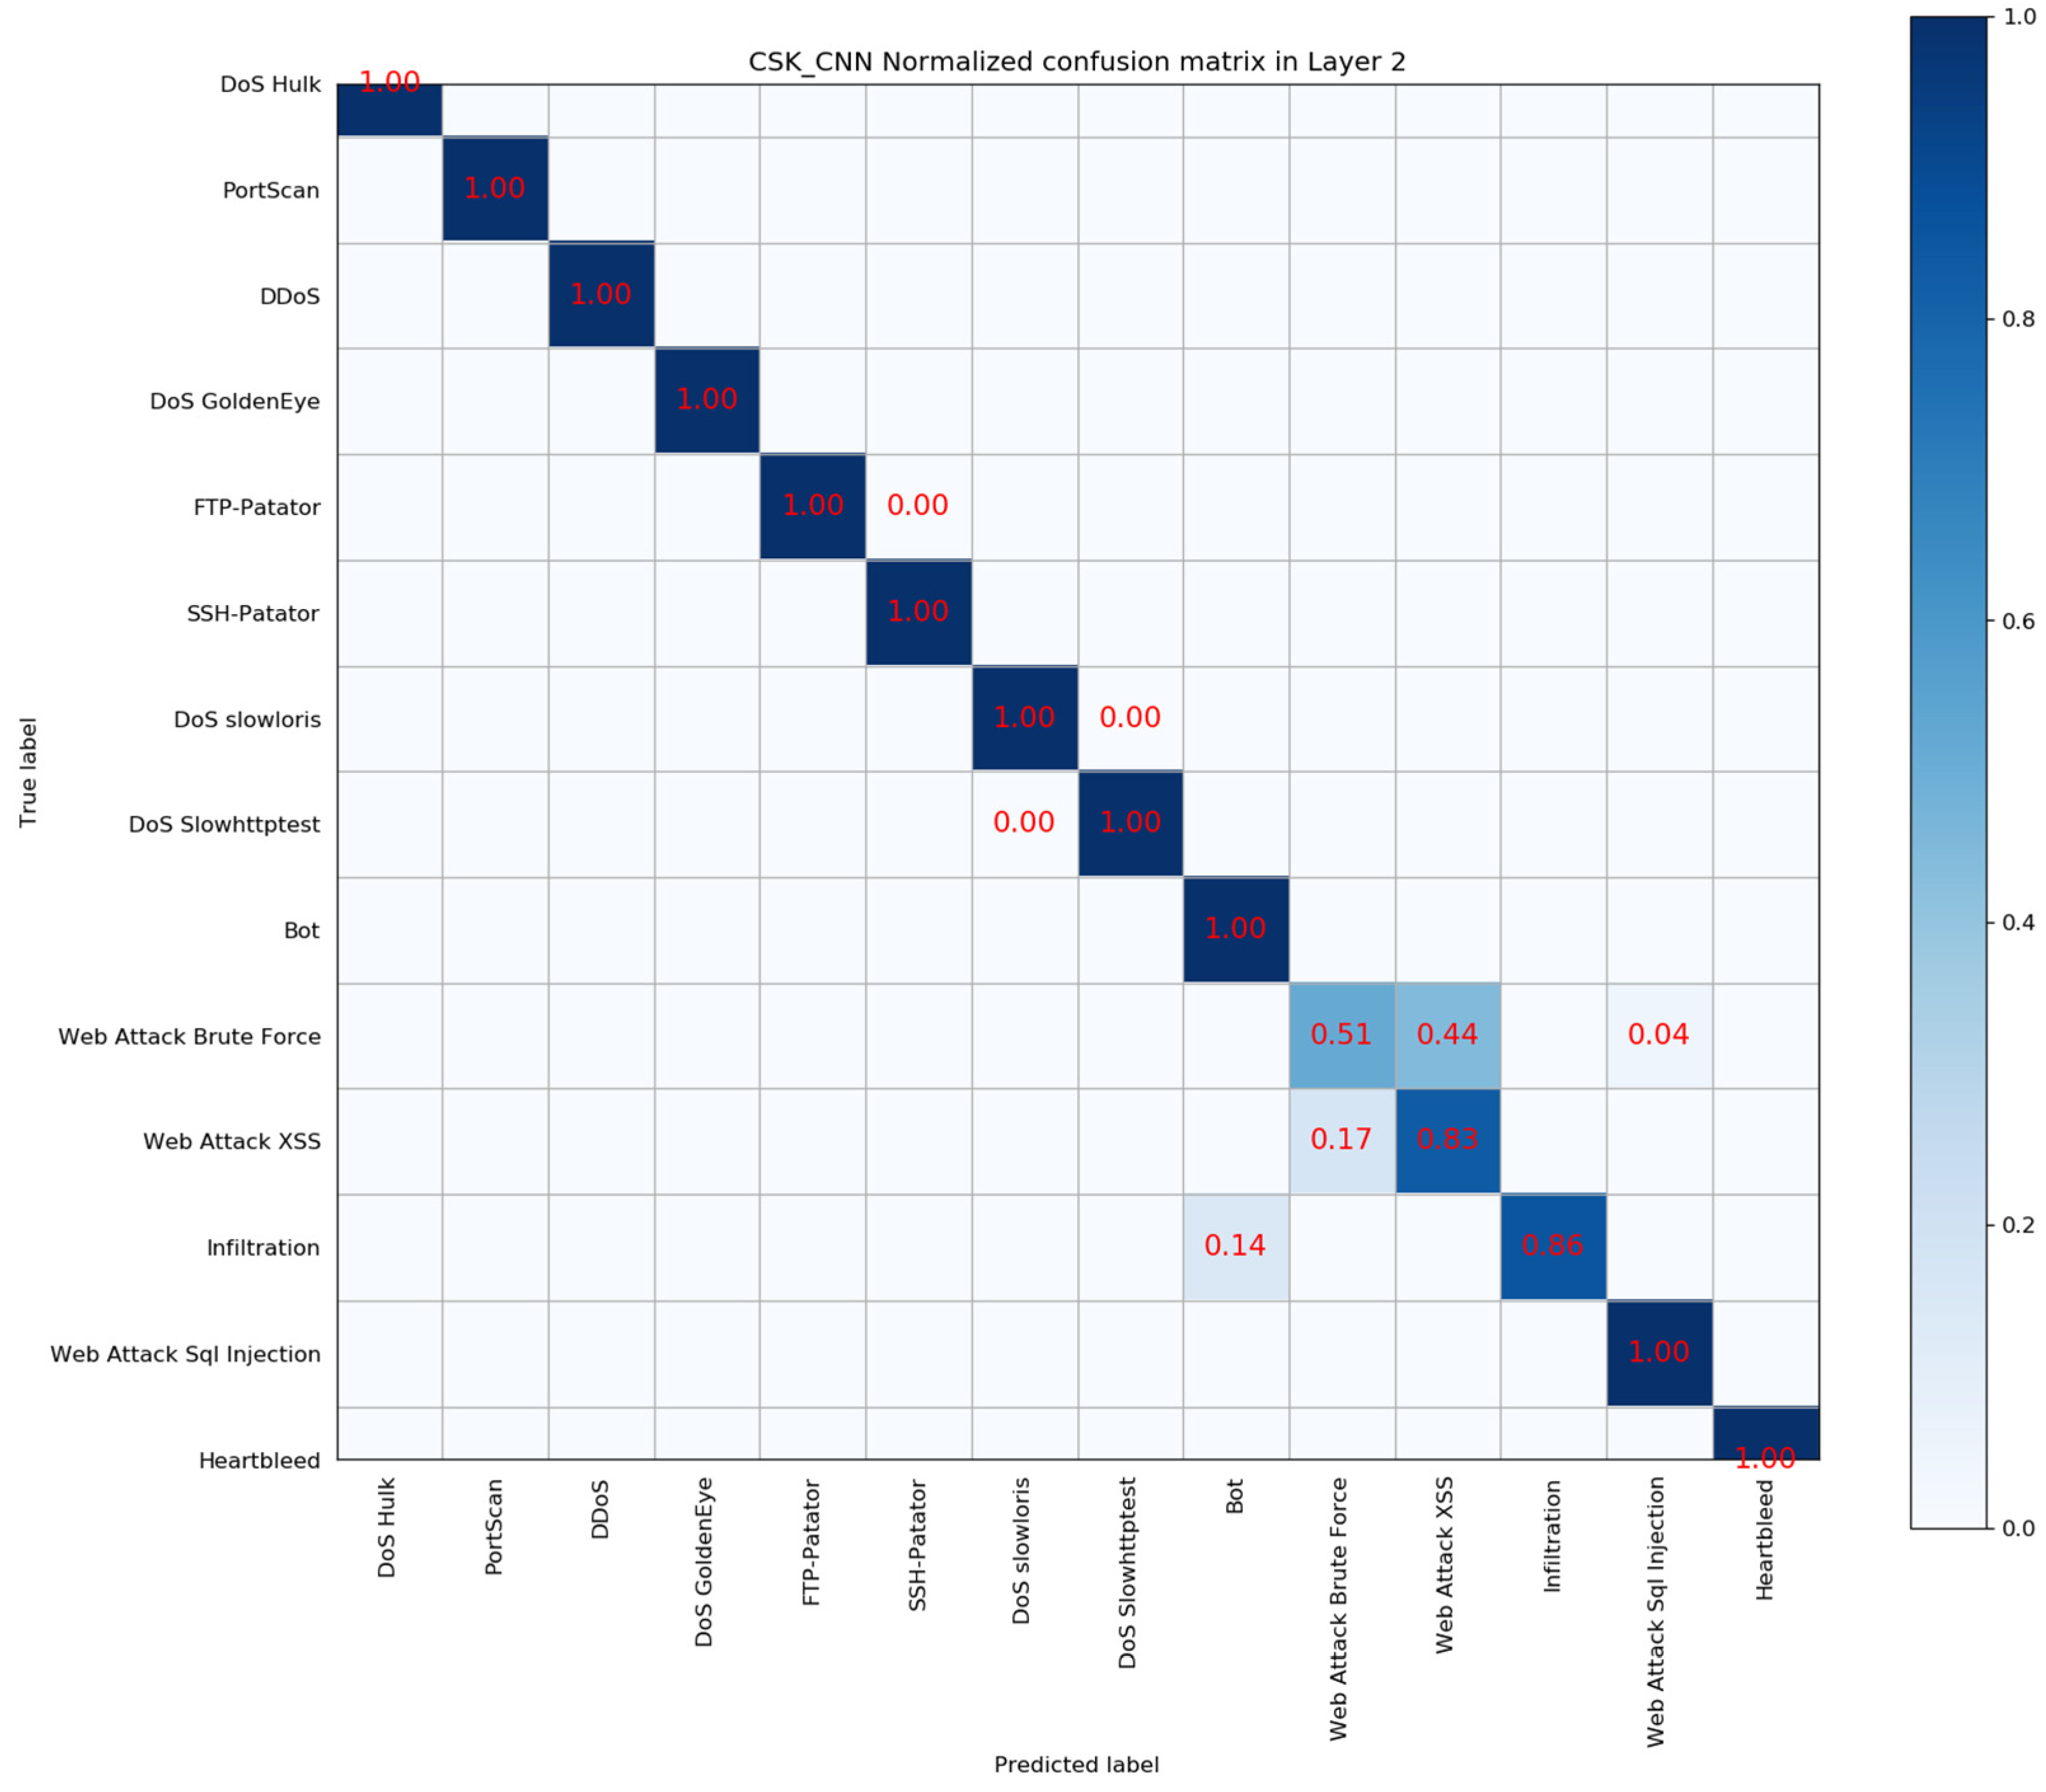
4.5. Layer 2: Multi Classification Results

In Layer 2, the multi classification experiment of abnormal samples uses the same classification model and class imbalance processing algorithm as the binary classification. On the UNSW-NB15 dataset and CICIDS2017 dataset, the number of neural units in the output layer of CNN and MLP models is 9 and 14 respectively, that is, the number of abnormal sample types. Other parameters are the same as those of the binary classification. The RF model also uses default parameters for training.
Table 7 shows the multi classification results calculated using the weighted average method on the UNSW-NB15 dataset. It can be observed from Table 7 that the CSK algorithm is obviously superior to other imbalance processing algorithms. The CSK-CNN model has better overall optimal classification performance than other models. In terms of Acc, Recall, Precision and F1-score indicators, they respectively reach 95.48%, 95.48%, 95.97% and 95.60%. Among them, CNN model is slightly better than MLP model, and RF performance is the worst. For MLP and RF models, the CSK model proposed in this paper has a slightly lower precision, but Acc, Recall, and F1 score are higher than other imbalance processing algorithms. In particular, F1 score is the harmonic average of Precision and Recall. The high F1 score means that the algorithm proposed in this paper has higher overall classification performance than other algorithms.
Figure 4 shows the multi category ROC curve on UNSW-NB15 dataset. As shown in Figure 4b,c, it can be seen intuitively and clearly that the CSK-CNN model proposed in this paper has the best performance under macro average and micro average calculation, and the AUC value of the area under the ROC curve is the largest. In addition, in Figure 4a, we can see the classification performance of each attack type under the CSK-CNN model intuitively. Backdoor, DoS, and Worms have poor detection performance, which is one of the main factors affecting the overall classification performance.
Table 8 shows the multi classification results calculated using the weighted average method on the CICIDS2017 dataset. It can be observed from Table 8 that the CSK-CNN algorithm has better overall optimal classification performance, reaching 99.80%, 99.80%, 99.86% and 99.82% respectively in Acc, Recall, Precision and F1 score indicators. Among them, the classification performance of MLP model is similar to that of CNN model, but CNN is slightly better than MLP model, and RF performance is the worst. For MLP and RF models, similar to UNSW-NB15 dataset, the CSK model proposed in this paper has a slightly lower precision, but Acc, Recall, and F1 score are higher than other class imbalance processing algorithms.
Figure 5 shows the multi category ROC curve on the CICIDS2017 dataset. As shown in Figure 5b,c, it can be seen intuitively and clearly that the CSK-CNN model proposed in this paper has the best performance under macro average and micro average calculation. Like the RF model, the AUC value of the area under the ROC curve is the largest. In addition, in Figure 5a, we can see the classification performance of each attack type under the CSK-CNN model intuitively. Web Attack Brute Force has poor detection performance, reaching 80%, which is one of the main factors affecting the overall classification performance.

4.6. Overall Performance of Network Intrusion Detection

Through the two-layer classification algorithm, we can calculate the overall accuracy of network intrusion detection Acc of the CSK-CNN model proposed in this paper. In addition, we compare the CSK-CNN model proposed in this paper with the current four latest works on UNSW-NB15 dataset and CICIDS2017 dataset, as shown in Table 9. Table 9 shows that the CSK-CNN intrusion detection algorithm proposed in this paper has the highest anomaly detection accuracy compared with the four latest works. The overall detection accuracy of UNSW-NB15 dataset is 98.77%, and that of CICIDS2017 dataset is 99.91%.

5. Conclusions

In this paper, in order to solve the problem that class imbalance in intrusion detection datasets affects the performance of classifiers, we propose a two-layer network detection model CSK-CNN, which combines the class imbalance processing algorithm Cluster-SMOTE + K-means (CSK) and convolutional neural network. In Layer 1, binary classification is used to separate normal traffic and abnormal traffic, and in Layer 2, multi-classification is used to further classify abnormal traffic into specific attack categories. Compared with five kinds of imbalance processing algorithms and two kinds of classification algorithms, the CSK-CNN model proposed in this paper has the overall best classification performance, the overall detection accuracy on the UNSW-NB15 dataset reaches 98.77%, and that of CICIDS2017 dataset reaches 99.91%. So it is suitable for deployment in real networks. In the future, we plan to explore other methods to improve the classification performance of abnormal categories, such as Dos, Backdoor, Web Attack Brute Force, etc.

Author Contributions

Conceptualization, J.S. and X.W.; data curation, L.J.; methodology, J.S. and L.J.; supervision, M.H., X.W. and L.J.; writing—original draft, J.S.; writing—review and editing, X.W., M.H. and L.J. All authors have read and agreed to the published version of the manuscript.

Funding

This research was funded by the National Natural Science Foundation of China, grant number 62071056.

Institutional Review Board Statement

The study did not involve humans or animals.

Informed Consent Statement

The study did not involve humans.

Data Availability Statement

The datasets used in this paper are available online [22,23], and they are also available from the corresponding author upon request.

Conflicts of Interest

The authors declare no conflict of interest.

Appendix A

Confusion Matrix obtained at Layer 1 of the proposed CSK-CNN is shown in Table A1 and Table A2.
Table A1. Layer 1 confusion matrix for UNSW-NB15 Dataset.
UNSW-NB15NormalAttack
Normal437,2883534
Attack73555,645
Table A2. Layer 1 confusion matrix for CICIDS2017 Dataset.
CICIDS2017NormalAttack
Normal454,351269
Attack48111,481
Confusion Matrix obtained at Layer 2 of the proposed CSK-CNN is shown in Figure A1 and Figure A2.
Figure A1. Layer 2 confusion matrix for UNSW-NB15 Dataset.
Information 14 00130 g0a1
Figure A2. Layer 2 confusion matrix for CICIDS2017 Dataset.
Information 14 00130 g0a2

References

  1. Abbood, Z.A.; Khaleel, I.; Aggarwal, K. Challenges and Future Directions for Intrusion Detection Systems Based on AutoML. Mesop. J. CyberSecurity 2021, 2021, 16–21. [Google Scholar] [CrossRef]
  2. Alajanbi, M.; Ismail, M.A.; Hasan, R.A.; Sulaiman, J. Intrusion Detection: A Review. Mesop. J. CyberSecurity 2021, 2021, 1–4. [Google Scholar] [CrossRef]
  3. Umamaheswari, A.; Kalaavathi, B. Honeypot TB-IDS: Trace back model based intrusion detection system using knowledge based honeypot construction model. Clust. Comput. 2019, 22, 14027–14034. [Google Scholar] [CrossRef]
  4. Zong, W.; Chow, Y.-W.; Susilo, W. Interactive three-dimensional visualization of network intrusion detection data for machine learning. Future Gener. Comput. Syst. 2020, 102, 292–306. [Google Scholar] [CrossRef]
  5. Ravale, U.; Marathe, N.; Padiya, P. Feature selection based hybrid anomaly intrusion detection system using k-means and RBF kernel function. Procedia Comput. Sci. 2015, 45, 428–435. [Google Scholar] [CrossRef] [Green Version]
  6. Chen, T.Q.; Guestrin, C. XGBoost: A scalable tree boosting system. In Proceedings of the 22nd ACM Sigkdd International Conference on Knowledge Discovery and Data Mining, San Francisco, CA, USA, 13–17 August 2016; pp. 785–794. [Google Scholar]
  7. Sangkatsanee, P.; Wattanapongsakorn, N.; Charnsripinyo, C. Practical real-time intrusion detection using machine learning approaches. Comput. Commun. 2011, 34, 2227–2235. [Google Scholar] [CrossRef]
  8. Liu, Y.; Wang, C.; Zhang, Y.; Yuan, J. Multiscale convolutional CNN model for network intrusion detection. Comput. Eng. Appl. 2019, 55, 90. [Google Scholar] [CrossRef]
  9. Sheikhan, M.; Jadidi, Z.; Farrokhi, A. Intrusion detection using reduced-size RNN based on feature grouping. Neural Comput. Appl. 2012, 21, 1185–1190. [Google Scholar] [CrossRef]
  10. Althubiti, S.A.; Jones, E.M., Jr.; Roy, K. LSTM for anomaly-based network intrusion detection. In Proceedings of the 2018 28th International Telecommunication Networks and Applications Conference (ITNAC), Sydney, NSW, Australia, 21–23 November 2018. [Google Scholar]
  11. Koroniotis, N.; Moustafa, N.; Sitnikova, E.; Slay, J. Towards developing network forensic mechanism for botnet activities in the IoT based on machine learning techniques. Mob. Netw. Manag. 2018, 235, 30–44. [Google Scholar] [CrossRef] [Green Version]
  12. Jiang, H.; He, Z.; Ye, G.; Zhang, H. Network intrusion detection based on PSO-XGBoost model. IEEE Access 2020, 8, 58392–58401. [Google Scholar] [CrossRef]
  13. Aljbali, S.; Roy, K. Anomaly detection using bidirectional LSTM. In Intelligent Systems and Applications. IntelliSys 2020; Advances in Intelligent Systems and Computing; Springer International Publishing: London, UK, 2020. [Google Scholar]
  14. Andresini, G.; Appice, A.; Malerba, D. Nearest cluster-based intrusion detection through convolutional neural networks. Knowl.-Based Syst. 2021, 216, 106798. [Google Scholar] [CrossRef]
  15. Yin, C.; Zhu, Y.; Fei, J.; He, X. A deep learning approach for intrusion detection using recurrent neural networks. IEEE Access 2017, 5, 21954–21961. [Google Scholar] [CrossRef]
  16. Faker, O.; Dogdu, E. Intrusion detection using big data and deep learning techniques. In Proceedings of the ACMSE 2019, Kennesaw, GA, USA, 18–20 April 2019. [Google Scholar] [CrossRef]
  17. Sun, P.; Liu, P.; Li, Q.; Liu, C.; Lu, X.; Hao, R.; Chen, J. DL-IDS: Extracting features using CNN-LSTM hybrid network for intrusion detection system. Sec. Commun. Netw. 2020, 2020, 8890306. [Google Scholar] [CrossRef]
  18. Zhang, H.; Huang, L.; Wu, C.Q.; Li, Z. An effective convolutional neural network based on SMOTE and Gaussian mixture model for intrusion detection in imbalanced dataset. Comput. Netw. 2020, 177, 107315. [Google Scholar] [CrossRef]
  19. Gupta, N.; Jindal, V.; Bedi, P. LIO-IDS: Handling class imbalance using LSTM and Improved One-vs-One technique in Intrusion Detection System. Comput. Netw. 2021, 192, 108076. [Google Scholar] [CrossRef]
  20. Abdulhammed, R.; Musafer, H.; Alessa, A.; Faezipour, M.; Abuzneid, A. Features dimensionality reduction approaches for machine learning based network intrusion detection. Electronics 2019, 8, 322. [Google Scholar] [CrossRef] [Green Version]
  21. Cieslak, D.A.; Chawla, N.V.; Striegel, A. Combating imbalance in network intrusion datasets. In Proceedings of the 2006 IEEE International Conference on Granular Computing, Atlanta, GA, USA, 10–12 May 2006; pp. 732–737. [Google Scholar] [CrossRef]
  22. Moustafa, N.; Slay, J. UNSW-NB15: A comprehensive dataset for network intrusion detection systems (UNSW-NB15 network dataset). In Proceedings of the IEEE: 2015 Military Communications and Information Systems Conference, IEEE, Canberra, ACT, Australia, 10–12 November 2015. [Google Scholar]
  23. Sharafaldin, I.; Lashkari, A.H.; Ghorbani, A.A. Toward generating a new intrusion detection dataset and intrusion traffic characterization. In Proceedings of the 4th International Conference on Information Systems Security and Privacy (ICISSP 2018), Funchal, Madeira, Portugal, 22–24 January 2018. [Google Scholar]
  24. Tahmassebi, A.; Gandomi, A.H.; Fong, S.; Meyer-Baese, A.; Foo, S.Y. Multistage optimization of a deep model: A case study on ground motion modeling. PLoS ONE 2018, 13, e0203829. [Google Scholar] [CrossRef] [Green Version]
  25. Baig, M.M.; Awais, M.M.; El-Alfy, E.-S.M. A multiclass cascade of artificial neural network for network intrusion detection. J. Intell. Fuzzy Syst. 2017, 32, 2875–2883. [Google Scholar] [CrossRef]
  26. Chohra, A.; Shirani, P.; Karbab, E.B.; Debbabi, M. Chameleon: Optimized feature selection using particle swarm optimization and ensemble methods for network anomaly detection. Comput. Secur. 2022, 117, 102684. [Google Scholar] [CrossRef]
  27. Yang, Y.; Zheng, K.; Wu, C.; Yang, Y. Improving the classification effectiveness of intrusion detection by using improved conditional variational autoencoder and deep neural network. Sensors 2019, 19, 2528. [Google Scholar] [CrossRef] [Green Version]
  28. Zhou, Y.; Cheng, G.; Jiang, S.; Dai, M. Building an efficient intrusion detection system based on feature selection and ensemble classifier. Comput. Netw. 2020, 174, 107247. [Google Scholar] [CrossRef] [Green Version]
  29. Zhang, Y.; Chen, X.; Guo, D.; Song, M.; Teng, Y.; Wang, X. PCCN: Parallel cross convolutional neural network for abnormal network traffic flows detection in multiclass imbalanced network traffic flows. IEEE Access 2019, 7, 119904–119916. [Google Scholar] [CrossRef]
Figure 1. CSK-CNN intrusion detection model.
Information 14 00130 g001
Figure 2. CNN Model Structure.
Information 14 00130 g002
Figure 3. ROC curve of binary classification. (a) ROC curve for UNSW-NB15; (b) ROC curve for CICIDS2017.
Information 14 00130 g003
Figure 4. ROC curve of multi-classification for UNSW-NB15. (a) 9-class; (b) macro; (c) micro.
Information 14 00130 g004
Figure 5. ROC curve of multi-classification for CICIDS2017. (a) 14-class; (b) macro; (c) micro.
Information 14 00130 g005
Table 1. Summary of some related methods.
Ref.MethodDescriptionType
[8] 2018ARM, ANN, NBDetect botnetML
[9] 2020PSO-XgboostImprove accuracy and efficiencyML
[10] 2020LSTMOutstanding performance.DL
[11] 20212D CNNNearest cluster-based intrusion detectionDL
[12] 2017RNNGood classification results.DL
[13] 2019DNN, K-meansFeature representations, accuracyDL
[14] 2020CNN-LSTMFeature representationsDL
[15] 2020CNN, GMMImbalanced classificationDL
[16] 2021LIO-IDSHandling class imbalanceDL
[17] 2019UDBBFeatures dimensionality reduction approachesML
Table 2. UNSW-NB15 Dataset Description.
CategoryTrainset-SizeTestset-SizeValidset-SizeTotal
Normal1,542,873440,822220,4122,204,107
Analysis43612462622
Backdoors2507136357
DoS26937693853847
Exploits19,8105660283028,300
Fuzzers15,0604303215121,514
Generic149,60242,74421,372213,718
Reconnaissance82972371118511,853
Shellcode10573031511511
Worms1223517174
Total1,740,200497,202248,6012,486,003
Table 3. CICIDS2017 Dataset Description.
CategoryTrainset-SizeTestset-SizeValidset-SizeTotal
BENIGN1,591,167454,620227,3102,273,097
DoS Hulk161,75146,21523,107231,073
PortScan111,25131,78615,893158,930
DDoS89,61825,60612,803128,027
DoS GoldenEye72052059102910,293
FTP-Patator551615887947898
SSH-Patator412811795905897
DoS slowloris405711595805796
DoS Slowhttptest384911005505499
Bot13763931971966
Web Attack Brute Force10553011511507
Web Attack XSS45713065652
Infiltration267336
Web Attack Sql Injection154221
Heartbleed82111
Total1,981,519566,149283,0752,830,743
Table 4. Hyperparameters of convolutional neural network model.
HyperparameterValue
Convolutional kernel32-32-64-64
Pool_size2 × 2
Strides2
Dropout0.2
Full connection layer nodes128
Learning rate0.008
Iterations100
mini-batch-size2048
Activation functionReLU
Optimization algorithmNadam
loss functioncategorical_crossentropy
Table 5. Performance Results of Binary Classification on UNSW-NB15 Dataset.
ModelImbalanced AlgorithmsAccRecallFARPrecisionF1-ScoreTrain-Times (s)Test-Times (s)
RFSMOTE0.98750.99990.01410.90060.947630.130.26
ROS0.98750.99990.01410.90060.947628.840.26
ADASYN0.98750.99990.01410.90060.947629.400.27
RUS + SMOTE0.98750.99990.01410.90050.947621.080.26
K-means + SMOTE0.98760.99960.01390.90200.948318.050.28
CSK0.98780.99800.01350.90460.949118.060.26
MLPSMOTE0.98840.99800.01280.90900.95142859.426.60
ROS0.98800.99900.01340.90540.94993059.286.61
ADASYN0.98780.99940.01370.90300.94882996.846.26
RUS + SMOTE0.98850.99950.01370.90310.94881739.536.54
K-means + SMOTE0.98850.99800.01280.90900.95151884.726.36
CSK0.98980.99390.01070.92220.95671887.676.71
CNNSMOTE0.98770.99960.01380.90230.94857836.5119.21
ROS0.98830.99910.01310.90680.95076077.9620.05
ADASYN0.98890.99670.01210.91310.95317789.3422.46
RUS + SMOTE0.98920.99610.01170.91570.95434595.5521.93
K-means + SMOTE0.98900.99720.01210.91370.95364508.7419.40
CSK0.99140.98700.00800.94030.96314212.5019.48
Table 6. Performance Results of Binary Classification on CICDS2017 Dataset.
ModelImbalanced AlgorithmsAccRecallFARPrecisionF1-ScoreTrain-Times (s)Test-Times (s)
RFSMOTE0.99480.98540.00290.98830.986842.250.34
ROS0.99490.98560.00280.98840.987044.730.35
ADASYN0.99490.98560.00280.98840.987043.580.34
RUS + SMOTE0.99500.98560.00270.98890.987343.980.36
K-means + SMOTE0.99500.98550.00270.98890.987237.270.32
CSK0.99590.99890.00490.98040.989631.260.35
MLPSMOTE0.99810.99930.00220.99120.99533138.297.28
ROS0.99780.99940.00260.98960.99453276.217.56
ADASYN0.99770.99830.00250.99000.99423186.588.24
RUS + SMOTE0.99820.99940.00220.99120.99532586.217.01
K-means + SMOTE0.99840.99940.00170.98960.99452784.787.50
CSK0.99860.99840.00130.99460.99652462.867.55
CNNSMOTE0.99930.99980.00080.99690.99846242.2430.58
ROS0.99940.99970.00070.99740.99856028.1432.23
ADASYN0.99920.99960.00090.99650.99806342.1828.46
RUS + SMOTE0.99920.99960.00090.99650.99804042.3924.98
K-means + SMOTE0.99930.99970.00080.99690.99833956.5422.51
CSK0.99940.99960.00060.99760.99863917.5826.29
Table 7. Multi-classification Performance Results on UNSW-NB15 Dataset.
ModelImbalanced AlgorithmsAccRecallPrecisionF1-ScoreTrain-Times (s)Test-Times (s)
RFSMOTE0.92050.92050.95340.930480.470.3441
ROS0.92090.92090.95320.930970.120.3361
ADASYN0.92310.92310.95190.931869.770.3381
RUS + SMOTE0.92320.92320.95250.932210.080.3351
K-means + SMOTE0.92230.92230.95210.93148.640.3431
CSK0.93120.93120.94650.93489.210.34
MLPSMOTE0.94410.94410.95120.94721740.831.38
ROS0.94920.94920.95300.95091595.380.96
ADASYN0.93740.93740.94690.94211708.831.00
RUS + SMOTE0.93780.93780.95370.94391053.861.85
K-means + SMOTE0.94140.94140.95450.9465995.431.09
CSK0.95230.95230.95380.9525988.850.78
CNNSMOTE0.94720.94720.95880.95183223.574.20
ROS0.94770.94770.95790.95173836.514.27
ADASYN0.94350.94350.95610.94863273.565.10
RUS + SMOTE0.94620.94620.95800.95081538.405.23
K-means + SMOTE0.94690.94690.95880.95101863.285.09
CSK0.95480.95480.95970.95601448.414.26
Table 8. Multi-classification Performance Results on CICDS2017 Dataset.
ModelImbalanced AlgorithmsAccRecallPrecisionF1-ScoreTrain-Times (s)Test-Times (s)
RFSMOTE0.99760.99760.99830.997732.591.01
ROS0.99760.99760.99830.997733.961.00
ADASYN0.99760.99760.99830.997733.511.25
RUS + SMOTE0.99770.99770.99840.997820.810.90
K-means + SMOTE0.99770.99770.99830.997835.020.89
CSK0.99770.99770.99830.997829.070.90
MLPSMOTE0.99780.99780.99840.9979859.772.08
ROS0.99780.99780.99810.9978901.441.67
ADASYN0.99780.99780.99810.9978893.521.46
RUS + SMOTE0.99780.99780.99840.9978567.421.52
K-means + SMOTE0.99770.99770.99800.9977594.052.06
CSK0.99790.99790.99820.9979540.801.96
CNNSMOTE0.99790.99790.99850.99801638.524.72
ROS0.99790.99790.99850.99801683.265.39
ADASYN0.99790.99790.99850.99801678.924.36
RUS + SMOTE0.99790.99790.99850.9980669.136.55
K-means + SMOTE0.99800.99800.99850.9980648.536.48
CSK0.99800.99800.99860.9982653.854.73
Table 9. A comparison of proposed CSK-CNN with the current state-of-the-art models.
DatasetModelAcc (%)
UNSW-NB15CSCADE-ANN [25]95.98
Chameleon [26]89.52
ICVAE-DNN [27]89.08
SMOTE + GMM [19]96.54
Proposed CSK-CNN98.77
CICIDS2017CFS-BA [28]99.89
PCA + RF [20]99.60
DNN [18]99.57
PCCN [29]99.87
Proposed CSK-CNN99.91
Disclaimer/Publisher’s Note: The statements, opinions and data contained in all publications are solely those of the individual author(s) and contributor(s) and not of MDPI and/or the editor(s). MDPI and/or the editor(s) disclaim responsibility for any injury to people or property resulting from any ideas, methods, instructions or products referred to in the content.

