Article

Improving CS1 Programming Learning with Visual Execution Environments

by
Raquel Hijón-Neira
1,*,
Celeste Pizarro
2,
John French
3,
Pedro Paredes-Barragán
1 and
Michael Duignan
3
1
Computer Science Department, Universidad Rey Juan Carlos, 28032 Madrid, Spain
2
Applied Mathematics Department, Universidad Rey Juan Carlos, Móstoles, 28933 Madrid, Spain
3
Department of Computer Science & Applied Physics, Atlantic Technological University, H91 T8NW Galway, Ireland
*
Author to whom correspondence should be addressed.
Information 2023, 14(10), 579; https://doi.org/10.3390/info14100579
Submission received: 16 August 2023 / Revised: 6 October 2023 / Accepted: 17 October 2023 / Published: 20 October 2023
(This article belongs to the Special Issue Information Technologies in Education, Research and Innovation)

Abstract

:
Students in their first year of computer science (CS1) at universities typically struggle to grasp fundamental programming concepts. This paper discusses research carried out using a Java-based visual execution environment (VEE) to introduce fundamental programming concepts to CS1 students. The VEE guides beginner programmers through the fundamentals of programming, utilizing visual metaphors to explain and direct interactive tasks implemented in Java. The study’s goal was to determine if the use of the VEE in the instruction of a group of 63 CS1 students from four different groups enrolled in two academic institutions (based in Madrid, Spain and Galway, Ireland) results in an improvement in their grasp of fundamental programming concepts. The programming concepts covered included those typically found in an introductory programming course, e.g., input and output, conditionals, loops, functions, arrays, recursion, and files. A secondary goal of this research was to examine if the use of the VEE enhances students’ understanding of particular concepts more than others, i.e., whether there exists a topic-dependent benefit to the use of the VEE. The results of the study found that use of the VEE in the instruction of these students resulted in a significant improvement in their grasp of fundamental programming concepts compared with a control group who received instruction without the use of the VEE. The study also found a pronounced improvement in the students’ grasp of particular concepts (e.g., operators, conditionals, and loops), suggesting the presence of a topic-dependent benefit to the use of the VEE.

1. Introduction

Programming ability is widely seen as a highly useful skill in our modern technological society. The need, therefore, arises to examine the variables and tools that can influence students’ success in acquiring this skill [1]. Learning to code involves a variety of factors, including the educational process, instructional materials, the technology employed, and metacognitive aspects. It is clear that engaging lessons and activities only have value when they have an impact on the pupils [2]. To this end, teaching aids and innovative teaching techniques may increase students’ feelings of success [3] and aid in their development of confidence, which is consistent with constructivist teaching methods and the theories of Piaget and Vygotsky [4,5,6,7,8].
Many students find fundamental programming concepts abstract and complicated upon first encountering them and experience challenges and misperceptions as a result [9]. Teachers could benefit from guidance in how to effectively teach these students since problems can result from a lack of or inadequate teaching methodologies [10,11]. Numerous strategies have been used to attempt to address these challenges, for instance, leveraging mobile technology [12] and pair programming [13]. Competitive programming challenges and contests are also popular [14] as is the use of automatic graders [15] in assessment. Research has also been carried out into the most effective sequence in which to introduce new concepts to students [16].
Visual Execution Environments (VEEs) have been proven to be effective in introducing programming concepts to students taking introductory programming courses at the university level (commonly referred to as CS1 students) [17] as well as to younger students [16]. Learning through game programming [18] and using a combination of VEEs and game programming [19] have also been found to be effective approaches.
The contribution of this research is a rigorous investigation into how to teach fundamental programming concepts at the CS1 level. In this research, a Java Visual Executing Environment (JVEE), created specifically for CS1 students, was evaluated as a teaching, learning, and practice tool for computer programming. The study aimed to address two research questions (RQ):
  • RQ1: Can this cohort of CS1 students benefit from the use of a Java Visual Execution Environment to enhance their understanding of programming concepts?
  • RQ2: Which programming principles are typically easier to understand? Furthermore, which are challenging?
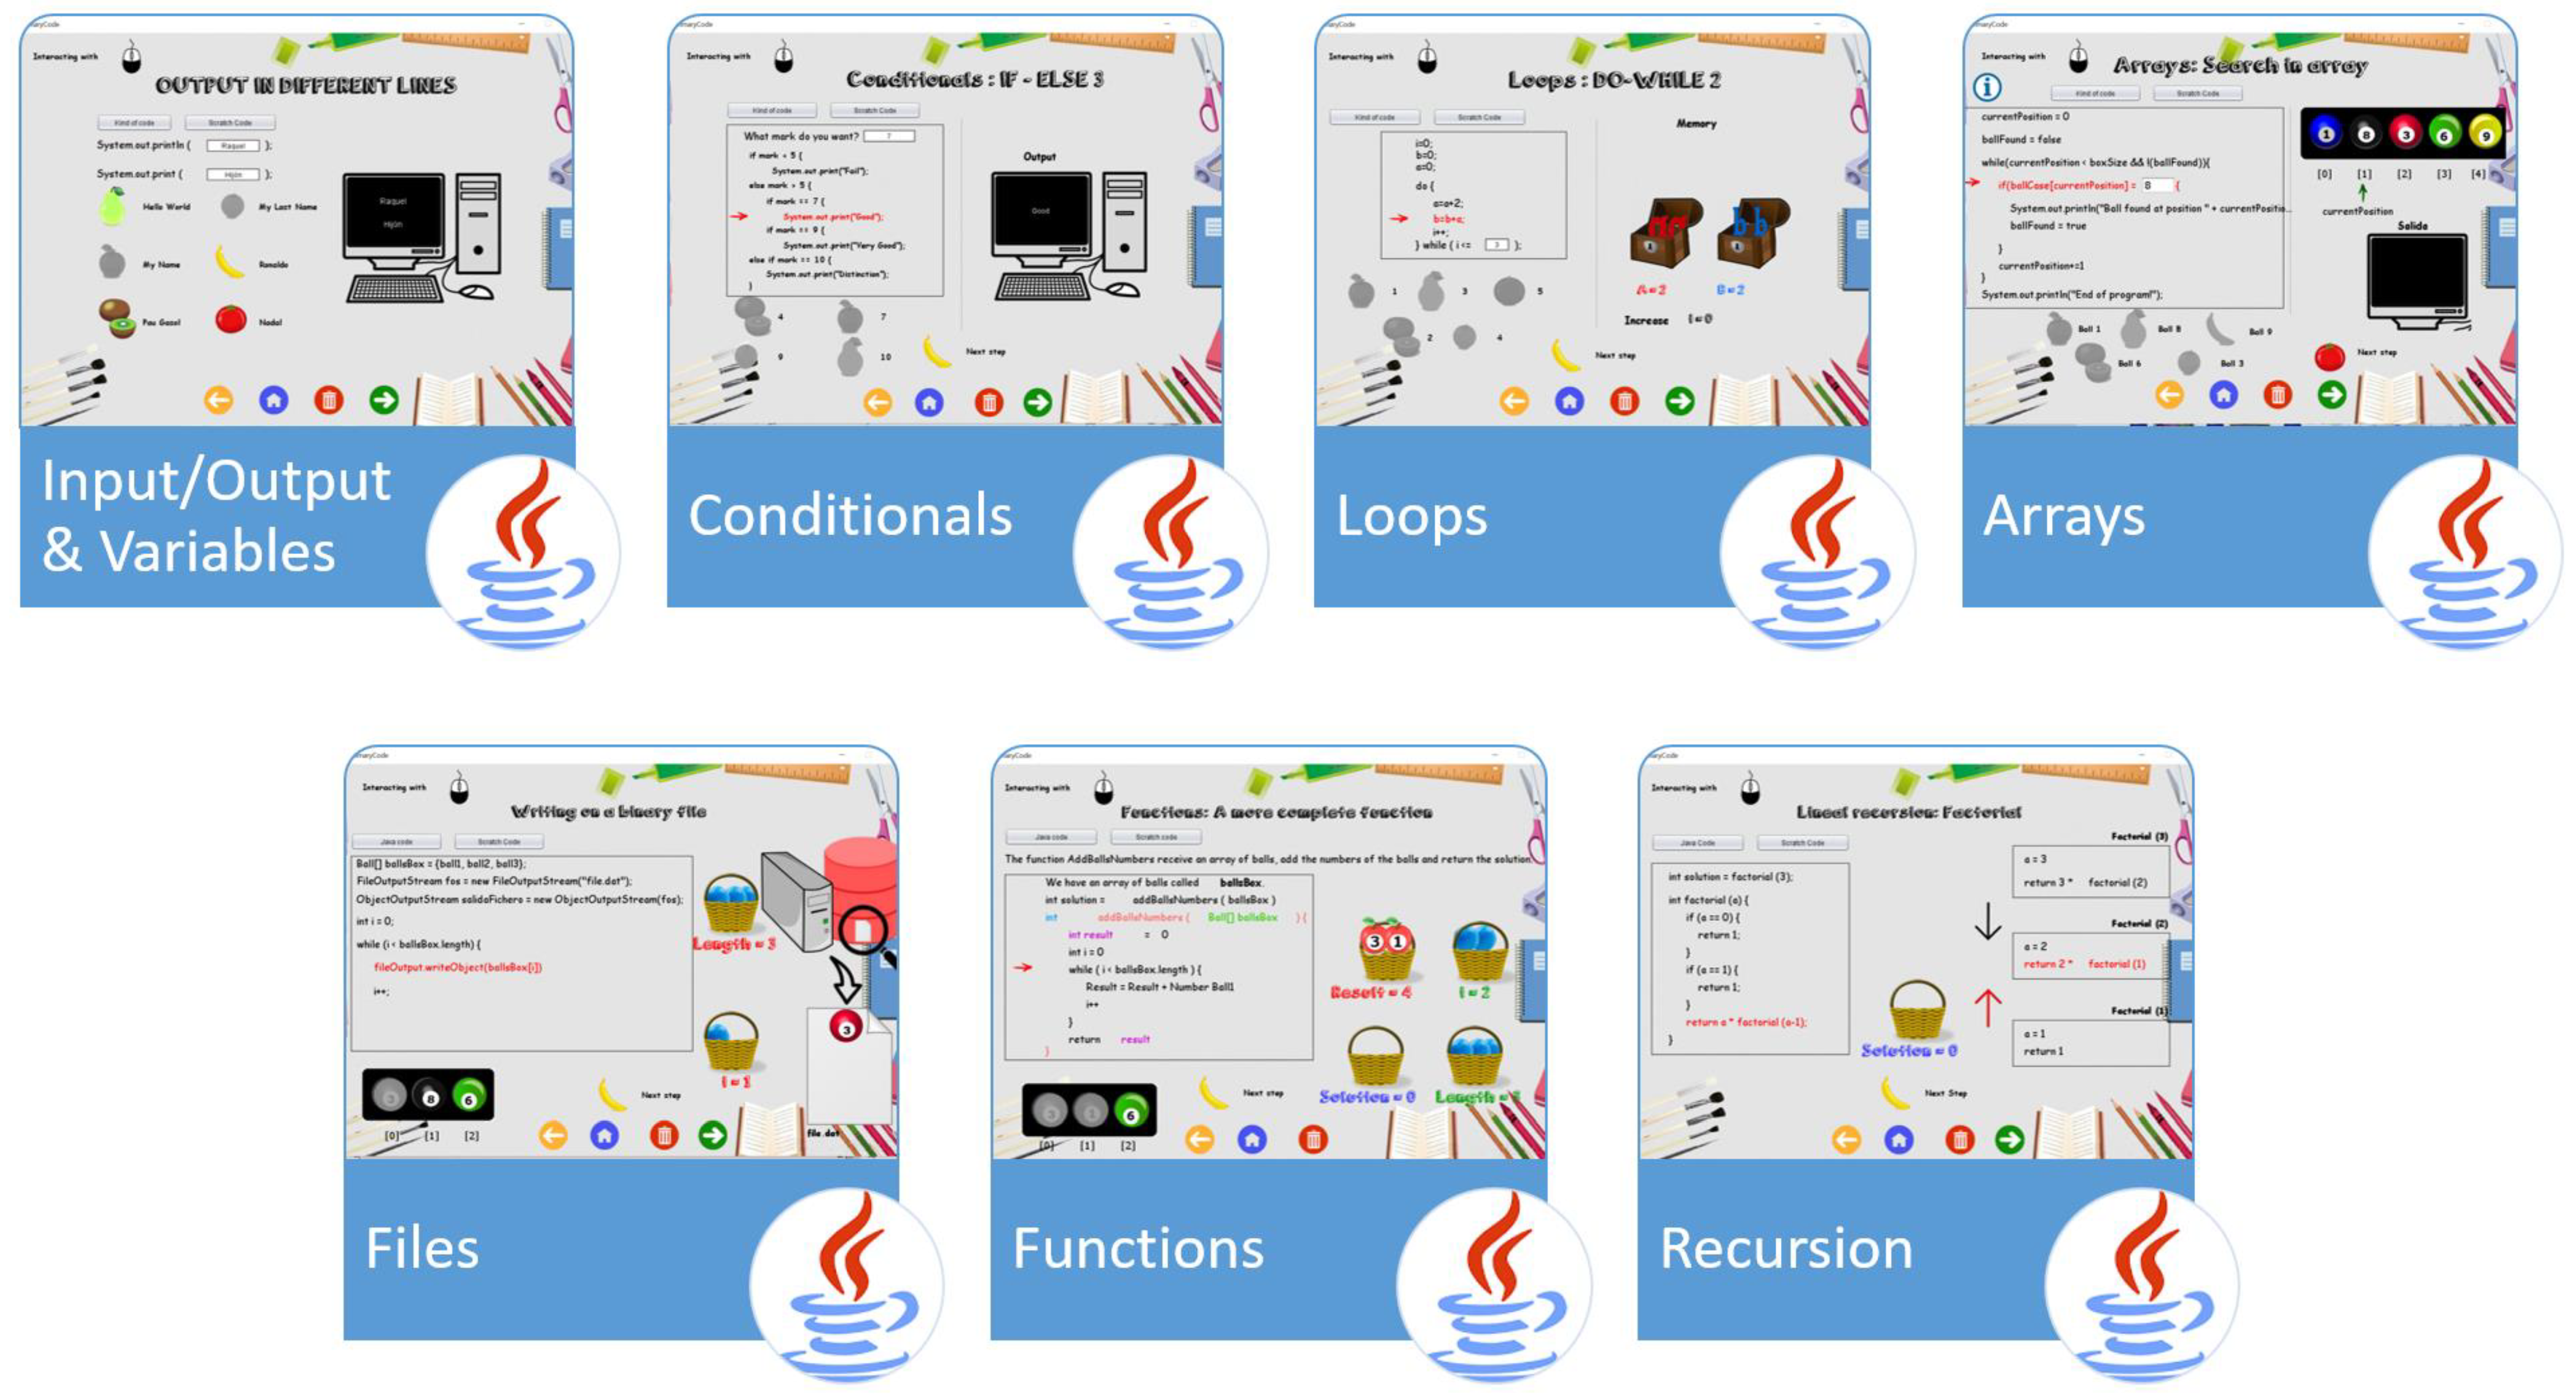
The programming concepts covered here can be found in a typical “Introduction to Programming” course, including input and output structures, conditionals, loops, arrays, functions, recursion, and files.
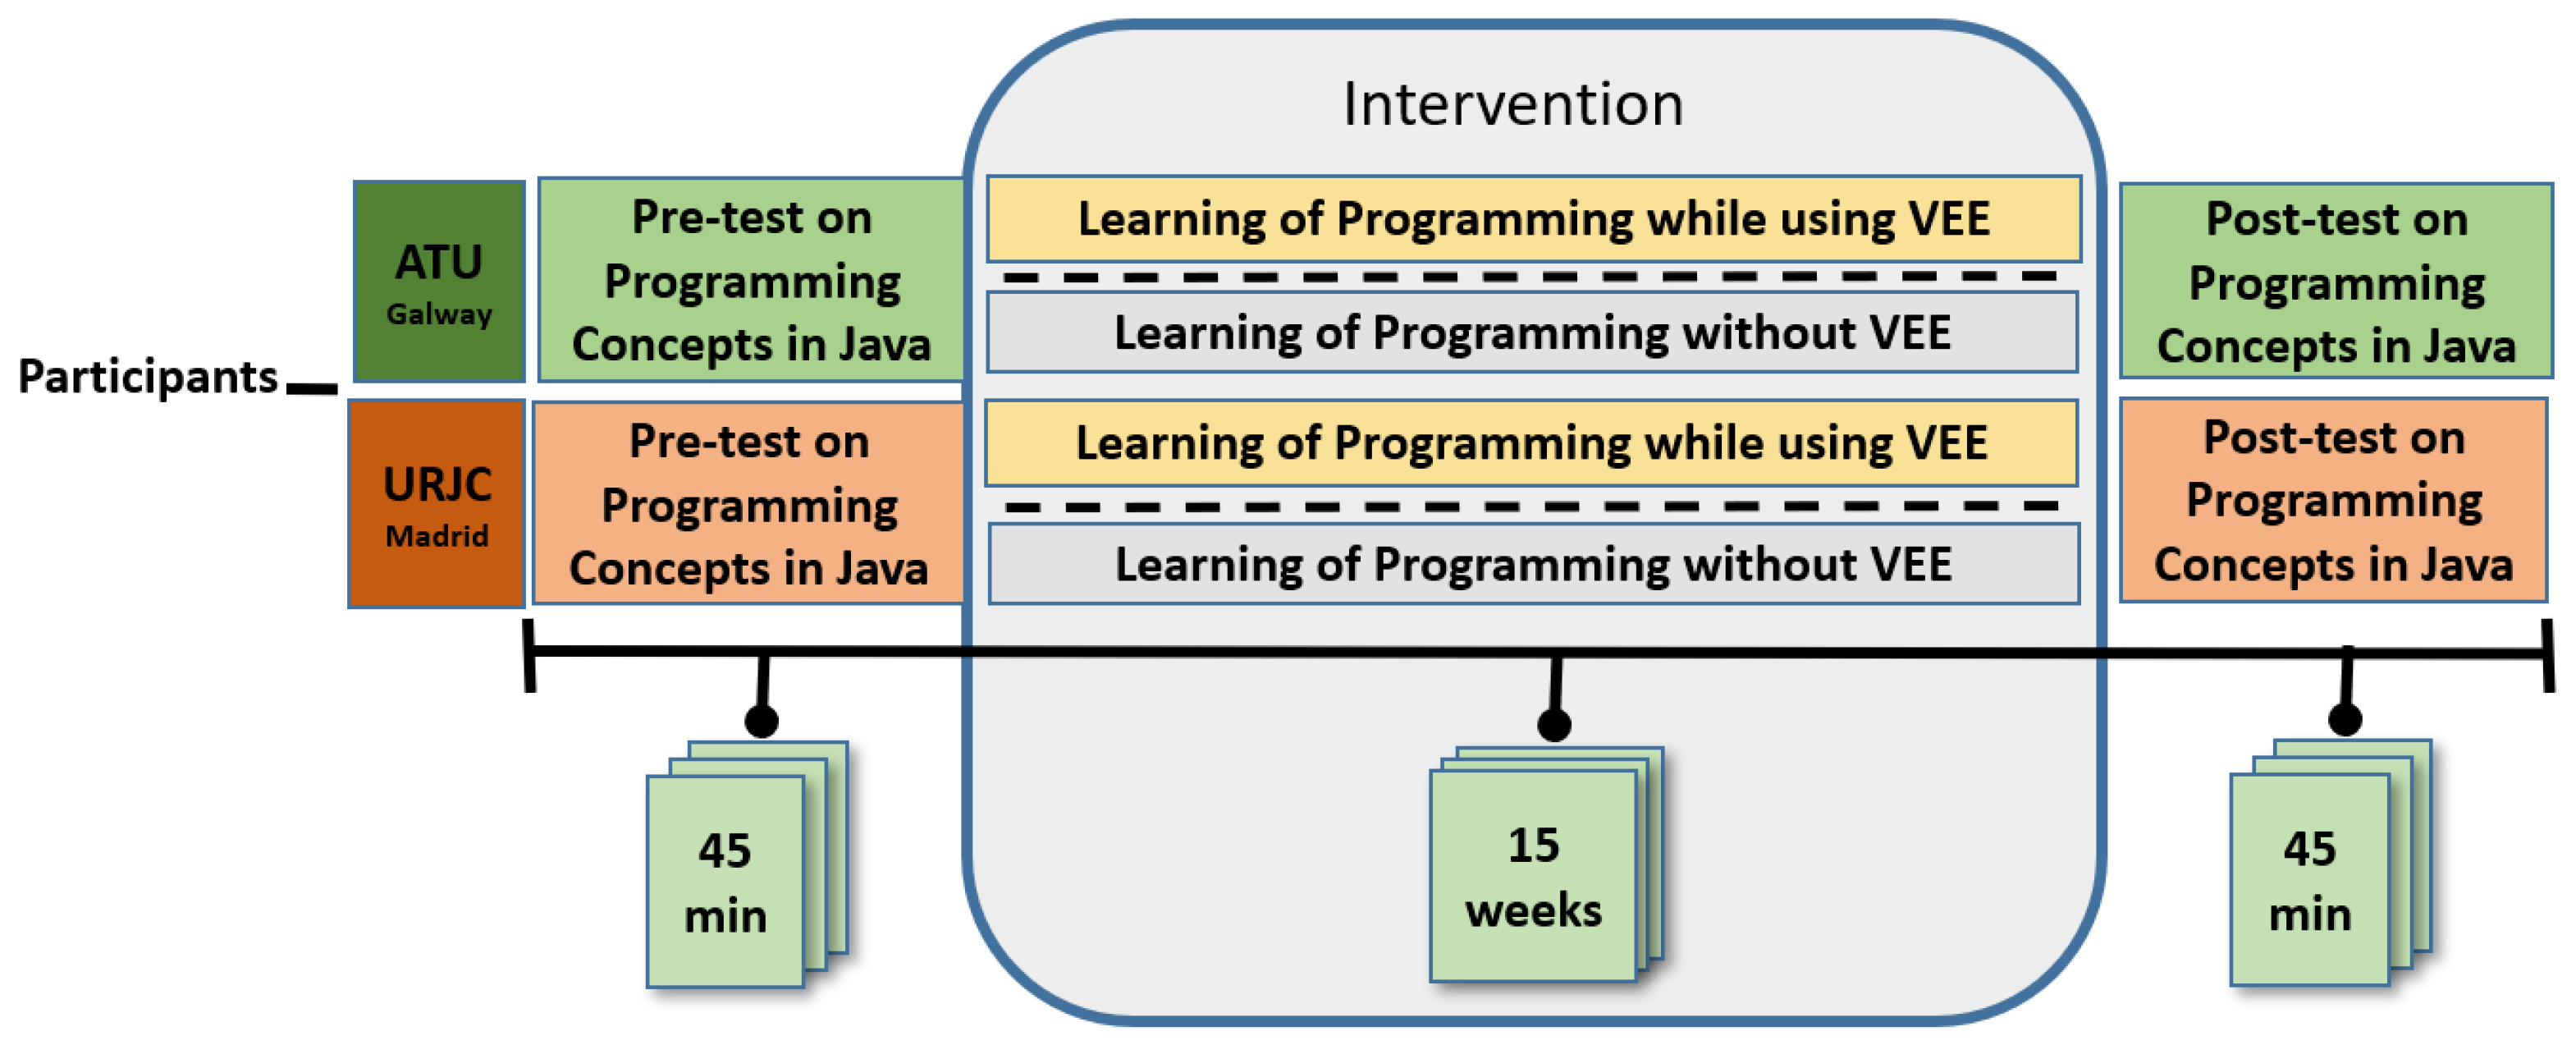
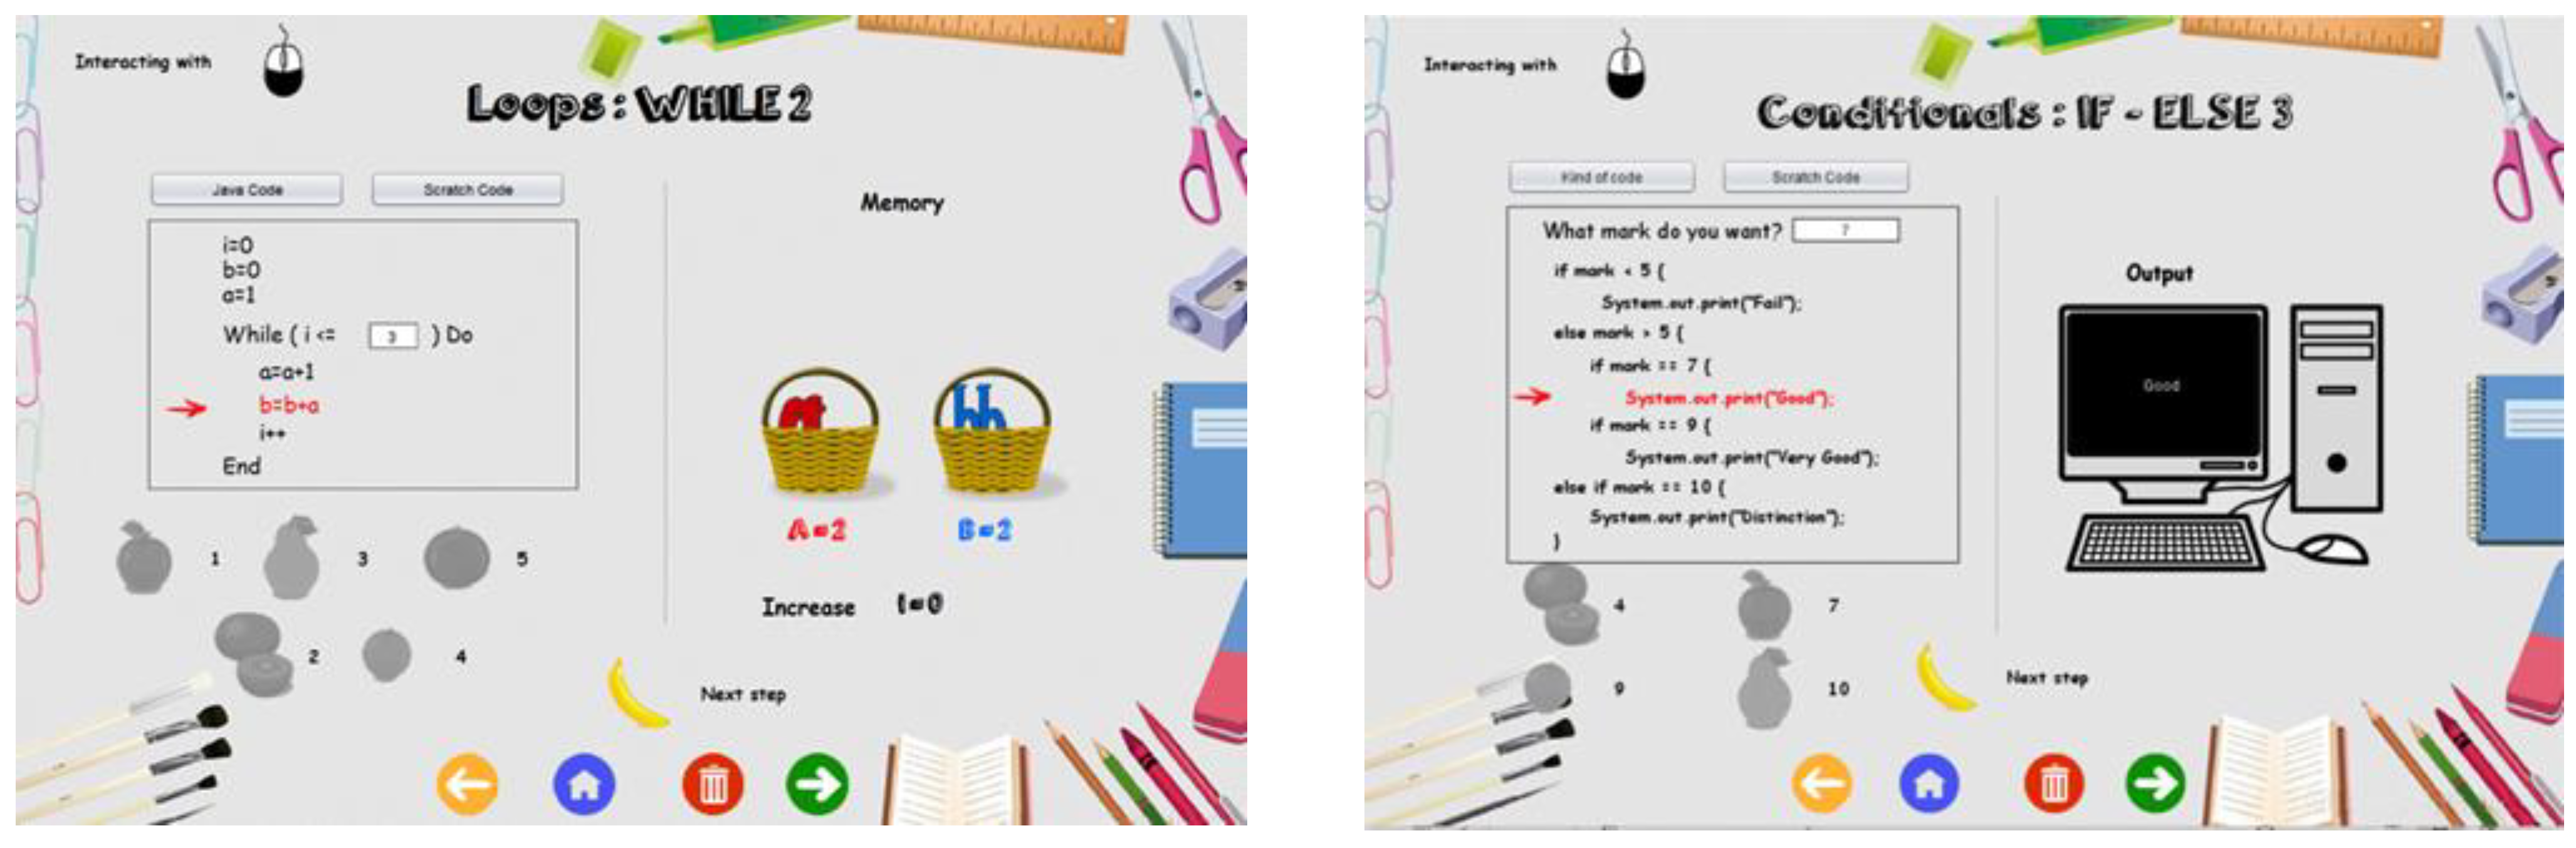
This paper examined whether a group of 63 CS1 undergraduate students registered for a Java-based introductory programming course in one of two universities (in Galway, Ireland and Madrid, Spain) could develop their programming skills under the guidance of the VEE. Secondly, it looked into whether use of the VEE had a topic-dependent benefit, i.e., whether particular topics could be taught effectively with the VEE more than others. The same lessons and order of concepts were followed on both university sites, and four very experienced and coordinated tutors taught the module to the CS1 students in each university. The student cohort was divided into four groups: two groups were designated as the experimental groups, and the other two as the control groups. The JVEE was used in the instruction of the experimental groups, whereas the control groups received the usual instruction given to CS1 students at the participating sites. The process for the experimental group included an introduction to each concept being taught, which was also conducted through initially using the Java VEE. The JVEE provided interactive exercises with visuals illustrating the execution of the code in steps, alongside giving context for the concepts using pre-made, on-the-spot exercises based on metaphors for each idea and practice with suggested activities in Java.
The JVEE was used for the whole of the first semester of 2021–2022 in Madrid, from 13 September to 22 December, and secondly, in Galway, Ireland, in the second semester of 2022–2023, from 23 January to 5 May. The improvement in the pupils’ learning was evaluated with a test before and after the course, which had 28 multiple-choice questions that covered the programming fundamentals. The same test was administered before and after the course of instruction with the JVEE. The findings revealed that the use of the JVEE resulted in a significant improvement in students’ programming ability in all topics, except conditionals. The improvement was particularly pronounced for some concepts, such as loops, recursion, files, arrays, and functions.
This paper is organized as follows: Section 2 examines the theoretical framework for enhancing programming learning, complementary methods for teaching programming, and Visual Execution Environments. Section 3 describes the research design, pedagogical strategy, research participants, and instruments for measuring. The experiment’s findings are presented in Section 4, both generally and with programming ideas. Section 5 discusses the limits of the study. Section 6 summarizes the results and suggests areas for further research.

2. Theoretical Framework

2.1. Learning How to Program

Programming is purportedly an extremely demanding topic or ability; thus, it is understandable that pupils find it difficult [20] to learn. Some authors have looked into what aspects of students’ mathematical aptitude, processing speed, analogical thinking, conditional reasoning, procedural reasoning, and temporal thinking [21] can influence their ability to acquire programming skills. Good programmers have generally been found to be proficient in many of these areas. Beginner programmers frequently struggle with basic ideas like variables, loops, and conditionals. According to research, individuals have trouble grasping the syntax and semantics of programming languages, which can result in logical and syntax problems [22,23]. When presented with programming obstacles, many students have trouble devising efficient problem-solving techniques. They might place more emphasis on syntax than algorithm design, resulting in hard-to-read and -maintain code [24].
According to Brooks [25], “I think the difficult one of developing software is the creation of this intellectual construct, specifically its specification, design, and testing, not the work of representing it and evaluating the fidelity of the representation. We still make syntactic mistakes, for sure, but they pale in comparison to the conceptual flaws found in the majority of systems. If this is the case, developing software is and always will be challenging” (p. 182). Many of the difficulties highlighted by Brooks are likely to be faced by initial computer science students (CS1) during their initial term of programming instruction. Novice programmers must learn abstract programming concepts, the syntax of a programming language, and the process of designing and constructing an algorithm, as well as how to use the development environment used in the class.
Usually, CS1 students begin by learning to write very basic programs such as “hello world”, where fundamental concepts like system output and variables are demonstrated. Over the course of the term, more elements are added, so that by the end, pupils have progressively been exposed to the key constructs of the programming language. In order to develop their ability to write programs to specific requirements, students are expected to practice using programming ideas through a variety of tasks [26]. It is crucial to keep students motivated and interested during the whole CS1 course. Demotivation can cause a decline in persistence and interest in programming learning [27].
The sequential process of converting system design specifications into functional programming code is composed of five separate steps: specification, algorithm, design, code, and testing. The specification, which is frequently rewritten in a detailed and close-to-implementation manner, helps the students grasp the issue domain and develop an acceptable method. It is typically stated in simple language. An algorithm is then developed and subsequently translated into programming constructs which can then be implemented in code, heavily reliant on abstraction. This step should not be difficult with a good design, depending on the programming language. Testing comes before the program is put into action, which is the last stage. This order is ideal for creating an effective computer program, although students frequently skip the specification and design phases in favor of the last “code” component. Since such methods are frequently strengthened in the way the subject is offered through books and talks, numerous inexperienced programmers have a tendency to focus on syntax [28].
Conceptualization, problem solving, logical mathematical thinking, procedural reasoning, evaluation, bug fixing, and career advancement are only a few of the abilities that are used in programming [21], and they cannot be used alone. It might be difficult for students to generalize and abstract programming principles. Their capacity to apply newly acquired knowledge to novel issues is hampered by this [29]. They are used in the context of a specific issue or problem region. The undergraduate program a student is pursuing will frequently dictate the quantity of programming that is performed, the language used, and the educational setting.

2.2. Complementary Methods for Teaching Programming

Many different academic backgrounds are represented in CS1 classes, and some students might not have had any programming experience before. It can be difficult for instructors to cater to this wide range of knowledge levels [30]. The instructional methods and programming languages used have a significant impact on how well pupils learn. It is crucial to strike the proper balance between theoretical ideas, practical programming, and real-world applications [31]. There are a variety of methods that have been found to be effective in assisting students who are taking introductory programming classes, including making use of an adaptive virtual reality platform [32], problem solving with artificial intelligence [33], simulation games [34], serious games [35,36], games and contests [14], using robots [37], and comparisons between block and text programming [38,39]. Also, programmers must have strong debugging abilities; however, beginners may find it difficult to locate and successfully correct flaws in their code, since they might not have a methodical debugging strategy [40]. For students who are having trouble, proper help and resources are essential. Learning results for struggling students can be enhanced by early detection and additional support [41], providing guidance, avoidance of negative consequences, and setting an adequate level of challenge [14].

2.3. The Visual Execution Environment

The PrimaryCode (https://tinyurl.com/2s334mfe (accessed on 30 July 2023)) visual execution environment (VEE) discussed in this article made use of pre-existing programs in Java for each of the suggested lessons [42]. Since the VEE was implemented in Java, it was platform-independent, requiring only that Java was installed on the host machine. It included a guide to gradually teach programming ideas (from simple to complex), utilizing predefined programming environments, thereby avoiding problems with syntax and giving new programmers a sense of security while they learn.
The Fogg model [42] states that the three factors intended to alter human behavior are skill (the degree of difficulty faced when performing the deed), trigger (the agent that initiates the action), and desire (to behave out of incentive, awe, fright, pleasure, etc.). An effective learning and instructional technique for fresh ideas that in this case included the ones connected with a specific introductory coding course was made possible by this VEE, which created a dynamic where these three parts all simultaneously came together.
The Mishra and Koehler TPACK model [43] was the basis for the integration of the necessary information into the VEE and the development of a useful tool for instructional programming ideas. Through the continual incorporation of technology into instruction, TPACK pinpointed the areas where students’ learning experiences were enhanced. In this area, knowledge from three different fields intersected: the understanding of the subject (programming ideas), pedagogical (displaying the execution of scripts along with other PC activity, display, RAM, data, etc.), and technical expertise (using Java and Scratch to run scripts). As depicted in Figure 1, TPACK is situated where the three regions converge.

3. Research Design

The method of didactic research for the computer instruction employed was based on the concepts of research-based learning. This study was created to support the teaching of fundamental coding ideas to pupils in the development of programming knowledge. Pre- and post-testing were conducted according to the experimental technique. It included tests before and after the full set of teaching sessions and was utilized to assess the seven introductory programming lessons’ coverage of programming principles using the same evaluation metrics. In both universities, the Atlantic Technological University Galway in Ireland and Spain’s Universidad Rey Juan Carlos, the CS1 participants completed a starting literacy pre-test, then used the VEE for Java to introduce each concept being taught into the instruction of their experimental groups. The VEE was not used with the control groups. After fifteen weeks of training in all the programming concepts that a CS1 introductory programming course should include, students completed a post-test to measure their progress. Each student took the test on their own at their assigned place. The schematic illustrating the subsequent experimental strategy is shown in Figure 2.

3.1. Pedagogical Strategy

A menu item was created that contained all seven lessons necessary for any introductory programming course. This arrangement allowed for logical ordering with no confusing topics. The Java TPACK PrimaryCode VEE offered built-in applications using preloaded scripting that allowed learners to sequentially select from a variety of suggestions for the scripts’ practice sessions as they followed the suggested classes. The instructor could utilize a different sequencing strategy than the one indicated due to this division, if necessary. This was crucial since certain concepts depend on prior learning, e.g., the knowledge of conditionals is necessary to understand loops. With an average screenplay length of 1.5 min, Table 1 provides the topics, description, and quantity of scripts for each topic.
Each lesson was thoughtfully created with the goal of encouraging successful concept assimilation. The chronology of the instructive method involved first demonstrated how to execute the script towards the left-hand side of the screen. Then, towards the right, a graphic representation appeared, showing numerous components including memory chests or containers, the computer monitor, and an array that looked like carton vegetables, among other things. Additionally, the sessions included a variety of activities and scripts, giving pupils the chance to interact with various data. All of the data included was easily available on the screen’s lower-left corner. Figure 3 displays two instances of the Java code executed, one for the conditionals and the other for the loops. The scripts provided immediate feedback to the students. The combined interaction of the learner with the script, visualizations, and sample data facilitated the assimilation of the concepts being studied (Figure 4).

3.2. Research Participants

Computer science CS1 undergraduates in two separate groups participated in the research. At the Atlantic Technological University of Galway in Ireland, there were two cohorts, one for the experimental group with 11 students and another for the control group with 10 students. Similarly, Madrid’s Universidad Rey Juan Carlos, Spain, had an arrangement of 22 students within the test group and 20 in the control group. All 63 students in both universities were registered for an “Introduction to Programming” in Java course, the ones in Spain in the first semester of the academic year 2021–2022, and the ones in Ireland during the second semester of the academic year 2022–2023. The age range of the students in the cohorts was 18 to 21, and they were all citizens of either Ireland or Spain. The exact same procedure was followed during the two academic years.

3.3. Instrument for Measuring

Pre- and post-tests made use of the same questionnaire on Java programming topics utilized in this study to assess the effects of the semester’s instruction on students’ programming abilities. An established procedure was utilized in both the preliminary and final evaluations. The exact same methodology, which included 28 multiple-choice questions about programming topics, was used to evaluate each group. Table 2 deals explicitly with these ideas. Each test had a total score of 10 points. Questions from the initial and subsequent tests included were written and edited by professionals with many years of programming experience. When a question was properly answered, the scoring rubric automatically awarded one point, and when it was erroneously answered, zero points. Additionally, links exist to the Java tests in English (https://tinyurl.com/primarycodeTest accessed on 18 October 2023) and Spanish (https://tinyurl.com/t8ecaf6x accessed on 18 October 2023).

3.4. Validity and Reliability

IBM SPSS Statistics Version 28 was used to complete the entire statistical analysis. The Cronbach’s alpha was 0.819, which was a good value to gauge the internal consistency of the responses to the preliminary and final questionnaires as well as the questions posed to assess the programming ideas. This value did not rise as items were deleted.

4. Results

This discussion first focuses on the overall findings, where it was investigated whether the use of the JVEE affected how well students acquired programming skills. Secondly, we examine if there was a topic-dependent benefit to the use of the JVEE.

4.1. Overall Results

Possible changes between the scores of the preliminary and final evaluations were studied. If there were variations, they were quantified.
Table 3 shows the mean, median, and standard deviation, respectively, as the main descriptive statistics for centralization, position, and dispersion. These values are shown for both the experimental and control groups.
As stated in Table 3, the mean and median values for both the control and experimental groups were higher in the post-test than for what was observed in the pre-test. It was also observed that the increase in the value of the mean and median was greater in the experimental group (from 4.61 to 7.48 for the mean and from 4.64 to 7.86 for the median) than in the control group (from 5.10 to 6.91 for the mean and from 5.00 to 7.67 for the median). The standard deviation increased in the post-test for both groups, being much larger in the control group.
Figure 5 shows a bee swarm plot of the pre- and post-test scores for the control and experimental groups. Red and green dots show the score of each student from the URJC in Spain and the ATU in Ireland, respectively. As can be seen, lower values in both post-tests occurred, to a greater extent in the students from Ireland.
First, the normality of the data was checked with the Shapiro–Wilk test. The results suggested no apparent violation of the assumption (in the control group, p = 0.154 and p = 0.112 for the pre- and post-tests, respectively, and, in the experimental group, p = 0.097 and p = 0.137 for the pre- and post-tests, respectively). This allowed for verifying this improvement with a t test of paired samples. As reflected in Table 4, the improvements, both in the control and experimental groups, were statistically significant. This improvement was accounted for using the d-Cohen test with a value of 1.851 for the control group and 1.898 for the experimental group, both very large.
If the interest is in knowing the difference between both methods, that is, directly comparing the control group with the experimental group, the t-Student test was used to consider unrelated instances (see Table 5).
Table 5 shows the difference, first of all, between the experimental group’s pre-test results and those of the control group. As can be seen, both the pre-tests were homogeneous (p-value = 0.057). For this reason, both groups’ follow-up test results could be directly compared, since they started from the same conditions. In the case of the comparison between the post-tests for the control and experimental groups, there was a statistically significant difference (p-value = 0.019).
To take into account all these particularities that are separately presented, a more advanced mathematical model was used, ANCOVA. In this model, the pre-test scores were included as a covariate, including factors such as place of origin (Spain or Ireland) and group (control or experimental). To do this, first of all, we checked that the conditions able to be applied to this model were verified, namely, the normality of the data and homoscedasticity. The results showed that normality of the data occurred (using the Shapiro–Wilk test with p = 0.060 and p = 0.092 for the pre- and post-test variables, respectively). Homoscedasticity was checked with the Levene test. The results showed that the equality-of-variance assumption was not violated (p = 0.744).
In Table 6, it can be seen that the pre-test grade did not influence the model, although the influence of the location of the students was statistically significant (in Spain there were better scores, on average, than in Ireland), as well as the group to which they belonged (the post-test results showed that the experimental group performed better than the control group). The interaction of location and group was not statistically significant. Through the partial Eta-Squared values, we could measure the effect of each significant factor, being 0.260 for the location and 0.577 for the group, both corresponding to a large effect, though the value was double for the group factor (either experimental or control).

4.2. By Means of Programming Topics

Then, the research concentrated on observing what occurred when we took each dimension separately, namely, input and output, loops, conditionals, functions, arrays, recursion, and files.
The descriptive values for these variables in both the control and experimental groups and the pre- and post-tests, which are depicted in Figure 6, are shown in Table 7. For each dimension, the mean, median, and standard deviation, in that order, are shown.
As can be seen in Table 7, in which the main descriptors are shown, all the dimensions increased or maintained their mean values from the pre- to post-test scores, both in the control and experimental groups. The information given in the table is complemented by Figure 6, where the greatest rise in the mean values for the experimental group can be observed.
Table 8 reveals that one of these topic differences between the pre- and post-tests were statistically significant. This was tested using the t-Student test for paired sample design. For the control group, statistically significant advancements were made between the pre- and post-tests for all but the conditionals concept (p-value > 0.05). The same phenomenon occurred in the experimental group. Conditionals was the only concept in which the improvement was not statistically significant.

5. Discussion and Conclusions

The contribution of this research is a rigorous investigation into how to teach fundamental CS1-level coding topics and how this affects students’ educational advancements in response to such a proposition. In this research, a Java Visual Executing Environment (JVEE) was evaluated as a teaching, learning, and practice tool for computer programming that was created for CS1 students. There were two research questions that aimed to address this:
  • RQ1: Can this cohort of CS1 students benefit from the use of a Java Visual Execution Environment to enhance their understanding of programming concepts?
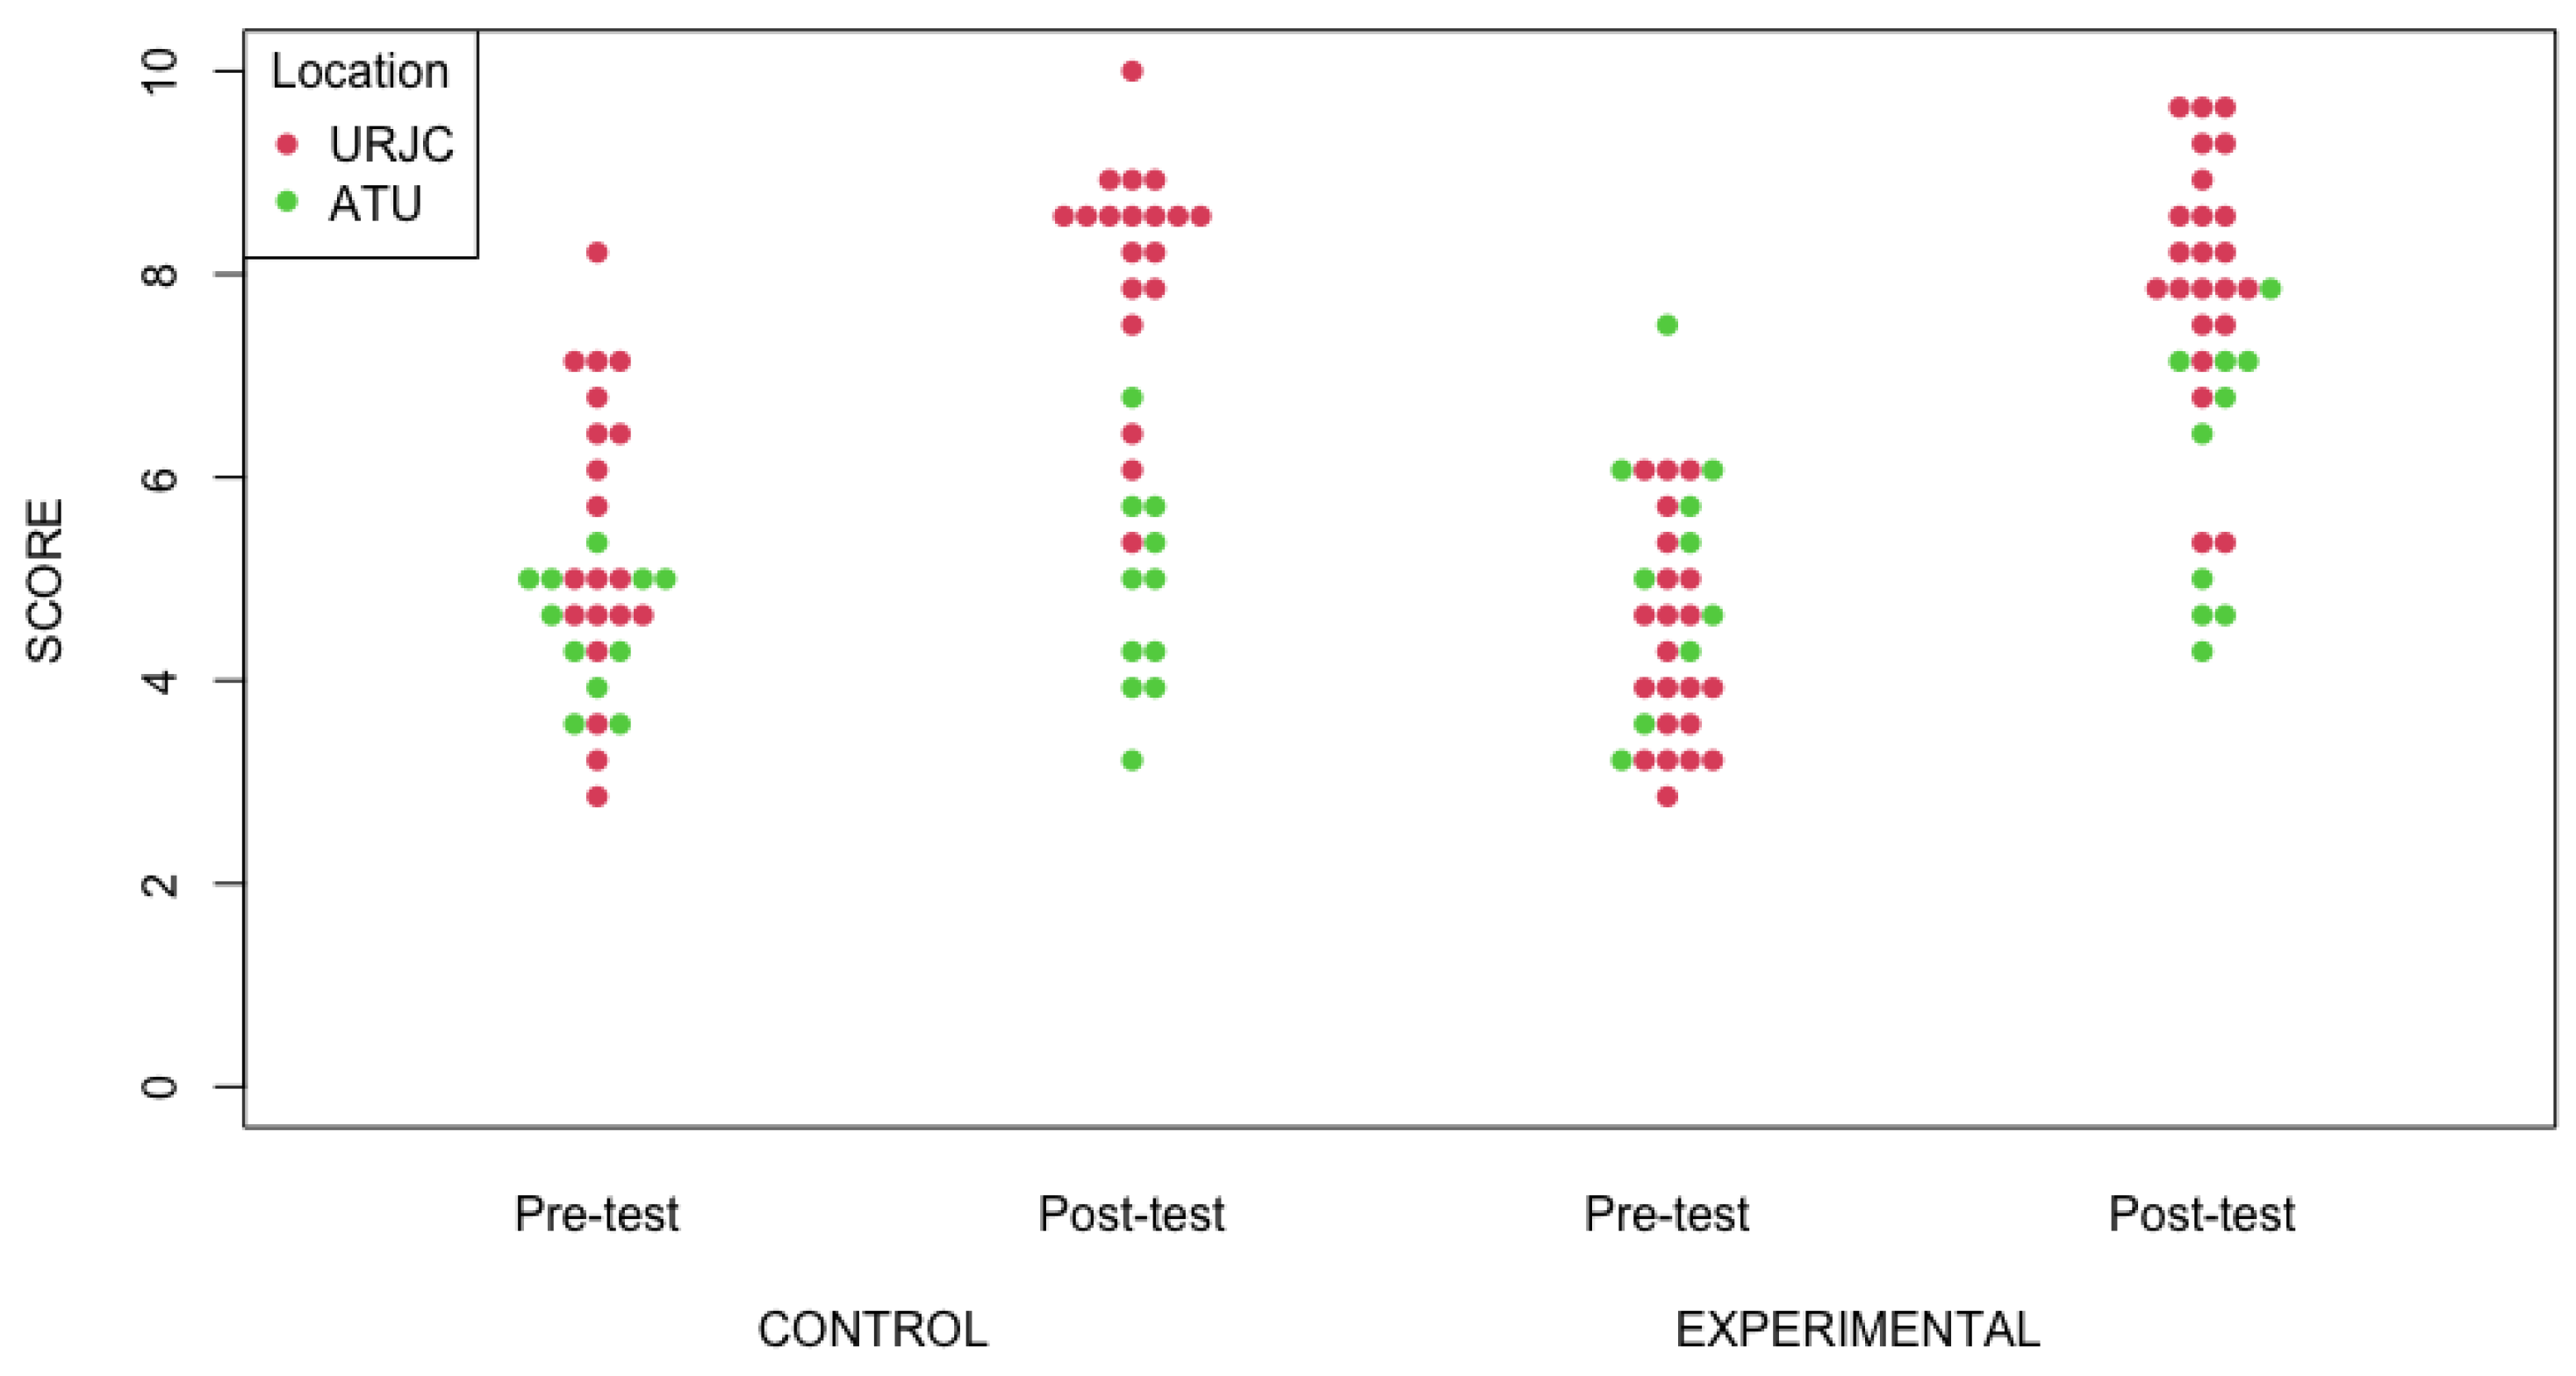
As discussed in the preceding section, statistically significant improvements in programming knowledge were seen in both the control and experimental groups as a result of undergoing a course of instruction. Since the question was whether the use of the JVEE had an impact on the students’ learning, it was therefore necessary to directly compare the control group (with no use of the JVEE) with the experimental group (with use of the JVEE). As it was seen, both pre-tests were homogeneous. For this reason, the post-tests of each group could be directly compared, since they started from the same conditions. In the case of the comparison of the post-tests for the control and experimental groups, there was a statistically significant difference.
To take into account all these particularities that are separately presented, a more advanced mathematical model was used, ANCOVA. In this model, the pre-test results were a covariate that included factors such as place of origin (Spain or Ireland) and group (control or experimental). To do this, first of all, it was verified that the conditions necessary for applying this model were present, namely, normality of the data and homoscedasticity.
Therefore, it was observed that the pre-test grade did not influence the model, although the influence of the location of the students was statistically significant (in Spain, there were better grades, on average, than in Ireland), as well as the group to which they belonged (the experimental group’s post-test scores were better compared with those of the control group in both locations). The interaction of location and group was not statistically significant. Through the partial Eta-Squared values, the effect of each significant factor could be measured. Both the location (Spain or Ireland) and the group factors (experimental or control groups) corresponded to a large effect, though the value was double for the group factors.
  • RQ2: Which programming principles are typically easier to understand and which are more challenging?
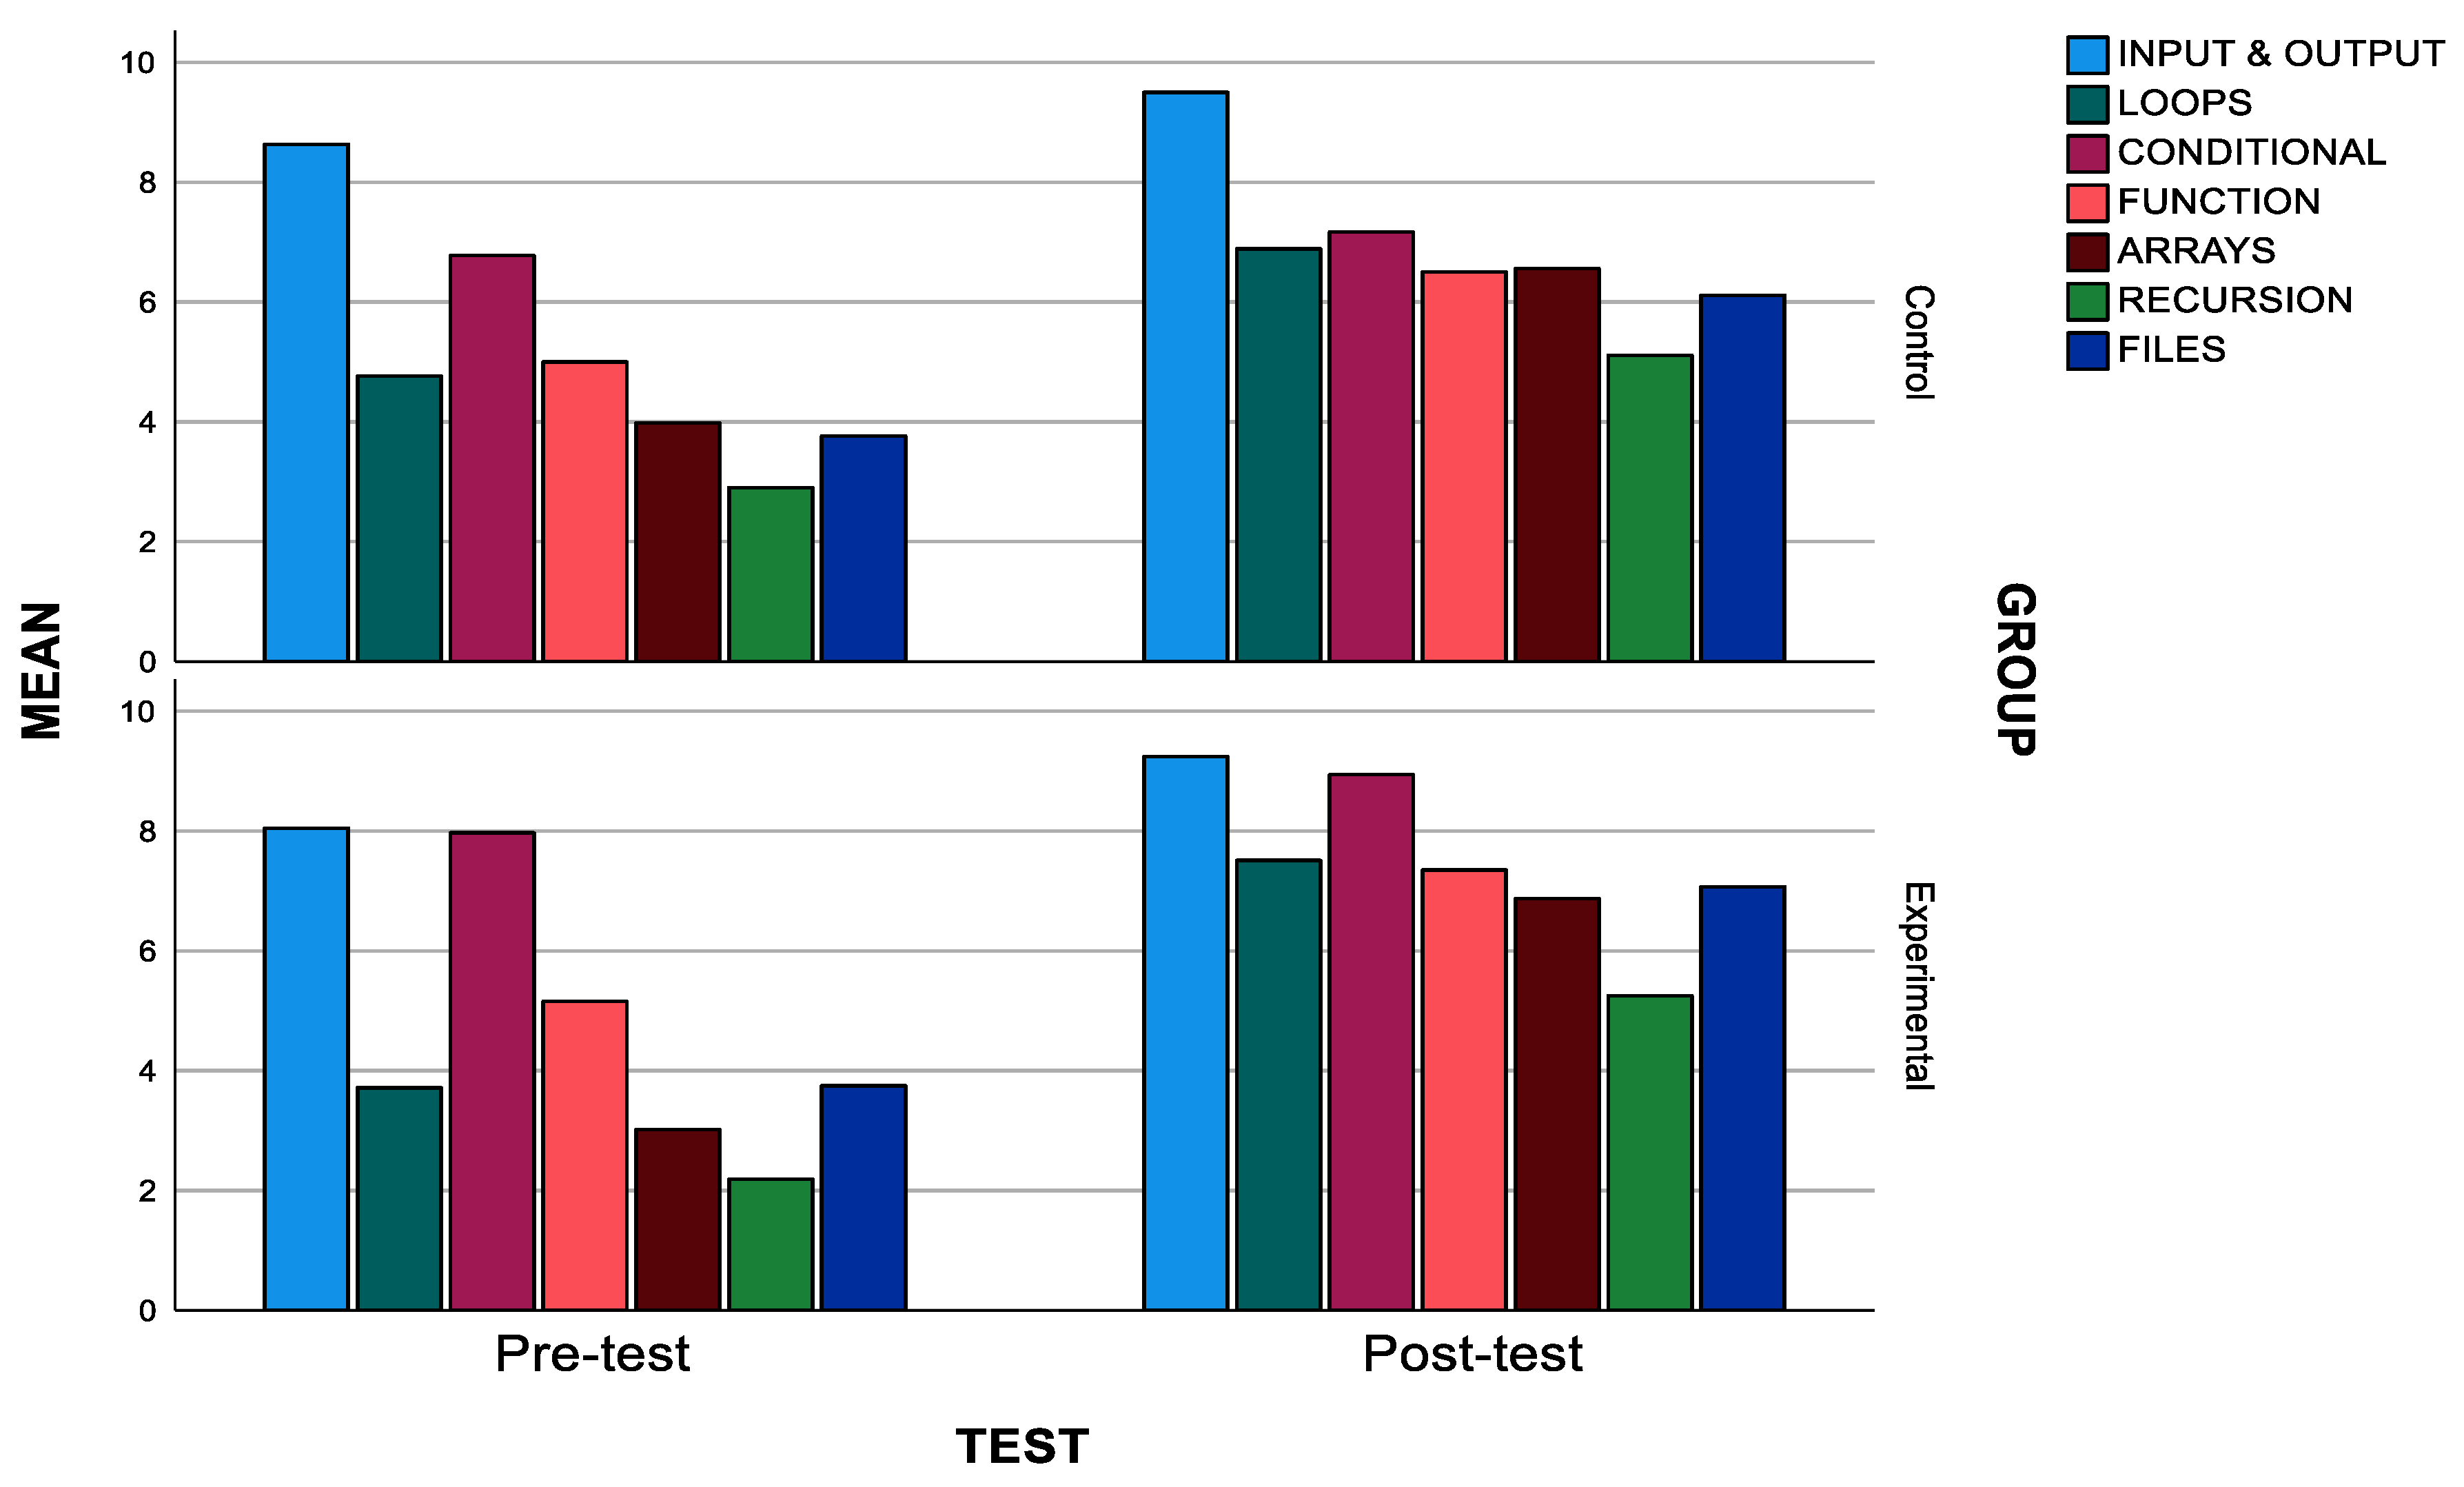
Here the study concentrated on observing what occurred when we took each dimension separately, e.g., input and output, loops, conditionals, functions, arrays, recursion, and files. As can be seen in previous sections, all the dimensions increased or maintained their mean values from the pre- and post-test results, both in the experimental and control groups. The information given was complemented by where the greatest rise in the mean values for the experimental group could be observed.
We examined these concept variations between the pre- and post-tests to discover if they were statistically significant. This was tested using the t-Student test for paired sample design. For the control group, there was a statistically significant improvement between the pre- and post-tests for all the concepts (input and output, loops, functions, arrays, recursion, and files), except the conditional concept (p-value > 0.05). The same phenomenon occurred in the experimental group, where the mean values increased even more (in this order) for loops, recursion, files, arrays, and functions; again, conditionals was the only concept in which the improvement was not statistically significant.

6. Future Works

Future proposed works include the enhancement of the VEE to visually and interactively help students understand what happens in the computer when Java code is executed, providing students with an option to be able to code their own scripts (as opposed to merely changing the input data to see what happens), and extending the VEE to other textual languages like Python.

Author Contributions

Conceptualization, R.H.-N., C.P., J.F., P.P.-B. and M.D.; methodology, R.H.-N., C.P., J.F., P.P.-B. and M.D.; software, R.H.-N.; validation, R.H.-N., C.P., J.F., P.P.-B. and M.D.; formal analysis, C.P.; investigation, R.H.-N., C.P., J.F., P.P.-B. and M.D.; resources, R.H.-N., C.P., J.F., P.P.-B. and M.D.; data curation, R.H.-N.; writing—original draft preparation, R.H.-N., C.P. and J.F.; writing—review and editing, R.H.-N., C.P. and J.F.; visualization, R.H.-N. and C.P. All authors have read and agreed to the published version of the manuscript.

Funding

This research was funded by the Spanish Ministry of Universities’ “José Castillejo” Program for Mobility Stays Abroad for Young Doctors, grant number CAS21/00413 to Raquel Hijón-Neira.

Data Availability Statement

The data presented in this study are available on request from the corresponding author. The data are not publicly available due to ethical reasons.

Conflicts of Interest

The authors declare no conflict of interest. The funders had no role in the design of the study; in the collection, analyses, or interpretation of data; in the writing of the manuscript; or in the decision to publish the results.

References

  1. Lau, W.W.; Yuen, A.H. Modelling programming performance: Beyond the influence of learner characteristics. Comput. Educ. 2011, 57, 1202–1213. [Google Scholar] [CrossRef]
  2. Astin, W.A. College Retention Rates Are Often Misleading; Chronicle of Higher Education: Washington, DC, USA, 1993. [Google Scholar]
  3. Stuart, V.B. Math Course or Math Anxiety? Natl. Counc. Teach. Math. 2000, 6, 330. [Google Scholar]
  4. Piaget, J. The Moral Judgement of the Child; Penguin Books: New York, NY, USA, 1932. [Google Scholar]
  5. Piaget, J. Origins of Intelligence in Children; International Universities Press: New York, NY, USA, 1952. [Google Scholar]
  6. Vygotsky, L.S. Thought and Language, 2nd ed.; MIT Press: Cambridge, MA, USA, 1962. [Google Scholar]
  7. Vygotsky, L.S. Mind in Society: The Development of Higher Psychological Process; Harvard University Press: Cambridge, MA, USA, 1978. [Google Scholar]
  8. Vygotsky, L.S. The Genesis of Higher Mental Functions. In Cognitive Development to Adolescence; Richardson, K., Sheldon, S., Eds.; Erlbaum: Hove, UK, 1988. [Google Scholar]
  9. Renumol, V.; Jayaprakash, S.; Janakiram, D. Classification of Cognitive Difficulties of Students to Learn Computer Programming; Indian Institute of Technology: New Delhi, India, 2009; p. 12. [Google Scholar]
  10. Barker, L.J.; McDowell, C.; Kalahar, K. Exploring factors that influence computer science introductory course students to persist in the major. ACM SIGCSE Bull. 2009, 41, 153–157. [Google Scholar] [CrossRef]
  11. Coull, N.J.; Duncan, I. Emergent Requirements for Supporting Introductory Programming. Innov. Teach. Learn. Inf. Comput. Sci. 2011, 10, 78–85. [Google Scholar] [CrossRef]
  12. Maleko, M.; Hamilton, M.; D’Souza, D. Novices’ Perceptions and Experiences of a Mobile Social Learning Environment for Learning of Programming. In Proceedings of the 12th International Conference on Innovation and Technology in Computer Science Education (ITiCSE), Haifa, Israel, 3–5 July 2012. [Google Scholar]
  13. Williams, L.; Wiebe, E.; Yang, K.; Ferzli, M.; Miller, C. In Support of Pair Programming in the Introductory Computer Science Course. Comput. Sci. Educ. 2002, 12, 197–212. [Google Scholar] [CrossRef]
  14. Combéfis, S.; Beresnevičius, G.; Dagienė, V. Learning Programming through Games and Contests: Overview, Characterisation and Discussion. Olymp. Inform. 2016, 10, 39–60. [Google Scholar] [CrossRef]
  15. Combéfis, S. Automated Code Assessment for Education: Review, Classification and Perspectives on Techniques and Tools. Software 2022, 1, 3–30. [Google Scholar] [CrossRef]
  16. Hijón-Neira, R.; Pérez-Marin, D.; Pizarro, C.; Connolly, C. The Effects of a Visual Execution Environment and Makey Makey on Primary School Children Learning Introductory Programming Concepts. IEEE Access 2020, 8, 217800–217815. [Google Scholar] [CrossRef]
  17. Hijón-Neira, R.; Connolly, C.; Palacios-Alonso, D.; Borrás-Gené, O. A Guided Scratch Visual Execution Environment to Introduce Programming Concepts to CS1 Students. Information 2021, 12, 378. [Google Scholar] [CrossRef]
  18. Ouahbi, I.; Kaddari, F.; Darhmaoui, H.; Elachqar, A.; Lahmine, S. Learning Basic Programming Concepts by Creating Games with Scratch Programming Environment. Procedia-Soc. Behav. Sci. 2015, 191, 1479–1482. [Google Scholar] [CrossRef]
  19. Hijon-Neira, R.B.; Velázquez-Iturbide, Á.; Pizarro-Romero, C.; Carriço, L. Game programming for improving learning experience. In Proceedings of the 2014 Conference on Innovation & Technology in Computer Science Education, Uppsala, Sweden, 21–25 June 2014; pp. 225–230. [Google Scholar] [CrossRef]
  20. Jenkins, T. The motivation of students of programming. ACM SIGCSE Bull. 2001, 33, 53–56. [Google Scholar] [CrossRef]
  21. Kurland, D.M.; Pea, R.D.; Lement, C.C.; Mawby, R. A Study of the Development of Programming Ability and Thinking Skills in High School Students. J. Educ. Comput. Res. 1986, 2, 429–458. [Google Scholar] [CrossRef]
  22. Alshaigy, B.; Ott, L. Novice programming students: Common difficulties and misconceptions. In Proceedings of the 43rd ACM Technical Symposium on Computer Science Education, Raleigh, NC, USA, 29 February–3 March 2012. [Google Scholar]
  23. Luxton-Reilly, A.; Simon; Albluwi, I.; Becker, B.A.; Giannakos, M.; Kumar, A.N.; Ott, L.; Paterson, J.; Scott, M.; Sheard, J.; et al. Introductory programming: A systematic literature review. In Proceedings of the ITiCSE 2018 Companion: Proceedings Companion of the 23rd Annual ACM Conference on Innovation and Technology in Computer Science Education, Larnaca, Cyprus, 2–4 July 2018; Association for Computing Machinery (ACM): New York, NY, USA, 2018; pp. 55–106. [Google Scholar] [CrossRef]
  24. Robins, A.; Rountree, J.; Rountree, N. Learning and teaching programming: A review and discussion. Comput. Sci. Educ. 2003, 13, 137–172. [Google Scholar] [CrossRef]
  25. Brooks, F.P. No Silver Bullet: Essence and Accidents of Software Engineering. In Proceedings of the Tenth World Computing Conference, Dublin, Ireland, 1–5 September 1986; pp. 1069–1076. [Google Scholar]
  26. Mishra, D.; Ostrovska, S.; Hacaloglu, T. Exploring and expanding students’ success in software testing. Inf. Technol. People 2017, 30, 927–945. [Google Scholar] [CrossRef]
  27. Corney, M.; Hanks, B.; McCauley, R. ‘Explain in Plain English’ Questions Revisited: Data Structures Problems. In Proceedings of the 45th ACM Technical Symposium on Computer Science Education, Atlanta, GA, USA, 5–8 March 2014. [Google Scholar]
  28. Clancy, M.J.; Linn, M.C. Case studies in the classroom. ACM SIGCSE Bull. 1992, 24, 220–224. [Google Scholar] [CrossRef]
  29. Arto, V.; Luukkainen, M.; Kurhila, J. Multi-faceted support for learning computer programming. In Proceedings of the 42nd ACM Technical Symposium on Computer Science Education, Dallas, TX, USA, 9–12 March 2011. [Google Scholar]
  30. Denny, P.; Luxton-Reilly, A.; Harmer, J. Students use of the PeerWise system. In Proceedings of the 13th Annual SIGCSE Conference on Innovation and Technology in Computer Science Education, Madrid, Spain, 30 June–2 July 2008; ACM: New York, NY, USA; pp. 73–77. [Google Scholar]
  31. Ragonis, N.; Uri, L. Factors explaining success in an introductory computer science course. ACM Trans. Comput. Educ. (TOCE) 2018, 19, 1–21. [Google Scholar]
  32. Chandramouli, M.; Zahraee, M.; Winer, C. A fun-learning approach to programming: An adaptive Virtual Reality (VR) platform to teach programming to engineering students. In Proceedings of the IEEE International Conference on Electro/Information Technology, Milwaukee, WI, USA, 5–7 July 2014. [Google Scholar]
  33. Silapachote, P.; Srisuphab, A. Teaching and learning computational thinking through solving problems in Artificial Intelligence: On designing introductory engineering and computing courses. In Proceedings of the 2016 IEEE International Conference on Teaching, Assessment, and Learning for Engineering (TALE), Bangkok, Thailand, 7–9 December 2016. [Google Scholar]
  34. Liu, C.-C.; Cheng, Y.-B.; Huang, C.-W. The effect of simulation games on the learning of computational problem solving. Comput. Educ. 2011, 57, 1907–1918. [Google Scholar] [CrossRef]
  35. Kazimoglu, C.; Kiernan, M.; Bacon, L.; Mackinnon, L. A Serious Game for Developing Computational Thinking and Learning Introductory Computer Programming. Procedia-Soc. Behav. Sci. 2012, 47, 1991–1999. [Google Scholar] [CrossRef]
  36. Garcia-Iruela, M.; Hijón-Neira, R. Experiencia de Juegos Serios en el aula de Formación Profesional. In Proceedings of the V Congreso Internacional de Videojuegos y Educación, (CIVE, 2017), La Laguna, Spain, 7–9 June 2017; Available online: https://riull.ull.es/xmlui/bitstream/handle/915/6682/CIVE17_paper_17.pdf?sequence=1 (accessed on 18 October 2023).
  37. Saad, A.; Shuff, T.; Loewen, G.; Burton, K. Supporting undergraduate computer science education using educational robots. In Proceedings of the ACMSE 2018 Conference, Tuscaloosa, AL, USA, 29–31 March 2012. [Google Scholar]
  38. Weintrop, W.; Wilensky, U. Comparing Block-Basedand Text-Based Programming in High School Computer Science Classrooms. ACM Trans. Comput. Educ. 2017, 18, 1. [Google Scholar] [CrossRef]
  39. Martínez-Valdés, J.A.; Velázquez-Iturbide, J.; Neira, R.H. A (Relatively) Unsatisfactory Experience of Use of Scratch in CS1. In Proceedings of the 5th International Conference on Technological Ecosystems for Enhancing Multiculturality, Cadiz, Spain, 18–20 October 2017. [Google Scholar]
  40. Fitzgerald, S.; Lewandowski, G.; Mccauley, R.; Murphy, L.; Simon, B.; Thomas, L.; Zander, C. Debugging: Finding, fixing and flailing, a multi-institutional study of novice debuggers. Comput. Sci. Educ. 2008, 18, 93–116. [Google Scholar] [CrossRef]
  41. Salguero, A.; Griswold, W.G.; Alvara Cdo Porter, L. Understanding Sources of Student Struggle in Early Computer Science Courses. In Proceedings of the 17th ACM Conference on International Computing Education Research (ICER 2021), Virtual Event, 16–19 August 2021; ACM: New York, NY, USA, 2021; pp. 319–333. [Google Scholar]
  42. Fogg, B.J. A behavior model for persuasive design. In Proceedings of the 4th International Conference on Persuasive Technology, Claremont, CA, USA, 26–29 April 2009; pp. 1–7. [Google Scholar]
  43. Mishra, P.; Koehler, M. Technological Pedagogical Content Knowledge: A Framework for Teacher Knowledge. Teach. Coll. Rec. 2006, 108, 1017–1054. [Google Scholar] [CrossRef]
  44. Mishra, P.; Koehler, M.J. Introducing Technological Pedagogical Content Knowledge; American Educational Research Association: Vancouver, BC, Canada, 2008; pp. 1–16. [Google Scholar]
  45. Hijón-Neira, R.; Connolly, C.; Pizarro, C.; Pérez-Marín, D. Prototype of a Recommendation Model with Artificial Intelligence for Computational Thinking Improvement of Secondary Education Students. Computers 2023, 12, 113. [Google Scholar] [CrossRef]
Figure 1. TPACK model [44].
Information 14 00579 g001
Figure 2. Schematic illustrating the experimental strategy.
Information 14 00579 g002
Figure 3. The TPACK PrimaryCode VEE with Java script execution scenarios for loops and conditionals on the left and right, respectively (red arrow points out next instruction to be executed) [45].
Information 14 00579 g003
Figure 4. The TPACK PrimaryCode VEE shows interactive Java script execution samples for every topic (1–7 from Table 1) on the left, and their interactivity on the right-hand side [45].
Information 14 00579 g004
Figure 5. Bee swarm plot for the control and experimental groups in pre- and post-tests.
Information 14 00579 g005
Figure 6. Bar chart of the means for different topic variables in the pre- and post-tests.
Information 14 00579 g006
Table 1. A suggestion for the Guided Java VEE topic order.
Topic Num.DescriptionNum. of Scripts
Topic 1.Input/Output and Variables5
Topic 2.Conditionals8
Topic 3.Loops18
Topic 4.Arrays12
Topic 5.Files11
Topic 6.Functions6
Topic 7.Recursion6
Table 2. The quantity of the preliminary and final multiple-choice questions and concepts covered.
Topic NumberNumber of QuestionsConcept Addressed
Topic 1. Input/Output and Variables4Input, output, input, and output
Topic 2. Conditionals2Conditional and switch
Topic 3. Loops9While, do-while, and for
Topic 4. Arrays3Search, read, and write
Topic 5. Files3Binary and text files
Topic 6. Functions4Parts, return value, and inputs
Topic 7. Recursion3Linear and tale recursion
Table 3. Descriptive analysis in pre- and post-tests for the control and experimental groups.
Pre-TestPost-Test
ControlExperimentalControlExperimental
Mean5.104.616.917.48
Median5.004.647.677.86
SD1.291.151.921.50
Table 4. A paired t test and the effect size for pre- vs. post-test scores in the control and experimental groups.
Pre-Post ControlPre-Post Experimental
Mean−1.84−2.85
Deviation1.8571.898
df3031
t−5.521−8.513
p-value<0.001<0.001
d Cohen1.8511.898
Table 5. t-test for independent samples for the control and experimental groups in the pre- and post-test scores.
tdfp-Value
Pre-test1.604610.057
Post-test−1.196610.019
Table 6. ANCOVA model for post-test scores.
dfQuadratic MeansFp-ValuePartial Eta Squared
Pre-test13.9203.0510.0860.050
Location194.93073.892<0.0010.260
Group16.2364.8540.0320.577
Location*Group12.6342.0500.1580.034
Error581.285
Table 7. Topic-specific descriptive analysis of the sample.
Pre-TestPost-Test
ControlExperimentalControlExperimental
8.628.049.169.24
Input and Output10101010
2.022.131.211.32
4.763.716.897.50
Loops4.443.337.787.77
2.622.022.682.11
6.777.967.168.93
Conditionals5.00101010
3.543.073.392.07
5.005.156.507.34
Functions5.005.007.507.5
2.232.611.801.86
3.973.026.556.86
Arrays3.333.336.676.66
2.772.723.213.11
2.902.185,115.25
Recursion3.333.333.336.66
2.822.173.473.43
3.763.756.117.07
File3.333.646.676.67
2.234.343.163.43
Table 8. The paired t-test and effect size for the pre- vs. post-test scores by dimensions in the control and experimental groups.
Group Experimental
tp-Valuedtp-Valued
Input/Output−2.0790.0232.37−2.3350.0132.83
Loops−4.239<0.0012.82−7.408<0.0012.88
Conditionals−1.0000.1632.69−1.4380.0803.68
Function−3.574<0.0012.38−4.625<0.0012.67
Arrays−4.167<0.0013.59−5.947<0.0013.56
Recursion−2.8080.0044.26−3.816<0.0014.63
Files−4.383<0.0013.00−4.209<0.0014.48
Disclaimer/Publisher’s Note: The statements, opinions and data contained in all publications are solely those of the individual author(s) and contributor(s) and not of MDPI and/or the editor(s). MDPI and/or the editor(s) disclaim responsibility for any injury to people or property resulting from any ideas, methods, instructions or products referred to in the content.

