Article

Digital Transformation Strategies Enabled by Internet of Things and Big Data Analytics: The Use-Case of Telecommunication Companies in Greece

Department of Applied Informatics, University of Macedonia, GR-54636 Thessaloniki, Greece
*
Author to whom correspondence should be addressed.
Information 2022, 13(4), 196; https://doi.org/10.3390/info13040196
Submission received: 20 March 2022 / Revised: 12 April 2022 / Accepted: 12 April 2022 / Published: 14 April 2022
(This article belongs to the Special Issue Big Data, IoT and Cloud Computing)

Abstract

:
Both Internet of Things (IoT) and Big Data Analytics (BDA) are innovations that already caused a significant disruption having a major impact on organizations. To reduce the attrition of new technology implementation, it is critical to examine the advantages of BDA and the determinants that have a detrimental or positive impact on users’ attitudes toward information systems. This article aims to evaluate the intention to use and the perceived benefits of BDA systems and IoT in the telecommunication industry. The research is based on the Technology Acceptance Model (TAM). Data were collected by 172 users and analyzed using Multivariate Regression Analysis. From our findings, we may draw some important lessons about how to increase the adoption of new technology and conventional practices while also considering a variety of diverse aspects. Users will probably use both systems if they think they will be valuable and easy to use. Regarding BDA, the good quality of data helps users see the system’s benefits, while regarding IoT, the high quality of the services is the most important thing.

1. Introduction

The usage of advanced digital technologies such as Internet of Things (IoT) and Big Data Analytics (BDA) will strengthen productivity, improve efficiency, and create new prospects for organizations in all areas, which are vital for economic recovery [1]. For example, using large amounts of data in combination with Artificial Intelligence (AI) methods such as machine learning and data mining to optimize business processes is an appropriate way to transform data into value. Most organizations struggle to achieve consistency in their repeated processes, and this is particularly true for industrial production processes [2,3].
Both IoT and Big Data are two innovations that have already caused a significant disruption in the business world, having a significant effect on existing strategies and business models of organizations [4,5,6]. Organizational change in enterprises is important. The continuous process of change caused by the adoption of the IoT as well as Big Data in every field of activity, such as in telecommunications [7], has a growing influence on the way organizations and businesses as a whole conduct their operations [8]. They are playing significant role in the growth of new business ecosystems, models, and markets [9].
At first glance, BDA and IoT appear to have a lot of similarities. These technologies are, in fact, interdependent because they collect and analyze a large amount of data to extract information. When firms can combine both, they complement each other. To begin, based on a data source standpoint, IoT transforms everyday “objects” into smart things by aggregating data from several sensors. When this data is joined with data from other sources, it creates a powerful combination (type) that can become big data and necessitates a large amount of processing power (velocity). Second, IoT analytics examines behaviors of the individual, whereas BDA looks for trends in data among many cases in order to make generalizations about unexplainable results. The conclusions are basic and comprehensible because they are founded on a person’s unique data history. IoT analytics have to combine real-time streaming data management, analytics, and decisions [10]. Organizations that do not invest in sufficient resources and capabilities to use BDA and IoT will face challenges in creating business value and surviving the Big Data revolution [11]. As a result, managers and scholars must examine how to maximize BDA systems and IoT and use them to gain a competitive advantage [12].
The Internet of Things (IoT) and Big Data Analytics (BDA) are two of the most significant shifts in technology today. Industry-specific IoT services are becoming more prevalent on a worldwide basis as more and more businesses are embracing IoT methods for generating valuable information for their businesses. In order to reap the benefits of BDA and IoT, managers and analysts must be aware of how these technologies can be used to their advantage [10,12]. The lack of literature on BDA and IoT use and impact on enterprises is limiting our present understanding of these technologies [4]. Many researchers have tried to examine how new information systems are used and adopted [13,14,15,16,17]. Some models and theories do not explain why a particular information system is accepted or not [18]. To reduce the attrition of new technology implementation, it is critical to examine the advantages of BDA and the determinants that influence one’s attitude, whether it is bad or good toward information systems [19]. Employee dissatisfaction may be the root of resistance to new information systems such as BDA that can negatively influence firm performance [20].
This article aims to evaluate the intention to use and the perceived benefits of BDA systems and IoT in the telecommunication industry. The research is based on the Technology Acceptance Model (TAM). Data was collected by 172 users and analyzed using Multivariate Regression Analysis.
The structure of the article is the following. The theoretical background on IoT and BDA is represented in Section 2. The methodology is described in Section 3, while Section 4 presents the analysis of the findings. Section 5 discusses the outcomes, limitations, and future research directions.

2. Theoretical Background

2.1. Internet of Things

Because the IoT is still a relatively recent development, few studies focus on IoT’s behavioral and managerial concerns. In this regard, businesses struggle to comprehend the drivers of IoT capabilities and their implications for competitive advantages [12,21,22]. IoT analytics and traditional big data are vastly different in many ways, so a thorough examination of these differences is critical.
Some of the important features that stand out in this technological innovation include the dynamic network, the interconnection, the global infrastructure, and the interaction between people and things and the dispersed existence of interconnected, uniquely identified objects [23]. The purpose of the IoT is to enable the efficient real-time exchange of information between autonomous network operators.
Objects in a future world will be able to be defined, accessed, and checked over the Internet [24]. A digital shadow of these objects will be kept in cyberspace, which will make it easier for humans and objects or machines to communicate and interact with each other. Objects interact with computers and humans do not participate, enabling the Internet to be more ubiquitous and interactive than ever before. This makes the world more connected, which makes it easier to recognize, track, monitor, and manage things in real-time, as well as to keep an eye on them. Physical things can be connected to be used to interact with the world around them.

2.2. Big Data Analytics

Through the focused development of BDA, companies are able to perceive emerging opportunities and threats, build critical thinking, and adapt their activities based on trends observed in the competitive environment. As a result, the main competitive differentiation provided by BDA is that they facilitate decision making with the suitable information they offer [11,25].
Managers are relying more and more on real-time data generated by large amounts of data and steering an increasing number of initiatives in this direction [26]. Several researchers indicate that the analysis of large amounts of data, when applied to problems in specific sectors such as healthcare, supply chain, services, and marketing, can provide considerable value [27]. The analysis of big data may also be a source of innovation, with those companies that are pioneers in their adoption offering new services and products in contrast with those that have not made such an investment.
However, the acquisition of value by BDA is the result of the focused diffusion of these technologies into an organization’s operations and therefore requires the development of a data-intensive operational analytics capability [25].
Recent studies agree that firm performance is affected by BDA. For example, Mikalef et al. (2018) [28] noticed that a firm’s marketing strategy and its capacity to adapt quickly in shaping new strategies are affected by Big Data Analytics Capabilities. Scholars examined the way data about customers could improve an organization’s performance. On the other hand, Mikalef et al. (2018) [28] and Amado et al. (2018) [29] highlighted that supply chains can have significant benefits from BDA. In this view, Wang et al. (2018) [30,31,32] noticed that the internal processes and functions of organizations as well as the effectiveness of an organization are improved through BDA.
However, Ghasemaghaei (2021) [33] noted that while the processing of several data based on different sources creates valuable knowledge in economic terms, focusing simply on rapid data processing or huge amount of data does not always result in financial gains for businesses. It is crucial for executives to be informed the value and quality of BDA as critical strategic goals to increase business performance [25].

2.3. An Extension of the Technology Acceptance Model

2.3.1. Data Quality

According to Steininger et al. (2022) [34], new possibilities emerge in a dynamic way when processes that record the experience accumulated (in an organization) are implemented and capture it in knowledge [35]. Indeed, BDA and IoT are considered a valuable element of knowledge [36]. Nevertheless, they add value to the organization if the data have certain quality characteristics [7,37]. The decision-making process will be improved using BDA systems and IoT with qualitative data. In addition, if people did not have to spend so much time checking and fixing their data, they could focus on their primary business or job.
On several occasions, data must be compatible with specific regulatory frameworks, and this is ensured by high-quality data. Additionally, BDA systems are very useful tools for many departments of a company. Thus, any of the features offered by the tools of BDA systems as well as the IoT should not be compromised by quality of data [37].
The evaluation of data quality is an important feedback mechanism for improving BDA and IoT tools and the optimization of decision-making processes at different levels may affect the performance of the company [38]. Companies should take data into consideration as a valuable resource and invest in their management to maintain their quality and to obtain valuable information that can increase the competitive advantage.
High-quality data are a prerequisite for both the implementation of BDA and IoT and for ensuring data quality. For example, completeness, format, accuracy, and currency are all examples of attributes that can be used to describe the quality of data. Completeness indicates “the extent to which the system gives all relevant data” [39]. A user’s perception of correctness is called accuracy [39]. Currency and format are two terms used to describe “the user’s perception of how well data are represented and are updated” [39].

2.3.2. System Quality

The quality of the system is relevant to the data quality, which is processed by the system [40]. Furthermore, the quality of the system evaluates the extent to which the system is technically even [41], and it is evaluated by features such as flexibility, complexity, system features, functionality, system accuracy, and system integration [42]. It is necessary to develop and implement well-designed systems to obtain benefits for organization such as cost reduction, improved process efficiency, and increased revenues. A poorly designed system, on the other hand, may harm business operations and raise product costs for an organization [40].
Most of the time, whether or not to use a new system will depend on its features. The important features of a system will be disseminated as a technology advantage from one user to another, as a result of which increases a common belief for the benefits of systems of BDA and IoT [43]. The ability to affect the behavioral intention of using a system depends on factors such as the accuracy and frequency of information, as well as the amount of data quality [44]. The BDA characteristics of a system will affect the common belief in the advantages of BDA. This effect on the common belief will affect the perceived usefulness and perceived ease of use of BDA, which will impact the attitude and the intent of use and implementation of BDA [43,44].
Jayakrishnan et al. (2018) [45] conducted a survey to understand business intelligence (BI) and BDA for the development of advanced management performance strategies. The researchers concluded that a combination of BDA and BI contributes to the creation of understanding how decisions are made by organizations.
Ghasemaghaei et al. (2018) [46] highlighted that the dimensions of data analysis significantly improved the quality of the decisions, regardless of the volume of data to be analyzed. Another survey that aimed to investigate the performance of management in a company concluded that the quality of data directly increases the overall strategic performance of the company [47]. Furthermore, Ghouchani et al. (2019) [48] noticed that the quality and security of IoT tools as well as users’ knowledge of Information Technology (IT) have a positive impact on the development of e-Business.
Talent, IT awareness, and data quality are important but also determinant factors of the quality of BDA that results in the development of a company’s overall performance strategy. The ability to analyze large amounts of data directly affects a business’s overall performance in the current digital era [49].
IoT has been found to be an important tool for implementing ongoing process improvement programs that influence firm performance. At the same time, it was emphasized that improving the quality of data over time directly adds value to the business [4].

2.3.3. Perceived Usefulness

Perceived usefulness is related to the degree to which a user believes that a system will support them to perform their job better. Many researchers have concluded that perceived usefulness influences a user’s intention to adopt it [50,51,52]. Perceived usefulness can be defined as the most crucial determinant in accepting a new system [51,52]. Based on other studies, it is more important to think about the perceived usefulness of a system than to think about how easy it is to use [51]. If business executives and managers realize that using a new system is almost certain to improve work efficiency and productivity, it would have a good effect on the attitude and intention to adopt the system.

2.3.4. Perceived Ease of Use

The relationship between perceived ease of use and the intention to adopt a system has been evaluated in many papers [53,54]. In many studies, perceived ease of use has both direct and indirect implications on the intention to adopt a system [53]. On the other hand, some researchers have concluded that perceived ease of use does not directly influence the intention to adopt a system [18]. The immediate findings conclude that the perceived ease of use could affect a user’s attitude about the adoption of a system regardless of the usefulness of the system. Due to this, people are more likely to see new technology as more valuable if they think it is easy to use. A more optimistic outlook and an intention to use innovation will result from this [55].

2.3.5. Intention to Use Technologies

According to Levy et al. (2021) [56], subjective rules and behaviors are used to determine whether or not an individual intends to engage in a particular type of conduct. In the Theory of Reasoned Action (TRA) model, attitude is defined as the sense of affection or disagreement for particular objects [56]. It is a person’s level of interest in a technology that determines their level of behavioral intention. As suggested by Sabani (2020) [40], a user’s attitude about a system is a significant factor of dependence on other determinants in user’s intention. Several researchers have highlighted the positive effect between the attitude for using a system and the user’s intention [57].
Previous studies suggested that perceived volunteerism is crucial for the acceptance and usage of a technology [58]. In addition, the compulsory usage of a technology is almost certain to take the lead at corporate advantages, assuring improved performance. The value of a system can also be found in its efficient use [59]. Executives might positively impact the process if they feel in charge of the results [43]. If BDA systems or IoT are required, there will be variations in users’ intentions [60]. It is crucial to evaluate the behavioral intention of using the systems even when the use may be mandatory.

2.3.6. Perceived Benefits of Technologies

Every business is interested in having a competitive advantage over its competitors [61]. One of the most critical factors of competitive advantage is the strategic performance of a business [27]. The competitive advantage is the synthesis of qualitative and quantitative dimensions such as strategic and economic performance.
Table 1 presents the relationship between the variables under investigation based on the existing literature.
According to the existing literature, Figure 1 presents the research model based on the following hypotheses about attitude and intention to use the BDA systems and IoT.
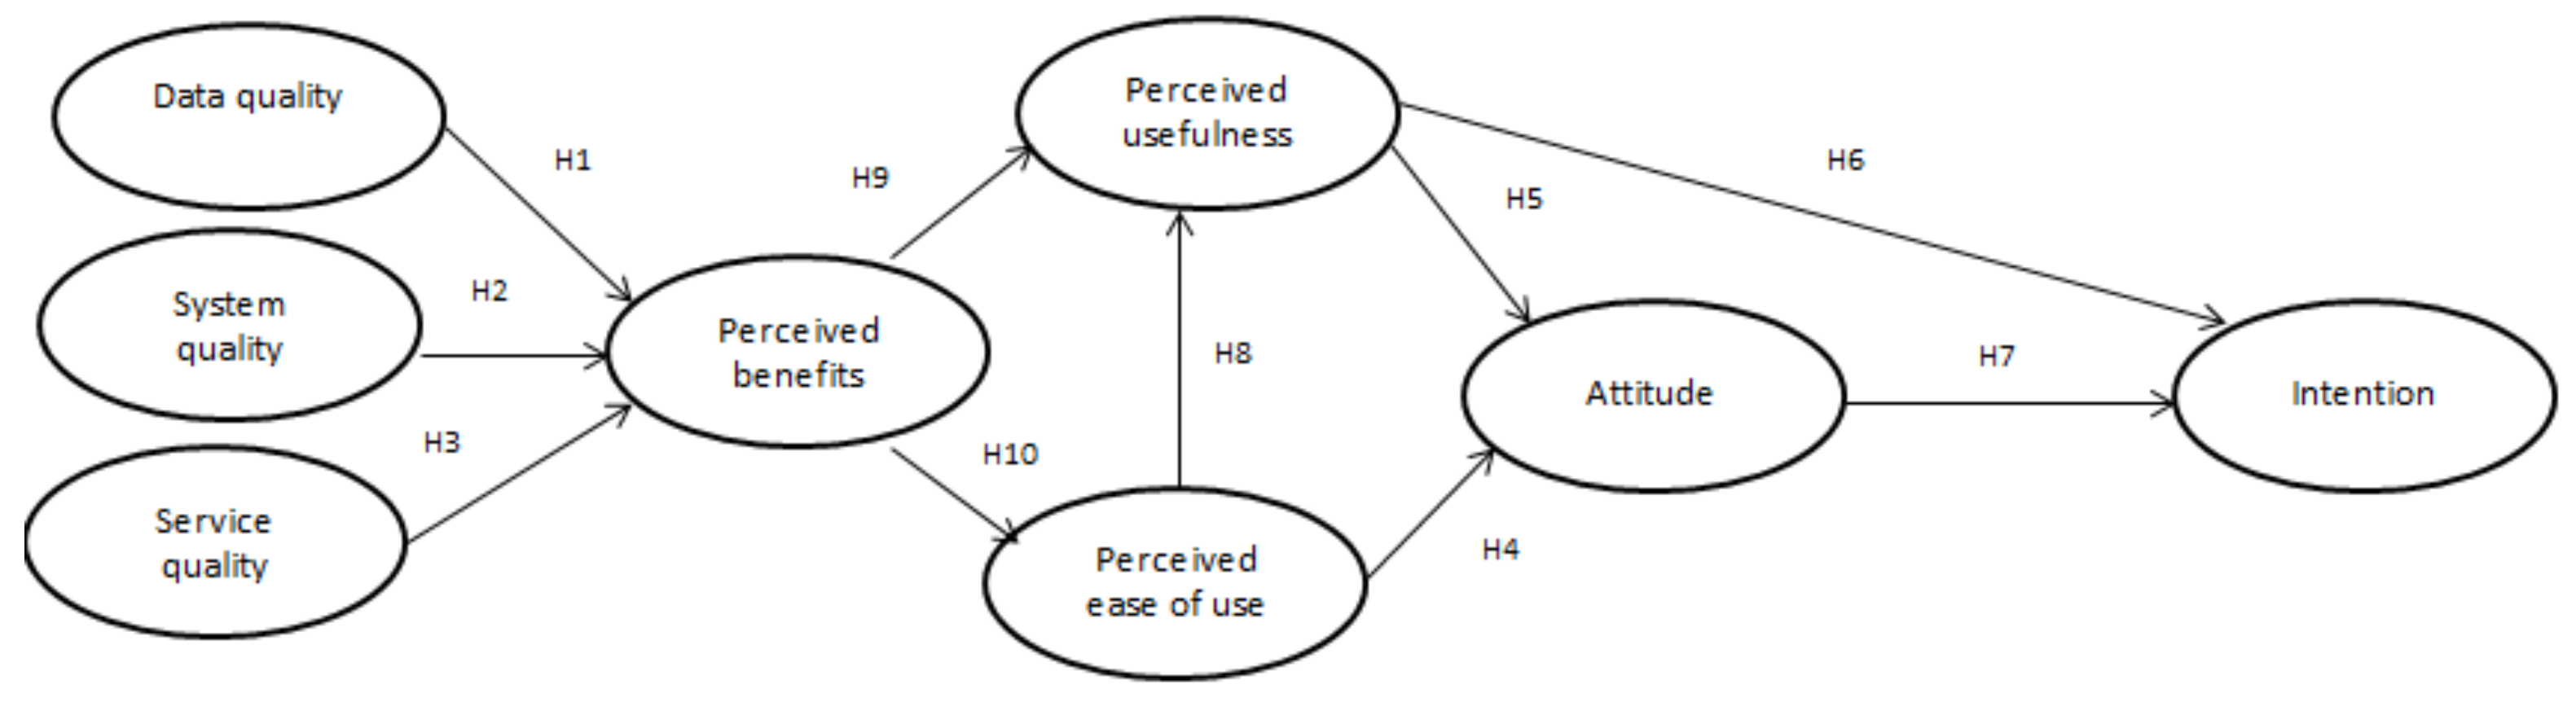
  • H1:The quality of the BDA systems/IoT has a positive impact on the perceived benefits.
  • H2: Data quality has a positive impact on the perceived benefits of BDA systems/IoT.
  • H3: Service quality has a positive effect on the perceived benefits of BDA systems/IoT.
  • H4: Perceived ease of use has a positive effect on the user’s attitude towards the BDA systems and IoT.
  • H5: The perceived usefulness has a positive effect on the user’s attitude towards the BDA systems and IoT.
  • H6: The perceived usefulness has a positive effect on the user’s intention towards the BDA systems and IoT.
  • H7: The attitude has a positive effect on the user’s intention towards the BDA systems and IoT.
  • H8: Perceived ease of use has a positive effect on the perceived usefulness of BDA systems and IoT.
  • H9: Perceived benefits have a positive effect on the perceived usefulness of BDA systems and IoT.
  • H10: Perceived benefits have a positive effect on the perceived ease of use of BDA systems and IoT.

3. Methodology

A questionnaire was developed to evaluate the intention to use and the perceived benefits of BDA systems and IoT. The questionnaire was forwarded via email to managers of the leading telecommunication company in Greece. Managers distributed the questionnaire to 1800 users of these systems, and 172 completed it. Perceived usefulness and perceived ease of use measures were derived from existing papers on the Technology Acceptance (TAM) model [62,63,64]. The measures of behavioral intention and attitude were based on Toft et al. (2014) [65] and Verma et al. (2018) [64]. To address the variables of the quality of data and the quality of the system, the studies of Shin (2015) [66,67], Verma et al. (2018) [64] and Zheng et al. (2013) [68] were used. The measures of perceived benefits were based on Amoako-Gyampah and Salam (2004) [57] and Verma et al. (2018) [64]. A 5-point Likert-scale was used to evaluate these variables. Data analysis was conducted using Multivariate Regression Analysis.
The sample consists of employees of the IT department of the organization who use BDA systems and IoT tools and have more than 10 years of work experience. Eighty percent of participants were 36 years old and older. Regarding their education level, 44% had a bachelor’s degree and 42% had a master’s degree.

4. Results

4.1. The Case of BDA

The values of Cronbach’s alpha coefficient for all variables were above 0.7 [69]. The data quality (0.952), system quality (0.955), and perceived usefulness (0.955) had the lowest coefficients. The remaining variables had a Cronbach’s alpha above 0.7, between 0.956 and 0.964.
Table 2 indicates that the descriptive statistics result of system quality, data quality, service quality, perceived ease of use, perceived usefulness, perceived benefits, attitude, and intention to use had grand means of 3.6478, 3.7113, 3.6569, 3.6406, 3.7220, 4.1434, 4.1889, and 4.0116 at standard deviations of 0.7958, 0.8109, 0.8435, 0.8487, 0.8400, 0.7326, 0.8078, and 0.7722, respectively.
Based on the values represented at Table 3, the beta value of System quality was −0.101 with significance level p > 0.05 (p = 0.514). Thus, System quality does not significantly influence Perceived benefits, and H1 was not supported. The beta value of Data quality was 0.808 with significance level p < 0.0001 (p = 0.000). Thus, Data quality significantly affects Perceived benefits, and H2 was supported. The beta value of Service quality was −0.035 with significance level p > 0.05 (p = 0.798). Thus, Service quality does not have a significant impact on Perceived benefits, and H3 was not supported. The beta value of Perceived ease of use was 0.508 with significance level p < 0.001 (p = 0.000). Thus, Perceived ease of use significantly influences Attitude, and H4 was supported. The beta value of Perceived usefulness was 0.121 with significance level p > 0.05 (p = 0.360). Thus, Perceived usefulness has a significant impact on Attitude, and H5 was not supported. The beta value of Perceived usefulness was 0.771 with significance level p < 0.001 (p = 0.000). Thus, Perceived usefulness significantly affects Intention to use, and H6 was supported. The beta value of Attitude was 0.845 with significance level p < 0.001 (p = 0.000). Thus, Attitude significantly affects Intention to use, and H7 was supported. The beta value of Perceived ease of use was 0.888 with significance level p < 0.001 (p = 0.000). Thus, Perceived ease of use has a significant impact on Perceived usefulness, and H8 was supported. The beta value of Perceived benefits was 0.621 with significance level p < 0.001 (p = 0.000). Thus, Perceived benefits significantly affect the Perceived usefulness, and H9 was supported. The beta value of Perceived benefits was 0.589 with significance level p < 0.001 (p = 0.000). Thus, Perceived benefits significantly influence the Perceived ease of use, and H10 was supported.

4.2. The Case of IoT

The values of Cronbach’s alpha coefficient for all variables were above 0.7 [69]. The data quality (0.943), service quality (0.944), and perceived ease of use (0.945) had the lowest coefficients. The remaining variables exhibit a Cronbach’s alpha above 0.7, between 0.956 and 0.964.
Table 4 indicates that the descriptive statistics result of system quality, data quality, service quality, perceived ease of use, perceived usefulness, perceived benefits, attitude, and intention to use had grand means of 3.4177, 3.4651, 3.4689, 3. 4767, 3.4860, 4.0310, 4.0116, and 3.8720 at standard deviations of 0.8173, 0.8097, 0.8091, 0.8105, 0.8357, 0.7691, 0.7703, and 0.7805, respectively.
Based on to the values represented at Table 5, the beta value of System quality was −0.017 with significance level p > 0.05 (p = 0.907). Thus, System quality does not significantly influence Perceived benefits, and H1 was not supported. The beta value of Data quality was 0.201 with significance level p > 0.05 (p = 0.207). Thus, Data quality does not significantly influence Perceived benefits, and H2 was not supported. The beta value of Service quality was 0.455 with significance level p < 0.05 (p = 0.003). Thus, Service quality significantly affects Perceived benefits, and H3 was supported. The beta value of Perceived ease of use was 0.546 with significance level p < 0.001 (p = 0.000). Thus, Perceived ease of use has a significant impact on Attitude, and H4 was supported. The beta value of Perceived usefulness was 0.615 with significance level p < 0.001 (p = 0.000). Thus, Perceived usefulness significantly affects Attitude, and H5 was supported. The beta value of Perceived usefulness was 0.665 with significance level p < 0.001 (p = 0.000). Thus, Perceived usefulness significantly affects Intention to use, and H6 was supported. The beta value of Attitude was 0.800 with significance level p < 0.001 (p = 0.000). Thus, Attitude significantly affects Intention to use, and H7 was supported. The beta value of Perceived ease of use was 0.925 with significance level p < 0.001 (p = 0.000). Thus, Perceived ease of use has a significant impact on Perceived usefulness, and H8 was supported. The beta value of Perceived benefits was 0.614 with significance level p < 0.001 (p = 0.000). Thus, Perceived benefits significantly affect the Perceived usefulness, and H9 was supported. The beta value of Perceived benefits was 0.592 with significance level p < 0.001 (p = 0.000). Thus, Perceived benefits significantly affect the Perceived ease of use, and H10 was supported.

5. Discussion

The results of this paper, therefore, present an assessment of the data analysis model’s validity within the case of BDA and IoT. The paper uses an extension of the TAM model in the case of BDA and IoT. Studying a novel belief construct on how company users evaluate the benefits of an information system, this paper adds to the current literature on technology adoption (i.e., the BDA systems or IoT). The TAM model is extended in this article by including a belief construct (perceived benefits of BDA and IoT) and two external constructs (the quality of the system and data), as suggested by Liao and Tsou (2009) [19] and Al-Jabri and Roztocki (2015) [62].
The results support the use of TAM to examine the determinants affecting BDA and IoT implementation in companies. This article contributes to the current research by taking into consideration two significant and well-known determinants in information system research: data and system quality. Data and system quality are external factors that do not influence the core TAM variables. This finding confirms the results in the case of IoT.
The significance of system and data quality in developing a successful information system cannot be overstated. When it comes to supplying and retrieving customer and market data, this paper concluded that the quality of data has a fundamental role in the establishment of shared opinions among users of the business [38]. The quality of the system enables users to investigate the technical and functional aspects of BDA systems [70]. It enables individuals to obtain data and analyze the perceived usefulness of BDA systems [66,67,70,71,72].
Those who use BDA systems need good data and system quality to fulfil their respective tasks in real-time. As a result of BDA systems’ higher-quality data, businesses are more likely to believe that the systems themselves can provide value.
However, perceived benefits of BDA affect the perceived ease of use of BDA among executives. This result confirms Amoako-Gyampah and Salam’s (2004) [57] findings as well the findings in the case of IoT. It may not be easy for executives to use BDA systems because they do not find them user-friendly [71]. In other words, traditional business intelligence is a more common choice for managers who do not like BDA systems because they are too complicated or hard to use. To support managers to adopt BDA, companies should encourage the development of an easily understandable tool and applications easily aligned with their current systems.
Nevertheless, perceived ease of use influences perceived usefulness. This result contradicts with the study of Amoako-Gyampah and Salam (2004) [57] and is in agreement with the results of several existing papers [19,53,73,74] as well as the results in the case of IoT. The results showed that the ease of use of BDA systems creates a positive attitude of their usefulness. That is to say, even though BDA systems are simple to use, managers recognize their value. The perceived usefulness of BDA had a significant effect on behavioral intentions toward BDA and IoT. This result agrees with the Sabani’s findings (2020) [40]. According to the findings, managers believe that using BDA systems will support them to create a positive perception toward using BDA systems, resulting in a greater willingness to use BDA.
Firms that use BDA can understand consumer requirements in great detail because, like mobile platforms and the IoT, BDA can collect information about customers from all angles. As a result, companies can better understand their customers’ demands (both felt and unfelt) than their competitors do. BDA- and IoT-enabled companies can offer new services and products, alter existing ones, and improve their marketing, sales, and after-sale services. Therefore, these firms will increase the number of new customers while retaining existing ones, thereby increasing the business value. It will cost money to set up BDA and IoT. Still, in the long run, they will save money by cutting down on operational costs, improving energy efficiency, forecasting demand, and encouraging new manufacturing processes [75].

6. Conclusions

This article investigated the intention to use and the perceived benefits of using BDA systems and IoT in the telecommunications sector. The findings provide helpful implications for accepting BDA and IoT and the important determinants that executives should take into account. The perceived usefulness of these technologies positively affects the intention to use both technologies. Nevertheless, in both cases, perceived ease of use is the determinant that has a positive impact on the perceived usefulness of BDA and IoT. In this view, Yang et al. (2012) [76] discovered that perceived benefits of BDA are highly relevant for IT adoption.
Perceived usefulness has a positive effect on an individual’s attitude only in the case of IoT. In both categories the system quality does not significantly influence the perceived belief about the benefits of the technologies. The quality of data significantly influences perceived benefits in the case of BDA, while the impact of service quality on perceived benefits is more important in the case of IoT.
The study results could be helpful to executives in firms who are trying to use BDA and IoT by examining and resolving challenges connected to BDA system characteristics and perceptions. The results about BDA adoption and its items (i.e., perceived usefulness, perceived ease of use, perceived benefits of BDA systems, and data and system quality) will aid in BDA scalability. Furthermore, the results suggest that executives attempting to increase the value of BDA should prioritize the quality of data, perceived benefits of BDA systems and IoT, perceived usefulness, and perceived ease of use as crucial factors to improve the adoption and intention of these technologies as well as firm performance. Furthermore, this paper contributes by examining and evaluating current IT research in a new information system domain, namely implementing BDA systems. In contrast with several other information systems, BDA necessitate concurrent changes in data sharing methods [77].
Additionally, this study gives practical implications for marketers to preserve a competitive edge by effectively deploying BDA and IoT applications simultaneously. The results of this paper will have an impact on marketers’ strategic adaption mechanisms. Although IoT and BDA technologies have advanced rapidly, ambiguity still exists. Early adopters of BDA and IoT applications appear to be struggling to grasp the benefits of these technologies while also assessing the dangers and developing a convincing business case for their investments [60]. These applications can make and store a lot of money, making businesses want to spend a lot of money [78].
A limitation of this paper is the usage of a relatively small sample size in order to collect and analyze quantitative data, as well as the fact that the information came from a single organization in the field of Telecommunications. Therefore, the conclusions of the research cannot be generalized because they concern only one company.
Future work as a follow-up to the present survey should include a larger sample that will involve executives and employees in more companies in the field of Telecommunications in Greece and abroad to be able to compare the results. It is also important to conduct similar research in another area, for example the financial sector or industries that require day-to-day data and knowledge management with great intensity. This will allow the comparison of data between industries and if there are parameters that affect the success of technologies penetration and the relative value they create per case. As these technologies are context-specific, a multi-country analysis is needed. Future studies can use extensive multi-region research to assess big data quality, holistically, taking into account both the indirect impact on business effectiveness of the two types of big data (BDA and IoT).
Further research may look into improving the model by incorporating it with user satisfaction theories. This can aid in comprehending the user’s perspective on the use of BDA in a mandated environment. Aside from the system and data quality as well as the perceived benefits of BDA systems, other factors influenced behavioral intention, such as the nature of the technology itself. As stated by Venkatesh and Davis (2000) [79], the more we know about these, the more we can develop efficient organizational interventions to enhance user acceptance and the use of new information systems.

Author Contributions

Conceptualization, F.K. and I.M.; methodology, F.K.; formal analysis, M.K.; investigation, I.M.; data curation, F.K.; writing—original draft preparation, F.K., I.M., and M.K.; writing—review and editing, F.K., I.M., and M.K.; supervision, F.K. All authors have read and agreed to the published version of the manuscript.

Funding

This research received no external funding.

Institutional Review Board Statement

Not applicable.

Informed Consent Statement

Not applicable.

Data Availability Statement

Not applicable.

Conflicts of Interest

The authors declare no conflict of interest.

References

  1. Gunasekaran, A.; Papadopoulos, T.; Dubey, R.; Wamba, S.F.; Childe, S.J.; Hazen, B.; Akter, S. Big data and predictive analytics for supply chain and organizational performance. J. Bus. Res. 2017, 70, 308–317. [Google Scholar] [CrossRef]
  2. Kitsios, F.; Kamariotou, M. Artificial intelligence and business strategy towards digital transformation: A research agenda. Sustainability 2021, 13, 2025. [Google Scholar] [CrossRef]
  3. Kitsios, F.; Kamariotou, M. Service innovation process digitization: Areas for exploitation and exploration. J. Hosp. Tour. Technol. 2021, 12, 4–18. [Google Scholar] [CrossRef]
  4. Côrte-Real, N.; Ruivo, P.; Oliveira, T. Leveraging internet of things and big data analytics initiatives in European and American firms: Is data quality a way to extract business value? Inf. Manag. 2020, 57, 103141. [Google Scholar] [CrossRef]
  5. Kitsios, F.; Kamariotou, M. Beyond Open Data Hackathons: Exploring Digital Innovation Success. Information 2019, 10, 235. [Google Scholar] [CrossRef] [Green Version]
  6. Kitsios, F.; Kamariotou, M.; Karanikolas, P.; Grigoroudis, E. Digital marketing platforms and customer satisfaction: Identifying eWOM using big data and text mining. Appl. Sci. 2021, 11, 8032. [Google Scholar] [CrossRef]
  7. Pinochet, L.H.C.; Amorim, G.D.C.B.; Júnior, D.L.; de Souza, C.A. Consequential factors of Big Data’s Analytics Capability: How firms use data in the competitive scenario. J. Enterp. Inf. Manag. 2021, 34, 1406–1428. [Google Scholar] [CrossRef]
  8. Kitsios, F.; Giatsidis, I.; Kamariotou, M. Digital Transformation and Strategy in the Banking Sector: Evaluating the Acceptance Rate of E-Services. J. Open Innov. Technol. Mark. Complex. 2021, 7, 204. [Google Scholar] [CrossRef]
  9. Leminen, S.; Rajahonka, M.; Westerlund, M.; Wendelin, R. The future of the Internet of Things: Toward heterarchical ecosystems and service business models. J. Bus. Ind. Mark. 2018, 33, 749–767. [Google Scholar] [CrossRef]
  10. Marjani, M.; Nasaruddin, F.; Gani, A.; Karim, A.; Hashem, I.A.T.; Siddiqa, A.; Yaqoob, I. Big IoT data analytics: Architecture, opportunities, and open research challenges. IEEE Access 2017, 5, 5247–5261. [Google Scholar]
  11. Erevelles, S.; Fukawa, N.; Swayne, L. Big Data consumer analytics and the transformation of marketing. J. Bus. Res. 2016, 69, 897–904. [Google Scholar] [CrossRef]
  12. Sestino, A.; Prete, M.I.; Piper, L.; Guido, G. Internet of Things and Big Data as enablers for business digitalization strategies. Technovation 2020, 98, 102173. [Google Scholar] [CrossRef]
  13. Kitsios, F.; Kamariotou, M. Information Systems Strategy and Innovation: Analyzing Perceptions Using Multiple Criteria Decision Analysis. IEEE Trans. Eng. Manag. 2021, in press. [Google Scholar] [CrossRef]
  14. Kitsios, F.; Kamariotou, M. Strategizing information systems: An empirical analysis of IT alignment and success in SMEs. Computers 2019, 8, 74. [Google Scholar] [CrossRef] [Green Version]
  15. Kitsios, F.; Kamariotou, M. Information Systems Strategy and Strategy-as-Practice: Planning Evaluation in SMEs. In Proceedings of the Americas Conference on Information Systems (AMCIS2019), Cancun, Mexico, 15–17 August 2019; pp. 1–10. [Google Scholar]
  16. Kamariotou, M.; Kitsios, F. Critical Factors of Strategic Information Systems Planning Phases in SMEs. In Information Systems; EMCIS 2018; Springer LNBIP 341; Themistocleous, M., Rupino da Cunha, P., Eds.; Springer Nature: Cham, Switzerland, 2019; pp. 503–517. [Google Scholar]
  17. Kitsios, F.; Kamariotou, M. Decision Support Systems and Strategic Information Systems Planning for Strategy Implementation. In Strategic Innovative Marketing; Springer Proceedings in Business and, Economics; Kavoura, A., Sakas, D., Tomaras, P., Eds.; Springer: Cham, Switzerland, 2017; pp. 327–332. [Google Scholar]
  18. Gangwar, H.; Date, H.; Ramaswamy, R. Understanding determinants of cloud computing adoption using an integrated TAM-TOE model. J. Enterp. Inf. Manag. 2015, 28, 107–130. [Google Scholar] [CrossRef]
  19. Liao, C.H.; Tsou, C.W. User acceptance of computer-mediated communication: The SkypeOut case. Expert Syst. Appl. 2009, 36, 4595–4603. [Google Scholar] [CrossRef]
  20. Lin, R.; Xie, Z.; Hao, Y.; Wang, J. Improving high-tech enterprise innovation in big data environment: A combinative view of internal and external governance. Int. J. Inf. Manag. 2020, 50, 575–585. [Google Scholar] [CrossRef]
  21. Yunana, K.; Alfa, A.A.; Misra, S.; Damasevicius, R.; Maskeliunas, R.; Oluranti, J. Internet of Things: Applications, Adoptions and Components-a Conceptual Overview. In Hybrid Intelligent Systems, HIS 2020, Advances in Intelligent Systems and Computing; Abraham, A., Hanne, T., Castillo, O., Gandhi, N., Nogueira Rios, T., Hong, T.P., Eds.; Springer: Cham, Switzerland, 2020; pp. 494–504. [Google Scholar]
  22. Cranmer, E.E.; Papalexi, M.; tom Dieck, M.C.; Bamford, D. Internet of Things: Aspiration, implementation and contribution. J. Bus. Res. 2022, 139, 69–80. [Google Scholar] [CrossRef]
  23. Lu, Y.; Papagiannidis, S.; Alamanos, E. Internet of Things: A systematic review of the business literature from the user and organisational perspectives. Technol. Forecast. Soc. Change 2018, 136, 285–297. [Google Scholar] [CrossRef] [Green Version]
  24. Shoukry, A.; Khader, J.; Gani, S. Improving business process and functionality using IoT based E3-value business model. Electron. Mark. 2021, 31, 17–26. [Google Scholar] [CrossRef]
  25. Aljumah, A.I.; Nuseir, M.T.; Alam, M.M. Organizational performance and capabilities to analyze big data: Do the ambidexterity and business value of big data analytics matter? Bus. Process Manag. J. 2021, 27, 1088–1107. [Google Scholar] [CrossRef]
  26. Mikalef, P.; Boura, M.; Lekakos, G.; Krogstie, J. Big data analytics and firm performance: Findings from a mixed-method approach. J. Bus. Res. 2019, 98, 261–276. [Google Scholar] [CrossRef]
  27. Laguir, I.; Gupta, S.; Bose, I.; Stekelorum, R.; Laguir, L. Analytics capabilities and organizational competitiveness: Unveiling the impact of management control systems and environmental uncertainty. Decis. Support Syst. 2022, 156, 113744. [Google Scholar] [CrossRef]
  28. Mikalef, P.; Pappas, I.O.; Krogstie, J.; Giannakos, M. Big data analytics capabilities: A systematic literature review and research agenda. Inf. Syst. e-Bus. Manag. 2018, 16, 547–578. [Google Scholar] [CrossRef]
  29. Amado, A.; Cortez, P.; Rita, P.; Moro, S. Research trends on Big Data in Marketing: A text mining and topic modeling based literature analysis. Eur. Res. Manag. Bus. Econ. 2018, 24, 1–7. [Google Scholar] [CrossRef]
  30. Wang, G.; Gunasekaran, A.; Ngai, E.W. Distribution network design with big data: Model and analysis. Ann. Oper. Res. 2018, 270, 539–551. [Google Scholar] [CrossRef]
  31. Wang, Y.; Kung, L.; Wang, W.Y.C.; Cegielski, C.G. An integrated big data analytics-enabled transformation model: Application to health care. Inf. Manag. 2018, 55, 64–79. [Google Scholar] [CrossRef] [Green Version]
  32. Wang, Y.; Kung, L.; Byrd, T.A. Big data analytics: Understanding its capabilities and potential benefits for healthcare organizations. Technol. Forecast. Soc. Change 2018, 126, 3–13. [Google Scholar] [CrossRef]
  33. Ghasemaghaei, M. Understanding the impact of big data on firm performance: The necessity of conceptually differentiating among big data characteristics. Int. J. Inf. Manag. 2021, 57, 102055. [Google Scholar] [CrossRef]
  34. Steininger, D.M.; Mikalef, P.; Pateli, A.; Ortiz-de-Guinea, A. Dynamic capabilities in information systems research: A critical review, synthesis of current knowledge, and recommendations for future research. J. Assoc. Inf. Syst. 2022, 23, 447–490. [Google Scholar] [CrossRef]
  35. Altintas, G.; Ambrosini, V.; Gudergan, S. MNE dynamic capabilities in (un) related diversification. J. Int. Manag. 2022, 28, 100889. [Google Scholar] [CrossRef]
  36. Korte, A.; Tiberius, V.; Brem, A. Internet of Things (IoT) Technology Research in Business and Management Literature: Results from a Co-Citation Analysis. J. Theor. Appl. Electron. Commer. Res. 2021, 16, 2073–2090. [Google Scholar] [CrossRef]
  37. De Mauro, A.; Greco, M.; Grimaldi, M. Understanding big data through a systematic literature review: The ITMI model. Int. J. Inf. Technol. Decis. Mak. 2019, 18, 1433–1461. [Google Scholar] [CrossRef]
  38. Vitari, C.; Raguseo, E. Big data analytics business value and firm performance: Linking with environmental context. Int. J. Prod. Res. 2020, 58, 5456–5476. [Google Scholar] [CrossRef]
  39. Liu, Y.; Dong, J.; Mei, L.; Shen, R. Digital innovation and performance of manufacturing firms: An affordance perspective. Technovation 2022, 102458. [Google Scholar] [CrossRef]
  40. Sabani, A. Investigating the influence of transparency on the adoption of e-Government in Indonesia. J. Sci. Technol. Policy Manag. 2020, 12, 236–255. [Google Scholar] [CrossRef]
  41. Prakash, A.V.; Das, S. Medical practitioner’s adoption of intelligent clinical diagnostic decision support systems: A mixed-methods study. Inf. Manag. 2021, 58, 103524. [Google Scholar] [CrossRef]
  42. DeLone, W.H.; McLean, E.R. The DeLone and McLean model of information systems success: A ten-year update. J. Manag. Inf. Syst. 2003, 19, 9–30. [Google Scholar]
  43. Nudurupati, S.S.; Tebboune, S.; Hardman, J. Contemporary performance measurement and management (PMM) in digital economies. Prod. Plan. Control. 2016, 27, 226–235. [Google Scholar] [CrossRef] [Green Version]
  44. Behl, A. Antecedents to firm performance and competitiveness using the lens of big data analytics: A cross-cultural study. Manag. Decis. 2022, 60, 368–398. [Google Scholar] [CrossRef]
  45. Jayakrishnan, M.A.; Mohamad, A.K.B.; Yusof, M.B.M. Understanding holistic view and complexities in big data analytics and business intelligence (BI) towards establishing strategic performance management: A case study. Adv. Sci. Lett. 2018, 24, 1775–1779. [Google Scholar] [CrossRef]
  46. Ghasemaghaei, M.; Ebrahimi, S.; Hassanein, K. Data analytics competency for improving firm decision making performance. J. Strateg. Inf. Syst. 2018, 27, 101–113. [Google Scholar] [CrossRef]
  47. Akhtar, M.; Sushil, S. Strategic performance management system in uncertain business environment: An empirical study of the Indian oil industry. Bus. Process Manag. J. 2018, 24, 923–942. [Google Scholar] [CrossRef]
  48. Ghouchani, B.E.; Jodaki, S.; Joudaki, M.; Balali, A.; Rajabion, L. A model for examining the role of the Internet of Things in the development of e-business. VINE J. Inf. Knowl. Manag. Syst. 2019, 50, 20–33. [Google Scholar]
  49. Akter, S.; Wamba, S.F.; Gunasekaran, A.; Dubey, R.; Childe, S.J. How to improve firm performance using big data analytics capability and business strategy alignment? Int. J. Prod. Econ. 2016, 182, 113–131. [Google Scholar] [CrossRef] [Green Version]
  50. Altarawneh, M.; Al-Makhadmeh, A. Big data analytics in auditing and the consequences for audit quality: A study using the technology acceptance model (tam). Corp. Gov. Organ. Organ. Rev. 2022, 6, 64–78. [Google Scholar]
  51. Mehra, A.; Rajput, S.; Paul, J. Determinants of adoption of latest version smartphones: Theory and evidence. Technol. Forecast. Soc. Change 2022, 175, 121410. [Google Scholar] [CrossRef]
  52. Jeyaraj, A. A meta-regression of task-technology fit in information systems research. Int. J. Inf. Manag. 2022, 65, 102493. [Google Scholar] [CrossRef]
  53. Onofrei, G.; Filieri, R.; Kennedy, L. Social media interactions, purchase intention, and behavioural engagement: The mediating role of source and content factors. J. Bus. Res. 2022, 142, 100–112. [Google Scholar] [CrossRef]
  54. Rahman, N.; Daim, T.; Basoglu, N. Exploring the factors influencing big data technology acceptance. IEEE Trans. Eng. Manag. 2021, 28, 205–222. [Google Scholar]
  55. Davis, F.D.; Bagozzi, R.P.; Warshaw, P.R. User acceptance of computer technology: A comparison of two theoretical models. Manag. Sci. 1989, 35, 982–1003. [Google Scholar] [CrossRef] [Green Version]
  56. Levy, S.; Gvili, Y.; Hino, H. Engagement of Ethnic-Minority Consumers with Electronic Word of Mouth (eWOM) on Social Media: The Pivotal Role of Intercultural Factors. J. Theor. Appl. Electron. Commer. Res. 2021, 16, 2608–2632. [Google Scholar] [CrossRef]
  57. Amoako-Gyampah, K.; Salam, A.F. An extension of the technology acceptance model in an ERP implementation environment. Inf. Manag. 2004, 41, 731–745. [Google Scholar] [CrossRef]
  58. Gupta, R.; Varma, S.; Bhardwaj, G. A structural equation model to assess the factors influencing employee’s attitude & intention to adopt BYOD (bring your own device). Int. J. Recent Technol. Eng. 2019, 8, 63030–66308. [Google Scholar]
  59. Grander, G.; da Silva, L.F.; Gonzalez, E.D.R.S. Big data as a value generator in decision support systems: A literature review. Revista Gestão 2021, 28, 205–222. [Google Scholar] [CrossRef]
  60. Gupta, H.; Yadav, A.K.; Sarpong, S.K.; Khan, S.A.; Sharma, S.C. Strategies to overcome barriers to innovative digitalisation technologies for supply chain logistics resilience during pandemic. Technol. Soc. 2022, 69, 101970. [Google Scholar] [CrossRef]
  61. Karim, M.S.; Nahar, S.; Demirbag, M. Resource-Based Perspective on ICT Use and Firm Performance: A Meta-analysis Investigating the Moderating Role of Cross-Country ICT Development Status. Technol. Forecast. Soc. Change 2022, 179, 121626. [Google Scholar] [CrossRef]
  62. Al-Jabri, I.M.; Roztocki, N. Adoption of ERP systems: Does information transparency matter? Telemat. Inform. 2015, 32, 300–310. [Google Scholar] [CrossRef]
  63. Terzis, V.; Moridis, C.N.; Economides, A.A. Continuance acceptance of computer based assessment through the integration of user’s expectations and perceptions. Comput. Educ. 2013, 62, 50–61. [Google Scholar] [CrossRef]
  64. Verma, S.; Bhattacharyya, S.S.; Kumar, S. An extension of the technology acceptance model in the big data analytics system implementation environment. Inf. Processing Manag. 2018, 54, 791–806. [Google Scholar] [CrossRef]
  65. Toft, M.B.; Schuitema, G.; Thøgersen, J. Responsible technology acceptance: Model development and application to consumer acceptance of Smart Grid technology. Appl. Energy 2014, 134, 392–400. [Google Scholar] [CrossRef]
  66. Shin, D.H. Demystifying big data: Anatomy of big data developmental process. Telecommun. Policy 2015, 40, 837–854. [Google Scholar] [CrossRef]
  67. Shin, D.H. Effect of the customer experience on satisfaction with smartphones: Assessing smart satisfaction index with partial least squares. Telecommun. Policy 2015, 39, 627–641. [Google Scholar] [CrossRef]
  68. Zheng, Y.; Zhao, K.; Stylianou, A. The impacts of information quality and system quality on users’ continuance intention in information-exchange virtual communities: An empirical investigation. Decis. Support Syst. 2013, 56, 513–524. [Google Scholar] [CrossRef]
  69. Newkirk, H.E.; Lederer, A.L.; Srinivasan, C. Strategic information systems planning: Too little or too much? J. Strateg. Inf. Syst. 2002, 12, 201–228. [Google Scholar] [CrossRef]
  70. Barlette, Y.; Baillette, P. Big data analytics in turbulent contexts: Towards organizational change for enhanced agility. Prod. Plan. Control. 2022, 33, 105–122. [Google Scholar] [CrossRef]
  71. Cheng, Y.M. Quality antecedents and performance outcome of cloud-based hospital information system continuance intention. J. Enterp. Inf. Manag. 2020, 33, 654–683. [Google Scholar] [CrossRef]
  72. Ji-fan Ren, S.; Fosso Wamba, S.; Akter, S.; Dubey, R.; Childe, S.J. Modelling quality dynamics, business value and firm performance in a big data analytics environment. Int. J. Prod. Res. 2016, 55, 1–16. [Google Scholar] [CrossRef] [Green Version]
  73. Stocchi, L.; Pourazad, N.; Michaelidou, N.; Tanusondjaja, A.; Harrigan, P. Marketing research on Mobile apps: Past, present and future. J. Acad. Mark. Sci. 2021, 50, 195–225. [Google Scholar] [CrossRef]
  74. Akdim, K.; Casaló, L.V.; Flavián, C. The role of utilitarian and hedonic aspects in the continuance intention to use social mobile apps. J. Retail. Consum. Serv. 2022, 66, 102888. [Google Scholar] [CrossRef]
  75. Verma, S.; Bhattacharyya, S.S. Perceived strategic value-based adoption of Big Data Analytics in emerging economy: A qualitative approach for Indian firms. J. Enterp. Inf. Manag. 2017, 30, 354–382. [Google Scholar] [CrossRef]
  76. Yang, S.; Lu, Y.; Gupta, S.; Cao, Y.; Zhang, R. Mobile payment services adoption across time: An empirical study of the effects of behavioral beliefs, social influences, and personal traits. Comput. Hum. Behav. 2012, 28, 129–142. [Google Scholar] [CrossRef]
  77. Kushwaha, A.K.; Kar, A.K.; Dwivedi, Y.K. Applications of big data in emerging management disciplines: A literature review using text mining. Int. J. Inf. Manag. Data Insights 2021, 1, 100017. [Google Scholar] [CrossRef]
  78. Perdana, A.; Lee, H.H.; Arisandi, D.; Koh, S. Accelerating data analytics adoption in small and mid-size enterprises: A Singapore context. Technol. Soc. 2022, 69, 101966. [Google Scholar] [CrossRef]
  79. Venkatesh, V.; Morris, M.G.; Davis, G.B.; Davis, F.D. User acceptance of information technology: Toward a unified view. Manag. Inf. Syst. Q. 2003, 27, 425–478. [Google Scholar] [CrossRef] [Green Version]
Figure 1. Research model.
Information 13 00196 g001
Table 1. Brief description of variables.
VariablesInfluenceReferences
Data qualityPerceived benefits[39]
System qualityPerceived benefits[40,43,44]
Perceived ease of usePerceived usefulness
Attitude
[55,61]
Perceived usefulnessIntention[50,51,52]
Perceived benefitsPerceived ease of use
Perceived usefulness
[43,44]
AttitudeIntention[40]
Table 2. Descriptive statistics.
VariablesMeanStd. DeviationN
System quality3.64780.7958172
Data quality3.71130.8109172
Service quality3.65690.8435172
Perceived ease of use3. 64060.8487172
Perceived usefulness3.72200.8400172
Perceived benefits4.14340.7326172
Attitude4.18890.8078172
Intention to use4.01160.7722172
Table 3. Regression results for BDA.
ModelIndependent VariablesβAdjusted R2F
1: dependent variable (perceived benefits) 0.68449.276 ***
System quality−0.101
Data quality0.808 ***
Service quality−0.035
2: dependent variable (attitude) 0.59252.215 ***
Perceived ease of use0.508 ***
Perceived usefulness0.121
3: dependent variable (intention to use) 0.712423.600 ***
Perceived usefulness0.771 ***
Attitude0.845 ***
4: dependent variable (Perceived usefulness) 0.787633.525***
Perceived ease of use0.888 ***
Perceived benefits0.621 ***
5: dependent variable (Perceived ease of use) 0.58990.424 ***
Perceived benefits0.589 ***
* Significant at 0.05. ** Significant at 0.01. *** Significant at 0.001.
Table 4. Descriptive statistics.
VariablesMeanStd. DeviationN
System quality3.41770.8173172
Data quality3.46510.8097172
Service quality3.46890.8091172
Perceived ease of use3.47670.8105172
Perceived usefulness3.48600.8357172
Perceived benefits4.03100.7691172
Attitude4.01160.7703172
Intention to use3.87200.7805172
Table 5. Regression results for IoT.
ModelIndependent VariablesβAdjusted R2F
1: dependent variable (perceived benefits) 0.62736.271 ***
System quality−0.017
Data quality0.201
Service quality0.455 *
2: dependent variable (attitude) 0.615103.505 ***
Perceived ease of use0.546 ***
Perceived usefulness0.615 ***
3: dependent variable (intention to use) 0.638302.178 ***
Perceived usefulness0.665 ***
Attitude0.800 ***
4: dependent variable (Perceived usefulness) 0.854102.767 ***
Perceived ease of use0.925 ***
Perceived benefits0.614 ***
5: dependent variable (Perceived ease of use) 0.59291.771 ***
Perceived benefits0.592 ***
* Significant at 0.05. ** Significant at 0.01. *** Significant at 0.001.
Publisher’s Note: MDPI stays neutral with regard to jurisdictional claims in published maps and institutional affiliations.

