Article

Driving Factors of Industry 4.0 Readiness among Manufacturing SMEs in Malaysia

by
Annie Pooi Hang Wong
* and
Daisy Mui Hung Kee
School of Management, Universiti Sains Malaysia, Penang 11800, Malaysia
*
Author to whom correspondence should be addressed.
Information 2022, 13(12), 552; https://doi.org/10.3390/info13120552
Submission received: 26 September 2022 / Revised: 19 October 2022 / Accepted: 1 November 2022 / Published: 23 November 2022
(This article belongs to the Special Issue Intelligent Manufacturing and Informatization)

Abstract

:
Industry 4.0 increases the production efficiency and competitiveness of companies. However, Industry 4.0 implementation is comparatively low in developing countries, while Malaysian manufacturing Small and Medium Enterprises (SMEs) Industry 4.0 adoption is still in its infancy stage. This quantitative study aimed to broaden the knowledge of the driving factors that significantly strengthen Malaysian manufacturing SMEs’ readiness for the digital revolution. Based on the Resource-Based View theory, the study built a research framework to govern the investigation of organizational capabilities, SME institutional support, perceived advantage, and market factors as the driving factors of Industry 4.0 readiness, while firm size as the moderating variable. The data were collected by conducting an online survey with the owners and managers of Malaysian-owned manufacturing SMEs located throughout Peninsular Malaysia, where the firms have received some form of government assistance. The analysis of the study indicated that organizational capabilities, SME institutional support, and market factors positively correlate with Industry 4.0 readiness. It was determined that firm size only moderates the relationship between SME institutional support and Industry 4.0 readiness. This study’s findings benefit industry practitioners and policymakers who wish to drive the future of Malaysia’s SMEs business ecosystem and contribute to Industry 4.0 literature.

1. Introduction: Industry 4.0 Revolutionize

1.1. Global Revolution Shift

Global manufacturing industries have seen digital transformation compelled by Industry 4.0 as an important agenda due to its operational advantages and market opportunities [1]. Industry 4.0 revolutionizes the means by which products are designed, fabricated, delivered, produced, used, operated, serviced, and maintained [2]. It also changes the processes, operations, supply chain management, skill requirements and manufacturing power, as well as the energy footprint of factories [2]. Product lifecycles are becoming shorter, which drives the sector’s constant and ongoing flow of product development projects [3]. Furthermore, the current COVID-19 pandemic provides an opportunity for a new generation of entrepreneurs to lead the next industrial transformation and innovate new methods of doing business using state-of-the-art technology [4]. According to Bawany [5], Industry 4.0 is about the idea of smart factories in which machines are augmented by the use of web connectivity and linked to a system that can envision the whole production chain and make decisions on its own. Smart factories represent a big step from more traditional automation to a fully connected and flexible system, where computers and machines communicate, collect and exchange data, and based on the data, enhance production efficiency to achieve better positioning in the competitive marketplace [6]. From a macroeconomic approach, Industry 4.0 is regarded as a new competitive advantage for a nation [7].

1.2. The Importance of SMEs Manufacturing Firms

In the context of Small- and Medium-sized Enterprises (SMEs), globalization and rapid technological advancements have paved the road for SMEs to become more competitive. SMEs are regarded as an economy’s backbone and are the largest contributor to most countries’ gross domestic product [8]. According to Organization for Economic Co-operation and Development report [9], SMEs represent 99 percent of all firms in the OECD area, almost one out of three persons are employed in a micro firm with less than ten employees, and two out of three persons are in SMEs. Meanwhile, in the Malaysian context, SMEs are defined based on qualifying criteria such as sales turnover and employment. In the manufacturing sector, SMEs are defined as establishments with sales turnover not exceeding MYR 50 million or a number of full-time employees not exceeding 200 [10]. Based on the SME insights of SME Corporation Malaysia [11], SMEs account for 98.5 percent of all businesses and contributed 38.9% of GDP in 2019, while there were 907,065 business establishments classified as SMEs, and they contributed 48.4 percent of the country’s workforce employment.
In terms of manufacturing firms, Industry 4.0 can change manufacturing SMEs in a variety of ways, including increasing productivity, efficiency, flexibility, and cost-effectiveness; increasing production capacity; allowing for improved quality control and monitoring, as well as a reduction in waste, delivery time, and system downtime [12,13,14]. Therefore, investing in Industry 4.0 is crucial for manufacturing firms that desire to remain competitive in this global economy [15]. On top of that, the manufacturing sector has the greatest multiplier effect on the nation’s operations and progress and remains the most important sector in the Malaysian economy [16]. As of 2020, Malaysia recorded MYR 164 billion in approved investments, while the total investments approved were led by the manufacturing sector, which received MYR 91.3 billion [16].
Globally, the manufacturing industry is evolving from a labor-intensive to an automation and digitalization landscape conforming to Industry 4.0 [17]. The trend toward automation and data exchange in manufacturing technologies, such as cyber-physical systems, artificial intelligence, the Internet of things (IoT), cloud computing, and robotics, enables companies to respond faster to market changes and more easily implement configurations or replan production [12]. In Malaysia, the manufacturing sector is the second-biggest contributor to the overall SMEs, with 47,698 establishments constituting 5.3% of SMEs [10]. On 21 February 2020, the Ministry of International Trade and Industry (MITI) initiated the National Automotive Policy 2020 [18], which is an expansion and prolongation of NAP 2014 and aims to propel Malaysia into a regional leader in automotive manufacturing as the automotive industry plays a significant role in the country’s transformation into an industrialized nation [18]. Malaysia’s manufacturing sector accounts for 80% of interregional merchandise trade, and only 20% of interregional trade is in services [19]. This study focuses on manufacturing SMEs as it significantly impacts the country’s economy.

1.3. SME Manufacturing Firms in Malaysia

The Malaysian government has recognized the significance of integrating the Industry 4.0 initiative into the national agenda to accelerate the country’s revolution into a smart and modern manufacturing system [2]. Lately, the manufacturing industry in Malaysia has been challenged by lower-cost competitors from emerging economies and swiftly transforming technologies [2]. Therefore, Malaysia needs to improve the value chain toward a higher-end manufacturing base [20]. Subsequently, it is crucial for Malaysian manufacturing firms, especially SMEs, to digitally transform their production processes and technologies at an accelerated pace and embrace Industry 4.0 to propel and sustain their future manufacturing competitiveness [2].
Although the Future of Production Report [21] underlines that Malaysia is well-positioned to benefit from Industry 4.0, and large firms and MNCs have successfully engaged in the process, most SMEs do not seem ready yet. Many SMEs struggle to keep abreast with the staggering speed of technological evolution because they face many issues and challenges related to resources and operational costs [22]. Although the Malaysian government has established initiatives to support manufacturing firms’ technological development, digital adoption, especially among SMEs, is still at about 20%, and most manufacturing firms implement less than 50% automation [23]. Moreover, despite the initiatives the Malaysian government has launched to encourage SME digitalization, only 25% of Malaysian firms accelerated their digital transformation processes due to the COVID-19 pandemic, while 60% slowed down [24]. In this respect, understanding why SMEs are slower on the uptake of Industry 4.0 is thus critical to assist policymakers. In addition, large manufacturing firms are aware of the advantages and risks of adopting Industry 4.0 practices. At the same time, many SMEs still lack information and knowledge about it and remain relatively unaware of their role in driving economic growth amid digital disruption [2,25]. Under these circumstances, a limited understanding of Industry 4.0 and its benefits may restrain the broader adoption of digital technologies. Therefore, the perceived advantages of Industry 4.0 could be one potential driving factor to consider in getting ready for Industry 4.0.
Giotopoulos, Kontolaimou [26] found that SMEs encounter increased difficulty in adopting new technologies due to inadequate skills, resources, commitment, and proper understanding of digital opportunities. Furthermore, Horváth and Szabó [27] also argued that financial resources pose a high barrier for SMEs. In this regard, SMEs with strong financial capabilities can hire more skilled employees, thus improving their technical capabilities to handle Industry 4.0 operation. As a result, they will feel more confident and motivated to prepare for Industry 4.0 sooner.
On the other hand, government support for digital transformation is another significant driver for SMEs, such as financial support in the form of funding, incentives, and technological support in the form of training, consulting, and guidance [28,29,30]. The availability of government initiatives and incentives must be communicated to SMEs, as many are unaware of government initiatives and incentives for digitalization [24]. SMEs face significant obstacles in adopting new digital technologies due to the lack of necessary resources [31]. Therefore, they would be more inclined to engage in this costly transition if they have any assistance in obtaining the resources they need.
Additionally, customers’ needs for products made using the Industry 4.0 manufacturing process will drive the manufacturers to adopt Industry 4.0 because they risk losing the consumer if they do not [32]. Many global manufacturers of finished goods have begun to place their requirements for the Industry 4.0 standard on their raw materials suppliers [33] and Malaysian SMEs. Meanwhile, as market competition in the Asia Pacific region heats up, SMEs in Malaysia risk losing local and foreign customers if their rivals implement the Industry 4.0 system [34]. Therefore, consumer needs and competitors’ rapid adoption of Industry 4.0 will push Malaysian SMEs to prepare for digital transformation.
Even though the readiness of SMEs for digital transformation is critical, manufacturing firms have a limited understanding of the required future skills and experience and their readiness to embark on the Industry 4.0 transformation. It is crucial to investigate manufacturing SMEs’ readiness for Industry 4.0, because implementation efforts regarding new technology processes or organizational change frequently fail when leaders do not establish adequate organizational readiness for change [35]. According to Weiner, Amick [36], organizational readiness for change refers to how members behave and psychologically execute organizational change. When organizational readiness is high, the organizational members are more likely to initiate change, unleash greater effort, show greater persistence, and exhibit more cooperative behavior, which results in more effective execution of the initiated change [36]. The outcome is more effective execution. In this regard, organizational readiness for change is perceived as a pivotal herald to the successful adoption of Industry 4.0.
Nevertheless, researchers such as Maavak and Ariffin [37] claimed that studies on the driving factors of readiness for Industry 4.0 in Malaysia are still in their early stages. This study extended the relationship between the driving factors, namely organizational capabilities, SME institutional support, perceived advantage, market factors and readiness for Industry 4.0, and empirically demonstrated the moderating effect of firm size to address this research gap. Moreover, although there has been some research on the impacts of capability and financial resources on SMEs’ engagement in innovative activities, there is currently a dearth of research connecting financial aptitude with digital technology adoption. In the current literature, the bulk of research analyzed firm size solely from the perspective of firm performance; consequently, the moderating effect of firm size on the deployment of Industry 4.0 remains insufficient.
Based on the discussion above, this study intends to determine how prepared Malaysian manufacturing SMEs are for digital transformation. Importantly, there is a need to comprehend the driving factors that will empower Malaysian manufacturing SMEs to embrace digital transformation. Therefore, this study aims to broaden the current state of knowledge in Industry 4.0 readiness of Malaysian manufacturing SMEs and the driving factors that significantly strengthen SMEs’ readiness for the digital revolution in Malaysia.
This study contributes to the existing body of knowledge by examining the moderating effect of firm size between the four driving factors and SMEs’ readiness for Industry 4.0. This study elongated the relationship between the driving factors, namely organizational capabilities, SME institutional support, perceived advantage, market factors and readiness for Industry 4.0, and empirically proved the moderating effect of firm size. In the current literature, most studies evaluated firm size only from the firm’s performance perspective; thus, the moderating role of firm size on Industry 4.0 implementation is still inadequate. Hence, rigorous validation is necessary to identify the moderating effect of firm size between the driving factors and Industry 4.0 implementation.

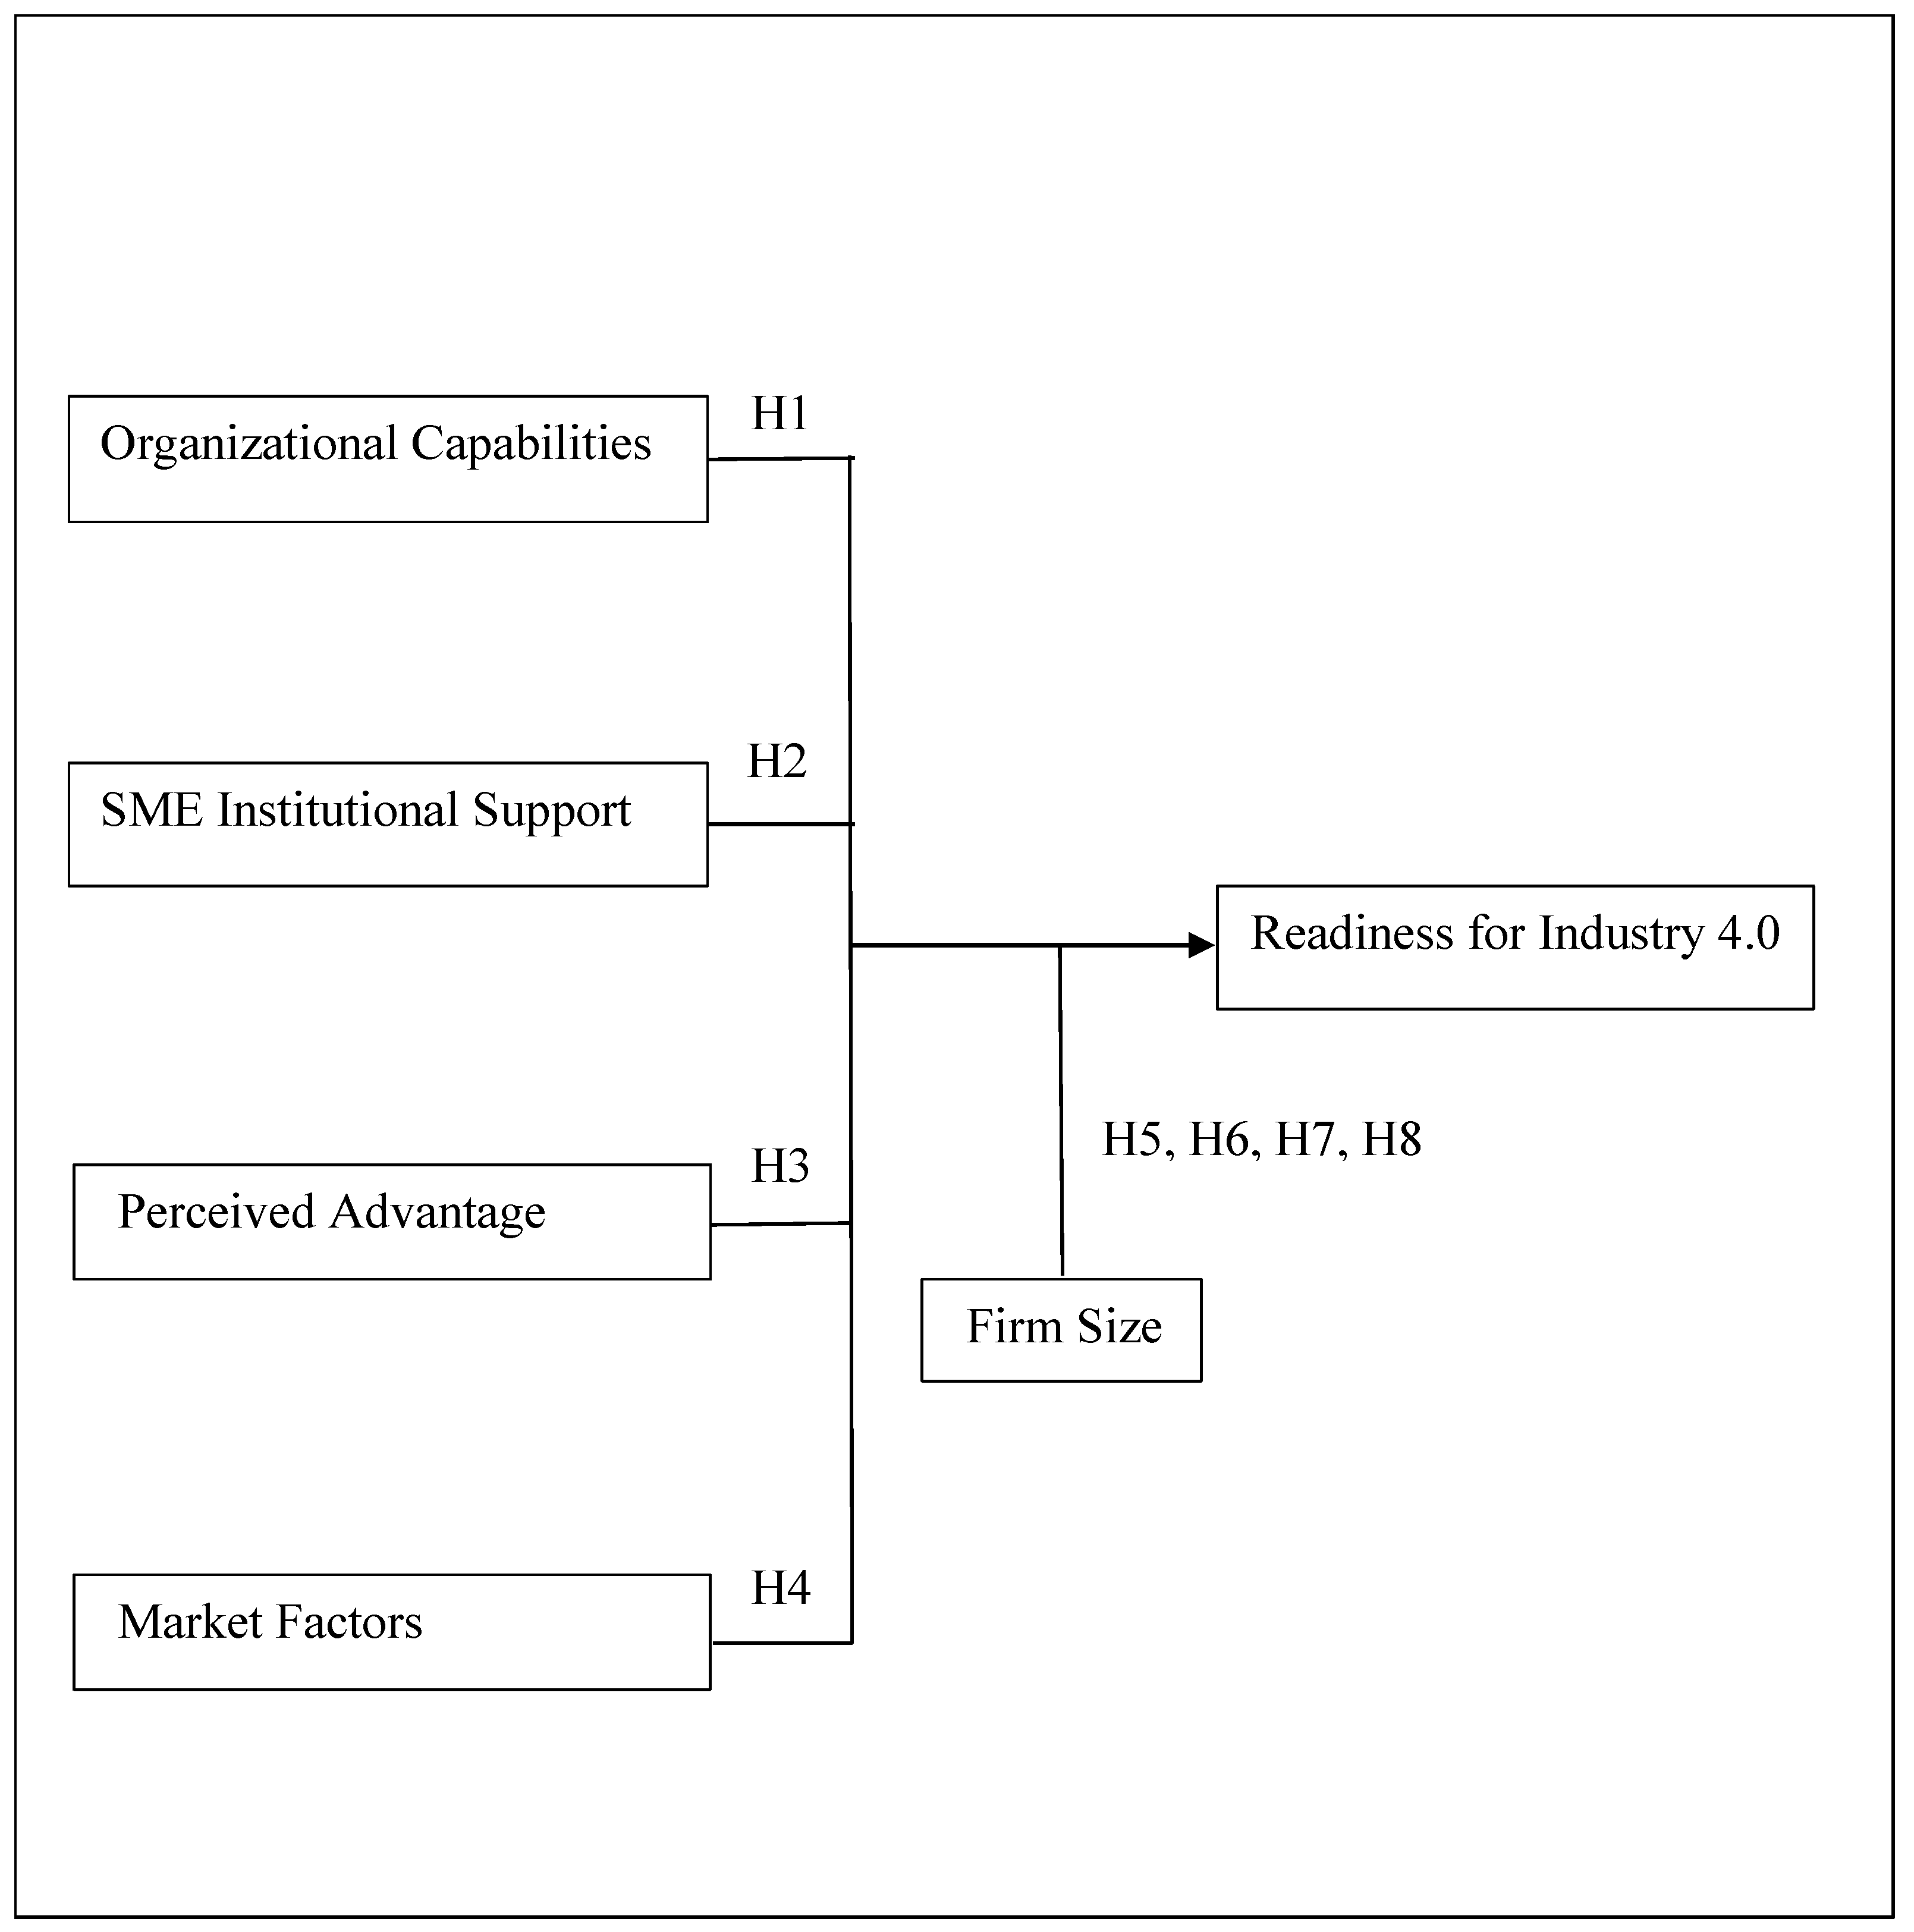
2. Theoretical Framework and Hypothesis Development

This section investigates the theoretical foundation and notion of Industry 4.0 readiness as well as the literature-reported driving factors, leading to the formulation of hypotheses for empirical testing. Figure 1 focuses particularly on the impact of driving factors for Industry 4.0 readiness and the moderating effect of firm size on Industry 4.0 implementation.

2.1. Readiness for Industry 4.0

Industry 4.0 provides new technological capabilities by communicating and integrating information technologies to maximize production performance [38,39]. Adopting Industry 4.0 is a crucial strategic decision. The inadequacy of a shared understanding of the factors that influence the implementation of Industry 4.0 technologies may reasonably explain SMEs’ hesitation to embrace the digital revolution under Industry 4.0 [40]. Hence, it is critical to analyze the organization’s readiness for Industry 4.0 implementation before making such a significant decision [41]. Readiness for new technology has been defined differently. According to Holt, Armenakis [42], a readiness assessment allows leaders to identify gaps in the current organization ahead of or throughout the change implementation process. In a more practical sense, the systemic analysis of an organization’s ability to deal with and implement a revolutionary process or change is defined as assessing or measuring readiness Pirola, Cimini [43].
Furthermore, a readiness assessment also intends to address potential barriers to success, empowering the companies to overcome the barriers before starting the transformation project [43]. In this study, Industry 4.0 readiness is defined as the preparedness level of organizations to benefit from Industry 4.0 technology [44], which includes management commitment, operational resources, technological skills, and technical requirements [45].
Malaysian SMEs require extensive preparations to address the challenges of getting them ready for Industry 4.0, which is not easy. The Industry 4.0 level process cannot be implemented without adequate planning and support from authorities. Therefore, understanding the current level of readiness for Industry 4.0 among SMEs and the areas in which SMEs should be ready may assist the government in creating a conducive ecosystem and generating important Industry 4.0 initiatives to increase SMEs’ readiness. This study evaluates SMEs’ current readiness level and examines whether manufacturing SMEs in Malaysia are ready to transform and achieve Industry 4.0 status digitally.

2.2. Driving Factors for Industry 4.0

Harvie, Narjoko [46] claimed that SMEs’ innovation capability strongly influences SMEs’ engagement in production networks. SMEs with plentiful internal financial resources or access to external sources of finance are hypothesized to be more likely to engage in innovative activities than those without [46]. Despite the importance of financial aptitude in acquiring new technology, there is still a scarcity of literature linking it to digital technology. This gap in the literature necessitates an empirical study of the impact of financial capability on digital transformation.
According to Tech Wire Asia [47], one of the main barriers to digital transformation is the manufacturing firms’ lack of expertise and skill scarcity. Besides, a firm with technological capability is likely to be tech-savvy and technologically oriented, since it strives to keep up with technological advancements [48]. Firms with unique technological resources or technical capabilities that are not prone to replication by competitors will gain a sustained competitive advantage due to newly emerging technologies [49]. Based on the literature and RBV, organizational capabilities with the dimensions of financial and technological capability are deemed to have great value and impact on driving Malaysian manufacturing firms to prepare for Industry 4.0. The following hypotheses are therefore formed:
Hypothesis 1 (H1):
Organizational Capabilities Positively Impact SMEs’ Readiness for Industry 4.0.
According to Lall [50], governments may need to take a proactive role to overcome market failures that prevent firms from developing the capabilities needed for industrial development. It has been said that a policy for higher industrial efficiency based on new processes should focus on the role of new machinery acquisition through incentives and credit for new technology investment by Vaona and Pianta [51].
Given that the Malaysian government has set aside significant funds to help SMEs transition to Industry 4.0, it is important to determine whether this effort has successfully driven SMEs’ digital transformation. In the study on South Korean firms, Kim and Lee [52] found that government support positively influences innovation production at the business level but that the effect on obtaining high innovativeness is statistically insignificant. Based on this literature, the researchers posit as follows.
Hypothesis 2 (H2):
SME institutional support positively impacts SMEs’ readiness for Industry 4.0.
It has been reported in the media that key barriers to Industry 4.0 in Malaysia include the lack of awareness of its benefits and impacts among SMEs [23]. Many manufacturing SMEs are still hesitant to adopt Industry 4.0 because they are unsure about the benefits. In this sense, manufacturers will be more encouraged to consider the implementation of Industry 4.0 as they perceive them as competitively valuable [53]. Since perceived benefits have been empirically validated to positively affect new technology implementation in the IT literature, SMEs will prepare for Industry 4.0 requirements based on their belief or perceived benefits of digital transformation [54].
On the other hand, introducing new services and products enabled by new technologies is expected to bring market opportunities for manufacturing firms [55]. Although market opportunities have been reported, a study by Tortora, Maria [56] revealed that most manufacturing firms are unaware of the potential opportunities that Industry 4.0 technologies may provide. Thus, they must thoroughly understand the various parts of Industry 4.0 and the necessary knowledge, skills, and confidence. As the Industry 4.0 transformation impacts the entire firm, it is critical to understand how the varied elements of Industry 4.0 can take advantage of digitization opportunities [1]. Therefore, the researchers hypothesize as follows.
Hypothesis 3 (H3):
Perceived advantage of Industry 4.0 positively impacts SMEs’ readiness for Industry 4.0.
Firms will be able to incorporate their customers’ needs and preferences into their development and production processes in new ways due to Industry 4.0, which includes direct data sharing with their machinery [32]. Industry 4.0 enables a faster response to customer needs than is currently achievable; hence, manufacturing system suppliers must understand how to apply technologies in new use cases to provide the most value to their customers [57] in order to avoid lower customer satisfaction levels and loss of customers [58]. In this respect, customers’ requirements drive the decision to begin the Industry 4.0 process.
Adopting new technology is frequently a strategic imperative for remaining competitive in the marketplace [54]. In the literature on technology transformation, competitive pressure has long been acknowledged as a key driver for technology transformation [59,60,61]. By adopting new technology, firms can gain better market insight, improved operational efficiency, and more accurate access to real-time data [59,60].
According to Rajnai and Kocsis [45], company competitiveness is vital for an economy to be well-positioned in the markets and value chains in a new and continuously changing environment. In this dynamic business environment, SMEs will prepare for Industry 4.0 when they feel competitive pressure from their competitors. At the same time, governments are keen to examine the local economy’s health and businesses, particularly to assess their readiness for Industry 4.0. The researchers hypothesizes as follows:
Hypothesis 4 (H4):
Market factors for Industry 4.0 positively impact SMEs’ readiness for Industry 4.0.

2.3. Firm Size as the Moderator

The firm’s size is the most important factor in implementing new technology and gives strong support [61]. Firm size has been investigated by several researchers in the field of innovation, which is seen to be a significant indication of organizational complexity, including Berry, Bizjak [62], Stock, Greis [63], and Zona, Zattoni [64]. SMEs’ firm size is measured using the number of employees [65,66]. Although some researchers have discovered a negative relationship between firm size and technology, for example, cloud computing [67], the majority of studies in various contexts, including ICT innovations [68] and ICT adoption [69], have found a positive relationship. According to Hansen [70], firm size is inversely associated with the innovative product when it comes to determining the factors that influence both product and process innovation, the size of the company matters [51,71].
Firms of various sizes have different patterns of the innovation process and diverse factors driving their organizational performance [72]. Although the RBV theory indicates that larger firms could enhance growth, Miller and Toulouse [73] revealed that the CEO in the smaller firm will have a greater impact on the employees, both directly and through internal procedures and processes, allowing the firm to respond more swiftly. On the other hand, SMEs’ flexibility and specificity are frequently thought to make them competitive when executing new technologies and addressing certain customer demands; however, their ability to the invention is constrained by scarce resources [74].
Financial support from the government for technological development enhanced a higher percentage of technological advancements’ success [75]. Even though there is already a huge amount of literature on the impact of government support on innovation performance for various sizes of businesses in various countries [29], this study focuses on SMEs in Malaysia, as most previous studies have been designed for managers in large firms. SMEs are not obligated to disclose financial statements to the public, so they are notoriously opaque regarding financial health [76]. Their main funding source for technology and innovation investments is external finance from financial institutions and banks [77]. As the financial system restricts the types of assets a lender can accept as collateral for a loan [78], small borrowers frequently lack assets to pledge as collateral or are limited in their company collateral options [79]. In this case, SMEs will require external funding or investment from institutions such as the government.
On the other hand, the perception of SME owner-managers and supply side shortcomings are proven to play a role in the difficulties of financing innovation [80]. Various factors suggest that small firms may have an advantage in innovation as they are more likely to recognize opportunities [81]. Individual firms should examine and account for their size before investing in innovative products or projects or embracing innovation to enhance their process management [76].
Christensen [72] claimed that competition and consumer needs in the value network affect the firm’s cost structure, the firm size required to remain competitive, and the required growth rate in various ways. Furthermore, technological and market factors determine the relationship between firm size and innovation [82]. As international competitive pressures have become more intense in recent years, the role of firm size has become a top priority for policymakers and industrial players [83].
Based on the above discussions, the size of a firm is believed to have a certain impact on technological innovation. Therefore, deriving and considering the impact that firm size could bring into this study, the role of firm size will be studied as a moderator, hence the following hypotheses:
Hypothesis 5 (H5):
Firm size moderates the relationship between organizational capabilities and SMEs’ readiness for Industry 4.0; the positive relationship between organizational capabilities and SMEs’ readiness for Industry 4.0 is stronger when the firm size becomes larger.
Hypothesis 6 (H6):
Firm size moderates the relationship between institutional support and SMEs’ readiness for Industry 4.0; as such, the positive relationship between institutional support and SMEs’ readiness for Industry 4.0 is stronger when the firm size becomes larger.
Hypothesis 7 (H7):
Firm size moderates the relationship between perceived advantage and SMEs’ readiness for Industry 4.0; as such, the positive relationship between perceived advantage and SMEs’ readiness for Industry 4.0 is stronger when the firm size becomes larger.
Hypothesis 8 (H8):
Firm size moderates the relationship between market factors and SMEs’ readiness for Industry 4.0; as such, the positive relationship between market factors and SMEs’ readiness for Industry 4.0 is stronger when the firm size becomes larger.

3. Methods

This quantitative study investigated the relationships between the independent variables (organizational capabilities, SME institutional support, perceived advantage, and market factors) and the readiness for Industry 4.0 in Malaysian manufacturing SMEs. In particular, this study aimed to investigate whether firm size affects managers’ decision to revolutionize their business into Industry 4.0 in three-dimensional readiness (managerial, operational, and technological readiness). This study is executed using a cross-sectional design, and in a non-contrived setting, that is, in the managers’ natural work environment, with the lowest interference from the researchers. Self-administered questionnaires were used to collect data for each study variable.

3.1. Population and Source of Data

The SME Corporation directory was employed as a sampling frame to determine the population of this present study. All SMEs in manufacturing form the population of the current study. A sample was elicited from these firms with the following set of conditions:
  • The respondents are the owners or managers of SMEs.
  • The firm must be from the SME manufacturing sector in Malaysia.
  • The firm must have received government assistance, including financial and technical assistance.
This study’s Malaysian manufacturing SMEs included a variety of businesses from the electronics, electrical, pharmaceutical, and automobile sectors. Thus, purposive sampling focusing on the management personnel at the organizational level from Malaysian manufacturing SMEs is employed in this study. Only the owners or managers of Malaysian-owned manufacturing SMEs are chosen as the data source in this study. Therefore, this study is a purposive sampling study, since it concentrates only on a group of owners or managers taken from Malaysian-owned manufacturing SMEs who share a common characteristic. The researchers clarified this matter with the owners or managers of the manufacturing firms during the phone call for survey invitation.

3.2. Unit of Analysis

In this study, the unit of analysis is at the organizational level. Management personnel at the organizational level serve as the decision-maker in Malaysian-owned manufacturing SMEs. An owner or manager will lead each Malaysian-owned manufacturing SME. Owner-managers in SME firms tend to be the main decision-maker maintaining control of the firm’s operations. Lobonţiu and Lobonţiu [84] stated that in small firms, owner-managers tend to be all-powerful and manipulate the two most vital functions of the firm: Production and Sales and Marketing.
Typically, top management members are members of the dominant coalition. In addition, Van Gils [85] conducted a study and found that although the CEO in SMEs is the main decision-maker, more than sixty percent of them set up top-management teams to reinforce the strategic decision-making process. The top-management teams are small, but the executives intensify the company’s know-how.
On the other hand, Burgelman [86] mentioned that middle-level managers strive to develop wider strategies for areas of new business activity and attempt to persuade top management to support them. This is the sort of strategic behavior encountered in the research of internal corporate venturing. Hence, only owners or managers were considered in this study.

3.3. Sampling Technique

This study used the purposive sampling technique, which restricted the sample selection to those who could provide the required information. This technique is suitable because a limited category or number of people have the information required. For example, the owners or managers of Malaysian-owned manufacturing SME firms were selected as a sample for this study because they are in the best position to give the information needed [87].

3.4. Minimum Sample Size

Cohen and Klepper [83] suggested that the sample size of statistical power of 80% with a 5% significant level and four arrows pointing at a construct with minimum R2 values of 0.25 and 0.10 between 65 and 137. Meanwhile, another method for identifying the sample size in PLS-based analysis is G*Power. G*Power is a tool employed to provide power and sample-size calculations. As the model in this study has 4 predictors pointing to one endogenous variable, the readiness for Industry 4.0 construct, the number of predictors in the sample size calculation is then set as 4. The effect size is set at 0.15, which is the medium size effect based on the argument of Cohen and Klepper [83], while the power required for the calculation is set as 0.8 Green [88]. Based on G*Power, the minimum sample size needed in this study is 84 respondents. As a result, this study collected a minimum sample size of 110 SME owners or managers.

3.5. Data Collection Procedures

Self-administered online questionnaires were employed to gather primary data to obtain responses for all variables in this study. The online questionnaire was set by using Google Forms. In January 2022, the researchers of the present study began to contact the managers of SMEs in Malaysia to get their approval to execute the survey. Before surveying owners or managers of Malaysian-owned manufacturing SME firms, the researchers invited manufacturing SMEs located throughout Peninsular Malaysia based on the Directory of SMEs, sector by sector, by phone and email, to invite them to participate in this study. To achieve a satisfactory response rate, emails and phone calls served as ways to communicate the importance and benefits of this survey. Ultimately, a total of 500 SMEs agreed to participate.
Once the researchers had received approval from the owners or managers of the respective manufacturing SME firms, a cover letter was emailed with the link to the questionnaire survey to each SME owner or manager, assuring the respondent of their anonymity and providing directions on completing the survey questionnaire. The questionnaire contained a total of 81 items representing the study variables along with demographic data. The SME owners and managers were given two weeks to complete the questionnaire. Upon completing the questionnaire, the SME owners and managers submitted their responses directly at the end, and the researchers received them immediately. The researchers followed up with the respondents at the end of the month to see if there were any additional submitted responses.

3.6. Research Instrument

This section presents the measurement employed in this study. The dependent variable is readiness for Industry 4.0, which consists of managerial readiness, operational readiness, and technological readiness. The independent variables consist of organizational capabilities, government support, perceived advantage, and market factors. Table 1 summarizes the measures employed in this study, with 69 items used to measure the variables. Another 12 items were included to obtain information on the respondents’ companies and personal profiles.

3.6.1. Readiness for Industry 4.0

The dependent variable in this study is readiness for Industry 4.0. Readiness for Industry 4.0 is conceptualized in three dimensions: managerial, operational, and technological. A 23-item measurement for readiness for Industry 4.0 developed by Khin and Kee [54] was employed. The first eight items measure managerial and operational readiness. The last seven items measure technological readiness. The measurement is assessed using a 5-point Likert scale, ranging from 1 (strongly disagree) to 5 (strongly agree). The Cronbach’s alpha reported by Khin and Kee [54] for managerial, operational, and technological readiness were 0.88, 0.86, and 0.79, respectively.
The 23-item measurement for managerial, operational, and technological readiness is shown in Table 2. To measure the readiness for Industry 4.0 of SMEs, respondents are asked to assess their managerial, operational, and technological readiness below on the basis of the 23 items. A 5-point Likert Scale ranging from 1 (strongly disagree) to 5 (strongly agree) was used.

3.6.2. Organizational Capabilities

The two dimensions of organizational capabilities, financial and technological, were measured using a 10-item measurement developed by Khin and Kee [54]. The items were measured using a 5-point Likert scale, ranging from 1 (very low) to 5 (very high). The Cronbach’s alpha values reported by Khin and Kee [54] for financial capability and technological capability were 0.94 and 0.96, respectively. The 10-item measurement for financial and technological capability is shown in Table 3. To measure SMEs’ financial and technological capabilities, the respondents were asked to examine their financial and technological capabilities to invest in segments below in ten items. A 5-point Likert scale (very low, low, moderate, high, very high) was used.

3.6.3. SME Institutional Support

The two dimensions of SME institutional support, financial and technological support, were measured using an 11-item measurement developed by Khin and Kee [54]. The measurement was assessed on a 5-point Likert scale, ranging from 1 (strongly disagree) to 5 (strongly agree). The Cronbach’s alpha values for financial and technological support were 0.85 and 0.91, respectively. To measure SMEs’ financial and technological support, respondents were asked to assess their financial and technological support for investing in the areas below on the basis of ten items. The 11-item measurement for both financial and technological support is shown in Table 4.

3.6.4. Perceived Advantages

The two dimensions of perceived advantages, perceived benefits, and opportunities were measured using a 15-item measurement developed by Khin and Kee [54]. The measurement was assessed on a 5-point Likert scale, ranging from 1 (Strongly Disagree) to 5 (Strongly Agree). The Cronbach’s alpha values reported for perceived benefits and opportunities were 0.96 and 0.94, respectively. To measure SMEs’ perceived benefits and opportunities, respondents were asked to assess the benefits and opportunities to investing in the areas below on the basis of 15 items. A 5-point Likert Scale ranging from 1 (strongly disagree) to 5 (strongly agree) was used. The 15-item measurement for perceived benefits and opportunities is presented in Table 5.

3.6.5. Market Factors

The two dimensions of market factors, customer needs and competitive pressure, were measured using a 10-item measurement developed by Khin and Kee [54]. The measurement was assessed on a 5-point Likert scale, ranging from 1 (strongly disagree) to 5 (strongly agree). The 10-item measurement for customer needs and competitive pressure is shown in Table 6. The Cronbach’s alpha values reported for customer needs and competitive pressure were 0.928 and 0.758, respectively.

3.7. Common Method Variance

Method variances or biases are one of the main sources of measurement error. Common method variance is perceived as a potentially critical concern for researchers because this study is cross-sectional based on survey data, especially since the independent and dependent variables are based on perceptual evaluations and come from the same source. Therefore, as suggested by Podsakoff, MacKenzie [89], several procedural remedies have been employed to cope with common method variance.
First and foremost, when designing and administering the questionnaire, different scale types, including dichotomous and rating scales, were used, as suggested by Podsakoff, MacKenzie [89], in order to reduce common method biases. Additionally, respondents were notified that there were no right or wrong answers in the questionnaire [89]. Secondly, the questionnaire was accompanied by a cover letter pledging the anonymity of the respondents. This method supports the statement that respondents are not being evaluated based on the answers [89]. Thirdly, Harman’s single-factor test technique was used, as noted by [89].

3.8. Statistical Techniques and Analysis

For data analysis and hypothesis testing, this study used the IBM SPSS Statistics Campus Edition (Version 26.0) and Partial Least Squares (PLS) with Smart PLS 3.3.2. The SPSS statistical analysis has been employed for data cleaning, data entry, descriptive analysis, and missing value imputation analysis. In contrast, the PLS was used to test the structural equation model.

3.8.1. Descriptive Statistics

The main purpose of employing descriptive statistics is to discuss the basic features of the data in the study. Descriptive statistics such as means and standard deviation were obtained to describe the sample. This helped the researchers understand the respondents’ firms’ constructs with respect to their readiness for Industry 4.0, organizational capabilities, institutional support, perceived advantages, and market factors.

3.8.2. Measurement Model

Evaluation of the measurement model (outer model) is the first step in PLS analysis. These steps involve evaluating whether the recommended variance properly measures the theoretical constructs. This means that the accuracy of the measures and their convergent and discriminant validities are to be evaluated.

3.8.3. Construct Validity

Sekaran and Bougie [32] illustrated that construct validity demonstrates how well the results from using the measure adapt to the theories around which the test is designed. This can be evaluated by using convergent and discriminant validity. At this stage, the important things that the researchers have to take note of are the respective loadings. Hair, Ringle [90] suggested a cut-off value of 0.5 for loadings considered significant.

3.8.4. Convergent Validity

Hair, Ringle [90] illustrated that convergent validity is the degree to which multiple attempts to assess the same constructs are in agreement. The researchers examined the composite reliability and the average variance extracted (AVE). Thresholds with values of 0.70, 0.70 and 0.50, respectively, are usually accepted in the literature.

3.8.5. Discriminant Validity

Discriminant validity is the extent to which measures of different concepts are distinct. According to Hair and Ringle [17], in assessing the discriminant validity, the AVE for each construct should be greater than the square of the correlations between the construct and all other constructs [33]. The elements include predictive power (R2), effect size (f2), bootstrap procedure, predictive relevance (Q2), and goodness of fit (GoF).

3.8.6. Structural Model Evaluation

In the PLS analysis, the following step after evaluating the Measurement Model is the examination of the model (inner model). The purpose of the structural model is to provide accurate evidence to support the theoretical model. The structural model is assessed based on the significance of the hypothesized relationships between the constructs.

4. Results

The researchers distributed 500 questionnaires using Google Forms via email to SME owners or managers for data collection. The expected response would be 100 (500 × 20% = 100), which meets the minimum sample size of 84. At the end of data collection, 110 questionnaires were filled in and returned to the researchers, surpassing the minimum requirement of 84 samples calculated using G*Power. Only 22% responded to the questionnaires. According to the feedback from those owners or managers of the manufacturing firms who disagreed with responding to the survey, their reasons are that they were not interested in implementing Industry 4.0, and some of them were still in the phase of Industry 2.0, so they did not have much information about the adoption of Industry 4.0. Therefore, it is also believed that these are the reasons why only 110 out of 500 SMEs responded.

4.1. Respondents’ Company Profiles

The raw data collected from Google Forms was then prepared for processing using Smart PLS 3.0 for further computation and analysis. Table 7 shows the respondents’ background information and company profiles.

4.2. Mean and Standard Deviation of the Variables

As depicted in Table 8, the mean value of financial capability (18.955) is higher than technology capability (17.036). This shows that respondents’ financial capabilities exceed their technological capabilities. Similarly, the mean value of access to financial support (12.718) is higher than the mean value of access to technological support (14.218), suggesting that they require more technological support. The mean value of perceived benefits (25.582) and opportunities (21.055) is moderately high, indicating that their awareness of Industry 4.0’s advantages is fair. On the other hand, customer needs (14.591) and competitive pressure (16.364) have moderate mean values.

4.3. Data Analysis

Partial least squares structural equation modeling (PLS-SEM) was executed for further statistical data analysis using SmartPLS 3 version [91] to investigate and statistically explore the structural and measurement model.

4.3.1. Common Method Variance (CMV)

Different scale types, including dichotomous scales and rating scales, were used in this study to reduce common method biases. For readiness for Industry 4.0, SME institutional support, perceived advantage, and market factors are examined using a 5-point Likert scale with 1 = strongly disagree to 5 = strongly agree. Moreover, the Likert scale for organizational capability is a 5-point scale with 1 = very low to 5 = very high.
Conversely, Harman’s single-factor test was used with SPSS software to assess the presence of any common method variance. An exploratory factor analysis based on unrotated factor analysis was performed by loading all the items used in this study. The unrotated factor analysis demonstrated that no single factor was deemed for all the variances. The results also revealed that 11 factors emerged, with the greatest factor accounting for 33.67% of the total variance of 69.77% of all measurement items. Since the greatest factor does not account for more than half of the total variance, it is believed that there was no significant common method variance. Therefore, it can be concluded that this study had no problem with common method variance.

4.3.2. Reliability Analysis

At this stage, the measurement model is evaluated to identify the validity and reliability of the measurements used. SmartPLS 3.0 version software examined the measurement model by executing the PLS algorithm. The PLS algorithm was used to construct the path coefficients, factor loadings, coefficient of determination, and the model’s reliability and validity measures.
Construct Validity
Construct validity was used in this study to ensure that the altered and adopted questionnaire questions accurately measured the target idea.
Convergent Validity
The loadings for all distinctive items between the constructs are demonstrated in Table 9. It can be observed from Table 9 that no indicators possessed loadings that were lower than 0.40. Nevertheless, the indicators of PB2, PB4, PB6, PB7 and PB8, as shown in Table 9, were deleted as recommended by Hair, Hult [92], because the AVE for the perceived advantage construct was lower than 0.50. After deleting the mentioned indicators, the AVE for perceived advantage increased to above 0.50. The results of the measurement model after the deletion of said indicators are shown in Table 9.
In addition to the loadings, the AVE, a summary indication of convergence, was analyzed. As a rule of thumb, it is recommended that the AVE be at least 0.50 [92,93,94]. Table 10 reveals astonishingly that the AVE for all constructs were more than 0.50. As a result, it can be concluded that the measurement employed in this study possessed adequate convergence validity.
Discriminant Validity
As can be seen from Table 11, the square root of the AVE for each construct surpassed the correlations between the constructs. As a result, the measurements employed in this study revealed sufficient discriminant validity.

4.4. Testing and Assessing the Structural Model

The structural model assessment was examined and checked with respect to the hypothesized relationships of the predicted research model after the constructs and instruments had been confirmed for their reliability and validity. Six steps of assessments were employed to assess the structural model, which corresponded to PLS-SEM [92]. The six steps were the assessment of collinearity, path coefficients, coefficient of determination (R2 value), effect size (f2 value), predictive relevance (Q2 value), and the PLSpredict.

4.4.1. Collinearity Assessment

Table 12 displays the values of skewness and kurtosis for each variable. It can be observed from Table 12 that the skewness and kurtosis values were within +1 and −1; thus, it can be inferred that the data were not intensely abnormal. Therefore, it is concluded that the data in the present study did not pose a serious concern because they were not highly abnormal.
The inner VIF values for the research variables were derived using SmartPLS. Table 13 demonstrates the inner VIF values for the involved study variables. It can be observed from Table 13 that none of the VIF values were above 5. Thus, multicollinearity was not an issue in the present study.
Bootstrapping was performed to examine the relevance and significance of the relationship in the model Hair, Risher [95]. The structural model was reported with the standard errors, path coefficients, t-values, and p-values after the complete bootstrapping of 5000 subsamples with a 95% confidence interval [96]. Since the model would have to go through the PLSpredict procedure, items from the endogenous construct must be included. As proposed by Sarstedt, Hair Jr [97], a discontinuous two-stage approach was applied. Items of a single construct were turned into a single item after the two-stage approach. This entailed combining the original items for the lower-order construct (LOC) with the latent variable score produced from the hierarchical component model (HCM). This enables PLSpredict to calculate the score for each item in the construct. Hahn and Ang [98] suggested that p values were insufficient to report on the significance of a hypothesis, and thus the researchers propose that the reporting should include other criteria as well, such as confidence intervals and effect size.

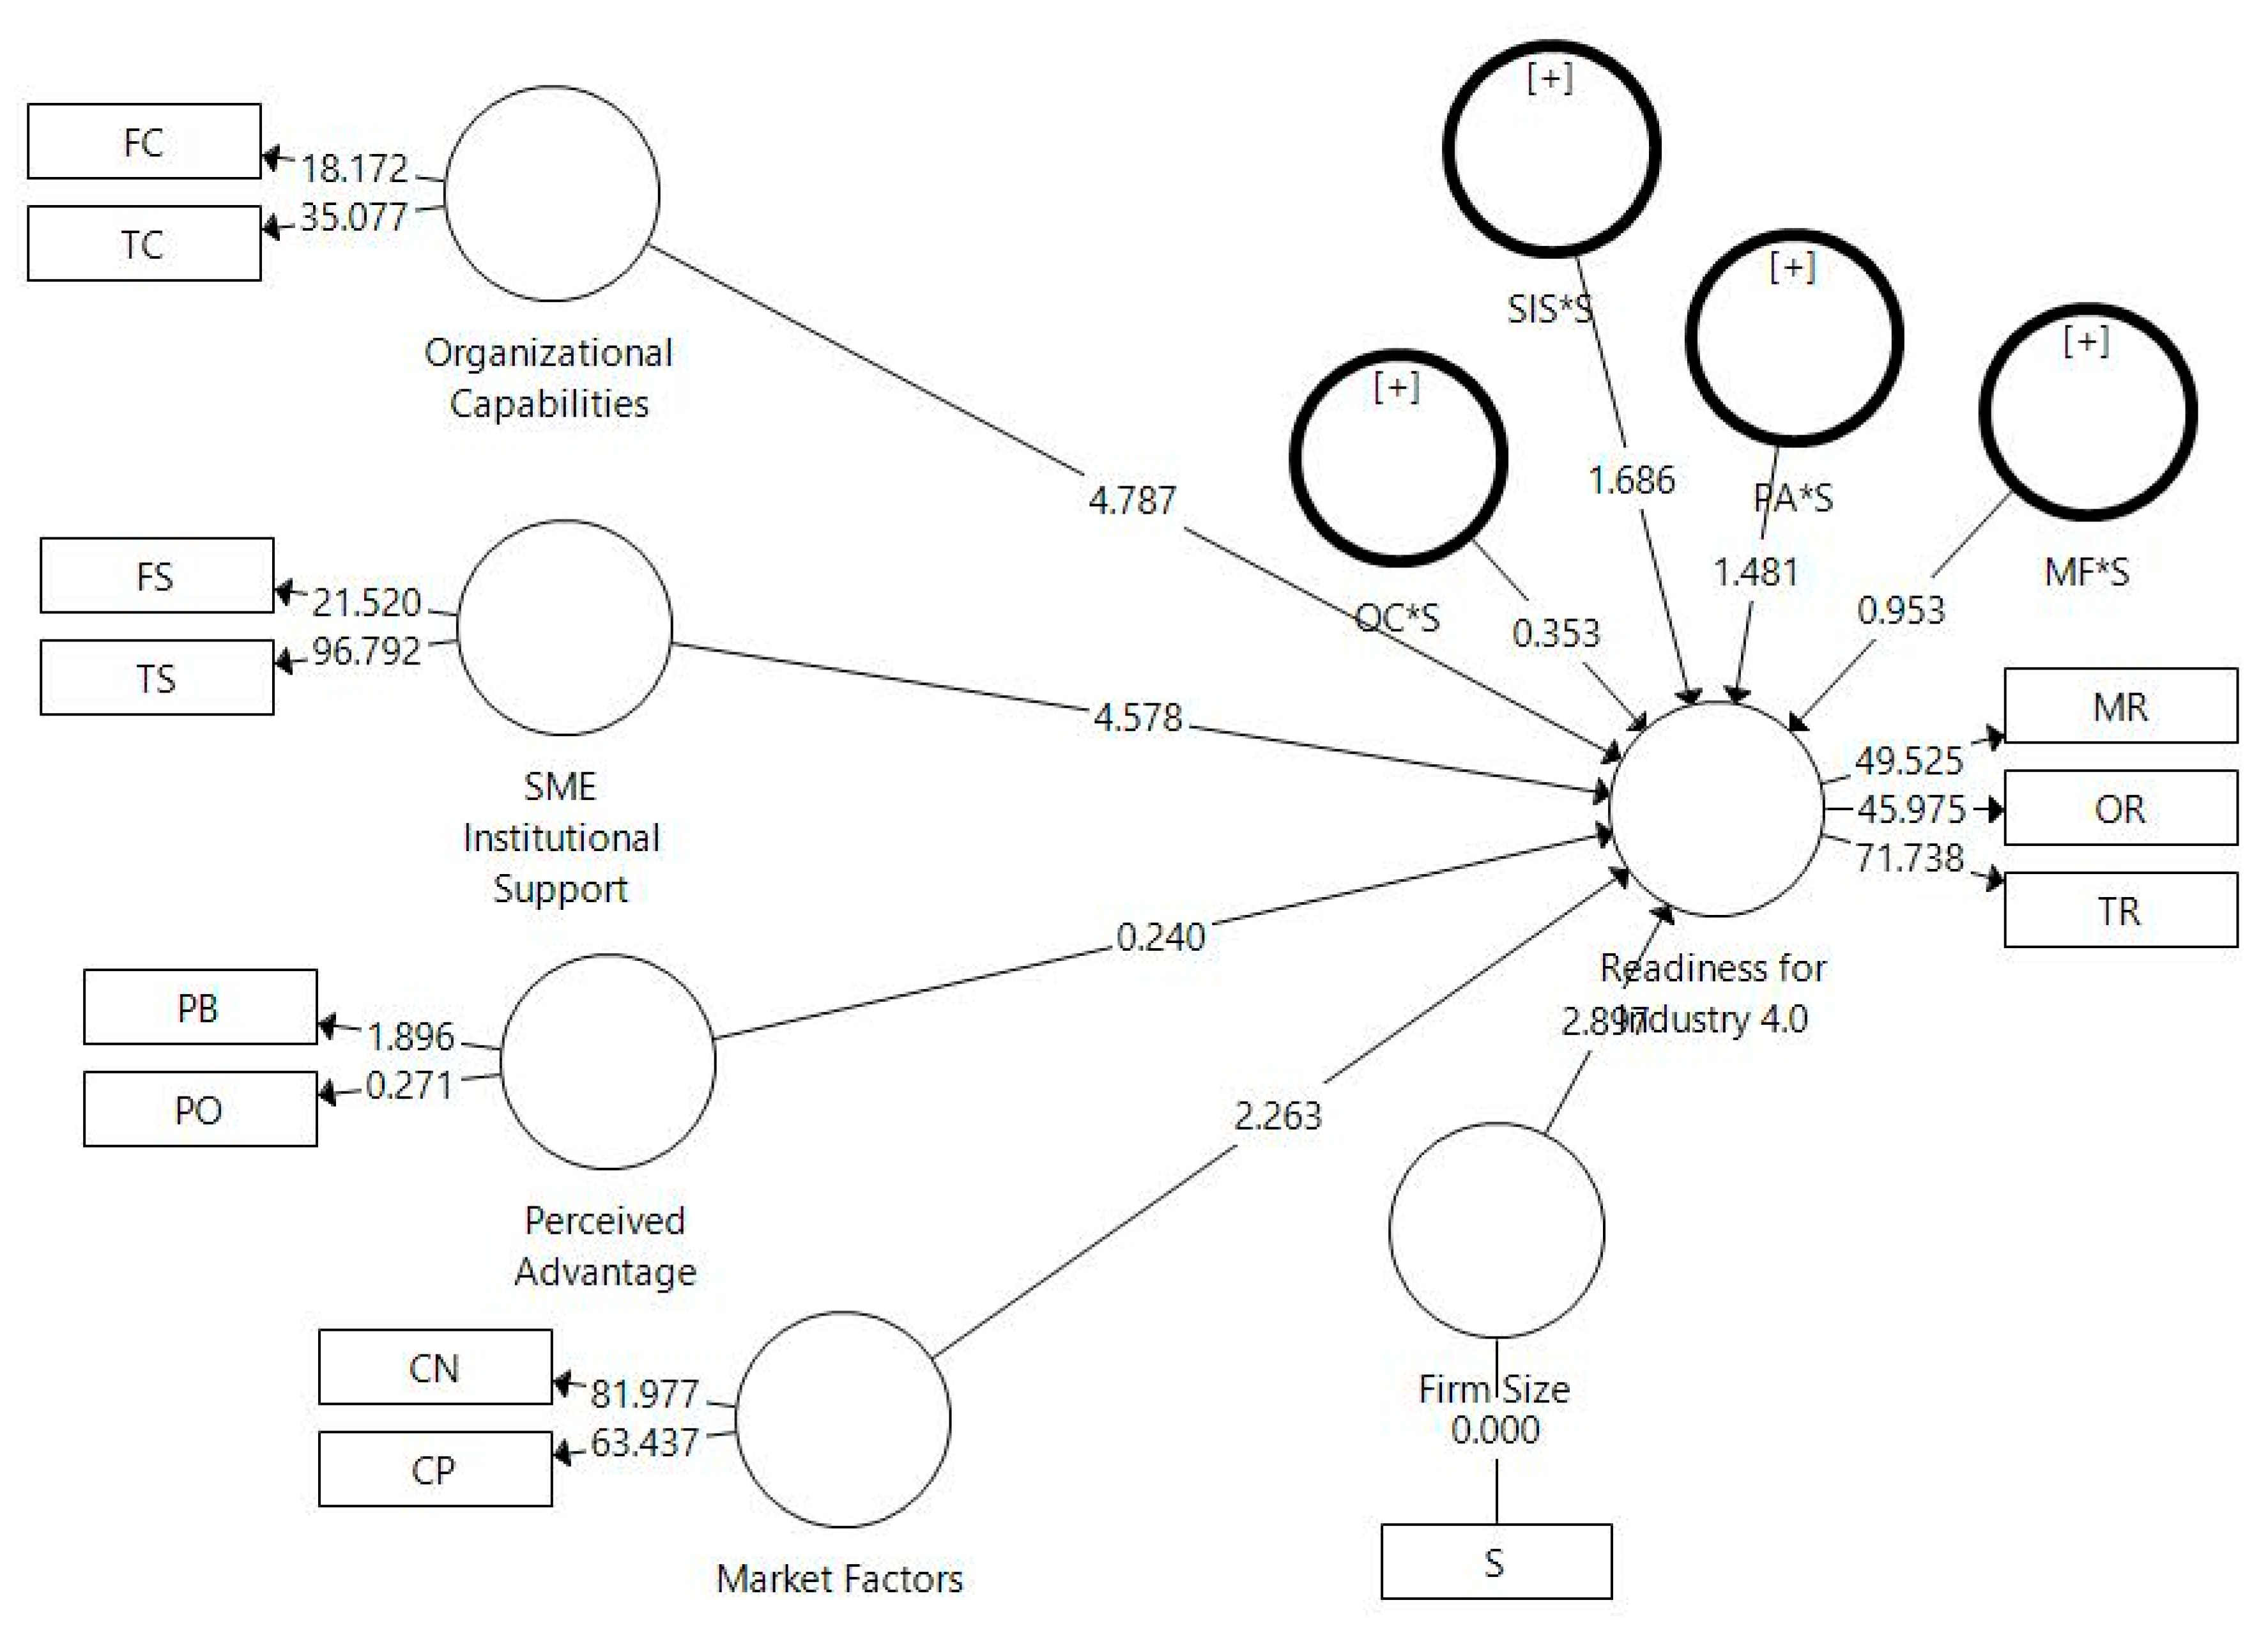
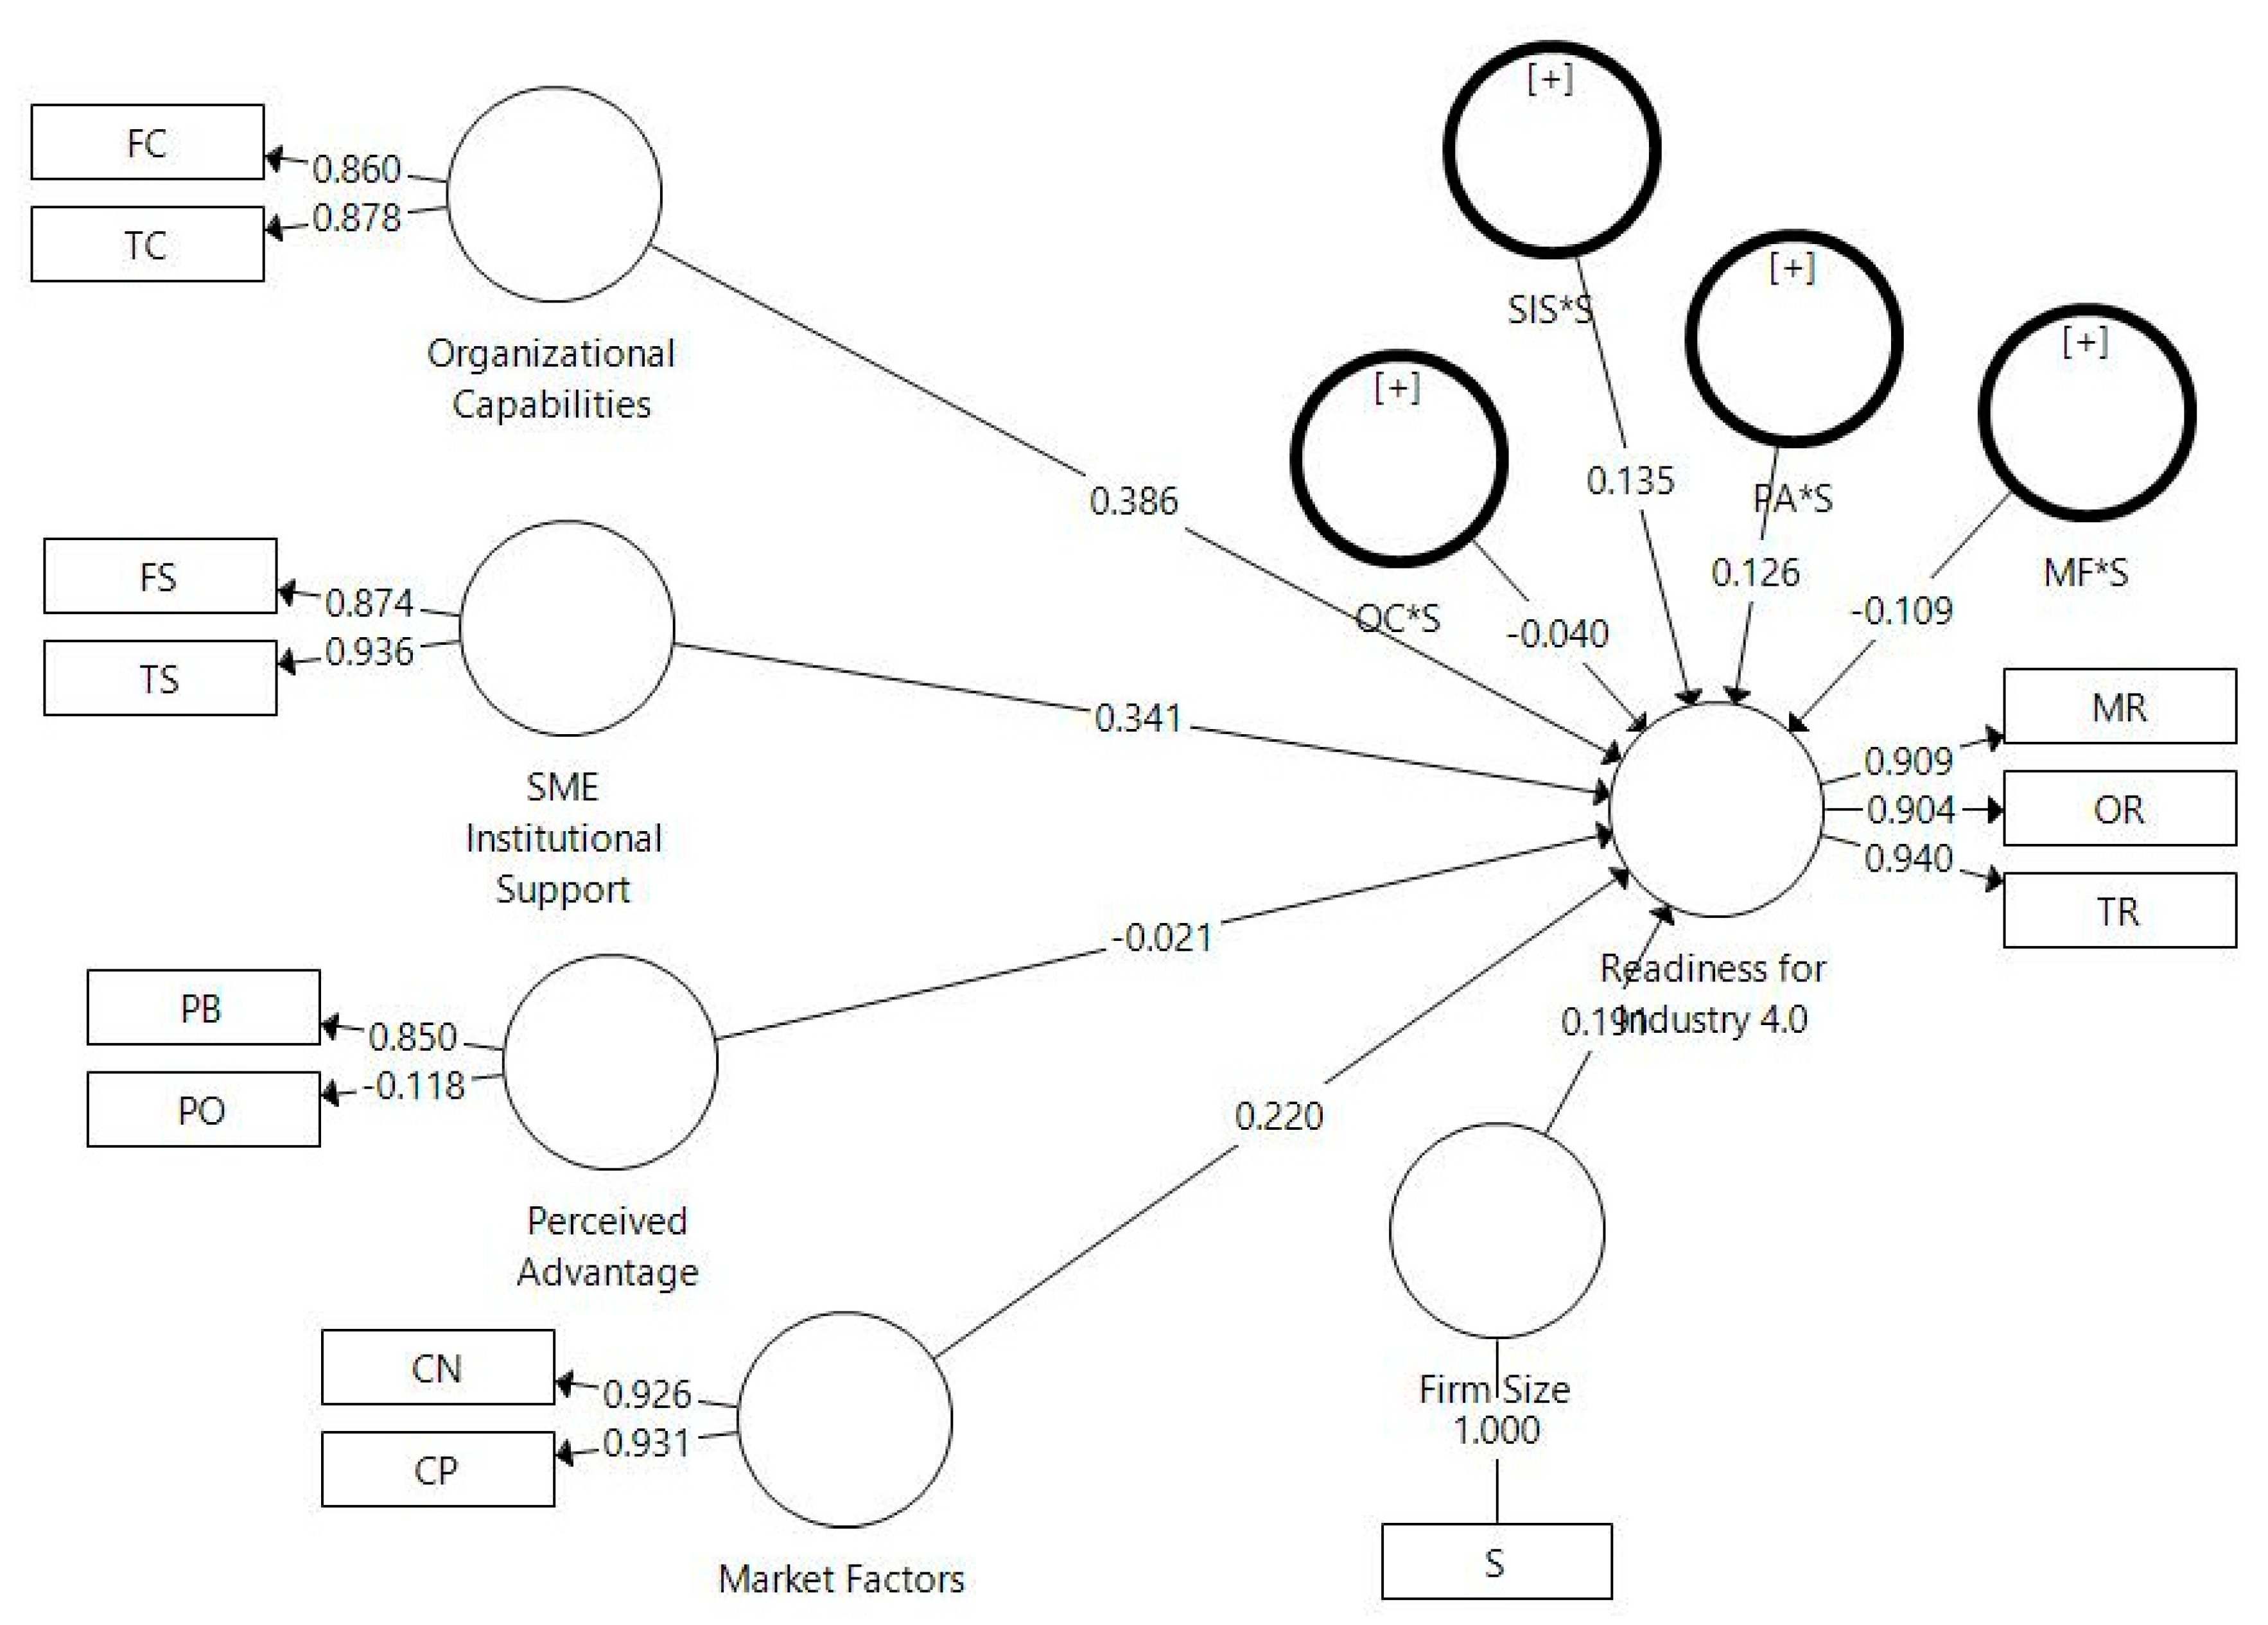
4.4.2. Path Coefficients and Coefficients of Determination

The structural model of data analysis is evaluated in this section with respect to the hypothesized links between the variables. Bootstrapping was performed on a sample of 5000 people. To determine the significance of the structural path, the path coefficients and t values were analyzed. The value of the path coefficients, which corresponds to the standardized beta values in β range between −1 and +1, as generated by the software, is used to estimate the predicted relationship between the predictor and the outcome variable. As illustrated in Figure 2, the bootstrapping process was subjected to a one-tailed test with a 5% level of significance, and the findings can be found in Table 13 under the t-values column.
With reference to Table 13, four out of the hypothesized relationships have t-values of more than 1.645, and are thus significant for α = 0.05. In summary, organizational capabilities explained 38.6% of the model (β = 0.386, p < 0.05), followed by SME institutional support, at 34.1% (β = 0.341, p < 0.05), and market factors (β = 0.220, p < 0.05), which explained 22.0% of the model, while the firm size moderation effect on SME institutional support explained 13.5% (β = 0.135, p < 0.05). However, one of the non-hypothesized relationships appeared to explain 19.1 percent of the model, which was firm size (β = 0.191, p < 0.05).

4.4.3. Coefficient of Determination

The next stage is to assess the model’s coefficient of determination. In the R2 endogenous construct, the coefficient of determination is shown in Figure 3 for the endogenous construct. The R2 value, which ranges from 0 to 1, shows the model’s explanatory power and in-sample predictive power, with a higher number indicating greater power of explanation (Hair, Sarstedt [99]). This study embraced the three levels of predictive accuracy proposed by Hair Jr, Hult [100], whereby 0.75 indicates considerable predictive accuracy, 0.50 moderate predictive accuracy, and 0.25 weak predictive power. In this study, the R2 value is 0.739, and the adjusted R2 value is 0.715, which is more than moderate predictive power.

4.4.4. Effect Size

In addition to determining the R2 value, the fifth step is to look at the effect size (f2) of the exogenous constructs and if they affect the endogenous construct. The f2 values are tested to examine the impact on the coefficient of determination when the interaction effect is eliminated from the study model [101]. According to Sheko and Braimllari [102], the f2 values, also known as Cohen’s Indicator, can be classified into three, with 0.02 being tiny, 0.15 median, and over 0.35 considered to be large. Therefore, with reference to Table 13, it can be observed that the construct with the largest effect size is organizational capabilities (f2 = 0.304), followed by SME institutional support (f2 = 0.236), firm size (f2 = 0.112), market factors (f2 = 0.098). Two of the hypothesized relationships have a large effect size, which are H6 (f2 = 0.040), and H7 (f2 = 0.042). However, the other two hypothesized moderated relationships had very low or no effect; H5 (f2 = 0.002) and H8 (f2 = 0.014).
In this scenario, firm size does not seem to have an impact in terms of strengthening the relationship between three driving factors, namely organizational capabilities, perceived advantage and market factors, and readiness for Industry 4.0; however, it has an impact in terms of strengthening the relationship between one driving factor, namely SME institutional support, and readiness for Industry 4.0. Moreover, since this study involved moderated hypotheses, the moderating effect must be evaluated. Table 14 demonstrates the outcome of the tested interactions.

4.4.5. Predictive Relevance

The following step assesses the predictive relevance. While the R2 value describes the model’s in-sample predictive and explanatory power, the StoneGeisser’s Q2 value demonstrates how valid the model’s prediction is through the blindfolding process [103]. This evaluation can be performed using the SmartPLS 3 software and is set with an omission distance of 7. Ramayah, Cheah [96] suggested that any Q2 value larger than 0 shows that the endogenous construct has substantial predictive relevance (see Table 15).

4.4.6. PLSpredict

The PLSPredict procedure is the final stage in the model evaluation [104,105]. The PLSpredict assessment is calculated with ten folds and ten repetitions using the SmartPLS software. With reference to Table 16, one indicator in the LM model is higher than the PLS model, while the other two are lower, hence suggesting that the model possesses low to moderate predictive power.

4.5. Summary of Hypotheses

The data collected from the samples were segmented into two phases to assess the proposed research framework. The first phase consisted of gathering demographic data, which was then descriptively analyzed to ensure that the data fit the study’s prerequisites and requirements as specified in the inclusion criteria. The second phase involved using structural equation modeling to examine the hypothesized correlations. Prior to assessing the relationships, the model’s convergent and discriminant validity were assessed, and after the criteria were met, the relationships were evaluated for path coefficients, collinearity statistics (VIF), and moderated relationships with SmartPLS 3. Table 17 presents an overview of the findings.

5. Discussion and Conclusions

5.1. Discussion

This section contains detailed clarifications for all the relationships evaluated in this study. The explanations help address the two research questions, which were tested through eight hypotheses. Out of the eight hypotheses, four were supported. As a result, the following sub-sections comprehensively discuss the hypotheses to clarify the reasons for the study’s findings.

5.1.1. Relationships between Organizational Capabilities, SME Institutional Support, Perceived Advantage, Market Factors, and SMEs’ Readiness for Industry 4.0

The first research questions asked about the relationships between organizational capabilities, institutional support, perceived advantage, market factors and SMEs’ readiness for Industry 4.0. Organizational capabilities, institutional support, perceived advantage, and market factors were hypothesized to impact SMEs’ readiness for Industry 4.0 positively. The present study found that organizational capabilities, SME institutional support, and market factors have positive impacts on SMEs’ readiness for Industry 4.0, whereas perceived advantage was found to have a negative impact on SMEs’ readiness for Industry 4.0. The discussion based on the findings to answer the research question is shown below

5.1.2. The Relationship between Organizational Capabilities and SMEs’ Readiness for Industry 4.0

The present study found that organizational capabilities have a positive impact on SMEs’ readiness for Industry 4.0. This finding contends that SMEs with the organizational capabilities to invest in Industry 4.0 are more prepared to execute digital processes. This is line with the findings of Agostini and Nosella [106], SMEs with stronger internal and external capabilities are more willing to adopt Industry 4.0 technologies. This could be due to firms recognize that new technology frequently makes business processes easier, faster, and less expensive, and thus they determine to keep up with emerging technologies and harness them in creative ways [107]. Likewise, it has also been claimed that the ability to innovate has emerged as one such dynamic capability that distinguishes firms that outperform their competitors [108].
Amid environmental turbulence, such as during an economic downturn, the demand for innovation is regarded to be able to withstand the gales of creative destruction [109]. Malaysia has been locked down for approximately 2 years due to the outbreak of the COVID-19 pandemic, and the country’s economy has been affected heavily, with its economy contracting by 4.5% in the third quarter of 2021 [110]. According to the overall observations of manufacturing firm responses in the survey conducted by UNIDO [111], small-sized firms have been hit the hardest by the COVID-19 crisis. Most of the respondents of the present study were small-sized firms (54.5%), and this could be the reason for their low willingness to adopt Industry 4.0 technologies.
According to a report by SME Corp Malaysia, in 2020, approximately 77 percent of SMEs maintained at the basic digitalization stage, which signifies that they will only have a website, while in 2019, only 53.9 percent of the companies were present on the Internet [112]. The high costs of maintaining cutting-edge technology services discouraged 44 percent of Malaysian SMEs from considering cloud services, and 48 percent of SME owners cited the fact that their employees lacked the technical skills needed to go digital [112]. The MDEC Digital Talent Survey 2021 also revealed that 85 percent of companies surveyed recognize the need to reskill their employees [113]. Nonetheless, Agostini and Nosella [106] claim that firms must invest in advanced manufacturing technology and equipment to fully exploit the advantages of Industry 4.0. At the same time, Bank Negara Malaysia [114] highlights that using digital tools benefits both sales and marketing functions, remote work arrangements and the establishment of new products. Hence, when the owners and managers of SMEs have the ability to transform and they recognize the importance of digital transformation, they are more likely to adopt Industry 4.0.

5.1.3. The Relationship between SME Institutional Support and SMEs’ Readiness for Industry 4.0

The present study found that SME institutional support positively impacts readiness for Industry 4.0. It highlights that SMEs that obtain SME institutional support are more likely to adopt digital transformation. Sáfrányné Gubik and Bartha [115] claimed that technology support enhances firms’ business development and also serves as a tipping point that gives the firms a competitive advantage. It is further delineated by Zhang, Xu [116] that through improved organizational capabilities, institutional support in terms of technology and government support and partnerships has an indirect positive impact on digital transformation, while technology propels the company’s digital strategy and assists top management. Moreover, Pavic, Koh [117] also proposed that SMEs should prioritize their supporting activities such that the firm’s human resources and technological infrastructure will shape the core of e-business planning to use the external and internal resources and opportunities to establish value through integration and intervention. According to Sommer [118], SMEs require more institutional support than larger organizations because they are less skilled at dealing with technological, financial, and staffing challenges. As digital transformation requires high investment and small-sized firms have less resources, they will therefore need financing solutions. In the present study, most of the responding firms are registered with limited legal status (LLP). According to SSM [119], any debts and obligations of the LLP will be borne by the LLP’s assets, not the partners’. Although LLPs have limited liability with respect to debts [120], which is seen as an advantage when seeking financing solutions, it has been reported that 60% of Malaysian SMEs are unaware of any relevant financing methods [112].
On the other hand, industries with great production volumes can take advantage of economies of scale, making them more likely to make greater initial investments to implement Industry 4.0 processes [32]. Lutfi [121] contended that SMEs’ CEOs’ recognition of government support and incentives plays a critical role in meeting enterprises’ IT innovation execution and would lead to their prompt implementation. The Malaysian government has recently initiated the National Economic Recovery Plan (Penjana) as an all-inclusive and holistic approach to the country’s economic recovery with the aim to encourage more SMEs to begin their digital revolution [122]. This institutional support has addressed the monetary issue in the demand for SMEs to go digital, and it has been reported that several SMEs have already taken advantage of the opportunity to begin digitalization as part of their digital transformation journey [112]. Therefore, it can be concluded that when SME firms obtain sufficient institutional support, it enhances the SME owners and managers to implement digital transformation.

5.1.4. The Relationship between Perceived Advantage and SMEs’ Readiness for Industry 4.0

The present study reveals that perceived advantage does not impact readiness for Industry 4.0. This finding showed that Industry 4.0 readiness is not an easy task, and it may take more effort and time to learn and master the required mechanisms of new digital technologies and processes, and thus an organization’s perceived advantages cannot drive its management to get ready for digital adoption. This is supported by Nugroho, Susilo [123], who found that SME firms are unwilling to invest in IT infrastructure because it is difficult to optimize or even use. Furthermore, Stentoft, Jensen [124] argue that some SMEs may overlook some possible benefits from Industry 4.0 technologies due to a primary focus on routine operations. In contrast, others are hesitant to use the technologies because they, in fact, may not introduce more benefits than the costs to introduce and execute the technologies. This finding is supported by those who discovered that implementing Industry 4.0 projects in SMEs is still a cost-driven initiative, and the benefits of business transformation have yet to be demonstrated. Hence, SME managers may be less aware of the opportunities provided by new digital technologies. As a result, scarce strategic vision toward new market opportunities can prevent them from preparing for Industry 4.0 [54]. The respondents who responded to this present study are mainly comprised of top management (45.4%) and middle management (40%). Alieva and Powell [125] discovered that top and middle management involvement were identified as positively influencing factors in the digital transformation process. In Malaysia, only 55% of CEOs recognize the need for digital transformation, and businesses are skeptical of embracing technology to improve their business productivity and growth [126].
On the other hand, more than half of the firms in the present study had been operating for more than 10 years, with 49.1% operating for 11 to 20 years, and 12.7% of them operating for 21 to 30 years. Based on the findings of Kane, Palmer [127], older companies are generally less digitally mature, and employees in older companies are more likely to inhibit digital transformation. Nonetheless, the findings of Bouncken, Ratzmann [128] suggest that, while all firms across the age spectrum can benefit from mutual knowledge creation in their alliances, older firms can minimize their limitations with respect to innovation value creation when they mutually establish knowledge with their partners. Therefore, to elevate the adoption rate of Industry 4.0, the top and middle management of SME manufacturing firms should be more aware of the benefits and take the initiative to change.

5.1.5. The Relationship between Market Factors and SMEs’ Readiness for Industry 4.0

Based on the results, it could be inferred that market factors are the important drivers for starting the transformation towards Industry 4.0, as it was found to positively impact readiness for Industry 4.0. This is in line with Lai, Sun [129] and Gangwar, Date [130], who discovered that competitive pressure drives Industry 4.0 readiness. Additionally, this finding is also consistent with the findings of Nugroho, Susilo [124], who reported that SMEs will prepare for Industry 4.0 if they are aware of the current or new customer demand for Industry 4.0-produced products. Consumers become the trigger system for digital implementation, because satisfaction is important to a business. In certain manufacturing sectors, such as pharmaceuticals and automobiles, Industry 4.0 has become a mandatory requirement for certain products in certain countries [54].
Moreover, according to the Adyen Malaysia Retail Report 2022, customer requirements in technology have become the trend urging companies to undergo digital transformation, while Malaysian companies undergoing digital transformation outperform their industry peers, with a total value of MYR 334 billion [131]. Companies also suggest employing technological solutions to better understand their customers’ needs and subsequently fulfil their requirements [131]. As a result, SMEs must be more customer-focused and proactive in seeking out new customers who require Industry 4.0 products. On the other hand, evolving new market players and competitors threatens established manufacturing companies’ market positions and competitive advantages [132]. Hence, technology has become one of the tools used to support enterprise competitiveness in dealing with consistently changing business dynamics and expanding various developmental methods of doing the work [124].
Additionally, the National Industry 4.0 policy that was launched in 2018 by the Malaysian government prioritized the support for five main sectors in terms of Industry 4.0 technology implementation, namely electronic and electrical, machinery and equipment, chemical, medical devices, and aerospace, while the emergence of new economies with lower cost structures boosted the development of the electronic and electrical sector [25]. The respondents of the present study corresponded to one-third (37.3%) of the mentioned sectors, with electronic and electrical sector accounting for 23.6% alone, and this could explain the situation whereby market factors affect the behavior of Malaysian SME manufacturing firms with respect to adopting digital transformation.

5.1.6. The Moderating Effect of Firm Size

The second research question asked whether firm size moderates the relationship between organizational capabilities, institutional support, perceived advantage, market factors, and SMEs’ readiness for Industry 4.0. Therefore, the relationship hypothesized is whether firm size strengthen the relationship between organizational capabilities, SME institutional support, perceived advantage, market factors, and SMEs’ readiness for Industry 4.0. To add novelty to this study, the element of firm size is incorporated into the research model to investigate its strengthening effect. Having introduced firm size as a moderator in the earlier chapter, some of the findings of the other researchers have shown the significant of firm size in the adoption of digital transformation. However, the findings of this study contradict the previous findings of the other researchers such as Pla-Barber and Alegre [82] and Noori, Nasrabadi [133], while being in line with the study of Lee and Kim [75]. The findings of this study demonstrate firm size not to be a strengthening factor of organizational capabilities, perceived advantage, and market factors. However, the results of this study reveal that firm size does moderate the relationship between institutional support and SMEs’ readiness for Industry 4.0; as such, the positive relationship between institutional support and SMEs’ readiness for Industry 4.0 is stronger when the firm size is larger.
The respondents in the present study were mainly small-sized enterprises (54.5%), followed by medium-sized firms (33.6%), and micro units (11.8%). With respect to the number of employees, the majority group of 59 (53.6%) had fewer than 50 employees, 28 (25.5%) had between 51 and 100 employees, 10 (9.1%) had 101 to 150, and 13 (9.8%) 151 to 200. First and foremost, the results show that firm size does not moderate the direct effect of organizational capabilities on Industry 4.0 readiness. This result is in line with the findings of Agostini and Nosella [107] who reported that firm size was not statistically significant in any research model. Additionally, the research discovered a weak relationship between firm size and willingness to adopt technology. This makes sense, because the size of a firm does not guarantee the availability of appropriate technology and sufficient financial resources for business transformation. This is supported by the research executed by Lin, Lee [134], who reported that firm size does not mandate increased use of advanced manufacturing technology for Industry 4.0, most probably due to industrial and product characteristics, such as high value, high safety and reliability requirements, global sourcing, large batch production, and large scale. Moreover, Michna and Kmieciak [135] also identified that SME firms’ financial performance was positively related to their willingness to implement Industry 4.0, regardless of firm size. Firms with sufficient financial resources may be able to invest in Industry 4.0 and meet the initial investment and administrative costs despite the risk of failure [136].
Inferring from the accepted moderated hypothesis of firm size between SME institutional support and SMEs Industry 4.0 readiness, firm size does affect the firm’s willingness to innovate and grow when they have or have not received institutional support. This is supported by the findings of Motta and Sharma [137], who revealed that SMEs’ access to capital might be hampered by firm size, as small businesses may lack the high-quality projects required to obtain bank credit from financial intermediaries. To improve the entire business operation, business owners should consider the trade-off between the cost of financial capital, its advantages, and the firm size restriction [76].
On the other hand, the results of the present study also show that firm size does not moderate the direct effect of perceived advantages on the Industry 4.0 readiness of manufacturing SMEs. This is in line with Ricci, Battaglia [138] finding that firm size does not significantly impact the perception of Industry 4.0 opportunities and the implementation of Industry 4.0 technologies. A possible reason for this might be that SMEs’ recognition of the advantages of Industry 4.0 adoption depends on their current automation level, which has nothing to do with the firm size. The findings of Müller, Buliga [139] proved that SMEs with high degrees of automation perceive opportunities rather than threats from Industry 4.0, but SMEs involving a high level of human labor are more likely not to expect changes from Industry 4.0 in their business models.
The impact of market factors on SMEs’ readiness for Industry 4.0 has an insignificant direct effect when firm size is taken into account. A possible reason for this finding is that the responsibilities of identifying and meeting customer needs and market demands, in terms of possessing technological skills that are adequate to the products offered, are at the top management level regardless of the firm size [140,141,142].

5.2. Theoretical Contribution

From a theoretical perspective, this study complements the literature encompassing Malaysian manufacturing SMEs’ readiness towards Industry 4.0 and the driving factors that will empower them to embrace digital transformation. More specifically, this study provides relevant information to the body of knowledge to recognize the relationships between independent variables, namely organizational capabilities, institutional support, perceived advantage, and market factors. Furthermore, this study contributes to the body of research already performed in Industry 4.0, especially in the Malaysian context. This study contributes empirical support to the implementation of resource-based view theory in the conceptualization of Industry 4.0 readiness on the basis of four driving factors.
This study contributes to the existing body of knowledge by examining the moderating effect of firm size between the four driving factors and SMEs’ readiness of Industry 4.0. In the existing literature, most studies have evaluated firm size only from the perspective of firm performance; thus, knowledge of the moderating role of firm size on Industry 4.0 implementation is still inadequate. Hence, rigorous validation is necessary to identify the moderating effect of firm size between the driving factors and Industry 4.0 implementation. To fill this research gap, this study elongated the relationship between the driving factors, namely organizational capabilities, SME institutional support, perceived advantage, and market factors and readiness for Industry 4.0, and empirically proved the moderating effect of firm size. The results demonstrated that most of the relationships between the driving factors and readiness of Industry 4.0 were not moderated by firm size.

5.3. Practical Implications

These findings lay a sturdy foundation for understanding the driving factors of Industry 4.0 for SMEs in the execution or diffusion stage. The results can be applied to other geographic or industrial areas for implementation and achievement, such as the service sector.
According to the study’s findings, SMEs must have relevant financial and technological resources for digital revolution. The owners and managers must comprehend the advantage of the digital adoption and make viable decisions to initiate Industry 4.0 implementation. They should set aside sufficient funds to upgrade the current IT infrastructure to make it compatible with this revolution. SME owners and managers must reskill their employees in terms of digital and technology and encourage them to embrace digital transformation.
The relationship of market factors was found to be significant with readiness for Industry 4.0. This shows that the present industrial environment and competitors put pressure on Malaysian SMEs to execute Industry 4.0. Competing in the local SME sector may produce such results. SMEs may also prioritize market pressure when making digital innovation decisions.
Furthermore, institutional support, including financial and technological support from the government or institutions, is critical for technological transformation. Owners and managers must consider obtaining institutional funding to execute Industry 4.0, as the technological evolution is costly.
The relationship between perceived advantage and SMEs’ readiness for Industry 4.0 was found to be insignificant. Lack of Industry 4.0-related knowledge and awareness among the owners and managers may also have contributed to the result. SME owners and managers should focus on this point and plan to ensure that the organization’s performance will be boosted by adopting new Industry 4.0 technologies.
The findings of this study could be useful for policy formulation in various ways. Policymakers could use the empirical findings to streamline institutional support and collaborative platforms, as well as a strategic reference for current development. Globalization and the growth of the information economy have rendered traditional policy ineffective, so new policy interventions for Industry 4.0 should be inventive. Industry 4.0 has sparked a technological revolution, and it is becoming ingrained in the DNA of businesses in order to obtain a competitive advantage. Technology is one of the primary drivers that will drive the future of Malaysia’s SMEs business ecosystem. Malaysian SMEs should take advantage of digital technology and enhanced automation to maintain the country on cutting-edge technological advancements.

5.4. Limitations and Recommendations for Future Studies

Although this study is useful to SMEs and policymakers, it has a sample size limitation due to time constraints during data gathering. A larger sample size may help researchers to obtain a more generalized picture of the situation regarding status and attitude toward Industry 4.0 adoption and readiness. Furthermore, multiple groups with varied readiness levels (ready vs. not ready) could be studied to produce more intriguing results. In terms of future study, it will be critical to investigate what Industry 4.0 means for a company’s business and the entire organization and how it affects present business strategies and business models. Furthermore, other elements that could motivate and encourage SMEs to prepare for digital transformation should be investigated depending on various theories.

5.5. Summary and Conclusions

This study relied on the RBV theory in identifying the driving factors of Malaysian SME manufacturing firms toward Industry 4.0 readiness. The objective of this study was to examine the relationship between organizational capabilities, institutional support, perceived advantage, market factors, and SMEs’ readiness for Industry 4.0, and to assess whether firm size moderated the relationship between organizational capabilities, institutional support, perceived advantage, market factors, and SMEs’ readiness for Industry 4.0.
In this study, organizational capabilities, SME institutional support, perceived advantage, and market factors explained 20.16% of the variance in Industry 4.0 readiness. According to Cohen’s (1992) rule of thumb, variances explained for an endogenous variable with values greater than 26% is regarded as high, while values greater than 13% are seen as medium and values greater than 2% are regarded as small. Therefore, the variance explained in Industry 4.0 readiness by the mentioned independent variables can be regarded as medium and substantial.
Based on the hypotheses tested, organizational capabilities and SME institutional support were found to have a significant positive impact on Industry 4.0 readiness, while perceived advantage and market factors were discovered to possess a significant negative impact on Industry 4.0 readiness. Regarding firm size as a moderator, it can be identified that firm size moderates the relationship between SME institutional support and SME’s readiness for Industry 4.0. Conversely, firm size is determined not to be a strengthening factor of organizational capabilities, perceived advantage, and market factors on SME’s readiness for Industry 4.0.
This study provides theoretical and practical contributions critical to practitioners and policymakers. For policymakers, empirical support is provided in this study for applying the RBV theory in explaining the Industry 4.0 readiness level of Malaysian SME manufacturing firms. For practitioners, the study supplies recommendations that could help to increase the Industry 4.0 readiness level among Malaysian SME manufacturing firms, potentially boosting the organization performance of Malaysian SME manufacturing firms.
Manufacturing SMEs must strive towards a high-tech production model and skilled workforce by embracing Industry 4.0 if Malaysia is to maintain its manufacturing competitiveness in the future. Overall, this research contributes to the body of information showing that readiness for a digital revolution is influenced by some characteristics that both practitioners and policymakers should pay greater attention to. First and foremost, this study highlights that, to begin the road towards Industry 4.0, SMEs have to first prepare by planning for all requirements from three key aspects: managerial, operational, and technological. Secondly, it emphasizes that being ready necessitates a coordinated effort to alter the mindsets of management staff before they can shift the mindsets of the non-managerial staff who will be allocated to handle new workers, machines, equipment, systems, procedure, process, and goods.
In conclusion, SMEs should keep in mind that the benefits of digital transformation may not be apparent immediately, but can be achieved over time. The autonomous or digitalized workplace may be a long way off for some, but it is useful to have a sense of what that vision might look like, and what benefits it might bring. In a nutshell, SMEs must be convinced of the advantages of implementing Industry 4.0, and this study addresses the reasons that may prompt them to prepare for this difficult but profitable shift along the digital wave.

Author Contributions

Conceptualization, A.P.H.W. and D.M.H.K.; methodology, A.P.H.W. and D.M.H.K.; software, A.P.H.W.; validation, A.P.H.W.; formal analysis, A.P.H.W.; investigation, A.P.H.W.; resources, A.P.H.W.; data curation, A.P.H.W.; writing—original draft preparation, A.P.H.W.; writing—review and editing, D.M.H.K.; visualization, A.P.H.W.; supervision, D.M.H.K.; project administration, D.M.H.K. All authors have read and agreed to the published version of the manuscript.

Funding

This research received no external funding.

Institutional Review Board Statement

Not applicable.

Informed Consent Statement

Informed consent was obtained from all subjects involved in the study.

Data Availability Statement

Not applicable.

Conflicts of Interest

The authors declare no conflict of interest.

References

  1. Nagy, J.; Oláh, J.; Erdei, E.; Máté, D.; Popp, J. The role and impact of Industry 4.0 and the internet of things on the business strategy of the value chain—The case of Hungary. Sustainability 2018, 10, 3491. [Google Scholar] [CrossRef] [Green Version]
  2. Ministry of International Trade and Industry. Industry 4WRD: National Policy on Industry 4.0; Ministry of International Trade and Industry: Kuala Lumpur, Malaysia, 2018.
  3. Santos, K.C.P.D.; Loures, E.D.F.R.; Canciglieri Junior, O.; Micosky, A.L. Diagnostic assessment of product lifecycle management based on Industry 4.0 requirements. Production 2022, 32. [Google Scholar] [CrossRef]
  4. Akpan, I.J.; Udoh, E.A.P.; Adebisi, B. Small business awareness and adoption of state-of-the-art technologies in emerging and developing markets, and lessons from the COVID-19 pandemic. J. Small Bus. Entrep. 2022, 34, 123–140. [Google Scholar] [CrossRef]
  5. Bawany, S. Leading the Digital Transformation of Organizations; Expert Insights Series by Business Express Press (BEP) Inc. LLC: New York, NY, USA, 2018. [Google Scholar]
  6. Burke, R.; Mussomeli, A.; Laaper, S.; Hartigan, M.; Sniderman, B. The smart factory: Responsive, adaptive, connected manufacturing. Deloitte Insights 2017, 31, 1–10. [Google Scholar]
  7. Erro-Garcés, A. Industry 4.0: Defining the research agenda. Benchmarking Int. J. 2019, 28, 1858–1882. [Google Scholar] [CrossRef]
  8. Robu, M. The dynamic and importance of SMEs in economy. USV Ann. Econ. Public Adm. 2013, 13, 84–89. [Google Scholar]
  9. OECD. OECD SME and Entrepreneurship Outlook 2019; OECD: Paris, France, 2019. [Google Scholar]
  10. SME Corporation Malaysia. SME Definition; SME Corporation Malaysia: Johor Bahru, Malaysia, 2021.
  11. SME Corporation Malaysia. SME Insights 2019/20; SME Corporation Malaysia: Johor Bahru, Malaysia, 2020.
  12. Kayikci, Y. Sustainability impact of digitization in logistics. Procedia Manuf. 2018, 21, 782–789. [Google Scholar] [CrossRef]
  13. Koch, V.; Kuge, S.; Geissbauer, R.; Schrauf, S. Industry 4.0: Opportunities and Challenges of the Industrial Internet; Strategy & PwC: New York, NY, USA, 2014; pp. 5–50. [Google Scholar]
  14. Waibel, M.W.; Steenkamp, L.P.; Moloko, N.; Oosthuizen, G. Investigating the effects of smart production systems on sustainability elements. Procedia Manuf. 2017, 8, 731–737. [Google Scholar] [CrossRef]
  15. Bosman, L.; Hartman, N.; Sutherland, J. How manufacturing firm characteristics can influence decision making for investing in Industry 4.0 technologies. J. Manuf. Technol. Manag. 2019, 31, 1117–1141. [Google Scholar] [CrossRef]
  16. Singh, M.K.B. Malaysia Records RM164 Billion of Total Approved Investments in 2020 Amid Global Pandemic; Malaysian Investment Development Authority: Kuala Lumpur, Malaysia, 2021.
  17. Geissbauer, R.; Vedso, J.; Schrauf, S. Industry 4.0: Building the Digital Enterprise. 2016. Available online: https://www.pwc.com/gx/en/industries/industries-4.0/landing-page/industry-4.0-building-your-digital-enterprise-april-2016 (accessed on 16 March 2020).
  18. Ministry of International Trade and Industry. National Automotive Policy 2020; Ministry of International Trade and Industry: Kuala Lumpur, Malaysia, 2020.
  19. Wu, Y. The Economics of the East Asia Steel Industries: Production, Consumption and Trade; Routledge: London, UK, 2019. [Google Scholar]
  20. Sima, V.; Gheorghe, I.G.; Subić, J.; Nancu, D. Influences of the industry 4.0 revolution on the human capital development and consumer behavior: A systematic review. Sustainability 2020, 12, 4035. [Google Scholar] [CrossRef]
  21. Kearney, A. Readiness for the Future of Production Report 2018; World Economic Forum: Colony, Switzerland, 2018. [Google Scholar]
  22. Mallinguh, E.; Wasike, C.; Zoltan, Z. Technology acquisition and smes performance, the role of innovation, export and the perception of owner-managers. J. Risk Financ. Manag. 2020, 13, 258. [Google Scholar] [CrossRef]
  23. Yatid, M.M. Why is digital adoption by SMEs not taking off? In New Straits Times; New Straits Times Press (M) Bhd.: Kuala Lumpur, Malaysia, 2019. [Google Scholar]
  24. Tong, A.; Gong, R. The Impact of COVID-19 on SME Digitalisation in Malaysia; The London School of Economics and Political Science: London, UK, 2020. [Google Scholar]
  25. Sharon, A. Preparing Malaysia for Its Digital Future. 2019. Available online: https://opengovasia.com/preparing-malaysia-for-its-digital-future/ (accessed on 16 March 2020).
  26. Giotopoulos, I.; Kontolaimou, A.; Korra, E.; Tsakanikas, A. What drives ICT adoption by SMEs? Evidence from a large-scale survey in Greece. J. Bus. Res. 2017, 81, 60–69. [Google Scholar] [CrossRef]
  27. Horváth, D.; Szabó, R.Z. Driving forces and barriers of Industry 4.0: Do multinational and small and medium-sized companies have equal opportunities? Technol. Forecast. Soc. Chang. 2019, 146, 119–132. [Google Scholar] [CrossRef]
  28. Chen, C.-L.; Lin, Y.-C.; Chen, W.-H.; Chao, C.-F.; Pandia, H. Role of Government to Enhance Digital Transformation in Small Service Business. Sustainability 2021, 13, 1028. [Google Scholar] [CrossRef]
  29. Doh, S.; Kim, B. Government support for SME innovations in the regional industries: The case of government financial support program in South Korea. Res. Policy 2014, 43, 1557–1569. [Google Scholar] [CrossRef]
  30. Lee, S.Y. Drivers for the participation of small and medium-sized suppliers in green supply chain initiatives. Supply Chain. Manag. Int. J. 2008, 13, 185–198. [Google Scholar] [CrossRef]
  31. Ongori, H.; Migiro, S.O. Information and communication technologies adoption in SMEs: Literature review. J. Chin. Entrep. 2010, 2, 93–104. [Google Scholar] [CrossRef]
  32. Deloitte. Industry 4.0: Challenges and Solutions for the Digital Transformation and Use of Exponential Technologies; The Creative Studio: Zurich, Switzerland, 2015. [Google Scholar]
  33. Agrawal, M.; Eloot, K.; Mancini, M.; Patel, A. Industry 4.0: Reimagining Manufacturing Operations after COVID-19; Mckinsey Company: Chicago, IL, USA, 2020. [Google Scholar]
  34. Jacobs, J. The opportunity and threat of Industry 4.0. In The Edge Malaysia; The Edge Communications Sdn. Bhd: Petaling Jaya, Malaysia, 2017. [Google Scholar]
  35. Leonard-Barton, D.; Kraus, W.A. Implementing new technology. Harv. Bus. Rev. 1985, 63, 6. [Google Scholar]
  36. Weiner, B.J.; Amick, H.; Lee, S.-Y.D. Conceptualization and measurement of organizational readiness for change: A review of the literature in health services research and other fields. Med. Care Res. Rev. 2008, 65, 379–436. [Google Scholar] [CrossRef]
  37. Maavak, M.; Ariffin, A.S. Is Malaysia Ready for the Fourth Industrial Revolution? The Automotive Sector as an i4. 0 Springboard. In Analyzing the Impacts of Industry 4.0 in Modern Business Environments; IGI Global: Hershey, PA, USA, 2018; pp. 41–64. [Google Scholar]
  38. Amjad, M.S.; Rafique, M.Z.; Khan, M.A. Leveraging optimized and cleaner production through industry 4.0. Sustain. Prod. Consum. 2021, 26, 859–871. [Google Scholar] [CrossRef]
  39. Xu, L.D.; Xu, E.L.; Li, L. Industry 4.0: State of the art and future trends. Int. J. Prod. Res. 2018, 56, 2941–2962. [Google Scholar] [CrossRef] [Green Version]
  40. Ghobakhloo, M.; Iranmanesh, M. Digital transformation success under Industry 4.0: A strategic guideline for manufacturing SMEs. J. Manuf. Technol. Manag. 2021, 32, 1533–1556. [Google Scholar] [CrossRef]
  41. Lucato, W.C.; Pacchini, A.P.T.; Facchini, F.; Mummolo, G. Model to evaluate the Industry 4.0 readiness degree in Industrial Companies. IFAC-PapersOnLine 2019, 52, 1808–1813. [Google Scholar] [CrossRef]
  42. Holt, D.T.; Armenakis, A.A.; Harris, S.G.; Feild, H.S. Toward a comprehensive definition of readiness for change: A review of research and instrumentation. Res. Organ. Change Dev. 2007, 16, 289–336. [Google Scholar] [CrossRef]
  43. Pirola, F.; Cimini, C.; Pinto, R. Digital readiness assessment of Italian SMEs: A case-study research. J. Manuf. Technol. Manag. 2019, 31, 1045–1083. [Google Scholar] [CrossRef]
  44. Stentoft, J.; Adsbøll Wickstrøm, K.; Philipsen, K.; Haug, A. Drivers and barriers for Industry 4.0 readiness and practice: Empirical evidence from small and medium-sized manufacturers. Prod. Plan. Control 2020, 32, 1–18. [Google Scholar] [CrossRef]
  45. Rajnai, Z.; Kocsis, I. Assessing industry 4.0 readiness of enterprises. In Proceedings of the 2018 IEEE 16th World Symposium on Applied Machine Intelligence and Informatics (SAMI), Kosice and Herlany, Slovakia, 7–10 February 2018; pp. 000225–000230. [Google Scholar]
  46. Harvie, C.; Narjoko, D.; Oum, S. Firm characteristic determinants of SME participation in production networks. ERIA Discuss. Pap. Ser. 2010, 11, 1–52. [Google Scholar]
  47. Tech Wire Asia. 2019 Budget: Is Malaysia Doing Enough to Boost Its Digital Transformation? Tech Wire Asia. 6 November 2018. Available online: https://techwireasia.com/2018/11/2019-budget-is-malaysia-doing-enough-to-boost-its-digital-transformation/ (accessed on 1 August 2022).
  48. Khin, S.; Mui Hung, D.K. Identifying the driving and moderating factors of Malaysian SMEs’ readiness for Industry 4.0. Int. J. Comput. Integr. Manuf. 2022, 35, 761–779. [Google Scholar] [CrossRef]
  49. Barney, J. Firm Resources and Sustained Competitive Advantage. J. Manag. 1991, 17, 99–120. [Google Scholar] [CrossRef]
  50. Lall, S. Reinventing Industrial Strategy: The Role of Government Policy in Building Industrial Competitiveness; QEH: Oxford, UK, 2003. [Google Scholar]
  51. Vaona, A.; Pianta, M. Firm size and innovation in European manufacturing. Small Bus. Econ. 2008, 30, 283–299. [Google Scholar] [CrossRef]
  52. Kim, M.; Lee, S.Y. The effects of government financial support on business innovation in South Korea. Asian J. Technol. Innov. 2011, 19, 67–83. [Google Scholar] [CrossRef]
  53. Oliveira, T.; Thomas, M.; Espadanal, M. Assessing the determinants of cloud computing adoption: An analysis of the manu-facturing and services sectors. Inf. Manag. 2014, 51, 497–510. [Google Scholar] [CrossRef]
  54. Kee, D.M.H.; Khin, S. Strategies for Preparing Manufacturing SMEs for Industry 4.0: A Case of Malaysia; TEST Engineering and Management: Kuala Lumpur, Malaysia, 2020; pp. 8153–8158. [Google Scholar]
  55. Lorenz, M.; Rüßmann, M.; Strack, R.; Lueth, K.L.; Bolle, M. Man and Machine in Industry 4.0: How Will Technology Transform the Industrial Workforce through 2025; The Boston Consulting Group: Boston, MA, USA, 2015; Volume 2. [Google Scholar]
  56. Tortora, A.M.; Maria, A.; Iannone, R.; Pianese, C. A survey study on Industry 4.0 readiness level of Italian small and medium enterprises. Procedia Comput. Sci. 2021, 180, 744–753. [Google Scholar] [CrossRef]
  57. Rüßmann, M.; Lorenz, M.; Gerbert, P.; Waldner, M.; Justus, J.; Engel, P.; Harnisch, M. Industry 4.0: The Future of Productivity and Growth in Manufacturing Industries; Boston Consulting Group: Boston, MA, USA, 2015; Volume 9, pp. 54–89. [Google Scholar]
  58. Bag, S.; Gupta, S.; Kumar, S. Industry 4.0 adoption and 10R advance manufacturing capabilities for sustainable development. Int. J. Prod. Econ. 2021, 231, 107844. [Google Scholar] [CrossRef]
  59. A Vouk, M. Cloud computing–issues, research and implementations. J. Comput. Inf. Technol. 2008, 16, 235–246. [Google Scholar] [CrossRef] [Green Version]
  60. Auramo, J.; Kauremaa, J.; Tanskanen, K. Benefits of IT in supply chain management: An explorative study of progressive companies. Int. J. Phys. Distrib. Logist. Manag. 2005, 35, 82–100. [Google Scholar] [CrossRef] [Green Version]
  61. Awa, H.O.; Ukoha, O.; Emecheta, B.C. Using TOE theoretical framework to study the adoption of ERP solution. Cogent Bus. Manag. 2016, 3, 1196571. [Google Scholar] [CrossRef]
  62. Berry, T.K.; Bizjak, J.M.; Lemmon, M.L.; Naveen, L. Organizational complexity and CEO labor markets: Evidence from diversified firms. J. Corp. Financ. 2006, 12, 797–817. [Google Scholar] [CrossRef]
  63. Stock, G.N.; Greis, N.P.; Fischer, W.A. Firm size and dynamic technological innovation. Technovation 2002, 22, 537–549. [Google Scholar] [CrossRef]
  64. Zona, F.; Zattoni, A.; Minichilli, A. A contingency model of boards of directors and firm innovation: The moderating role of firm size. Br. J. Manag. 2013, 24, 299–315. [Google Scholar] [CrossRef]
  65. Bukola, A.A.; Abosede, A.G.; Adesola, M. Customer Relationship Management and Small and Medium Enterprises Performance: Pragmatic Evidence from Oyo State, Nigeria. Asian J. Educ. Soc. Stud. 2019, 5, 1–9. [Google Scholar] [CrossRef]
  66. Kangu, M.A. The Role of Customer Relationship Management Dimensions on Customer Loyalty in the Hotel Industry in Kenya Maureen Adhiambo; COHRED, JKUAT: Juja, Kenya, 2017. [Google Scholar]
  67. Alhammadi, A.; Stanier, C.; Eardley, A. The determinants of cloud computing adoption in Saudi Arabia. In Proceedings of the 2nd International Conference on Computer Science and Engineering, Dubai, United Arab Emirates, 28–29 August 2015. [Google Scholar]
  68. Alshamaila, Y.; Papagiannidis, S.; Li, F. Cloud computing adoption by SMEs in the north east of England: A multi-perspective framework. J. Enterp. Inf. Manag. 2013, 26, 250–275. [Google Scholar] [CrossRef] [Green Version]
  69. Alam, S.S.; Noor, M.K.M. ICT adoption in small and medium enterprises: An empirical evidence of service sectors in Malaysia. Int. J. Bus. Manag. 2009, 4, 112–125. [Google Scholar] [CrossRef] [Green Version]
  70. Hansen, J.A. Innovation, firm size, and firm age. Small Bus. Econ. 1992, 4, 37–44. [Google Scholar]
  71. Audretsch, D.B.; Vivarelli, M. Firms size and R&D spillovers: Evidence from Italy. Small Bus. Econ. 1996, 8, 249–258. [Google Scholar]
  72. Christensen, C.M. The Innovator’s Dilemma: When New Technologies Cause Great Firms to Fail; Harvard Business Review Press: Boston, MA, USA, 2013. [Google Scholar]
  73. Miller, D.; Toulouse, J.-M. Chief executive personality and corporate strategy and structure in small firms. Manag. Sci. 1986, 32, 1389–1409. [Google Scholar] [CrossRef]
  74. Iturrioz, C.; Aragón, C.; Narvaiza, L. How to foster shared innovation within SMEs’ networks: Social capital and the role of intermediaries. Eur. Manag. J. 2015, 33, 104–115. [Google Scholar] [CrossRef]
  75. Lee, J.-I.; Kim, C.-J. The econometric evaluation of the impact of R&D incentive on technological outcomes. J. Korea Technol. Innov. Soc. 2007, 10, 1–21. [Google Scholar]
  76. Kijkasiwat, P.; Phuensane, P. Innovation and firm performance: The moderating and mediating roles of firm size and small and medium enterprise finance. J. Risk Financ. Manag. 2020, 13, 97. [Google Scholar] [CrossRef]
  77. Benfratello, L.; Schiantarelli, F.; Sembenelli, A. Banks and innovation: Microeconometric evidence on Italian firms. J. Financ. Econ. 2008, 90, 197–217. [Google Scholar] [CrossRef] [Green Version]
  78. International Finance Corporation; W.B. Group. Doing Business 2010: Reforming through Difficult Times—Comparing Regulation in 183 Economies; The World Bank: Washington, DC, USA, 2009. [Google Scholar]
  79. Menkhoff, L.; Neuberger, D.; Rungruxsirivorn, O. Collateral and its substitutes in emerging markets’ lending. J. Bank. Financ. 2012, 36, 817–834. [Google Scholar] [CrossRef] [Green Version]
  80. North, D.; Smallbone, D.; Vickers, I. Public sector support for innovating SMEs. Small Bus. Econ. 2001, 16, 303–317. [Google Scholar] [CrossRef]
  81. Rogers, M. Networks, firm size and innovation. Small Bus. Econ. 2004, 22, 141–153. [Google Scholar] [CrossRef]
  82. Pla-Barber, J.; Alegre, J. Analysing the link between export intensity, innovation and firm size in a science-based industry. Int. Bus. Rev. 2007, 16, 275–293. [Google Scholar] [CrossRef]
  83. Cohen, W.M.; Klepper, S. The tradeoff between firm size and diversity in the pursuit of technological progress. Small Bus. Econ. 1992, 4, 1–14. [Google Scholar]
  84. Lobonţiu, G.; Lobonţiu, M. The owner-manager and the functional management of a small firm. Procedia-Soc. Behav. Sci. 2014, 124, 552–561. [Google Scholar]
  85. Van Gils, A. Management and governance in Dutch SMEs. Eur. Manag. J. 2005, 23, 583–589. [Google Scholar] [CrossRef]
  86. Burgelman, R.A. A model of the interaction of strategic behavior, corporate context, and the concept of strategy. Acad. Manag. Rev. 1983, 8, 61–70. [Google Scholar] [CrossRef]
  87. Sekaran, U.; Bougie, R. Research Methods for Business: A Skill Building Approach; John Wiley & Sons: Hoboken, NJ, USA, 2019. [Google Scholar]
  88. Green, S.B. How many subjects does it take to do a regression analysis. Multivar. Behav. Res. 1991, 26, 499–510. [Google Scholar] [CrossRef]
  89. Podsakoff, P.M.; MacKenzie, S.B.; Lee, J.; Podsakoff, N.P. Common method biases in behavioral research: A critical review of the literature and recommended remedies. J. Appl. Psychol. 2003, 88, 879. [Google Scholar] [CrossRef]
  90. Hair, J.F.; Ringle, C.M.; Sarstedt, M. PLS-SEM: Indeed a silver bullet. J. Mark. Theory Pract. 2011, 19, 139–152. [Google Scholar] [CrossRef]
  91. Ringle, C.M.; Wende, S.; Becker, J.M. Smart PLS 3. 2015. Available online: https://www.smartpls.com/ (accessed on 1 August 2022).
  92. Hair, J.F.; Hult, G.T.M.; Ringle, C.M.; Sarstedt, M. A Primer on Partial Least Squares Structural Equation Modeling; Sage: Southern Oaks, CA, USA, 2014. [Google Scholar]
  93. Chin, W.W. How to write up and report PLS analyses. In Handbook of Partial Least Squares; Springer: Berlin/Heidelberg, Germany, 2010; pp. 655–690. [Google Scholar]
  94. Hair, J.; Black, W.; Babin, B.; Anderson, R. Multivariate Data Analysis: A Global Perspective; Pearson: Upper Saddle River, NJ, USA, 2010. [Google Scholar]
  95. Hair, J.F.; Risher, J.J.; Sarstedt, M.; Ringle, C.M. When to use and how to report the results of PLS-SEM. Eur. Bus. Rev. 2019, 31, 2–24. [Google Scholar] [CrossRef]
  96. Ramayah, T.; Cheah, J.; Chuah, F.; Ting, H.; Memon, M.A. Partial least squares structural equation modeling (PLS-SEM) using smartPLS 3.0. In An Updated Guide and Practical Guide to Statistical Analysis; Pearson: Kuala Lumpur, Malaysia, 2018. [Google Scholar]
  97. Sarstedt, M. How to specify, estimate, and validate higher-order constructs in PLS-SEM. Australas. Mark. J. (AMJ) 2019, 27, 197–211. [Google Scholar] [CrossRef]
  98. Hahn, E.D.; Ang, S.H. From the editors: New directions in the reporting of statistical results in the Journal of World Business. J. World Bus. 2017, 52, 125–126. [Google Scholar] [CrossRef]
  99. Hair, J.F.; Sarstedt, M.; Ringle, C.M. Rethinking some of the rethinking of partial least squares. Eur. J. Mark. 2019, 53, 566–584. [Google Scholar] [CrossRef]
  100. Hair, J.F., Jr.; Hult, G.T.M.; Ringle, C.M.; Sarstedt, M. A Primer on Partial Least Squares Structural Equation Modeling (PLS-SEM); SAGE Publications: New York, NY, USA, 2021. [Google Scholar]
  101. Matthews, L.; Hair, J.; Matthews, R. PLS-SEM: The Holy Grail for Advanced Analysis. Mark. Manag. J. 2018, 28, 1–13. [Google Scholar]
  102. Sheko, A.; Braimllari, A. Information technology inhibitors and information quality in supply chain management: A PLS-SEM analysis. Acad. J. Interdiscip. Stud. 2018, 7, 125. [Google Scholar] [CrossRef]
  103. Henseler, J.; Hubona, G.; Ray, P.A. Using PLS path modeling in new technology research: Updated guidelines. Ind. Manag. Data Syst. 2016, 116, 2–20. [Google Scholar] [CrossRef]
  104. Shmueli, G.; Ray, S.; Estrada, J.M.V.; Chatla, S.B. The elephant in the room: Predictive performance of PLS models. J. Bus. Res. 2016, 69, 4552–4564. [Google Scholar] [CrossRef]
  105. Shmueli, G.; Sarstedt, M.; Hair, J.F.; Cheah, J.-H.; Ting, H.; Vaithilingam, S.; Ringle, C.M. Predictive model assessment in PLS-SEM: Guidelines for using PLSpredict. Eur. J. Mark. 2019, 53, 2322–2347. [Google Scholar] [CrossRef]
  106. Agostini, L.; Nosella, A. The adoption of Industry 4.0 technologies in SMEs: Results of an international study. Manag. Decis. 2019, 58, 625–643. [Google Scholar] [CrossRef]
  107. Priyono, A.; Moin, A.; Putri, V.N.A.O. Identifying digital transformation paths in the business model of SMEs during the COVID-19 pandemic. J. Open Innov. Technol. Mark. Complex. 2020, 6, 104. [Google Scholar] [CrossRef]
  108. Naidoo, V. Firm survival through a crisis: The influence of market orientation, marketing innovation and business strategy. Ind. Mark. Manag. 2010, 39, 1311–1320. [Google Scholar] [CrossRef]
  109. Danneels, E. The dynamics of product innovation and firm competences. Strateg. Manag. J. 2002, 23, 1095–1121. [Google Scholar] [CrossRef]
  110. Department of Statistics Malaysia. Pocket Stats Q3 2021; Department of Statistics Malaysia: Putrajaya, Malaysia, 2021.
  111. UNIDO. Impact Assessment of COVID-19 On Malaysia’s Manufacturing Firms; United Nations Industrial Development Organization: Vienna, Austria, 2020. [Google Scholar]
  112. The Star. An Affordable, Successful Digital Transformation is Possible. In The Star; Star Media Group Berhad: Petaling Jaya, Malaysia, 2022. [Google Scholar]
  113. Yap, S. 85 Percent of Malaysian Companies See the Need to Equip Their Employees with Digital Skills; Malaysia Digital Economy Corporation (MDEC) Sdn Bhd: Kuala Lumpur, Malaysia, 2021. [Google Scholar]
  114. Bank Negara Malaysia. Economic and Financial Developments in Malaysia in the 4th Quarter of 2020; Bank Negara Malaysia: Kuala Lumpur, Malaysia, 2021.
  115. Sáfrányné Gubik, A.; Bartha, Z. The Effect of Business Knowledge on the Internationalisation of Small and Medium Sized Enterprises. Zesz. Nauk. Wyższej Szkoły Bank. W Pozn. 2017, 75, 33–52. [Google Scholar]
  116. Zhang, X.; Xu, Y.; Ma, L. Research on Successful Factors and Influencing Mechanism of the Digital Transformation in SMEs. Sustainability 2022, 14, 2549. [Google Scholar] [CrossRef]
  117. Pavic, S.; Koh, S.; Simpson, M.; Padmore, J. Could e-business create a competitive advantage in UK SMEs? Benchmarking Int. J. 2007, 14, 320–351. [Google Scholar] [CrossRef]
  118. Sommer, L. Industrial revolution-industry 4.0: Are German manufacturing SMEs the first victims of this revolution? J. Ind. Eng. Manag. 2015, 8, 1512–1532. [Google Scholar] [CrossRef] [Green Version]
  119. SSM. Starting a Limited Liability Partership (LLP). 2022. Available online: https://www.ssm.com.my/Pages/Register_Business_Company_LLP/LLP/Starting-a-Limited-Liability-Partnership-(LLP).aspx (accessed on 21 May 2022).
  120. Herefordshire & Worcestershire Chamber of Commerce. Legal Status of Your Business. 2021. Available online: https://hwchamber.co.uk/support/advice/starting-a-business/business-legal-status/ (accessed on 21 January 2022).
  121. Lutfi, A. Investigating the moderating effect of Environment Uncertainty on the relationship between institutional factors and ERP adoption among Jordanian SMEs. J. Open Innov. Technol. Mark. Complex. 2020, 6, 91. [Google Scholar] [CrossRef]
  122. Prime Minister’s Office of Malaysia. PENJANA Initiatives. 2022. Available online: https://www.pmo.gov.my/penjana-initiatives/ (accessed on 21 May 2022).
  123. Nugroho, M.A.; Susilo, A.Z.; Fajar, M.A.; Rahmawati, D. Exploratory study of SMEs technology adoption readiness factors. Procedia Comput. Sci. 2017, 124, 329–336. [Google Scholar] [CrossRef]
  124. Stentoft, J.; Jensen, K.W.; Philipsen, K.; Haug, A. Drivers and barriers for Industry 4.0 readiness and practice: A SME perspective with empirical evidence. In Proceedings of the 52nd Hawaii International Conference on System Sciences, Maui, HI, USA, 8–11 January 2019. [Google Scholar]
  125. Alieva, J.; Powell, D.J. The significance of employee behaviours and soft management practices to avoid digital waste during a digital transformation. Int. J. Lean Six Sigma, 2022; ahead-of-print. [Google Scholar] [CrossRef]
  126. Yapp, E. Malaysia’s Digital Transformation Efforts Progress; TechTarget: Newton, MA, USA, 2020. [Google Scholar]
  127. Kane, G.C.; Palmer, D.; Phillips, A.-N.; Kiron, D.; Buckley, N. Coming of age digitally. MIT Sloan Manag. Rev. Deloitte Insights 2018, 59, 1–10. [Google Scholar]
  128. Bouncken, R.B.; Ratzmann, M.; Kraus, S. Anti-aging: How innovation is shaped by firm age and mutual knowledge creation in an alliance. J. Bus. Res. 2021, 137, 422–429. [Google Scholar] [CrossRef]
  129. Lai, Y.; Sun, H.; Ren, J. Understanding the determinants of big data analytics (BDA) adoption in logistics and supply chain management: An empirical investigation. Int. J. Logist. Manag. 2018, 29, 676–703. [Google Scholar] [CrossRef]
  130. Gangwar, H.; Date, H.; Ramaswamy, R. Understanding determinants of cloud computing adoption using an integrated TAM-TOE model. J. Enterp. Inf. Manag. 2015, 28, 107–130. [Google Scholar] [CrossRef]
  131. Devanesan, J. Digital Transforming Malaysian Businesses to Deliver on Consumer Expectations. 2 June 2022. Available online: https://techwireasia.com/2022/06/digital-transformation-is-malaysian-businesses-to-deliver-on-consumer-expectations/ (accessed on 3 June 2022).
  132. Kiel, D.; Müller, J.M.; Arnold, C.; Voigt, K.-I. Sustainable industrial value creation: Benefits and challenges of industry 4.0. In Digital Disruptive Innovation; World Scientific: Singapore, 2020; pp. 231–270. [Google Scholar]
  133. Noori, J.; Nasrabadi, M.B.; Yazdi, N.; Babakhan, A.R. Innovative performance of Iranian knowledge-based firms: Large firms or SMEs? Technol. Forecast. Soc. Chang. 2017, 122, 179–185. [Google Scholar] [CrossRef]
  134. Lin, D.; Lee, C.K.; Lau, H.; Yang, Y. Strategic response to Industry 4.0: An empirical investigation on the Chinese automotive industry. Ind. Manag. Data Syst. 2018, 118, 589–605. [Google Scholar] [CrossRef] [Green Version]
  135. Michna, A.; Kmieciak, R. Open-mindedness culture, knowledge-sharing, financial performance, and industry 4.0 in SMEs. Sustainability 2020, 12, 9041. [Google Scholar] [CrossRef]
  136. Hamada, T. Determinants of decision-makers’ attitudes toward Industry 4.0 adaptation. Soc. Sci. 2019, 8, 140. [Google Scholar] [CrossRef] [Green Version]
  137. Motta, V.; Sharma, A. Lending technologies and access to finance for SMEs in the hospitality industry. Int. J. Hosp. Manag. 2020, 86, 102371. [Google Scholar] [CrossRef]
  138. Ricci, R.; Battaglia, D.; Neirotti, P. External knowledge search, opportunity recognition and industry 4.0 adoption in SMEs. Int. J. Prod. Econ. 2021, 240, 108234. [Google Scholar] [CrossRef]
  139. Müller, J.M.; Buliga, O.; Voigt, K.-I. Fortune favors the prepared: How SMEs approach business model innovations in Industry 4.0. Technol. Forecast. Soc. Chang. 2018, 132, 2–17. [Google Scholar] [CrossRef]
  140. Deming, W.E. Out of Crisis Boston; Massachusetts Institute of Technology Center for Advanced Engineering Education Study: Bosyon, MA, USA, 1986. [Google Scholar]
  141. Flynn, B.B.; Schroeder, R.G.; Sakakibara, S. The impact of quality management practices on performance and competitive advantage. Decis. Sci. 1995, 26, 659–691. [Google Scholar] [CrossRef]
  142. Ou, C.S.; Liu, F.C.; Hung, Y.C.; Yen, D.C. A structural model of supply chain management on firm performance. Int. J. Oper. Prod. Manag. 2010, 30, 526–545. [Google Scholar] [CrossRef]
Figure 1. Theoretical framework.
Information 13 00552 g001
Figure 2. Bootstrapped model.
Information 13 00552 g002
Figure 3. R2 Adjusted Value.
Information 13 00552 g003
Table 1. Summary of measures used in the study.
VariablesItemsReliabilitySource
Readiness for Industry 4.0 [54]
Managerial Readiness80.88
Operational Readiness80.86
Technological Readiness70.79
Organizational Capabilities
Financial Capability60.94
Technological Capability50.96
Institutional Support
Financial Support50.85
Technological Support50.91
Perceived Advantages
Perceived Benefits80.96
Perceived Opportunities70.94
Market Factors
Customer Needs50.92
Competitive Pressure50.75
Total number of items69
Table 2. Measurement items for managerial readiness, operational readiness, and technological readiness.
1Our management is convinced that we should consider the Industry 4.0 production process.
2Our management has the plan to digitalize the production process.
3Our management is mentally prepared to adopt Industry 4.0.
4We have the left leadership in place to implement digitalized production.
5Digital transformation is our corporate priority.
6Our management does not commit to upgrading the production process (R).
7Our management has approved a budget for upgrading production processes.
8Our management has been recruiting new staff necessary for upgrading the production process.
9Our company is financially prepared to digitalize operations to Industry 4.0 standards.
10Our staffs are cooperative in upgrading production processes.
11We are mentally prepared for changes in our production.
12We have staff to manage the Industry 4.0 process.
13Our production processes can be digitalized to Industry 4.0.
14Our production floor is prepared for digitalized production.
15We have the infrastructure to support the Industry 4.0 production process.
16We have the resources to start the digital transformation.
17We have an IT system that could be upgraded for Industry 4.0 production process.
18Our key machines could be networked for Industry 4.0 process.
19Our staffs are capable of learning new digital skills.
20Our staffs have sound knowledge of technical requirements for Industry 4.0.
21Training has been provided to our staff to understand digital technologies.
22Our staffs have no technical knowledge about digital transformation (R).
23We have vendors who can provide good service for the technical aspect of digital transformation.
Adopted from Khin and Kee [54].
Table 3. Measurement items for financial capability and technological capability.
1Information technology
2Production machinery
3Process innovation
4Digital technology
5Operational resources
6Acquiring important technology-related information
7Identifying new technological opportunities
8Responding to current technological trends
9Learning advanced technologies
10Upgrading production technologies
Adopted from Khin and Kee [54].
Table 4. Measurement items for financial support and technological support.
1We are aware of Industry 4.0-related financial incentives from agencies.
2We have access to funding for Industry 4.0 provided by agencies.
3We know where to apply for funding for Industry 4.0 from authorities.
4We have applied for funding for Industry 4.0.
5We have received funding for Industry 4.0.
6We have attended training for Industry 4.0 technology provided by external agencies.
7We have received technical advice from agencies regarding Industry 4.0
8We have access to Industry 4.0-related programs
9Governmental agencies have been supportive in providing technological assistance for Industry 4.0.
10We have access to Industry 4.0-related services from agencies.
Adopted from Khin and Kee [54].
Table 5. Measurement items for perceived benefits and perceived opportunities. Adopting Industry 4.0 may result in ….
1production efficiency.
2cost-saving.
3less defect.
4less labor dependency.
5enhanced productivity.
6enhanced quality.
7enhanced speed.
8better access to production data.
9more market for products with better quality and margin.
10new export markets.
11more customers and buyers.
12more sales.
13more market shares.
14new products with better quality.
15a better image of our company.
Adopted from Khin and Kee [54].
Table 6. Measurement items for customer needs and competitive pressure.
1Our customers are looking for products of Industry 4.0 quality.
2Our customers are looking for suppliers who use the Industry 4.0 manufacturing process.
3Our customers requested that we use Industry 4.0 manufacturing process for the products they buy from us.
4We risk losing our customers if we do not adopt Industry 4.0.
5Potential customers in new markets need Industry 4.0 products.
6Competition is high in our industry.
7Our competitors are ahead of us in adopting Industry 4.0.
8Our competitors may attract our existing customers if they could supply products with Industry 4.0 standards.
9Our customers might switch to competitors if we cannot reduce costs and improve quality.
10We are in urgent need for adopting the Industry 4.0 process to keep our customers away from competitors.
Adopted from Khin and Kee [54].
Table 7. Respondent’s background information and company profiles.
DemographicsFrequencyPercentage
Firm Size
Medium3733.6
Small6054.5
Micro1311.8
Number of employees
1 to 505953.6
51 to 1002825.5
101 to 150109.1
151 to 2001311.8
Legal status of the firm
Limited7568.2
Partnership1110.0
Sole proprietorship1614.5
Public Listed10.9
Others76.4
Firm age
1 to 10 years3531.8
11 to 20 years5449.1
21 to 30 years1412.7
Firm’s sector
Automobile65.5
Chemical & Adhesives87.3
Electronic & Electrical2623.6
Food & Beverage1110.0
Furniture, Carpets & Wood32.7
Iron, Steel & Metal1816.4
Paper, Packaging & Printing76.4
Pharmaceutical, Medical Equipment, Cosmetics & Toiletries76.4
Plastic65.5
Textile10.9
Others 1715.5
Location of the firm
Johor54.5
Kedah54.5
Kuala Lumpur76.4
Melaka10.9
Pahang10.9
Penang2421.8
Perak2926.4
Perlis10.9
Selangor3733.6
Respondents’ managerial position
Business Owner87.3
Business Partner54.5
Chief Executive Officer76.4
General Manager1614.5
Managing Director1412.7
Operation Director2119.1
Operation Manager1412.7
Production Manager98.2
Others98.2
Respondents’ educational qualifications
Degree4843.6
Masters2119.1
Diploma2018.2
SPM76.4
Table 8. Mean and standard deviation of variables.
VariablesMeanModeStd.
Deviation
Min.Max.
Readiness for Industry 4.0
Managerial Readiness27.27324.0006.68510.00040.000
Operational Readiness22.69118.0006.6118.00037.000
Technological Readiness20.88226.0005.7617.00035.000
Organizational Capabilities
Financial Capability18.95518.0005.9036.00030.000
Technology Capability17.03615.0005.0435.00025.000
SME Institutional Support
Financial Support12.71815.0004.8505.00025.000
Technological Support14.21819.0005.0495.00025.000
Perceived Advantage
Perceived Benefits25.58228.0005.9488.00045.000
Perceived Opportunities21.05517.0006.6239.00035.000
Market Factors
Customer Needs14.59115.0005.1255.00024.000
Competitive Pressure16.36420.0003.9995.00025.000
Firm Size2.2182.0000.64081.0003.000
Table 9. Measurement model for first-order constructs.
First-Order ConstructsItemLoadingsAVECR
Financial CapabilityFC10.8420.7760.942
FC20.817
FC30.929
FC40.903
FC50.917
FC60.870
Technology CapabilityTC10.9370.8780.965
TC20.961
TC30.946
TC40.937
TC50.904
Financial SupportFS10.8670.6300.847
FS20.909
FS30.902
FS40.650
FS50.580
Technological SupportTS10.7310.7470.914
TS20.908
TS30.919
TS40.844
TS50.905
Perceived BenefitsPB20.5710.4110.640
PB40.661
PB60.523
PB70.758
PB80.666
Perceived OpportunitiesPO10.7070.6330.883
PO20.794
PO30.842
PO40.774
PO50.842
PO60.806
Customer NeedsCN10.8570.7750.927
CN20.901
CN30.860
CN40.883
CN50.900
Competitive PressureCP20.7870.6470.813
CP30.891
CP40.632
CP50.880
Managerial ReadinessMR10.8490.7100.931
MR20.861
MR30.874
MR40.854
MR50.860
MR70.820
MR80.775
Operational ReadinessOR10.8430.7010.928
OR20.866
OR30.766
OR40.879
OR50.822
OR60.786
OR70.892
Technological ReadinessTR10.7810.5880.859
TR20.727
TR30.771
TR40.830
TR50.810
TR70.673
Firm SizeS1.0001.0001.000
Table 10. Measurement model for the second-order constructs.
Second-Order ConstructsItemLoadingsAVECR
Organizational CapabilitiesFinancial Capability0.8590.7550.676
Technology Capability0.878
SME Institutional SupportFinancial Support0.8750.8210.901
Technological Support0.936
Perceived AdvantagePerceived Opportunities1.0001.0001.000
Market FactorsCustomer Needs0.9260.8620.841
Competitive Pressure0.931
Firm SizeFirm Size1.0001.0001.000
Readiness for Industry 4.0Managerial Readiness0.9090.8210.786
Operational Readiness0.904
Technological Readiness0.939
Table 11. Discriminant validity using the Fornell and Larcker criterion.
SMFOCPARSIS
S1.000
MF0.1260.929
OC0.1620.5830.869
PA0.1060.2530.3031.000
R0.2990.6750.7310.1400.918
SIS0.1410.6010.5800.1550.7110.906
Note: OC = organizational capabilities, SIS = SME institutional support, PA = perceived advantage, MF = market factors, S = firm size, R = readiness for Industry 4.0.
Table 12. Skewness and kurtosis values for the study variables.
VariablesSkewnessKurtosis
StatisticStd ErrorStatisticStd Error
Organizational Capabilities−0.5220.2300.4830.457
SME Institutional Support0.0210.230−0.2020.457
Perceived Advantage0.3540.230−0.2120.457
Market Factors−0.2110.230−0.6940.457
Readiness for Industry 4.0−0.3280.2300.1570.457
Firm Size−0.2290.230−0.6370.457
Table 13. Assessment of the structural model.
HRelationshipsStandardized BetaStandard Errorst-Valuep-Valuef2VIF
H1OC -> R0.3860.0814.7870.0000.3041.878
H2SIS -> R0.3410.0744.5780.0000.2361.886
H3PA -> R−0.0210.0880.2400.4050.0011.432
H4MF -> R0.2200.0972.2630.0120.0981.887
S -> R0.1910.0662.8970.0020.1121.252
H5OC*S -> R−0.0400.1150.3530.3620.0023.496
H6SIS*S -> R0.1350.0801.6860.0460.0401.987
H7PA*S -> R0.1260.0851.4810.0690.0421.712
H8MF*S -> R−0.1090.1140.9530.1700.0143.718
Note: OC = organizational capabilities, SIS = SME institutional support, PA = perceived advantage, MF = market factors, S = firm size, R = readiness for Industry 4.0
Table 14. Outcome of the tested interactions.
HypothesisRelationshipStandardized BetaStandard Errort-ValueSupported
H5OC*S -> R−0.0400.1100.367No
H6SIS*S -> R0.1350.0801.699Yes
H7PA*S -> R0.1260.0851.487No
H8MF*S -> R−0.1090.1120.976No
Note: OC = organizational capabilities, SIS = SME institutional support, PA = perceived advantage, MF = market factors, S = firm size, R = readiness for Industry 4.0.
Table 15. Predictive relevance Q2.
ConstructQ2 Value
Readiness for Industry 4.00.596
Table 16. PLS predictive power.
ItemPLS MYR SELM MYR SEPLS-LMQ2_Predict
Managerial Readiness 4.4504.986−0.5360.559
Operational Readiness 4.3794.0480.3310.563
Technological Readiness 3.6833.790−0.1070.593
Table 17. Summary of results for hypotheses.
NoHypothesisResults
H1Organizational capabilities positively impact SMEs’ readiness for Industry 4.0.Supported
H2SME institutional support positively impacts SMEs’ readiness for Industry 4.0.Supported
H3Perceived advantage of Industry 4.0 positively impacts SMEs’ readiness for Industry 4.0.Not supported
H4Market factors for Industry 4.0 positively impact SMEs’ readiness for Industry 4.0.Supported
H5Firm size moderates the relationship between organizational capabilities and SMEs’ readiness for Industry 4.0; as such, the positive relationship between organizational capabilities and SMEs’ readiness for Industry 4.0 is stronger when the firm size becomes larger.Not supported
H6Firm size moderates the relationship between institutional support and SMEs’ readiness for Industry 4.0; as such, the positive relationship between institutional support and SMEs’ readiness for Industry 4.0 is stronger when the firm size becomes larger.Supported
H7Firm size moderates the relationship between perceived advantage and SMEs’ readiness for Industry 4.0; as such, the positive relationship between perceived advantage and SMEs’ readiness for Industry 4.0 is stronger when the firm size becomes larger.Not supported
H8Firm size moderates the relationship between market factors and SMEs’ readiness for Industry 4.0; as such, the positive relationship between market factors and SMEs’ readiness for Industry 4.0 is stronger when the firm size becomes larger.Not supported
Publisher’s Note: MDPI stays neutral with regard to jurisdictional claims in published maps and institutional affiliations.

