
A Text Mining Approach in the Classification of Free-Text Cancer Pathology Reports from the South African National Health Laboratory Services

 , , ,
, , ,
Abstract
:1. Introduction
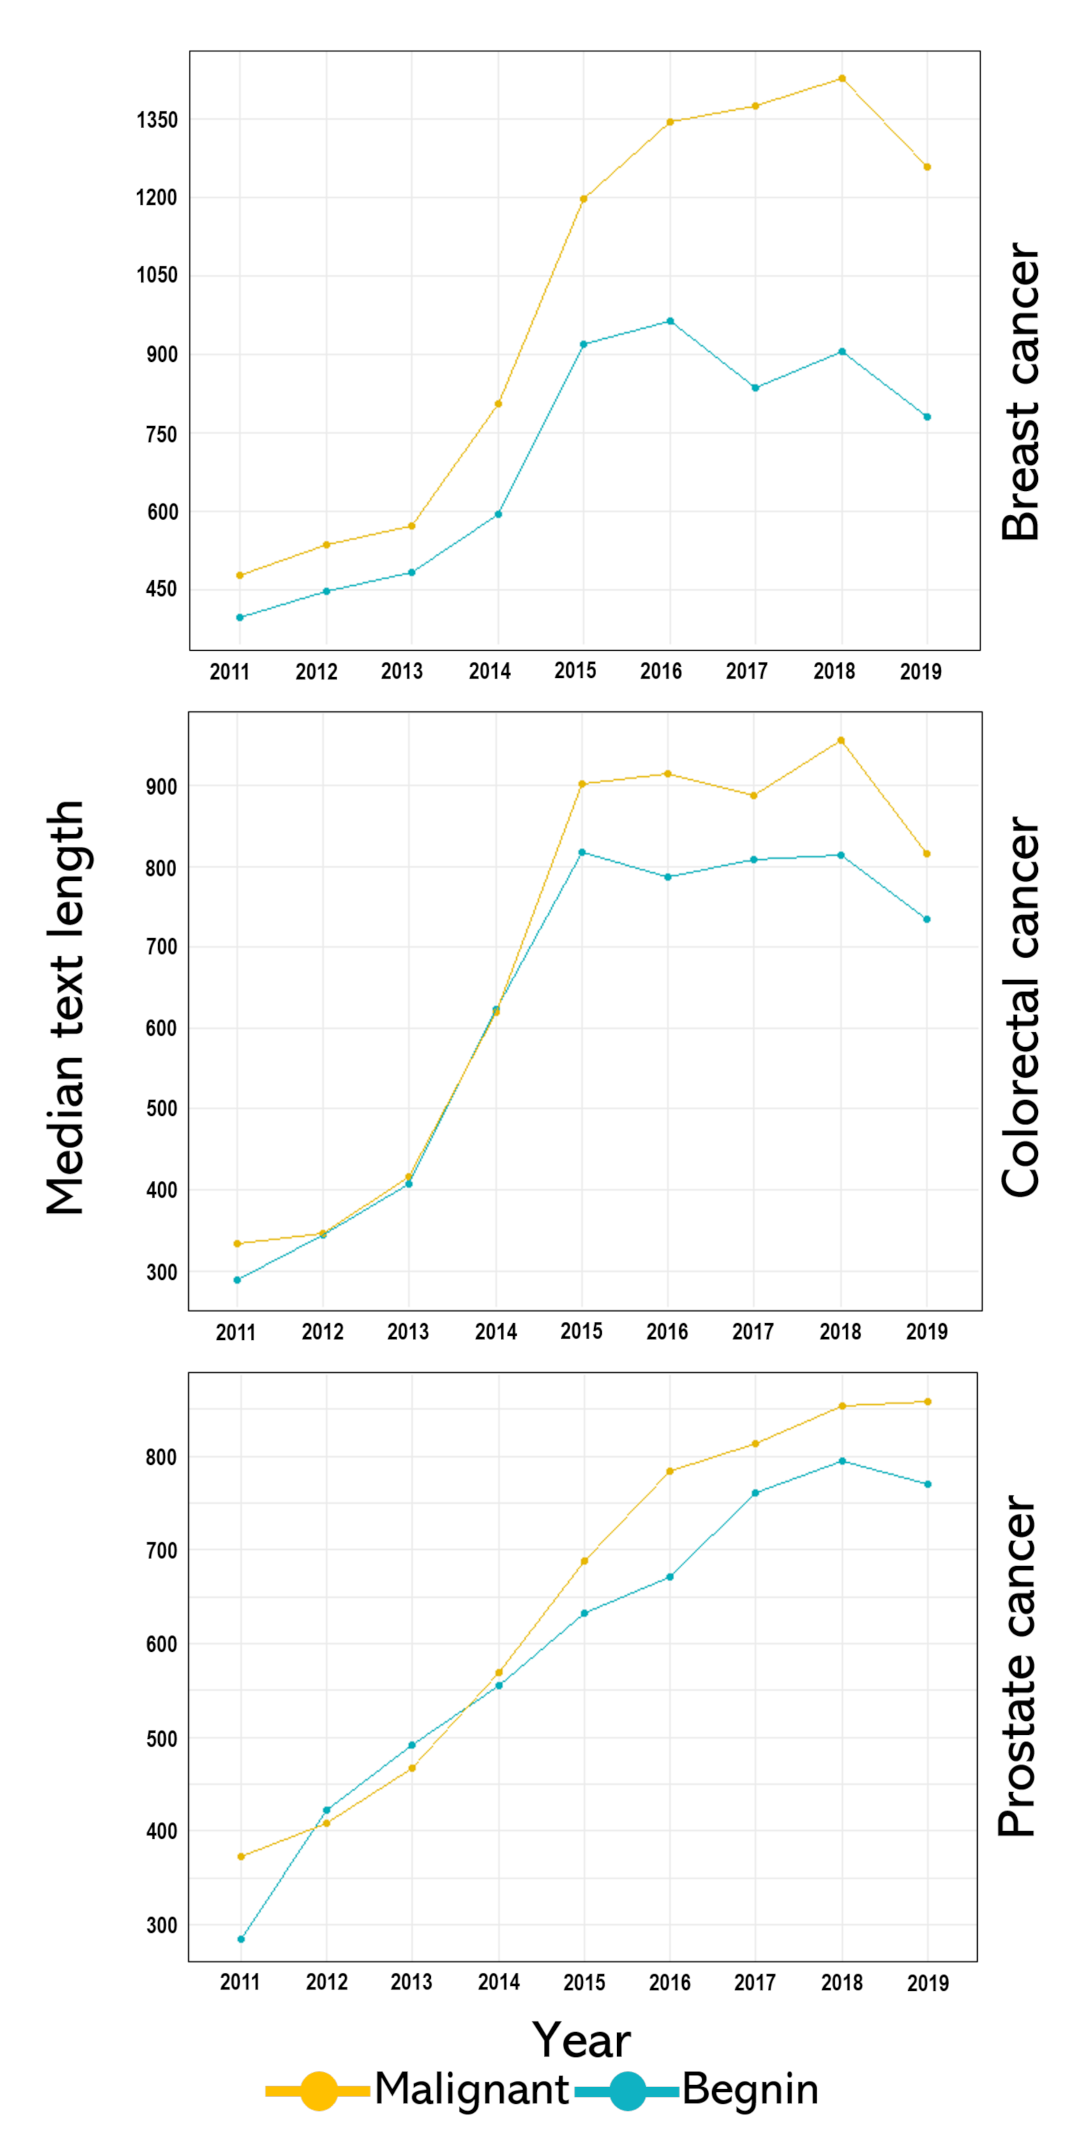
- Our effort was based on the premise that almost a decade of cancer pathology reports (used in this study) may yield more valuable insights into the integrity of the curation of these pathology reports and consistency and style in cancer pathology reporting over the years. Therefore, our data coverage is more comprehensive, which also reflects the population of South Africa.
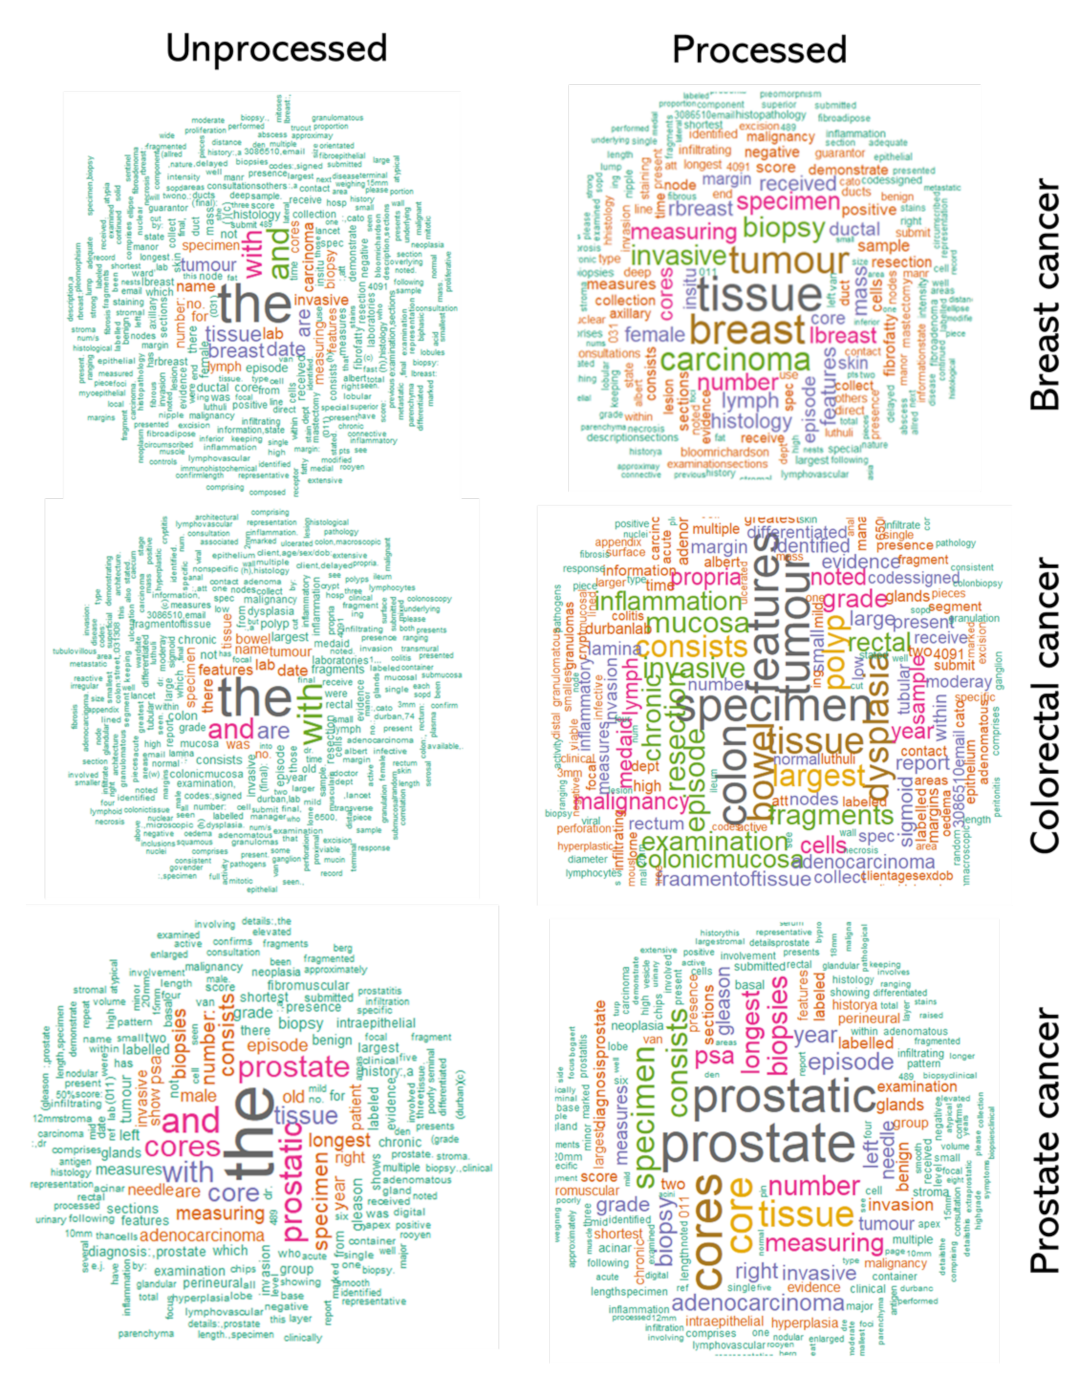
- Various cancers have some unique clinical key terms specific to that cancer (in their reports) and are entirely different from other cancers. For instance, we expect a breast cancer pathology report to include key terms such as “estrogen receptor and progesterone receptor”, which should not be present in colorectal or prostate cancer pathology reports. Hence, we analysed cancer-specific reports instead of aggregating reports of all cancers in a single analysis.
- We perform a detailed comparative evaluation of features selected by the different feature selection techniques and assessed if the integration of the selected features could impact the algorithms’ efficiency. The selected features were manually reviewed to ascertain the reliability of any term used in the model building.
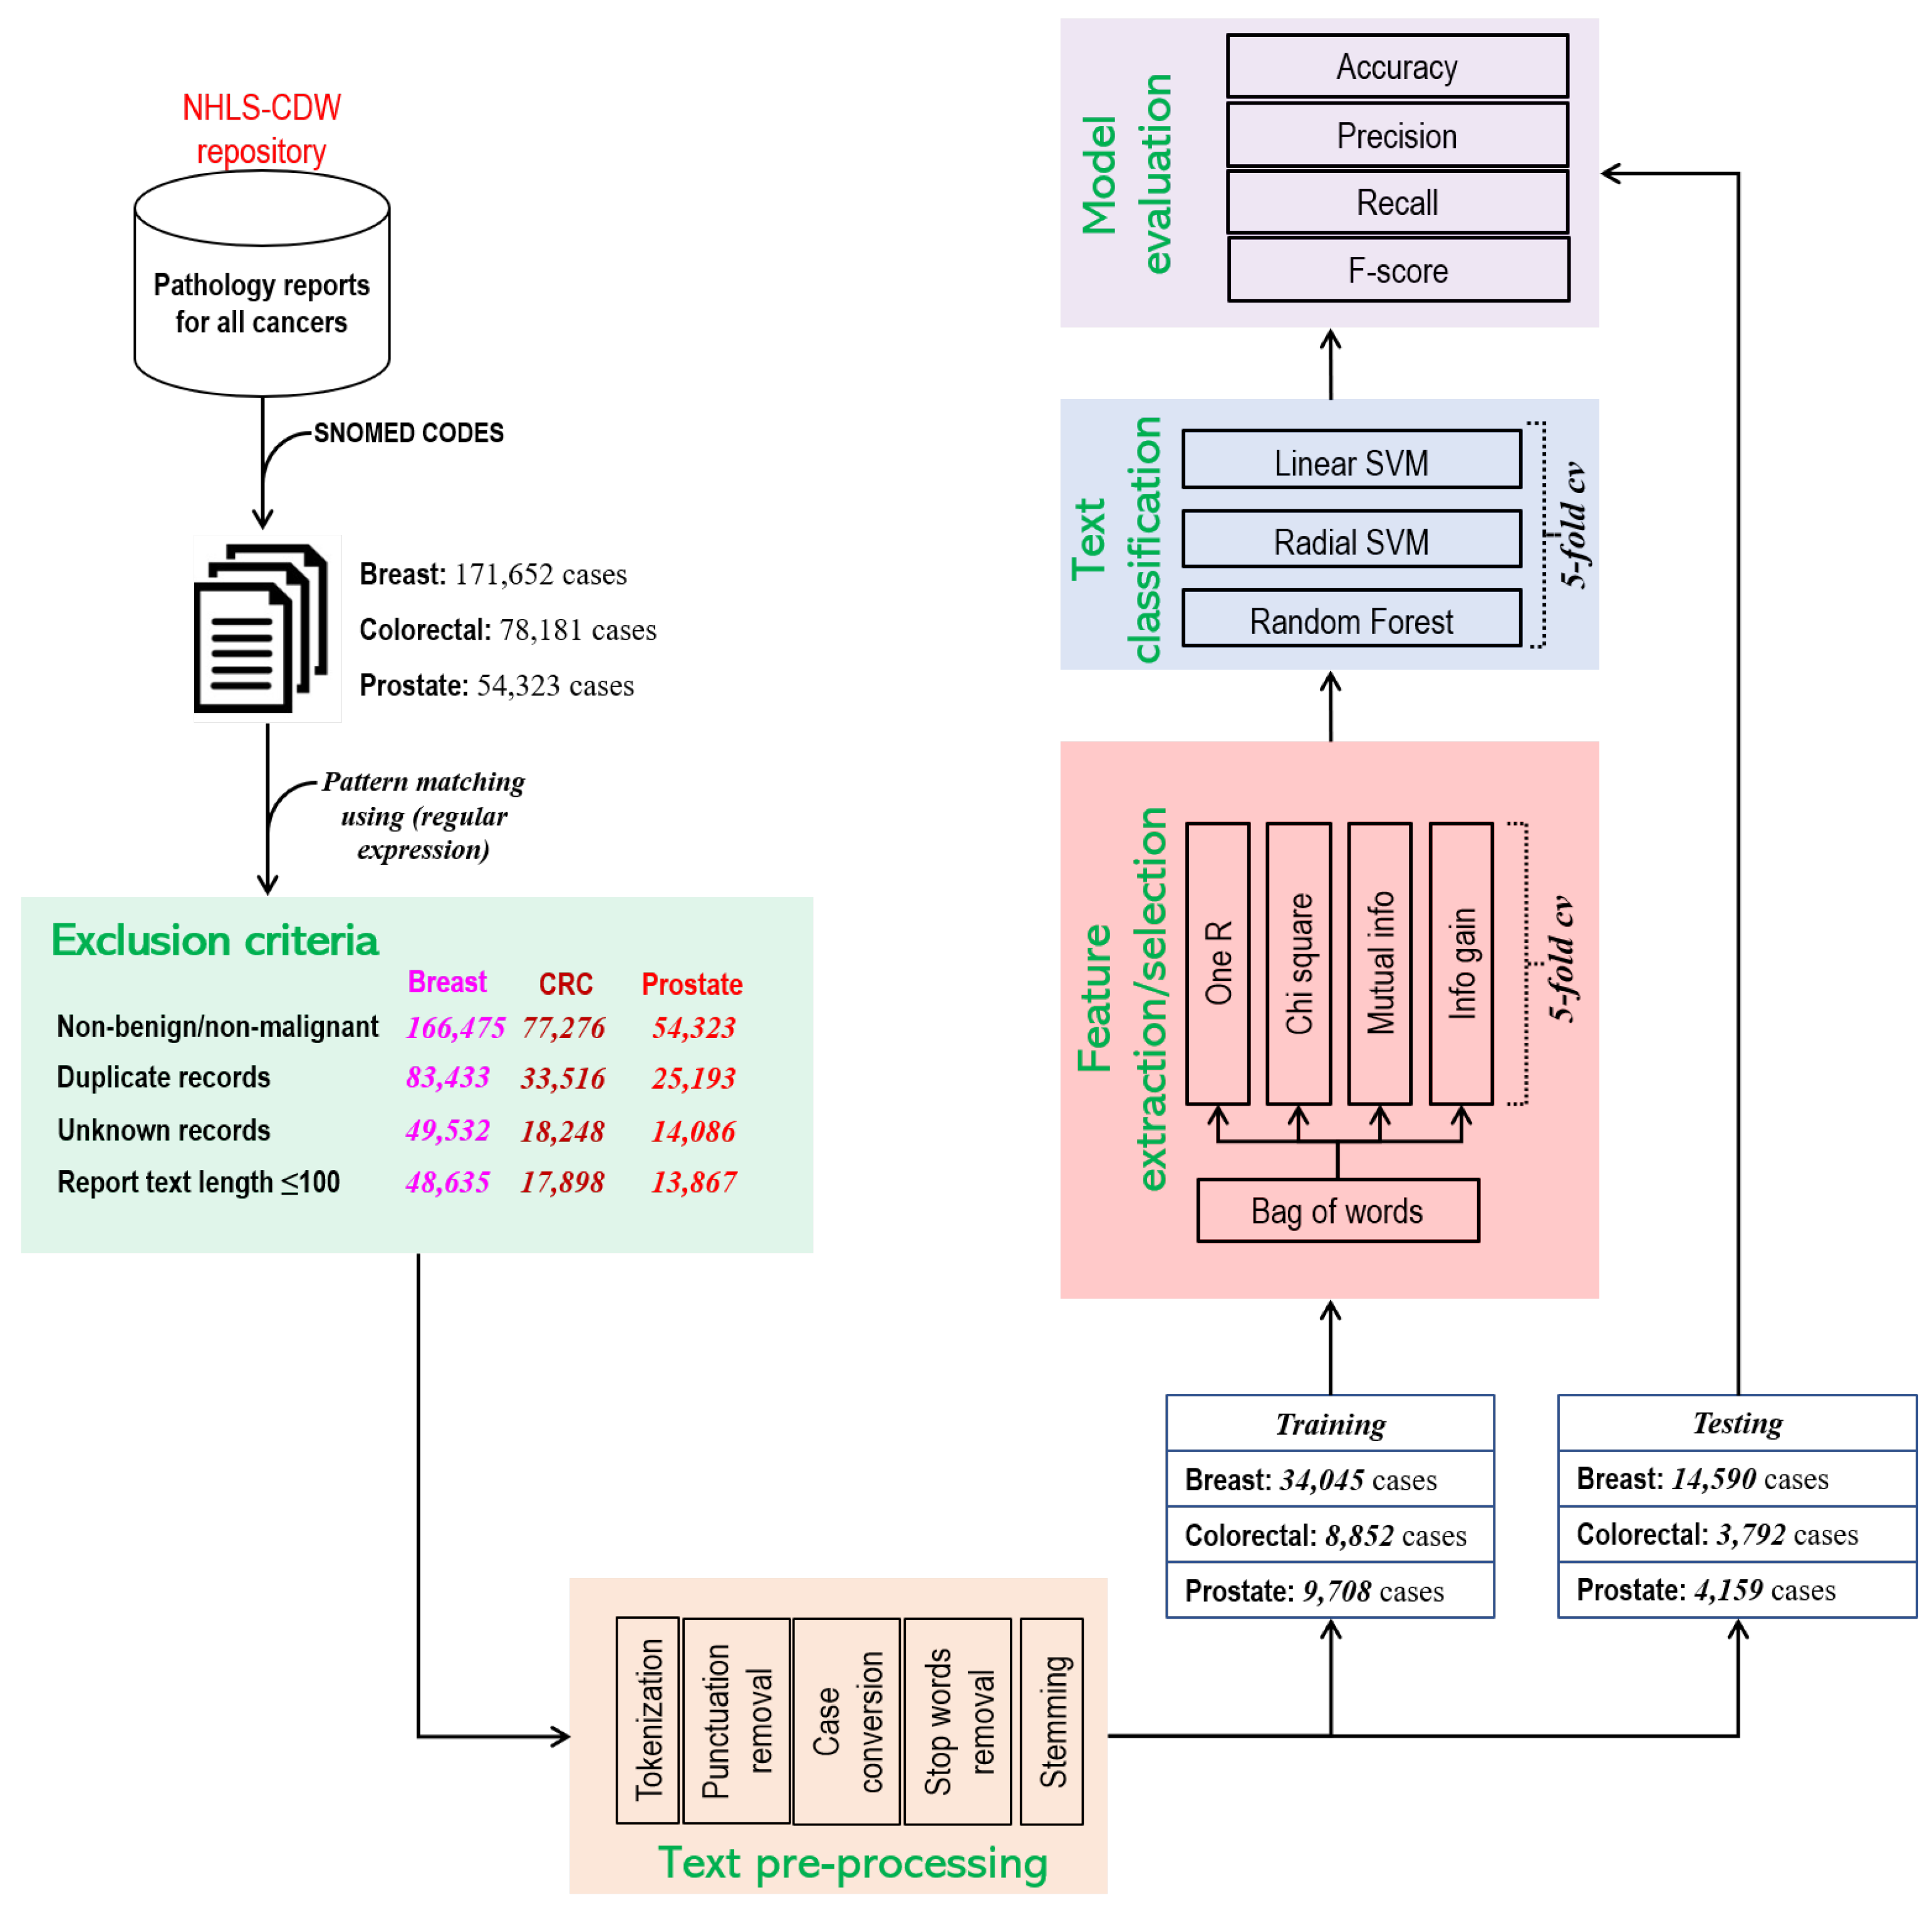
2. Materials and Methods
2.1. Data Source
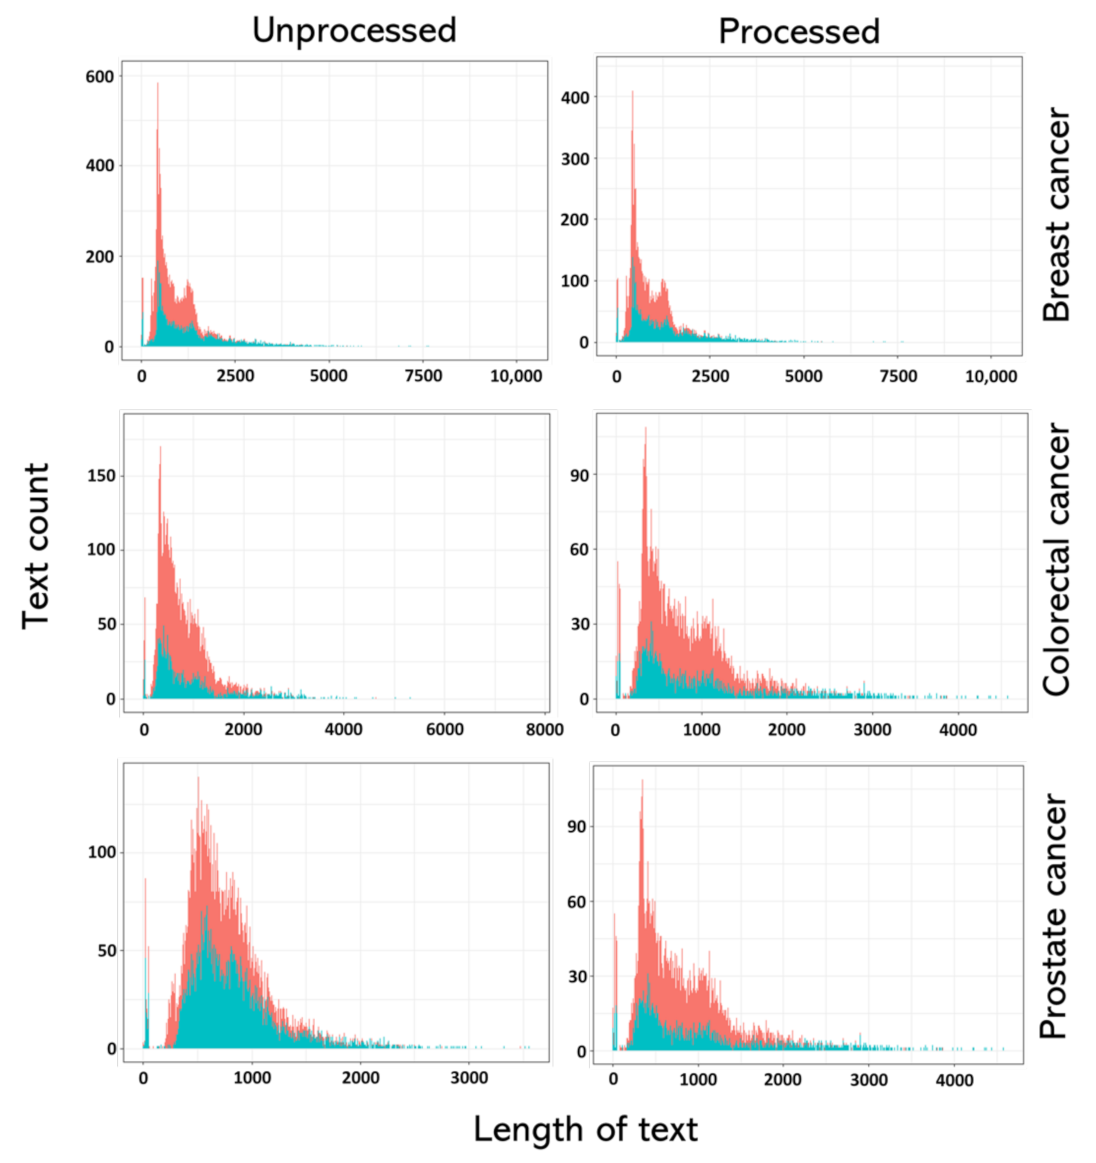
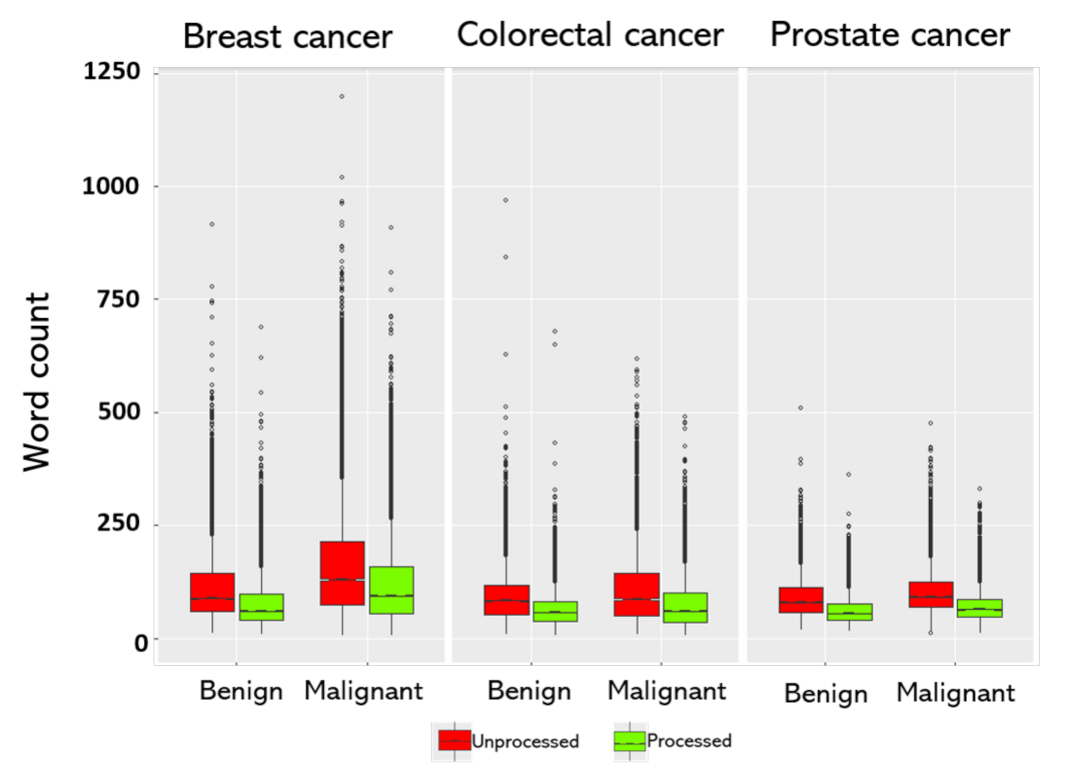
2.2. Preprocessing
2.3. Model Development and Validation
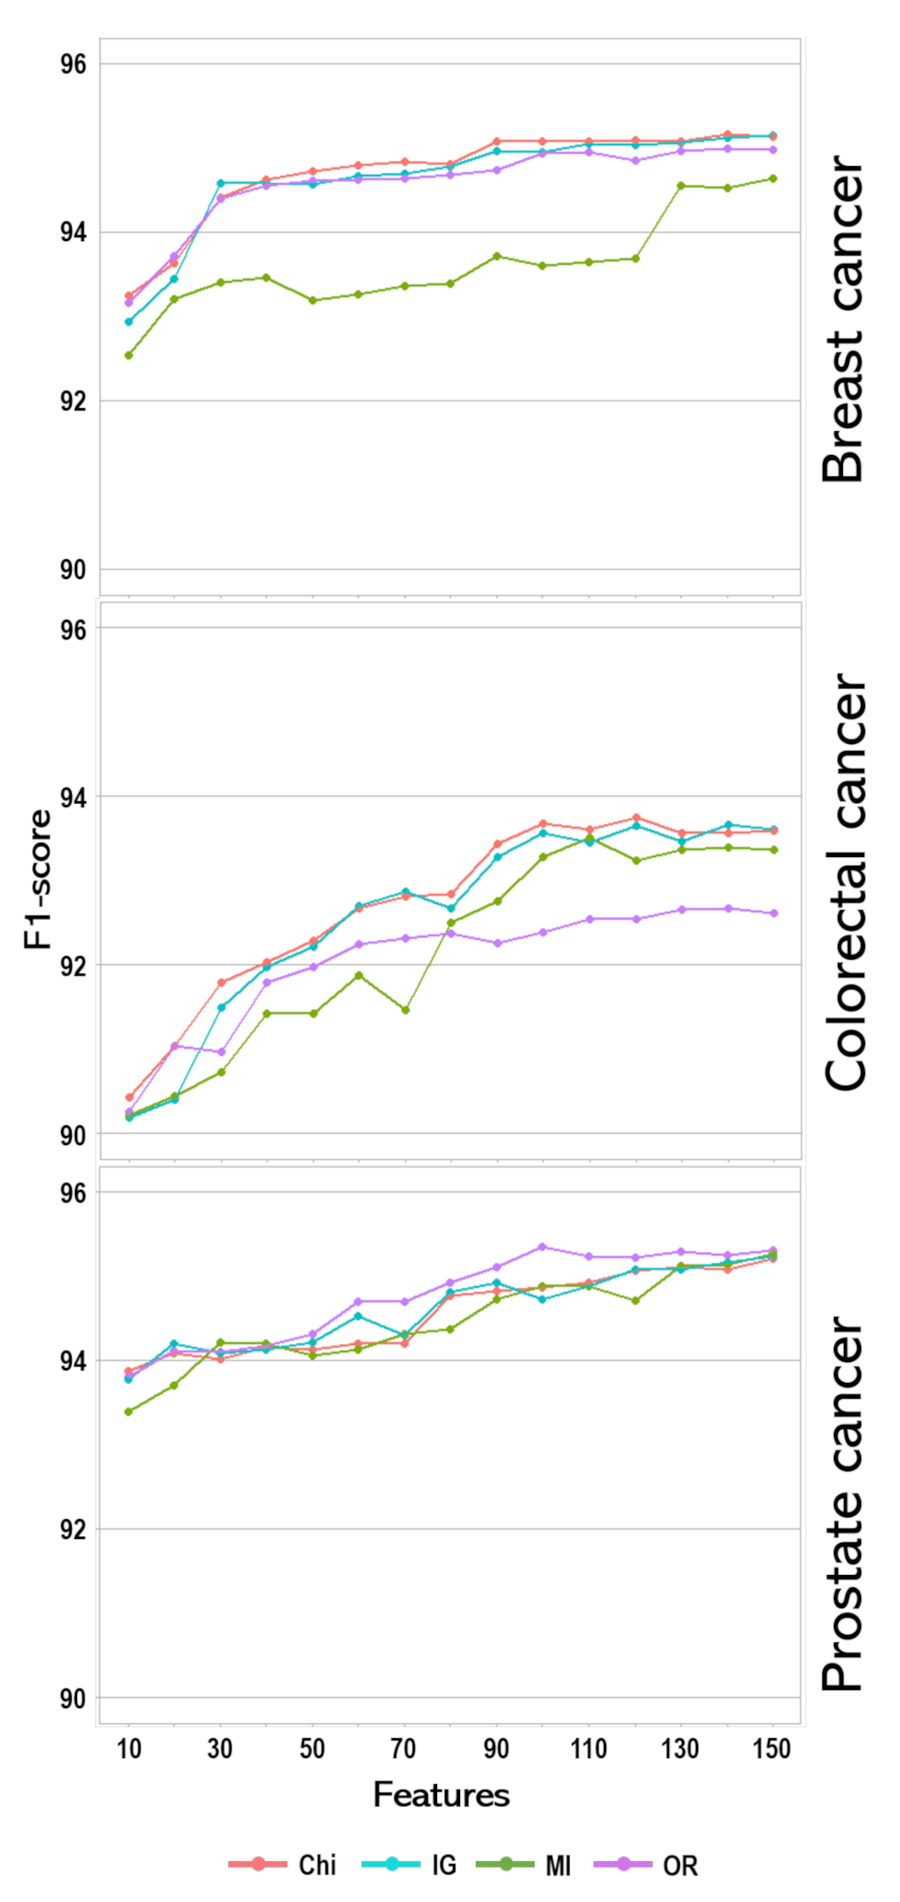
2.3.1. Feature Selection
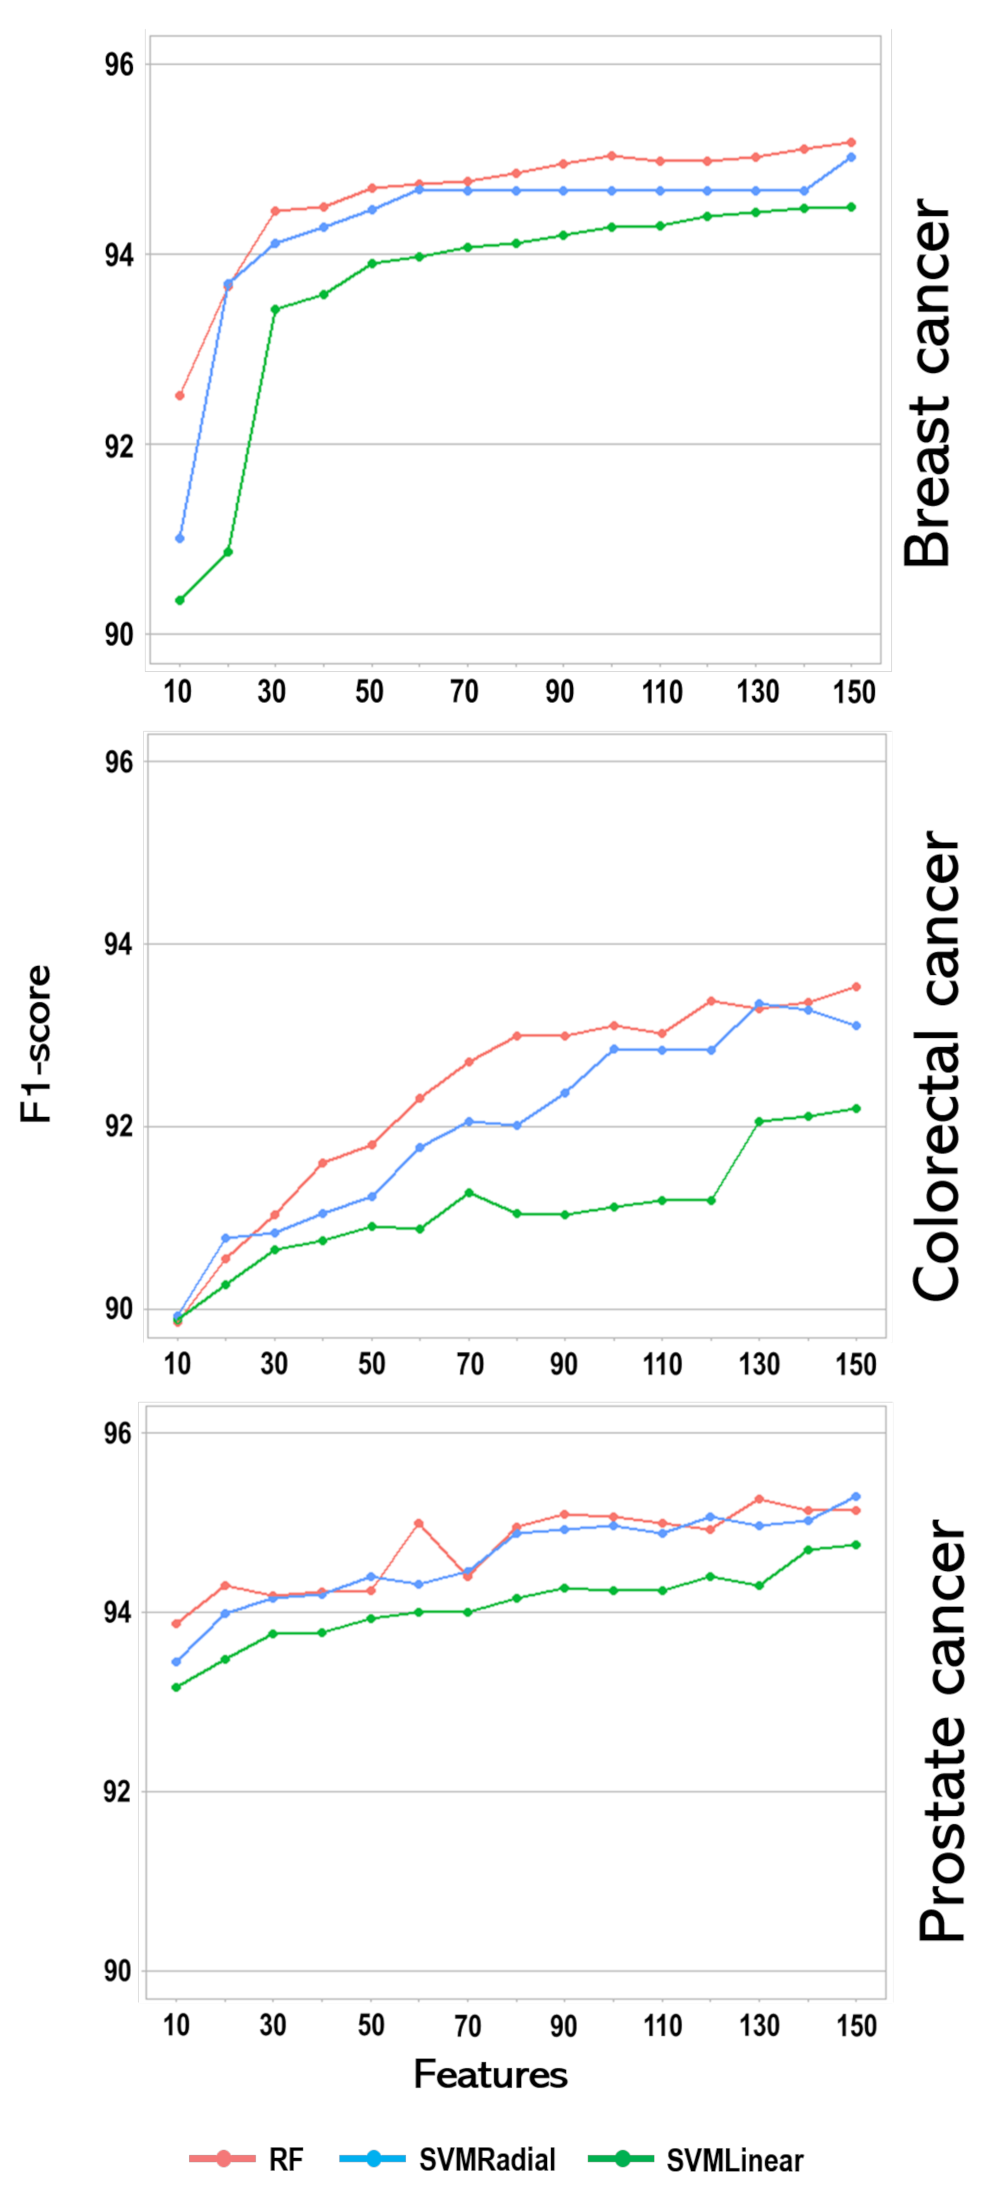
2.3.2. Classifiers
- Randomly select sample from the training data, S.
- Construct a classifier with selected samples.
- Randomly select the number of features that maximise the information gain from the total features.
- Use the best split among the selected features to calculate the node and the daughter node.
- Repeat steps 3 and 4 until the required N number of nodes is reached.
- Recursively repeat the above steps i number of times to create t number of forests.
- For a new case i, predict Y class using the rule from step 6, calculate votes v, and use the majority votes.
2.4. Evaluation Metric
- Precision (P) =
- Recall (R) =
- F 2
- Acc = ,
- —true positive
- —true negative
- —false positive
- —false negative
3. Result
4. Discussion
Conclusions and Future Studies
Author Contributions
Funding
Institutional Review Board Statement
Informed Consent Statement
Data Availability Statement
Acknowledgments
Conflicts of Interest
Abbreviations
| ARP | accuracy recall precision |
| AUC | Area under the curve |
| CDW | Corporate Data Warehouse |
| DL | deep learning |
| ICD-O-3 | International Classification of Diseases for Oncology version O-3 |
| IG | information gain |
| KNN | K nearest neighbour |
| ML | machine learning |
| NB | naïve Bayes |
| NHLS | National Health Laboratory Service |
| OneR | one rule |
| RF | random forest |
| ROC | receiver operating characteristics |
| SVM | support vector machine |
| TM | text mining |
References
- Statistics South Africa. Mortality and Causes of Death in South Africa: Findings from Death Notification; Statistics South Africa: Pretoria, South Africa, 1997. [Google Scholar]
- Stefan, D.C. Why is cancer not a priority in South Africa? S. Afr. Med. J. 2015, 105, 103–104. [Google Scholar] [CrossRef] [Green Version]
- Adonis, L.; An, R.; Luiz, J.; Mehrotra, A.; Patel, D.; Basu, D.; Sturm, R. Provincial screening rates for chronic diseases of lifestyle, cancers and HIV in a health-insured population. S. Afr. Med. J. 2013, 103, 309–312. [Google Scholar] [CrossRef] [PubMed] [Green Version]
- Connolly, J.L.; Schnitt, S.J.; Wang, H.H.; Longtine, J.A.; Dvorak, A.; Dvorak, H.F. Role of the Surgical Pathologist in the Diagnosis and Management of the Cancer Patient. In Holland-Frei Cancer Medicine, 6th ed.; BC Decker: Hamilton, ON, Canada, 2003. [Google Scholar]
- Lankshear, S.; Srigley, J.; McGowan, T.; Yurcan, M.; Sawka, C. Standardized synoptic cancer pathology reports—So what and who cares? A population-based satisfaction survey of 970 pathologists, surgeons, and oncologists. Arch. Pathol. Lab. Med. 2013, 137, 1599–1602. [Google Scholar] [CrossRef] [Green Version]
- Toma, A.; O’Neil, D.; Joffe, M.; Ayeni, O.; Nel, C.; van den Berg, E.; Nayler, S.; Cubasch, H.; Phakathi, B.; Buccimazza, I.; et al. Quality of Histopathological Reporting in Breast Cancer: Results From Four South African Breast Units. JCO Glob. Oncol. 2021, 7, 72–80. [Google Scholar] [CrossRef] [PubMed]
- Service, N.H.L. Annual Report 2011–2017. Available online: http://www.nhls.ac.za/?page=annual_report&id=45 (accessed on 7 August 2018).
- Jouhet, V.; Defossez, G.; Burgun, A.; Le Beux, P.; Levillain, P.; Ingrand, P.; Claveau, V. Automated classification of free-text pathology reports for registration of incident cases of cancer. Methods Inf. Med. 2012, 51, 242. [Google Scholar]
- Dube, N.; Girdler-Brown, B.; Tint, K.; Kellett, P. Repeatability of manual coding of cancer reports in the South African National Cancer Registry, 2010. S. Afr. J. Epidemiol. Infect. 2013, 28, 157–165. [Google Scholar] [CrossRef] [Green Version]
- Berry, M.W.; Kogan, J. Text Mining: Applications and Theory; John Wiley & Sons: Hoboken, NJ, USA, 2010. [Google Scholar]
- Coden, A.; Savova, G.; Sominsky, I.; Tanenblatt, M.; Masanz, J.; Schuler, K.; Cooper, J.; Guan, W.; De Groen, P.C. Automatically extracting cancer disease characteristics from pathology reports into a Disease Knowledge Representation Model. J. Biomed. Inform. 2009, 42, 937–949. [Google Scholar] [CrossRef] [Green Version]
- Goh, Y.M.; Ubeynarayana, C. Construction accident narrative classification: An evaluation of text mining techniques. Accid. Anal. Prev. 2017, 108, 122–130. [Google Scholar] [CrossRef]
- Sarkar, S.K.; Roy, S.; Alsentzer, E.; McDermott, M.B.; Falck, F.; Bica, I.; Adams, G.; Pfohl, S.; Hyland, S.L. Machine Learning for Health (ML4H) 2020: Advancing Healthcare for All. 2020. Available online: http://proceedings.mlr.press/v136/sarkar20a.html (accessed on 7 June 2021).
- Toh, C.; Brody, J.P. Applications of Machine Learning in Healthcare. Smart Manufacturing: When Artificial Intelligence Meets the Internet of Things. 2021. Available online: https://www.intechopen.com/books/smart-manufacturing-when-artificial-intelligence-meets-the-internet-of-things/applications-of-machine-learning-in-healthcare (accessed on 29 June 2021).
- Joachims, T. Text categorization with support vector machines: Learning with many relevant features. In European Conference on Machine Learning; Springer: Berlin/Heidelberg, Germany, 1998; pp. 137–142. [Google Scholar]
- Hyland, S.L.; Faltys, M.; Hüser, M.; Lyu, X.; Gumbsch, T.; Esteban, C.; Bock, C.; Horn, M.; Moor, M.; Rieck, B.; et al. Early prediction of circulatory failure in the intensive care unit using machine learning. Nat. Med. 2020, 26, 364–373. [Google Scholar] [CrossRef]
- Ali, F.; El-Sappagh, S.; Islam, S.R.; Kwak, D.; Ali, A.; Imran, M.; Kwak, K.S. A smart healthcare monitoring system for heart disease prediction based on ensemble deep learning and feature fusion. Inf. Fusion 2020, 63, 208–222. [Google Scholar] [CrossRef]
- Tong, S.; Koller, D. Support vector machine active learning with applications to text classification. J. Mach. Learn. Res. 2001, 2, 45–66. [Google Scholar]
- Nguyen, D.H.; Patrick, J.D. Supervised machine learning and active learning in classification of radiology reports. J. Am. Med. Inform. Assoc. 2014, 21, 893–901. [Google Scholar] [CrossRef] [Green Version]
- Lorenzoni, G.; Bressan, S.; Lanera, C.; Azzolina, D.; Da Dalt, L.; Gregori, D. Analysis of unstructured text-based data using machine learning techniques: The case of pediatric emergency department records in Nicaragua. Med. Care Res. Rev. 2021, 78, 138–145. [Google Scholar] [CrossRef]
- Lewin-Epstein, O.; Baruch, S.; Hadany, L.; Stein, G.Y.; Obolski, U. Predicting antibiotic resistance in hospitalized patients by applying machine learning to electronic medical records. Clin. Infect. Dis. 2021, 72, e848–e855. [Google Scholar] [CrossRef] [PubMed]
- Kasthurirathne, S.N.; Dixon, B.E.; Gichoya, J.; Xu, H.; Xia, Y.; Mamlin, B.; Grannis, S.J. Toward better public health reporting using existing off the shelf approaches: A comparison of alternative cancer detection approaches using plaintext medical data and non-dictionary based feature selection. J. Biomed. Inform. 2016, 60, 145–152. [Google Scholar] [CrossRef]
- Kasthurirathne, S.N.; Dixon, B.E.; Gichoya, J.; Xu, H.; Xia, Y.; Mamlin, B.; Grannis, S.J. Toward better public health reporting using existing off the shelf approaches: The value of medical dictionaries in automated cancer detection using plaintext medical data. J. Biomed. Inform. 2017, 69, 160–176. [Google Scholar] [CrossRef]
- Radha, P.; MeenaPreethi, B. Machine learning approaches for disease prediction from radiology and pathology reports. J. Green Eng. 2019, 9, 149–166. [Google Scholar]
- Kalra, S.; Li, L.; Tizhoosh, H.R. Automatic classification of pathology reports using TF-IDF Features. arXiv 2019, arXiv:1903.07406. [Google Scholar]
- Nguyen, A.; O’Dwyer, J.; Vu, T.; Webb, P.M.; Johnatty, S.E.; Spurdle, A.B. Generating high-quality data abstractions from scanned clinical records: Text-mining-assisted extraction of endometrial carcinoma pathology features as proof of principle. BMJ Open 2020, 10, e037740. [Google Scholar] [CrossRef]
- Olago, V.; Muchengeti, M.; Singh, E.; Chen, W.C. Identification of Malignancies from Free-Text Histopathology Reports Using a Multi-Model Supervised Machine Learning Approach. Information 2020, 11, 455. [Google Scholar] [CrossRef]
- Wickham, H.; Wickham, M.H. Package ‘Stringr’ 2019. Available online: https://cran.r-project.org/web/packages/stringr/stringr.pdf (accessed on 15 March 2021).
- Eler, D.M.; Grosa, D.; Pola, I.; Garcia, R.; Correia, R.; Teixeira, J. Analysis of document pre-processing effects in text and opinion mining. Information 2018, 9, 100. [Google Scholar] [CrossRef] [Green Version]
- Benoit, K.; Watanabe, K.; Wang, H.; Nulty, P.; Obeng, A.; Müller, S.; Matsuo, A. quanteda: An R package for the quantitative analysis of textual data. J. Open Source Softw. 2018, 3, 774. [Google Scholar] [CrossRef] [Green Version]
- Bird, S.; Klein, E.; Loper, E. Natural Language Processing with Python: Analyzing Text with the Natural Language Toolkit; O’Reilly Media, Inc.: Newton, MA, USA, 2009. [Google Scholar]
- Sebastiani, F. Machine learning in automated text categorization. ACM Comput. Surv. (CSUR) 2002, 34, 1–47. [Google Scholar] [CrossRef]
- Lunardon, N.; Menardi, G.; Torelli, N. ROSE: A Package for Binary Imbalanced Learning. R J. 2014, 6, 79–89. [Google Scholar] [CrossRef] [Green Version]
- Kuhn, M.; Wing, J.; Weston, S.; Williams, A.; Keefer, C.; Engelhardt, A.; Cooper, T.; Mayer, Z.; Kenkel, B.; Team, R.C.; et al. Package ‘caret’. 2020. Available online: https://cran.r-project.org/web/packages/caret/caret.pdf (accessed on 29 June 2021).
- Parimala, R.; Nallaswamy, R. A study of spam e-mail classification using feature selection package. Glob. J. Comput. Sci. Technol. 2011, 11, 45–54. [Google Scholar]
- Chandrashekar, G.; Sahin, F. A survey on feature selection methods. Comput. Electr. Eng. 2014, 40, 16–28. [Google Scholar] [CrossRef]
- Alhaj, T.A.; Siraj, M.M.; Zainal, A.; Elshoush, H.T.; Elhaj, F. Feature selection using information gain for improved structural-based alert correlation. PLoS ONE 2016, 11, e0166017. [Google Scholar] [CrossRef] [PubMed] [Green Version]
- Kou, G.; Yang, P.; Peng, Y.; Xiao, F.; Chen, Y.; Alsaadi, F.E. Evaluation of feature selection methods for text classification with small datasets using multiple criteria decision-making methods. Appl. Soft Comput. 2020, 86, 105836. [Google Scholar] [CrossRef]
- Kuhn, M. Building predictive models in R using the caret package. J. Stat. Softw. 2008, 28, 1–26. [Google Scholar] [CrossRef] [Green Version]
- Shah, K.; Patel, H.; Sanghvi, D.; Shah, M. A comparative analysis of logistic regression, random Forest and KNN models for the text classification. Augment. Hum. Res. 2020, 5, 1–16. [Google Scholar] [CrossRef]
- Wright, M.N.; Ziegler, A. ranger: A fast implementation of random forests for high dimensional data in C++ and R. arXiv 2015, arXiv:1508.04409. [Google Scholar] [CrossRef] [Green Version]
- Parwani, A.V.; Mohanty, S.K.; Becich, M.J. Pathology reporting in the 21st century: The impact of synoptic reports and digital imaging. Lab. Med. 2008, 39, 582–586. [Google Scholar] [CrossRef]
- Ellis, D.; Srigley, J. Does standardised structured reporting contribute to quality in diagnostic pathology? The importance of evidence-based datasets. Virchows Arch. 2016, 468, 51–59. [Google Scholar] [CrossRef] [PubMed]
- Liu, K.; Mitchell, K.J.; Chapman, W.W.; Crowley, R.S. Automating tissue bank annotation from pathology reports–comparison to a gold standard expert annotation set. In AMIA Annual Symposium Proceedings; American Medical Informatics Association: Bethesda, MD, USA, 2005; Volume 2005, p. 460. [Google Scholar]
- Martinez, D.; Li, Y. Information extraction from pathology reports in a hospital setting. In Proceedings of the 20th ACM International Conference on Information and Knowledge Management, Glasgow, UK, 24–28 October 2011; pp. 1877–1882. [Google Scholar]
- Wagholikar, K.; Sohn, S.; Wu, S.; Kaggal, V.; Buehler, S.; Greenes, R.; Wu, T.T.; Larson, D.; Liu, H.; Chaudhry, R.; et al. Clinical decision support for colonoscopy surveillance using natural language processing. In Proceedings of the 2012 IEEE Second International Conference on Healthcare Informatics, Imaging and Systems Biology, La Jolla, CA, USA, 27–28 September 2012; pp. 12–21. [Google Scholar]


| Cancer Type | Class | Frequency | Percent | Word Counts | Character Counts | ||
|---|---|---|---|---|---|---|---|
| Unprocessed | Processed | Unprocessed | Processed | ||||
| Median (Range) | Median (Range) | Median (Range) | Median (Range) | ||||
| Breast | Benign | 29,741 | 40.0% | 88.0 (12.0–916.0) | 61.0 (8.0–688.0) | 696.5 (106.0–6974.0) | 558.0 (78.0–5549.0) |
| Malignant | 19,791 | 60.0% | 130.0 (7.0–1197.0) | 94.0 (7.0–909.0) | 1093.0 (102.0–10,483.0) | 875.0 (82.0–7122.0) | |
| Colorectal | Benign | 13,084 | 72.0% | 83.0 (8.0–968.0) | 83.0 (6.0–678.0) | 689.0 (102.0–7697.0) | 553.0 (88.0–6207.0) |
| Malignant | 5164 | 28.0% | 86.0 (9.0–619.0) | 58.0 (7.0–490.0) | 735.0 (109.0–5346.0) | 594.0 (81.0–4232.0) | |
| Prostate | Benign | 6849 | 49.0% | 80.0 (20.0–510.0) | 55.0 (16.0–363.0) | 654.0 (155.0–3482.0) | 523.0 (127.0–2854.0) |
| Malignant | 7018 | 51.0% | 92.0 (12.0–475.0) | 64.0 (12.0–330.0) | 758.0 (131.0–3553.0) | 603.0 (114.0–2705.0) | |
| Cancer | Infogain | Chi-Square | OneR | Mutual Info |
|---|---|---|---|---|
| Breast | carcinoma | carcinoma | carcinoma | ki67 |
| ki67 | ki67 | ki67 | pleomorphism | |
| tumour | tumour | er | bloomrichardson | |
| score | score | score | er | |
| er | er | tumour | invasion | |
| invasion | pr | pr | lymphovascular | |
| Age | invasion | infiltrating | nests | |
| pr | infiltrating | invasion | infiltrating | |
| infiltrating | invasive | positive | pr | |
| pleomorphism | pleomorphism | her2 | score | |
| Colorectal | adenocarcinoma | adenocarcinoma | adenocarcinoma | adenocarcinoma |
| differentiated | differentiated | differentiated | differentiated | |
| moderay | moderay | tumour | moderay | |
| tumour | tumour | moderay | lymphovascular | |
| invasion | invasion | invasion | perineural | |
| infiltrating | infiltrating | invasive | infiltrating | |
| invasive | invasive | infiltrating | distant | |
| lymphovascular | lymphovascular | nodes | differentiation | |
| perineural | perineural | lymph | distance | |
| lymph | lymph | lymphovascular | ajcc | |
| Prostate | adenocarcinoma | adenocarcinoma | adenocarcinoma | gleason |
| gleason | gleason | gleason | adenocarcinoma | |
| perineural | perineural | perineural | perineural | |
| invasion | invasion | invasion | score | |
| score | score | score | group | |
| group | tumour | grade | invasion | |
| tumour | group | tumour | major | |
| grade | grade | group | minor | |
| major | major | hyperplasia | lymphovascular | |
| minor | hyperplasia | cores | involved |
| Features | Cancer Type | Model | F1 | Recall | Precision | Accuracy |
|---|---|---|---|---|---|---|
| 10 | Breast | RF | 92.51 | 90.81 | 94.28 | 90.72 |
| SVMLinear | 90.35 | 85.04 | 96.39 | 87.50 | ||
| SVMRadial | 91.01 | 87.38 | 94.96 | 88.61 | ||
| Colorectal | RF | 89.86 | 83.88 | 96.77 | 86.74 | |
| SVMLinear | 89.89 | 83.84 | 96.89 | 86.76 | ||
| SVMRadial | 89.93 | 84.01 | 96.77 | 86.84 | ||
| Prostate | RF | 93.88 | 93.17 | 94.60 | 93.94 | |
| SVMLinear | 93.17 | 92.07 | 94.31 | 93.19 | ||
| SVMRadial | 93.45 | 92.15 | 94.79 | 93.45 | ||
| 150 | Breast | RF | 95.19 | 94.73 | 95.65 | 94.09 |
| SVMLinear | 94.50 | 92.26 | 96.85 | 93.11 | ||
| SVMRadial | 95.03 | 94.05 | 96.03 | 93.86 | ||
| Colorectal | RF | 93.53 | 91.51 | 95.65 | 86.76 | |
| SVMLinear | 92.20 | 88.81 | 95.86 | 86.79 | ||
| SVMRadial | 93.11 | 90.70 | 95.65 | 90.96 | ||
| Prostate | RF | 95.34 | 95.69 | 94.60 | 95.25 | |
| SVMLinear | 94.76 | 94.40 | 95.12 | 94.82 | ||
| SVMRadial | 95.29 | 95.55 | 94.88 | 95.39 |
Publisher’s Note: MDPI stays neutral with regard to jurisdictional claims in published maps and institutional affiliations. |
© 2021 by the authors. Licensee MDPI, Basel, Switzerland. This article is an open access article distributed under the terms and conditions of the Creative Commons Attribution (CC BY) license (https://creativecommons.org/licenses/by/4.0/).
Share and Cite
Achilonu, O.J.; Olago, V.; Singh, E.; Eijkemans, R.M.J.C.; Nimako, G.; Musenge, E. A Text Mining Approach in the Classification of Free-Text Cancer Pathology Reports from the South African National Health Laboratory Services. Information 2021, 12, 451. https://doi.org/10.3390/info12110451
Achilonu OJ, Olago V, Singh E, Eijkemans RMJC, Nimako G, Musenge E. A Text Mining Approach in the Classification of Free-Text Cancer Pathology Reports from the South African National Health Laboratory Services. Information. 2021; 12(11):451. https://doi.org/10.3390/info12110451
Chicago/Turabian StyleAchilonu, Okechinyere J., Victor Olago, Elvira Singh, René M. J. C. Eijkemans, Gideon Nimako, and Eustasius Musenge. 2021. "A Text Mining Approach in the Classification of Free-Text Cancer Pathology Reports from the South African National Health Laboratory Services" Information 12, no. 11: 451. https://doi.org/10.3390/info12110451