
Remote Sensing from Different Sources for Crop Growth Monitoring in the Area of the Lower Northern Mississippi

1
USDA-ARS Genetics and Sustainable Agriculture Research Unit, Mississippi State, MS 39762, USA
2
Pontotoc Ridge-Flatwoods Branch Experiment Station, Mississippi State University, Pontotoc, MS 38863, USA
*
Author to whom correspondence should be addressed.
Challenges 2023, 14(1), 12; https://doi.org/10.3390/challe14010012
Submission received: 28 November 2022
/
Revised: 4 February 2023
/
Accepted: 13 February 2023
/
Published: 14 February 2023
Abstract
:Remote sensing monitoring of crop growth began from airborne photography to assist in crop pest management and has evolved into monitoring from satellites, manned aircraft, unmanned aerial vehicles (UAVs), and ground-based systems for crop production process modeling, optimization, and control. In recent years, for crop growth remote sensing monitoring, apart from satellites, manned aircrafts, and ground-based systems, UAVs have been developed and widely used for low-altitude remote sensing of crop fields to uniquely provide a cost-effective, flexible tool for field crop growth remote sensing. Additionally, their data create a critical layer between all other remote sensing platforms. This paper overviews the use of remote sensing from difference sources, especially airborne remote sensing from manned aircraft and UAVs, to monitor crop growth in the area of the lower northern Mississippi from the Mississippi Delta to the Black Prairie, one of the most important agricultural areas in the U.S. In this paper, three sites typical in the area are demonstrated for remote sensing monitoring of crop growth, and the issues and challenges are identified and discussed for future opportunities to integrate remote sensing data from different sources to improve crop monitoring in this area and surrounding areas.
1. Introduction
Remote sensing monitoring of crop fields has a history over 100 years. A classic example is from College Station, Texas, where aerial photography was used to identify cotton root rot in the late 1920s [1,2,3]. In the mid-1950s, aerial color infrared (CIR) photography was assessed to classify vegetation types and detect diseases and stresses of cereal crops [4]. Since then, remote sensing technologies have been rapidly developed in spaceborne, airborne, and ground-based platforms and widely applied for geospatial analysis of natural resources in ecological systems on the Earth [5,6,7,8,9]. Modern precision agriculture is revolutionizing agricultural operations using site-specific management supported by the technologies of global positioning systems (GPS), geographic information systems (GIS), and remote sensing [10,11]. Precision agriculture has been technically implemented since the late 1980s, and, accordingly, agricultural remote sensing has been rapidly developed and widely applied for monitoring crop fields [12,13]. Agricultural remote sensing has been conducted on a satellite, an aircraft, or a portable spectrometer. In recent years, agricultural remote sensing has been developed into a paradigm of low-altitude remote sensing centered around unmanned aircraft or unmanned aerial vehicles (UAVs) for high-performance monitoring of crop fields for crop production process modeling, optimization, and control [14,15,16,17].
A UAV, especially small UAV (sUAV), is a remote sensing platform that can be developed and used to remotely observe crop fields with high quality images. The operation of a UAV over an area is flexible, with minor restrictions due to weather and field conditions. In observing crop fields, an sUAV is typically used to cover small fields, while satellite imagery and the imagery acquired from manned aircrafts can directly cover a large area of fields because their flight altitudes (or orbits) are much higher than sUAVs’. Therefore, the spatial resolutions of the images from satellites and manned aircraft may be much lower than the images from sUAVs.
In monitoring crop fields, different sources of remote sensing may be used depending on the purpose of research and management. Satellite imagery is mainly used for boundary delineation of regional or farm areas for determining land use and land cover. The imagery acquired from manned aircraft can be used for land use and land cover quantification, or, as the images acquired from sUAVs are, for field boundary delineation for detection and determination of plant traits and stresses. For a specific focus of concern, a source of remote sensing data can be used, and, at the same time, different sources of remote sensing data can be compared for optimal spatial, spectral, and temporal coordination. This paper overviews the use of remote sensing from different sources, especially airborne remote sensing from manned aircraft and UAVs, to monitor crop growth with three demonstration sites typical in the area of the lower northern Mississippi from the Mississippi Delta to the Black Prairie, one of the most important agricultural areas in the U.S., and indicates the capabilities of satellite remote sensing for crop field monitoring. Then, the issues and challenges are identified and discussed for future opportunities to integrate the remote sensing data from different sources to improve crop monitoring in this area and surrounding areas in the state of Mississippi and any other similar areas.
2. Demonstration Sites
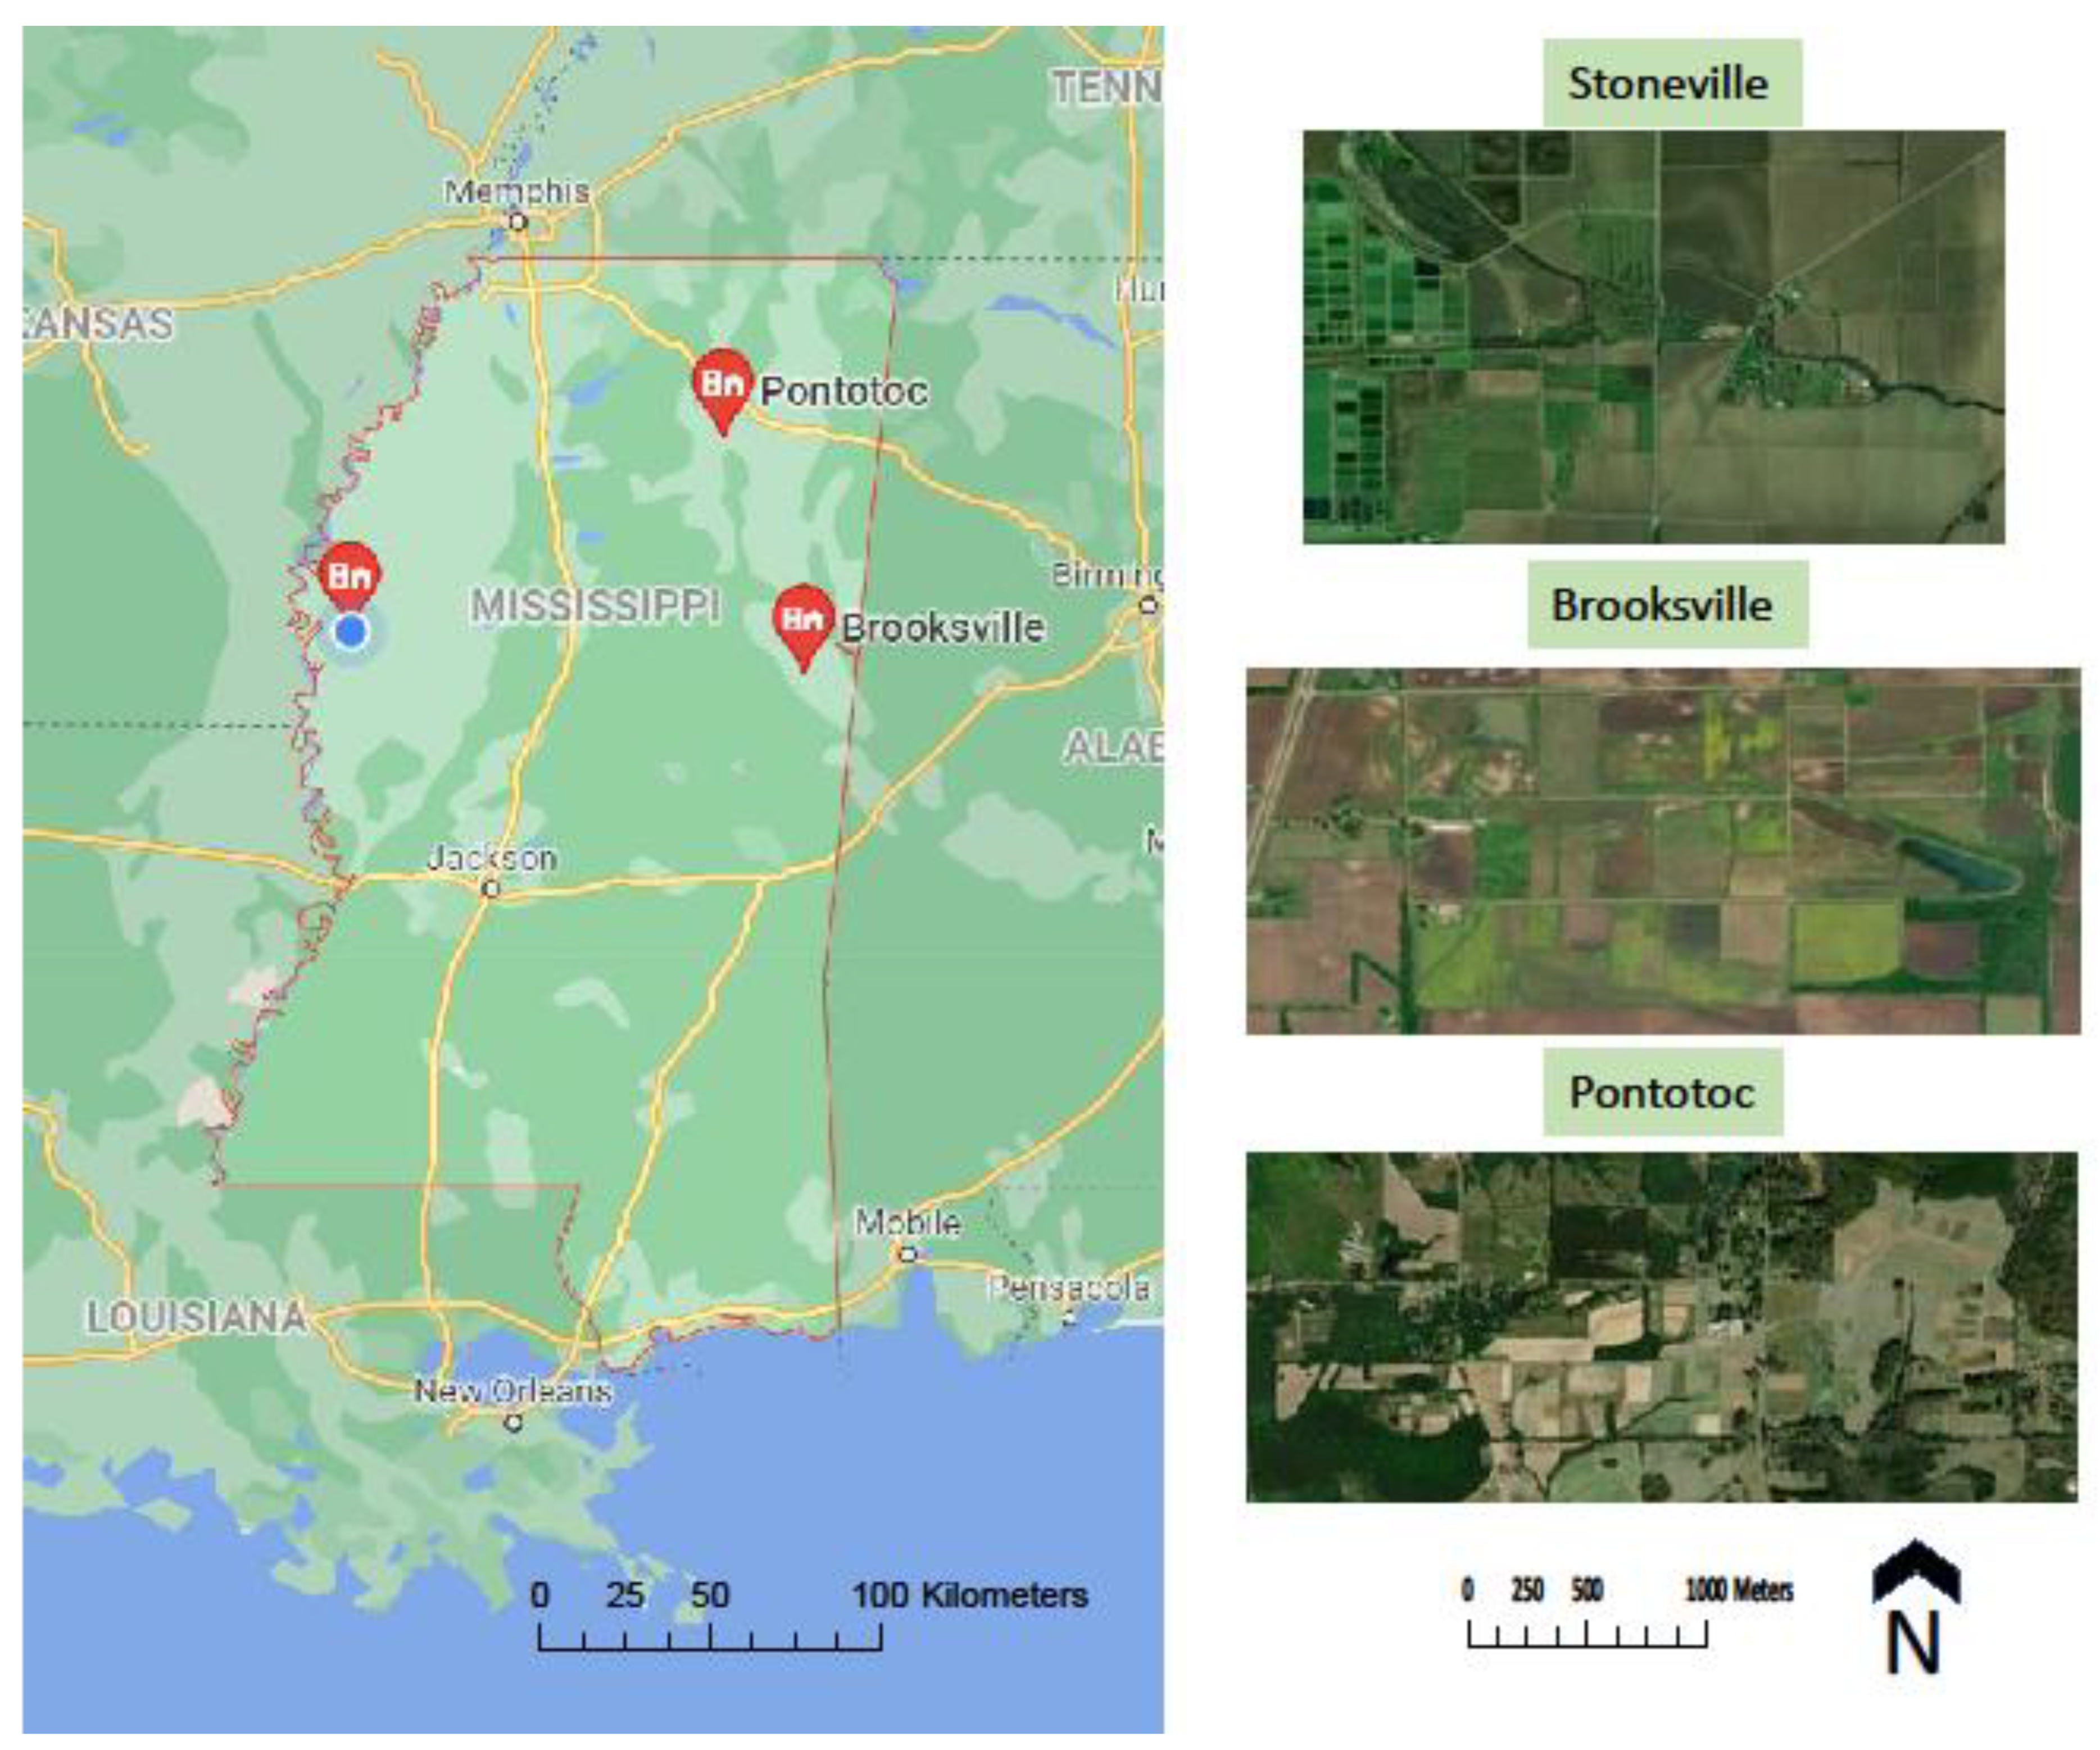
The demonstration sites are scattered at three typical locations over the area of the lower northern Mississippi from the Mississippi Delta to the Black Prairie:
- Stoneville, Mississippi
This location is in the area of the Mississippi Delta, one of the largest contiguous agricultural areas in the U.S. and close the Mississippi river. At this location, the United States Department of Agriculture (USDA), Agricultural Research Unit (ARS) has land of about 1.2 km2 (33°26′42″ N, 90°52′50″ W and 37 m elevation), with numerous fields specialized for various crop research and experiments of precision agriculture, weed science, and irrigation water management.
- 2.
- Brooksville, Mississippi
This location is close to the Black Prairie wildlife area in Mississippi where Mississippi State University professors are conducting irrigation research experiments over an area of 2.7 km2 (33°15′31″ N, 88°32′60″ W and 79 m elevation) in eastern Mississippi. Within the area, a field of 9700 m2 (33°15′40″ N, 88°32′22″ W and 73 m elevation) was used for an irrigation study in a soybean field by USDA ARS scientists, with two treatments, rainfed and irrigated, replicated four times.
- 3.
- Pontotoc, Mississippi
This location is in the middle of the lower northern Mississippi, and at this location, USDA ARS scientists have conducted crop science experiments in numerous fields in the farm of Mississippi State University over an area of 2.6 km2 (34°08′17″ N, 89°00′15″ W and 141 m elevation) in northeastern Mississippi.
Figure 1 shows the maps of the study areas generated by Google Maps and Google Earth Pro (Google, Mountain View, CA, USA).
3. Materials and Methods
3.1. Airborne Remote Sensing of Study Area and Fields
3.1.1. Manned Aircraft Remote Sensing
At Stoneville, Mississippi, USDA-ARS scientists began to remotely sense crop fields from manned aircraft in the early 2000s. A video-based system installed on an Air Tractor 402B spraying airplane (Air Tractor, Olney, TX, USA) was developed for aerial remote sensing flyovers of crop fields, especially for detection of crop stress caused by multiple factors, within the USDA research farms in this location [18,19]. A thermal imaging system installed on the Air Tractor 402 spray plane was further developed for aerial remote sensing flyovers of crop fields, especially for determination of field surface and canopy temperature for irrigation management [20]. Since 2009, airborne remote sensing has been fully developed and applied in this area. The Air Tractor 402B airplane was retrofitted with digital, multispectral, and thermal cameras that were triggered automatedly based on GPS navigation of the flights. The applications have been accomplished in field monitoring for assessing crop damage caused by herbicides sprayed from aircraft and tractors [21] and farm mapping for field decision support based on remote sensing big data [22].
The system developed on Air Tractor 402B consists of two GoPro Hero 3+ cameras (GoPro, San Mateo, CA, USA). One is for RGB image acquisition, and the other was modified by replacing the red lens with a 700 nm high-pass filtered lens to sense NIR signals for NIR images. The original lenses of GoPro cameras are wide-angled, however, for this study, the lenses were all replaced with 2.97 mm f/4.0 low distortion ones. Each lens has a 95° of field of view (FOV), which can offer 55 cm/pixel ground spatial resolution of the images at a flight altitude of 900 m with an image size of 3680 × 2760. This resolution is superior to the imagery of high-resolution satellites in multispectral bands. Additionally, a GPS receiving unit was synchronized with the operation of the imaging system onboard the airplane to provide GPS data to geotag the images along the flying track, which is required for image mosaic. To ensure the camera was pointed nadir during flight, the camera was shimmed backward 10° to compensate for the in-flight difference in vertical angle. The lens was calibrated for optimal focus and exposure for aerial operation.
This system was also synchronized to a FLIR Vue Pro 640 13 mm thermal camera which works at the spectral band over 7.5–3.5 µm, with an image size of 640 × 512 pixels and 45° (horizontal) × 37° (vertical) FOV. It can offer an average of 118 cm/pixel (1.18 m/pixel) ground spatial resolution of the images at a flight altitude of 900 m.
With thermal image data, “hot” spots over the crop fields can be identified to show the distribution of crop stresses, such as water deficiency. With RGB and multispectral image data, the crop growth vigor over the field can be visualized, which can be expressed as a vegetation index. A vegetation index is a combination of remotely sensed earth surface radiance or reflectance at two or more wavelengths to highlight a particular property of vegetation. Various vegetation indices have been published for crop studies in fields [23,24]. Among them, the normalized difference vegetation index (NDVI) has been most widely used in data processing of various remote sensing platforms and sensors to characterize land surface vegetation, and was used for this study as well. NDVI originated for satellite remote sensing. It has been expanded to be used for airborne and other remote sensors with red and NIR band data. Thus, it has been widely used in remote sensing crop monitoring and crop assessment from the spectral data measured from various remote sensing platforms [25,26,27,28,29] and it has been the important indicator of crop growth vigor monitoring for our studies.
3.1.2. UAV Remote Sensing
At Stoneville, Mississippi, in 2012, USDA-ARS scientists began to develop UAVs for remote sensing of RGB, multispectral, thermal, and hyperspectral cameras and sensors for various applications, including crop herbicide damage assessment, herbicide-resistant weed identification, crop yield estimation, and crop phenotyping, for crop field monitoring [16,30].
At Brooksville, Mississippi, USDA-ARS scientists began to conduct UAV remote sensing of a soybean field in 2017 and continued in 2018 and 2019. For this study, UAV multispectral images were acquired using a Parrot Sequoia multispectral camera (Parrot, Paris, France) with a broadband RGB sensor and narrowband red, green, red-edge, and NIR sensors flown with an eBee senseFly fixed-wing UAV (senseFly, Cheseaux-sur-Lausanne, Switzerland).
At Pontotoc, Mississippi, USDA-ARS scientists similarly began to conduct UAV remote sensing of crop fields in 2017 and continued in 2018 and 2019, with most flyovers in 2018. For the studies, UAV images were also acquired using the Parrot Sequoia camera flown with the eBee senseFly fixed-wing UAV.
3.2. Satellite Imagery Sources for Remote Sensing of Study Areas
There are numerous sources of satellite imagery that can be used for spaceborne remote sensing monitoring of agricultural areas and crop fields. The following are the most used for crop monitoring in this area, with free access for research purposes and have been used in our studies in this work:
3.2.1. Landsat (National Aeronautics and Space Administration (NASA), Washington DC, USA; United States Geological Survey (USGS), Reston, VA, USA)
Landsat is a joint program of NASA and USGS for acquisition of satellite imagery of the Earth. Landsat images are a good data source to detect land uses for regional studies for crop type classification and yield estimation, however, it has a relatively long revisit cycle (16 days), so it is often difficult to find a day with a cloudless image during the summer in the humid region of the Lower Northern Mississippi. For this study, Landsat 8 multispectral imagery with 30 m spatial resolution was collected from EarthExplorer for the products with a processing level of 2 for atmospherically corrected surface reflectance.
3.2.2. Sentinel (European Space Agency (ESA), Paris, France)
ESA has developed the Sentinel program for developing a series of next-generation Earth observation (EO) satellite missions to advance ongoing and upcoming EO studies. Images from Sentinel-2 [31,32,33,34,35,36] and Landsat 8 [36] have already been used for agricultural remote sensing and crop monitoring for precision agriculture applications. With a shorter cycle of revisiting (less than 5 days) compared with Landsat, Sentiniel-2 has a better chance to provide more cloudless images during the summer in humid regions. For this study, Sentinel 2A multispectral imagery with 10 m spatial resolution was collected from EarthExplorer for the products with a processing level of 1C, which includes radiometric and geometric corrections, along with orthorectification to generate highly accurate geolocated products.
3.2.3. PlanetScope (Planet, San Francisco, CA, USA)
Planet operates the PlanetScope, RapidEye, and SkySat Earth-imaging satellite constellations. Planet images have been increasingly used in crop field monitoring [37,38,39]. Planet provides imagery services for a fee. With the mission of the company to promote scientific research with rapid Earth surface observation, Planet offers university-affiliated students, faculty members, and researchers accounts in the Education and Research Program for limited, non-commercial access to PlanetScope imagery and RapidEye archive. Recently the US federal government made a contract with Planet for US federal scientists to similarly apply for accounts in the Education and Research Program for limited, non-commercial access to Planet imagery. For this study, PlanetScope 4-band multispectral imagery with 3 m spatial resolution and 1 day revisit time was collected from the Planet website (https://www.planet.com/explorer/ 10 January 2023) for the scene products with a processing level of 3B, with which orthorectified, scaled top of atmosphere radiance (at sensor), or surface reflectance image products are available that are suitable for analytic and visual applications. This product has scene-based framing and is projected to a cartographic projection.
4. Results
4.1. Stoneville, Mississippi
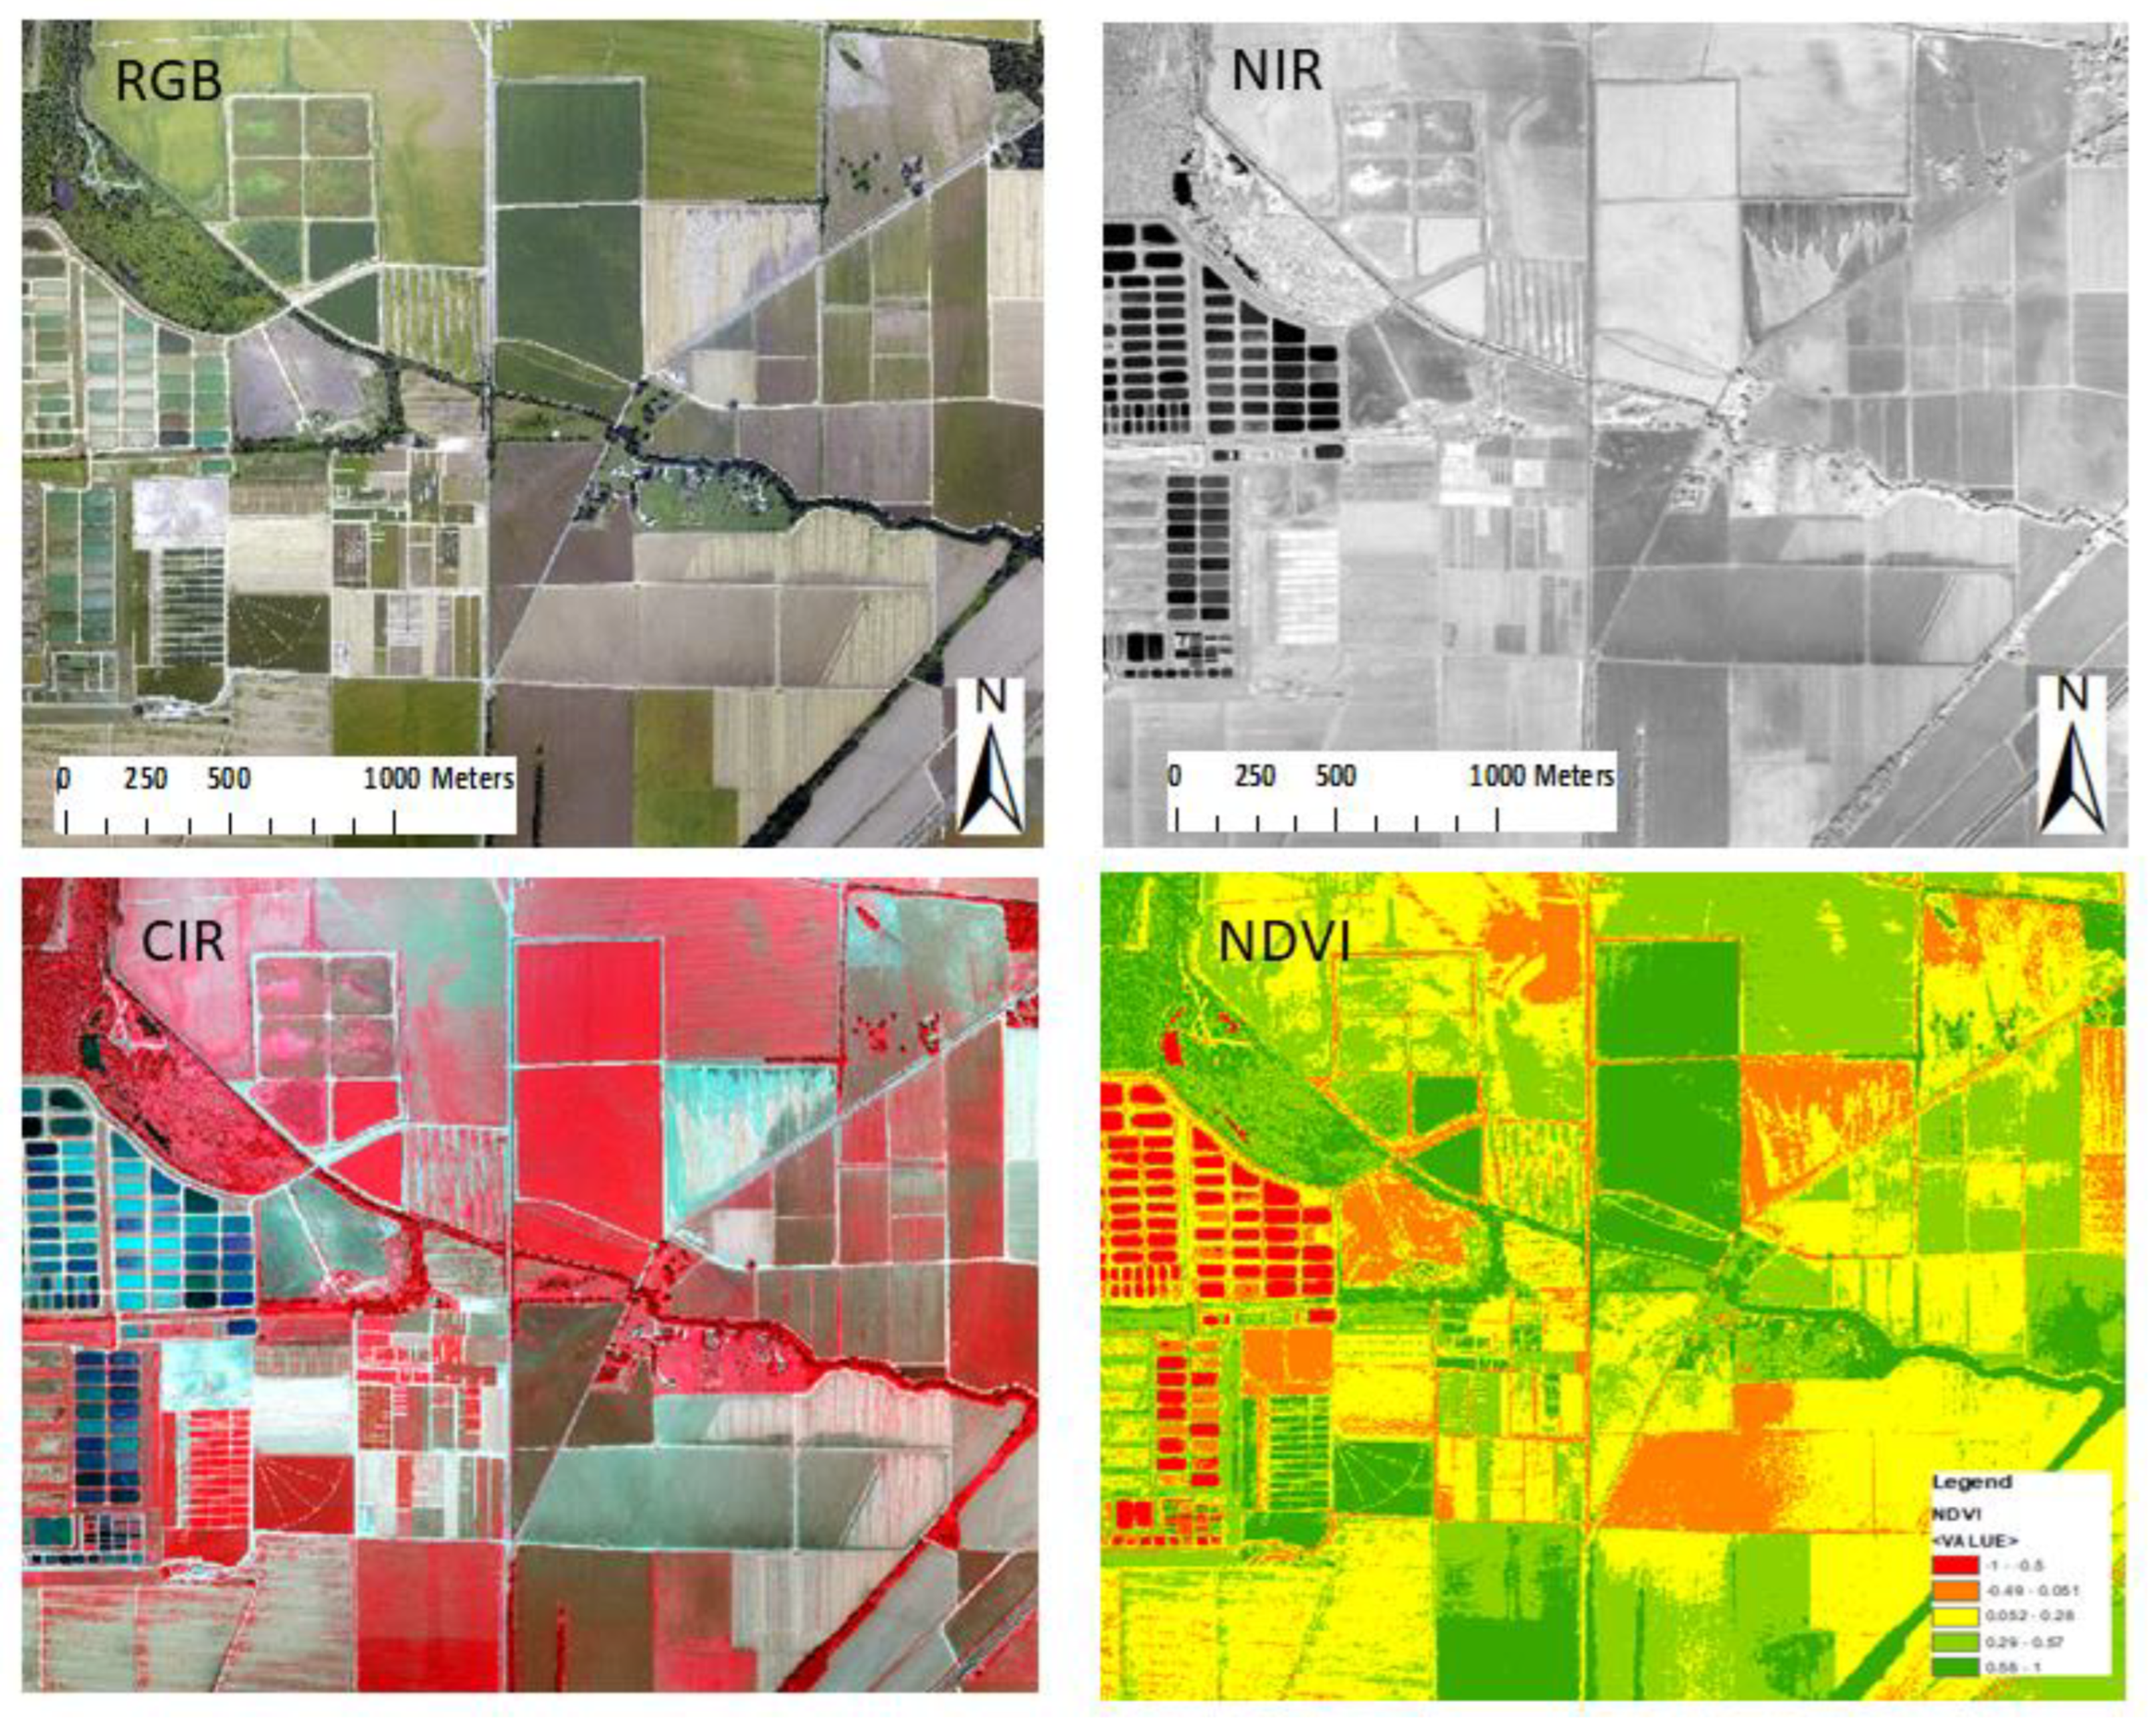
Figure 2 shows orthomosaic images (RGB, NIR, CIR (Color-Infrared), and NDVI) over the USDA-ARS research farm area at Stoneville, Mississippi in September 2016. The original images for the mosaicking were acquired from a dual GoPro digital imaging system operated on the Air Tractor 402B agricultural airplane. The images shown in Figure 2, especially NDVI, clearly indicate harvested corn fields, matured soybean fields, and vegetated cotton fields in a typical September crop growth in this area. The synchronized FLIR Vue Pro 640 13 mm thermal camera scanned over the farm area at the same time. This camara is a non-radiometric thermal imager, which displays temperature field distributions (intensity of thermal radiation in captured scenes) without the possibility of any other correction. This thermal camera could be further replaced a radiometric unit, such as FLIR Vue Pro 640 R, which can provide thermal images that contain accurate, calibrated temperature data embedded in every pixel. This type of portable radiometric thermal camera has been used more often on small UAVs in recent years.
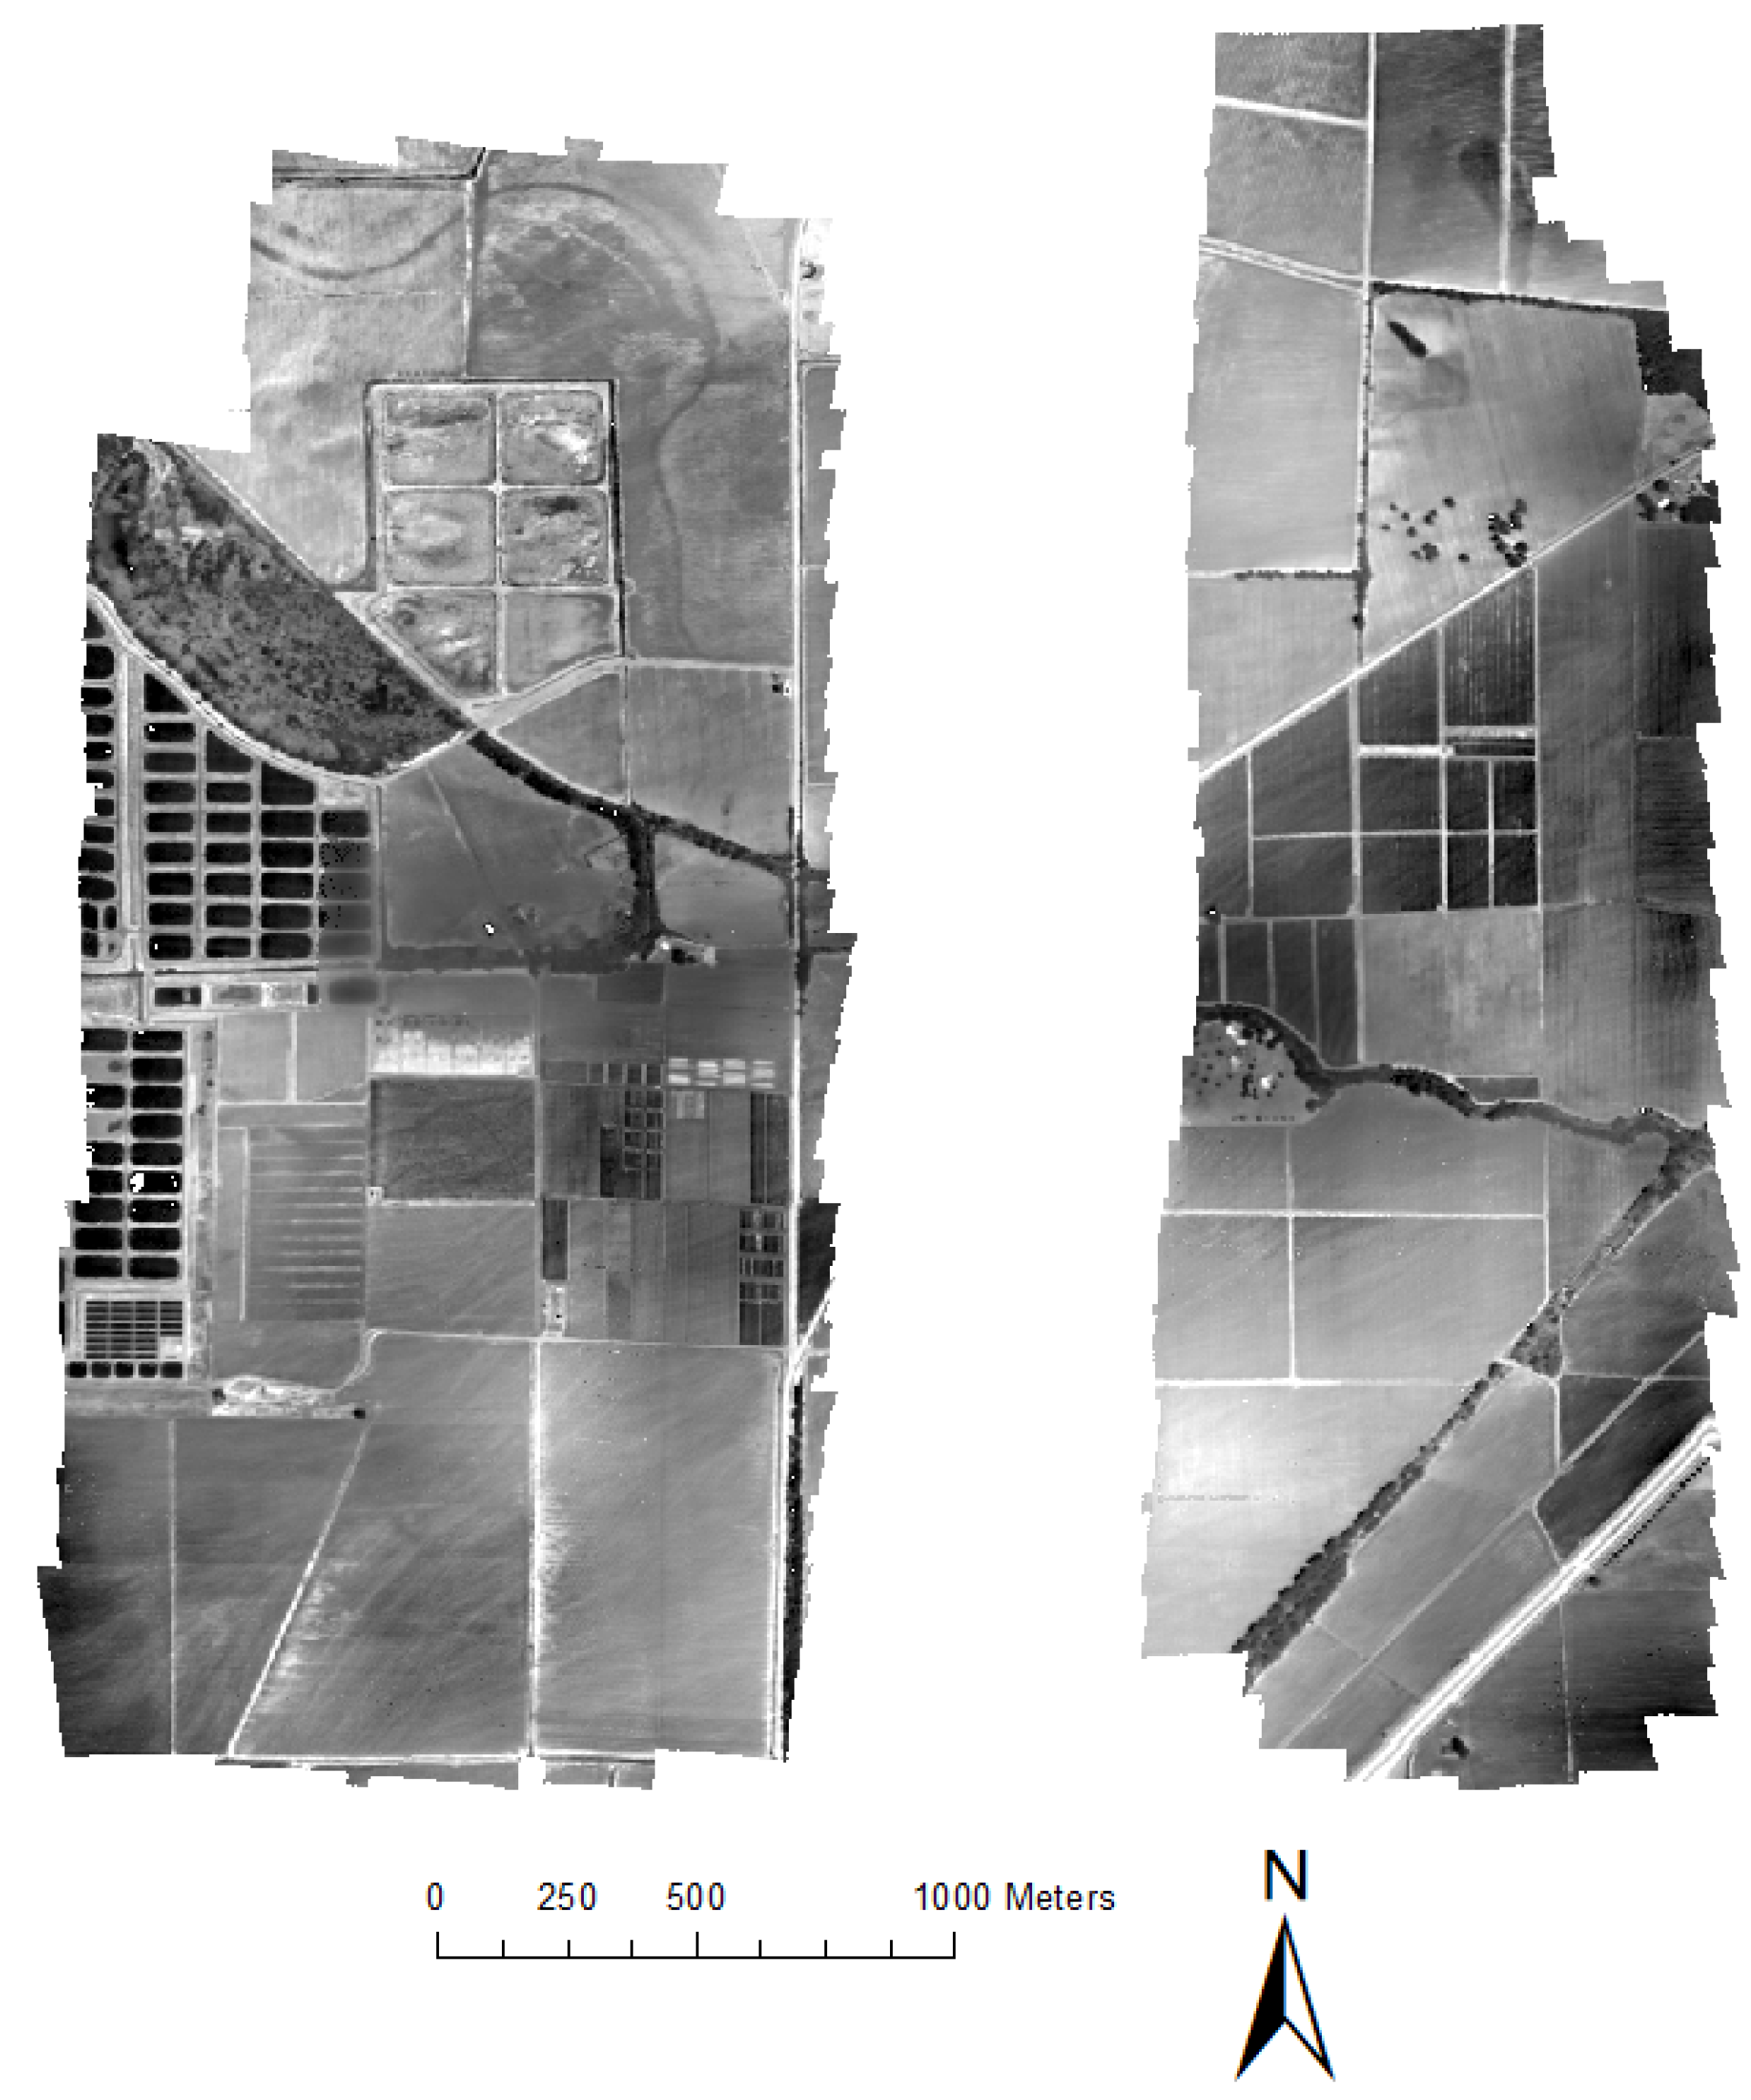
Figure 3 shows the orthomosaic thermal image over the USDA-ARS research farm area at Stoneville, Mississippi in May 2017. This image clearly indicated the thermal radiation (relative temperature difference) over vegetated corn fields and soybean and cotton seedling fields in a typical May crop growth in this area. This resolution of the thermal images is much coarser than the GoPro’s, but it is comparable with the imagery of high-resolution satellites in multispectral bands.
Since 2012, UAVs have been used to fly over about 12 fields at various sizes, from 7K to 130K m2, in the farm area for low-altitude remote sensing of crop growth monitoring. The fields flown by UAVs were used to conduct various studies of precision agriculture, such as crop field surveys, crop field scouting, crop species identification, crop health mapping, and crop yield estimation.
Crop yield estimation or prediction is a conventional task of agronomy for crop production management. Traditionally, yield estimation is based on empirical or mechanistic crop modeling, using inputs of crop growth status, crop management, and weather/climate. In recent years, more remote sensing data and information, especially from UAVs, are generated for creating innovative approaches for improved crop yield estimation. Crop plant height is also an important indicator of crop yield potential. To estimate crop plant height, images collected on a UAV are processed for 3D point cloud data. With interpolation of 3D point clouds, a digital terrain model (DTM) and a digital surface model (DSM) can be calculated based on UAV photogrammetry integrated with a structure from motion (SfM) technique. The difference in DSM and DTM provides the data for crop plant height estimation from UAV image data. This method has been used to estimate soybean and cotton plant heights in the fields of the research farm area, and the estimated plant heights were used to estimate crop yields [40,41].
Furthermore, UAV-based remote sensing could help improve crop yield estimation based on agronomic principles. In agronomy, crop yield can be estimated using measured yield components [42]. For example, yield of crops such as sorghum can be estimated based on effective panicle number per unit area, average number of grains per panicle, seed setting rate, and single grain weight. Among these components, effective panicle number per unit area and spikelet number per panicle play the most important role in yield formation. With high-resolution UAV imagery of crop fields, highly accurate characterization of plant yield components is possible. With UAV image data, 3D crop canopy models over the field can be built to recognize and count the yield components, such as panicle and spikelet, using the recognition, classification, and analysis of pattern recognition algorithms. With the recognition and counting data, a special spikelet index can be quantified to monitor the spikelet number of the crop in the flowering stage for yield.
Within this aspect, a study was conducted in a cotton field of 65K m2 in the research farm area at Stoneville, Mississippi to segment cotton bolls from the background of the UAV digital images of the defoliated cotton field just prior to harvest. Cotton yield was estimated with the estimated cotton plot unit coverage as the image metric, defined as a ratio for a cotton unit coverage (CUC) in each field plot, as shown in [41]:
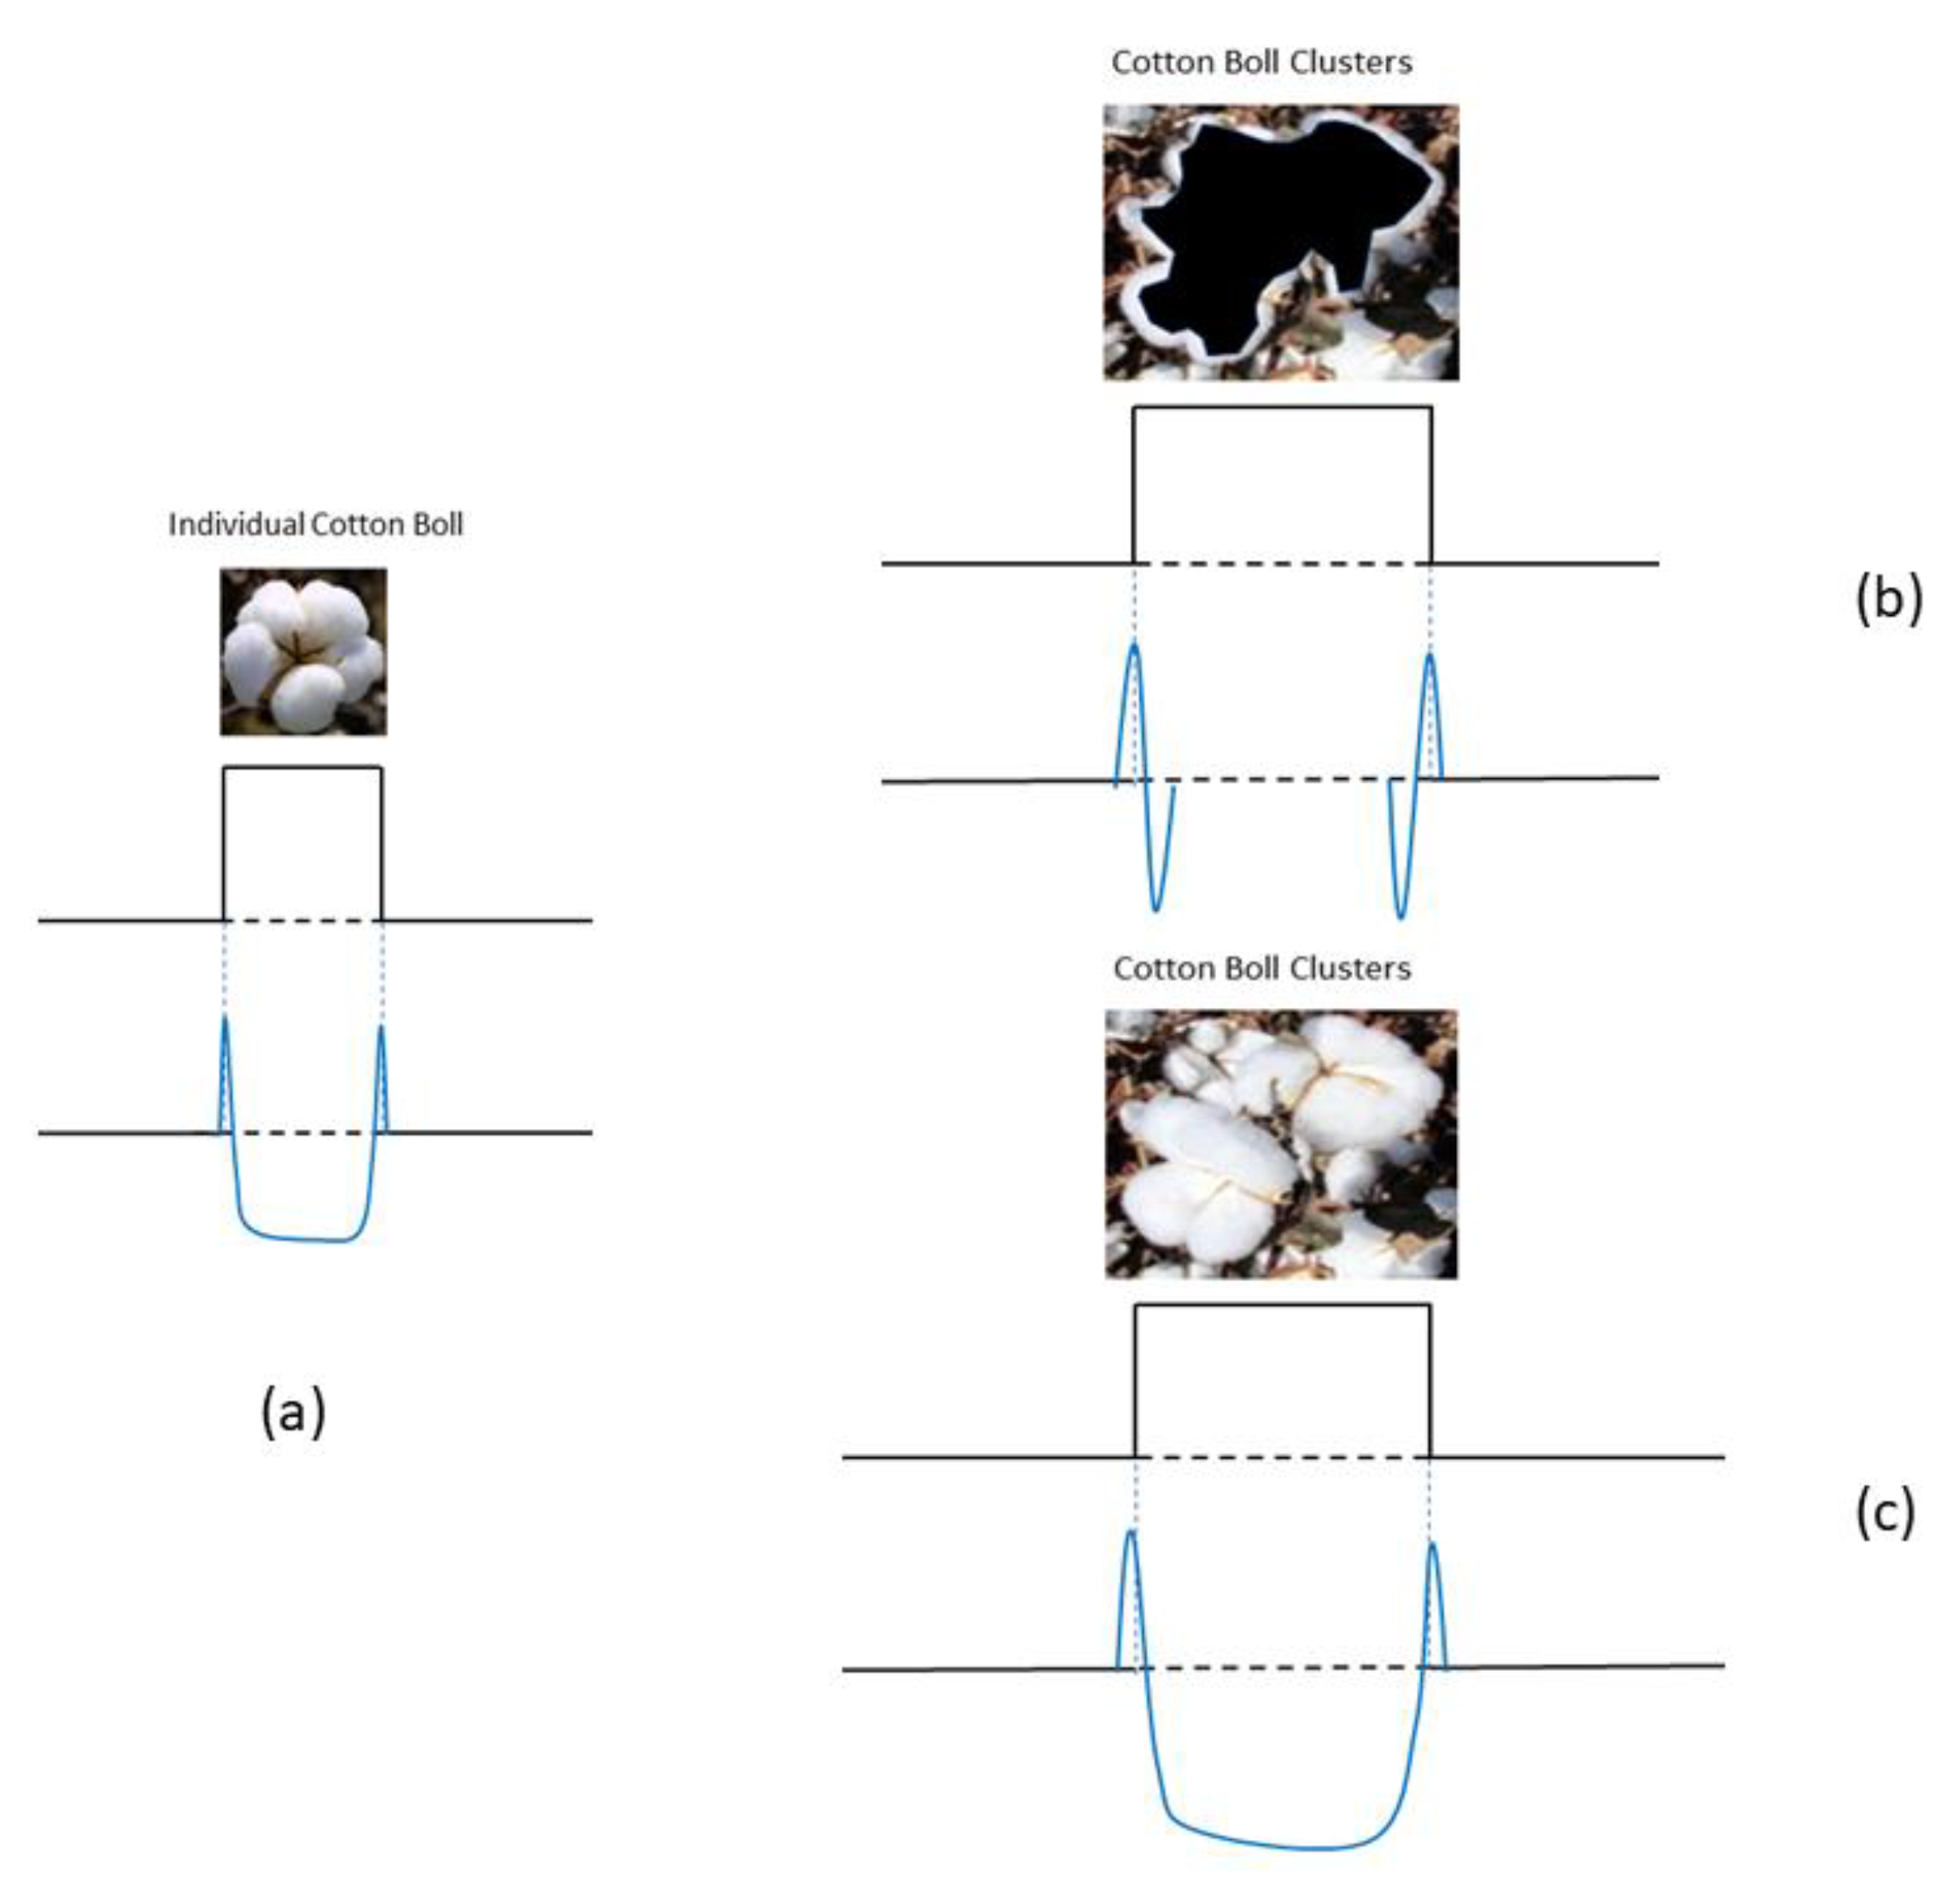
where is the number of cotton boll pixels in an experimental plot unit and is the number of pixels in the plot unit area. The ratio can be calculated using the number of cotton boll pixels in a field plot divided by the number of pixels in the plot area. In this study, it was initially assumed that cotton bolls are globally brighter (white) and the method of RGB thresholding was directly used for image processing, but the correlation between the yield and the CUC was low (0.3), which might be because of the background interference of soil, defoliated cotton leaves and dead cotton stems/branches, and occluded cotton bolls. Therefore, cotton bolls were further assumed, as they are only locally brighter. Based on this assumption, Laplacian of the RGB images was conducted, and this increased the correlation (to 0.58) because this only worked for small bolls, while large bolls missed the fill-up in the enclosures because Laplacian of images is basically for edge detection (Figure 4). Then, thresholding of Laplacian of Gaussian (LoG) of the UAV images was applied to completely segment out the cotton bolls and boll clusters to accurately quantify the CUC for cotton yield estimation with relatively high correlation (0.86) (Figure 5).
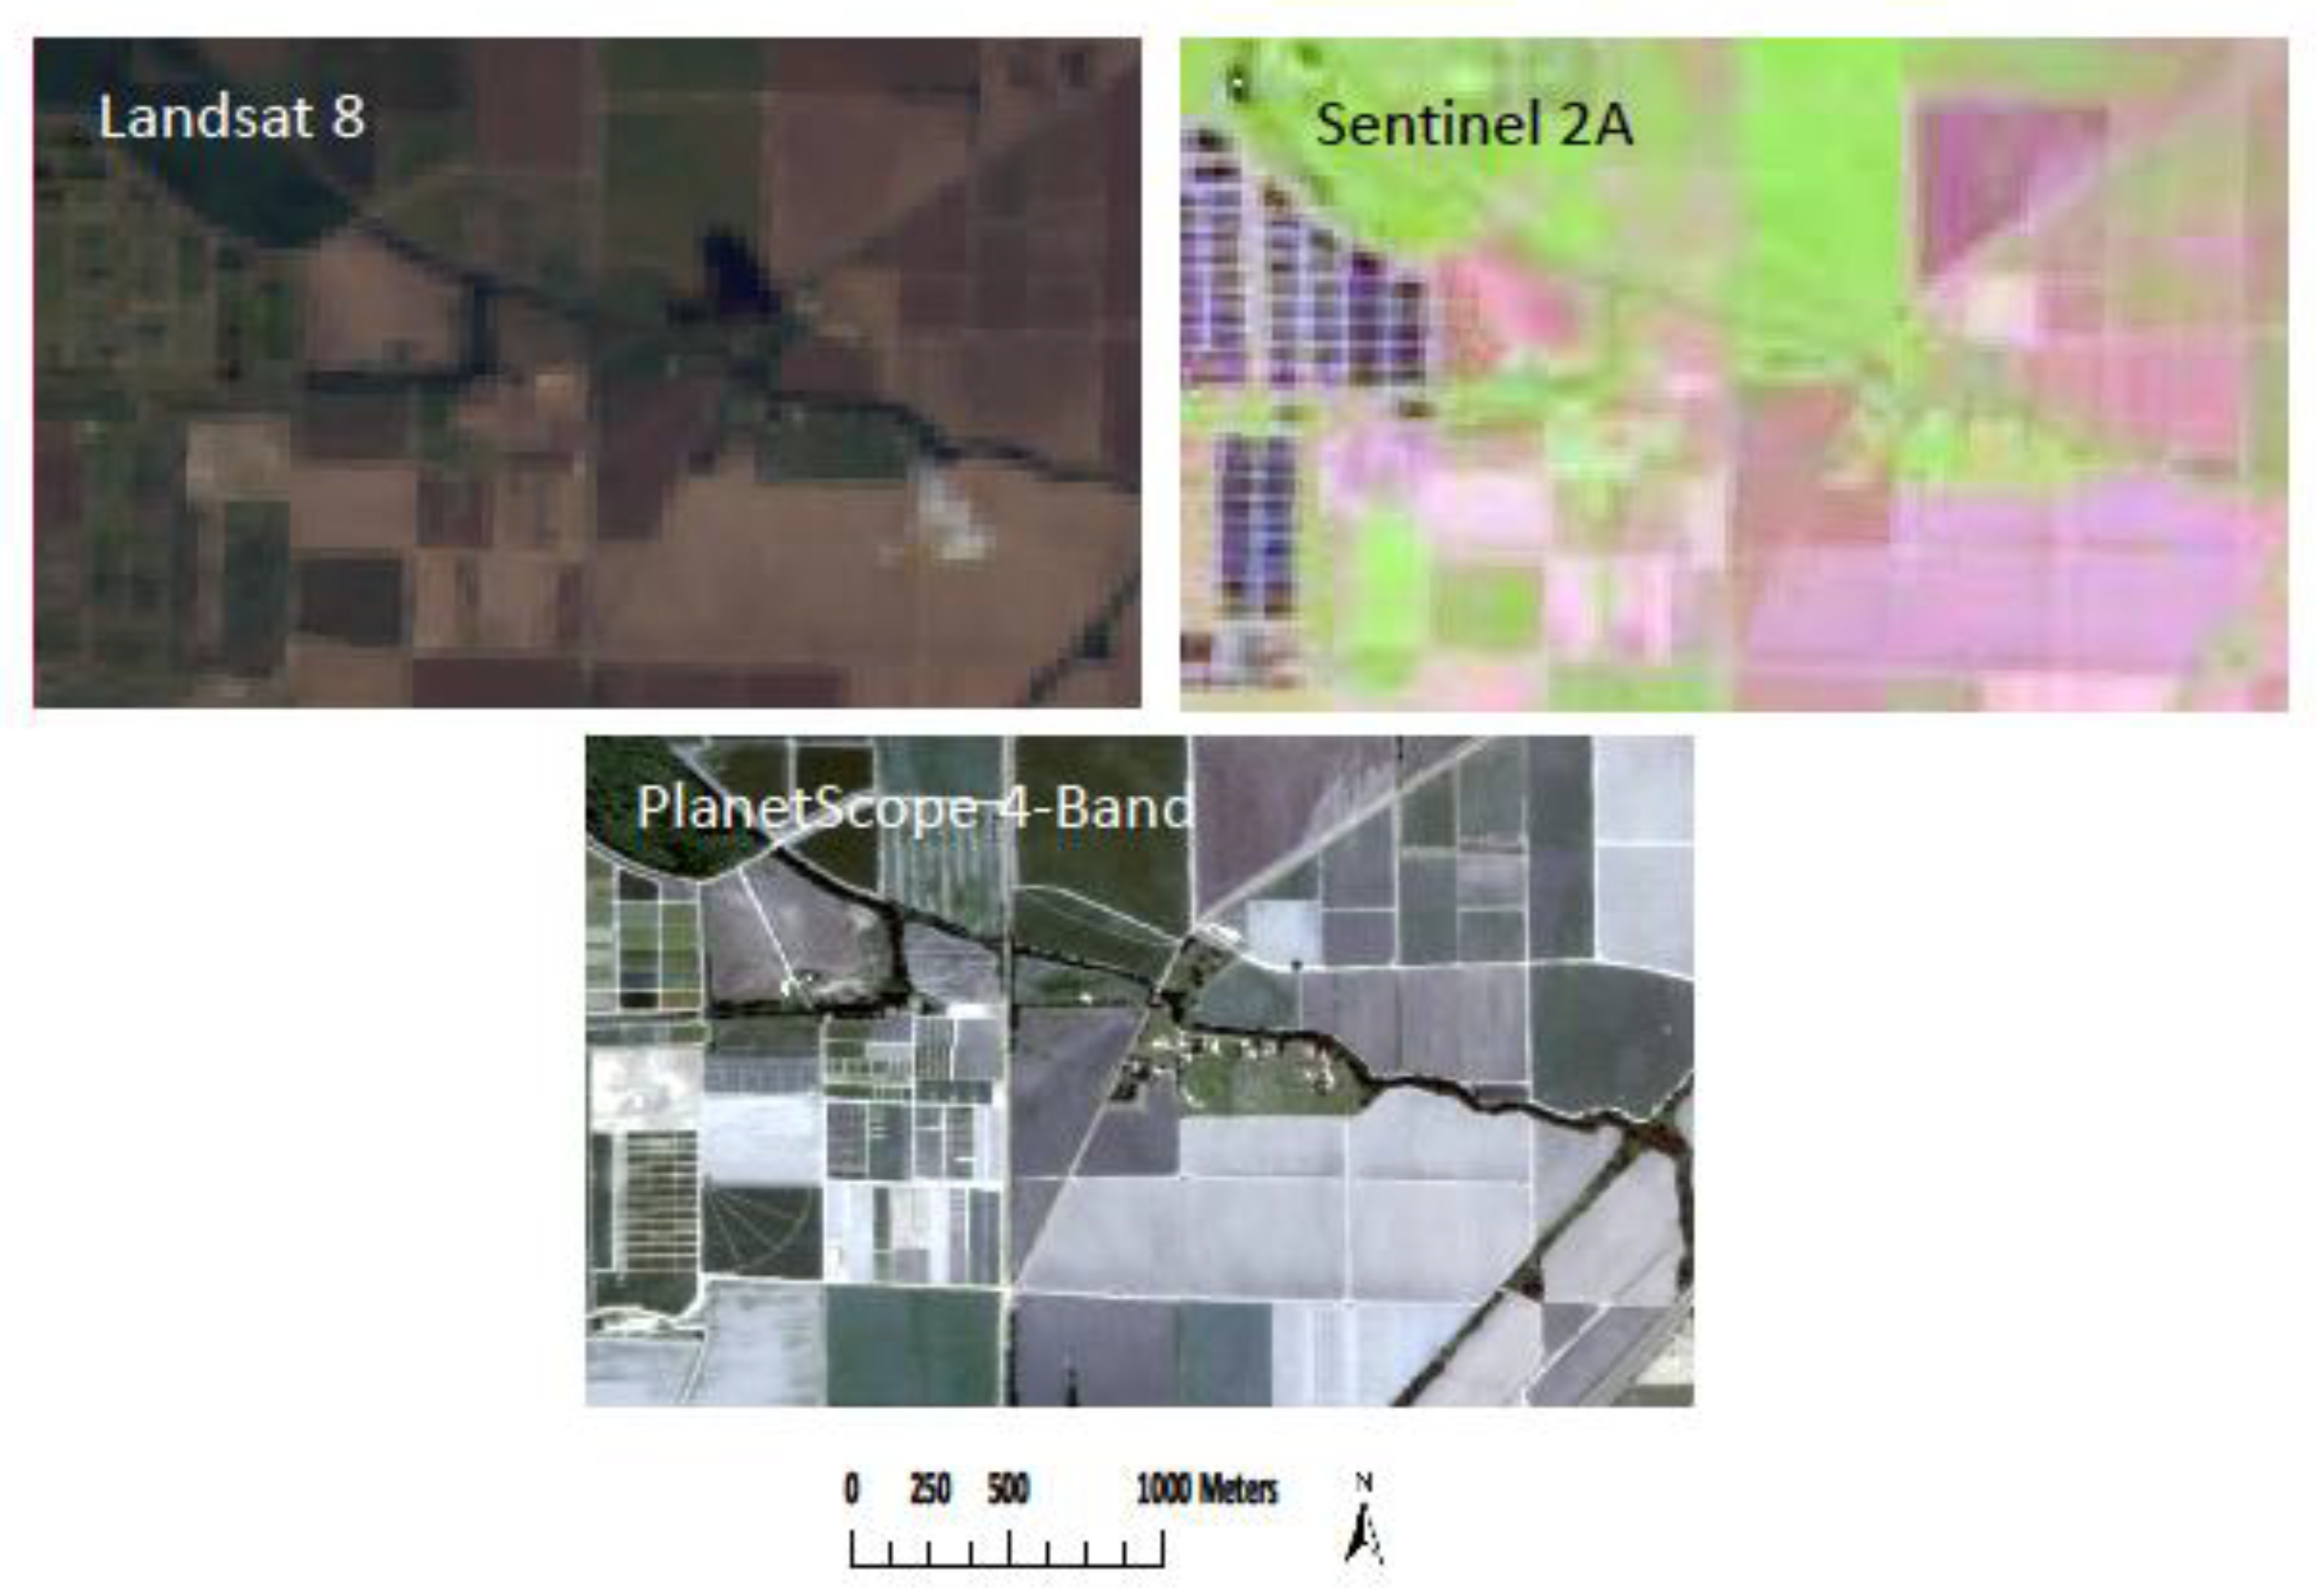
Figure 6 shows the multispectral imagery of Landsat 8, Sentinel 2A, and PlanetScope over the Stoneville, Mississippi research area in September 2016. In Figure 2, the relatively high resolution of the manned aircraft images can clearly delineate the boundaries of the fields, and even differentiate the variation within the fields with. However, in Figure 6, the satellite images all have coarser resolutions compared with airborne images, but each of them still has its own function for the area of remote sensing. To cover this area of crop fields, Landsat 8 imagery can roughly delineate the boundaries of the sections of the fields to differentiate types of vegetation (crops and weeds) over the area. Sentinel imagery can delineate the boundaries of the fields for improved differentiation of vegetation types. PlanetScope imagery can clearly delineate the boundaries of the fields but is limited to differentiate the within-field variations, which can be overcome by airborne platforms, manned aircraft, and UAVs.
4.2. Brooksville, Mississippi
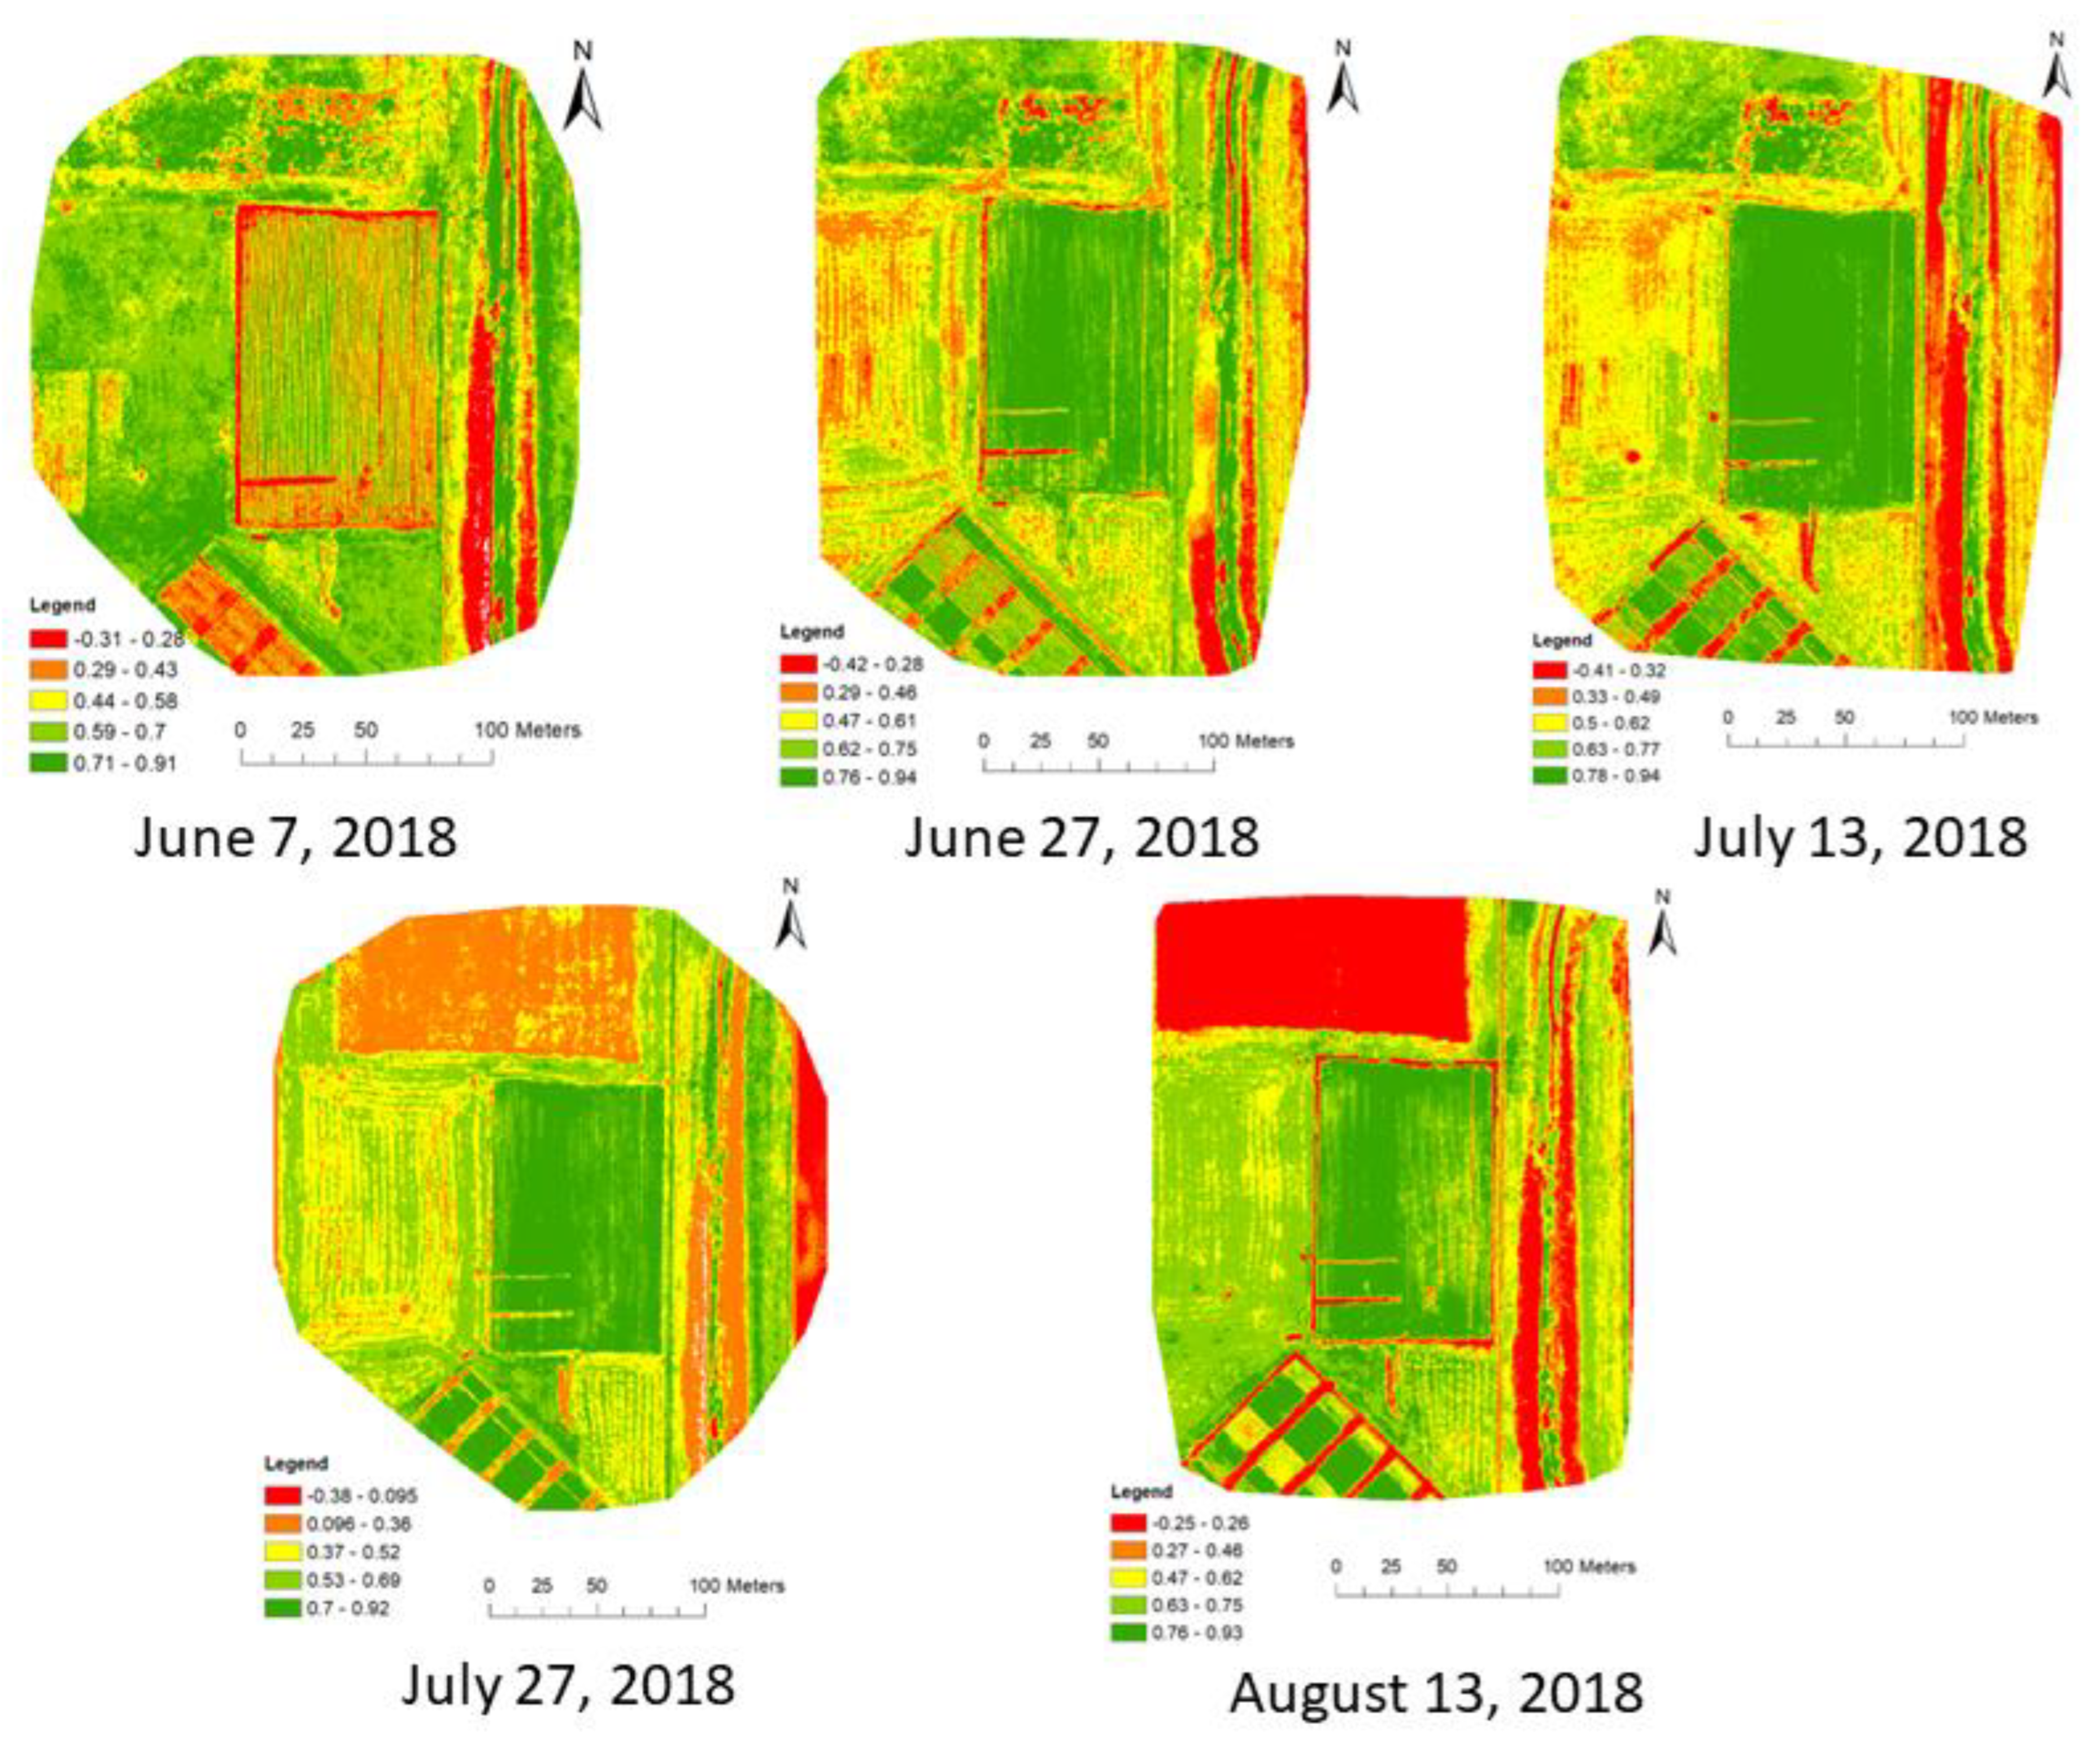
UAV remote sensing was conducted in 2018 and 2019 at Brooksville, Mississippi in a field of 9K m2 within the farm area, although the data are limited, for the irrigation study of a soybean field. In 2018, five days were successful for UAV imaging flyovers, 7 June, 27 June, 13 July, 27 July, and 13 August. In 2019, only two days were successful, 3 June and 1 August. Figure 7 shows the UAV NDVI images of 2018 for the soybean field in the research farm area at Brooksville, Mississippi, calculated from the acquired multispectral images. These time series of NDVI images indicate the phenology of the soybean growth from vegetative to reproductive stages, with highest vegetation vigor indicated on 27 July.
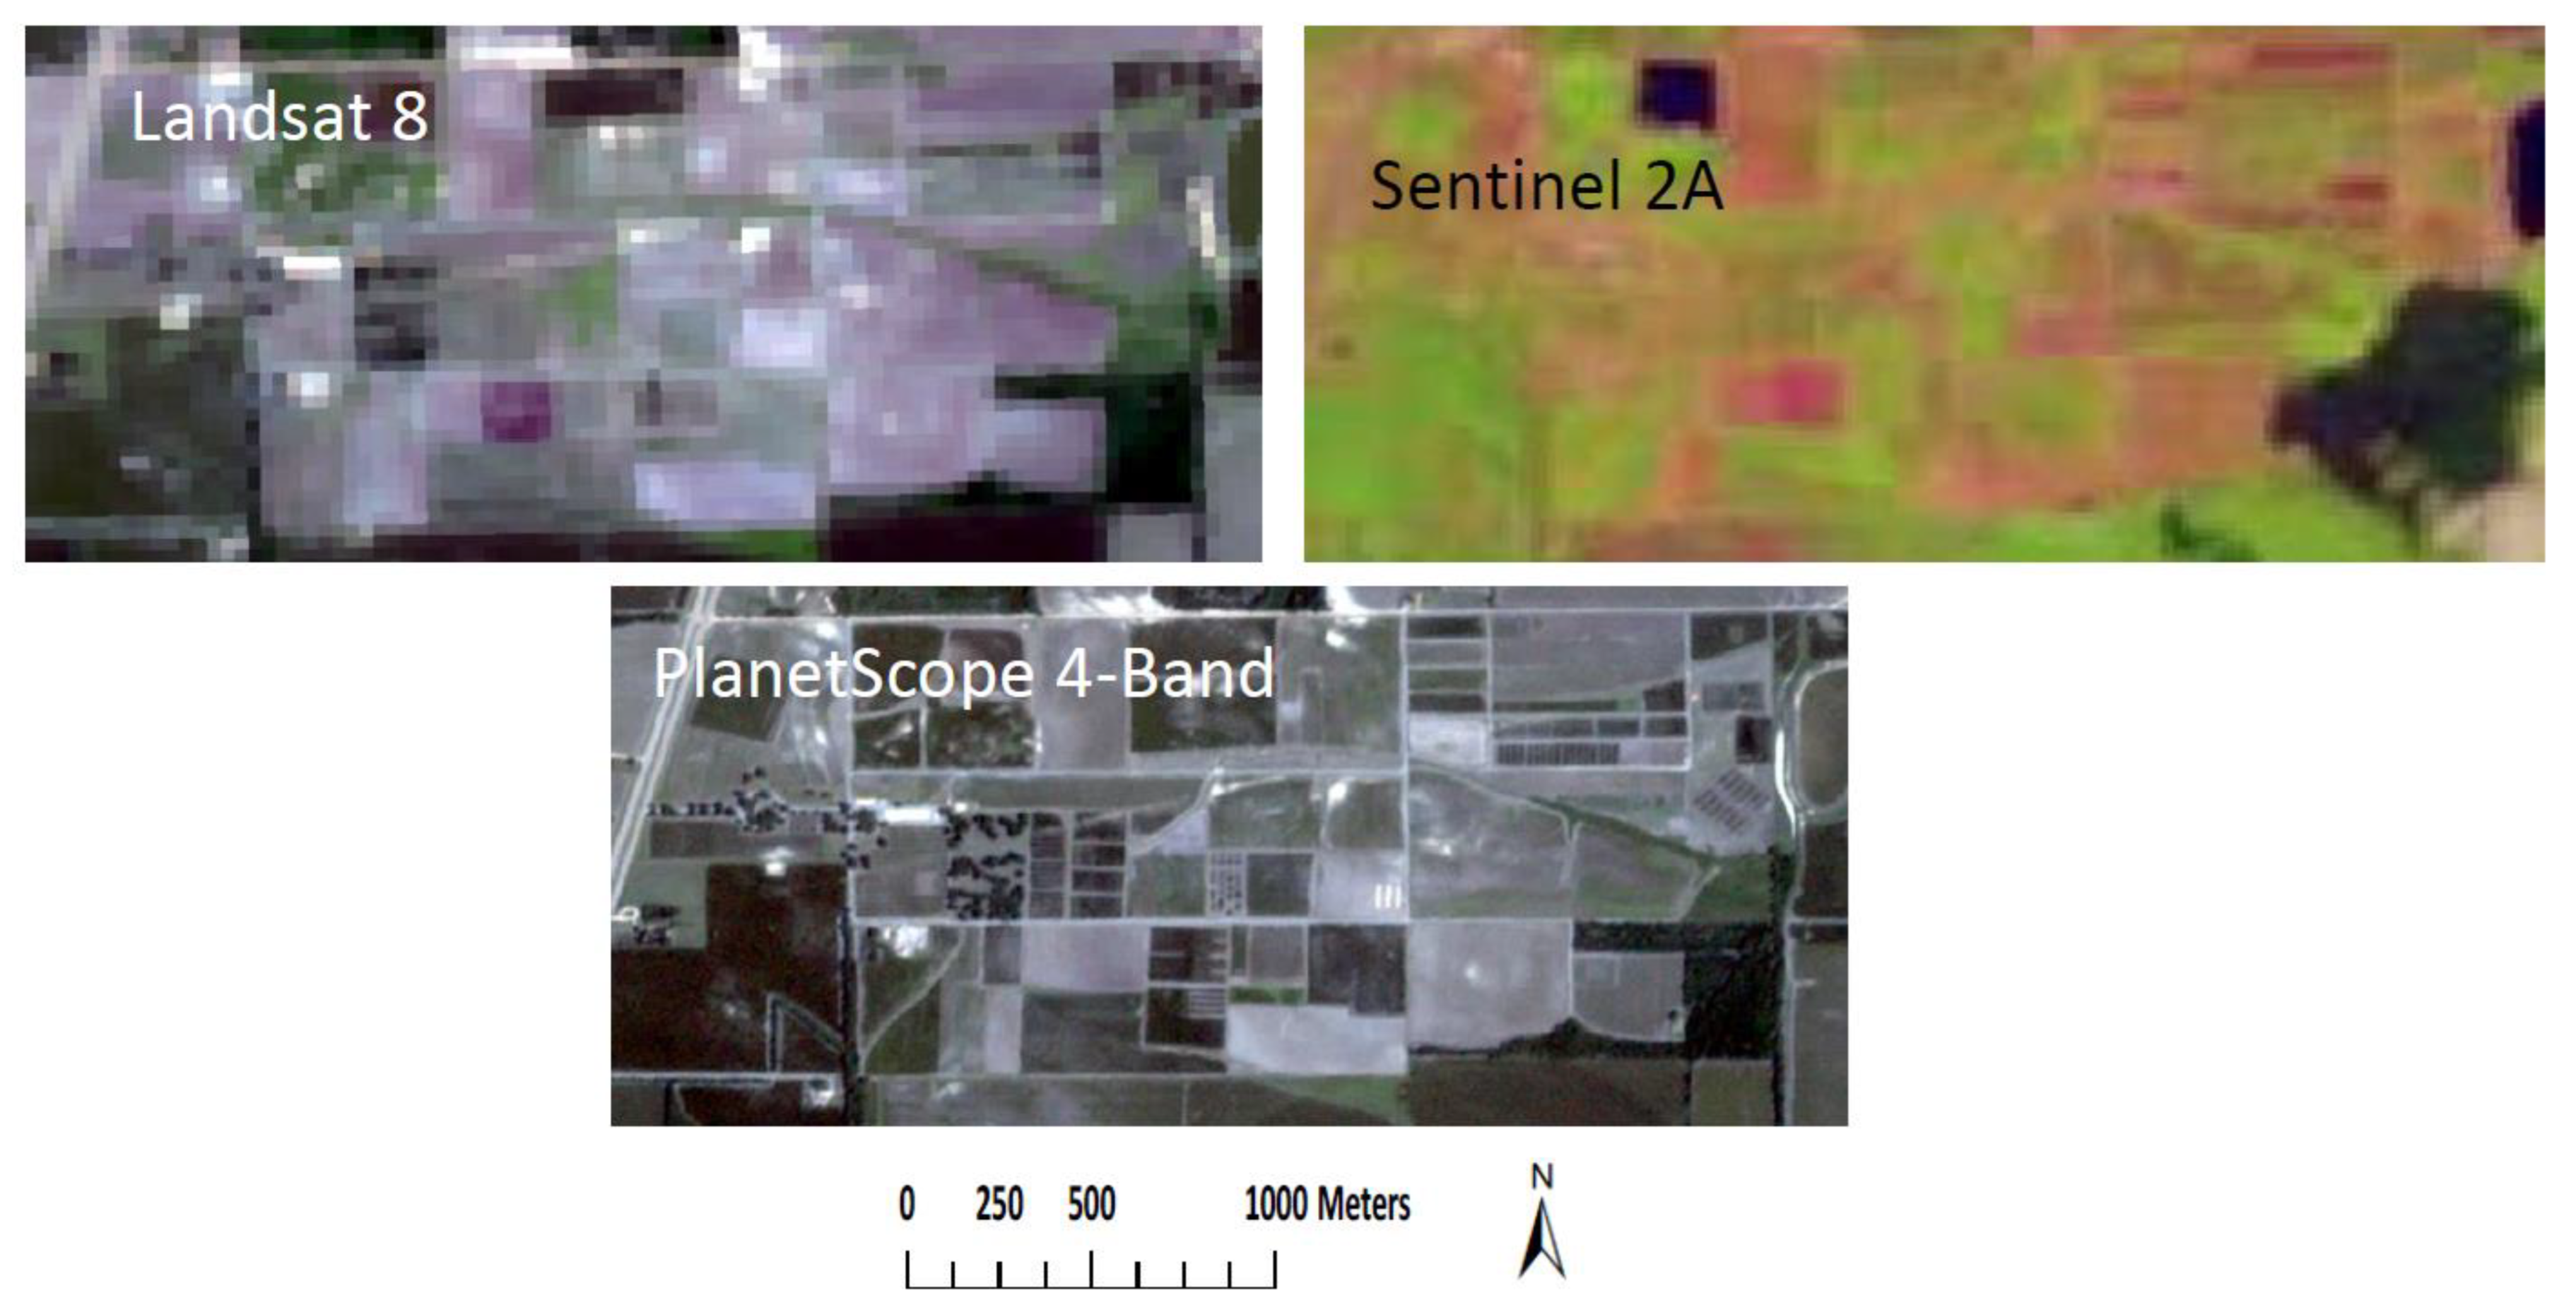
Landsat 8 imagery is typically limited for cloudless data. In 2018, only four days of images, 7 June, 16 June, 2 July, and 20 September, were cloudless to cover the research farm area. However, the 30 m spatial resolution of the images was not sufficient to clearly delineate the boundary of the field. Further, the imagery of Sentinel-2 is typically more available for cloudless data, with more frequent revisit times. For example, in 2018, there were 24 days of cloudless images from January to September to cover the research farm area. With the 10 m spatial resolution of the Sentinel-2 images, the boundaries of the fields within the farm area can be clearly delineated, but not the rows within the fields. Lastly, there are even more PlanetScope images available to clearly cover the fields in the research farm area. In 2018, 118 days of cloudless images from January to September were found to cover the farm area. With 3 m spatial resolution, the images can delineate the boundaries of the fields and identify features and variations over the fields—although the rows still cannot be differentiated within the field—which may be good enough to discriminate the plot treatments of the experiment in conjunction with the high-resolution UAV images. In the concerned soybean field, an irrigation study was conducted with two treatments, rainfed and irrigated, replicated with four plots for each treatment in 2018. Figure 8 shows the multispectral imagery of Landsat 8, Sentinel 2A, and PlanetScope over the research farm area in 2018.
4.3. Pontotoc, Mississippi
UAV remote sensing was conducted in 2017, 2018, and 2019 for cover crop studies at Pontotoc, Mississippi. Among the studies, a soybean field of 14K m2 in the research farm area was focused on with UAV remote sensing. For the soybean field study, in 2017, five days were successful for flyovers, 24 July, 8 August, 17 August, 5 September, and 18 September. In 2018, nine days were successful, 1 May, 22 May, 20 June, 3 July, 10 July, 16 July, 1 August, 8 August, and 22 August. In 2019, four days were successful, 27 March, 11 June, 6 August, and 21 August. Figure 9 shows the UAV NDVI images from 2018 of the soybean field in the research farm area at Pontotoc, Mississippi, calculated from the acquired multispectral images. These time series of NDVI images indicate the phenological difference of the soybean planted one month apart in two different field plot areas with overall highest vegetation vigor indicated on 3 July.
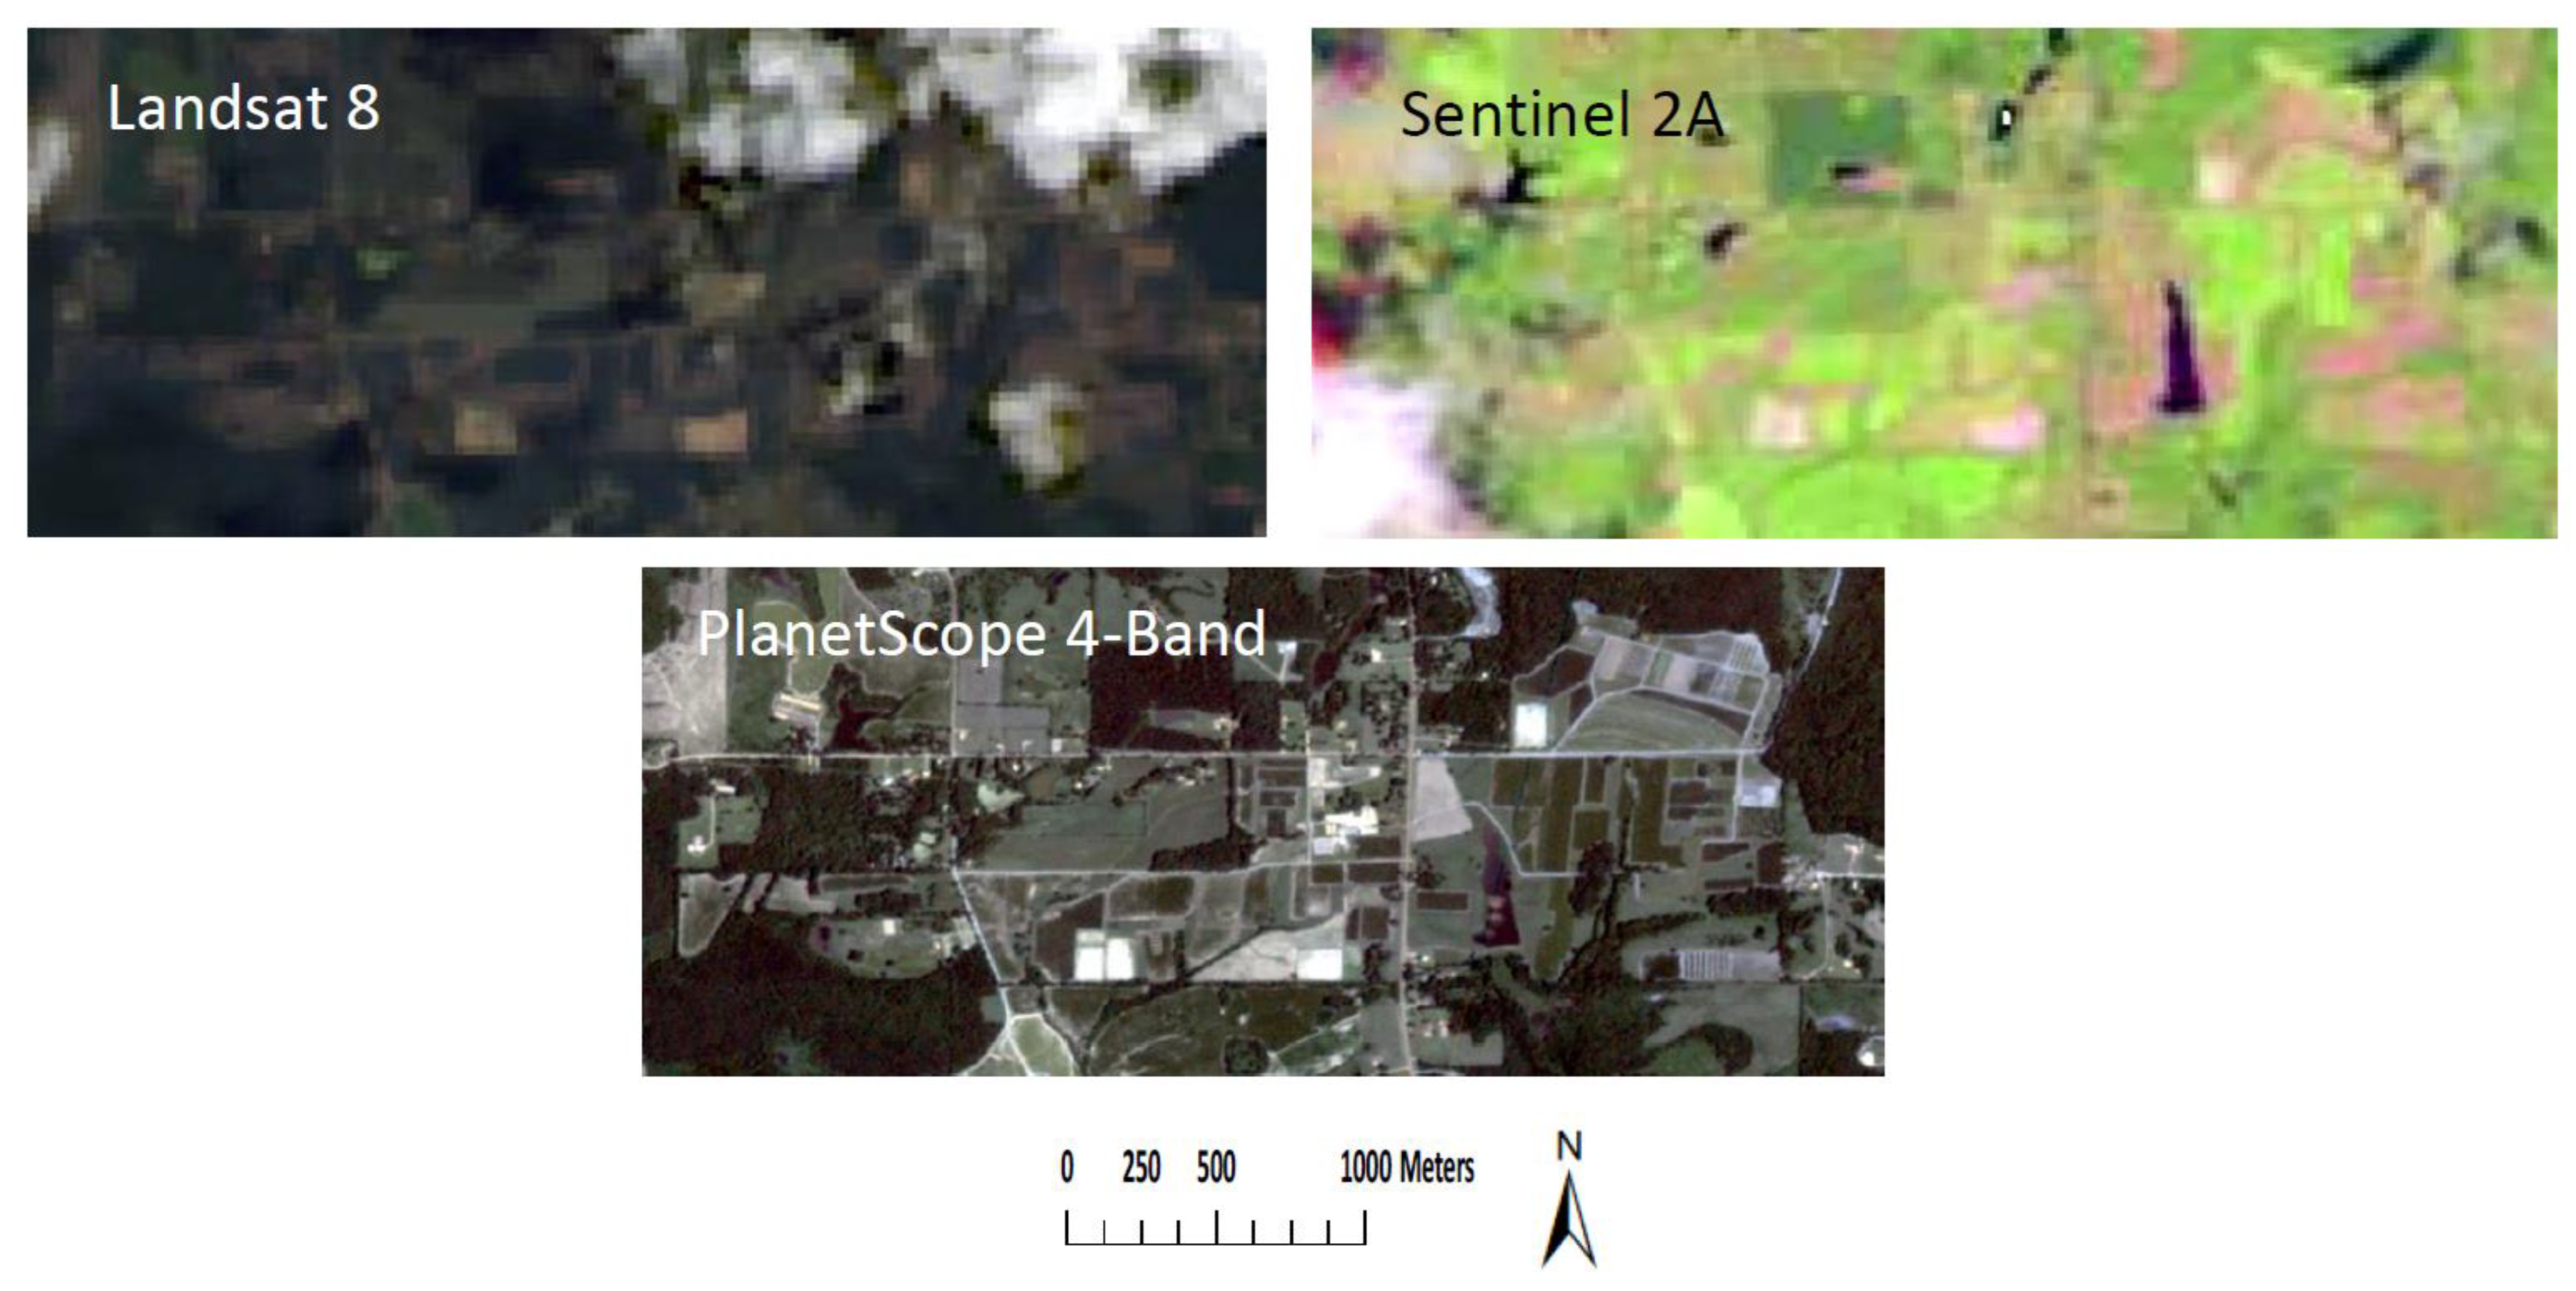
Figure 10 shows the multispectral imagery of Landsat 8, Sentinel 2A, and PlanetScope over the research farm area at Pontotoc, Mississippi in 2018. Similar to the case at Brooksville, Mississippi, Landsat 8 imagery is limited for cloudless data, as shown in the figure, and the 30 m spatial resolution of the images is not sufficient to clearly delineate the boundary of the field. The imagery of Sentinel-2 is more available for cloudless data, and with the 10 m spatial resolution, the Sentinel-2 images can clearly delineate the boundaries of the fields within the farm area, but not the rows within the fields. Additionally, there are even more PlanetScope images available to clearly cover the fields in the research farm area, and with 3 m spatial resolution, the images can delineate the boundaries of the fields and identify features and variations over the fields, although the rows still cannot be differentiated within the field, which may be good enough to discriminate the plot treatments of the experiment in conjunction to the high-resolution UAV images. In the concerned soybean field area, a study has been conducted with soybeans planted one month apart in two different field plot areas with the treatments of five cover crops, three fertilizers, and four replications for two different planting dates.
5. Discussion of Issues and Challenges
With all the cases demonstrated above, issues and challenges of remote sensing from different sources can be identified as follows:
- Spatial resolution
For satellite imagery, Landsat data, with its 30 m spatial resolutions, 250 m, are limited to delineate the boundary of the crop fields at the three locations. Sentinel-2 and Planet imagery, with higher spatial resolutions (10 m and 3 m, respectively), can delineate the boundary of the fields, and even be discriminate the features and variations within the fields. Therefore, satellite imagery may be used to complement when the UAVs miss some days or some part of the field area.
- 2.
- Signal inconsistency
Because of the atmospheric effect, the attenuation of reflectance signals to the remote sensors, and sensor factors, the remote sensing data from different sources may not be consistent in observing in order to characterize the same area of earth using NDVI or any other vegetation indices [29]. Landsat data are good for regional studies. At the field scale, 5-cm resolution UAV NDVI was more accurate than 10-m Sentinel-2 NDVI for measuring vineyard variability [43]. UAV-derived NDVI was found more effective in tracking forest canopy phenology than Landsat-derived NDVI [44].
- 3.
- Cloud cover
Cloud cover over study areas is an issue for the use of satellite imagery in the growth season, especially in the summer of the year in the humid study areas. Planet has high revisiting cycles, increasing the possibility to capture cloudless imagery. Sentinel-2 is acceptable in this aspect too, but Landsat may not guarantee provision of useable imagery from June to August in our study areas.
- 4.
- Limits of UAV imaging sensors
Although UAS imaging sensors can offer high-resolution products, the quality of the sensors varies greatly [45]. The satellite systems typically have been thoroughly calibrated into different levels of products. However, various commercially available UAV-based multispectral NDVI capable sensors (cameras) may involve substantial geometric and radiometric errors, which may need further calibration and correction to improve. UAV imagery has high spatial resolutions. Therefore, even a small error in the viewing angle of a single lens could cause unacceptable geometric distortions between the NIR and red bands to produce biased NDVI.
- 5.
- Limits of UAV imagery
Even for a small field, a UAV imaging system needs to acquire multiple images during a period of time, then a mosaicking of the multiple images is needed to fully visualize the field, and the resulting image mosaic may contain unignorable geometric and radiometric mismatches due to unmatched features and projections between images and lapses of imaging time of different images.
6. Summary and Future Work
This paper indicated that different sources of remote sensing data, such as satellites, manned aircraft, or UAVs, are not consistent and performed differently, although they are somewhat correlated. Spatial resolution decides the scope of the application of the data from each source. Cloud cover is an issue, especially for the satellites with long revisit time. UAVs have great potential for high-performance monitoring of crop growth. However, they have limits in varied sensor quality and image mosaicking for unignorable geometric and radiometric mismatches. So too do the manned aircraft-based sensors and images. Satellite systems are typically thoroughly calibrated geometrically and radiometrically. Satellite and manned aircraft images can cover large areas at one time and can be integrated to monitor the field area. Although the spatial resolution of Landsat is not good enough for the fields in this study, if the larger areas surrounding the fields are considered, the products of Landsat (monitoring and classification) are good sources to show general vegetation profiles of the area, and then the data can be scaled down to the specific area and fields with Sentinel-2, PlanetScope, manned aircraft, and/or UAVs if necessary. This is advantageous in that the study of a field can be opened to associate with the surrounding environment and ecology and properly uses the data sources.
Remote sensing crop growth monitoring is a critical component of precision agriculture technology and has a potential to enhance crop growth management in nutrient status determination, irrigation schedule, weed/pest control, irrigation scheduling, and harvesting planning to boost crop yield, increase resource use efficiency, and minimize negative environmental impact. Various remote sensing systems with corresponding decision support models are continuously attracting more attention locally and areawide with climate change. Remote sensing research has a need to develop integrated platforms and corresponding data pipelines for crop production management decision support. The integrated systems will enable more accurate characterization of crop growth status at optimal spatiotemporal resolution. Therefore, to improve remote sensing crop growth monitoring, different sources of remote sensing data should be coordinated and integrated or fused to build a paradigm of multisource remote sensing. This new paradigm should consider the spatial, spectral, and temporal factors in the sense of optimization for a specific focus of concerned field areas.
To develop multisource remote sensing for crop monitoring in the area and other similar areas, remotely sensed images from different sources for the same area can be processed to fully extract features and information from the images from different sources, and the extracted features and information can be further integrated into a resulting image that contains rich spectral information and spatial details. This process involves multisource remote sensing data fusion, which can be conducted at different levels:
- Pixel level, which is conducted to merge images from different sources pixel by pixel by a certain scheme for a new image as an independent product or input of the model;
- Feature level, which is conducted to merge features extracted from images from different sources by a certain scheme, such as fused NDVI, for a new feature image as an independent product or input of the model;
- Decision level, which is conducted to combine the outputs of different image analytic models.
This development will provide a more accurate data basis for advanced remote sensing image classification, target detection, and spectral analysis for improved crop growth remote sensing monitoring for precision crop production management in the area of lower northern Mississippi and hopefully other similar areas.
Author Contributions
Conceptualization, Y.H.; methodology, Y.H.; software, Y.H.; formal analysis, Y.H.; investigation, Y.H.; data curation, Y.H.; writing—original draft preparation, Y.H.; writing—review and editing, G.F., H.T. and M.W.S. All authors have read and agreed to the published version of the manuscript.
Funding
This research received no external funding.
Institutional Review Board Statement
Not applicable.
Informed Consent Statement
Not applicable.
Data Availability Statement
Data are available upon request from the first author but subject to agency’s rules and regulation.
Acknowledgments
Thanks to Ryan Poe for installing, configurating, and operating the imaging system with different cameras on Air Tractor 402B and UAVs for flyovers in Stoneville MS, and Jay Munyon for operating UAVs for imaging over the sites in Brooksville and Pontotoc, MS.
Conflicts of Interest
The authors declare no conflict of interest.
References
- Neblette, C.B. Aerial photography for the study of plant diseases. Photo-Era Mag. 1927, 58, 346. [Google Scholar]
- Taubenhaus, J.J.; Ezekiel, W.N.; Neblette, C.B. Airplane photography in the study of cotton root rot. Phytopathology 1929, 19, 1025–1029. [Google Scholar]
- Steddom, K.; Jones, D.; Rush, C. A Picture is Worth a Thousand Words. Am. Phytopathol. Soc. 2005. Available online: https://www.apsnet.org/edcenter/apsnetfeatures/Pages/RemoteSensing.aspx (accessed on 7 April 2021).
- Colwell, R.N. Determining the prevalence of certain cereal crop diseases by means of aerial photography. Hilgardia 1956, 26, 223–286. [Google Scholar] [CrossRef]
- Lo, C. Applied Remote Sensing; Longman Group UK Limited: London, UK, 1986. [Google Scholar]
- Cracknell, A.P. The development of remote sensing in the last 40 years. Int. J. Remote Sens. 2018, 39, 8387–8427. [Google Scholar] [CrossRef]
- Orusa, T.; Orusa, R.; Viani, A.; Carella, E.; Borgogno Mondino, E. Geomatics and EO data to support wildlife diseases assessment at landscape level: A pilot experience to map infectious keratoconjunctivitis in chamois and phenological trends in Aosta Valley (NW Italy). Remote Sens. 2020, 12, 3542. [Google Scholar] [CrossRef]
- Carella, E.; Orusa, T.; Viani, A.; Meloni, D.; Borgogno-Mondino, E.; Orusa, R. An integrated, tentative remote-sensing approach based on NDVI entropy to model canine distemper virus in wildlife and to prompt science-based management policies. Animals 2022, 12, 1049. [Google Scholar] [CrossRef]
- Misbah, K.; Laamrani, A.; Khechba, K.; Dhiba, D.; Chehbouni, A. Multi-sensors remote sensing applications for assessing, monitoring, and mapping NPK content in soil and crops in African agricultural land. Remote Sens. 2022, 14, 81. [Google Scholar] [CrossRef]
- Zhang, N.; Wang, M.; Wang, N. Precision agriculture: A worldwide overview. Comput. Electron. Agric. 2002, 36, 113–132. [Google Scholar] [CrossRef]
- Huang, Y.; Brown, M. Advancing to the next generation precision agriculture. In Agriculture & Food Systems to 2050–Global Trends, Challenges and Opportunities; World Scientific Publishing: Singapore, 2018; pp. 285–314. [Google Scholar]
- Mulla, D.J. Twenty five years of remote sensing in precision agriculture: Key advances and remaining knowledge gaps. Biosyst. Eng. 2013, 114, 358–371. [Google Scholar] [CrossRef]
- Sishodia, R.P.; Ray, R.L.; Singh, S.K. Applications of remote sensing in precision agriculture: A review. Remote Sens. 2020, 12, 3136. [Google Scholar] [CrossRef]
- Huang, Y.; Thomson, S.J.; Hoffman, W.C.; Lan, Y.; Fritz, B.K. Development and prospect of unmanned aerial vehicles for agricultural production management. Int. J. Agric. Biol. Eng. 2013, 6, 1–10. [Google Scholar]
- Yang, G.; Liu, J.; Li, Z.; Huang, Y.; Yu, H.; Xu, B.; Yang, X.; Zhu, D.; Zhang, X.; Zhang, R. The application of flexible unmanned aerial vehicle remote sensing for field-based crop phenotyping: Current status and perspectives. Front. Plant Sci. 2017, 8, 1–26. [Google Scholar]
- Huang, Y.; Reddy, K.N.; Fletcher, R.S.; Pennington, D. UAV low-altitude remote sensing for precision weed management. Weed Technol. 2018, 32, 2–6. [Google Scholar] [CrossRef]
- Barbedo, J.G.A. A Review on the Use of Unmanned Aerial Vehicles and Imaging Sensors for Monitoring and Assessing Plant Stresses. Drones 2019, 3, 40. [Google Scholar] [CrossRef] [Green Version]
- Thomson, S.J.; Hanks, J.E.; Sassenrath–Cole, G.F. Continuous georeferencing for video-based remote seeing on agricultural aircraft. Trans. ASAE 2002, 45, 1177–1189. [Google Scholar] [CrossRef]
- Thomson, S.J.; Zimba, P.V.; Bryson, C.T.; Alarcon-Calderon, V.J. Potential for remote sensing from agricultural aircraft using digital video. Appl. Eng. Agric. 2005, 21, 531–537. [Google Scholar] [CrossRef]
- Thomson, S.J.; Ouellet-Plamondon, C.M.; DeFauw, S.L.; Huang, Y.; Fisher, D.K.; English, P.J. Potential and challenges in use of thermal imaging for humid region irrigation system management. J. Agric. Sci. 2012, 4, 1–15. [Google Scholar] [CrossRef]
- Huang, Y.; Thomson, S.J.; Ortiz, B.V.; Reddy, K.N.; Ding, W.; Zablotowicz, R.M.; Bright, J.R., Jr. Airborne remote sensing assessment of the damage to cotton caused by spray drift from aerially applied glyphosate through spray deposition meas-urements. Biosyst. Eng. 2010, 107, 212–220. [Google Scholar] [CrossRef]
- Huang, Y.; Chen, Z.; Yu, T.; Huang, X.; Gu, X. Agricultural remote sensing big data: Management and applications. J. Integr. Agric. 2018, 17, 1915–1931. [Google Scholar] [CrossRef]
- Xue, J.; Su, B. Significant remote sensing vegetation indices: A review of development and applications. J. Sens. 2017, 2017, 1353691. [Google Scholar] [CrossRef]
- Camps-Valls, G.; Campos-Taberner, M.; Moreno-Martínez, A.; Walther, S.; Duveiller, G.; Cescatti, A.; Mahecha, M.D.; Muñoz-Marí1, J.; García-Haro, F.J.; Guanter, L.; et al. A unified vegetation index for quantifying the terrestrial biosphere. Sci. Adv. 2021, 7, eabc7447. [Google Scholar] [CrossRef] [PubMed]
- Peters, A.J.; Walter-Shea, E.A.; Ji, L.; Vina, A.; Hayes, M.; Svoboda, M.D. Drought monitoring with NDVI-based standardized vegetation index. Photogramm. Eng. Remote Sens. 2002, 68, 71–75. [Google Scholar]
- Immitzer, M.; Vuolo, F.; Atzberger, C. First Experience with Sentinel-2 Data for Crop and Tree Species Classifications in Central Europe. Remote Sens. 2016, 8, 166. [Google Scholar] [CrossRef]
- Filgueiras, R.; Mantovani, E.C.; Althoff, D.; Fernandes Filho, E.I.; Cunha, F.F.D. Crop NDVI monitoring based on Sentinel 1. Remote Sens. 2019, 11, 1441. [Google Scholar] [CrossRef]
- Li, C.; Li, H.; Li, J.; Lei, Y.; Li, C.; Manevski, K.; Shen, Y. Using NDVI percentiles to monitor real-time crop growth. Comput. Electron. Agric. 2019, 162, 357–363. [Google Scholar] [CrossRef]
- Huang, S.; Tang, L.; Hupy, J.P.; Wang, Y.; Shao, G. A commentary review on the use of normalized difference vegetation index (NDVI) in the era of popular remote sensing. J. For. Res. 2021, 32, 1–6. [Google Scholar] [CrossRef]
- Huang, Y. Agricultural aviation perspective on precision agriculture in the Mississippi delta. Smart Agric. 2019, 1, 12. [Google Scholar]
- Saini, R.; Ghosh, S.K. Crop classification on single date Sentinel-2 imagery using random forest and support vector machine. In Proceedings of the The International Archives of the Photogrammetry, Remote Sensing and Spatial Information Sciences, Volume XLII-5, 2018 ISPRS TC V Mid-term Symposium “Geospatial Technology–Pixel to People”, Dehradun, India, 20–23 November 2018. [Google Scholar]
- Sonobe, R.; Yamaya, Y.; Tani, H.; Wang, X.; Kobayashi, N.; Mochizuki, K. Crop classification from Sentinel-2-derived vege-tation indices using ensemble learning. J. Appl. Remote Sens. 2018, 12, 026019. [Google Scholar] [CrossRef]
- Segarra, J.; Buchaillot, M.L.; Araus, J.L.; Kefauver, S.C. Remote sensing for precision agriculture: Sentinel-2 improved features and applications. Agronomy 2020, 10, 641. [Google Scholar] [CrossRef]
- Yi, Z.; Jia, L.; Chen, Q. Crop classification using multi-temporal Sentinel-2 data in the Shiyang River Basin of China. Remote Sens. 2020, 12, 4052. [Google Scholar] [CrossRef]
- Song, X.; Huang, W.; Hansen, M.C.; Potapov, P. An evaluation of Landsat, Sentinel-2, Sentinel-1 and MODIS data for crop type mapping. Sci. Remote Sens. 2021, 3, 100018. [Google Scholar] [CrossRef]
- Blickensdörfer, L.; Schwieder, M.; Pflugmacher, D.; Nendel, C.; Erasmi, S.; Hostert, P. Mapping of crop types and crop sequences with combined time series of Sentinel-1, Sentinel-2 and Landsat 8 data for Germany. Remote Sens. Environ. 2022, 269, 112831. [Google Scholar] [CrossRef]
- Muñoz, J.; Pencue, L.; Figueroa, A.; Guzmán, C. Crop monitoring in high Andean ecosystems of the Upper Basin of the Palacé River using Planet images. In Advances in Information and Communication Technologies for Adapting Agriculture to Climate Change AACC′17 2017; Angelov, P., Iglesias, J., Corrales, J., Eds.; Advances in Intelligent Systems and Computing; Springer: Cham, Switzerland, 2017; Volume 687. [Google Scholar]
- Helman, D.; Bahat, I.; Netzer, Y.; Ben-Gal, A.; Alchanatis, V.; Peeters, A.; Cohen, Y. Using time series of high-resolution planet satellite images to monitor grapevine stem water potential in commercial vineyards. Remote Sens. 2018, 10, 1615. [Google Scholar] [CrossRef]
- Zhang, C.; Marzougui, A.; Sankaran, S. High-resolution satellite imagery applications in crop phenotyping: An overview. Comput. Electron. Agric. 2020, 175, 105584. [Google Scholar] [CrossRef]
- Huang, Y.; Thomson, S.J.; Brand, H.J.; Reddy, K.N. Development of low-altitude remote sensing systems for crop production management. Int. J. Agric. Biol. Eng. 2016, 9, 1–11. [Google Scholar]
- Huang, Y.; Brand, H.; Sui, R.; Thomson, S.J.; Furukawa, T.; Ebelhar, M.W. Cotton yield estimation using very high-resolution digital images acquired on a low-cost small unmanned aerial vehicle. Trans. ASABE 2017, 59, 1563–1574. [Google Scholar]
- Clapham, A. The estimation of yield in cereal crops by sampling methods. J. Agric. Sci. 1929, 19, 214–235. [Google Scholar] [CrossRef]
- Khaliq, A.; Comba, L.; Biglia, A.; Ricauda Aimonino, D.; Chiaberge, M.; Gay, P. Comparison of satellite and UAV-based multispectral imagery for vineyard variability assessment. Remote Sens. 2019, 11, 436–452. [Google Scholar] [CrossRef] [Green Version]
- Berra, E.F.; Gaulton, R.; Barr, S. Assessing spring phenology of a temperate woodland: A multiscale comparison of ground, unmanned aerial vehicle and Landsat satellite observations. Remote Sens. Environ. 2019, 223, 229–242. [Google Scholar] [CrossRef]
- Grant, B.G. UAV imagery analysis: Challenges and opportunities. In Proceedings of the long-range imaging II, Anaheim, CA, USA, 9–13 April 2017; Volume 10204, p. 1020406. [Google Scholar]
Figure 1.
Google/Google Earth maps of the demonstration sites at three locations in lower northern Mississippi.
Figure 1.
Google/Google Earth maps of the demonstration sites at three locations in lower northern Mississippi.

Figure 2.
Orthomosaic images (2 September 2016) of the research farm area at Stoneville, Mississippi.
Figure 2.
Orthomosaic images (2 September 2016) of the research farm area at Stoneville, Mississippi.

Figure 3.
Orthomosaic thermal image (25 May 2017) of the research farm area at Stoneville, Mississippi.
Figure 3.
Orthomosaic thermal image (25 May 2017) of the research farm area at Stoneville, Mississippi.

Figure 4.
CUC quantification (a) LoG of UAV RGB images of individual small cotton boll; (b) LoG of UAV RGB images of large cotton boll/boll clusters; (c) thresholding of LoG of UAV RGB images of large cotton boll/boll clusters.
Figure 4.
CUC quantification (a) LoG of UAV RGB images of individual small cotton boll; (b) LoG of UAV RGB images of large cotton boll/boll clusters; (c) thresholding of LoG of UAV RGB images of large cotton boll/boll clusters.

Figure 5.
Cotton yield estimation based on CUC quantified through thresholding of LoG of UAV RGB images (the square shapes represent data points, and the solid line is the trend of the data points with the fitted regression equation as shown on the top).
Figure 5.
Cotton yield estimation based on CUC quantified through thresholding of LoG of UAV RGB images (the square shapes represent data points, and the solid line is the trend of the data points with the fitted regression equation as shown on the top).

Figure 6.
Satellite multispectral imagery of the research farm area at Stoneville, Mississippi: Landsat 8 (12 September 2016), Sentinel 2A (3 September 2016), and PlanetScope 4-band (3 September 2016).
Figure 6.
Satellite multispectral imagery of the research farm area at Stoneville, Mississippi: Landsat 8 (12 September 2016), Sentinel 2A (3 September 2016), and PlanetScope 4-band (3 September 2016).

Figure 7.
UAV NDVI images of the soybean field in the research farm area at Brooksville, Mississippi in 2018.
Figure 7.
UAV NDVI images of the soybean field in the research farm area at Brooksville, Mississippi in 2018.

Figure 8.
Satellite multispectral imagery of the research farm area at Brooksville, Mississippi: Landsat 8 (16 June 2018), Sentinel 2A (12 July 2018), and PlanetScope 4-band (4 July 2018).
Figure 8.
Satellite multispectral imagery of the research farm area at Brooksville, Mississippi: Landsat 8 (16 June 2018), Sentinel 2A (12 July 2018), and PlanetScope 4-band (4 July 2018).

Figure 9.
UAV NDVI images of the soybean field in the research farm area at Pontotoc, Mississippi in 2018.
Figure 9.
UAV NDVI images of the soybean field in the research farm area at Pontotoc, Mississippi in 2018.

Figure 10.
Satellite multispectral imagery of the research farm area at Pontotoc, Mississippi: Landsat 8 (25 July 2018), Sentinel 2A (22 July 2018), and PlanetScope 4-band (4 July 2018).
Figure 10.
Satellite multispectral imagery of the research farm area at Pontotoc, Mississippi: Landsat 8 (25 July 2018), Sentinel 2A (22 July 2018), and PlanetScope 4-band (4 July 2018).

Disclaimer/Publisher’s Note: The statements, opinions and data contained in all publications are solely those of the individual author(s) and contributor(s) and not of MDPI and/or the editor(s). MDPI and/or the editor(s) disclaim responsibility for any injury to people or property resulting from any ideas, methods, instructions or products referred to in the content. |
© 2023 by the authors. Licensee MDPI, Basel, Switzerland. This article is an open access article distributed under the terms and conditions of the Creative Commons Attribution (CC BY) license (https://creativecommons.org/licenses/by/4.0/).
Share and Cite
MDPI and ACS Style
Huang, Y.; Feng, G.; Tewolde, H.; Shankle, M.W. Remote Sensing from Different Sources for Crop Growth Monitoring in the Area of the Lower Northern Mississippi. Challenges 2023, 14, 12. https://doi.org/10.3390/challe14010012
AMA Style
Huang Y, Feng G, Tewolde H, Shankle MW. Remote Sensing from Different Sources for Crop Growth Monitoring in the Area of the Lower Northern Mississippi. Challenges. 2023; 14(1):12. https://doi.org/10.3390/challe14010012
Chicago/Turabian StyleHuang, Yanbo, Gary Feng, Haile Tewolde, and Mark W. Shankle. 2023. "Remote Sensing from Different Sources for Crop Growth Monitoring in the Area of the Lower Northern Mississippi" Challenges 14, no. 1: 12. https://doi.org/10.3390/challe14010012
Note that from the first issue of 2016, this journal uses article numbers instead of page numbers. See further details here.