
Beach Monitoring and Morphological Response in the Presence of Coastal Defense Strategies at Riccione (Italy)

 , and
, and
Abstract
:1. Introduction
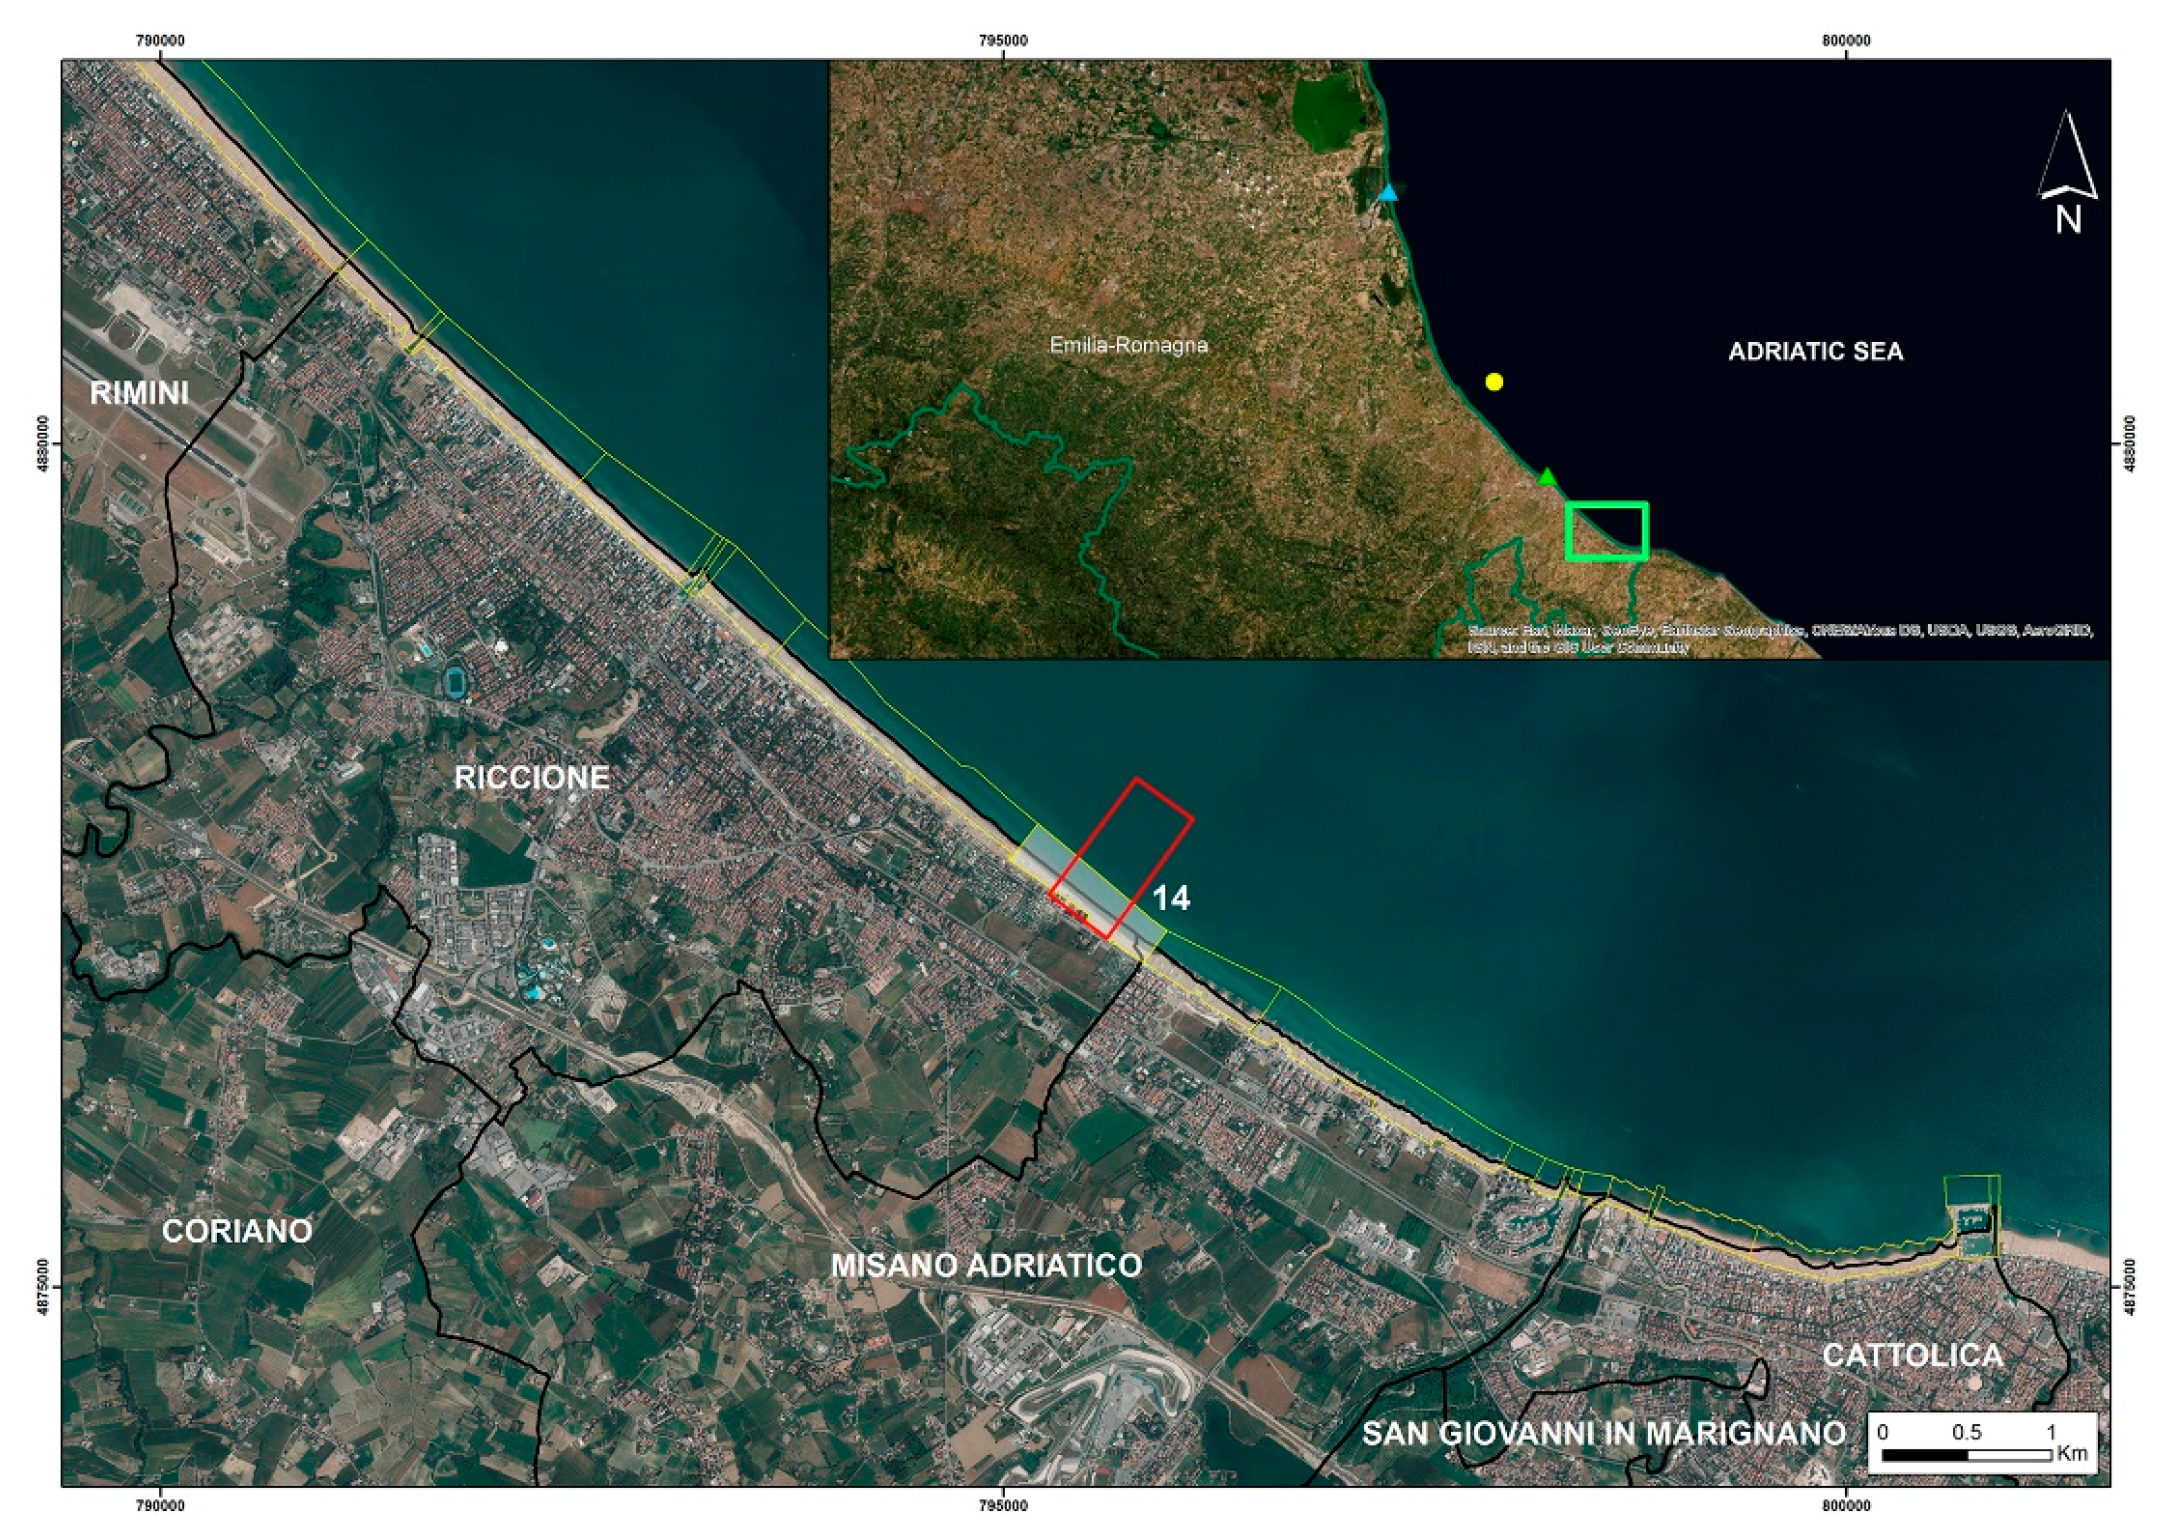
2. The Study Site
2.1. General Setting and Coastal Dynamics
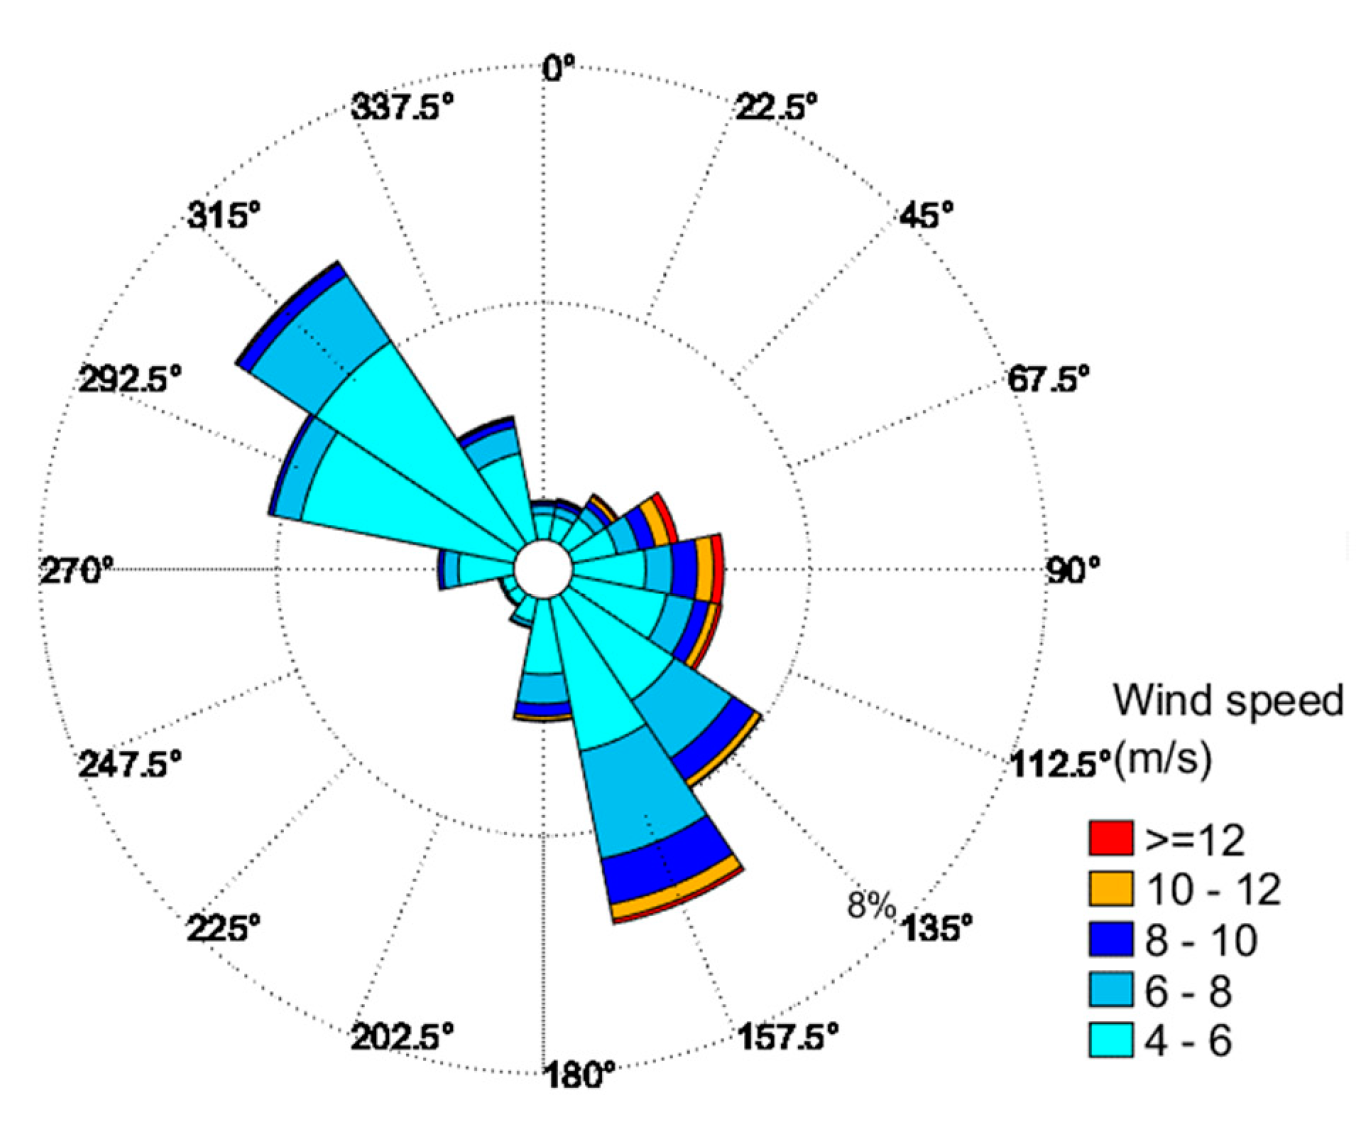
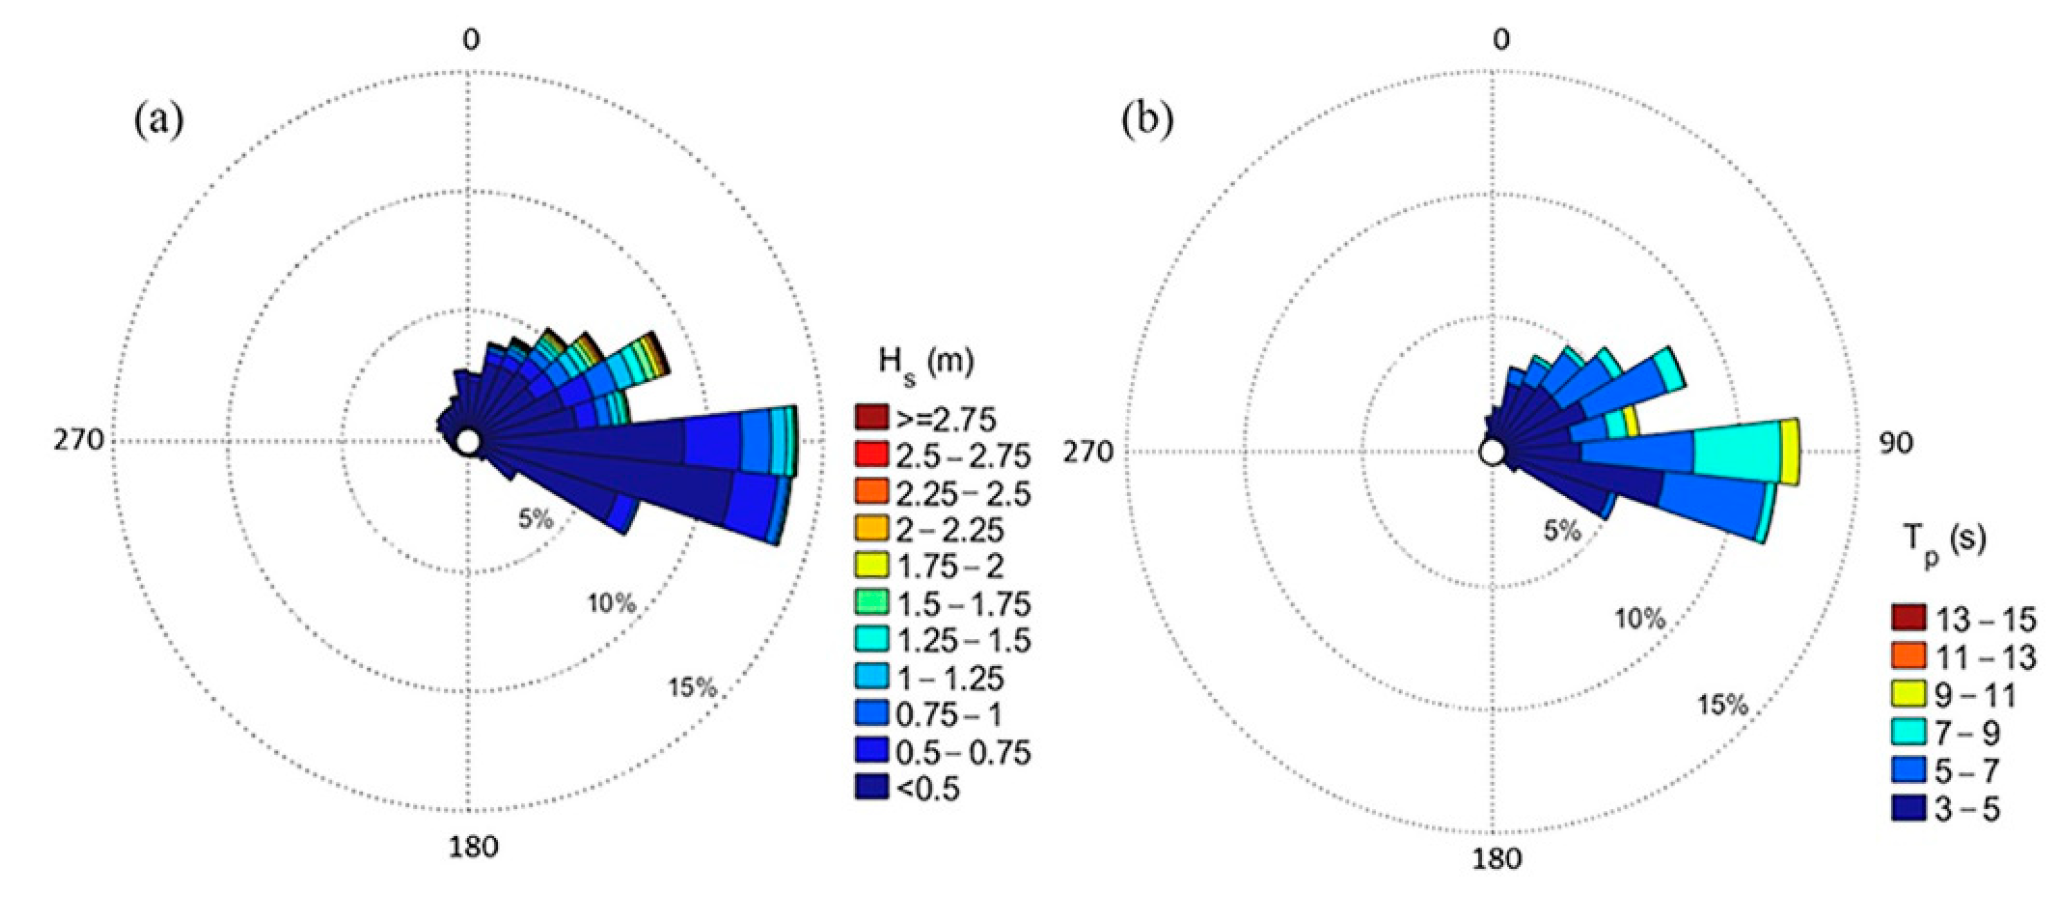
2.2. Meteo-Marine Climate
- the most energetic waves, up to 4.0 m in height, propagating from the sector 50°–60° N;
- the most frequent conditions, with wave height up to 1.0 m, coming from 90° N;
- the high wave periods with values ranging from 9–11 s, coming from 90° N;
- the most frequent values of peak periods ranging from 5 to 7 s.
3. Data and Methods
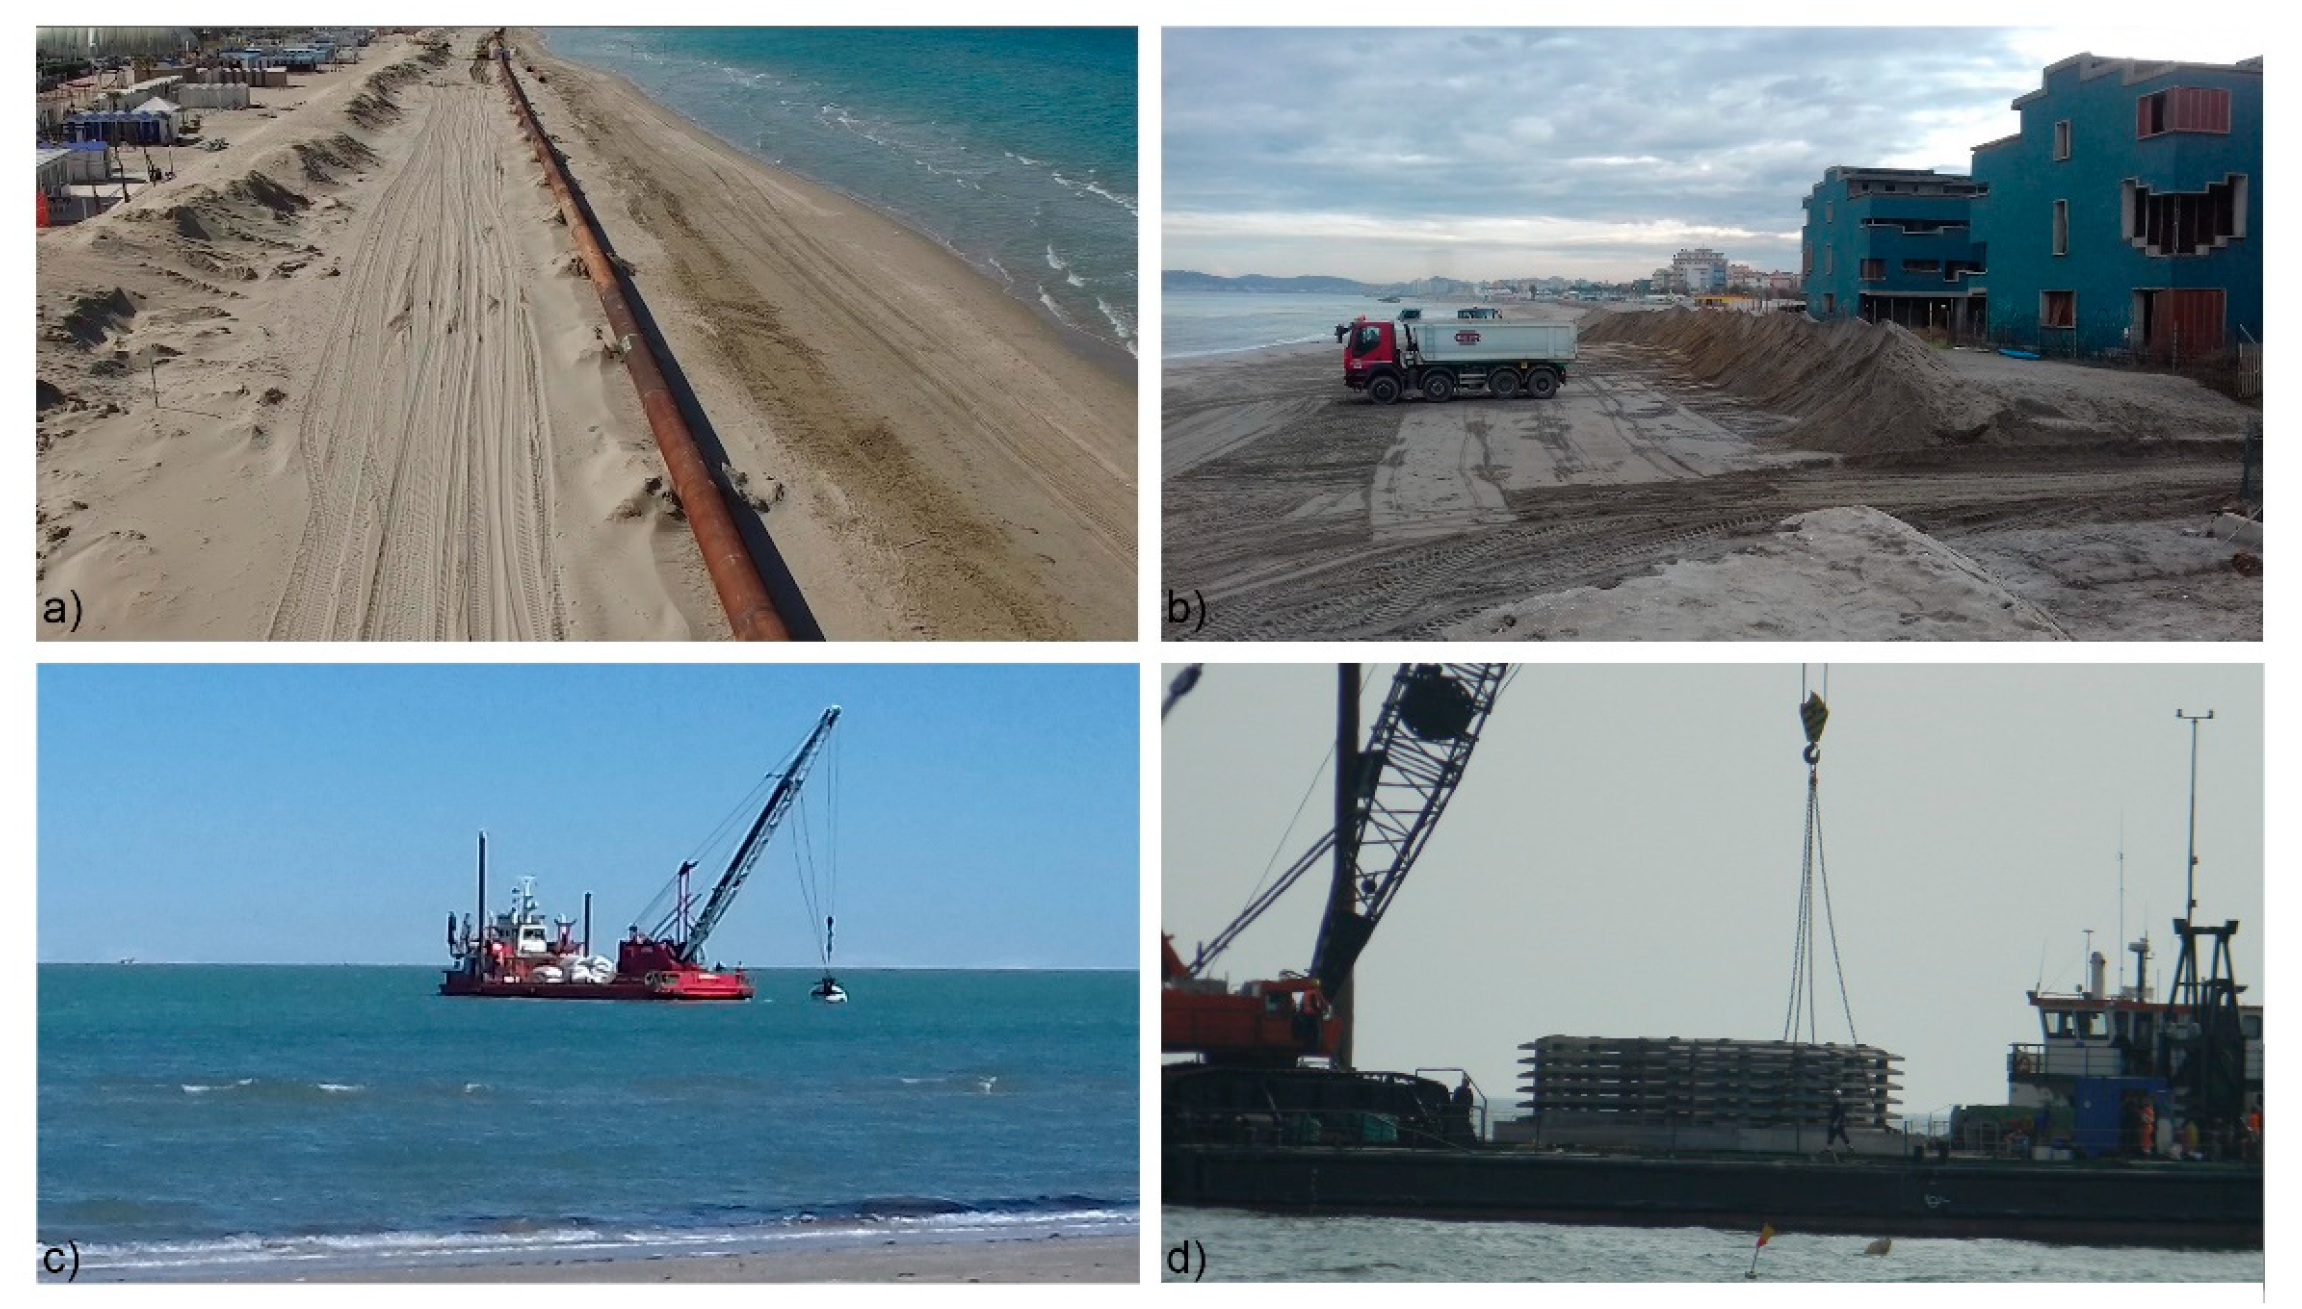
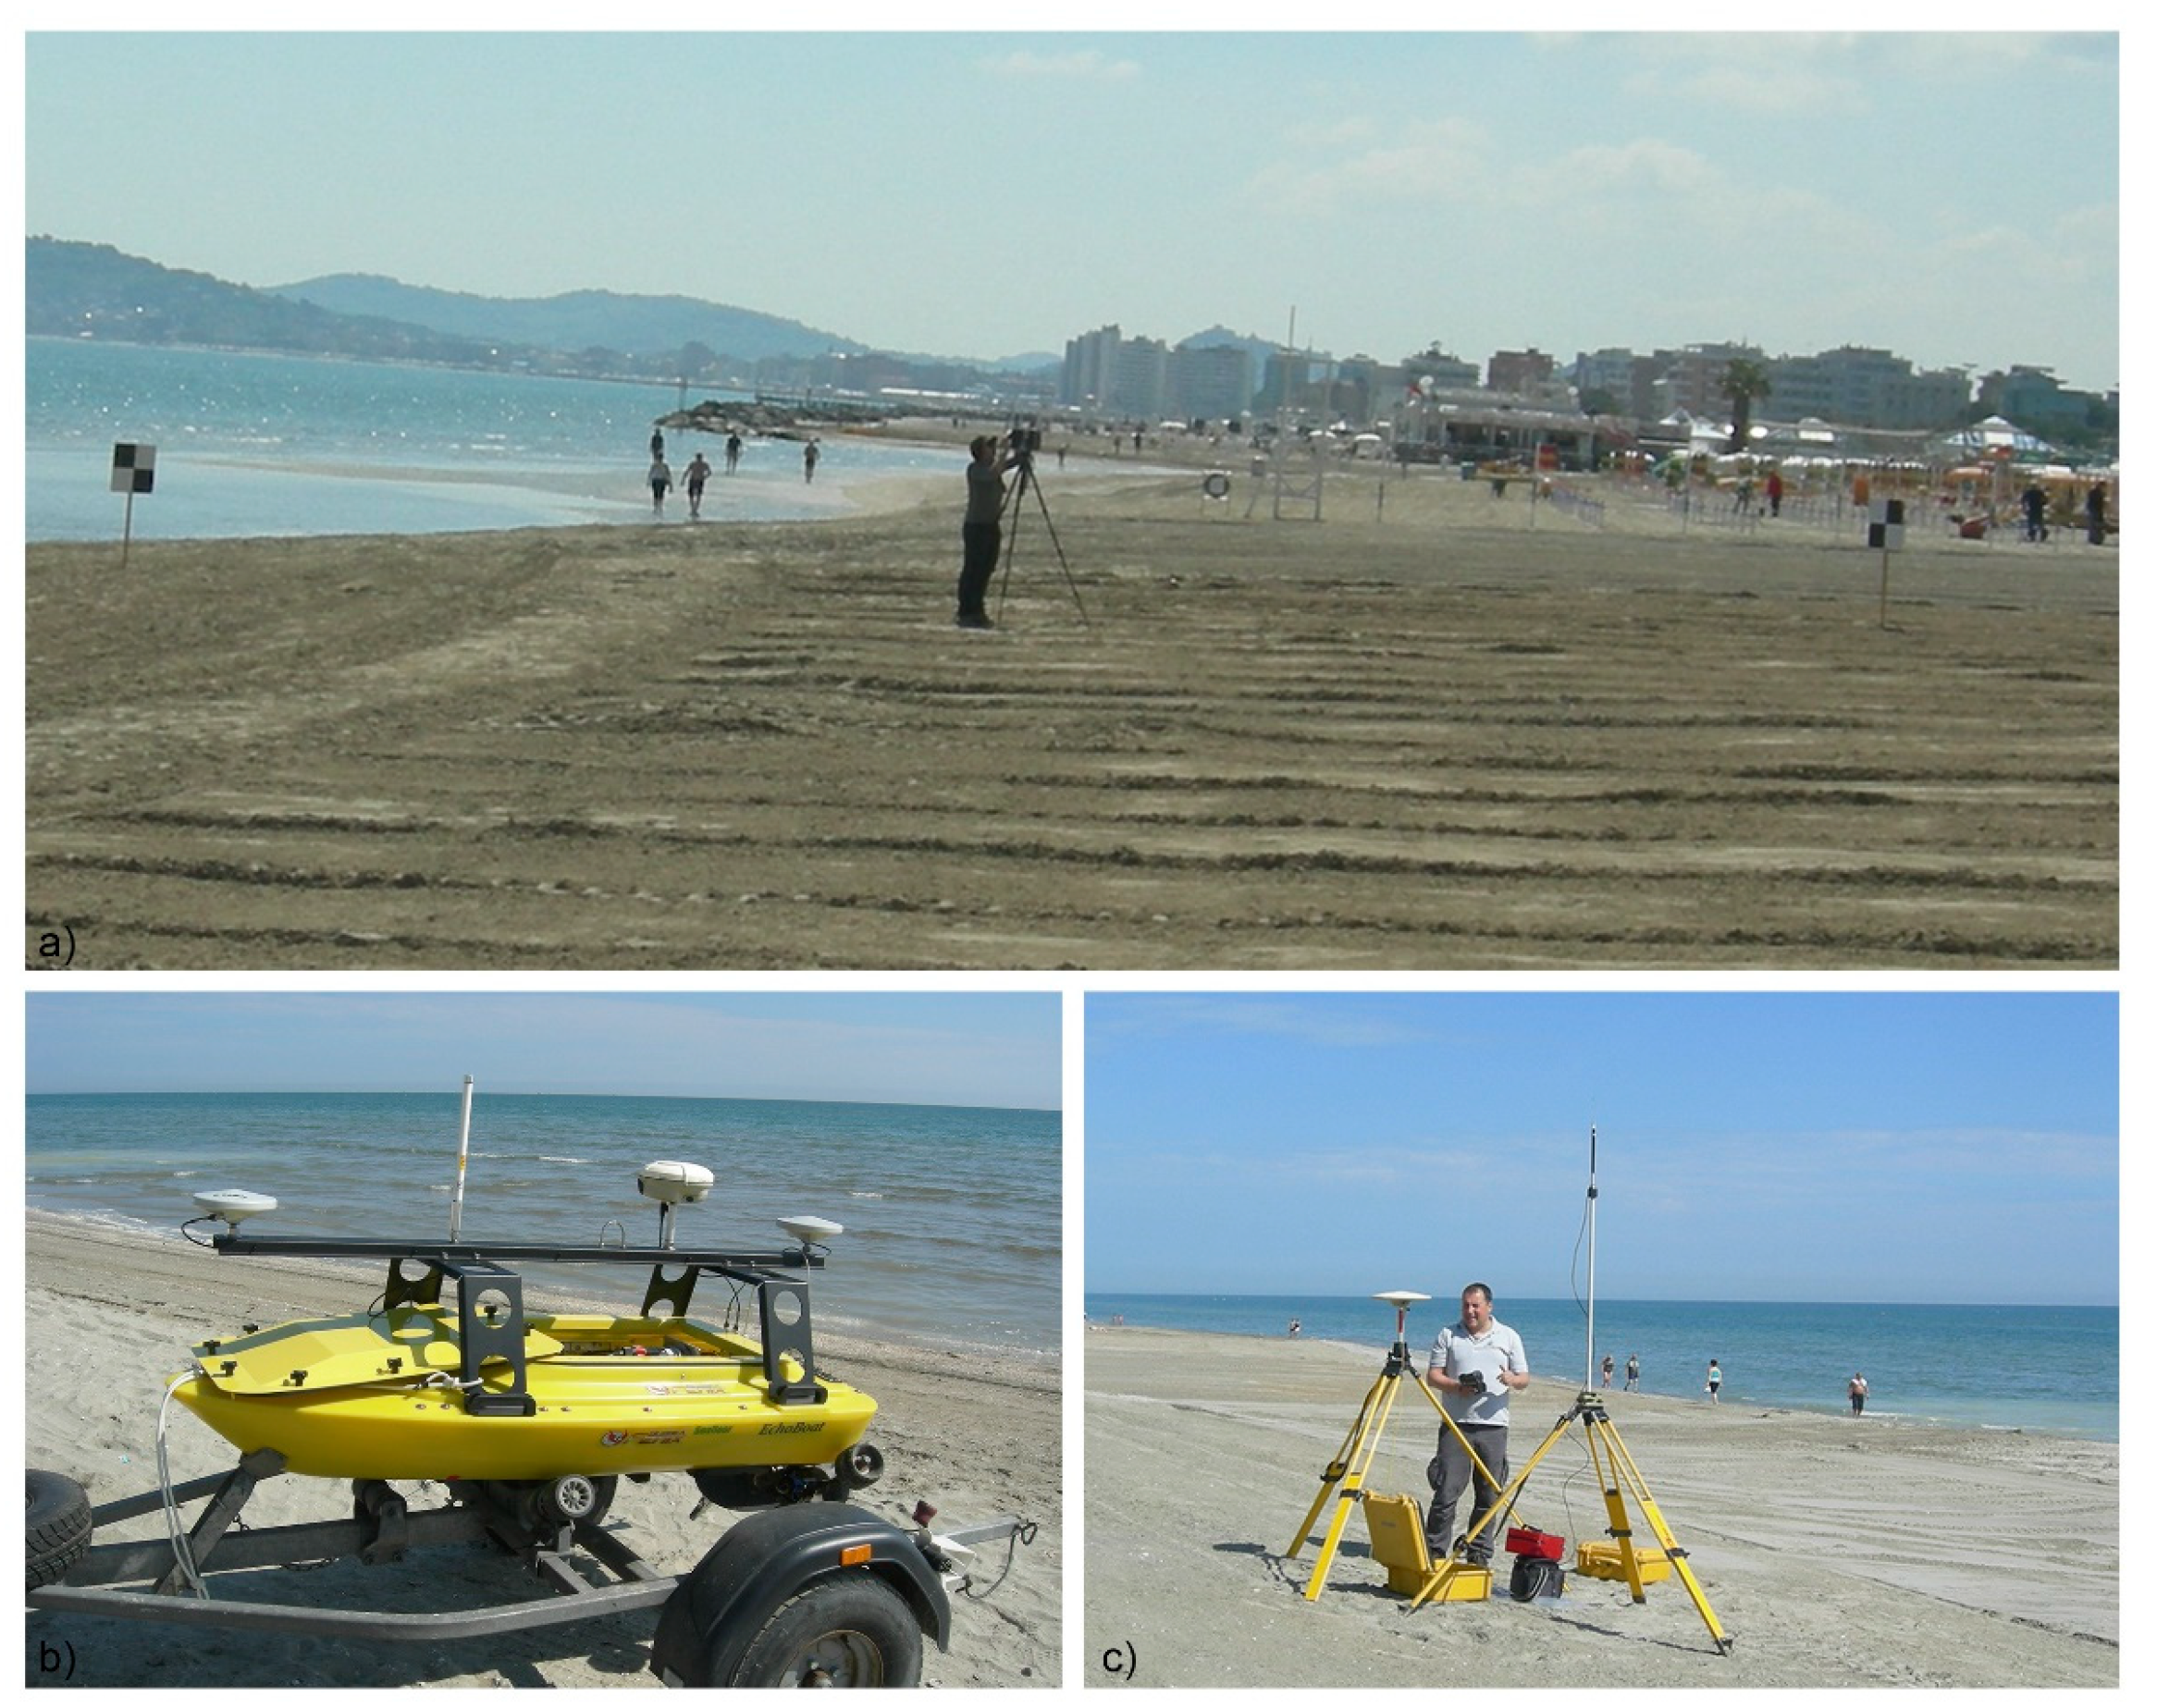
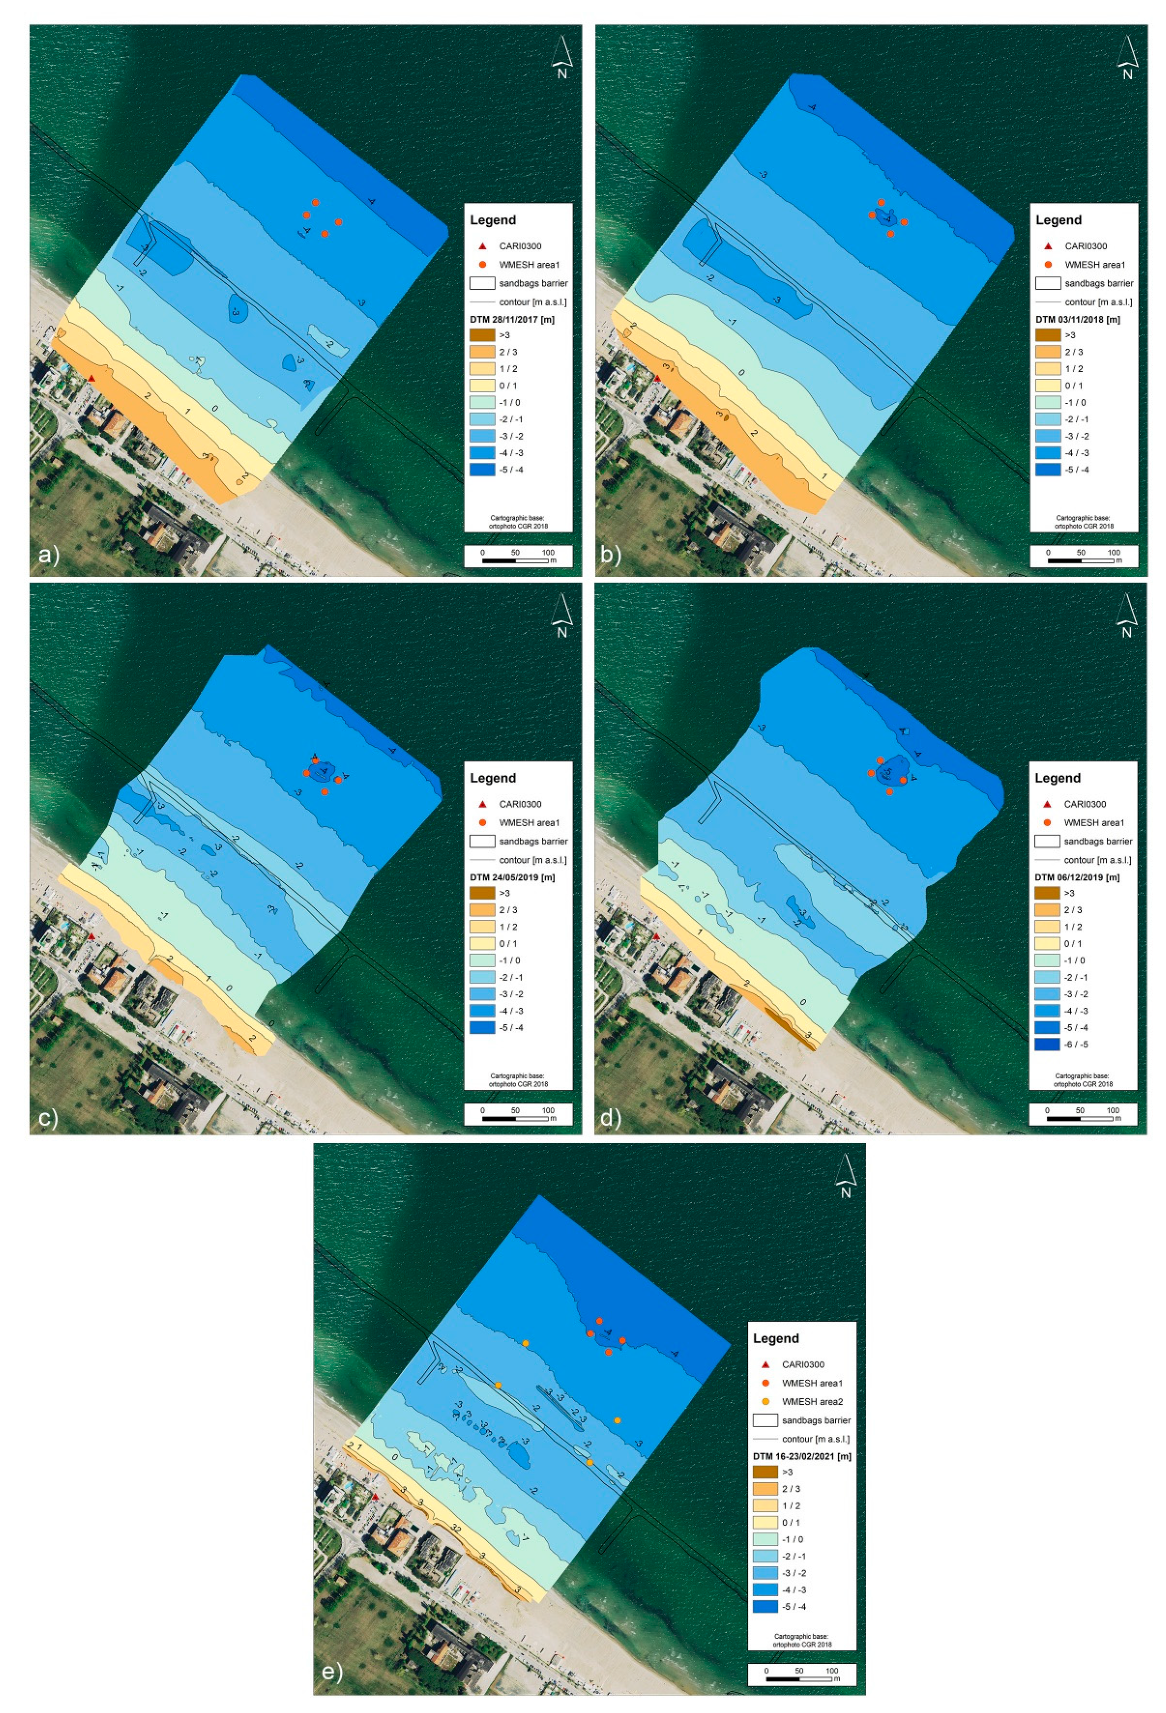
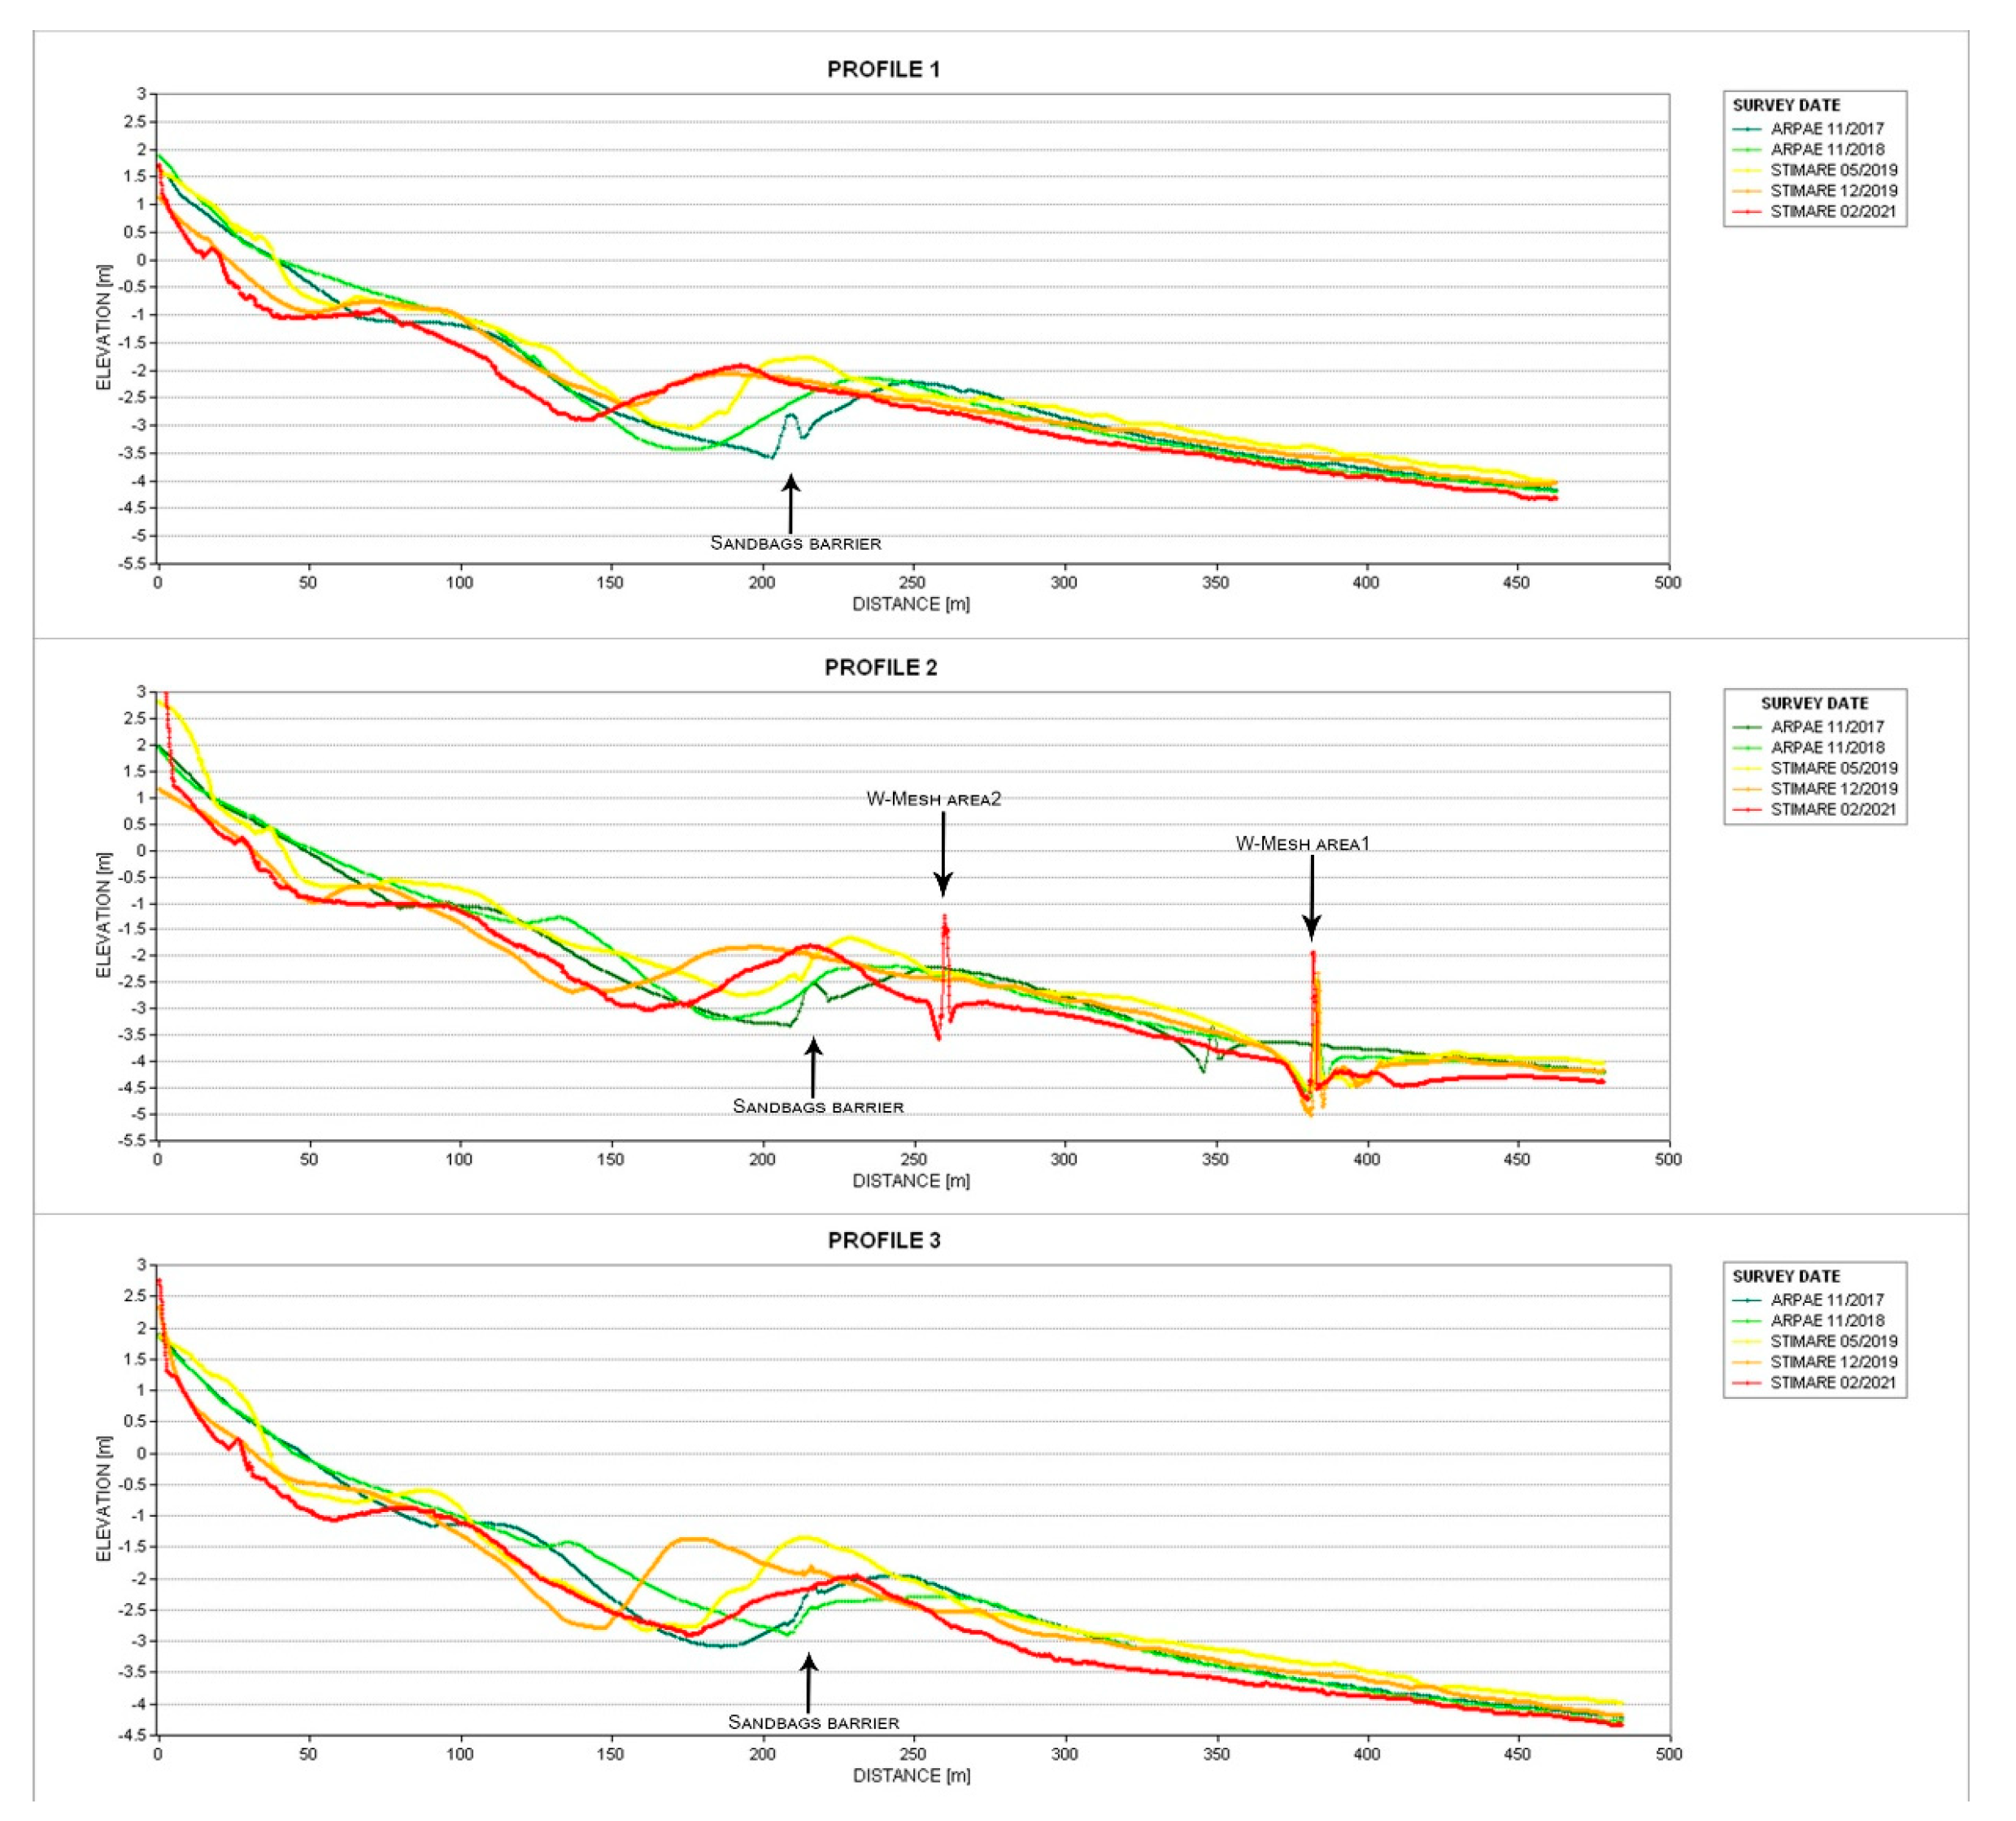
3.1. Topographic–Bathymetric Surveys
3.2. DTM Geomorphologic Analysis
3.3. Analysis of Storm Events in the Studied Period
4. Results
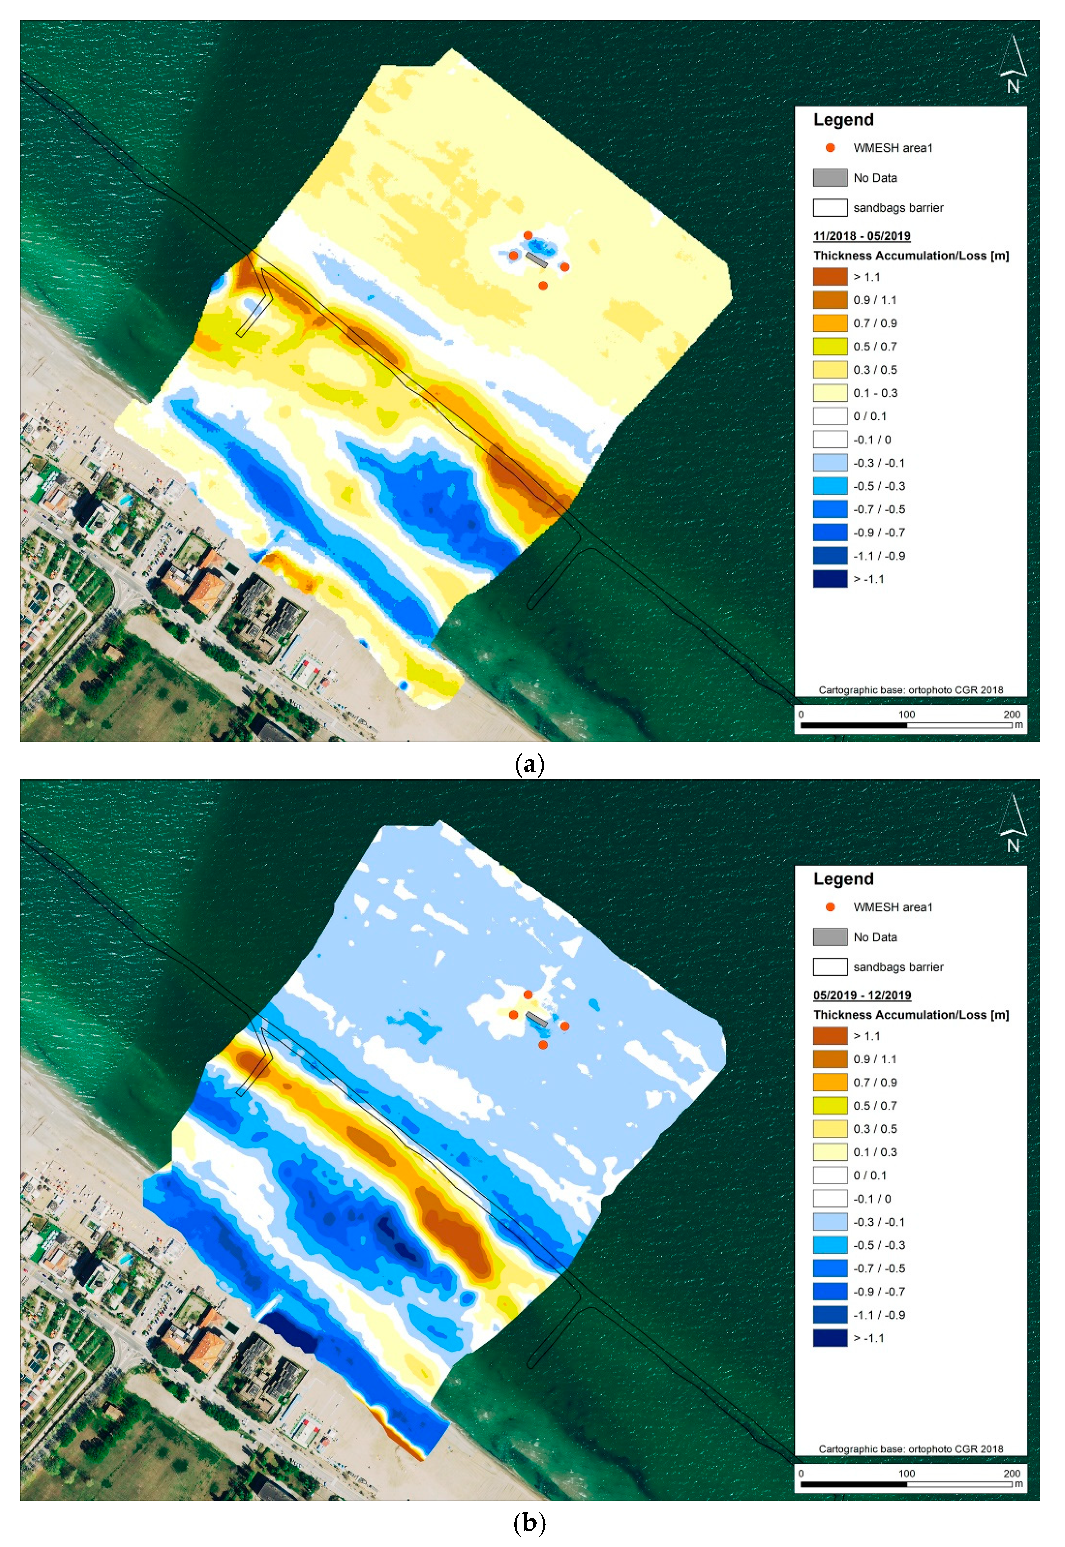
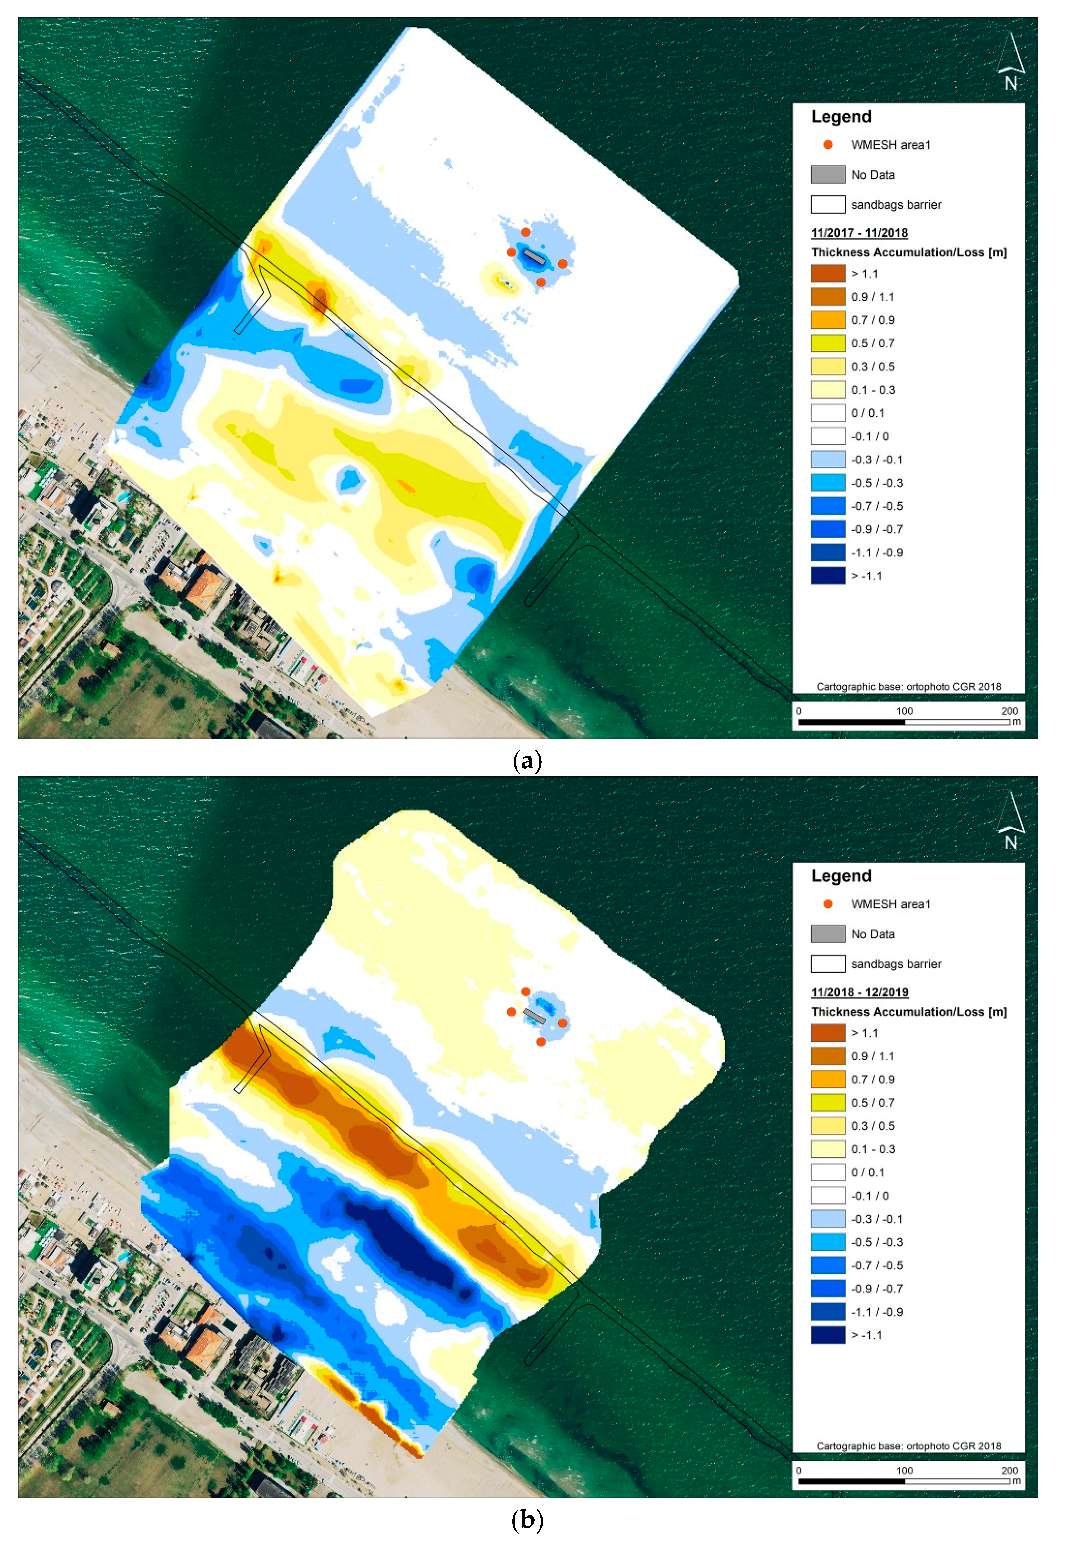
4.1. Seasonal Comparisons
4.2. Interannual Comparisons
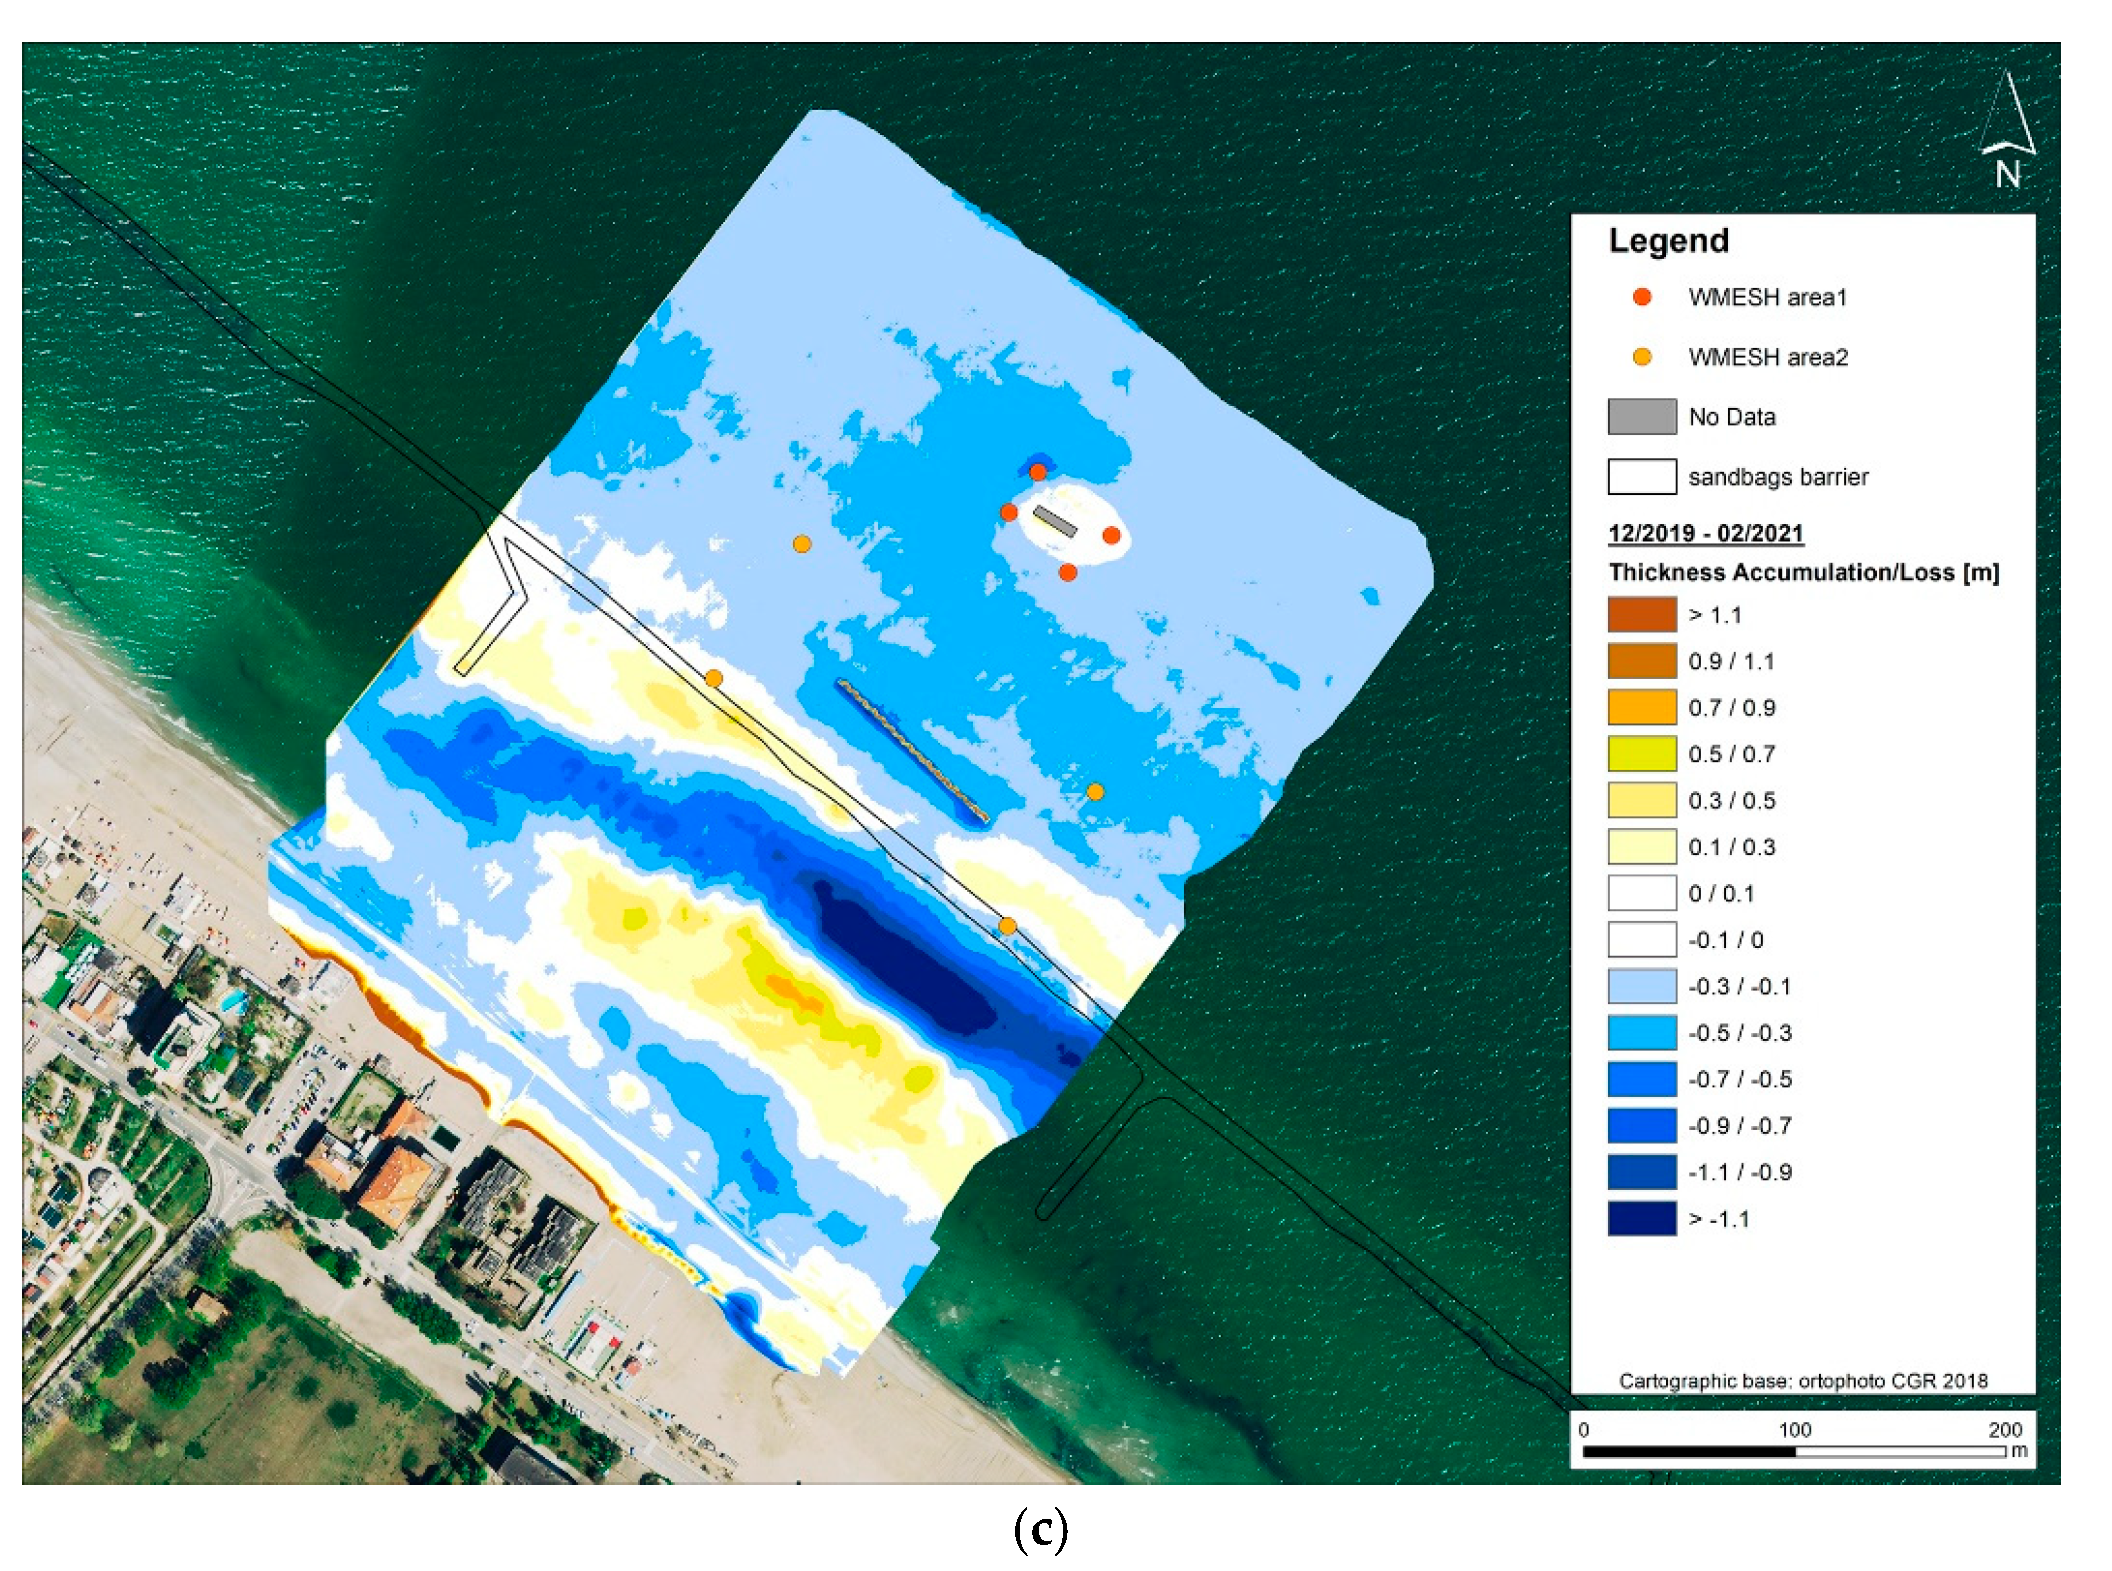
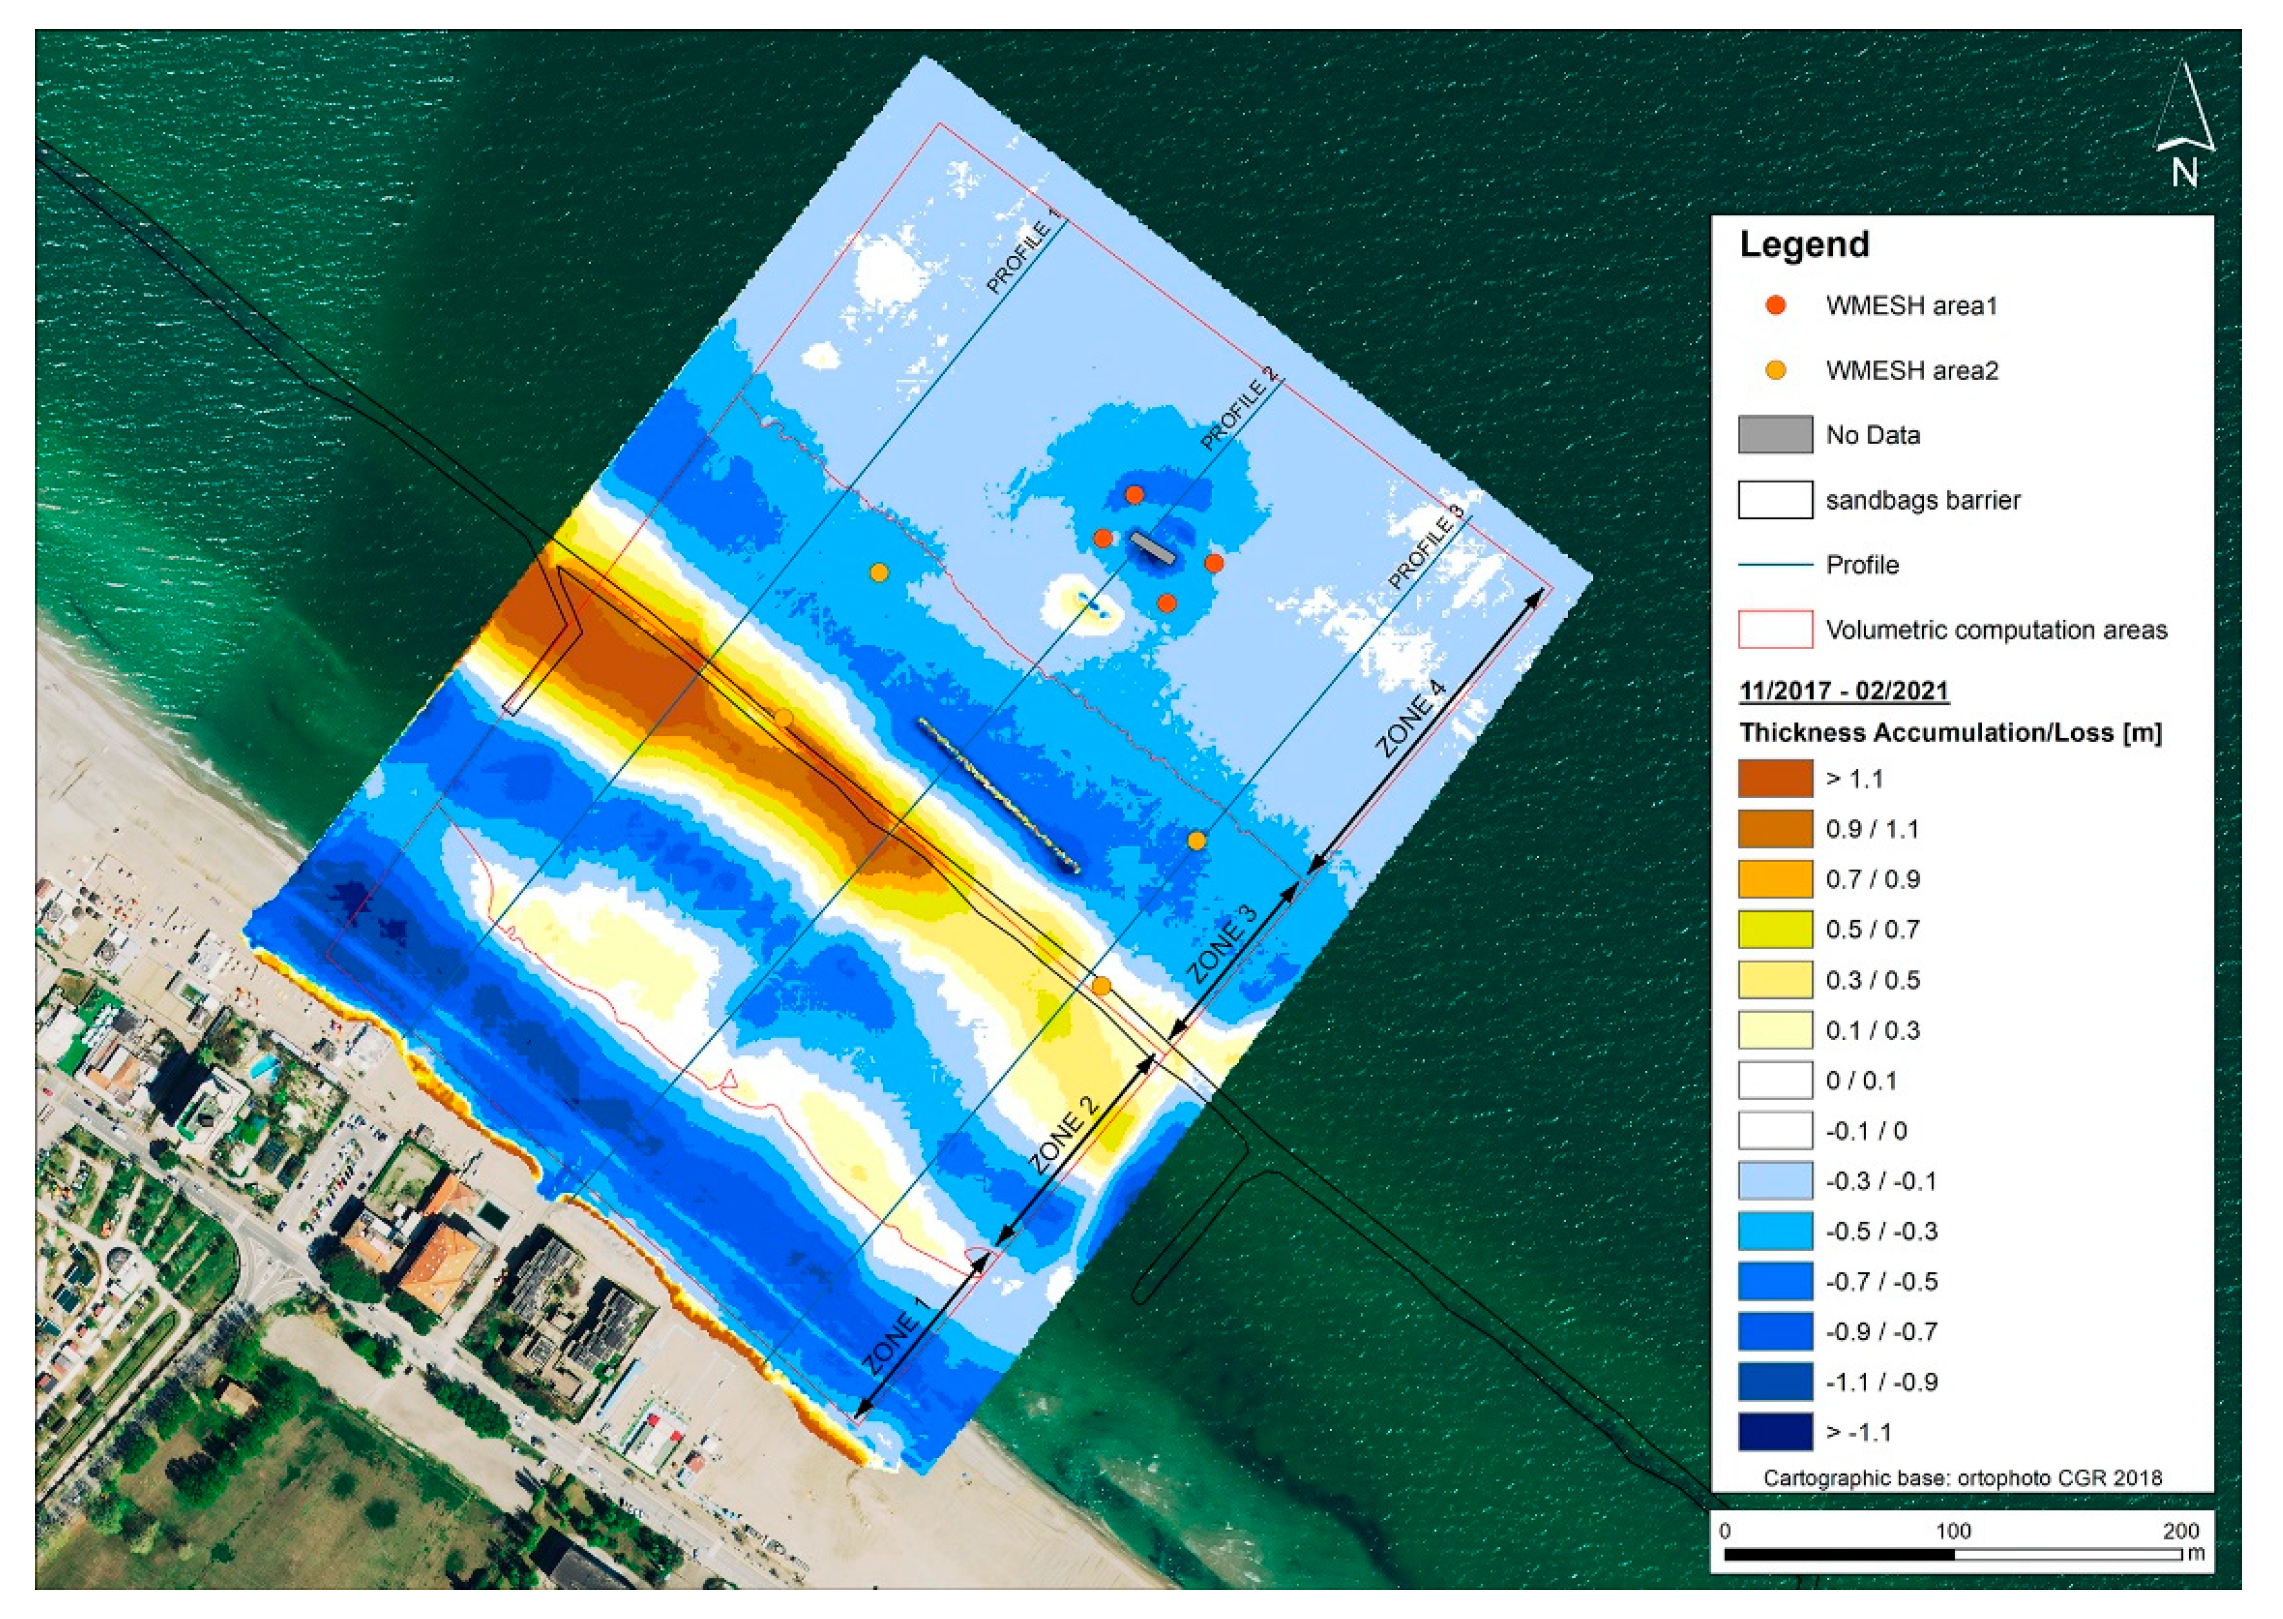
4.3. 2D and Volumetric Comparisons
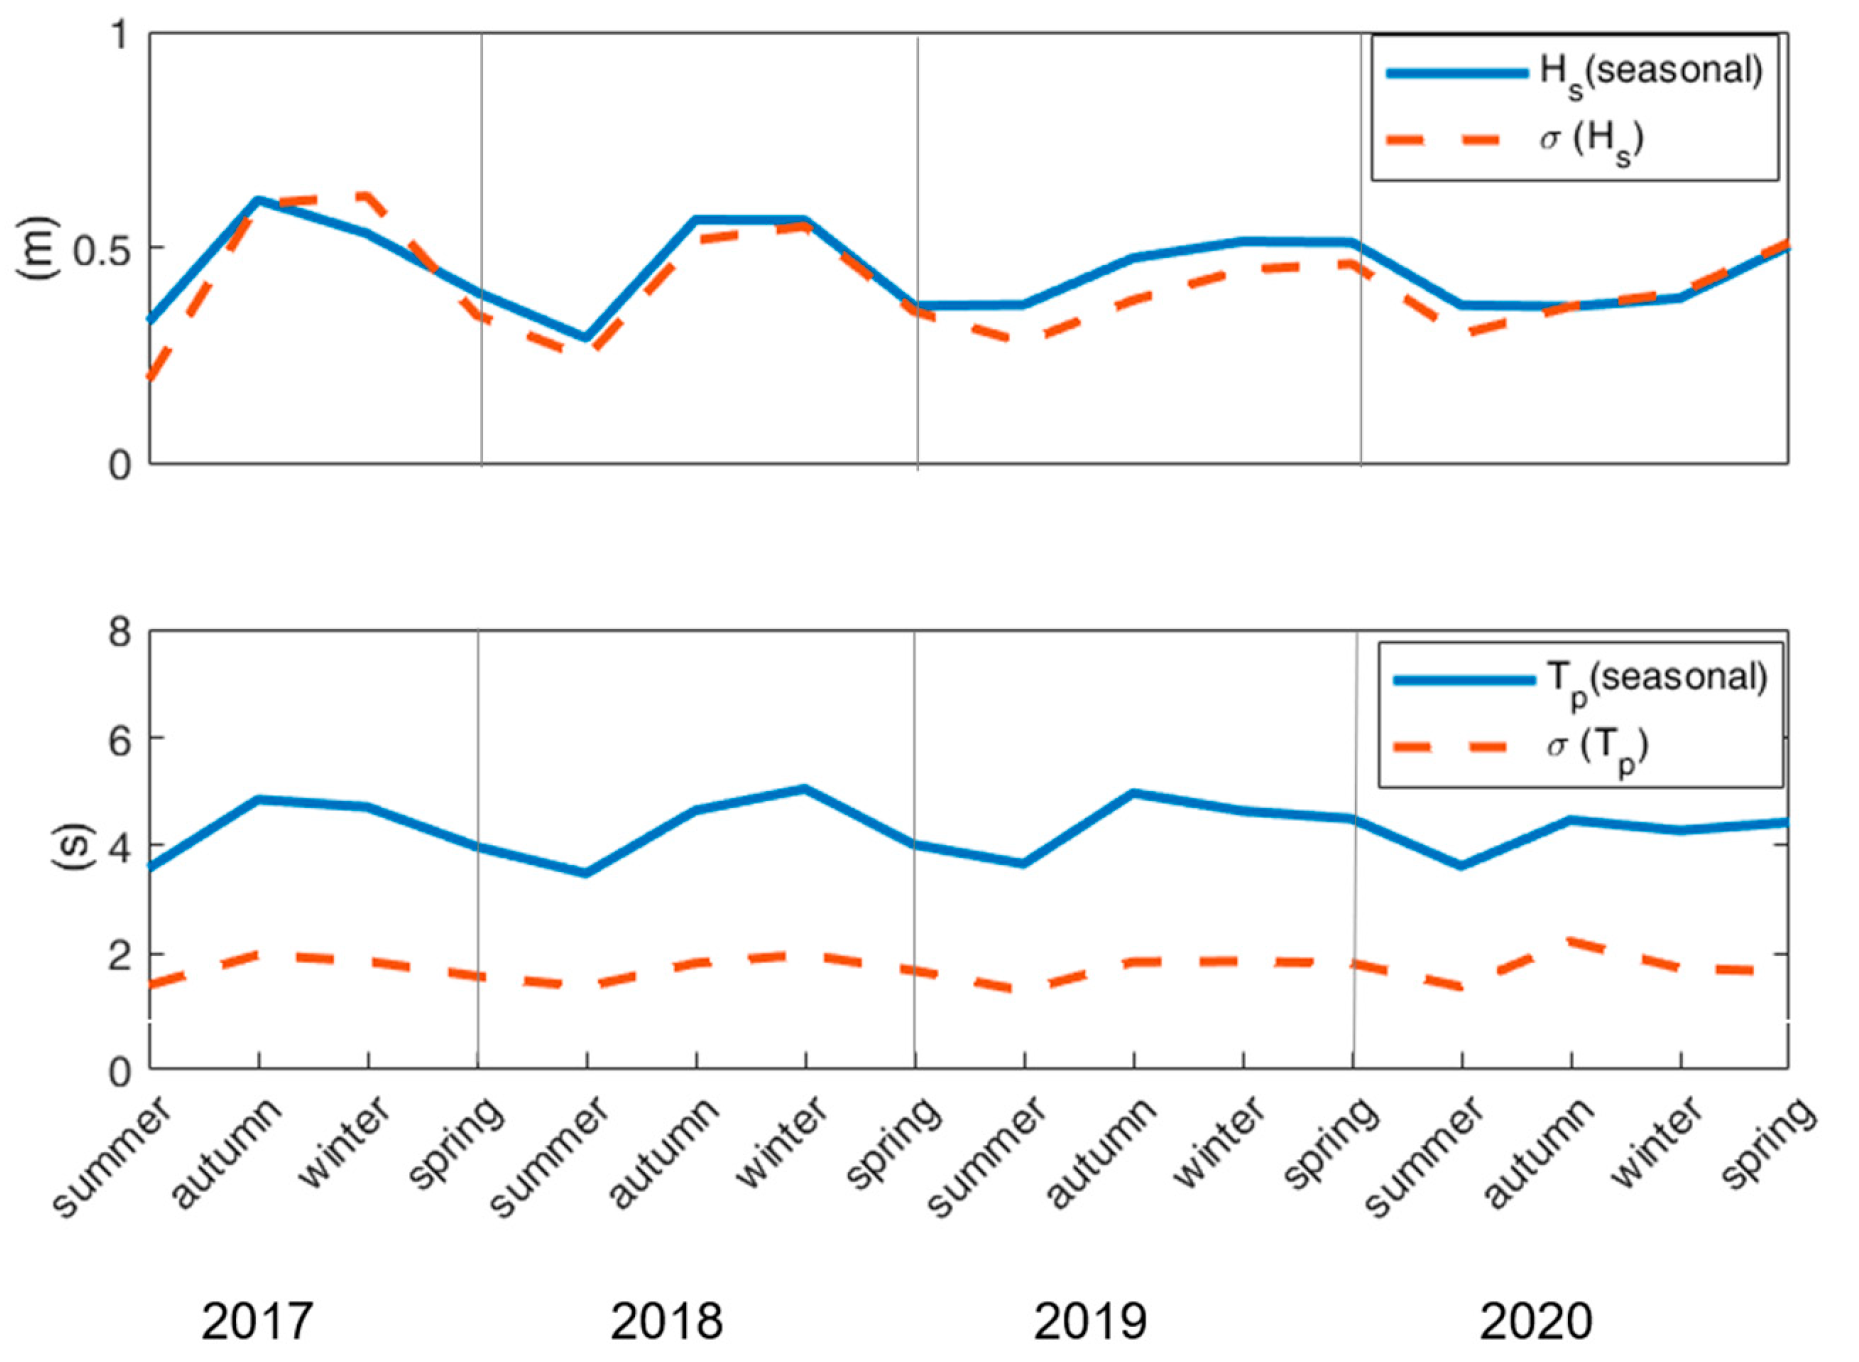
4.4. Analysis of Seasonal Climate and Occurrence of Storm Events in the Studied Period
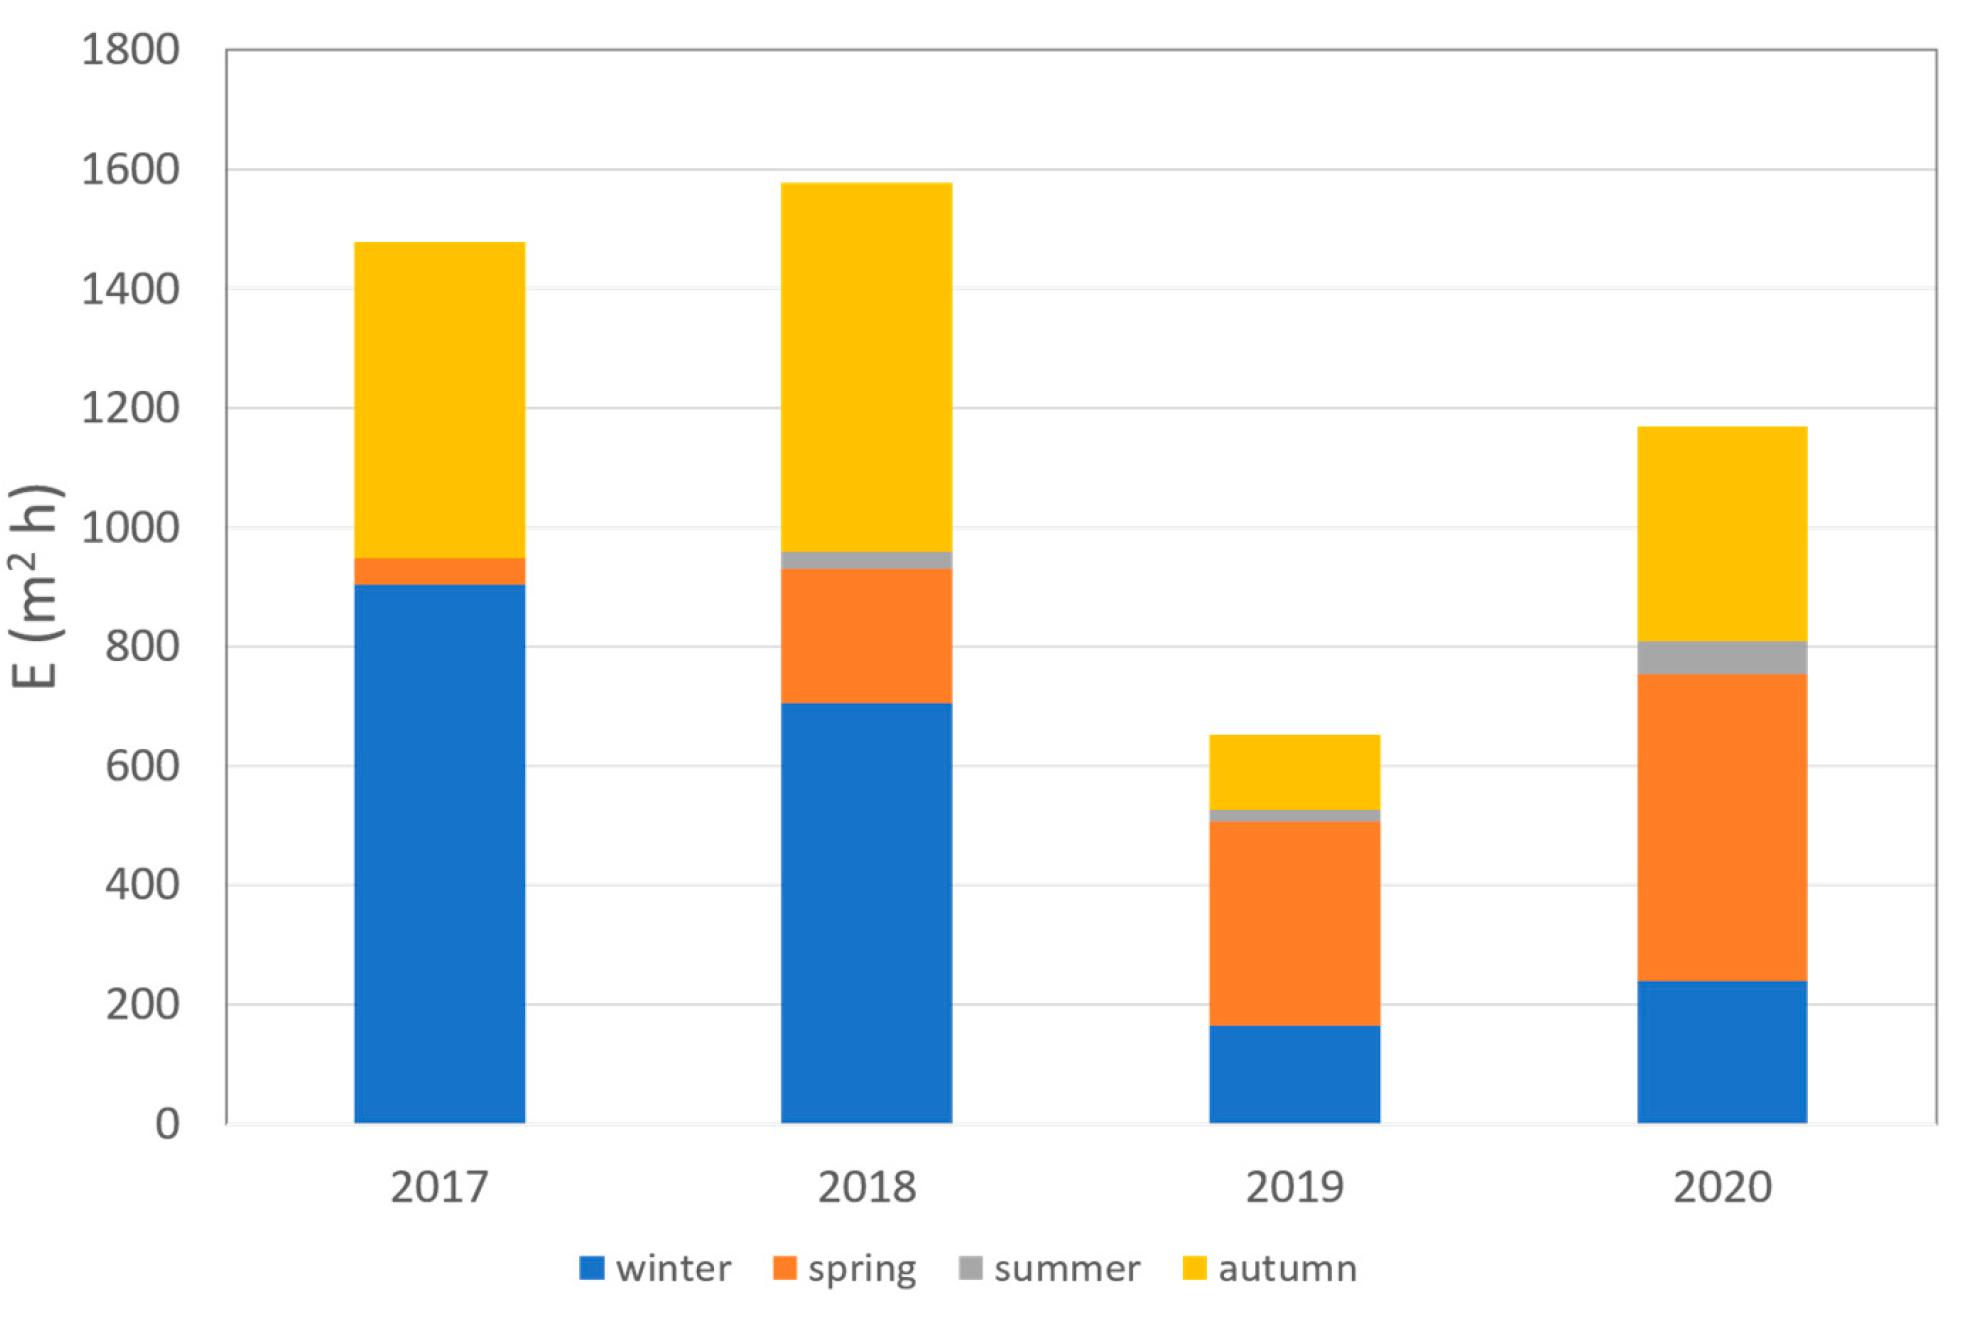
- the year with the most energetic marine climate, with a total energy E equal to about 1600 m2 h, was 2018, with a yearly occurrence of significant storms of 26.66%, mostly in winter;
- a higher amount of storm energy (E ≅ 900 m2 h) occurred in winter 2017, when a severe storm, characterized by Hs > 4 m and duration > 3 days, was observed on January 17th;
- the year 2019 was overall a less energetic year in terms of storm energy (E ≅ 600 m2 h), with a higher percentage (66.68%) of storms classified as weak. Most storm events occurred in spring (E ≅ 400 m2 h);
- the year 2020 also shows a greater occurrence of storm events in spring (E = over 500 m2 h);
- in all years, fewer and weaker sea storms were observed in summer, as expected.
5. Discussion
5.1. Effects of Human Interventions on the Beach Morphology
5.2. The Contribution of Natural Processes
6. Conclusions
Author Contributions
Funding
Institutional Review Board Statement
Data Availability Statement
Acknowledgments
Conflicts of Interest
Appendix A

| Year | Month | Dumped Volumes (m3) | Nourishment Location | Provenance (n. cell) |
|---|---|---|---|---|
| 2017 | April | 4200 | emerged beach | Miramare (24) |
| 28 November 2017—1° survey (Arpae) | ||||
| 2018 | May | 5428 | - | Miramare (24) |
| May | 2000 | - | Riccione S beach cleaning (14) | |
| 3 November 2018—2° survey (Arpae) | ||||
| 2019 | March | 7520 | emerged beach | Miramare (24) |
| May | 6060 | emerged beach | Miramare (24) | |
| May | 4640 | emerged beach | Riccione S beach cleaning | |
| 24 May 2019—3° survey (STIMARE) | ||||
| 6 December 2019—4° survey (STIMARE) | ||||
| December | 2000 | emerged beach | Misano (12) | |
| 2020 | October | - | winter dune | Riccione south berm |
| December | 8500 | emerged beach | Construction excavations | |
| 2021 | February | 2500 | emerged beach | Miramare (24) |
| 16–23 February 2021—5° survey (STIMARE) | ||||
| Year | Date | Season | Hs (m) | Tm (s) | Tp (s) | MWD (°N) | Compass Sector | Dur (h) | E (m2 h) | Class | Max Level (m) |
|---|---|---|---|---|---|---|---|---|---|---|---|
| 2017 | 6-January-17 | winter | 2.75 | 5.6 | 7.7 | 58 | I | 45 | 220.5 | III | 0.15 |
| 17-January-17 | winter | 4.18 | 6.1 | 8.3 | 58 | I | 96 | 619.9 | IV | 0.55 | |
| 6-February-17 | winter | 2.01 | 5.3 | 7.7 | 79 | I | 8 | 24.7 | I | 0.45 | |
| 25-February-17 | winter | 3.08 | 5.5 | 7.1 | 49 | I | 8 | 38.4 | I | 0.44 | |
| 18-April-17 | spring | 2.94 | 5.3 | 6.7 | 32 | I | 9 | 45.3 | I | 0.41 | |
| 6-November-17 | autumn | 2.79 | 5.6 | 8.3 | 61 | I | 19.5 | 89.68 | II | 0.83 | |
| 13-November-17 | autumn | 3.68 | 6.7 | 9.1 | 59 | I | 50.5 | 302.96 | III | 0.93 | |
| 26-November-17 | autumn | 3.07 | 5 | 7.7 | 46 | I | 11 | 50.77 | I | 0.36 | |
| 28-November-17 | Bathymetric survey | ||||||||||
| 2-December-17 | autumn | 2.39 | 5.3 | 7.7 | 58 | I | 22 | 86.48 | II | 0.69 | |
| 2018 | 3-February-18 | winter | 2.51 | 5.3 | 8.3 | 55 | I | 9.5 | 36.15 | I | 0.70 |
| 13-February-18 | winter | 1.78 | 4.4 | 6.2 | 24 | I | 7 | 20.33 | I | 0.52 | |
| 18-February-18 | winter | 2.70 | 5.6 | 8.3 | 59 | I | 15 | 70.10 | II | 0.45 | |
| 24-February-18 | winter | 3.00 | 6 | 8.3 | 75 | I | 67.5 | 331.37 | III | 0.70 | |
| 26-February-18 | winter | 2.49 | 5.5 | 7.1 | 48 | I | 59 | 248.20 | III | 0.61 | |
| 21-March-18 | spring | 3.10 | 6 | 9.1 | 65 | I | 37 | 182.44 | III | 0.83 | |
| 23-March-18 | spring | 2.13 | 5.1 | 7.1 | 42 | I | 12.5 | 42.66 | I | 0.72 | |
| 26-August-18 | summer | 2.00 | 5.1 | 7.7 | 37 | I | 9 | 28.14 | I | 0.53 | |
| 24-September-18 | autumn | 2.75 | 5.8 | 8.3 | 316 | IV | 47 | 188.87 | III | 0.59 | |
| 2-October-18 | autumn | 2.36 | 5.3 | 7.7 | 23 | I | 11.5 | 49.20 | I | 0.40 | |
| 21-October-18 | autumn | 2.76 | 5.6 | 7.1 | 340 | IV | 20 | 73.58 | II | 0.57 | |
| 29-October-18 | autumn | 2.63 | 6.2 | 9.1 | 46 | I | 16.5 | 75.98 | II | 1.06 | |
| 3-November-18 | Bathymetric survey | ||||||||||
| 17-November-18 | autumn | 2.33 | 5.5 | 7.7 | 44 | I | 34.5 | 121.52 | II | (a) | |
| 20-November-18 | autumn | 2.66 | 5.4 | 7.7 | 42 | I | 11.5 | 55.93 | I | (a) | |
| 27-November-18 | autumn | 2.3 | 5.1 | 6.2 | 66 | I | 16.5 | 53.12 | I | (a) | |
| 2019 | 23-February-19 | winter | 2.84 | 6.1 | 9.1 | 66 | I | 32 | 145.29 | III | 0.12 |
| 20-March-19 | winter | 1.89 | 4.8 | 7.1 | 63 | I | 6.5 | 20.10 | I | 0.31 | |
| 26-March-19 | spring | 3.6 | 6.3 | 8.3 | 38 | I | 7.5 | 67.50 | II | 0.73 | |
| 4-April-19 | spring | 1.94 | 6.2 | 9.1 | 82 | I | 8 | 22.13 | I | 0.73 | |
| 5-May-19 | spring | 2.77 | 5.6 | 7.1 | 52 | I | 19.5 | 80.04 | II | 0.65 | |
| 12-May-19 | spring | 2.75 | 5.3 | 7.1 | 32 | I | 31 | 143.70 | III | 0.46 | |
| 14-May-19 | spring | 2.02 | 4.9 | 6.7 | 38 | I | 23.5 | 28.65 | I | 0.38 | |
| 24-May-19 | Bathymetric survey | ||||||||||
| 3-September-19 | summer | 1.85 | 4.8 | 6.7 | 55 | I | 6.5 | 18.8 | I | 0.49 | |
| 3-October-19 | autumn | 2.5 | 5.4 | 7.7 | 28 | I | 9 | 38.4 | I | 0.59 | |
| 17-November-19 | autumn | 1.87 | 6.5 | 9.1 | 83 | I | 7.5 | 22.8 | I | 1.11 | |
| 24-November-19 | autumn | 1.77 | 5.5 | 8.3 | 82 | I | 13.5 | 34.8 | I | 0.86 | |
| 6-December-19 | Bathymetric survey | ||||||||||
| 10-December-19 | autumn | 1.75 | 5.1 | 6.7 | 66 | I | 11 | 30.9 | I | 0.30 | |
| 23-December-19 | winter | (b) | 1.0 | ||||||||
| 2020 | 20-January-20 | winter | 1.73 | 4.7 | 5.9 | 61 | I | 21 | 55.1 | I | 0.27 |
| 6-February-20 | winter | 2.54 | 5.3 | 7.1 | 44 | I | 18.5 | 84.1 | II | 0.34 | |
| 25-March-20 | spring | 4.05 | 7.8 | 25 | 58 | I | 76.5 | 369.6 | III | 0.32 | |
| 31-March-20 | spring | 2.24 | 5.2 | 7.1 | 48 | I | 17 | 56.0 | I | 0.32 | |
| 1-April-20 | spring | 1.88 | 4.7 | 6.2 | 61 | I | 10.5 | 29.9 | I | 0.17 | |
| 14-April-20 | spring | 2.58 | 5.5 | 7.7 | 59 | I | 16 | 58.5 | II | 0.22 | |
| 7-July 20 | summer | 3.06 | 6.0 | 8.3 | 59 | I | 9 | 54.4 | I | 0.29 | |
| 28-September-20 | autumn | 1.72 | 4.3 | 5.9 | 21 | I | 11 | 30.0 | I | 0.58 | |
| 21-November-20 | autumn | 2.93 | 6.0 | 8.3 | 58 | I | 41 | 257.6 | III | 0.46 | |
| 5-December-20 | autumn | 1.91 | 5.6 | 9.1 | 84 | I | 27 | 73.0 | II | 0.85 | |
| 26-December-20 | winter | 2.60 | 5.6 | 7.7 | 55 | I | 28 | 101.0 | II | 0.52 | |
| 2021 | 11-February-21 | winter | 1.80 | 4.7 | 6.7 | 63 | I | 8.0 | 22.4 | I | 0.60 |
| 14-February-21 | winter | 2.57 | 5.1 | 7.1 | 32 | I | 41.5 | 196.6 | III | 0.46 | |
| 16-February-21 | Bathymetric survey | ||||||||||
| 27-February-21 | winter | 2.22 | 5.2 | 7.1 | 68 | I | 14.5 | 45.6 | I | 0.28 | |
References
- Arpae. Stato del Litorale Emiliano-Romagnolo al 2018. Erosione e interventi di difesa. In I Quaderni di Arpae; Aguzzi, M., Costantino, R., De Nigris, N., Morelli, M., Romagnoli, C., Unguendoli, S., Vecchi, E., Eds.; Arpae Emilia Romagna: Bologna, Italy, 2020; p. 224. ISBN 978-88-87854-48-0. Available online: https://www.arpae.it/it/notizie/slem-2018.pdf (accessed on 20 February 2021).
- Armaroli, C.; Ciavola, P.; Perini, L.; Calabrese, L.; Lorito, S.; Valentini, A.; Masina, M. Critical storm thresholds for significant morphological changes and damage along the Emilia-Romagna coastline, Italy. Geomorphology 2012, 143–144, 34–51. [Google Scholar] [CrossRef]
- Perini, L.; Calabrese, L.; Salerno, G.; Ciavola, P.; Armaroli, C.G. Evaluation of coastal vulnerability to flooding: Comparison of two different methods adopted by the Emilia-Romagna region (Italy). Nat. Hazards Earth Syst. Sci. 2016, 16, 181–194. [Google Scholar] [CrossRef] [Green Version]
- Perini, L.; Calabrese, L.; Luciani, P.; Olivieri, M.; Galassi, G.; Spada, G. Sea-level rise along the Emilia-Romagna coast (North-ern Italy) in 2100: Scenarios and impacts. Nat. Hazards Earth Syst. Sci. 2017, 17, 2271–2287. [Google Scholar] [CrossRef] [Green Version]
- MATTM-Regioni. Linee Guida Nazionali per la Difesa della Costa dai Fenomeni di Erosione e Dagli Effetti dei Cambiamenti climatici. Documento Elaborato Dal Tavolo Nazionale Sull’erosione Costiera, MATTM-Regioni col Coordinamento Tecnico di ISPRA. 2018, p. 305. Available online: http://www.erosionecostiera.isprambiente.it/files/linee-guida-nazionali/TNEC_LineeGuidaerosionecostiera_2018.pdf (accessed on 10 November 2019).
- Haxel, J.H.; Holman, R.A. The sediment response of a dissipative beach to variations in wave climate. Mar. Geol. 2004, 206, 73–99. [Google Scholar] [CrossRef]
- Vousdoukas, M.I.; Almeida, L.P.M.; Ferreira, O. Beach erosion and recovery during consecutive storms at a steep-sloping, meso-tidal beach. Earth Surf. Process. Landf. 2011, 37, 583–593. [Google Scholar] [CrossRef]
- Ruggiero, P.; Kaminsky, G.M.; Gelfenbaum, G.; Cohn, N. Morphodynamics of prograding beaches: A synthesis of seasonal-to century-scale observations of the Columbia River littoral cell. Mar. Geol. 2016, 376, 51–68. [Google Scholar] [CrossRef] [Green Version]
- Makar, A.; Specht, C.; Specht, M.; Dąbrowski, P.; Burdziakowski, P.; Lewicka, O. Seabed Topography Changes in the Sopot Pier Zone in 2010–2018 Influenced by Tombolo Phenomenon. Sensors 2020, 20, 6061. [Google Scholar] [CrossRef] [PubMed]
- Pietro, L.S.; O’Neal, M.A.; Puleo, J.A. Developing Terrestrial-LIDAR-Based Digital Elevation Models for Monitoring Beach Nourishment Performance. J. Coast. Res. 2008, 246, 1555–1564. [Google Scholar] [CrossRef]
- Hein, C.J.; Fallon, A.R.; Rosen, P.; Hoagland, P.; Georgiou, I.Y.; FitzGerald, D.M.; Morris, M.; Baker, S.; Marino, G.B.; Fitz-simons, G. Shoreline Dynamics Along a Developed River Mouth Barrier Island: Multi-Decadal Cycles of Erosion and Event-Driven Mitigation. Front. Earth Sci. 2019, 7, 103. [Google Scholar] [CrossRef]
- Bonaldo, D.; Antonioli, F.; Archetti, R.; Bezzi, A.; Correggiari, A.; Davolio, S.; De Falco, G.; Fantini, M.; Fontolan, G.; Furlani, S.; et al. Integrating multidisciplinary instruments for assessing coastal vulnerability to erosion and sea level rise: Lessons and challenges from the Adriatic Sea, Italy. J. Coast. Conserv. 2019, 23, 19–37. [Google Scholar] [CrossRef]
- Casella, E.; Rovere, M.; Pedroncini, A.; Stark, C.; Casella, M.; Ferrari, M.; Firpo, M. Drone as a tool for monitoring beach to-pography changes in the Ligurian Sea (NW Mediterranean). Geo-Mar. Lett. 2016, 201636, 151–163. [Google Scholar] [CrossRef]
- Hodúl, M.; Bird, S.; Knudby, A.; Chénier, R. Satellite derived photogrammetric bathymetry. ISPRS J. Photogramm. Remote. Sens. 2018, 142, 268–277. [Google Scholar] [CrossRef]
- Almar, R.; Bergsma, E.W.J.; Maisongrande, P.; Melo de Almeida, L.P. Wave-derived coastal bathymetry from satellite video imagery: A showcase with Pleiades persistent mode. Remote. Sens. Environ. 2019, 231, 111263. [Google Scholar] [CrossRef]
- Turner, I.L.; Harley, M.D.; Almar Erwin, R.; Bergsma, W.J. Satellite optical imagery in Coastal Engineering. Coast. Eng. 2021, 167, 103919. [Google Scholar] [CrossRef]
- Klemas, V. Beach Profiling and LIDAR Bathymetry: An Overview with Case Studies. J. Coast. Res. 2011, 27, 1019–1028. [Google Scholar] [CrossRef]
- O’Dea, A.; Brodie, K.L.; Hartzell, P. Continuous Coastal Monitoring with an Automated Terrestrial Lidar Scanner. J. Mar. Sci. Eng. 2019, 7, 37. [Google Scholar] [CrossRef] [Green Version]
- Caballero, I.; Stumpf, R.P. On the use of Sentinel-2 satellites and lidar surveys for the change detection of shallow bathyme-try: The case study of North Carolina inlets. Coast. Eng. 2021, 169, 103936. [Google Scholar] [CrossRef]
- Thuan, D.H.; Almar, R.; Marchesiello, P.; Viet, N.T. Video Sensing of Nearshore Bathymetry Evolution with Error Estimate. J. Mar. Sci. Eng. 2019, 7, 233. [Google Scholar] [CrossRef] [Green Version]
- Carlson, D.F.; Fürsterling, A.; Vesterled, L.; Skovby, M.; Pedersen, S.S.; Melvad, C.; Rysgaard, S. An affordable and portable autonomous surface vehicle with obstacle avoidance for coastal ocean monitoring. HardwareX 2019, 6, e00059. [Google Scholar] [CrossRef]
- Archetti, R.; Damiani, L.; Bianchini, A.C.; Romagnoli, C.; Abbiati, M.; Addona, F.; Airoldi, L.; Cantelli, L.; Gaeta, M.G.; Guerrero, M.; et al. Innovative strategies, monitoring and analysis of the coastal erosion risk: The Stimare Project. In Proceedings of the 29th International Ocean and Polar Engineering Conference, ISOPE 2019, Honolulu, HI, USA, 16–21 June 2019; Volume 3, pp. 3836–3841. [Google Scholar]
- Martinelli, L.; Zanuttigh, B.; De Nigris, N.; Preti, M. Sand bag barriers for coastal protection along the Emilia Romagna littoral, Northern Adriatic Sea, Italy. Geotext. Geomembr. 2011, 29, 370–380. [Google Scholar] [CrossRef] [Green Version]
- Regione Emilia Romagna. New Tools for Coastal Management in Emilia-Romagna; Montanari, R., Marasmi, C., Eds.; Regione Emilia Romagna: Bologna, Italy, 2012; p. 61. [Google Scholar]
- Idroser. Progetto di Piano per la Difesa dal Mare e la Riqualificazione Ambientale del Litorale della Regione Emilia-Romagna. In AA.VV.; Regione Emilia Romagna: Bologna, Italy, 1996; p. 365. [Google Scholar]
- Arpa. Stato del Litorale Emiliano-Romagnolo all’anno 2000. In I quaderni di Arpa; Preti, M., Ed.; Arpa Emilia Romagna: Bologna, Italy, 2002; p. 224. ISBN 88-87854-10-6. [Google Scholar]
- Arpa. Stato del Litorale Emiliano-Romagnolo all’anno 2007 e piano decennale di gestione. In I Quaderni di Arpa; Preti, M., De Nigris, N., Morelli, M., Monti, M., Bonsignore, F., Aguzzi, M., Eds.; Arpa Emilia Romagna: Bologna, Italy, 2009; p. 270. ISBN 88-87854-21-1. [Google Scholar]
- Arpae. Stato del Litorale Emiliano-Romagnolo al 2012. Erosione e Interventi di Difesa. In I Quaderni di Arpae; Aguzzi, M., Bonsignore, F., De Nigris, N., Morelli, M., Paccagnella, T., Romagnoli, C., Unguendoli, S., Eds.; Arpa Emilia Romagna: Bologna, Italy, 2016; p. 227. ISBN 978-88-87854-41-1. [Google Scholar]
- Vecchi, E.; Aguzzi, M.; Albertazzi, C.; De Nigris, N.; Gandolfi, S.; Morelli, M.; Tavasci, L. Third beach nourishment project with submarine sands along Emilia-Romagna coast: Geomatic methods and first monitoring results. Rend. Lincei Sci. Fis. Nat. 2020, 31, 79–88. [Google Scholar] [CrossRef]
- Arpae. Monitoraggio morfologico e sedimentologico delle 8 spiagge oggetto di ripascimento—Monitoraggio morfologico dell’area al largo di prelievo delle sabbie—Rete Geodetica Costiera. In Risultati, AA.VV.; Arpae Emilia Romagna: Bologna, Italy, 2019; p. 249. [Google Scholar]
- Lamberti, A.; Mancinelli, A. Italian experience on submerged barriers as beach defence structures. In Proceedings of the Coastal Engineering Proceedings, Orlando, FL, USA, 2–6 September 1996; Volume 1, pp. 2352–2365. [Google Scholar]
- Poulain, P.M.; Kourafalou, V.H.; Cushman-Roisin, B. Northern Adriatic Sea. In Physical Oceanography of the Adriatic Sea Past, Present and Future; Cushman-Roisin, B., Gacic, M., Poulain, P.M., Artegiani, A., Eds.; Kluwer Academic Publishers: Dordrecht, The Netherlands, 2001. [Google Scholar] [CrossRef]
- Lionello, P.; Cavaleri, L.; Nissen, K.M.; Pino, C.; Raicich, F.; Ulbrich, U. Severe marine storms in the Northern Adriatic: Characteristics and trends. Phys. Chem. Earth Parts A/B/C 2012, 40–41, 93–105. [Google Scholar] [CrossRef]
- Arpae. Available online: http://www.smr.arpa.emr.it/dext3rhttps://www.arpae.it/sim/?mare/boa (accessed on 27 December 2020).
- Masina, M.; Ciavola, P. Analisi dei livelli marini estremi e delle acque alte lungo il litorale ravennate. Studi Costieri 2011, 18, 87–101. [Google Scholar]
- Fabbri, S.; Giambastiani, B.M.S.; Sistilli, F.; Scarelli, F.; Gabbianelli, G. Geomorphological analysis and classification of foredune ridges based on Terrestrial Laser Scanning (TLS) technology. Geomorphology 2017, 295, 436–451. [Google Scholar] [CrossRef]
- Mancini, F.; Dubbini, M.; Gattelli, M.; Stecchi, F.; Fabbri, S.; Gabbianelli, G. Using Unmanned Aerial Vehicles (UAV) for High-Resolution Reconstruction of Topography: The Structure from Motion Approach on Coastal Environments. Remote. Sens. 2015, 5, 6880–6898. [Google Scholar] [CrossRef] [Green Version]
- Scarelli, F.; Sistilli, F.; Fabbri, S.; Cantelli, L.; Barboza, E.; Gabbianelli, G. Seasonal dune and beach monitoring using photo-grammetry from UAV surveys to apply in the ICZM on the Ravenna coast (Emilia-Romagna, Italy). Remote. Sens. Appl. Soc. Environ. 2017, 7, 27–39. [Google Scholar]
- Perini, L.; Calabrese, L.; Deserti, M.; Valentini, A.; Ciavola, P.; Armaroli, C. Le mareggiate e gli impatti sulla costa in Emilia-Romagna 1946–2010. In I quaderni di Arpa; Arpa Emilia Romagna: Bologna, Italy, 2011. [Google Scholar]
- Dolan, R.; Davis, R.E. An intensity scale for Atlantic coast northeast storms. J. Coast. Res. 1992, 8, 352–364. [Google Scholar]
- Mendoza, E.; Jiménez, J. Storm-Induced Beach Erosion Potential on the Catalonian Coast. J. Coast. Res. 2004, 48, 81–88. [Google Scholar]
- Archetti, R.; Paci, A.; Carniel, S.; Bonaldo, D. Optimal index related to the shoreline dynamics during a storm: The case of Jesolo beach. Nat. Hazards Earth Syst. Sci. 2016, 16, 1107–1122. [Google Scholar] [CrossRef] [Green Version]
- Preti, M. I due interventi di ripascimento con sabbie sottomarine realizzati in Emilia-Romagna nel 2002 e nel 2007. Studi Costieri 2011, 19, 7–9. [Google Scholar]
- Preti, M.; Aguzzi, M.; Costantino, R.; De Nigris, N.; Morelli, M. Monitoraggio delle spiagge nel periodo 2007–2009. Studi Costieri 2011, 19, 137–198. [Google Scholar]
- Cavaleri, L.; Bajo, M.; Barbariol, F.; Bastianini, M.; Benetazzo, A.; Bertotti, L.; Chiggiato, J.; Ferrarin, C.; Umgiesser, G.; Trincardi, F. The 2019 Flooding of Venice and Its Implications for Future Predictions. Oceanography 2020, 33, 42–49. [Google Scholar] [CrossRef] [Green Version]


| Date | Kind of Survey | Project/Activity |
|---|---|---|
| 28 November 2017 | GNSS + MBES | Arpae monitoring |
| 3 November 2018 | GNSS + MBES | “ ” |
| 24 May 2019 | TLS + GNSS- + MBES | STIMARE project |
| 6 December 2019 | GNSS- + MBES | “ ” |
| 16–23 February 2021 | TLS + GNSS- + MBES | “ ” |
| Comparison | Interannual | Seasonal | Overall | ||||
|---|---|---|---|---|---|---|---|
| November 2017–November 2018 | November 2018–December 2019 | December 2019–February 2021 | November 2018–May 2019 | May 2019–December 2019 | November 2017–February 2021 | ||
| Zone 1 | Volume difference | 2370 | 80 | 170 | 1920 | 610 | 20 |
| −590 | −11,290 | −4210 | −5240 | −8510 | −13,520 | ||
| Net Δ Volume | 1780 | −11,220 | −4050 | −3320 | −7900 | −13,500 | |
| Zone 2 | Volume difference | 10,150 | 15,690 | 4190 | 11,180 | 9960 | 10,720 |
| −3230 | −11,340 | −12,580 | −5650 | −11,140 | −7850 | ||
| Net Δ Volume | 6920 | 4350 | −8390 | 5540 | −1190 | 2880 | |
| Zone 3 | Volume difference | 2130 | 2370 | 510 | 7530 | 40 | 2910 |
| −3290 | −2800 | −7000 | −890 | −7050 | −10,910 | ||
| Net Δ Volume | −1150 | −420 | −6450 | 6640 | −7010 | −7990 | |
| Zone 4 | Volume difference | 320 | 4960 | 60 | 12,420 | 130 | 80 |
| −2770 | −410 | −13,430 | −210 | −7790 | −11,350 | ||
| Net Δ Volume | −2450 | 4550 | −13,370 | 12,210 | −7660 | −11,270 | |
| Total area | Volume difference | 14,950 | 23,060 | 4920 | 32,990 | 10,750 | 13,670 |
| −9900 | −25,890 | −37,210 | −11,990 | −34,580 | −43,750 | ||
| Net Δ Volume | 5050 | −2830 | −32,290 | 21,000 | −23,840 | −30,080 | |
| I—Weak | II—Moderate | III—Significant | IV—Severe | |
|---|---|---|---|---|
| 2017 | 44.45% | 22.22% | 22.22% | 11.11% |
| 2018 | 46.68% | 26.66% | 26.66% | 0.00% |
| 2019 | 66.68% | 16.66% | 16.66% | 0.00% |
| 2020 | 45.45% | 36.37% | 18.18% | 0.00% |
Publisher’s Note: MDPI stays neutral with regard to jurisdictional claims in published maps and institutional affiliations. |
© 2021 by the authors. Licensee MDPI, Basel, Switzerland. This article is an open access article distributed under the terms and conditions of the Creative Commons Attribution (CC BY) license (https://creativecommons.org/licenses/by/4.0/).
Share and Cite
Romagnoli, C.; Sistilli, F.; Cantelli, L.; Aguzzi, M.; De Nigris, N.; Morelli, M.; Gaeta, M.G.; Archetti, R. Beach Monitoring and Morphological Response in the Presence of Coastal Defense Strategies at Riccione (Italy). J. Mar. Sci. Eng. 2021, 9, 851. https://doi.org/10.3390/jmse9080851
Romagnoli C, Sistilli F, Cantelli L, Aguzzi M, De Nigris N, Morelli M, Gaeta MG, Archetti R. Beach Monitoring and Morphological Response in the Presence of Coastal Defense Strategies at Riccione (Italy). Journal of Marine Science and Engineering. 2021; 9(8):851. https://doi.org/10.3390/jmse9080851
Chicago/Turabian StyleRomagnoli, Claudia, Flavia Sistilli, Luigi Cantelli, Margherita Aguzzi, Nunzio De Nigris, Maurizio Morelli, Maria Gabriella Gaeta, and Renata Archetti. 2021. "Beach Monitoring and Morphological Response in the Presence of Coastal Defense Strategies at Riccione (Italy)" Journal of Marine Science and Engineering 9, no. 8: 851. https://doi.org/10.3390/jmse9080851