
Understanding the Cognitive Components of Coastal Risk Assessment


Abstract
:1. Introduction
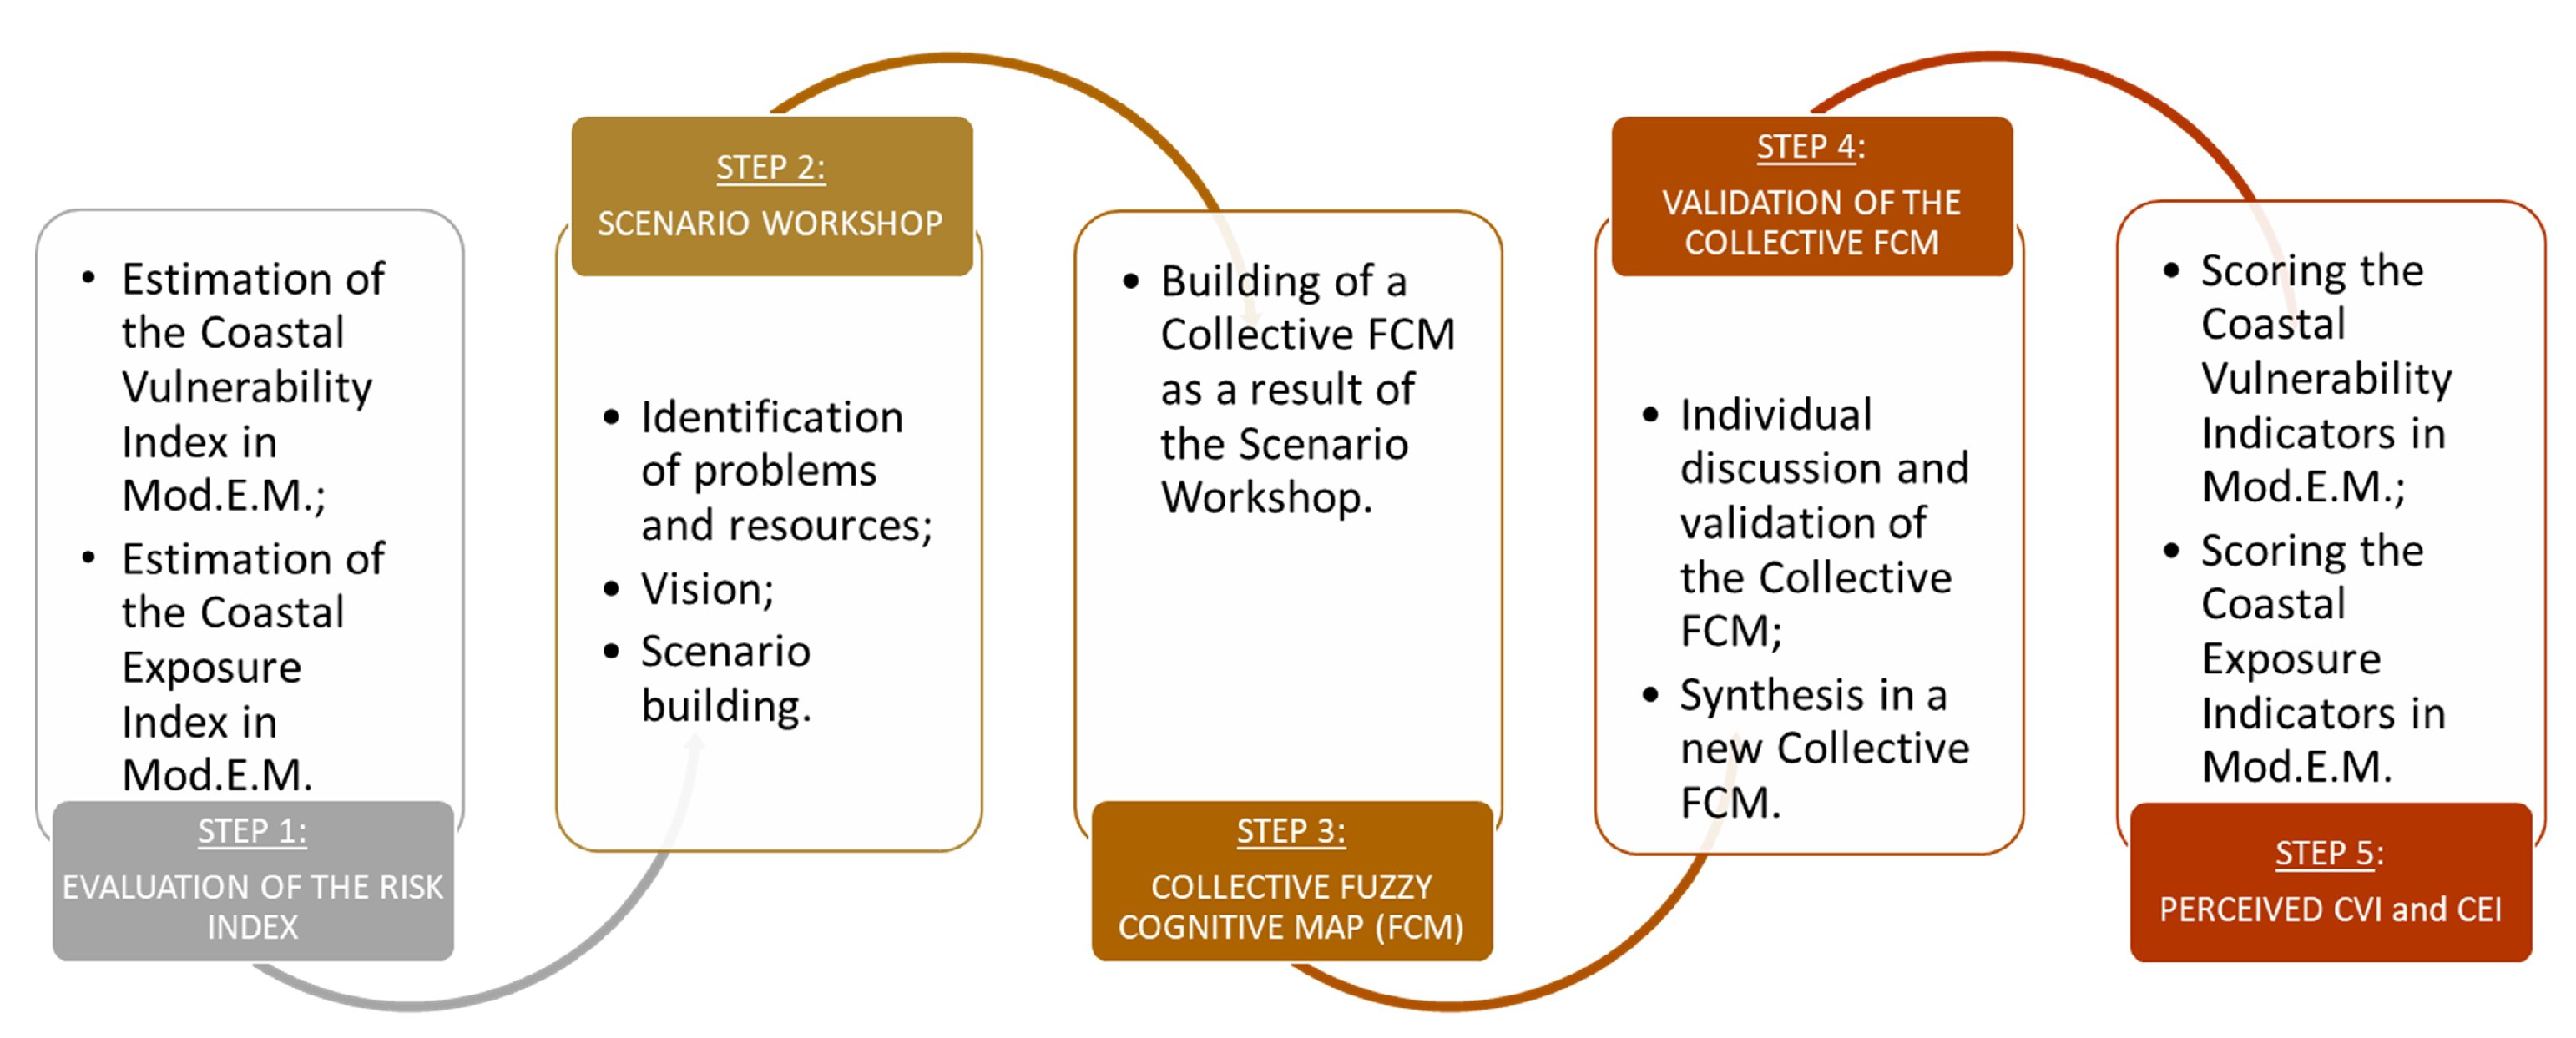
2. Method
2.1. Step 1: The Physical Coastal Risk
2.2. The Perceived Coastal Risk
2.2.1. Step 2: The Scenario Workshop
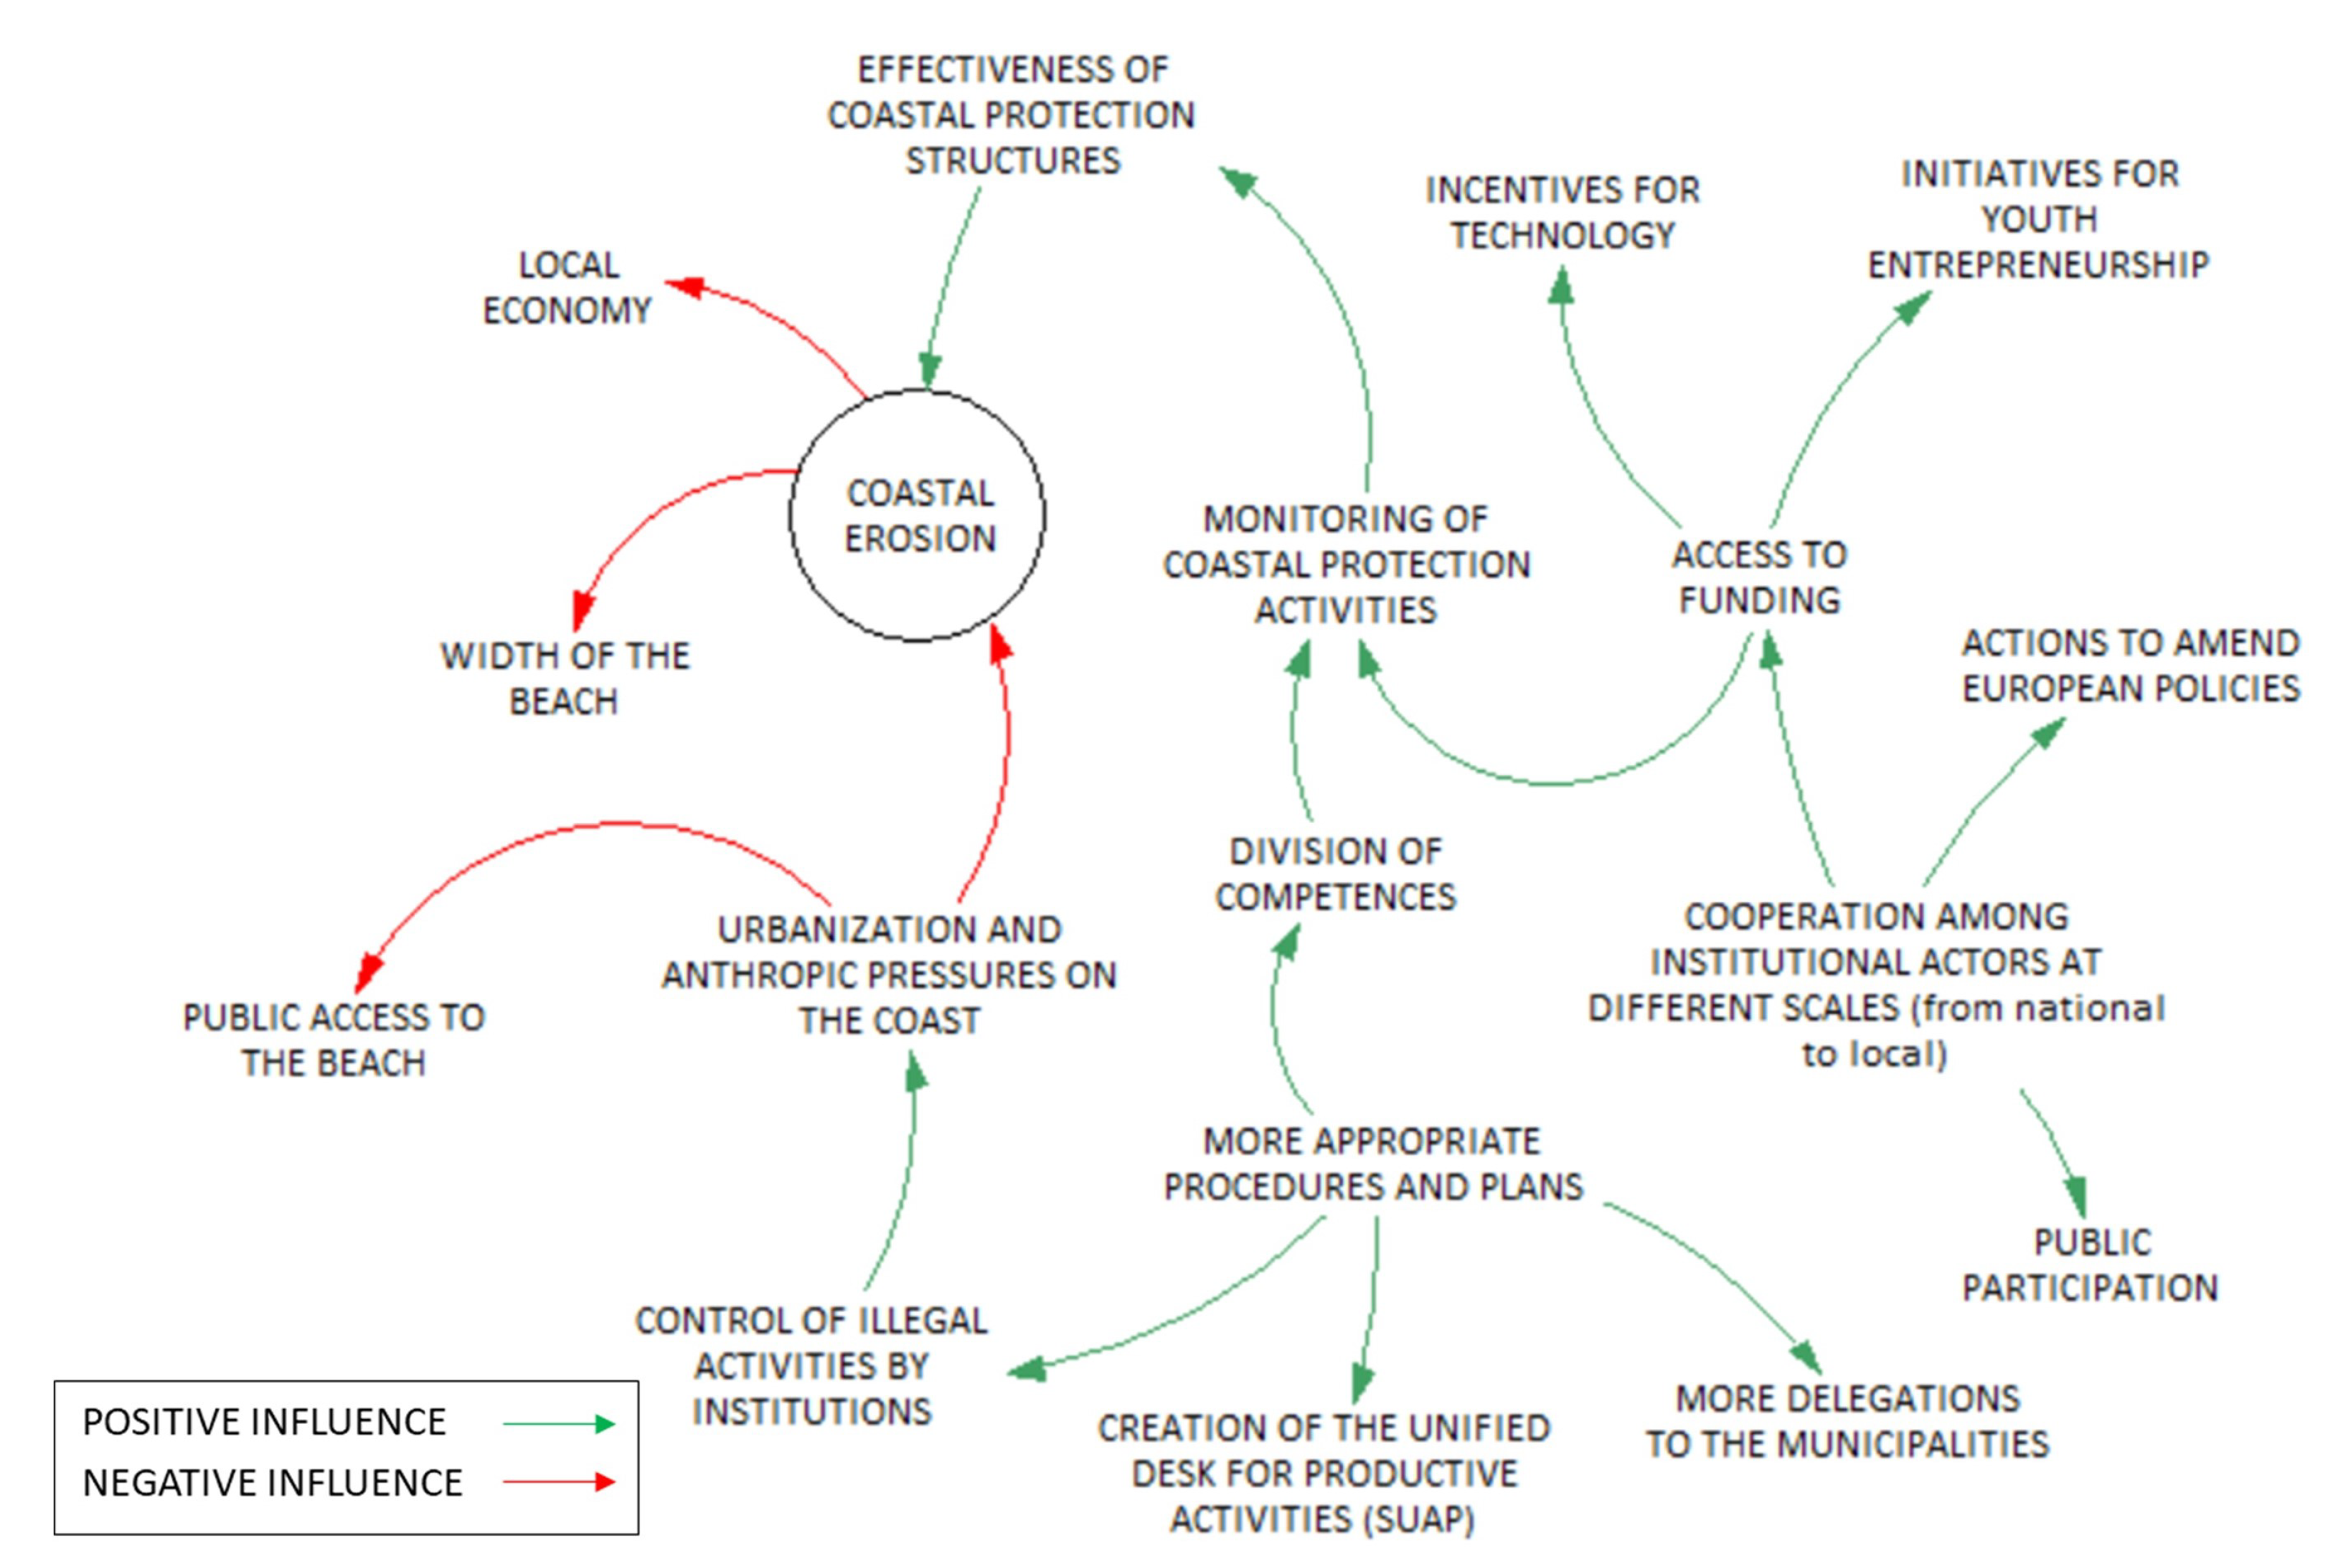
2.2.2. Step 3: The Collective-Fuzzy Cognitive Map
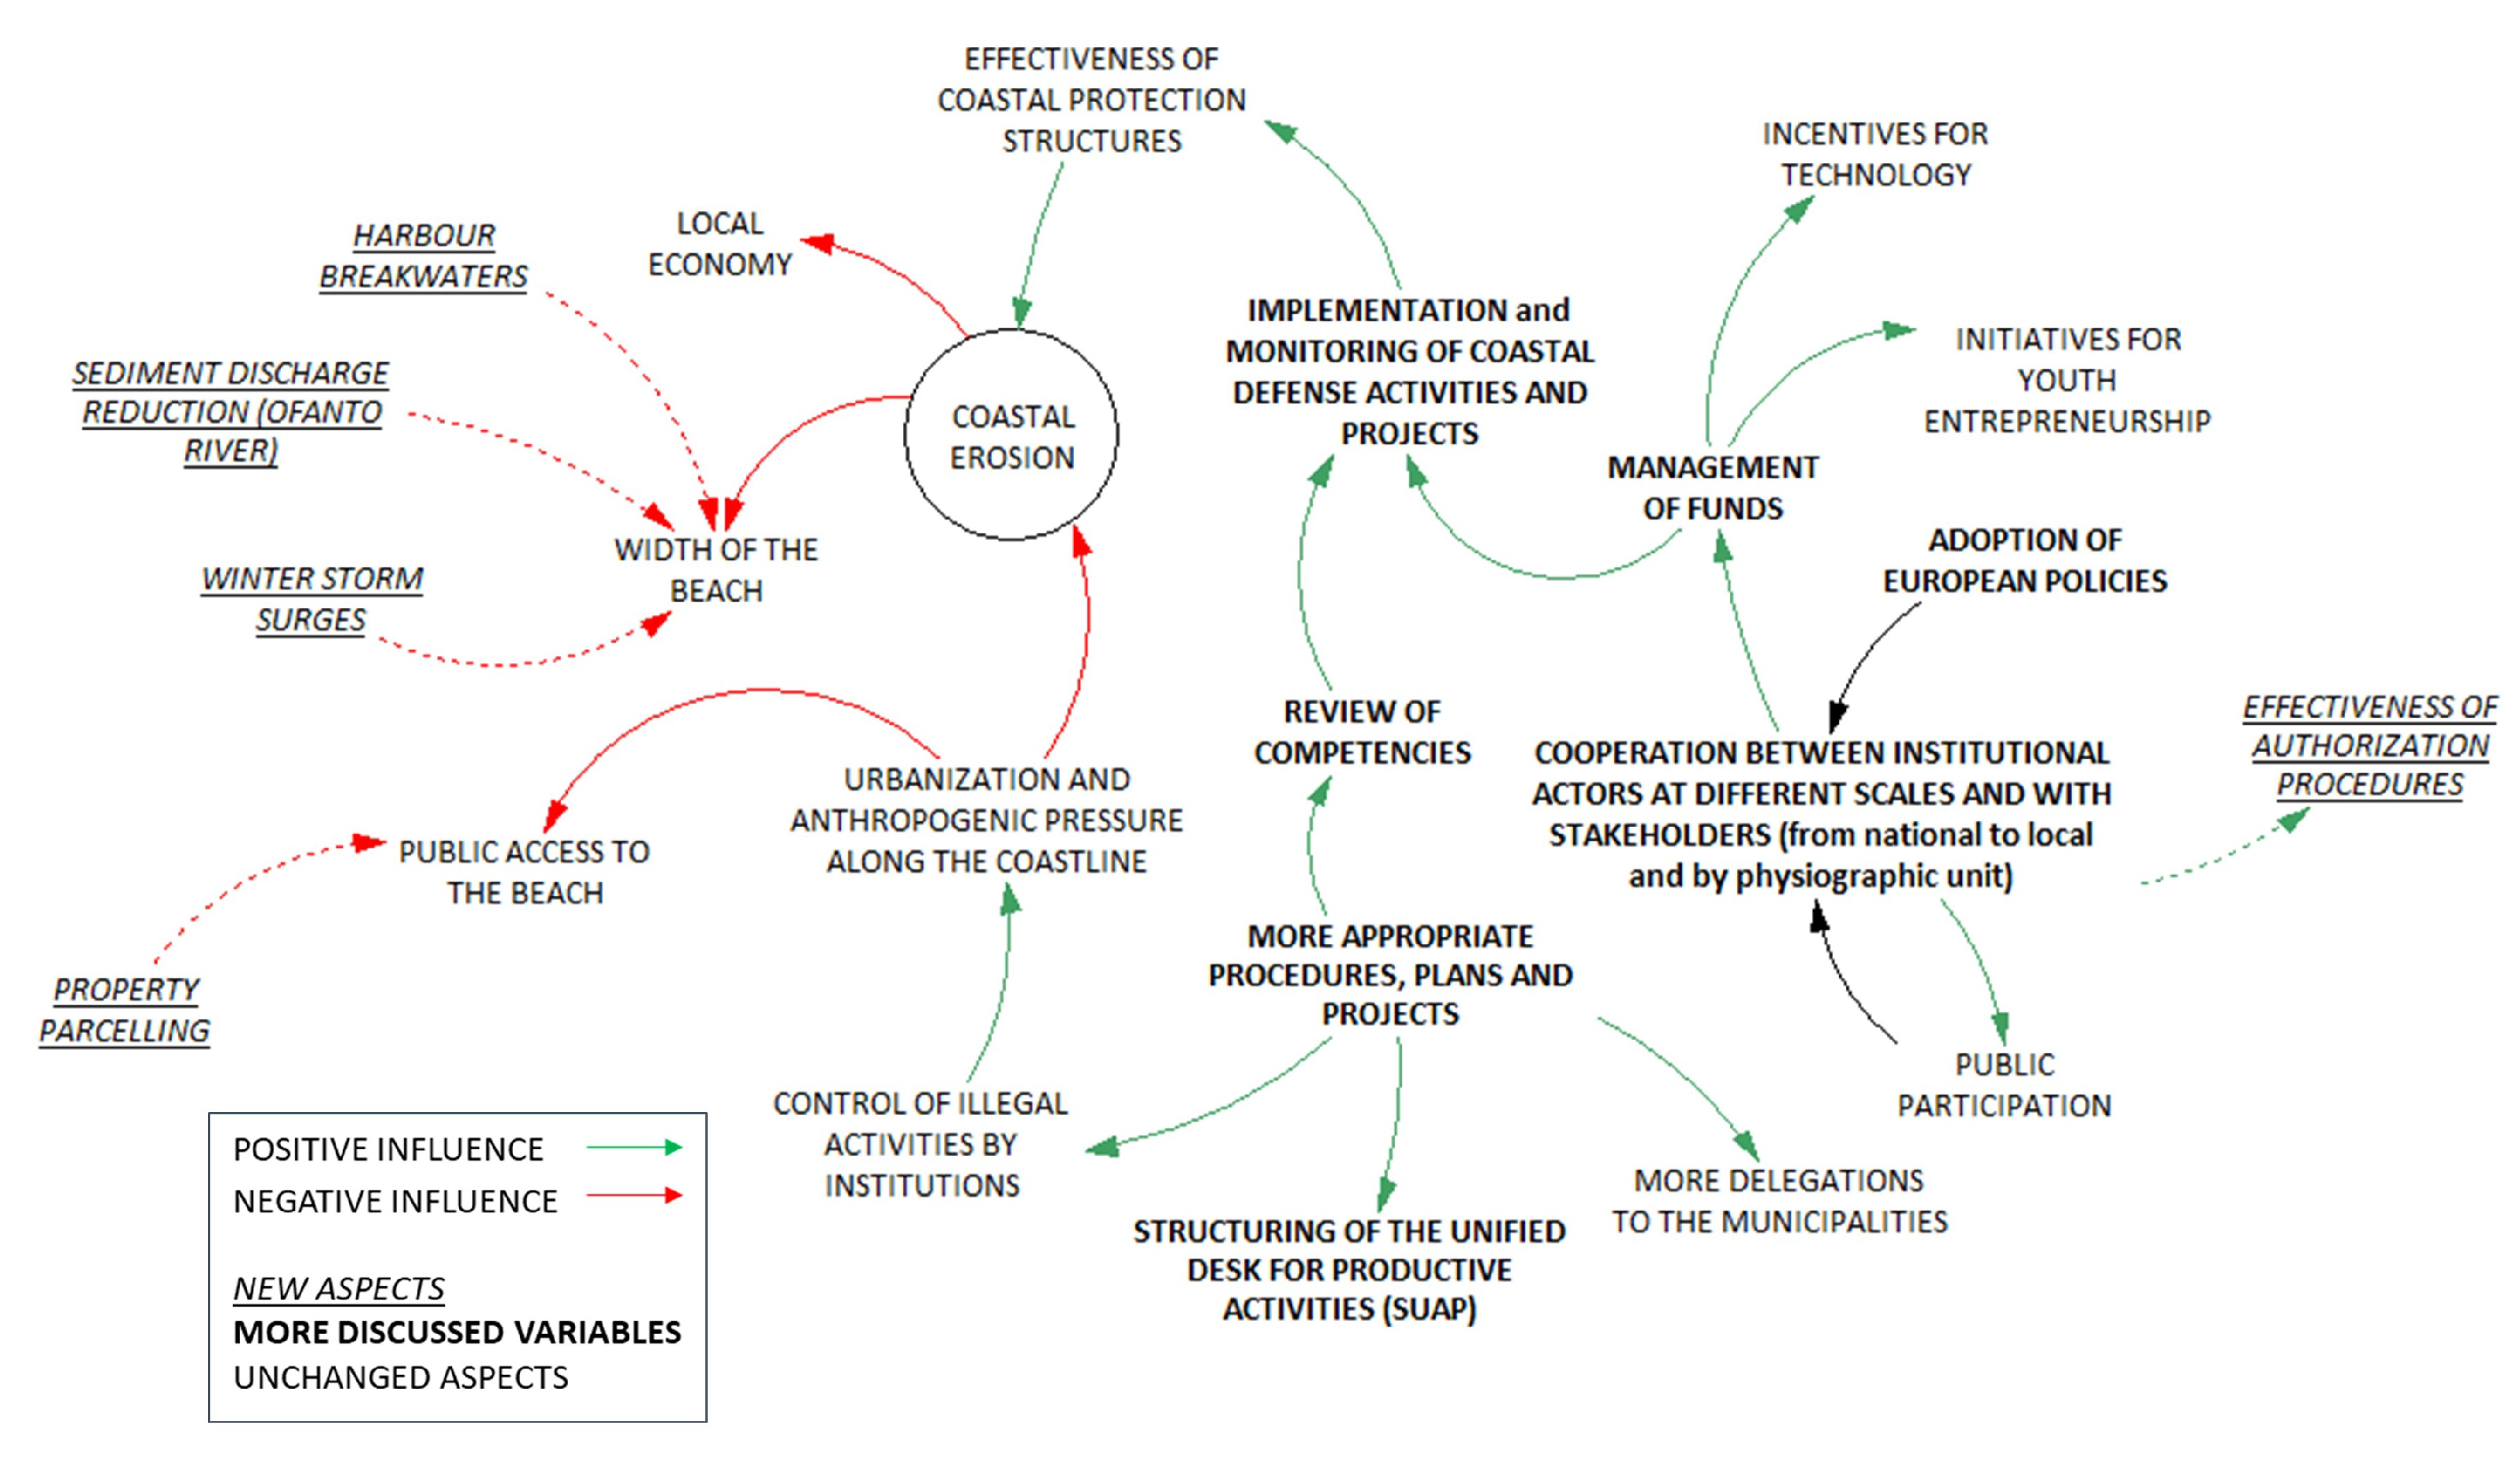
2.2.3. Step 4: The Validation of the Collective-Fuzzy Cognitive Map
2.2.4. Step 5: Evaluation of CVI and CEI Indices by Stakeholders and Policy Makers
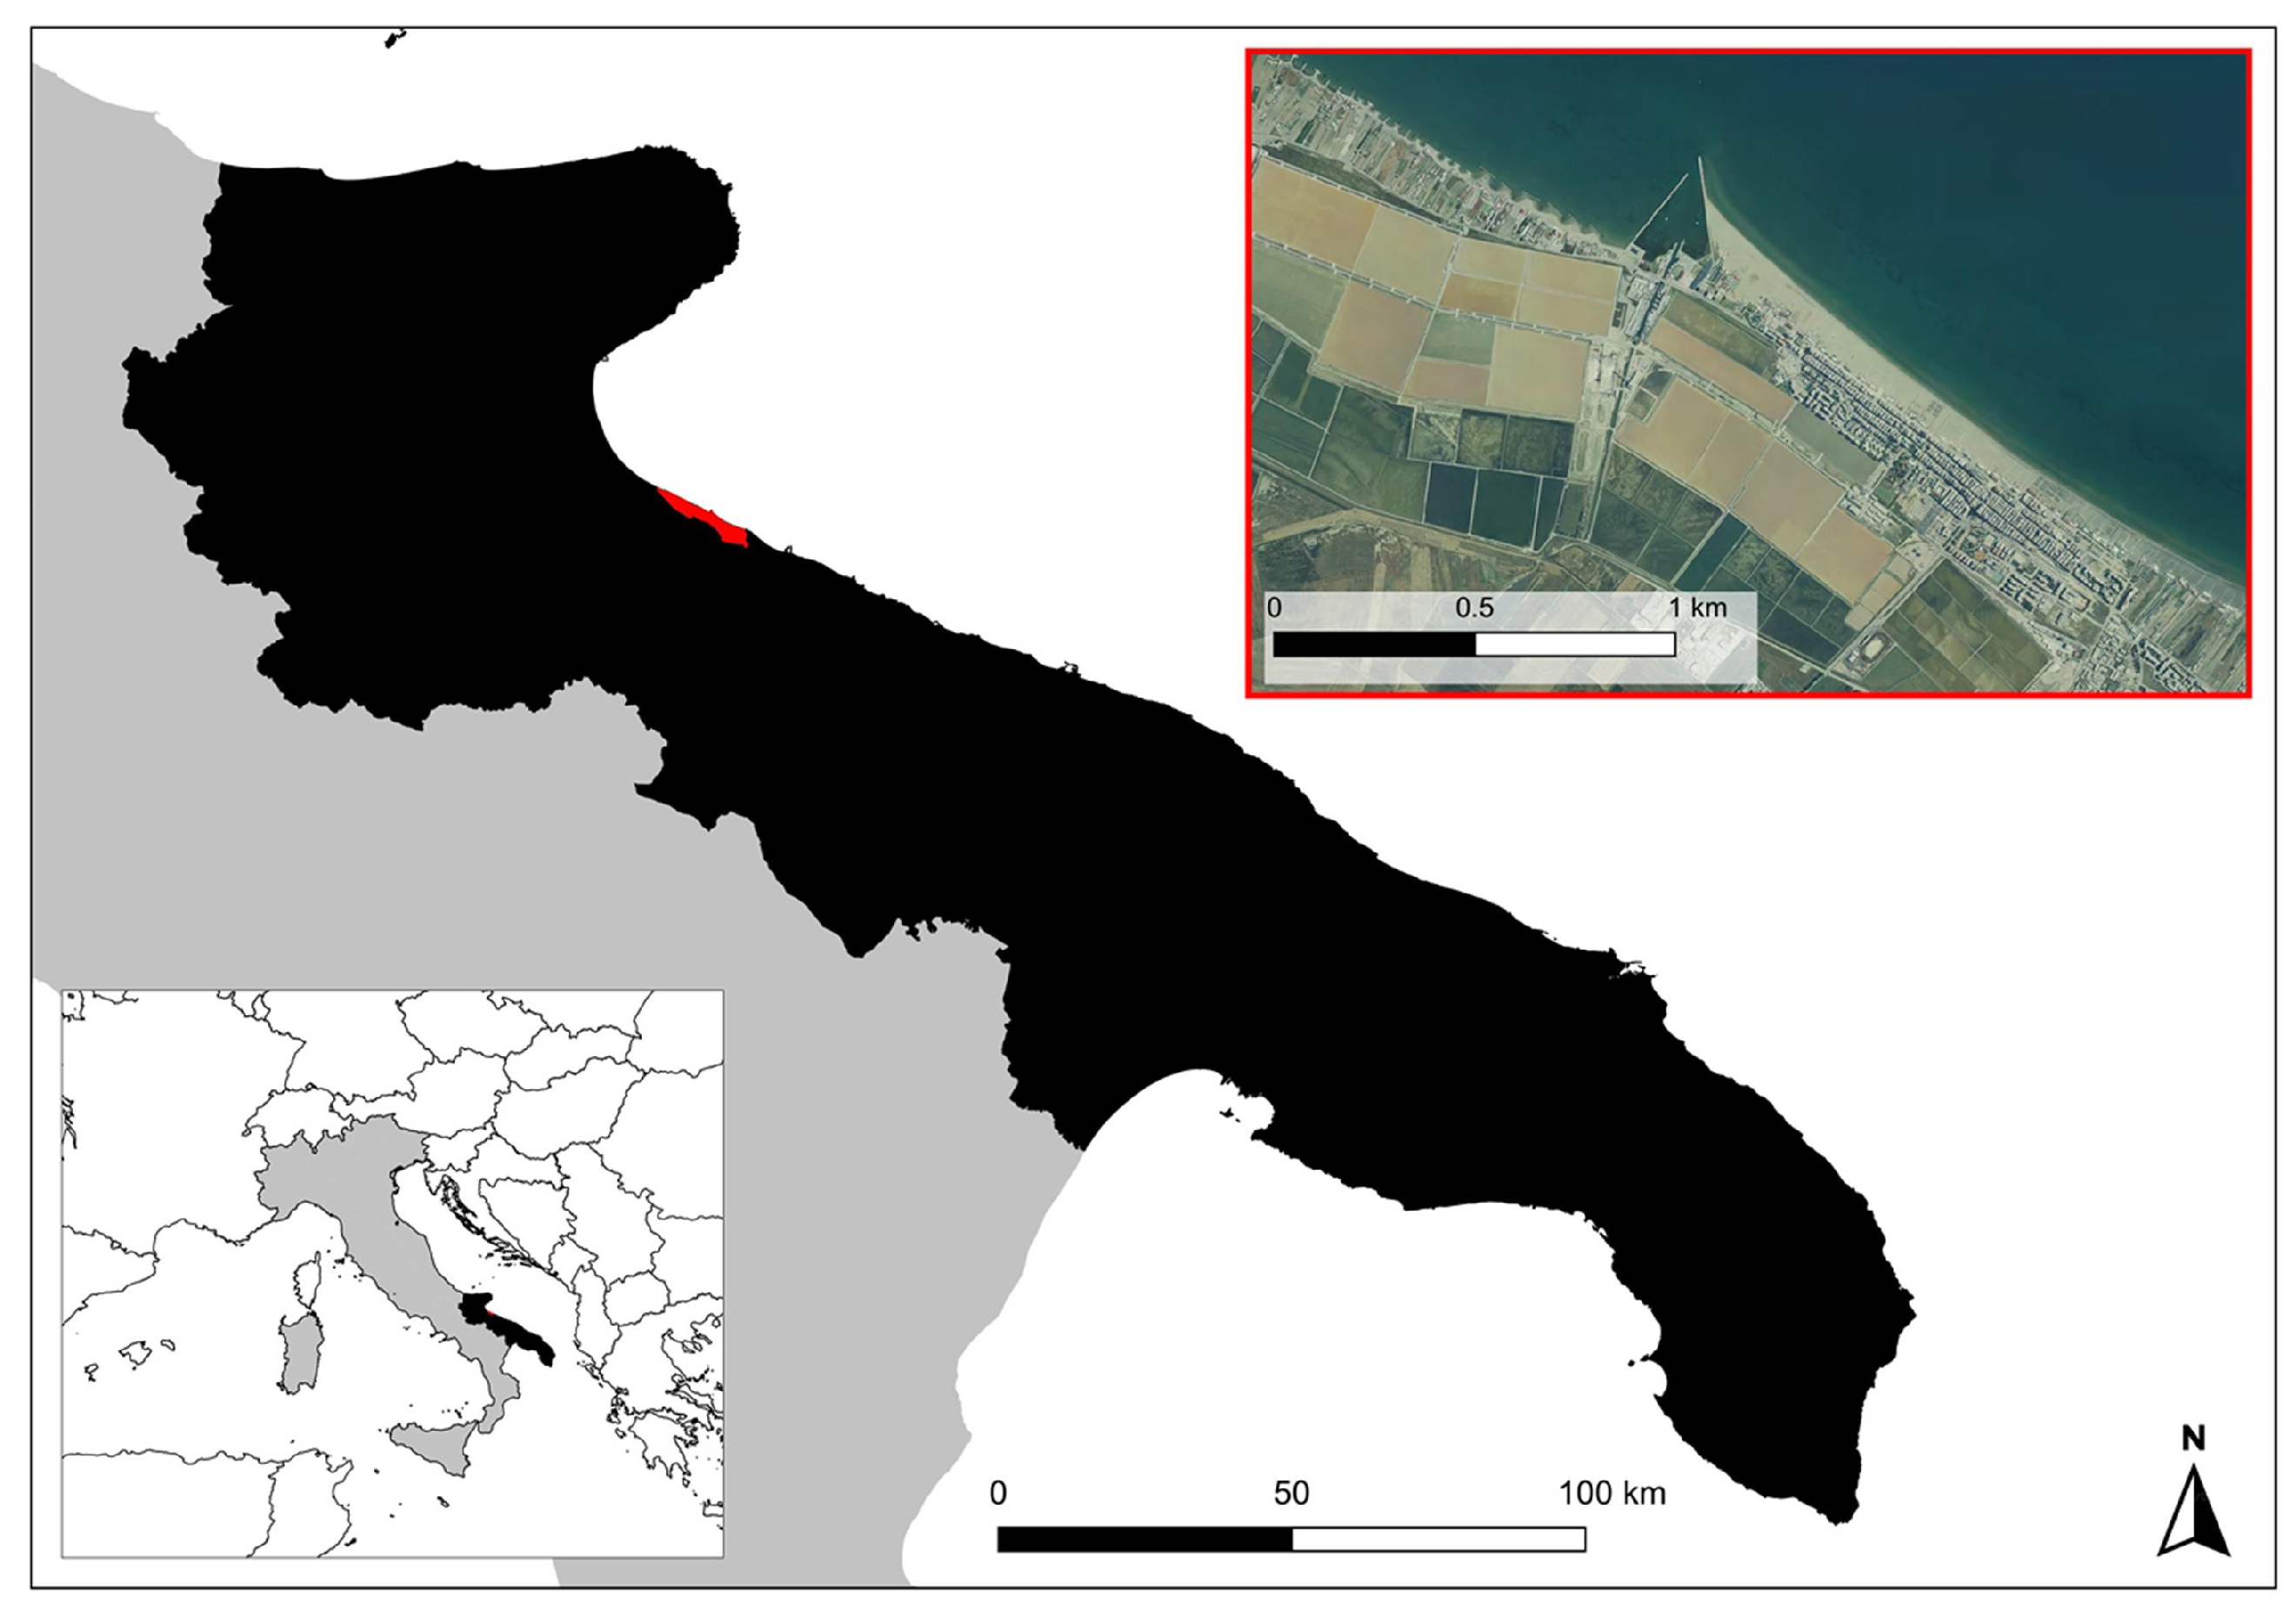
3. The Study Area: Margherita Di Savoia (Puglia Region, Southern Italy)
4. Results
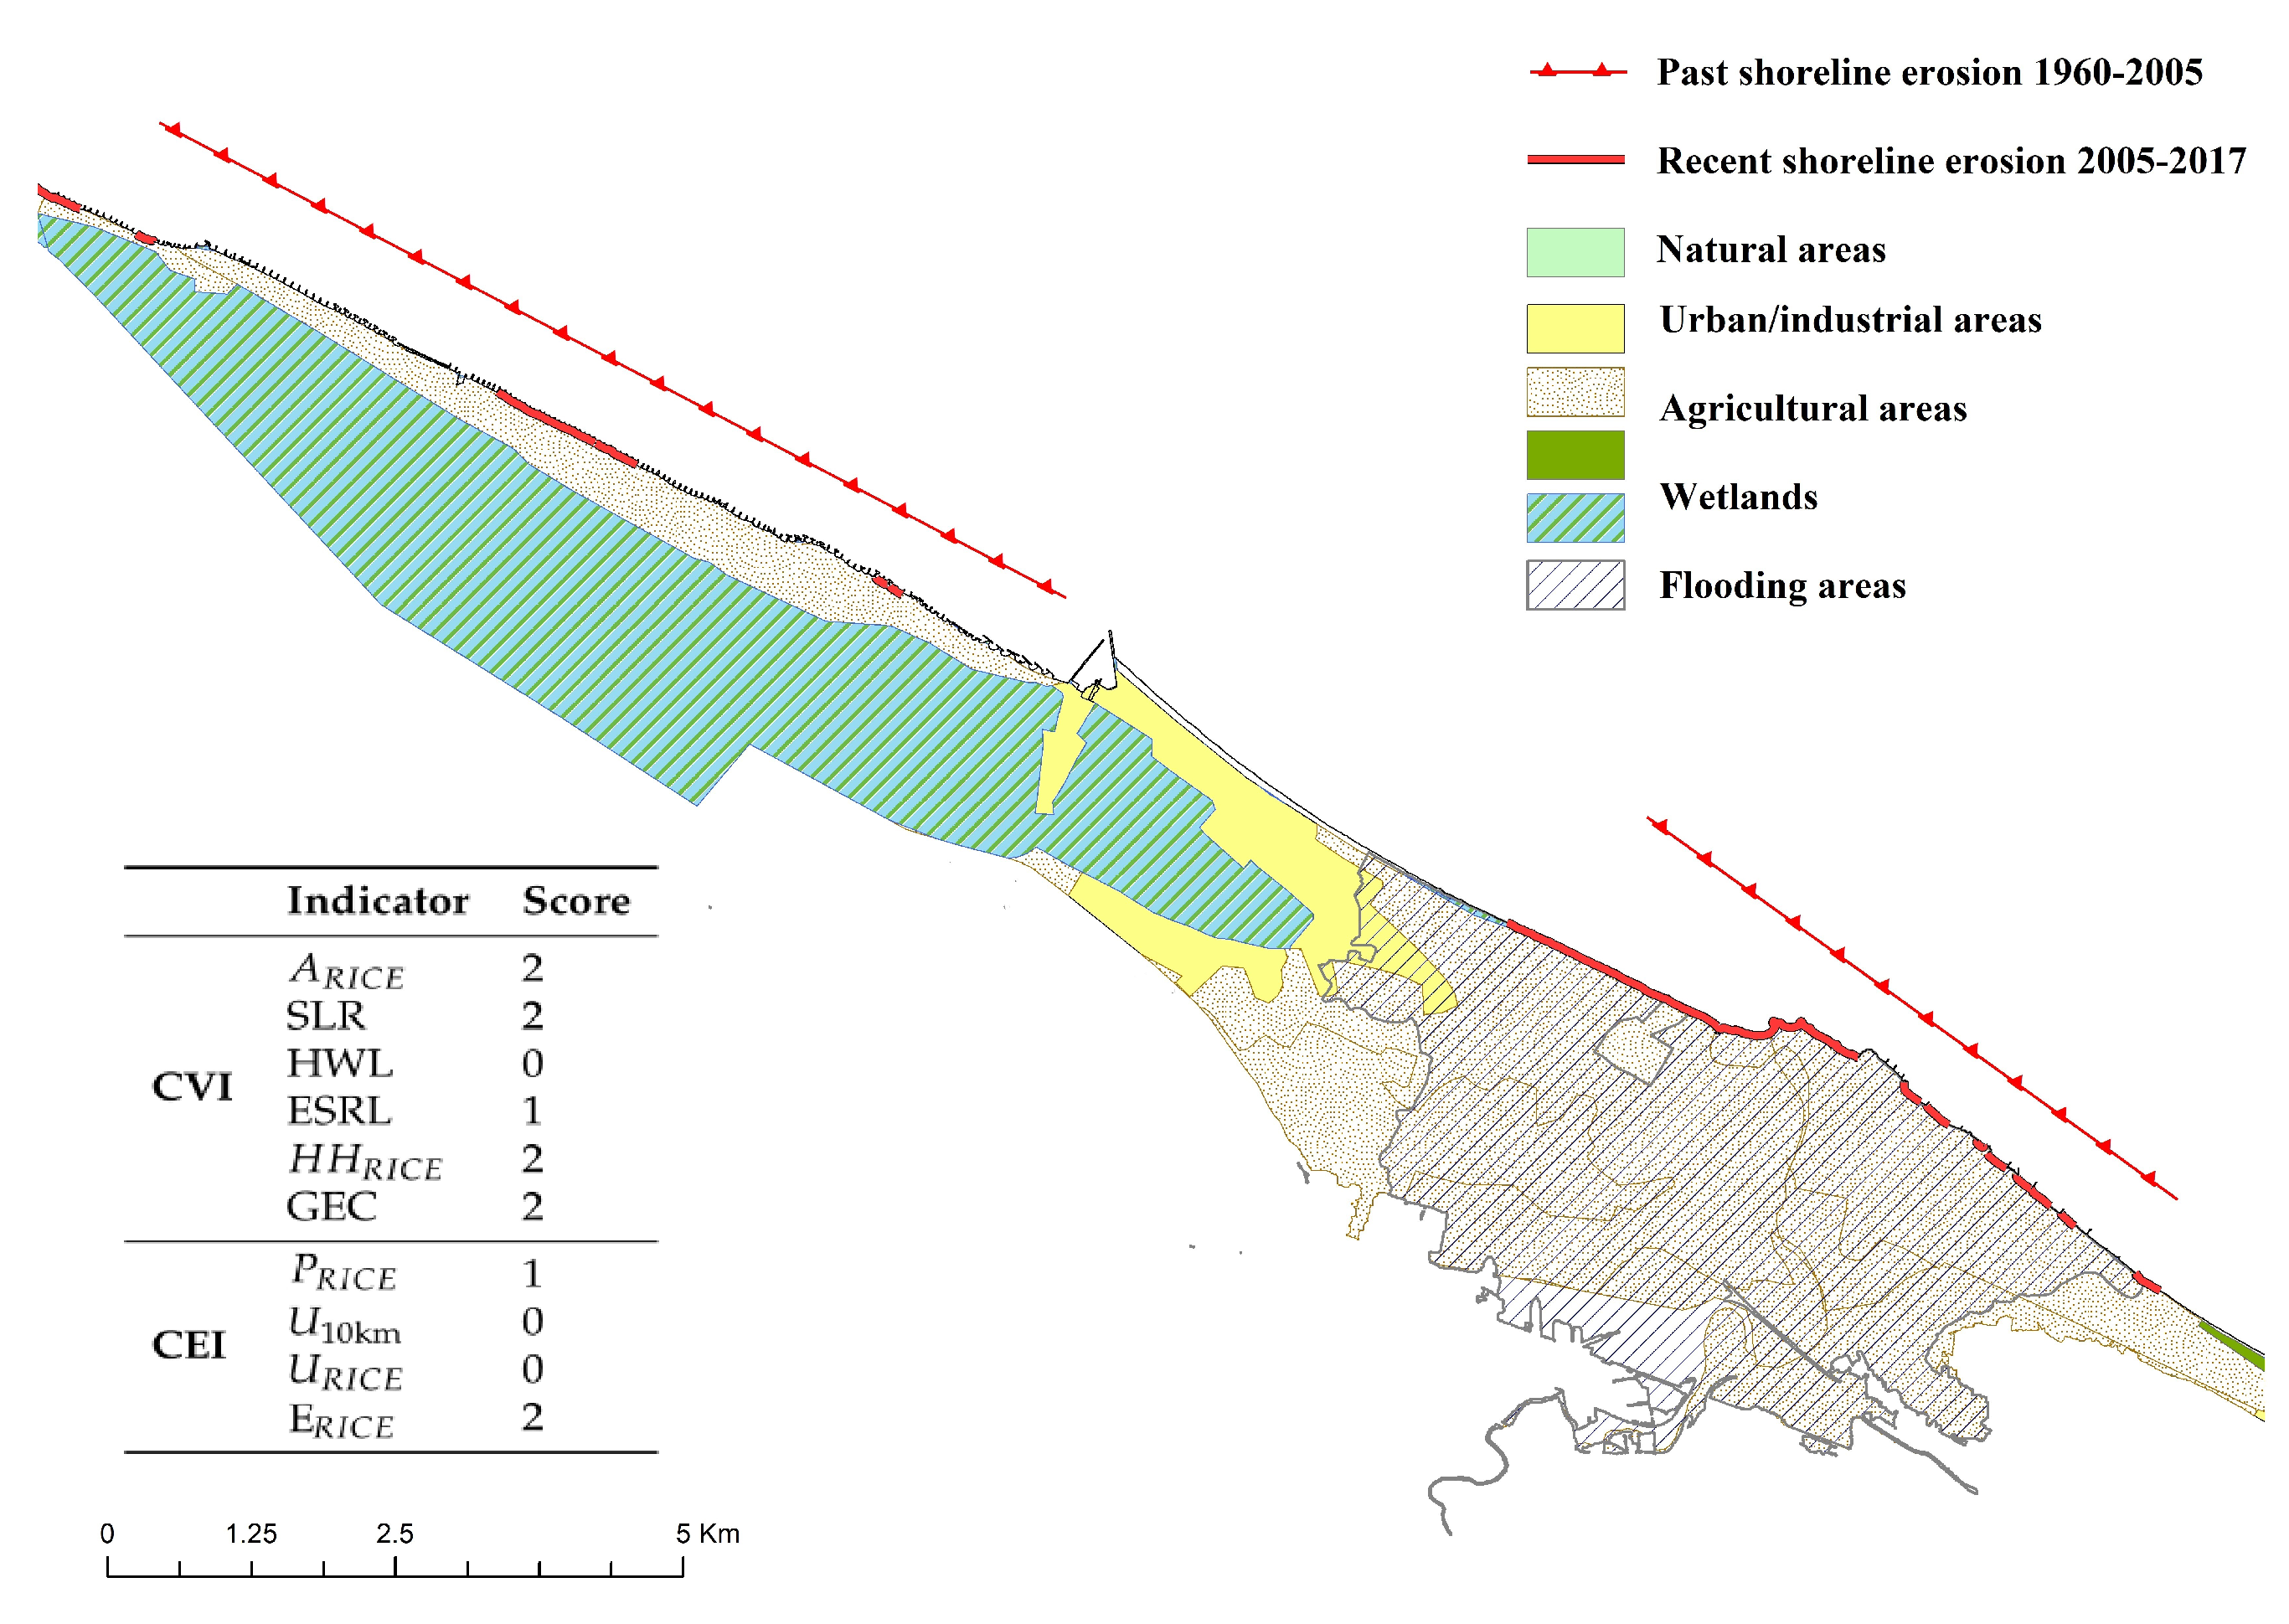
4.1. The Physical Coastal Risk in the Test Site
4.2. The Perceived Coastal Risk in the Test Site
5. Discussion
6. Conclusions
Author Contributions
Funding
Institutional Review Board Statement
Informed Consent Statement
Data Availability Statement
Conflicts of Interest
References
- Neumann, B.; Vafeidis, A.T.; Zimmermann, J.; Nicholls, R.J. Future coastal population growth and exposure to sea-level rise and coastal flooding-a global assessment. PLoS ONE 2015, 10, e0118571. [Google Scholar] [CrossRef] [Green Version]
- Vousdoukas, M.I.; Mentaschi, L.; Voukouvalas, E.; Bianchi, A.; Dottori, F.; Feyen, L. Climatic and socioeconomic controls of future coastal flood risk in Europe. Nat. Clim. Chang. 2018, 8, 776–780. [Google Scholar] [CrossRef]
- Adger, W.; Hughes, T.; Folke, C.; Carpenter, S.R.; Rockström, J. Social-ecological resilience to coastal disasters. Science 2005, 309, 1036–1039. [Google Scholar] [CrossRef] [PubMed] [Green Version]
- Crichton, D. The risk triangle. In Natural Disaster Management; Ingleton, J., Ed.; Tudor Rose: London, UK, 1999; pp. 102–103. [Google Scholar]
- Cardona, O.D.; Van Aalst, M.K.; Birkmann, J.; Fordham, M.; Mc Gregor, G.; Rosa, P.; Pulwarty, R.S.; Schipper, E.L.F.; Sinh, B.T.; Décamps, H.; et al. Determinants of risk: Exposure and vulnerability. In Managing the Risks of Extreme Events and Disasters to Advance Climate Change Adaptation: Special Report of the Intergovernmental Panel on Climate Change; Cambridge University Press: Cambridge, UK, 2012; pp. 65–108. [Google Scholar]
- Vousdoukas, M.I.; Ranasinghe, R.; Mentaschi, L.; Plomaritis, T.A.; Athanasiou, P.; Luijendijk, A.; Feyen, L. Sandy coastlines under threat of erosion. Nat. Clim. Chang. 2020, 10, 260–263. [Google Scholar] [CrossRef]
- Kirezci, E.; Young, I.R.; Ranasinghe, R.; Muis, S.; Nicholls, R.J.; Lincke, D.; Hinkel, J. Projections of global-scale extreme sea levels and resulting episodic coastal flooding over the 21st Century. Sci. Rep. 2020, 10, 1–12. [Google Scholar] [CrossRef] [PubMed]
- Pellicani, R.; Argentiero, I.; Fidelibus, M.D.; Motta Zanin, G.; Parisi, A.; Spilotro, G. Dynamics of the Basilicata Ionian coast: Human and natural drivers. Rend. Lincei. Sci. Fis. E Nat. 2020, 31, 353–364. [Google Scholar] [CrossRef]
- Parisi, A.; Monno, V.; Fidelibus, M. Cascading vulnerability scenarios in the management of groundwater depletion and salinization in semi-arid areas. Int. J. Disaster Risk Reduct. 2018, 30, 292–305. [Google Scholar] [CrossRef]
- Folke, C.; Hahn, T.; Olsson, P.; Norberg, J. Adaptive governance of social-ecological systems. Annu. Rev. Environ. Resour. 2005, 30, 441–473. [Google Scholar] [CrossRef] [Green Version]
- Holling, C.S. Resilience and stability of ecological systems. Annu. Rev. Ecol. Syst. 1973, 4, 1–23. [Google Scholar] [CrossRef] [Green Version]
- Hinkel, J.; Klein, R.J. Integrating knowledge to assess coastal vulnerability to sea-level rise: The development of the DIVA tool. Glob. Environ. Chang. 2009, 19, 384–395. [Google Scholar] [CrossRef]
- Torresan, S.; Critto, A.; Rizzi, J.; Marcomini, A. Assessment of coastal vulnerability to climate change hazards at the regional scale: The case study of the North Adriatic Sea. Nat. Hazards Earth Syst. Sci. 2012, 12, 2347–2368. [Google Scholar] [CrossRef]
- Zanuttigh, B.; Simcic, D.; Bagli, S.; Bozzeda, F.; Pietrantoni, L.; Zagonari, F.; Hoggart, S.; Nicholls, R.J. THESEUS decision support system for coastal risk management. Coast. Eng. 2014, 87, 218–239. [Google Scholar] [CrossRef]
- Van Dongeren, A.; Ciavola, P.; Martinez, G.; Viavattene, C.; Bogaard, T.; Ferreira, O.; Higgins, R.; McCall, R. Introduction to RISC-KIT: Resilience-increasing strategies for coasts. Coast. Eng. 2018, 134, 2–9. [Google Scholar] [CrossRef] [Green Version]
- Estrela-Segrelles, C.; Gomez-Martinez, G.; Perez-Martin, M.A. Risk assessment of climate change impacts on Mediterranean coastal wetlands. Application in Jucar River Basin District (Spain). Sci. Total Environ. 2021, 790, 148032. [Google Scholar] [CrossRef]
- Cogswell, A.; Greenan, B.J.; Greyson, P. Evaluation of two common vulnerability index calculation methods. Ocean Coast. Manag. 2018, 160, 46–51. [Google Scholar] [CrossRef]
- Gornitz, V.M.; Daniels, R.C.; White, T.W.; Birdwell, K.R. The development of a coastal risk assessment database: Vulnerability to sea-level rise in the US Southeast. J. Coast. Res. 1994, 12, 327–338. [Google Scholar]
- Mosley, S. Coastal cities and environmental change. Environ. Hist. 2014, 20, 517–533. [Google Scholar] [CrossRef]
- Barragán, J.M.; de Andrés, M. Analysis and trends of the world’s coastal cities and agglomerations. Ocean Coast. Manag. 2015, 114, 11–20. [Google Scholar] [CrossRef]
- Besio, G. Il Progetto Della Costa: Le Sistemazioni Costiere; Donzelli: Roma, Italy, 2014. [Google Scholar]
- Dreyer, M.; Boström, M.; Jönsson, A.M. Participatory deliberation, risk governance and management of the marine region in the European Union. J. Environ. Policy Plan. 2014, 16, 497–515. [Google Scholar] [CrossRef]
- Motta Zanin, G. The role of experiential knowledge in risk management of coastal landscapes. A case study in the Mediterranean Basin. In Landscape at Risk; Luciano Editore: Napoli, Italy, 2020. [Google Scholar]
- Salomons, W.; Turner, K.; de Lacerda, L.D.; Ramachandran, S. Perspectives on Integrated Coastal Zone Management; Springer Science & Business Media: Berlin/Heidelberg, Germany, 2012. [Google Scholar]
- Environmental European Commission. Recommendation of the European Parliament and of the Council of 30 May 2002 Concerning the Implementation of Integrated Coastal Zone Management in Europe. Off. J. Eur. Commun 2002, 148, 22–27. [Google Scholar]
- Alterman, R.; Pellach, C. Regulating Coastal Zones: International Perspectives on Land Management Instruments; Routledge: London, UK, 2020. [Google Scholar]
- Bruno, M.F.; Saponieri, A.; Molfetta, M.G.; Damiani, L. The DPSIR Approach for Coastal Risk Assessment under Climate Change at Regional Scale: The Case of Apulian Coast (Italy). J. Mar. Sci. Eng. 2020, 8, 531. [Google Scholar] [CrossRef]
- Costas, S.; Ferreira, O.; Martinez, G. Why do we decide to live with risk at the coast? Ocean Coast. Manag. 2015, 118, 1–11. [Google Scholar] [CrossRef]
- Mani-Peres, C.; Xavier, L.Y.; Santos, C.R.; Turra, A. Stakeholders perceptions of local environmental changes as a tool for impact assessment in coastal zones. Ocean Coast. Manag. 2016, 119, 135–145. [Google Scholar] [CrossRef]
- Fatorić, S.; Morén-Alegret, R.; Niven, R.J.; Tan, G. Living with climate change risks: Stakeholders’ employment and coastal relocation in mediterranean climate regions of Australia and Spain. Environ. Syst. Decis. 2017, 37, 276–288. [Google Scholar] [CrossRef]
- Lemée, C.; Fleury-Bahi, G.; Krien, N.; Deledalle, A.; Mercier, D.; Coquet, M.; Rommel, D.; Navarro, O. Factorial structure of the coastal flooding risk perception and validation of a French coastal flooding risk evaluation scale (CFRES) for non-experts. Ocean Coast. Manag. 2018, 155, 68–75. [Google Scholar] [CrossRef]
- UNDRR. Sendai Framework for Disaster Risk Reduction 2015–2030. Available online: https://www.undrr.org/publication/sendai-framework-disaster-risk-reduction-2015-2030 (accessed on 23 June 2021).
- IRGC. Involving Stakeholders in the Risk Governance Process; EPFL International Risk Governance Center: Lausanne, Switzerland, 2020. [Google Scholar]
- Koutrakis, E.; Sapounidis, A.; Marzetti, S.; Marin, V.; Roussel, S.; Martino, S.; Fabiano, M.; Paoli, C.; Rey-Valette, H.; Povh, D.; et al. ICZM and coastal defence perception by beach users: Lessons from the Mediterranean coastal area. Ocean Coast. Manag. 2011, 54, 821–830. [Google Scholar] [CrossRef]
- Gray, S.; Gagnon, A.; Gray, S.; O’Dwyer, B.; O’Mahony, C.; Muir, D.; Devoy, R.; Falaleeva, M.; Gault, J. Are coastal managers detecting the problem? Assessing stakeholder perception of climate vulnerability using Fuzzy Cognitive Mapping. Ocean Coast. Manag. 2014, 94, 74–89. [Google Scholar] [CrossRef]
- Francis, O.P.; Kim, K.; Pant, P. Stakeholder assessment of coastal risks and mitigation strategies. Ocean Coast. Manag. 2019, 179, 104844. [Google Scholar] [CrossRef]
- Schmidt, L.; Delicado, A.; Gomes, C.; Granjo, P.; Guerreiro, S.; Horta, A.; Mourato, J.; Prista, P.; Saraiva, T.; Truninger, M.; et al. Change in the way we live and plan the coast: Stakeholders discussions on future scenarios and adaptation strategies. J. Coast. Res. 2013, 65, 1033–1038. [Google Scholar] [CrossRef] [Green Version]
- Gerkensmeier, B.; Ratter, B.M. Governing coastal risks as a social process—Facilitating integrative risk management by enhanced multi-stakeholder collaboration. Environ. Sci. Policy 2018, 80, 144–151. [Google Scholar] [CrossRef]
- Slovic, P. Perception of risk. Science 1987, 236, 280–285. [Google Scholar] [CrossRef]
- Jungk, R.; Müllert, N. Future Workshops: How to Create Desirable Futures; Inst. for Social Inventions: London, UK, 1987. [Google Scholar]
- Santoro, S.; Motta Zanin, G. The role of stakeholders’ risk perception in water management policies: A case study comparison in Southern Italy. In Smart and Sustainable Planning for Cities and Regions, Results of SSPCR; Springer: Cham, Switzerland, 2019. [Google Scholar]
- Papageorgiou, E.; Kontogianni, A. Using fuzzy cognitive mapping in environmental decision making and management: A methodological primer and an application. Int. Perspect. Glob. Environ. Chang. 2012, 427–450. [Google Scholar] [CrossRef] [Green Version]
- Özesmi, U.; Özesmi, S. A participatory approach to ecosystem conservation: Fuzzy cognitive maps and stakeholder group analysis in Uluabat Lake, Turkey. Environ. Manag. 2003, 31, 0518–0531. [Google Scholar] [CrossRef] [PubMed]
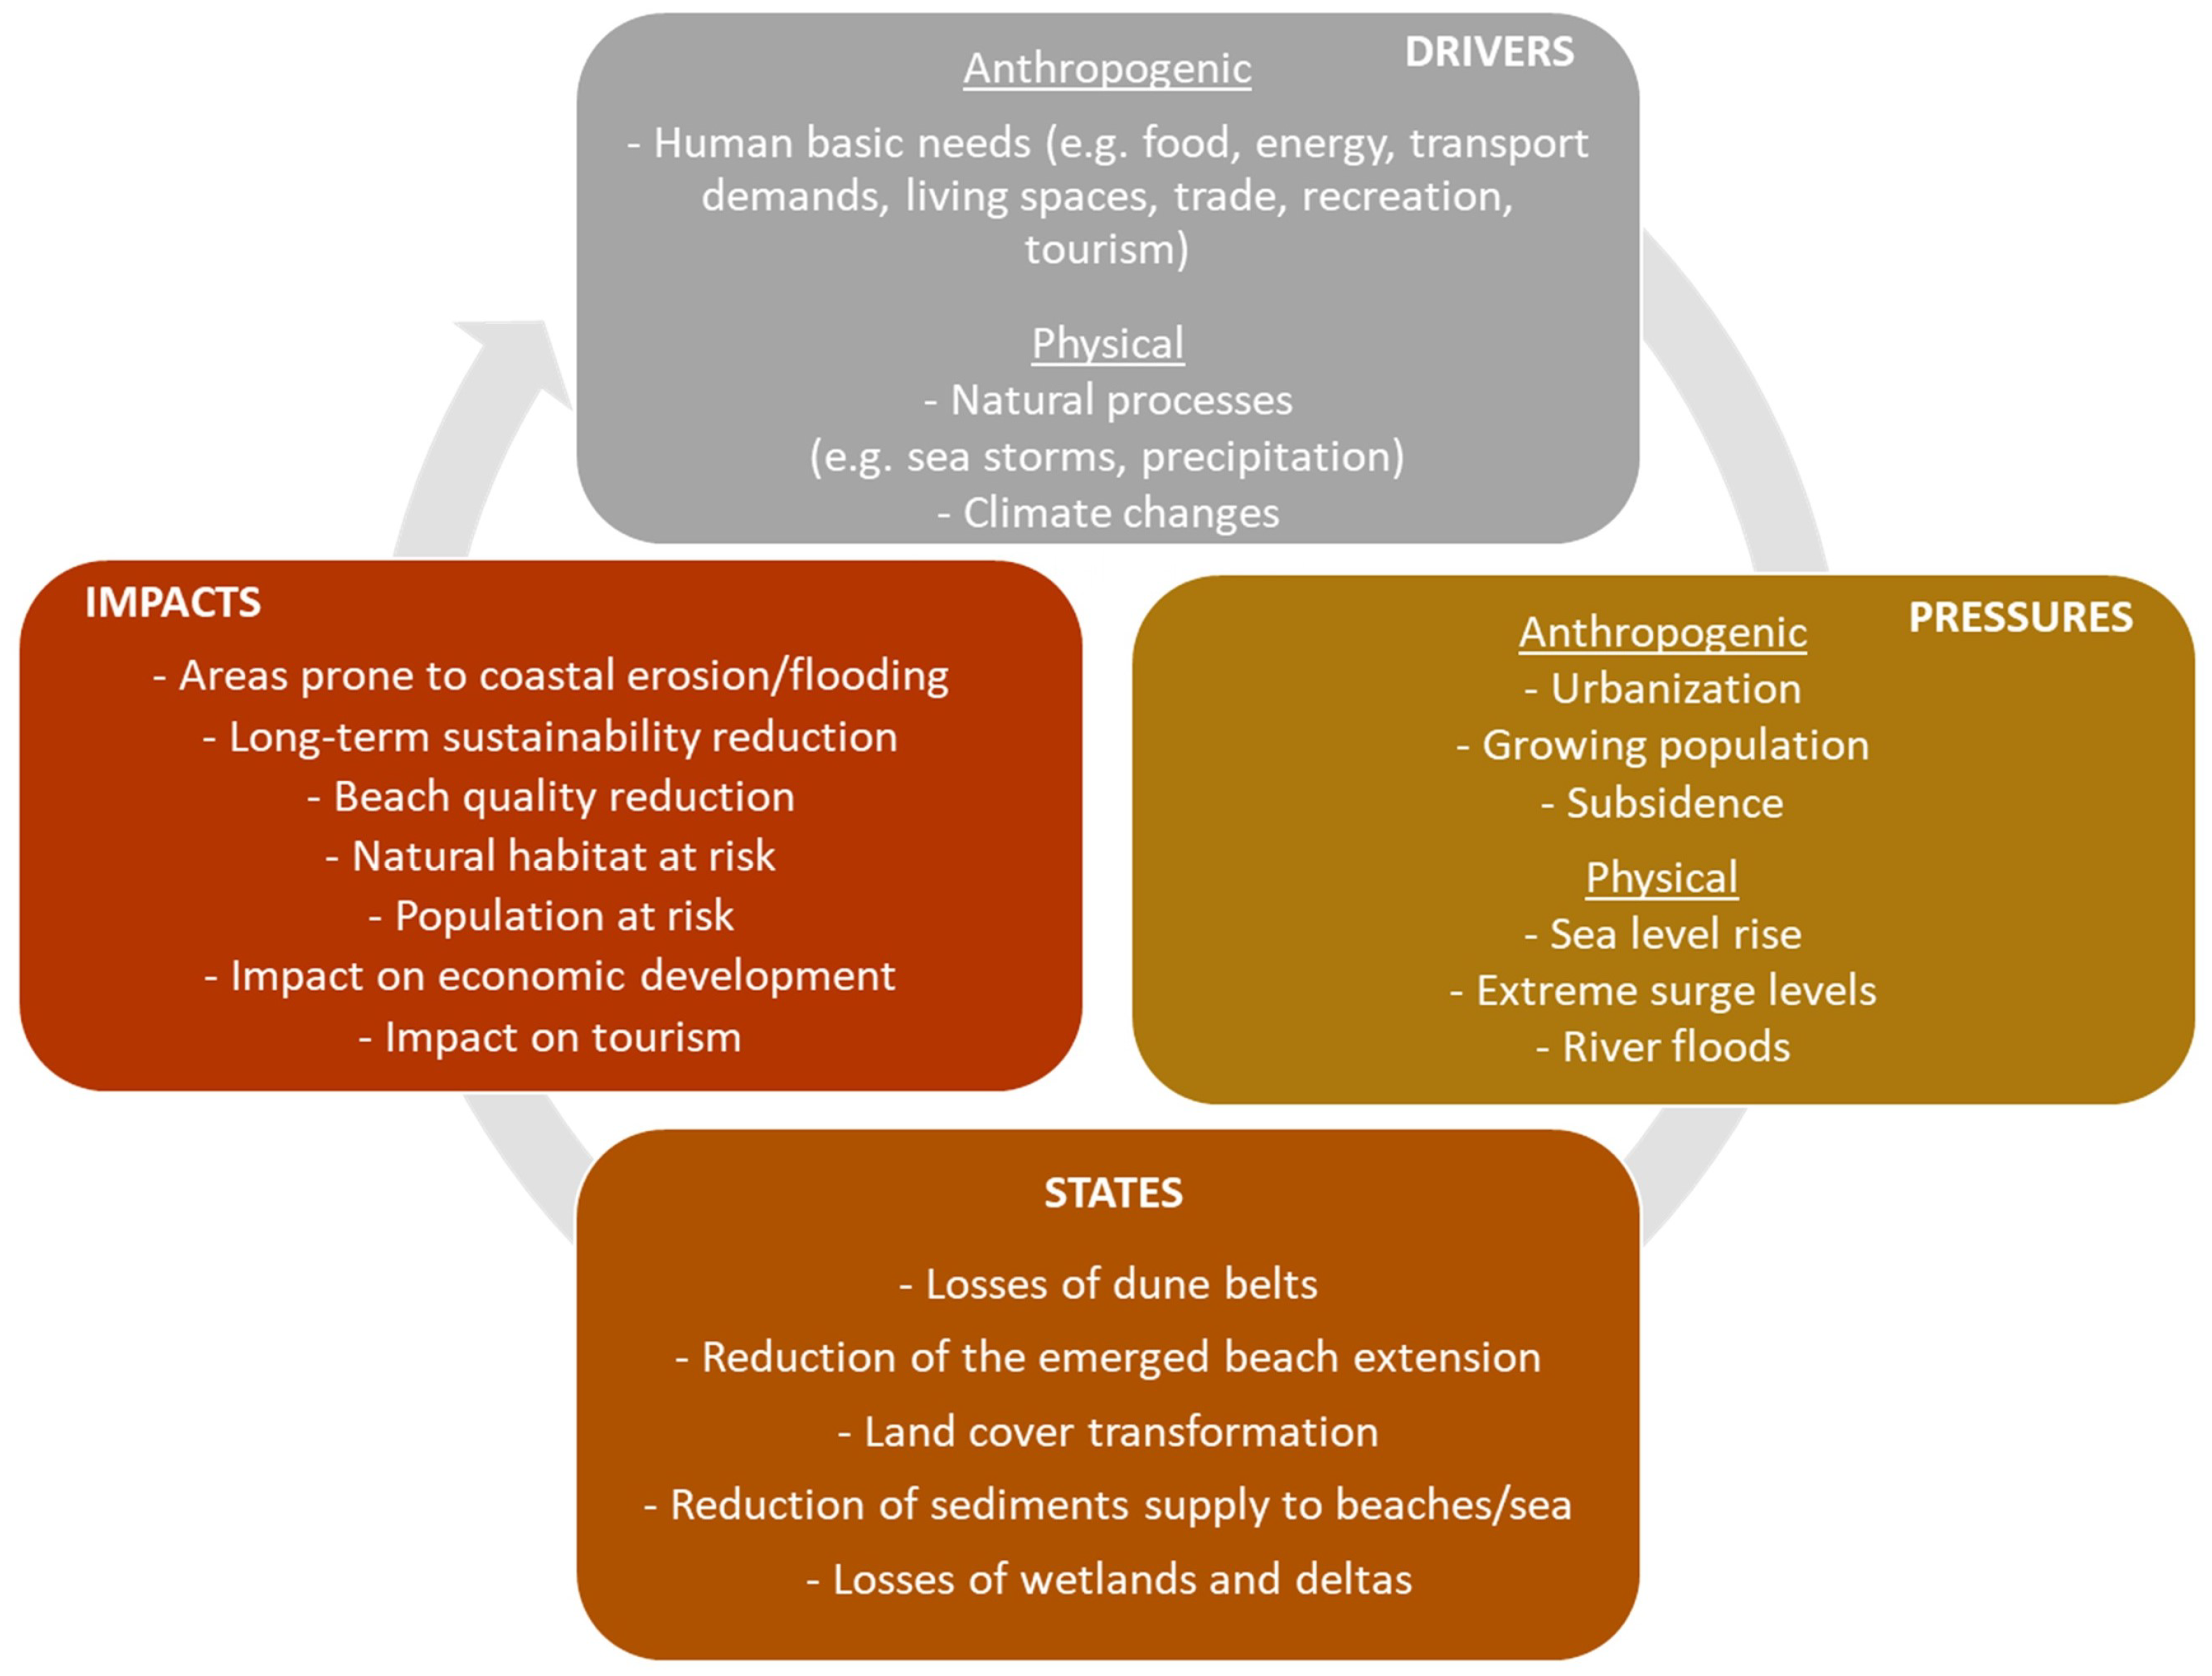
- Gari, S.R.; Newton, A.; Icely, J.D. A review of the application and evolution of the DPSIR framework with an emphasis on coastal social-ecological systems. Ocean Coast. Manag. 2015, 103, 63–77. [Google Scholar] [CrossRef] [Green Version]
- EEA. The Changing Faces of Europe’s Coastal Areas; Number No. 6 in EEA Report; European Environment Agency: Copenhagen, Denmark, 2006. [Google Scholar]
- Torres, J.M.; Bass, B.; Irza, N.; Fang, Z.; Proft, J.; Dawson, C.; Kiani, M.; Bedient, P. Characterizing the hydraulic interactions of hurricane storm surge and rainfall–runoff for the Houston–Galveston region. Coast. Eng. 2015, 106, 7–19. [Google Scholar] [CrossRef] [Green Version]
- Lopez Diez, A.; Mayer Suarez, P.; Diaz Pacheco, J.; Dorta Antequera, P. Rainfall and Flooding in Coastal Tourist Areas of the Canary Islands (Spain). Atmosphere 2019, 10, 809. [Google Scholar] [CrossRef] [Green Version]
- Apollonio, C.; Bruno, M.F.; Iemmolo, G.; Molfetta, M.G.; Pellicani, R. Flood risk evaluation in ungauged coastal areas: The case study of Ippocampo (Southern Italy). Water 2020, 12, 1466. [Google Scholar] [CrossRef]
- Motta Zanin, G.; Bruno, M.F.; Saponieri, A. Understanding the Importance of Risk Perception in Coastal Socio-Ecological Systems Management: A Case Study in Southern Italy. In Innovation in Urban and Regional Planning: Proceedings of the 11th INPUT Conference—Volume 1; Springer: Berlin/Heidelberg, Germany, 2021; p. 235. [Google Scholar]
- Vidal, R.V.V. The future workshop: Democratic problem solving. Econ. Anal. Work. Pap. 2006, 5, 21. [Google Scholar]
- Stylios, C.D.; Georgopoulos, V.C.; Malandraki, G.A.; Chouliara, S. Fuzzy cognitive map architectures for medical decision support systems. Appl. Soft Comput. 2008, 8, 1243–1251. [Google Scholar] [CrossRef]
- Van Vliet, M.; Kok, K.; Veldkamp, T. Linking stakeholders and modellers in scenario studies: The use of Fuzzy Cognitive Maps as a communication and learning tool. Futures 2010, 42, 1–14. [Google Scholar] [CrossRef]
- Valentini, N.; Saponieri, A.; Danisi, A.; Pratola, L.; Damiani, L. Exploiting remote imagery in an embayed sandy beach for the validation of a runup model framework. Estuar. Coast. Shelf Sci. 2019, 225, 106244. [Google Scholar] [CrossRef] [Green Version]
- Bruno, M.F.; Molfetta, M.G.; Pratola, L.; Mossa, M.; Nutricato, R.; Morea, A.; Nitti, D.O.; Chiaradia, M.T. A Combined Approach of Field Data and Earth Observation for Coastal Risk Assessment. Sensors 2019, 19, 1399. [Google Scholar] [CrossRef] [Green Version]
- Spinosa, A.; Ziemba, A.; Saponieri, A.; Damiani, L.; El Serafy, G. Remote sensing-based automatic detection of shoreline position: A case study in apulia region. J. Mar. Sci. Eng. 2021, 9, 575. [Google Scholar] [CrossRef]
- Russo, S. Margherita di Savoia. Storia di una Comunità nella Prima Metà del Novecento; Claudio Grenzi Editore: Foggia, Italy, 2020. [Google Scholar]
- Regional Tourism Agency-Puglia Region. Report Movimento Turistico Annuale per Comune: Anno 2019 [Annual Tourism Movement Report by Municipality: Year 2019]. 2019. Available online: https://www.agenziapugliapromozione.it (accessed on 23 June 2021).
- Archetti, R.; Damiani, L.; Bianchini, A.; Romagnoli, C.; Abbiati, M.; Addona, F.; Airoldi, L.; Cantelli, L.; Gaeta, M.G.; Guerrero, M.; et al. Innovative strategies, monitoring and analysis of the coastal erosion risk: The STIMARE project. In Proceedings of the 29th International Ocean and Polar Engineering Conference, International Society of Offshore and Polar Engineers, Honolulu, HI, USA, 16–21 June 2019. [Google Scholar]
- Damiani, L.; Petrillo, A.; Ranieri, G. Management of coastal area in Apulia Region. Landsc. Water Hist. Innov. Sustain 2002, 1, 71–80. [Google Scholar]
- Armenio, E.; Serio, F.D.; Mossa, M.; Petrillo, A.F. Coastline evolution based on statistical analysis and modeling. Nat. Hazards Earth Syst. Sci. 2019, 19, 1937–1953. [Google Scholar] [CrossRef] [Green Version]
- De Santis, V.; Caldara, M.; Marsico, A.; Capolongo, D.; Pennetta, L. Evolution of the Ofanto River delta from the ‘Little Ice Age’to modern times: Implications of large-scale synoptic patterns. Holocene 2018, 28, 1948–1967. [Google Scholar] [CrossRef]
- Pellegrini, M.; Aghakhani, A.; Gaeta, M.G.; Archetti, R.; Guzzini, A.; Saccani, C. Effectiveness Assessment of an Innovative Ejector Plant for Port Sediment Management. J. Mar. Sci. Eng. 2021, 9, 197. [Google Scholar] [CrossRef]
- Vousdoukas, M.I.; Mentaschi, L.; Voukouvalas, E.; Verlaan, M.; Jevrejeva, S.; Jackson, L.P.; Feyen, L. Global probabilistic projections of extreme sea levels show intensification of coastal flood hazard. Nat. Commun. 2018, 9, 1–12. [Google Scholar] [CrossRef] [Green Version]
- Bruno, M.; Molfetta, M.; Petrillo, A. The influence of interannual variability of mean sea level in the Adriatic Sea on extreme values. J. Coast. Res. 2014, 70, 241–246. [Google Scholar] [CrossRef]
- Pasquali, D.; Bruno, M.; Celli, D.; Damiani, L.; Di Risio, M. A simplified hindcast method for the estimation of extreme storm surge events in semi-enclosed basins. Appl. Ocean Res. 2019, 85, 45–52. [Google Scholar] [CrossRef]
- Apulian Regional Watershed Authority. Piano Stralcio di Assetto Idrogeologico (PAI). 2005. Available online: http://www.adb.puglia.it (accessed on 23 June 2021).
- European Union Copernicus Land Monitoring Service. 2018 Corine Land Cover. 2018. Available online: https://land.copernicus.eu (accessed on 23 June 2021).
- Legambiente. Mare Monstrum. 2021. Available online: https://www.legambiente.it/rapporti-in-evidenza/mare-monstrum/ (accessed on 16 July 2021).
- Metzger, J. Placing the stakes: The enactment of territorial stakeholders in planning processes. Environ. Plan. A 2013, 45, 781–796. [Google Scholar] [CrossRef] [Green Version]


| Coastal Vulnerability Indicators | Scores | ||
|---|---|---|---|
| 0 | 1 | 2 | |
| SLR: Average speed of Sea Level Rise (mm/yr) | <0 | 0–4 | >4 |
| HWL: Highest water level (m) | <1.5 | 1.5–3 | >3 |
| PSE: Past shoreline erosion (%) | <20 | 20–60 | >60 |
| RSE: Recent shoreline erosion (%) | <20 | 20–60 | >60 |
| : Hydraulic hazard in RICE (%) | <10 | 10–20 | >20 |
| GEC: Coastal Geology- Rocky shoreline (%) | >70 | 40–70 | <40 |
| : Municipal area in RICE (%) | <5 | 5–10 | >10 |
| ESRL: Eroded shoreline | 0.7 RSE + 0.3 PSE | ||
| Coastal Vulnerability Indicators | Scores | ||
| 0 | 1 | 2 | |
| : Urban and/or industrial area in RICE (%) | <10 | 10–40 | >40 |
| : High ecological value areas in RICE (%) | <5 | 5–30 | >30 |
| : Resident and seasonal population in RICE (1000 hab.) | <5 | 5–20 | >20 |
| : Increase in urban area in a 10-km wide coastal area (%) | <5 | 5–10 | >10 |
| Involved Local Actors |
|---|
| Municipality of Margherita di Savoia—Mayor |
| Municipality of Margherita di Savoia—Technical Office (urban planning) |
| Municipality of Margherita di Savoia—Technical Office (heritage and environment) |
| Municipality of Margherita di Savoia—Tourism Office |
| Puglia Aqueduct (AQP) |
| Port Authority |
| Basin Authority |
| Province of Barletta-Andria-Trani—Sector of urban planning |
| Puglia Region—Maritime public domain |
| Touristic Information Office (I.A.T.) |
| Association of beach concessionaires of Margherita di Savoia (A.S.B.A.) |
| Torre Pietra Association of local farmers |
| La Nuova Arenaiola Agriculture cooperative |
| Fare Natura Pro Natura Association |
| Legambiente Association |
| Scores | |||||||
|---|---|---|---|---|---|---|---|
| Indicator | Act. 1 | Act. 2 | Act. 3 | Act. 4 | Act. 5 | Act. 6 | |
| CVI | 2 | 2 | 2 | 1 | 2 | 2 | |
| SLR | 2 | 1 | 0 | 2 | 2 | 2 | |
| HWL | 0 | 1 | 0 | 2 | 0 | 2 | |
| ESRL | 2 | 1 | 2 | 2 | 2 | 2 | |
| 2 | 2 | 2 | 1 | 1 | 2 | ||
| GEC | 2 | 2 | 2 | 2 | 2 | 2 | |
| CVI | 10 | 9 | 8 | 10 | 9 | 12 | |
| CEI | 1 | 2 | 1 | 1 | 2 | 0 | |
| 0 | 1 | 0 | 2 | 2 | 0 | ||
| 2 | 1 | 2 | 2 | 2 | 1 | ||
| 2 | 2 | 2 | 2 | 2 | 2 | ||
| CEI | 5 | 6 | 5 | 7 | 8 | 3 | |
| Costal risk index | 50 | 54 | 40 | 70 | 72 | 36 | |
Publisher’s Note: MDPI stays neutral with regard to jurisdictional claims in published maps and institutional affiliations. |
© 2021 by the authors. Licensee MDPI, Basel, Switzerland. This article is an open access article distributed under the terms and conditions of the Creative Commons Attribution (CC BY) license (https://creativecommons.org/licenses/by/4.0/).
Share and Cite
Bruno, M.F.; Motta Zanin, G.; Barbanente, A.; Damiani, L. Understanding the Cognitive Components of Coastal Risk Assessment. J. Mar. Sci. Eng. 2021, 9, 780. https://doi.org/10.3390/jmse9070780
Bruno MF, Motta Zanin G, Barbanente A, Damiani L. Understanding the Cognitive Components of Coastal Risk Assessment. Journal of Marine Science and Engineering. 2021; 9(7):780. https://doi.org/10.3390/jmse9070780
Chicago/Turabian StyleBruno, Maria Francesca, Giulia Motta Zanin, Angela Barbanente, and Leonardo Damiani. 2021. "Understanding the Cognitive Components of Coastal Risk Assessment" Journal of Marine Science and Engineering 9, no. 7: 780. https://doi.org/10.3390/jmse9070780