
Soil Classification and Site Variability Analysis Based on CPT—A Case Study in the Yellow River Subaquatic Delta, China

Abstract
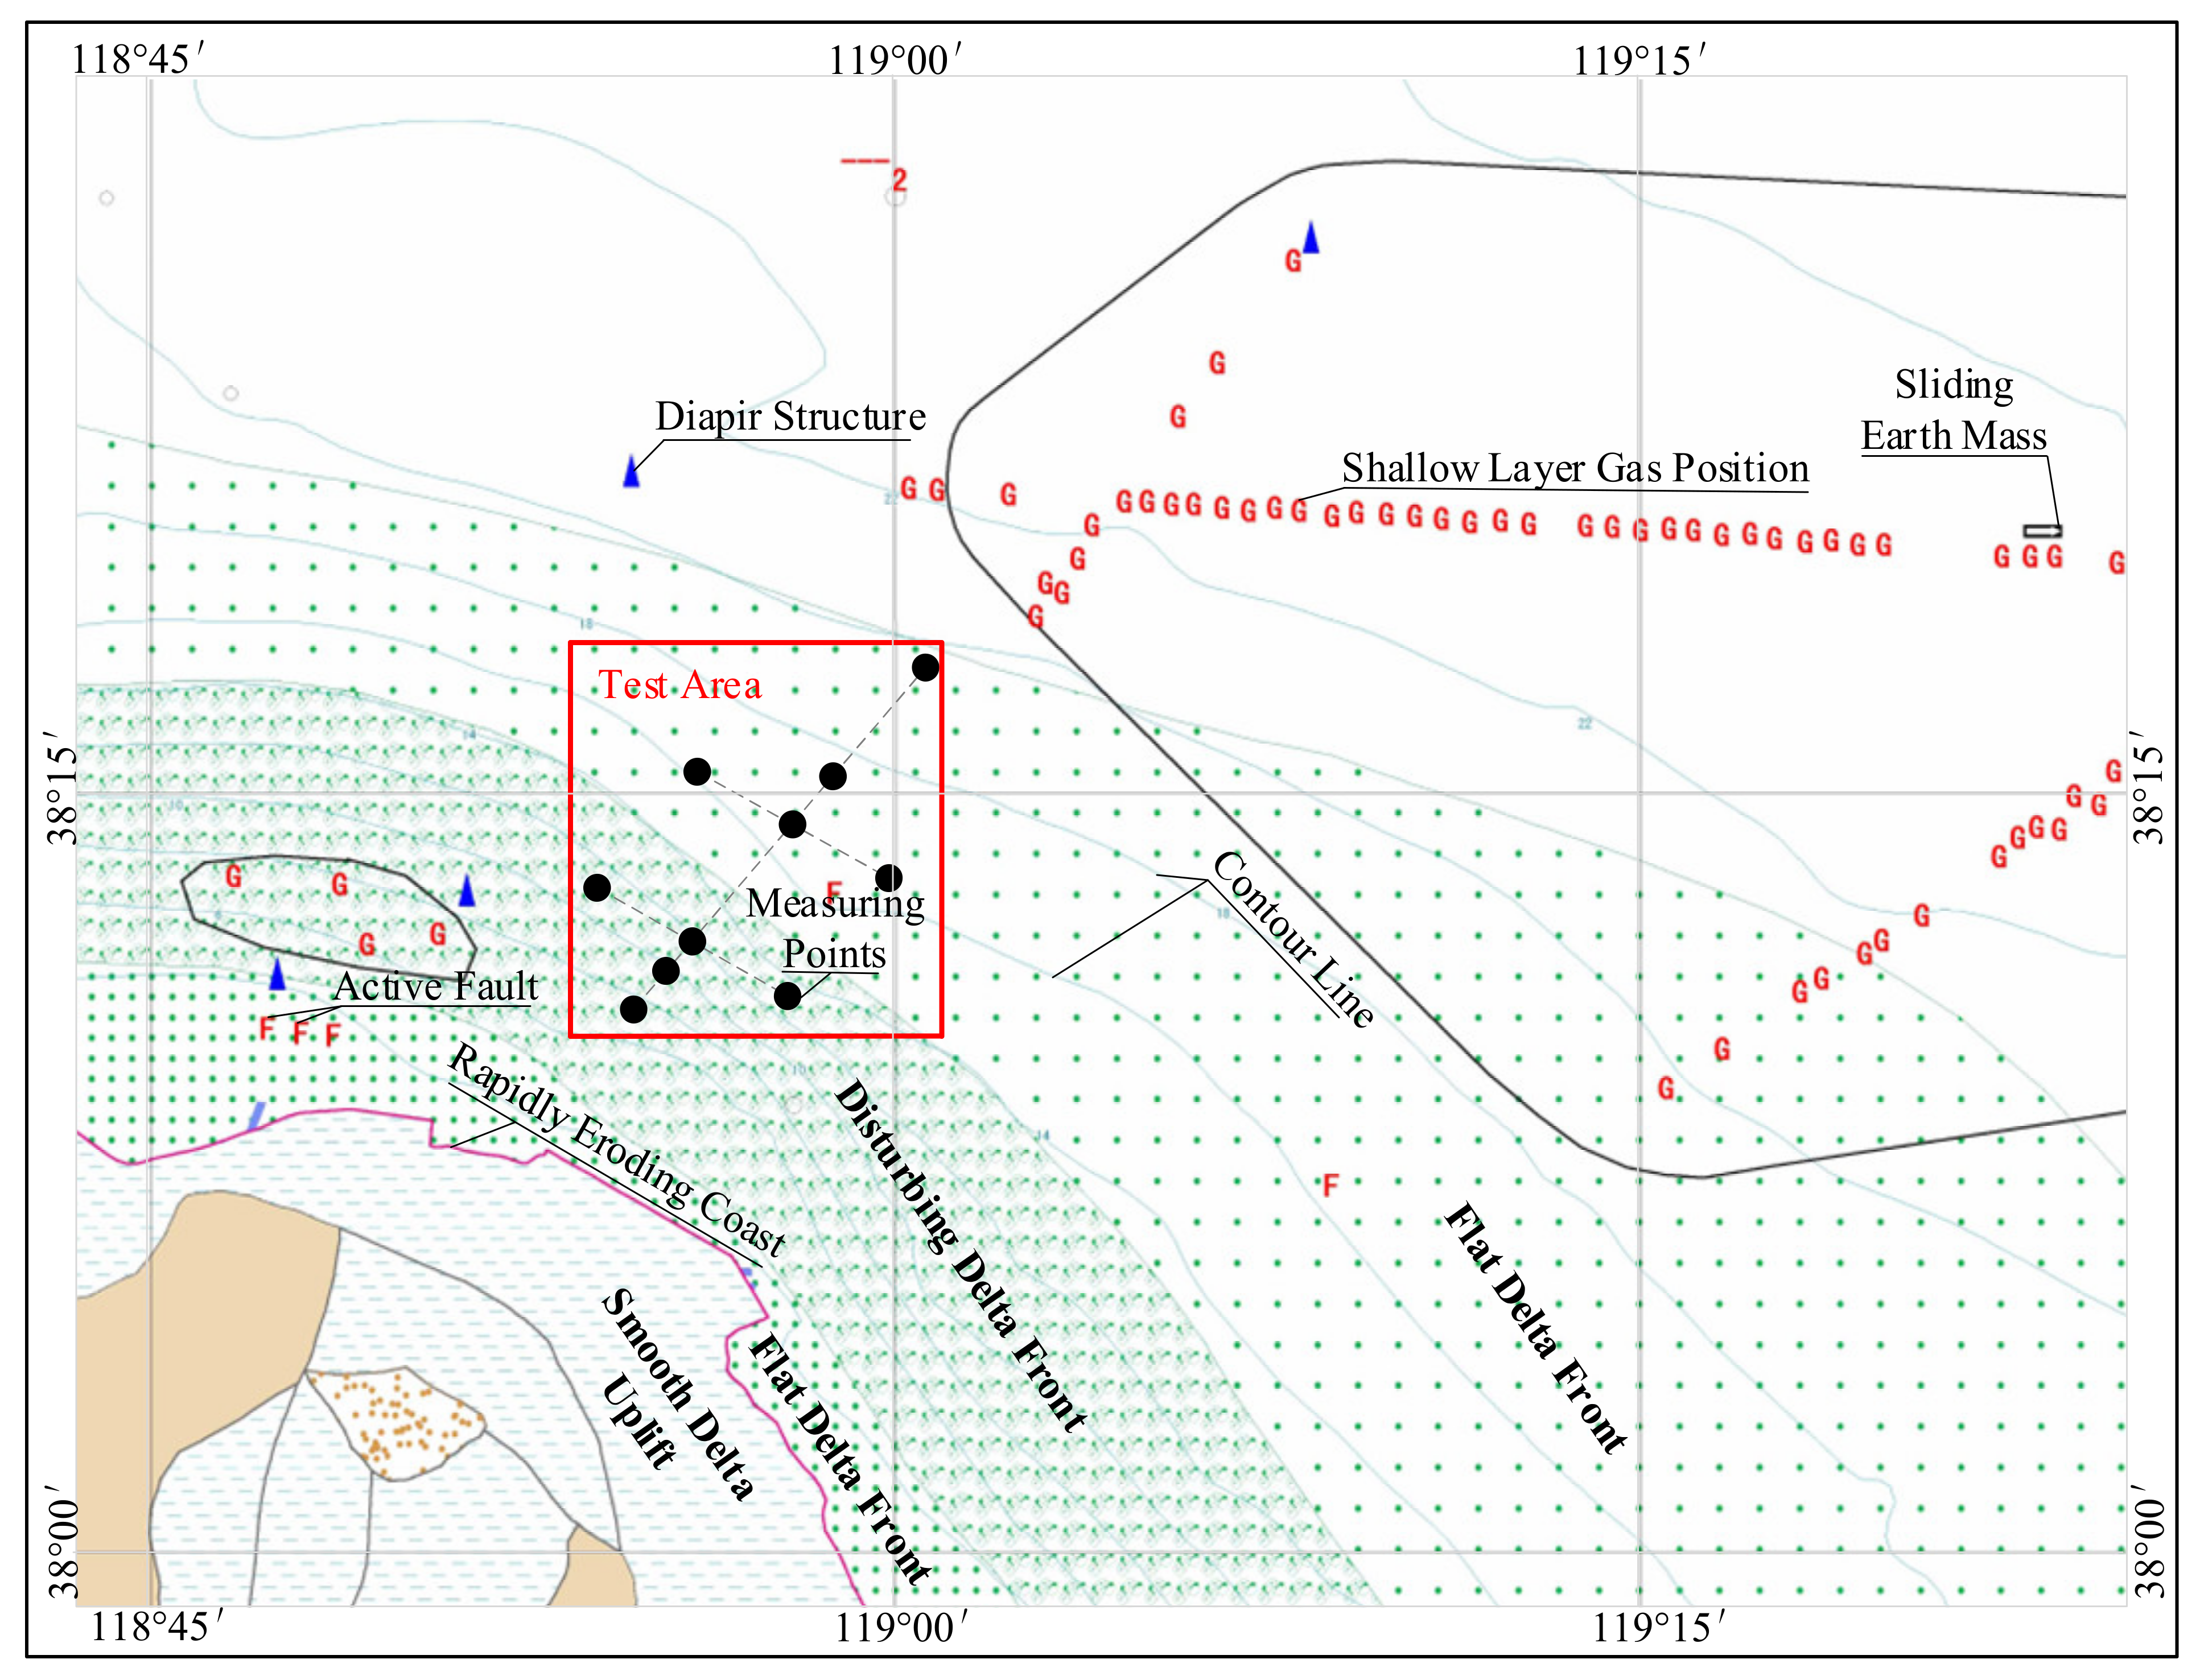
:1. Introduction
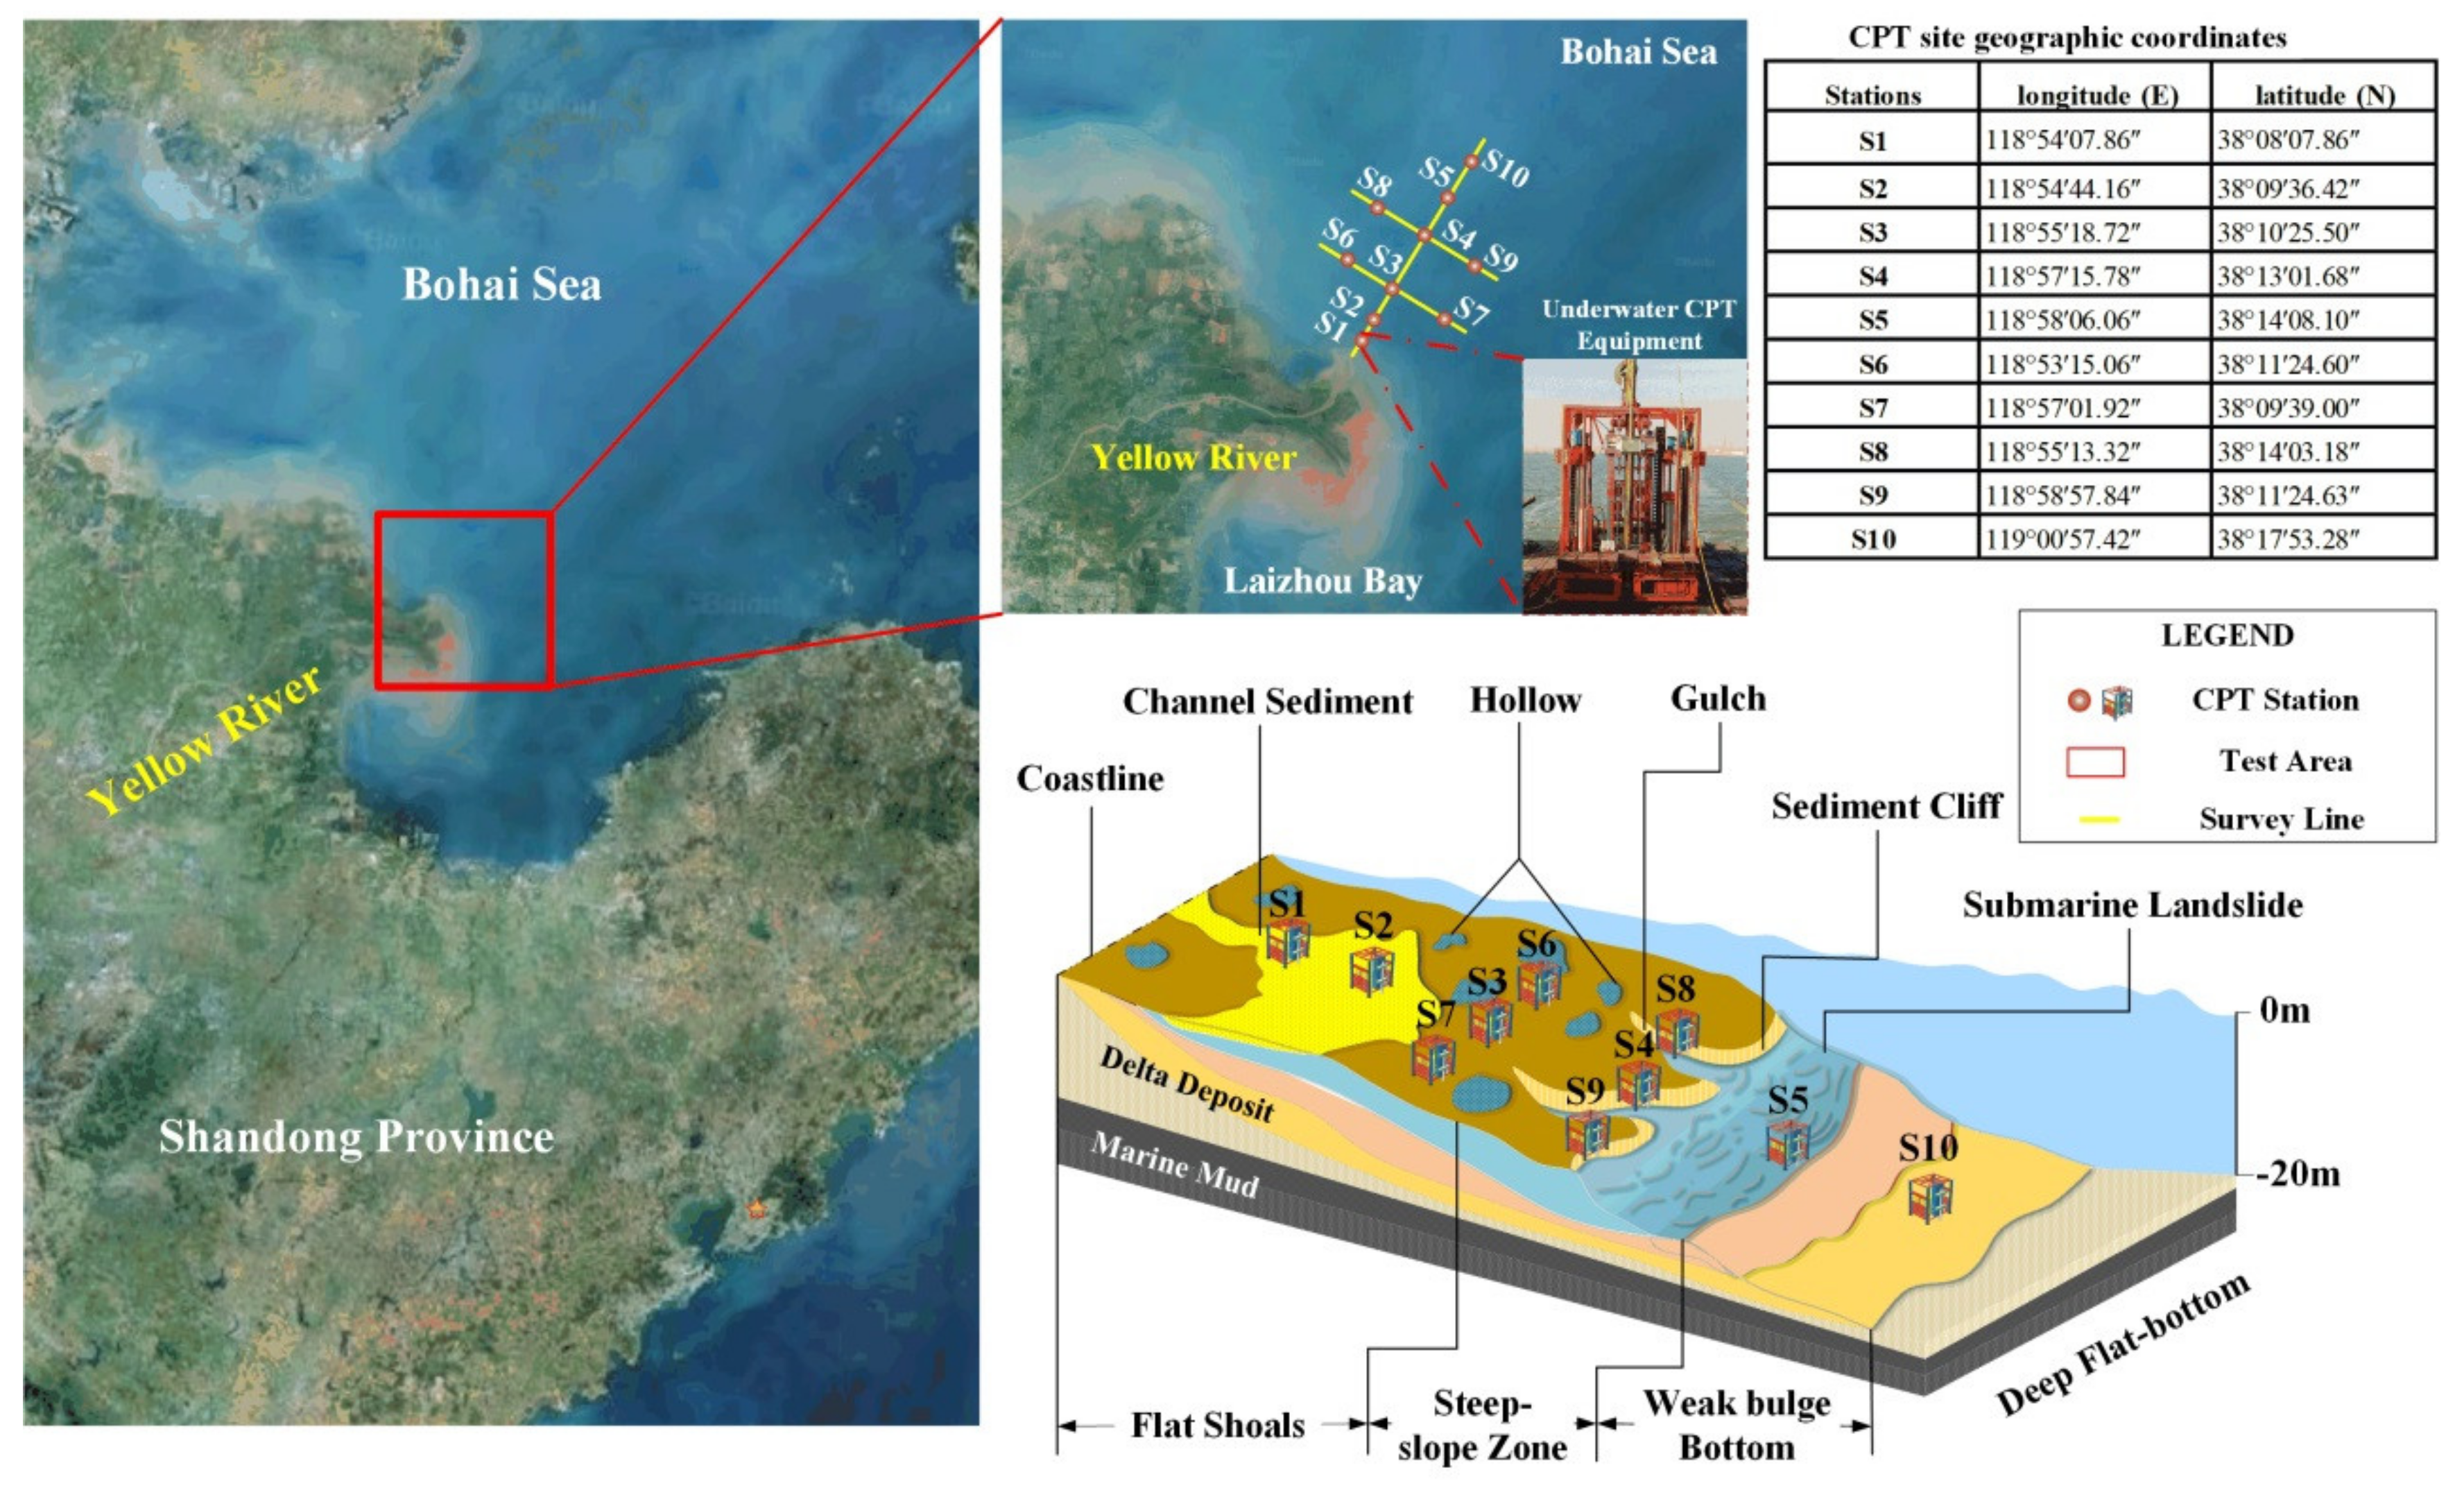
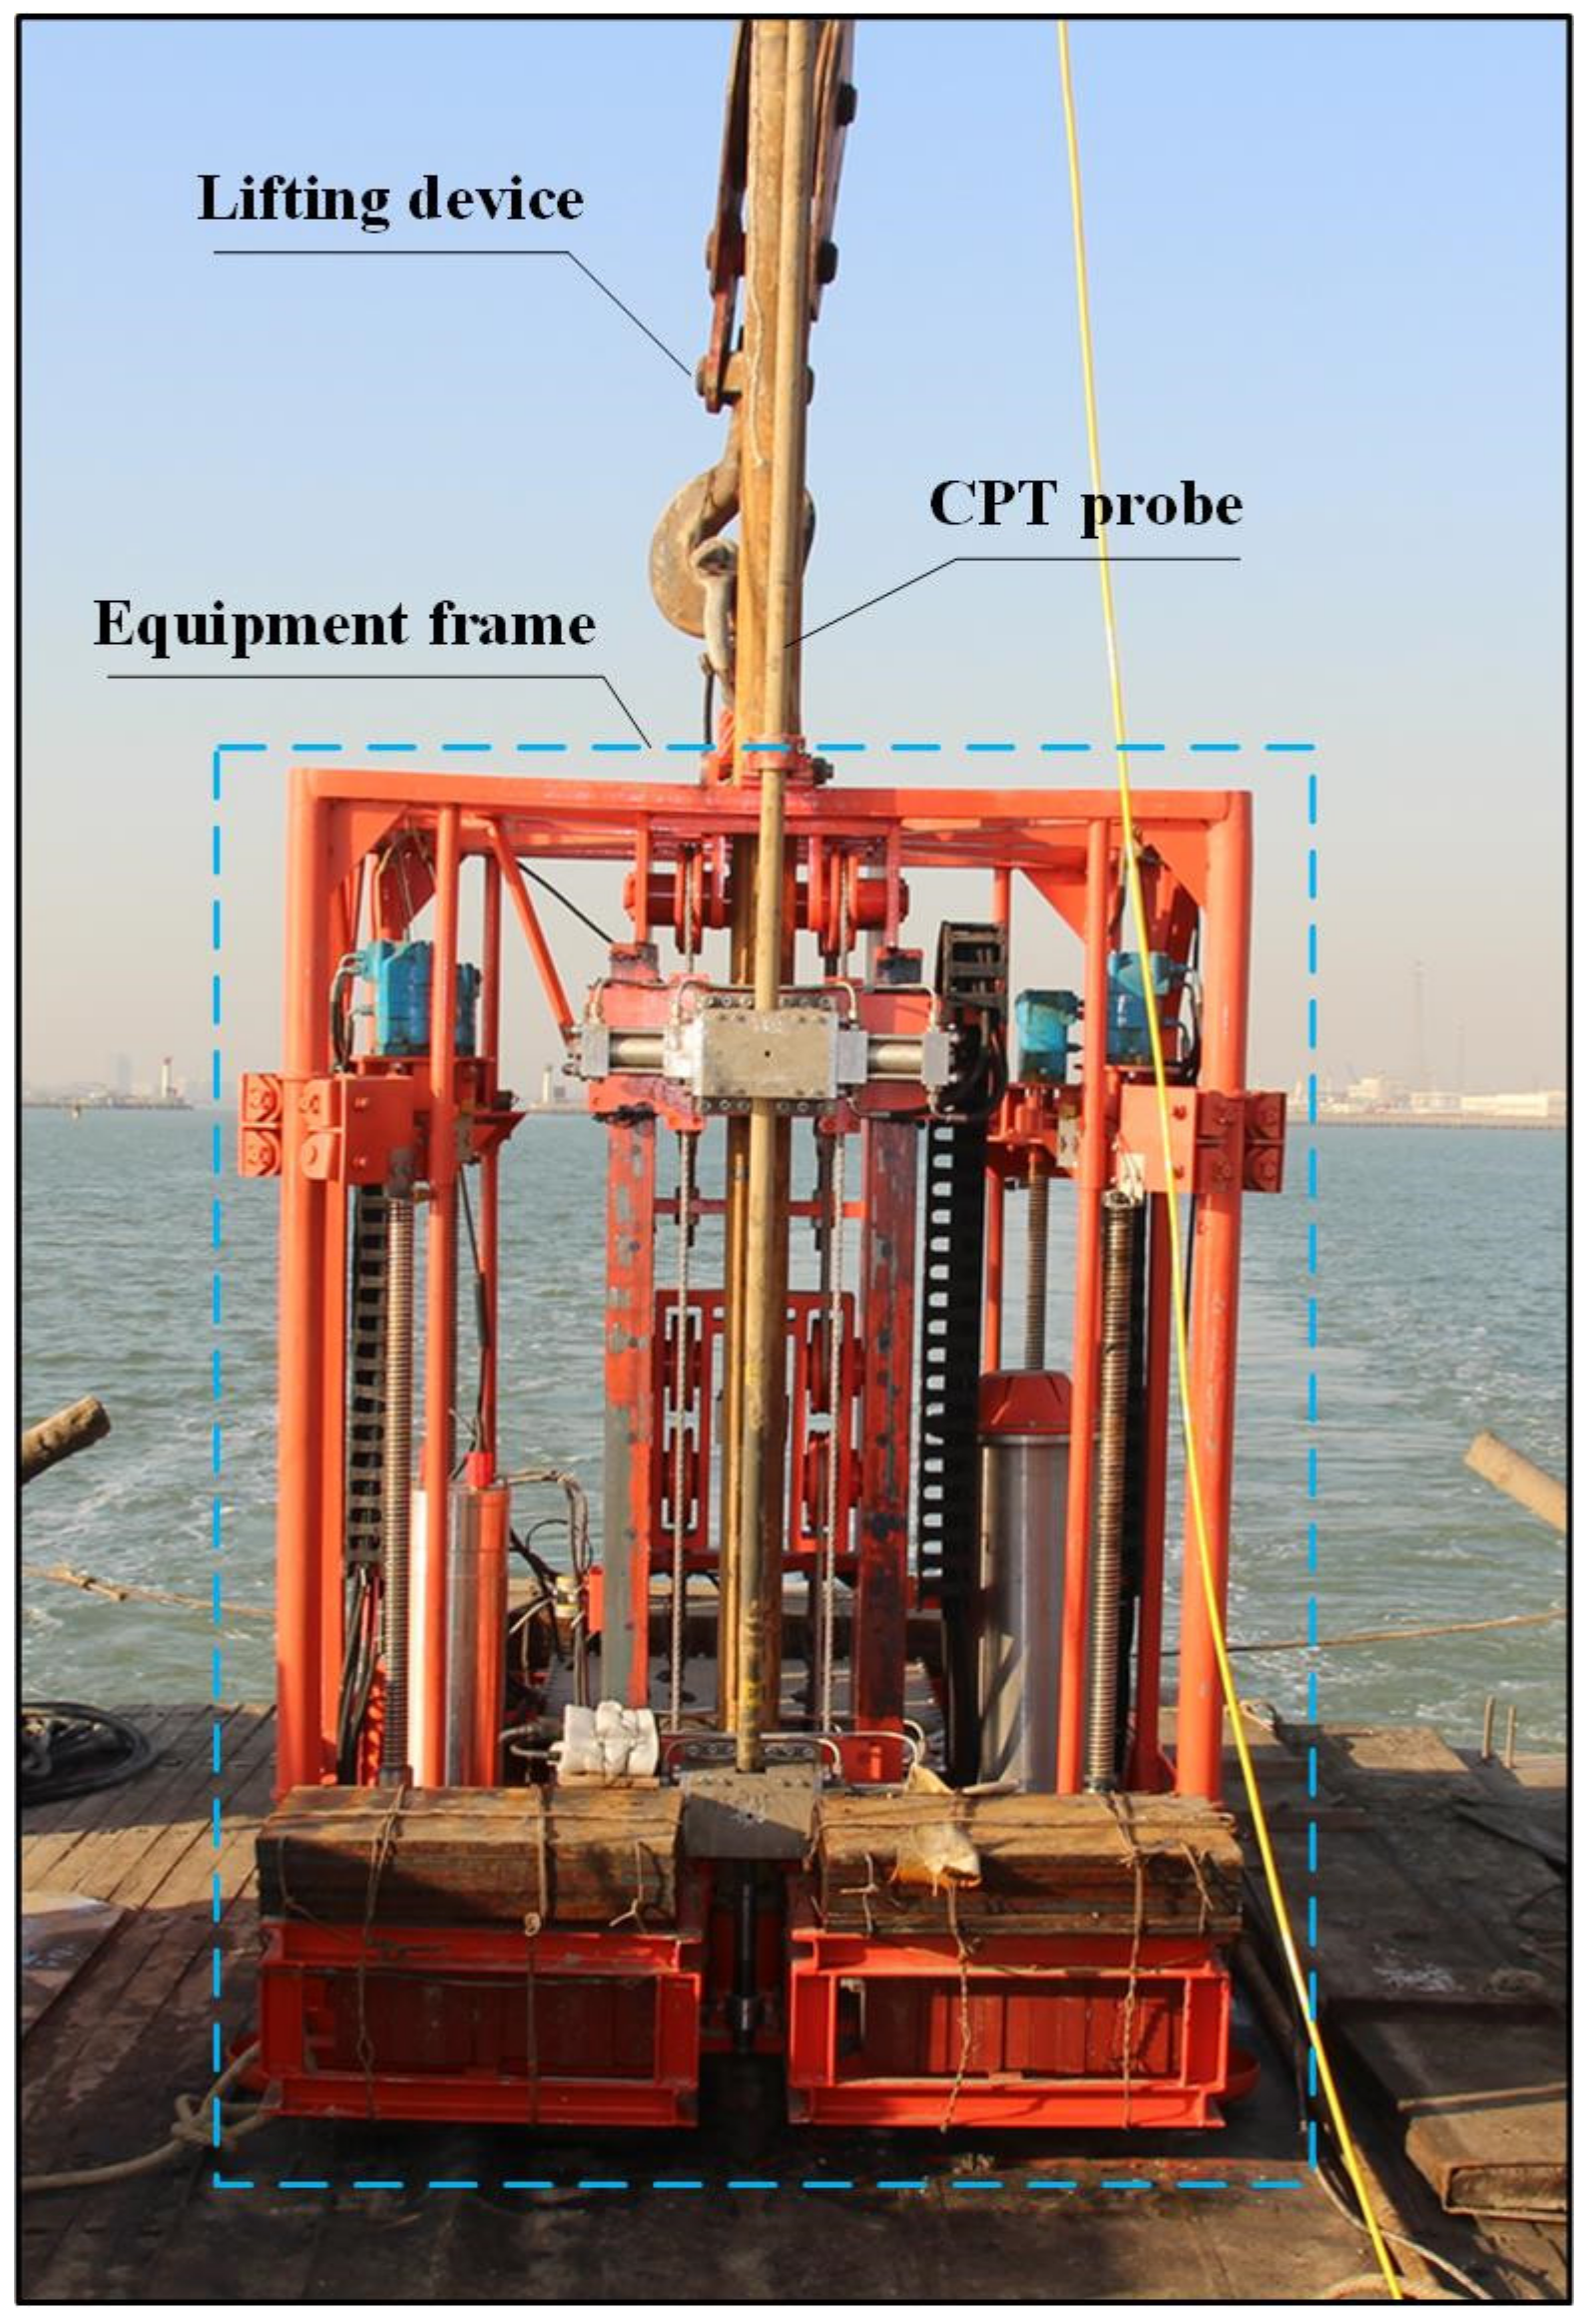
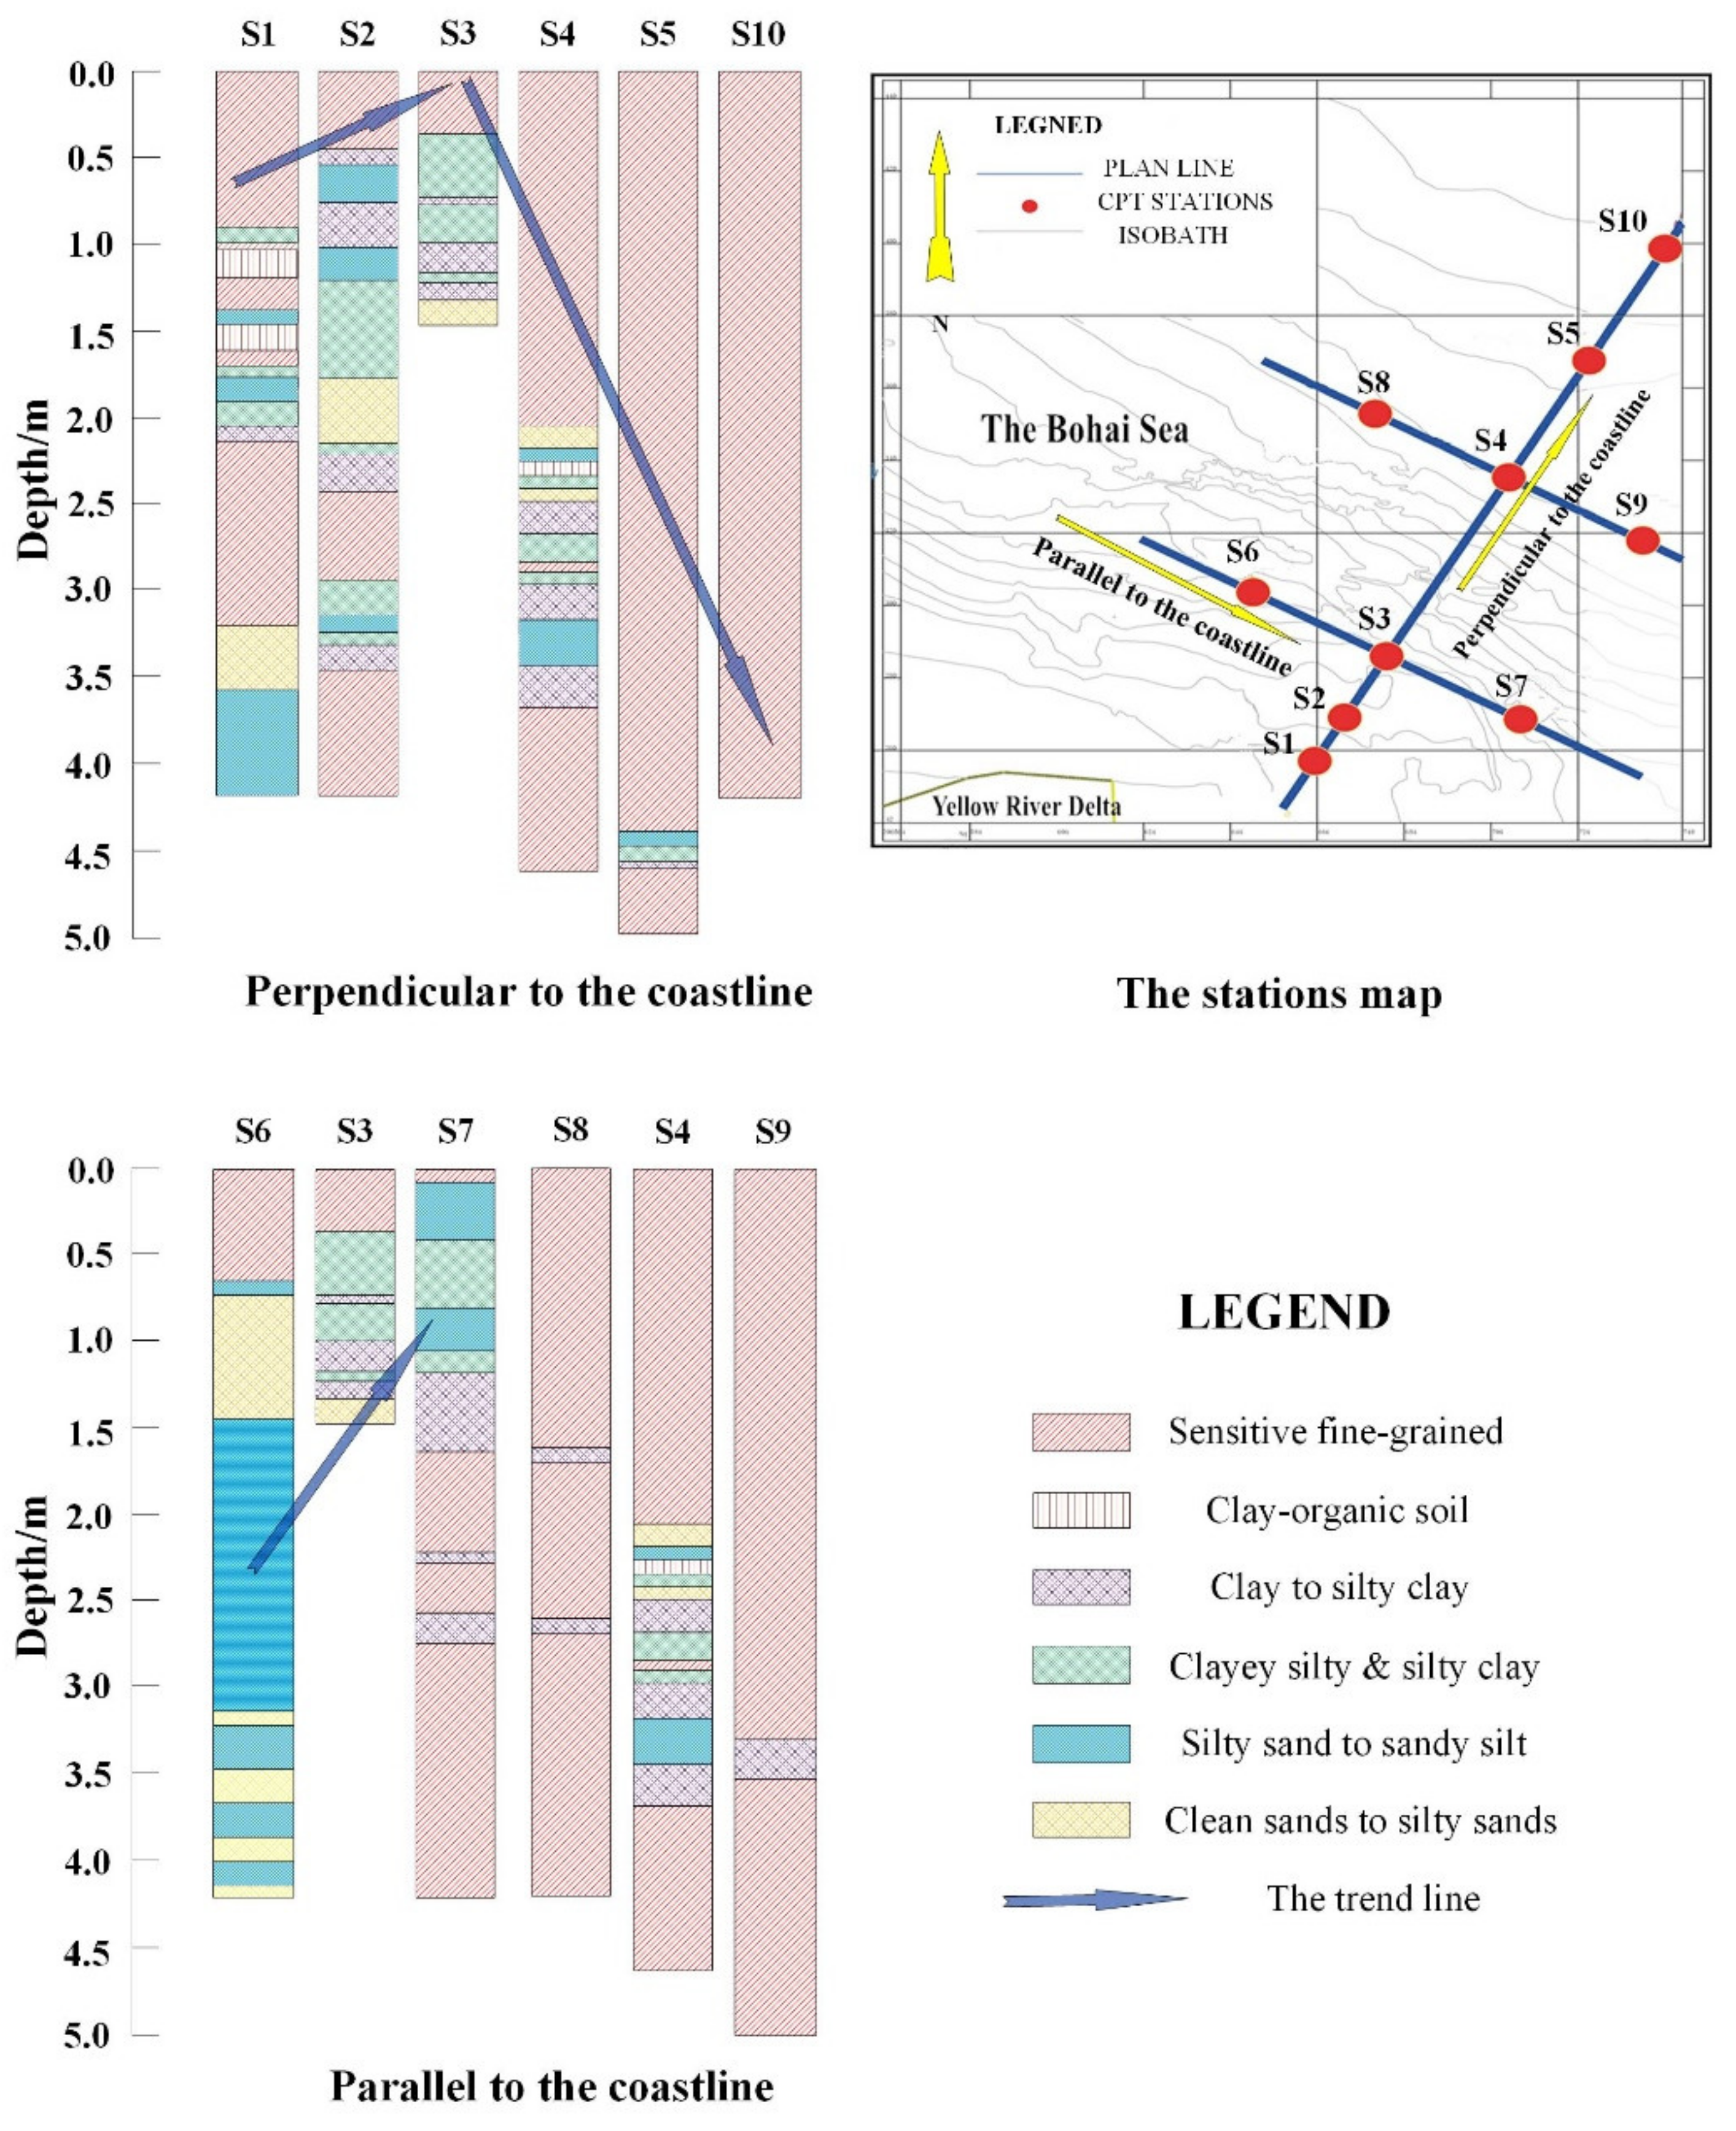
2. In-Situ Survey
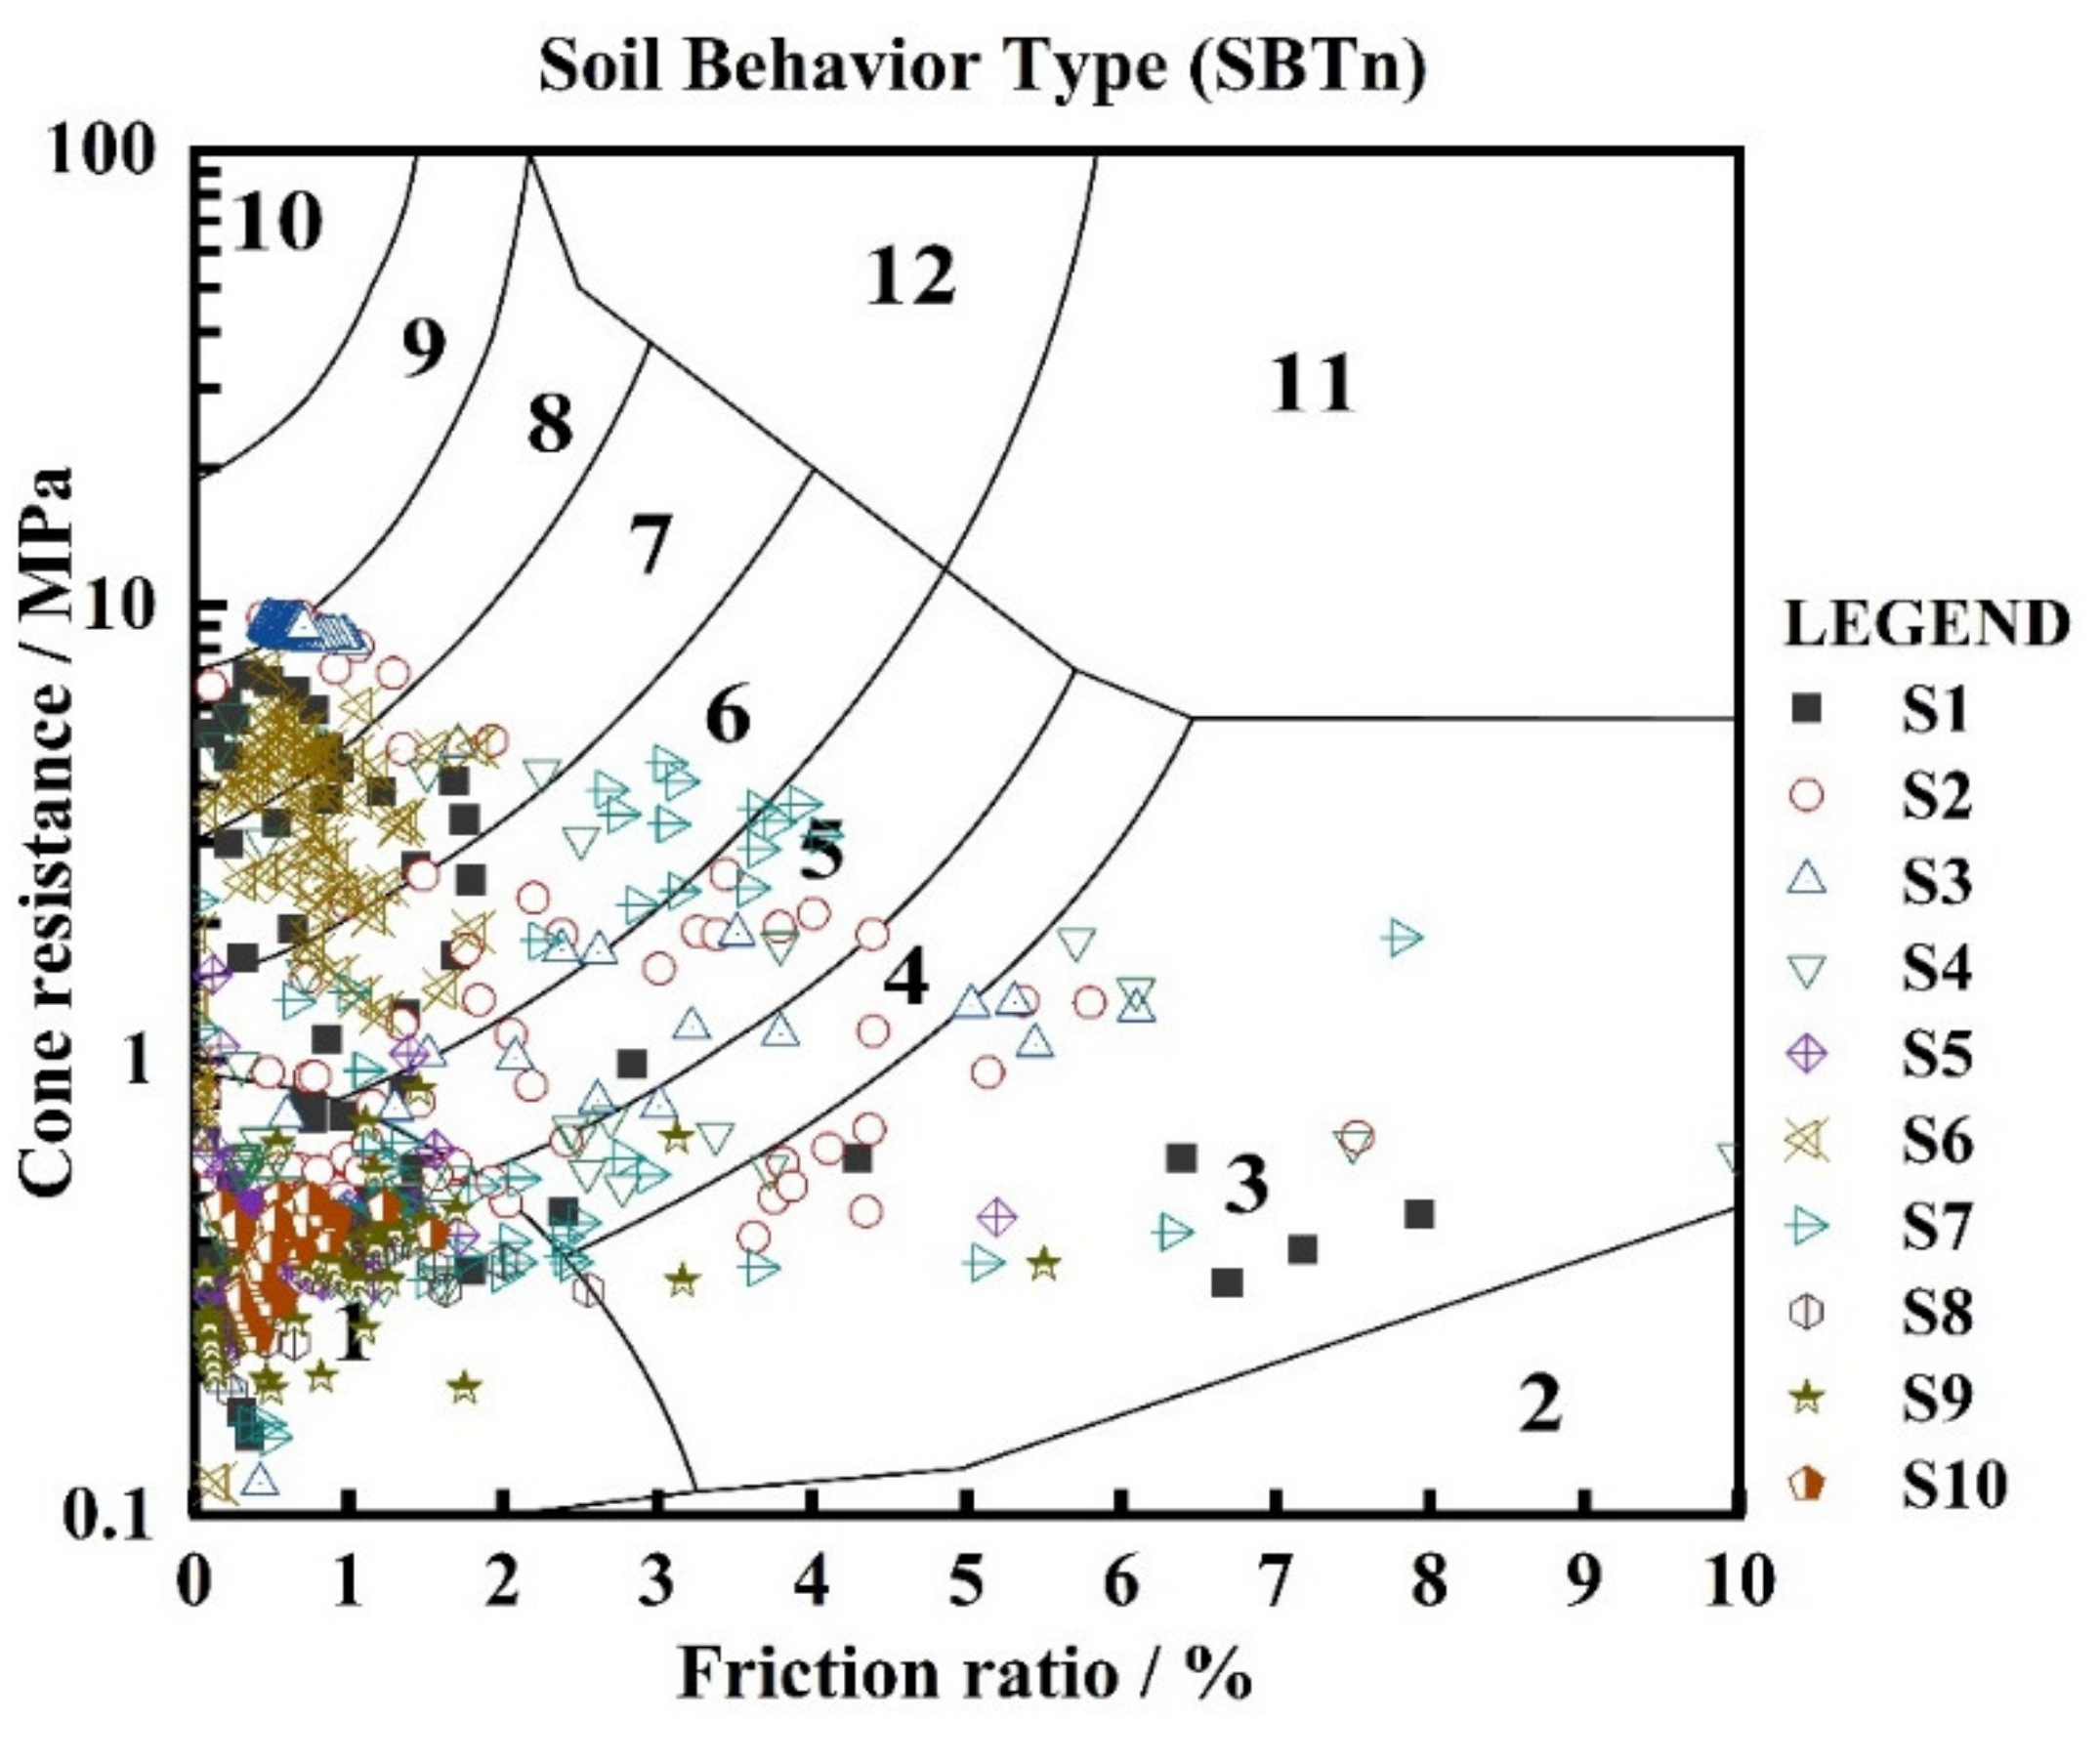
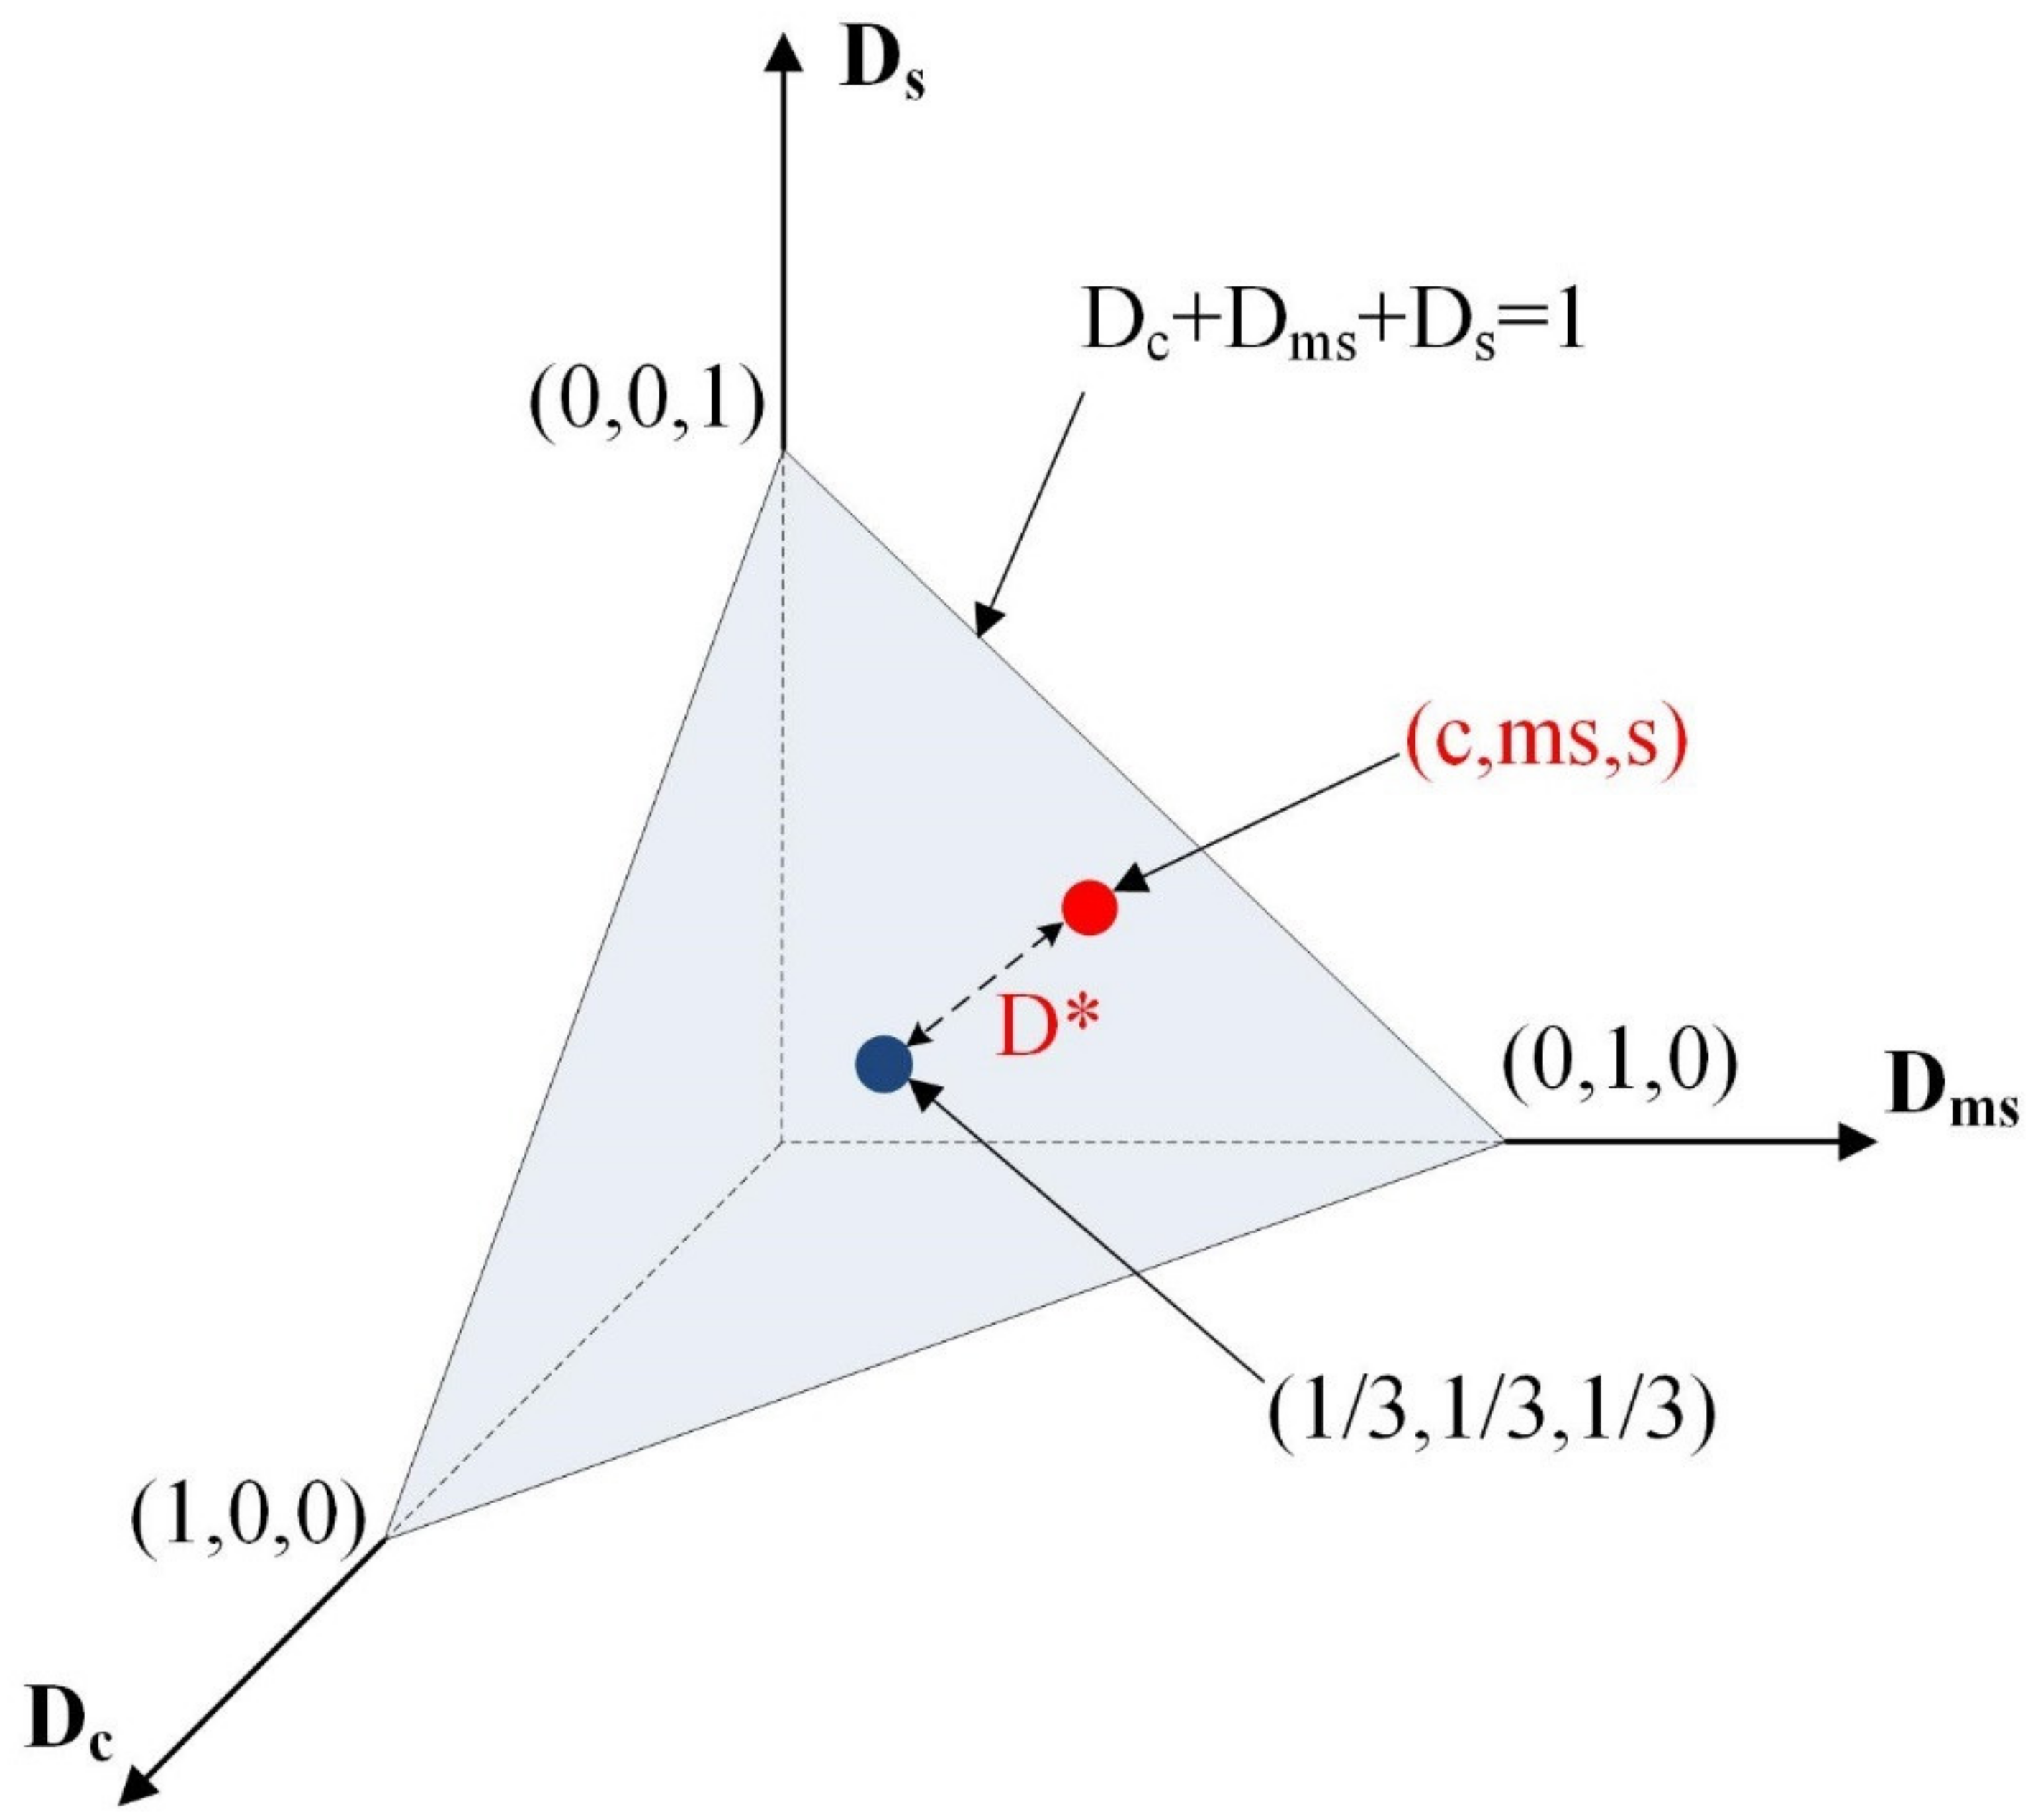
3. Soil Classification
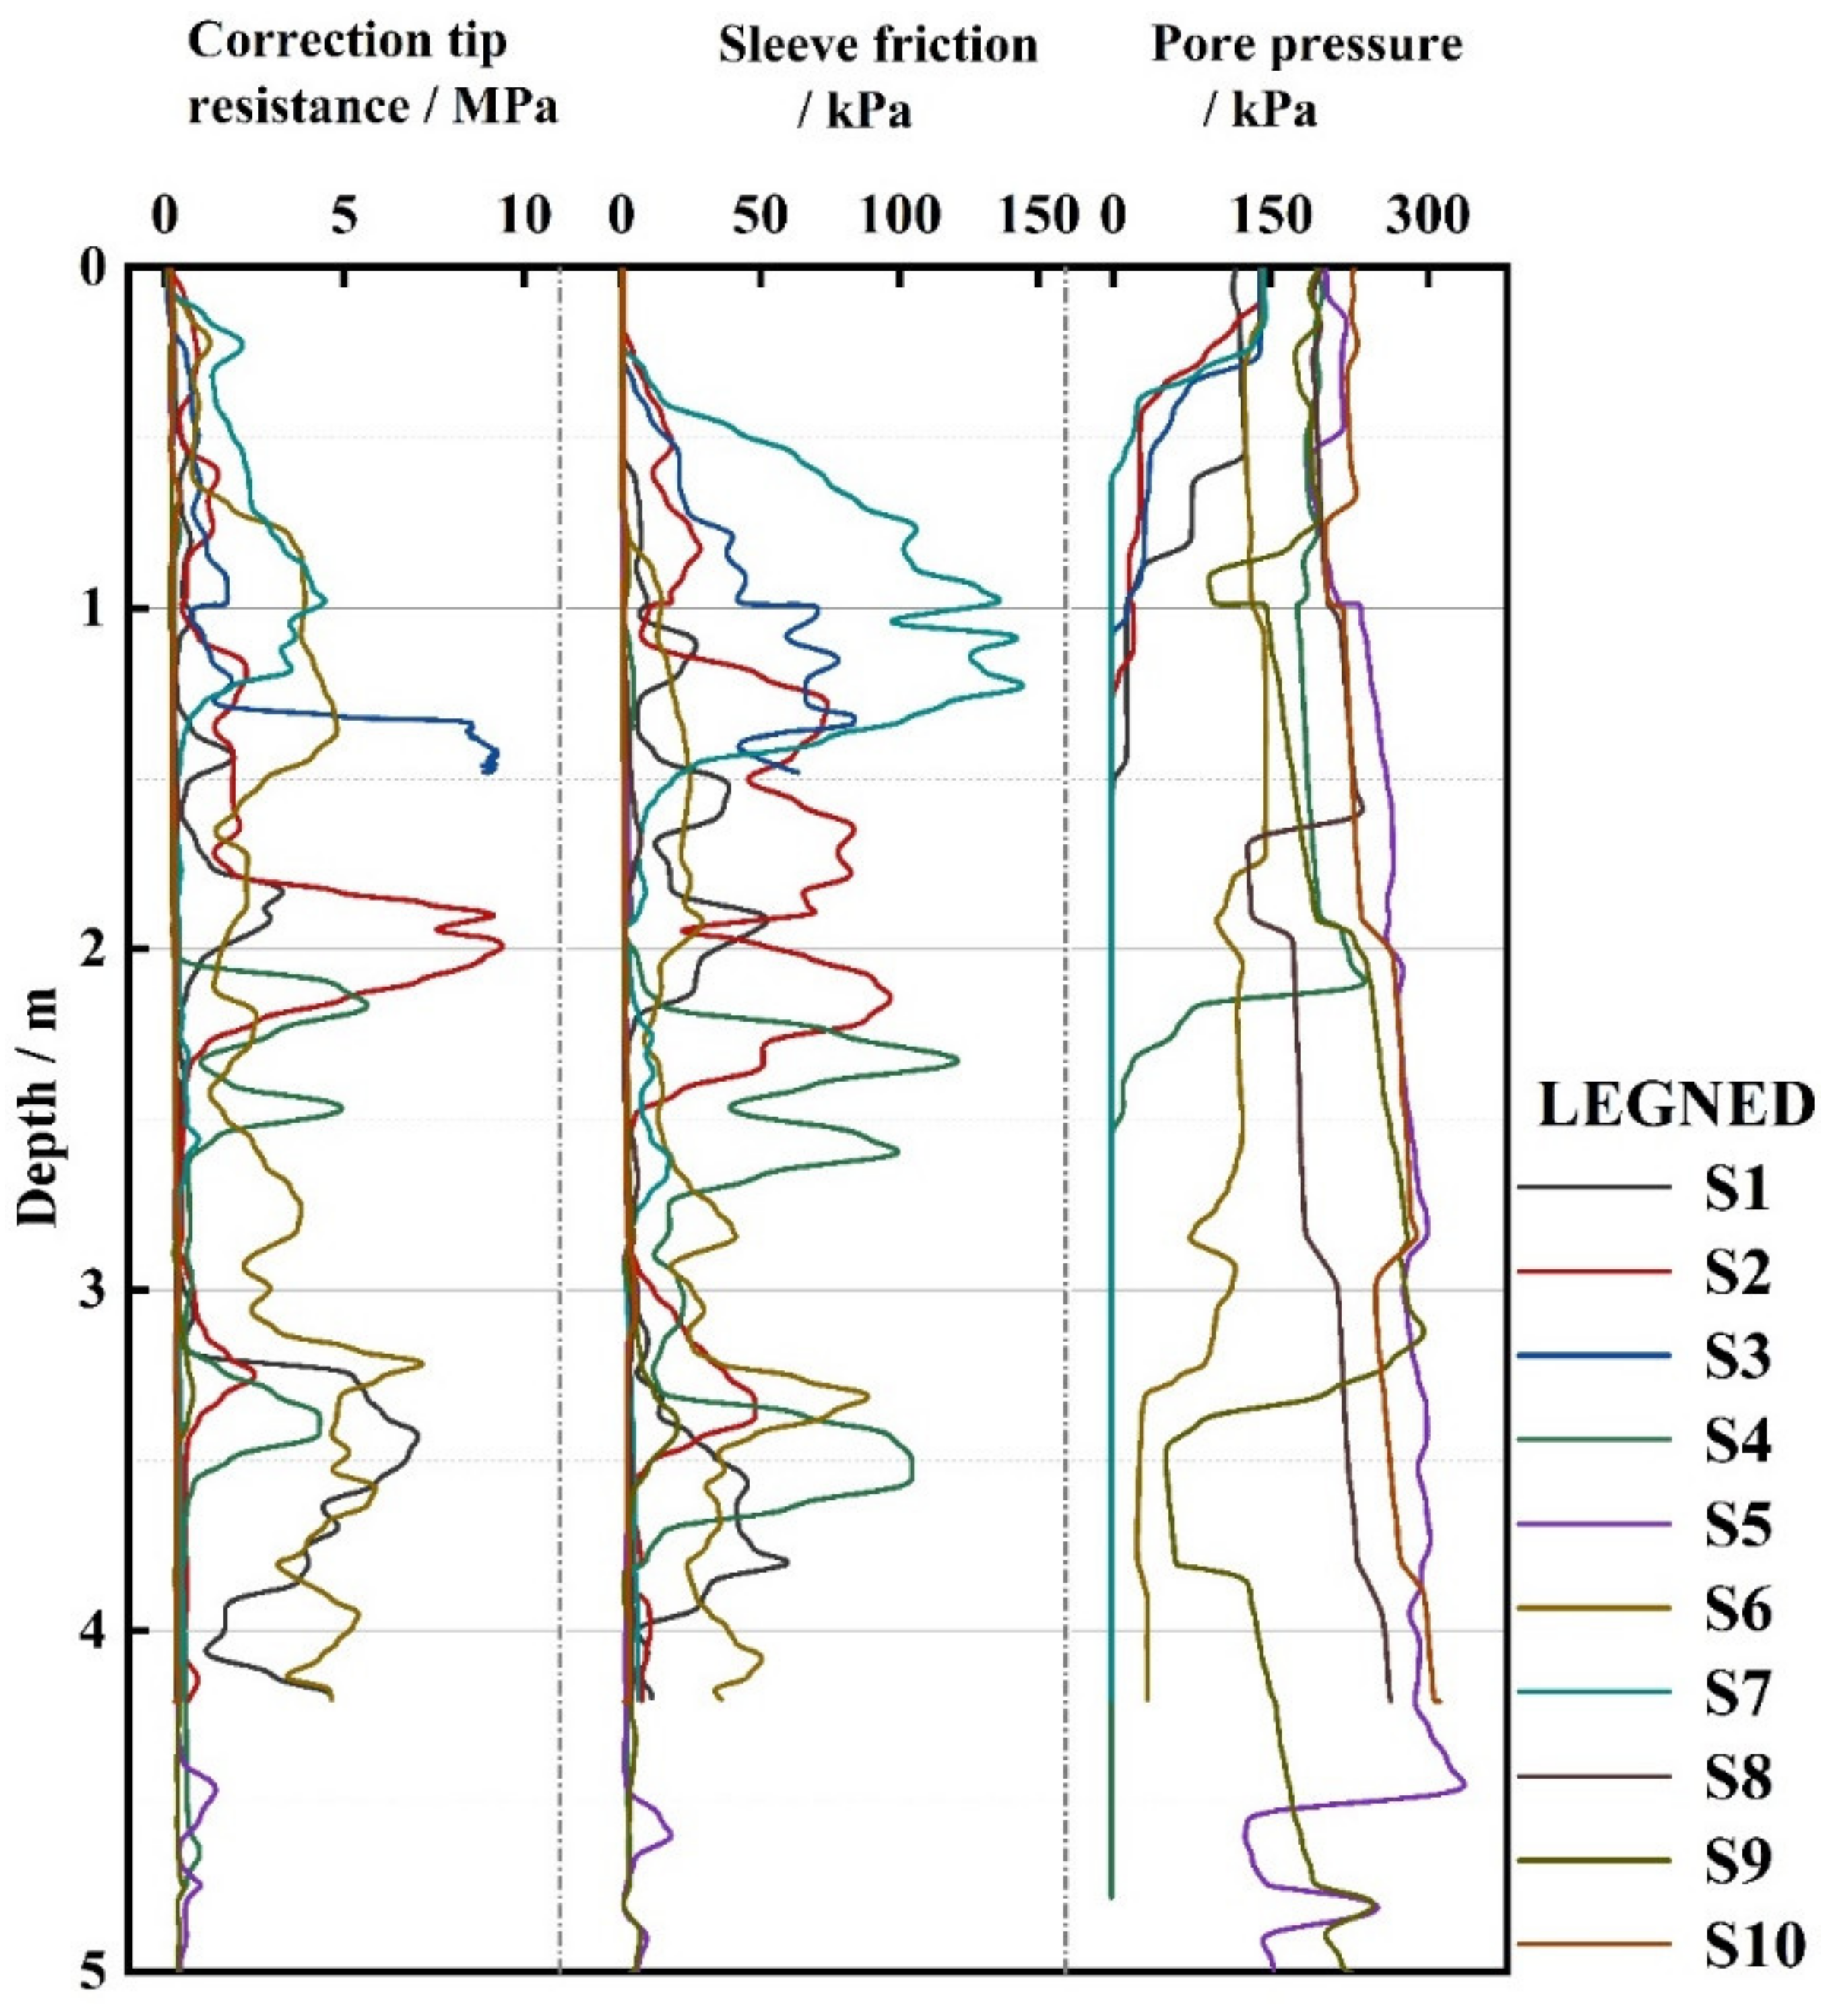
4. Site Variability Analysis Based on CPT
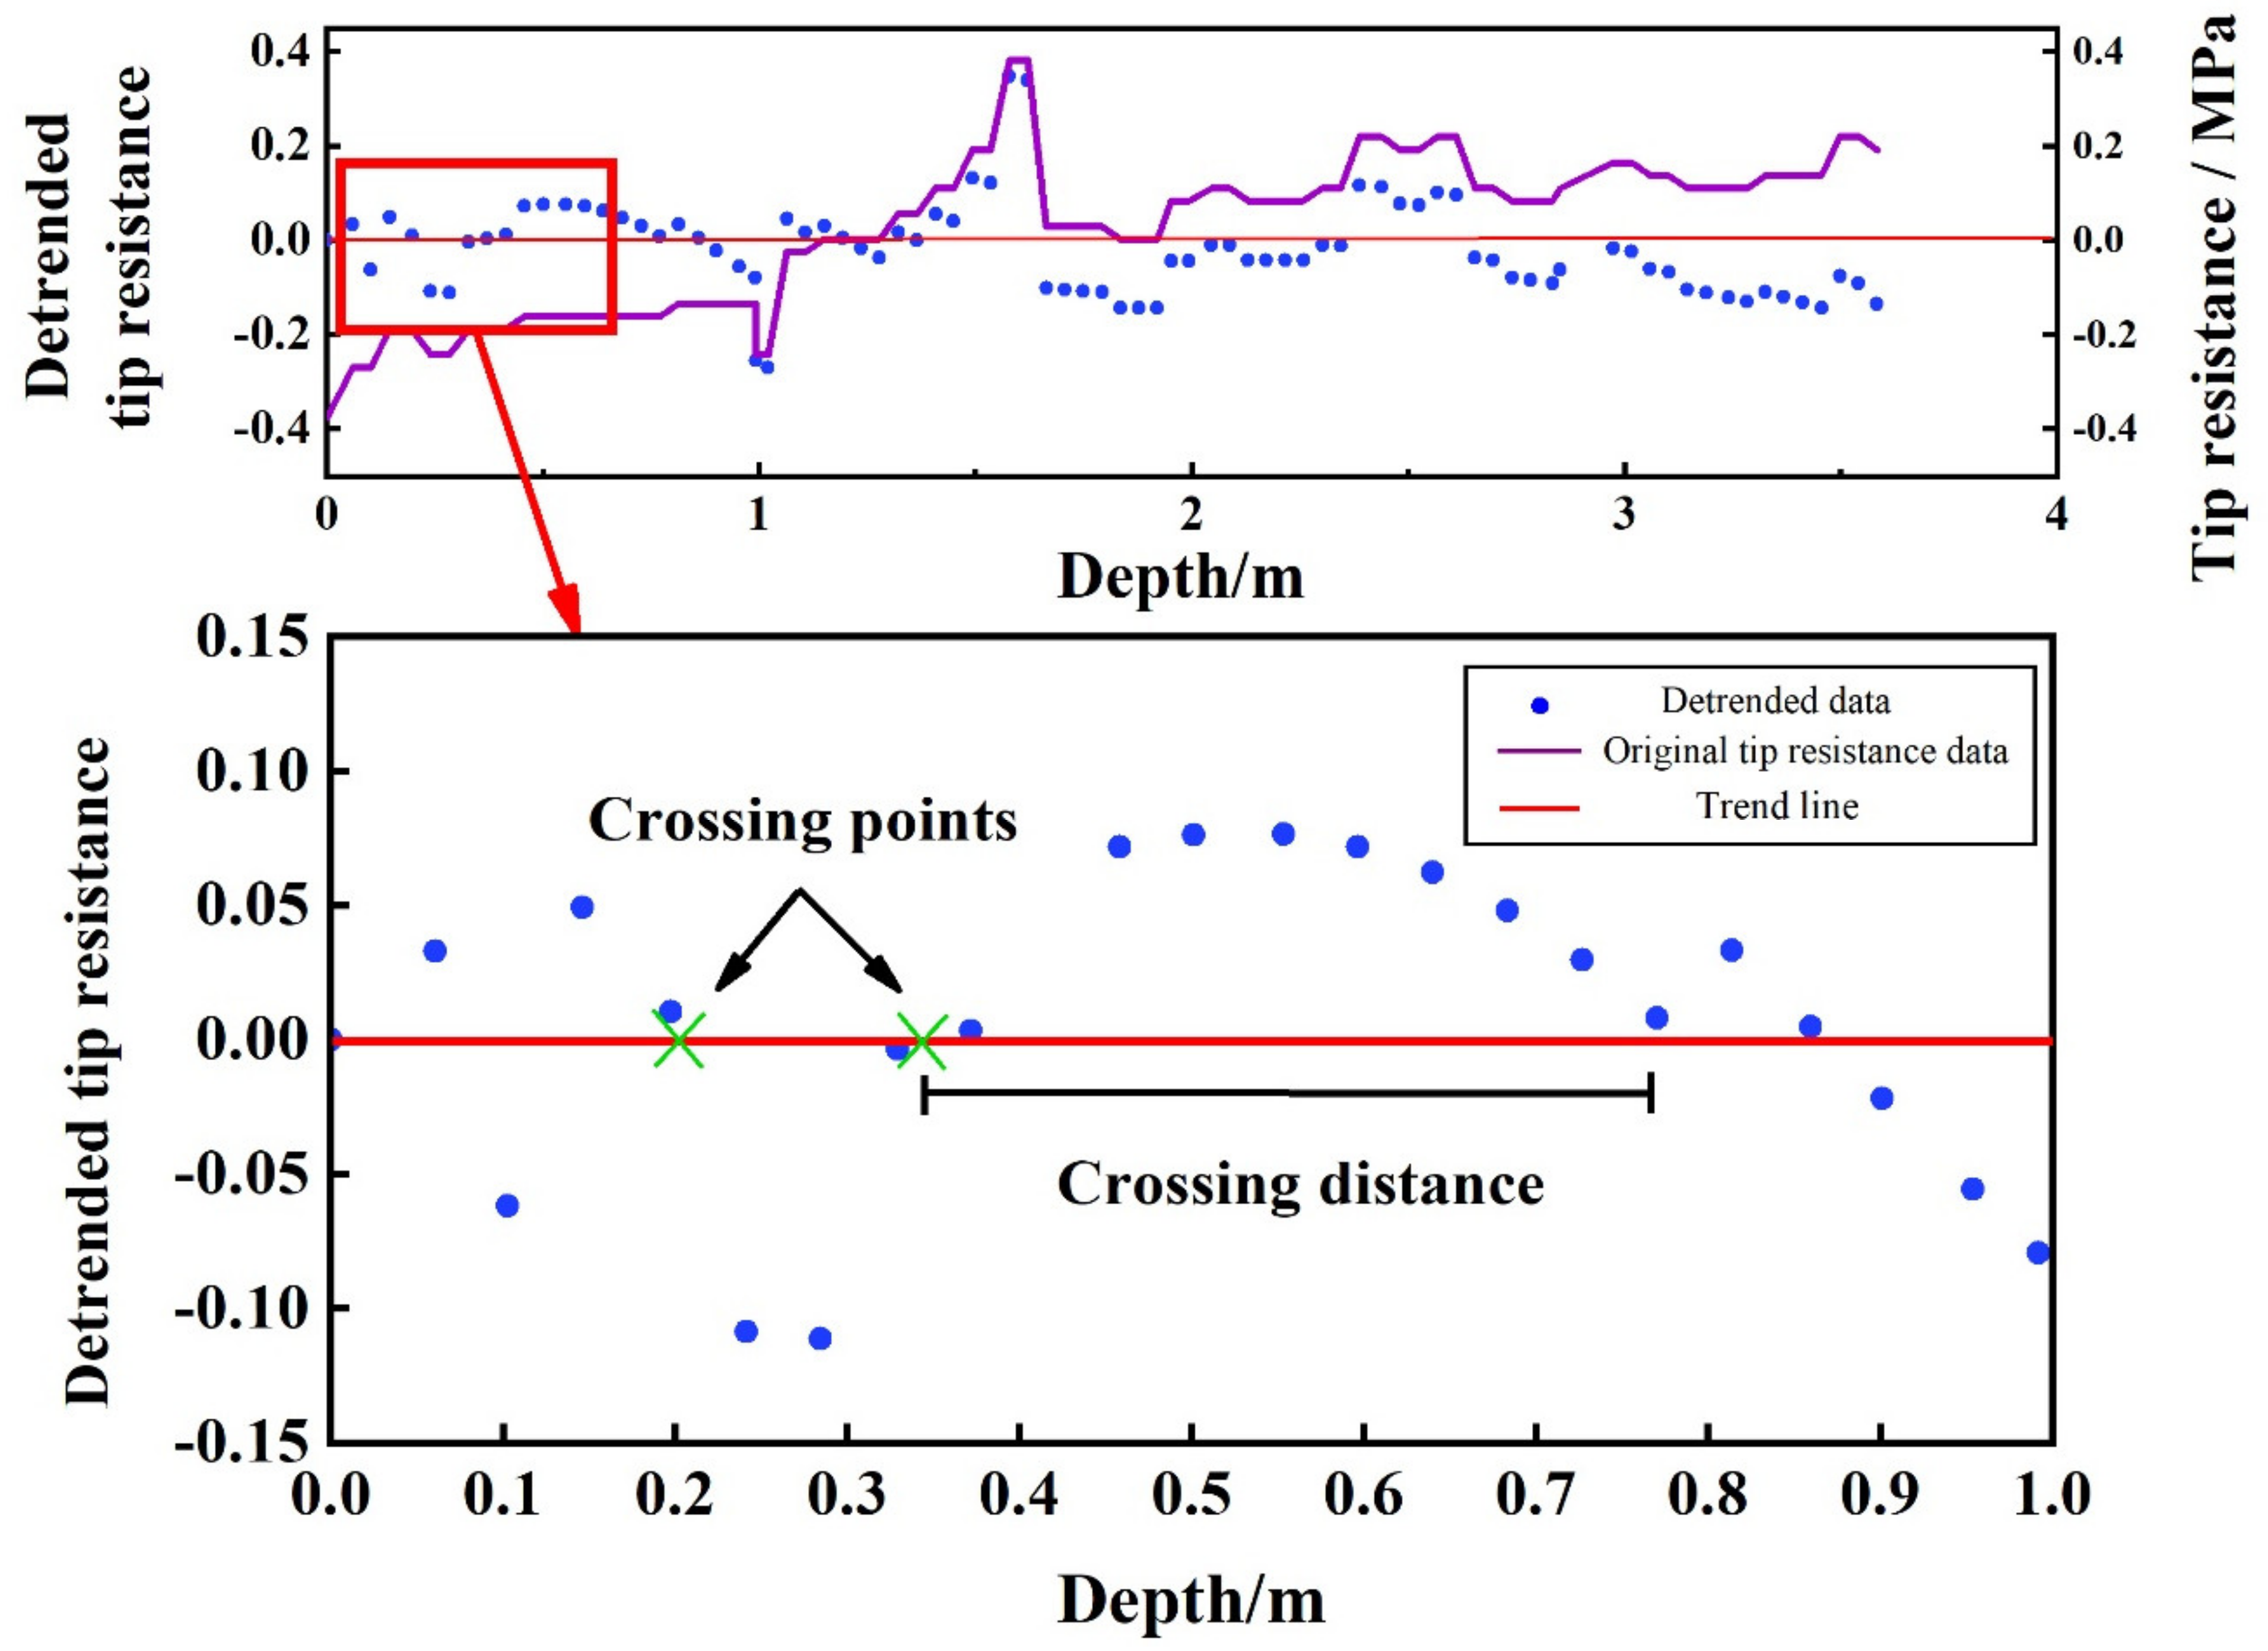
4.1. Vertical Variability Index (VVI)
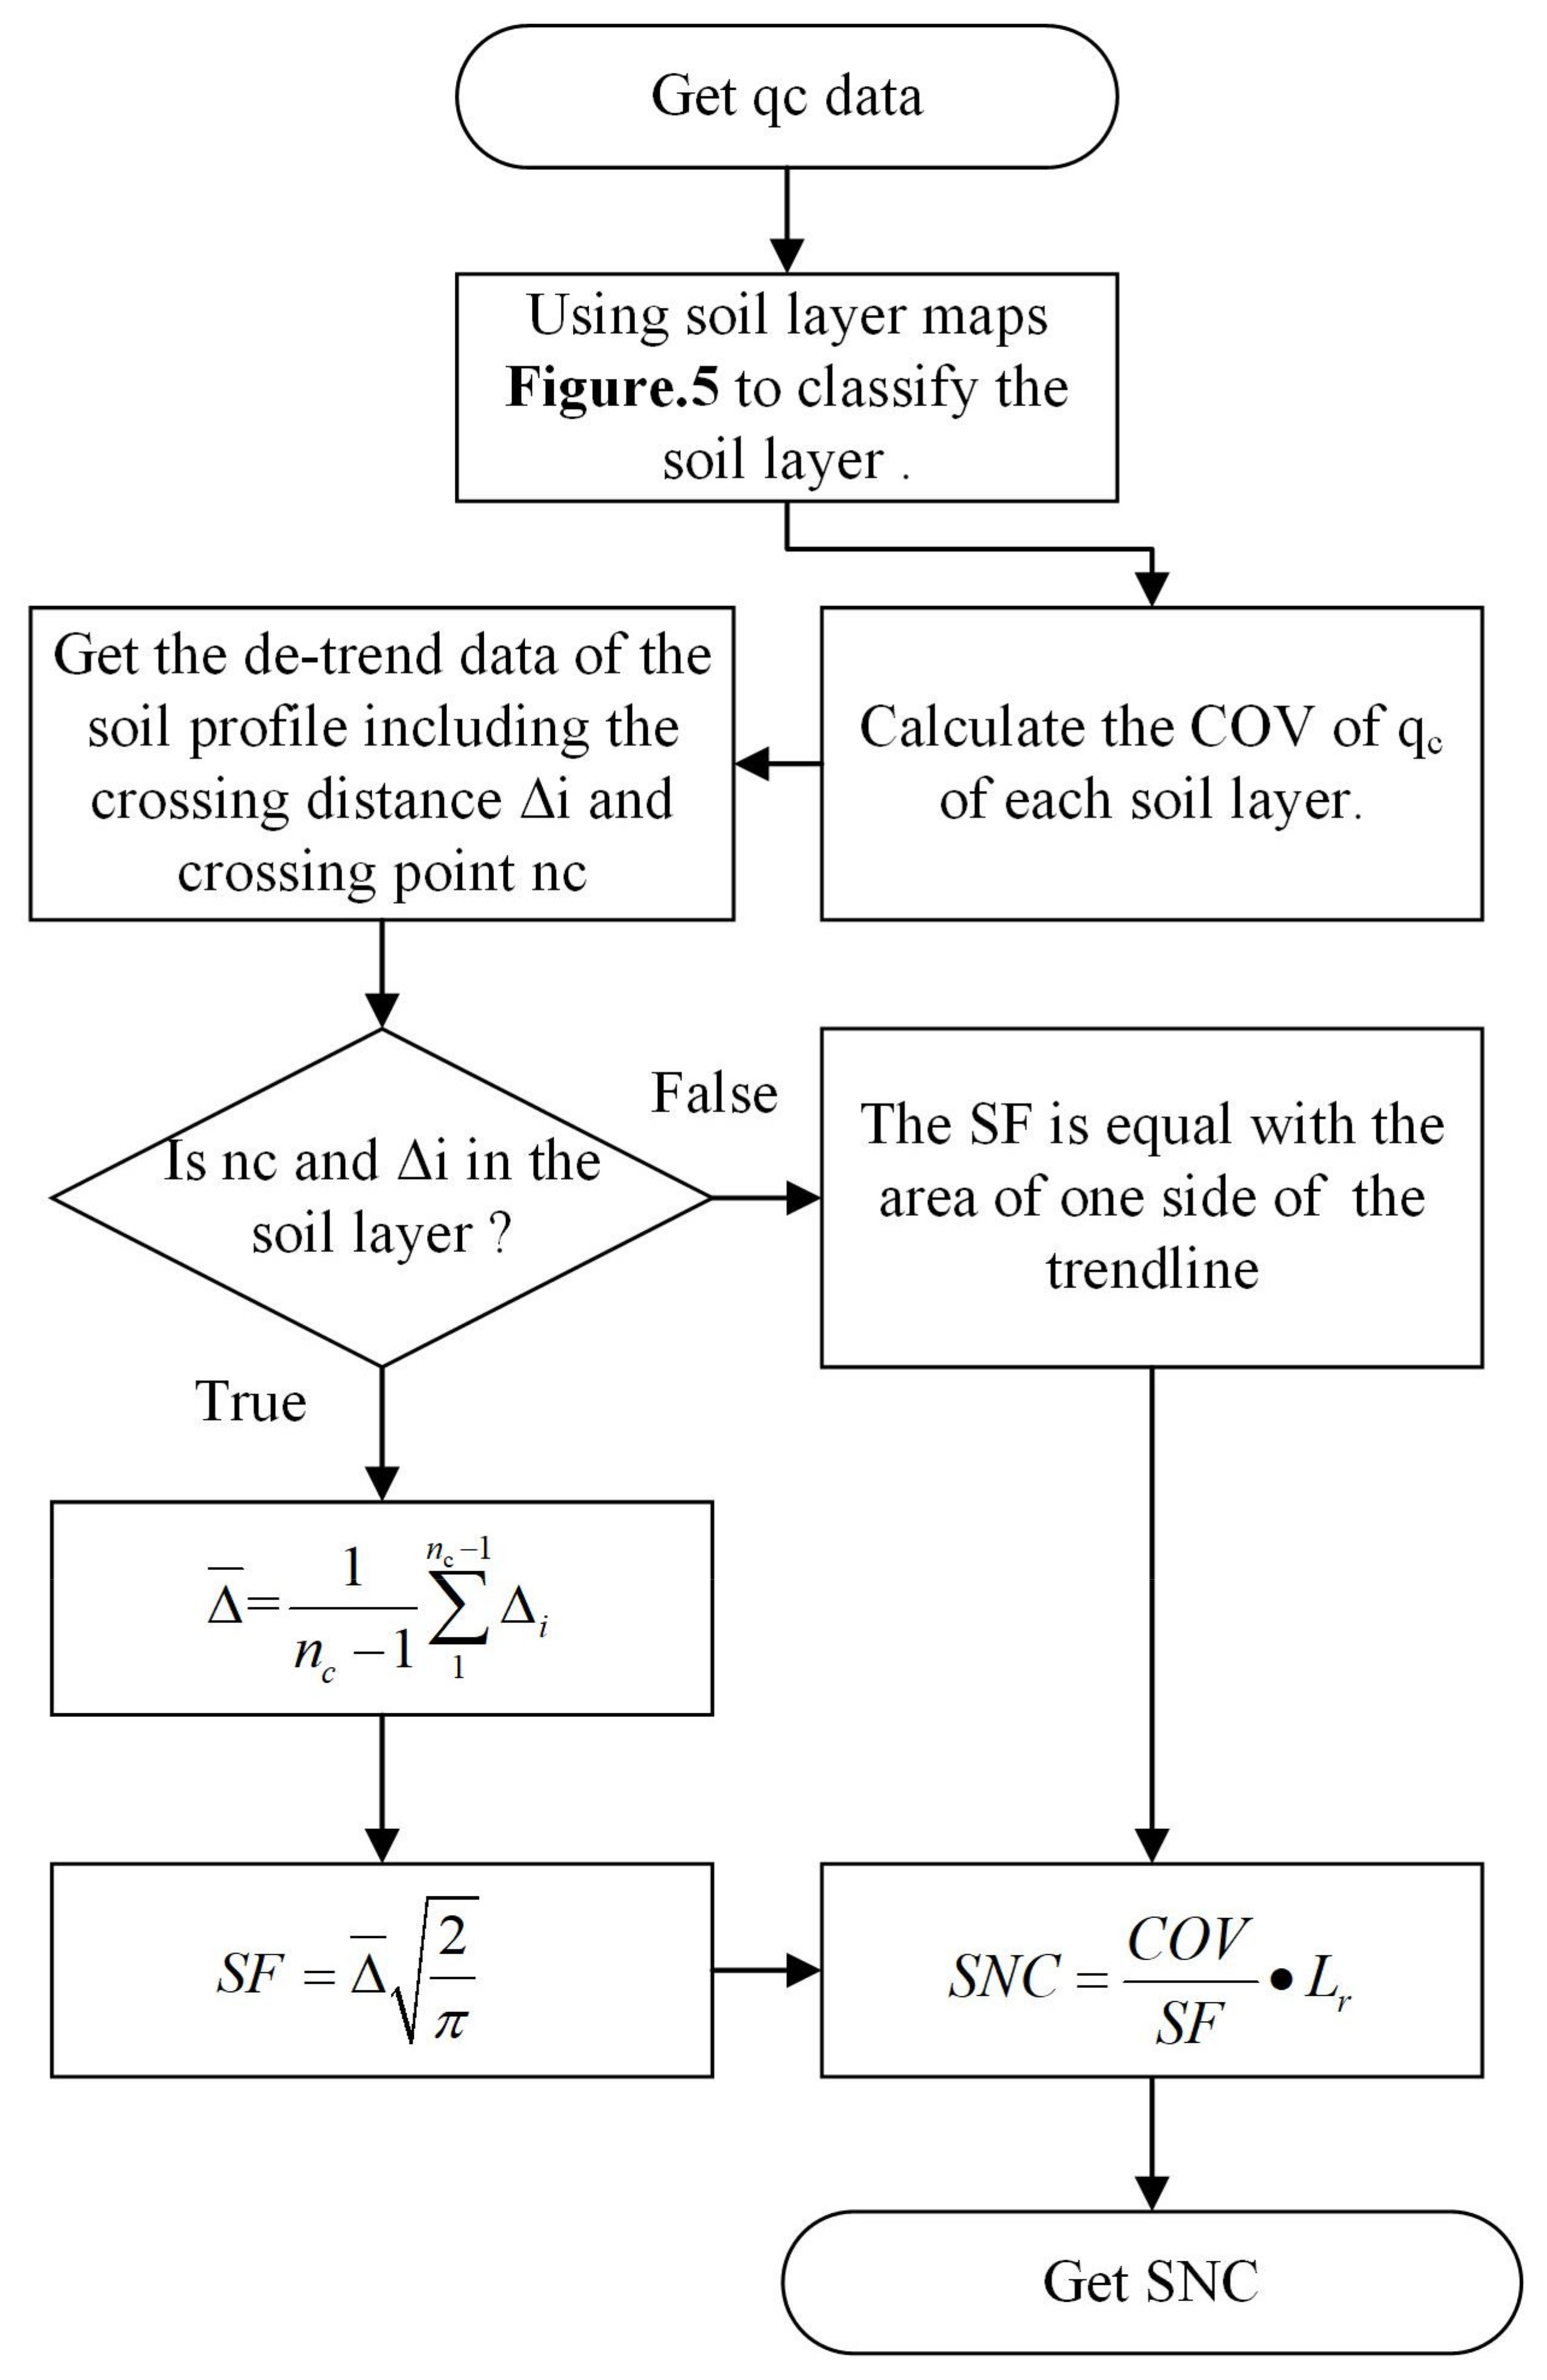
4.2. Intra-Layer Variation Index (VVIIL)
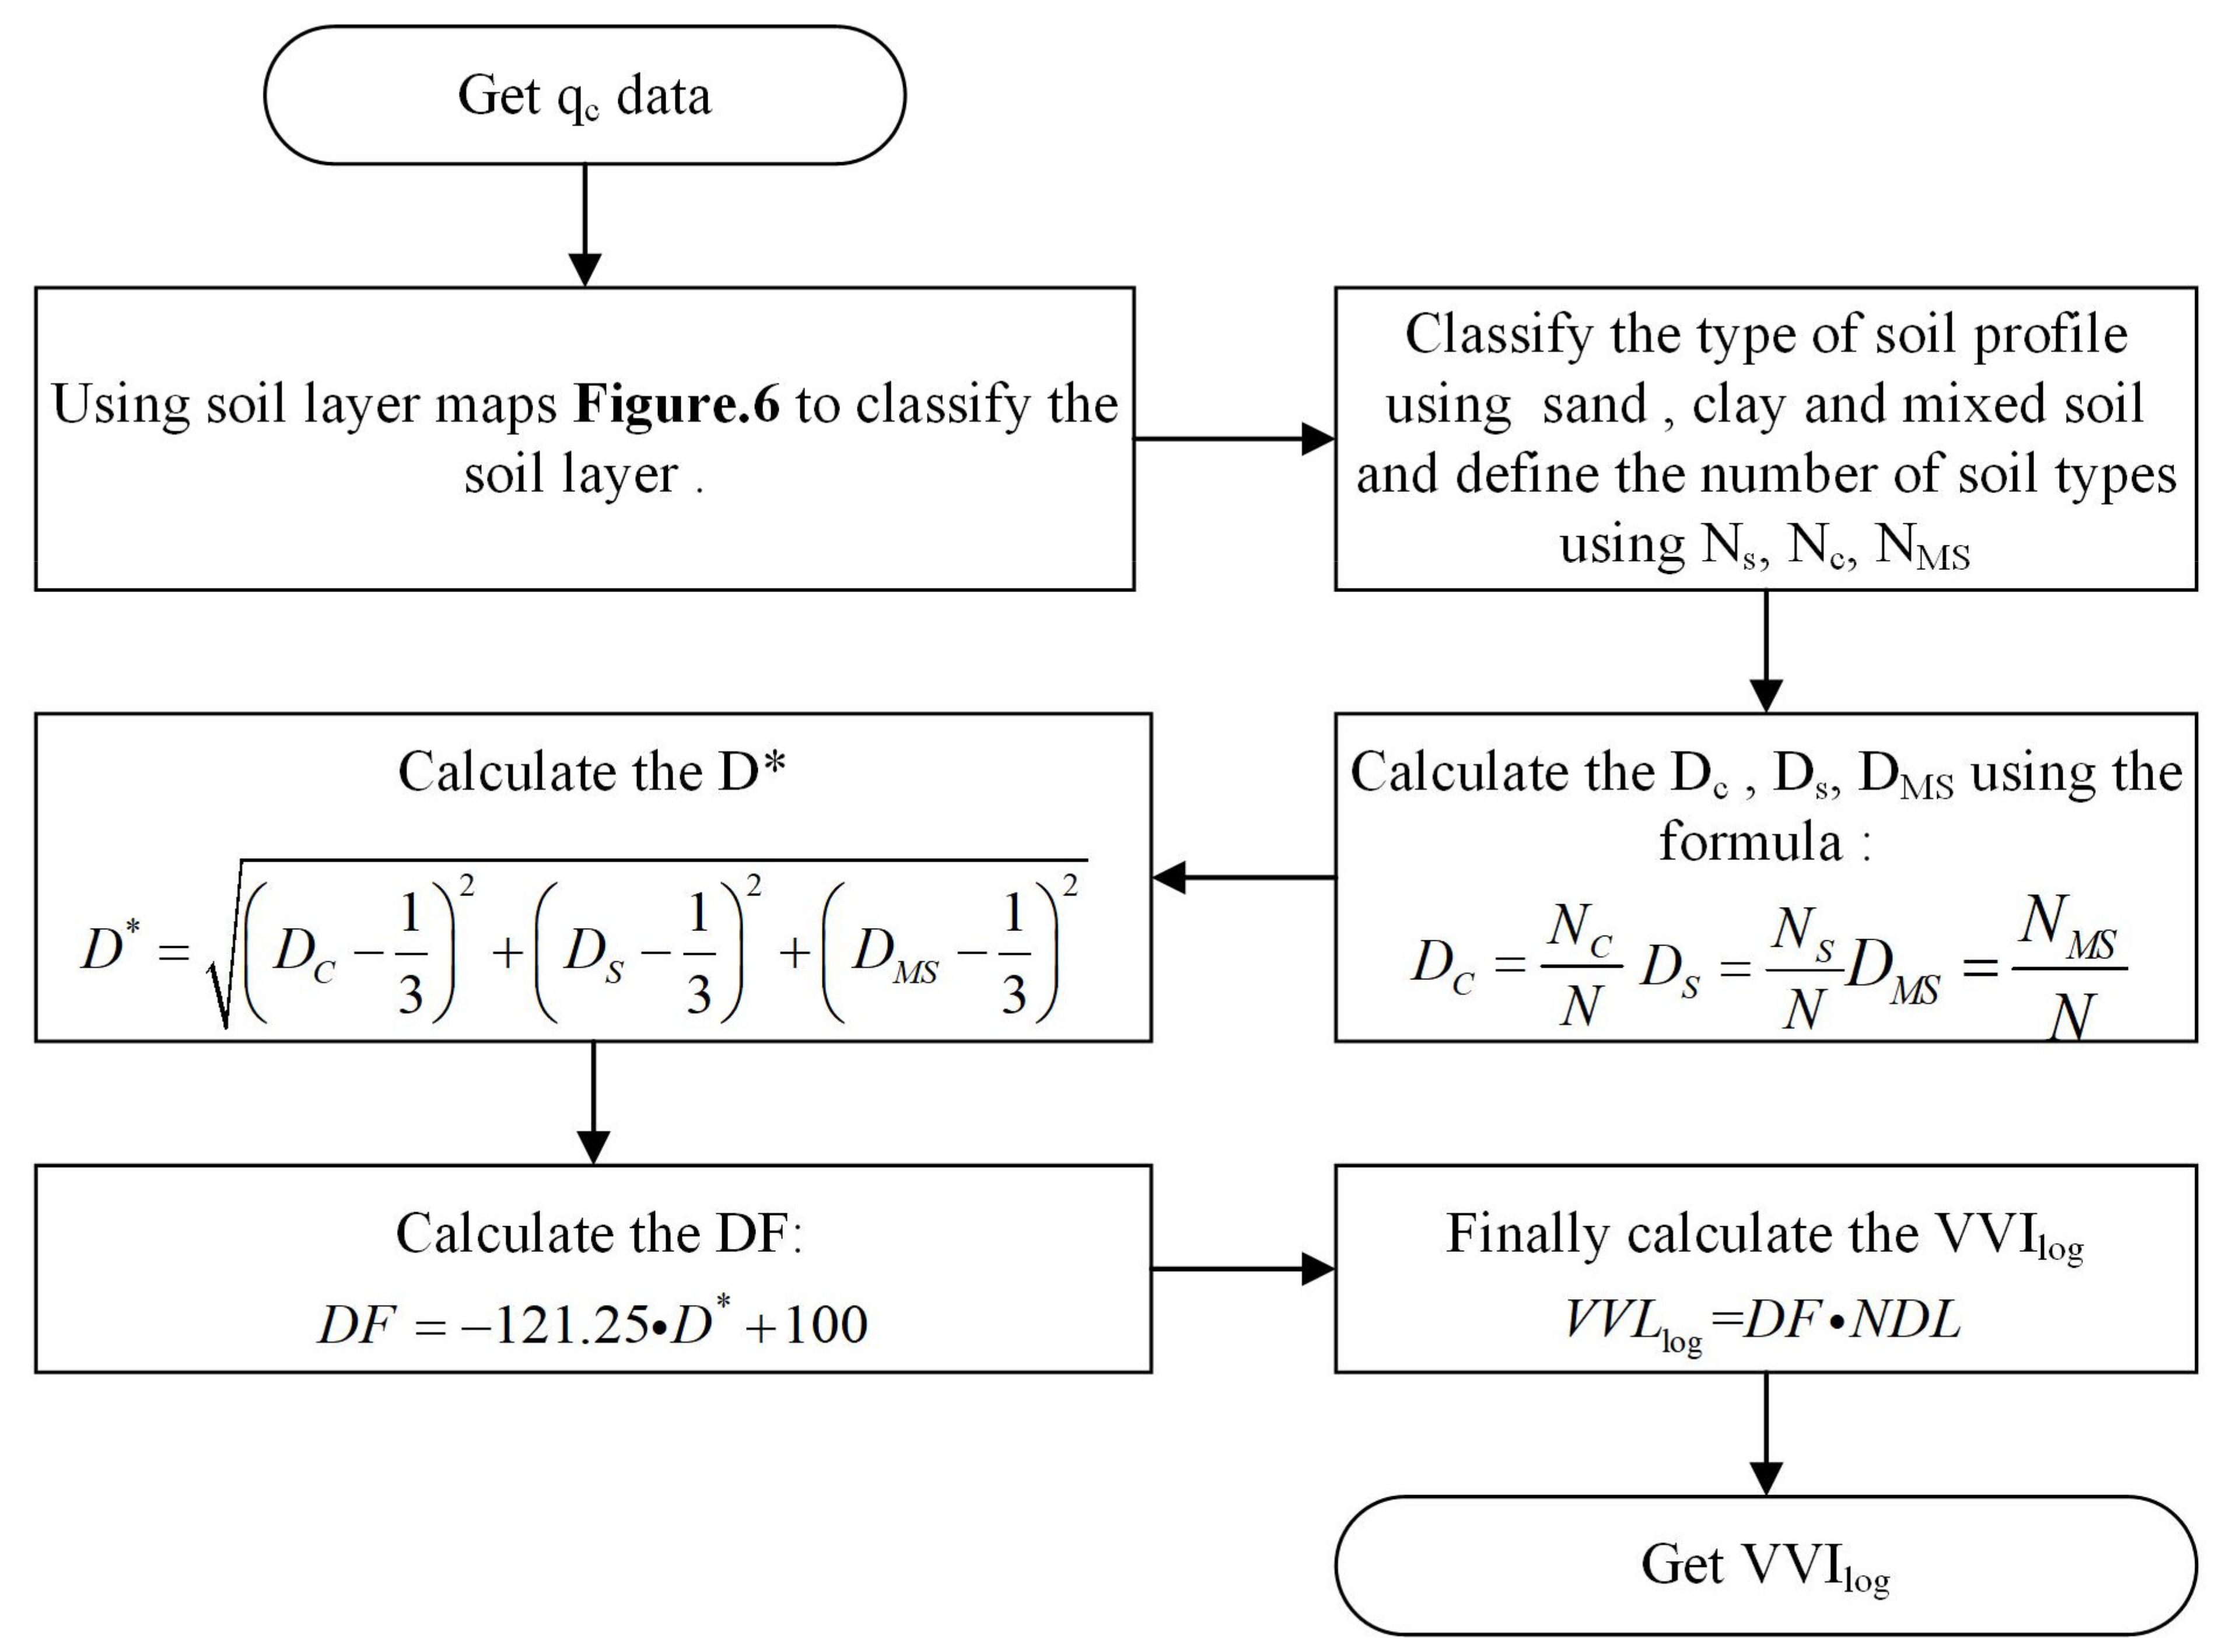
4.3. Log Vertical Variability Index (VVIlog)
4.4. Cone Resistance Vertical Variability Index (VVIqc)
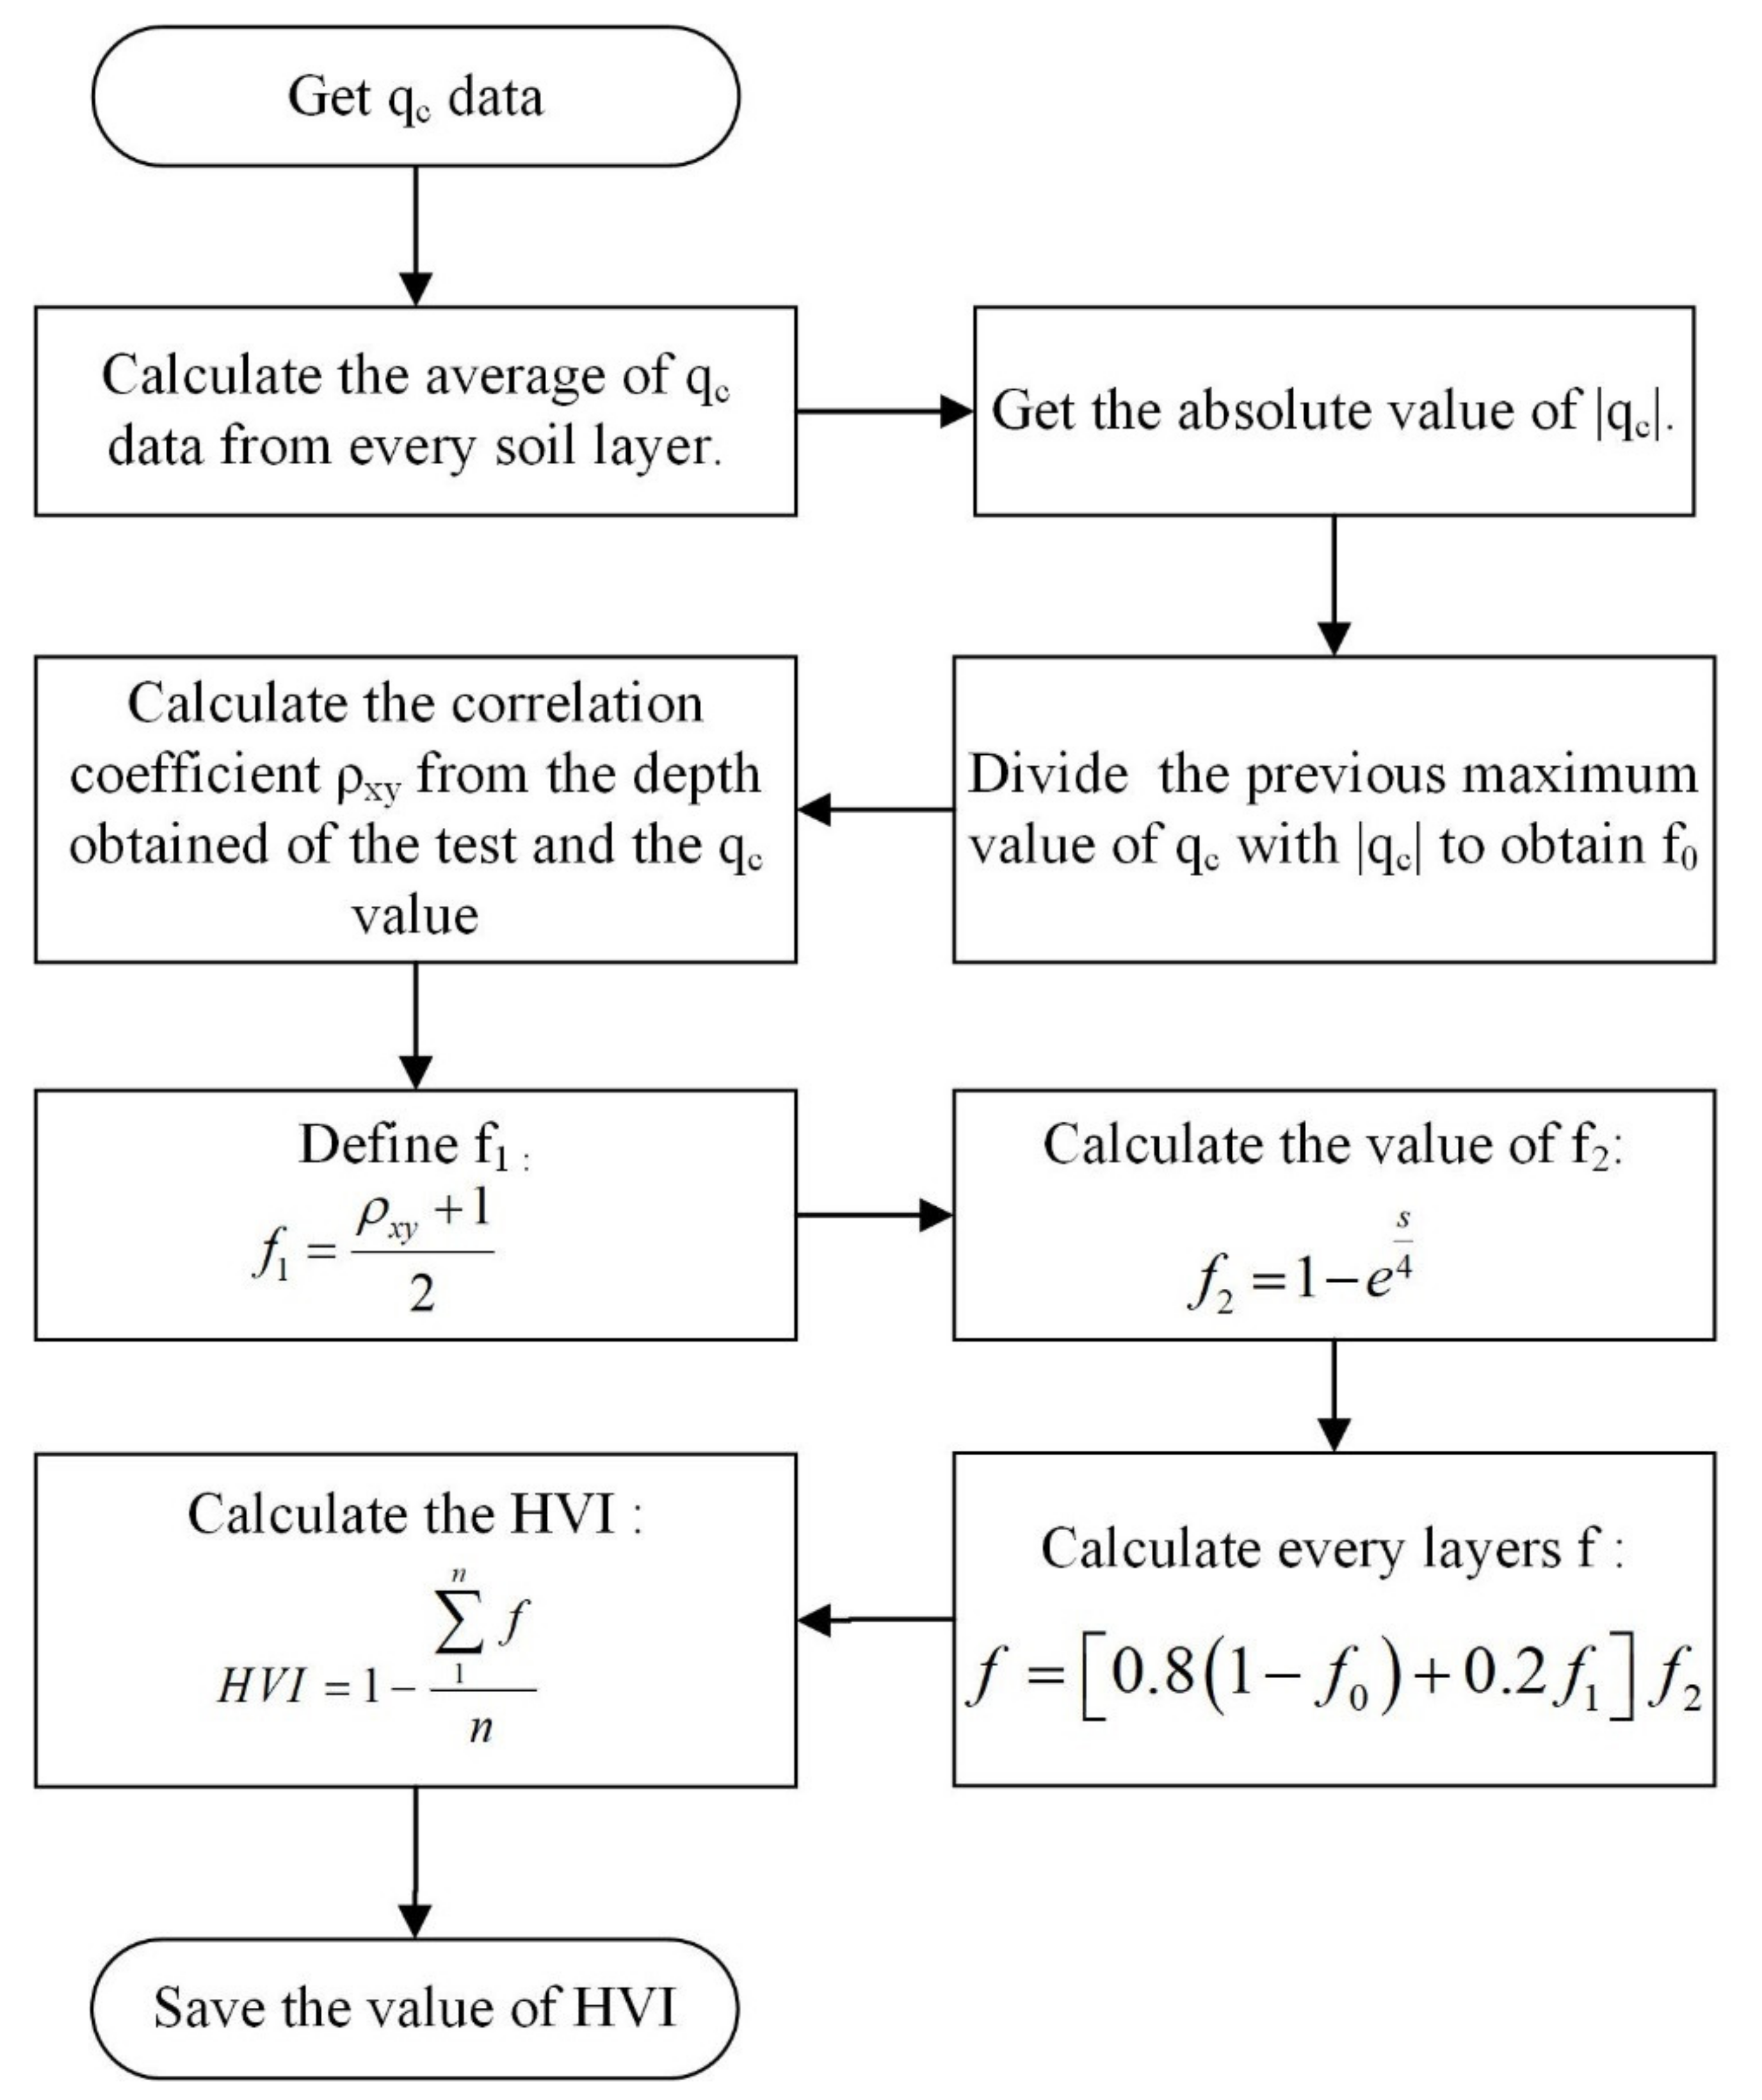
4.5. Horizontal Variability Index (HVI)
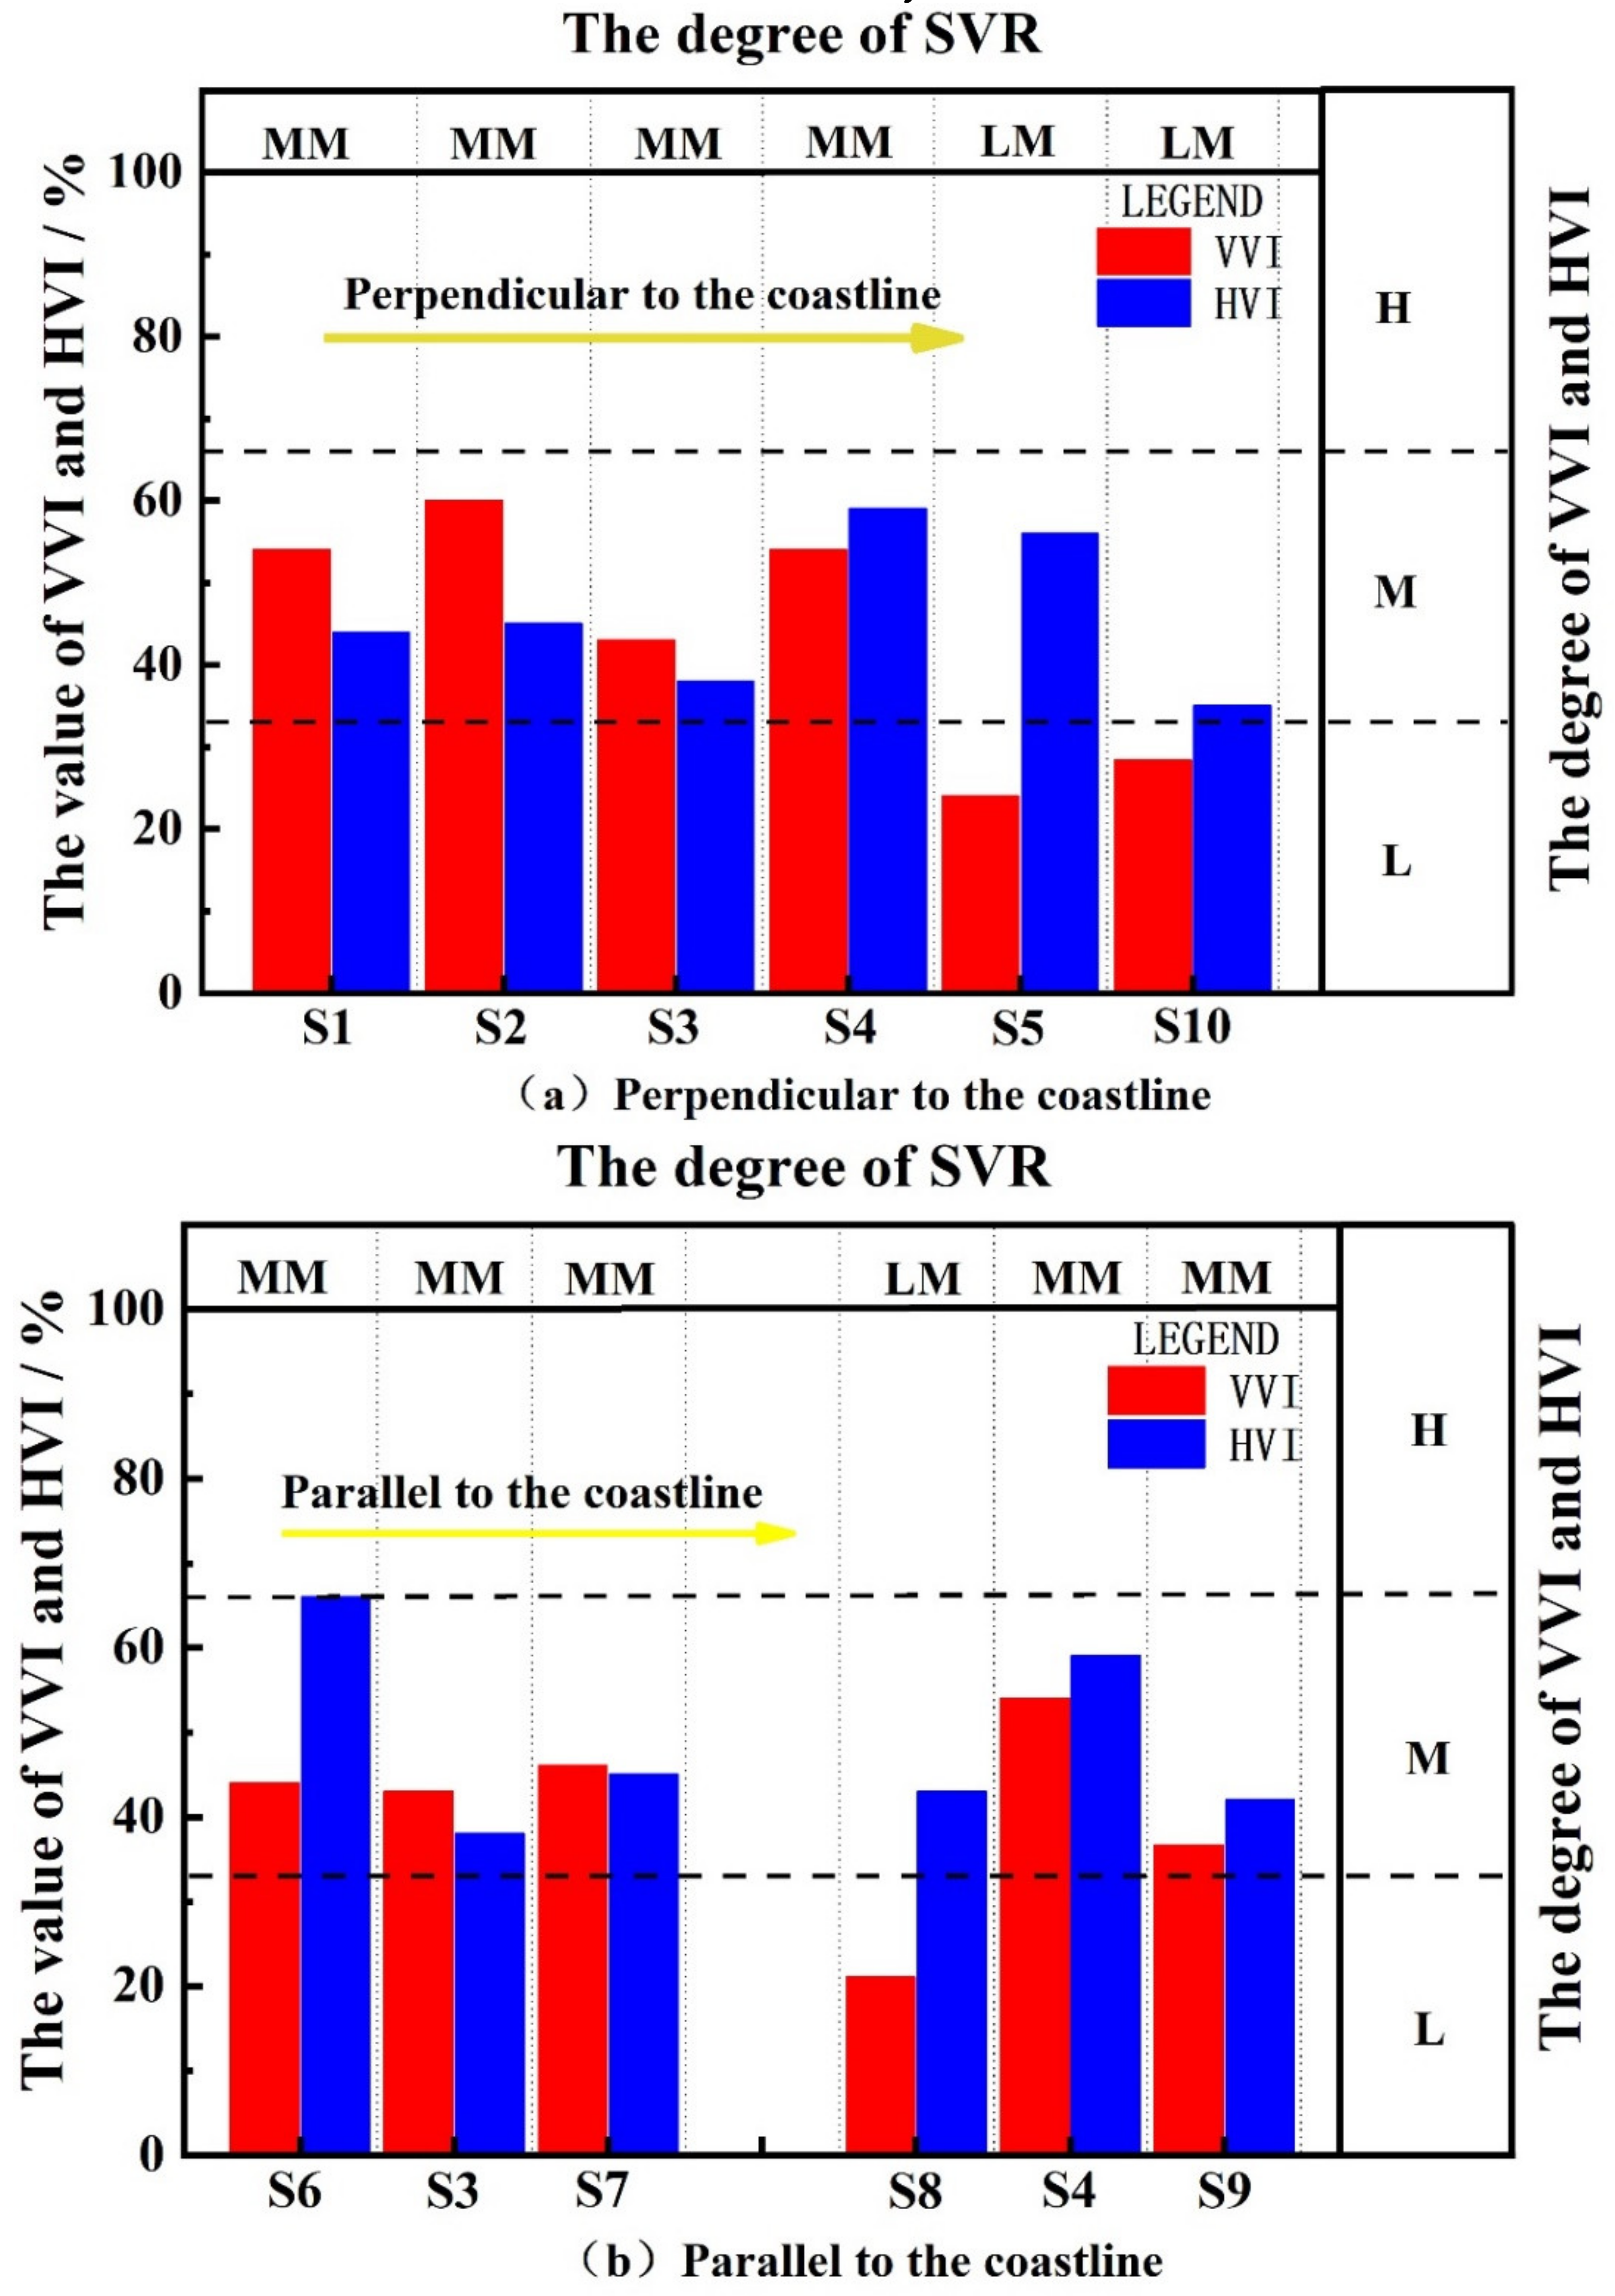
5. Site Variability Rating
6. Conclusions
- (1)
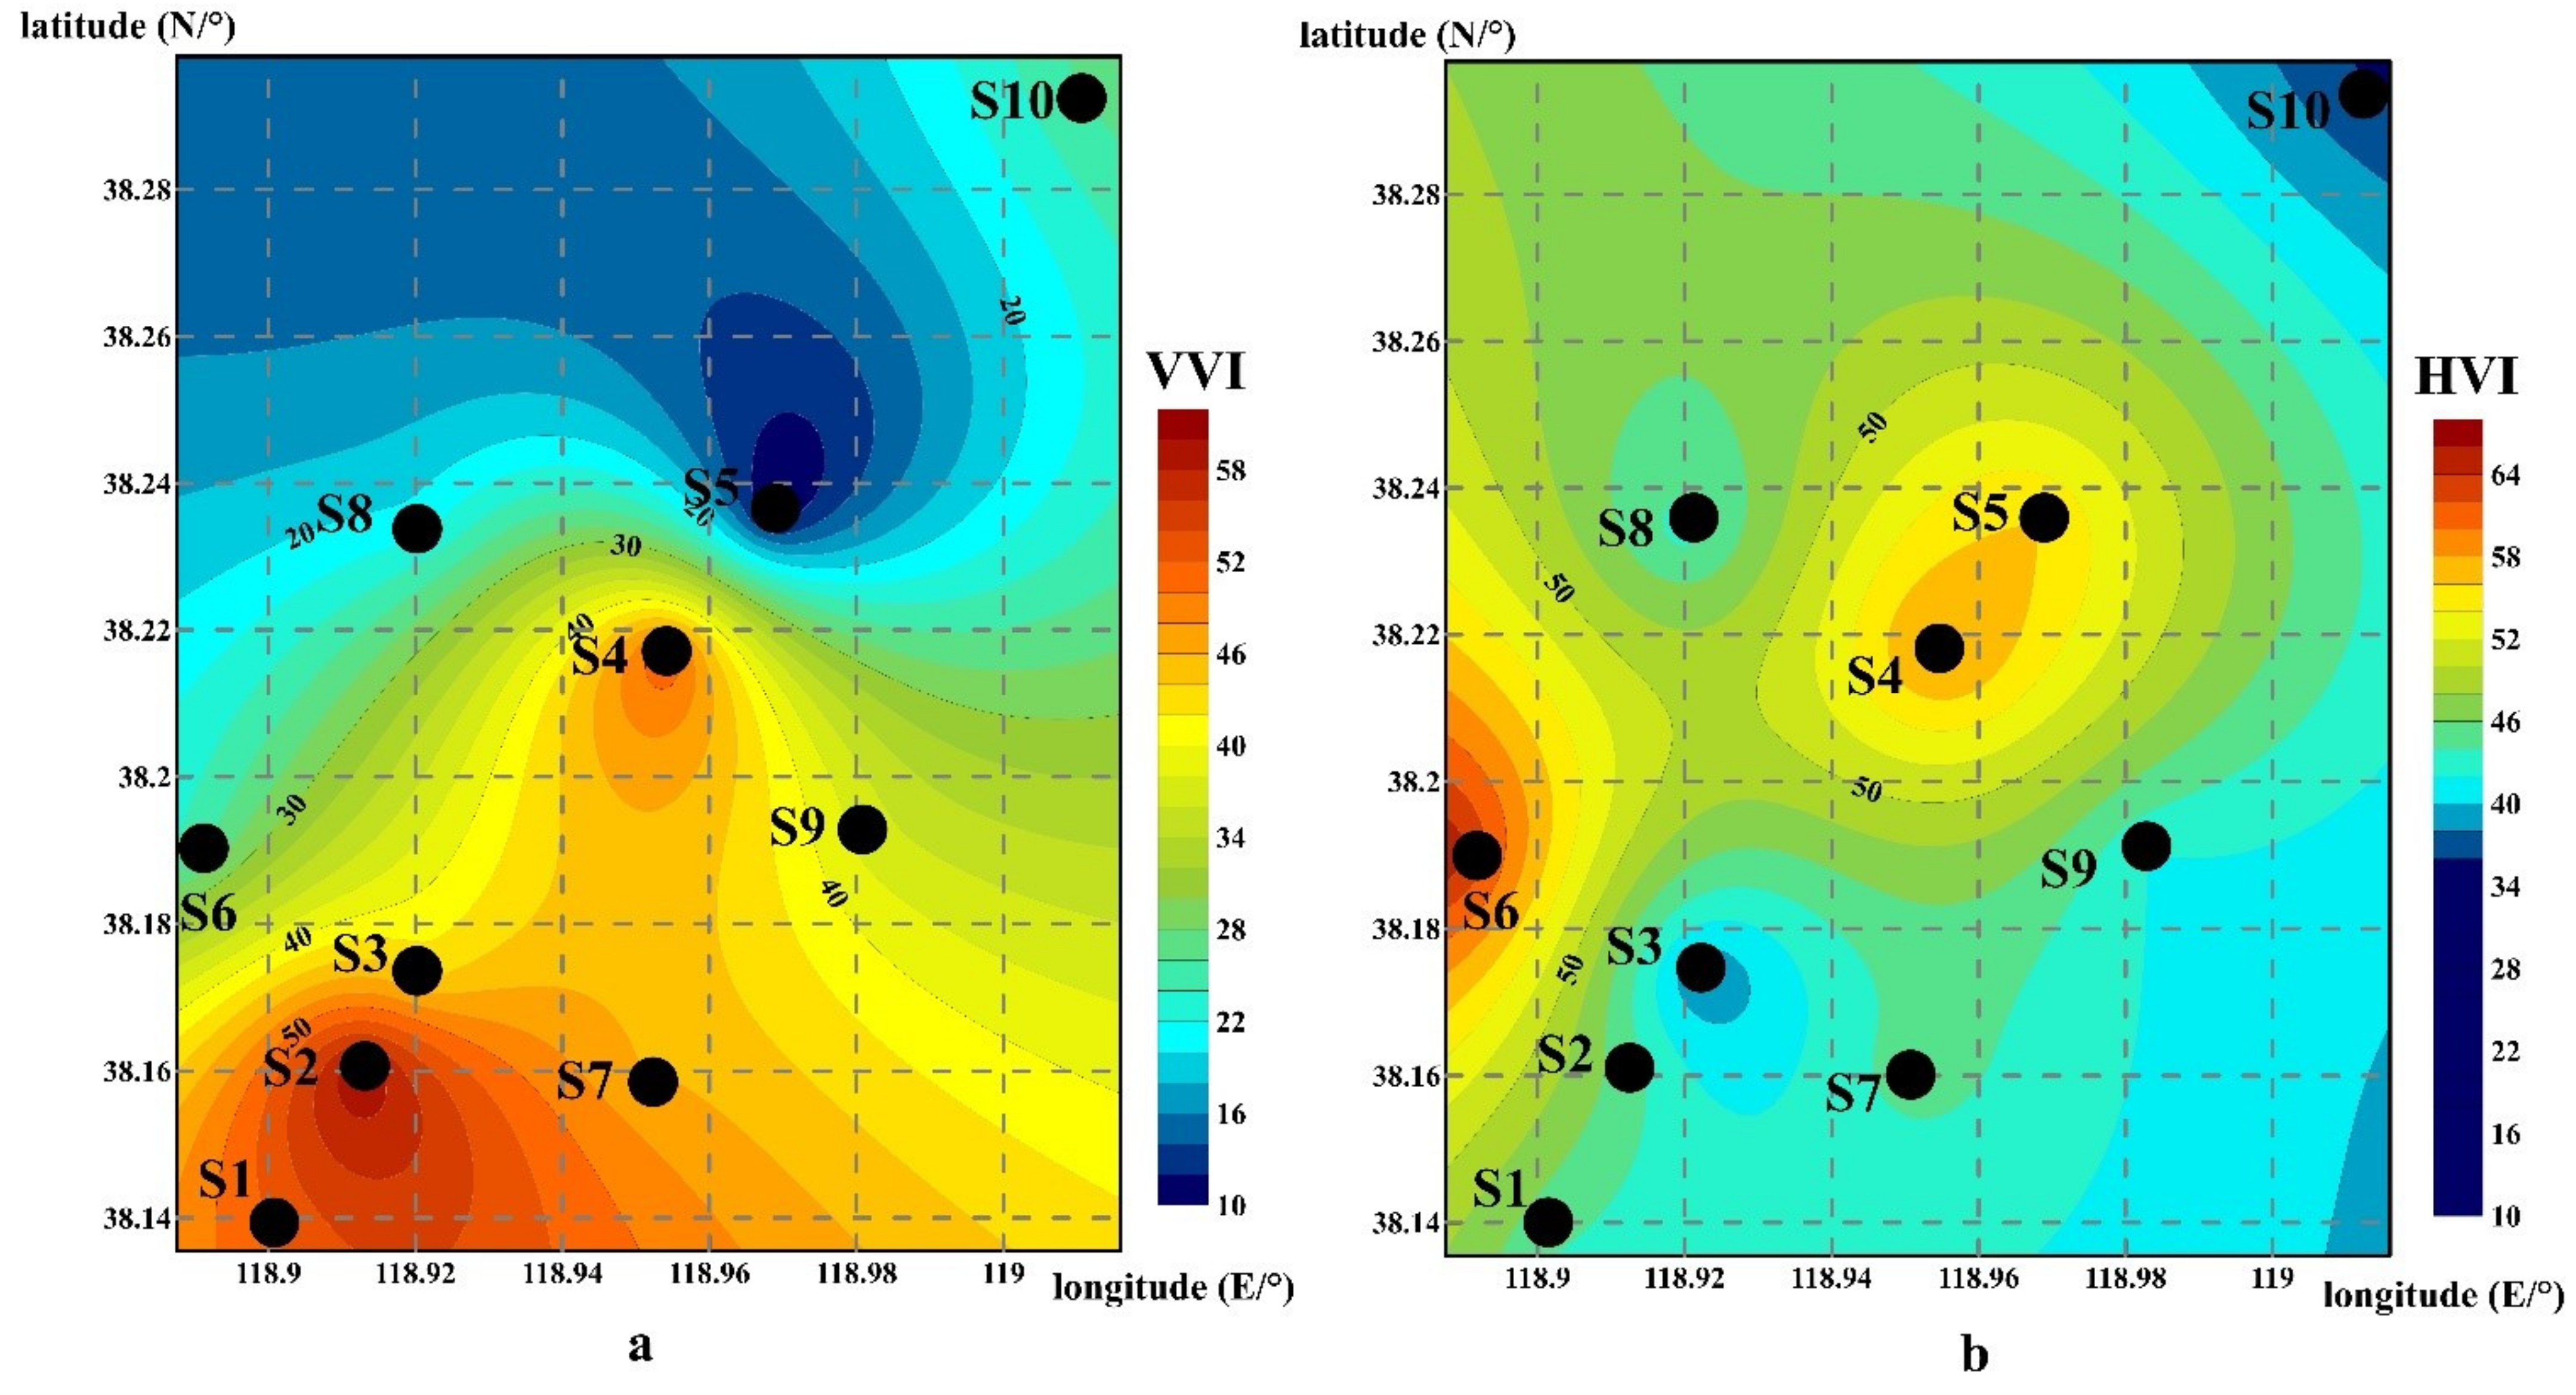
- Sensitive fine-grained soil is widely distributed in the Yellow River Delta. The classification results revealed that 70% of the soil layers in the test area are mainly sensitive fine-grained soil, and the soil composition type is distributed variously. There is an obvious change in the direction perpendicular to the coastline where the content of sensitive fine-grained soil in the near-coast is less than that in the far-coast.
- (2)
- Vertical to the coast, the water depth changes complexly and is obviously affected by hydrodynamic forces. The vertical variability index varies obviously in the direction perpendicular to the coastline. The vertical variability in the offshore areas is basically maintained in the range of more than 45%, which is much larger than the value in distant sea areas, which is less than 20%.
- (3)
- The soil layer changes are complex because of the shallow water depth and the obvious effect of the wave load near the shore. The diversification of the horizontal variability mainly occurs near the coast, and gradually decreases from the northwest direction to the southeast direction. There is no significant change of the horizontal variability distribution in the measured area, and its value is maintained at a moderate level of about 45% or less.
- (4)
- Based on the previously-available geological composition of the Yellow River Delta, the vertical variability and soil distribution are significantly different in the disturbing delta front and the flat delta front. In the distribution delta front, the soil composition is diverse, with high vertical variability basically exceeding 40%; in the flat delta front, the soil composition is homogeneous, with low variability, and is below 20%.
Author Contributions
Funding
Institutional Review Board Statement
Informed Consent Statement
Data Availability Statement
Conflicts of Interest
References
- Song, B.; Sun, Y.; Song, Y.; Dong, L.; Du, X.; Zhou, Q.; Zhao, X. Post-liquefaction re-compaction effect on the cyclic behavior of natural marine silty soil in the Yellow River delta. Ocean. Eng. 2020, 195, 106753. [Google Scholar] [CrossRef]
- Prior, D.B.; Yang, Z.-S.; Bornhold, B.D.; Keller, G.H.; Lu, N.Z.; Wiseman, W.J.; Wright, L.D.; Zhang, J. Active slope failure, sediment collapse, and silt flows on the modern subaqueous Huanghe (Yellow River) delta. Geo-Mar. Lett. 1986, 6, 85–95. [Google Scholar] [CrossRef]
- Xiuli, F.; Hongshuai, Q.; Teng, W.; Anlong, L.; Lin, L. Geomorphological evolution and geological disasters analysis in Chengdao sea area of the Yellow River Delt. Rock Soil Mech. 2004, 25, 17–20. [Google Scholar] [CrossRef]
- Yuling, Z.; Xiuli, F.; Sheng, S.; Donghui, T. Geochemical partition of surface sediments in the seas near the modern Yellow River Delta. Mar. Sci. 2016, 40, 98–104. [Google Scholar]
- Liangyong, Z.; Jian, L.; Xiqing, L.; Guangxue, L.; Zhengxin, C. Hazardous Geology in the Shallow Sea Area of Modern Yellow River Delta. Mar. Geol. Quat. Geol. 2004, 24, 19–27. [Google Scholar]
- Haoran, H.; Zhili, Z.; Chengshu, C. Numerical Simulation of Morphological Evolution Process of the Yellow River Mouth. Coast. Eng. 2018, 37, 1–14. [Google Scholar]
- Yang, Z.; Zhu, Y.; Liu, T.; Sun, Z.; Ling, X.; Yang, J. Pumping effect of wave-induced pore pressure on the development of fluid mud layer. Ocean. Eng. 2019, 189, 106391. [Google Scholar] [CrossRef]
- Yang, Z.; Zhu, Y.; Liu, T.; Sun, Z.; Ling, X.; Zheng, Y. Contribution of Pumping Action of Wave-Induced Pore-Pressure Response to Development of Fluid Mud Layer. J. Mar. Sci. Eng. 2019, 7, 317. [Google Scholar] [CrossRef] [Green Version]
- Jia, Y.; Zhang, L.; Zheng, J.; Liu, X.; Jeng, D.-S.; Shan, H. Effects of wave-induced seabed liquefaction on sediment re-suspension in the Yellow River Delta. Ocean. Eng. 2014, 89, 146–156. [Google Scholar] [CrossRef]
- Ren, Y.; Xu, G.; Xu, X.; Zhao, T.; Wang, X. The initial wave induced failure of silty seabed: Liquefaction or shear failure. Ocean. Eng. 2020, 200, 106990. [Google Scholar] [CrossRef]
- Zheng, J.-W.; Jia, Y.-G.; Liu, X.-L.; Shan, H.-X.; Zhang, M.-S. Experimental study of the variation of sediment erodibility under wave-loading conditions. Ocean. Eng. 2013, 68, 14–26. [Google Scholar] [CrossRef]
- Xiushan, G.; Qinian, Z.; Mingzuo, F.; Peiying, L.; Xiaoshi, X. Quantitative analysis and evaluation of scouring and silting in the Yellow River Estuary. Acta Oceanol. Sin. 1988, 10, 712–719. [Google Scholar]
- Anlong, L.; Guangxue, L.; Lihua, C.; Qingde, Z.; Shenggui, D. Coastal erosion and shoreline evolution of abandoned leaf petals in the Yellow River Delta. Acta Geogr. Sin. 2004, 59, 731–737. [Google Scholar] [CrossRef]
- Robertson, P.K. Evaluating Soil Liquefaction and Post-earthquake deformations using the CPT. In Proceedings of the Geotechnical and Geophysical Site Characterization, Porto, Portugal, 19–22 September 2004. [Google Scholar]
- Lakusic, S.; Librić, L.; Jurić-Kaćunić, D.; Kovačević, M.S. Application of cone penetration test (CPT) results for soil classification. J. Croat. Assoc. Civ. Eng. 2017, 69, 11–20. [Google Scholar] [CrossRef] [Green Version]
- Dong, D.; Wan, D. Preliminary Study on the Erosion of the Modern Yellow River Delta. Mar. Geol. Quat. Geol. 1988, 8, 53–60. [Google Scholar]
- Liuqi, W.; Zaixing, J. Mineralogical characteristics and sedimentary genesis of land surface sediments in the Yellow River Delta. J. Univ. Pet. China 1993, 17, 1–6. [Google Scholar]
- Eslami, A.; Fellenius, B.H. Pile capacity by direct CPT and CPTu methods applied to 102 case histories. Can. Geotech. J. 1997, 34, 886–904. [Google Scholar] [CrossRef]
- Guo, L.; Liu, X.; Yang, Z.; Jia, C.; Shi, W.; Ling, X. CPT-based analysis of structured soil characteristics and liquefaction failure of the Yellow River Subaquatic Delta. Mar. Georesour. Geotechnol. 2021, 1–20. [Google Scholar] [CrossRef]
- Cetin, K.O.; Ozan, C. CPT-Based Probabilistic Soil Characterization and Classification. J. Geotech. Geoenviron. Eng. 2009, 135, 84–107. [Google Scholar] [CrossRef]
- Robertson, P.K.; Campanella, R.G.; Gillespie, D.; Greig, J. Use of piezometer cone data. In Use of In Situ Tests in Geotechnical Engineering; ASCE: Blacksburg, VA, USA, 1986. [Google Scholar]
- Long, M. Key Note Lecture: Design parameters from in situ tests in soft ground—Recent developments. In Proceedings of the 3rd International Conference on Geotechnical and Geophysical Site Characterisation (ISC’3), Taipei, Taiwan, 1–4 April 2008. [Google Scholar]
- Cai, G.; Liu, S.; Puppala, A.J. Comparison of CPT charts for soil classification using PCPT data: Example from clay deposits in Jiangsu Province, China. Eng. Geol. 2011, 121, 89–96. [Google Scholar] [CrossRef]
- Robertson, P.K. Soil behavior type from the CPT: An updata. In Proceedings of the 2nd International Symposium on Cone penetration Testing, Huntington Beach, CA, USA, 9–11 May 2010. [Google Scholar]
- Jianmin, Z.; Hongxian, S.; Yonggang, J.; Hongjun, L.; Guohui, X. Experimental study on non-uniform consolidation of soil using fast-deposited seafloor in the Yellow River and estuary under wave tide. Rock Soil Mech. 2007, 7, 88–94. [Google Scholar] [CrossRef]
- Hongxian, S.; Jianmin, Z.; Yonggang, J.; Hongjun, L.; Guohui, X. Study on the Consolidation Process of Rapidly Deposited Seabed Soil in the Yellow River Estuary. Chin. J. Rock Mech. Eng. 2006, 25, 1676. [Google Scholar] [CrossRef]
- Xiaohua, W.; Hongjun, L.; Yonggang, J. Study on Mineral Composition Characteristics of Silty Soil in the Yellow River Estuary and Its Response to Hydrodynamic Conditions. Mar. Geol. Lett. 2004, 5, 34–39. [Google Scholar]
- Yonggang, J.; Hongxian, S.; Xiujuan, Y.; Xiangmei, M.; Fangqiang, C.; Jiewen, Z. Sediment Dynamics and Geologic Hazards in the Estuary of Yellow River, China; Science Press: Beijing, China, 2011. [Google Scholar]
- Xiaoying, C.; Shenliang, C.; Yongsheng, L. Characteristics and regularity of sediments in the coastal area of the Yellow River Delta. In Proceedings of the 9th National Symposium on Estuary and Coast, Xiamen, China, 6–9 September 2006. [Google Scholar]
- Ganju, E.; Prezzi, M.; Salgado, R. Algorithm for generation of stratigraphic profiles using cone penetration test data. Comput. Geotech. 2017, 90, 73–84. [Google Scholar] [CrossRef]
- Vanmarcke, E.H. Probabilistic Modeling of Soil Profiles. J. Geotech. Eng. Div. 1977, 103, 1227–1246. [Google Scholar] [CrossRef]
- Bombasaro, E.; Kasper, T. Evaluation of spatial soil variability in the Pearl River Estuary using CPTU data. Soils Found. 2016, 56, 496–505. [Google Scholar] [CrossRef]
- Salgado, R.; Ganju, E.; Prezzi, M. Site variability analysis using cone penetration test data. Comput. Geotech. 2019, 105, 37–50. [Google Scholar] [CrossRef]
- Jaksa, M.B.; Kaggwa, W.S.; Brooker, P.I. Experimental evaluation of the scale of fluctuation of a stiff clay. In Proceedings of the 8th International Conference on the Application of Statistics and Probability, Sydney, Australia, 12–15 December 1999. [Google Scholar]
- Ping, Y.; Naishuang, B.; Xiao, W.; Yong, Z.; Houjie, W. Spatial Distribution of Surface Sediments in the Modern Yellow River Delta. Mar. Geol. Quat. Geol. 2016, 36, 49–55. [Google Scholar]
- Liangyong, Z.; Jian, L.; Xiqing, L. Geo Cloud. 2003. Available online: http://geocloud.cgs.gov.cn/#/portal/geologicalDatabase/DetailsPage?child_id=v_cpgl_dzt_33302020520183866214&tableCode=v_cpgl_dzt&jddm=333 (accessed on 2 March 2021).
- Jianmin, Z. Super-Consolidation Characteristics of Sediments in Modern Yellow River Delta and Their Genesis; Ocean University of China: Qingdao, China, 2006. [Google Scholar]
- Guohui, X.; Ruifang, C.; Anlong, L.; Guanghai, H. Experimental study on the behavioral changes of sticky silty bed under wave action. Adv. Mar. Sci. 2020, 18, 19–26. [Google Scholar]
- Xiujuan, Y.; Yonggang, J.; Jie, L. Analysis of engineering geological characteristics of sediments in the Yellow River Delta. Yellow River 2010, 32, 201–202. [Google Scholar]


| Specifications | Parameters |
|---|---|
| Water depth of working | 100 m |
| Probe parameters | Φ36 mm |
| Sampling tube parameters | Φ75 mm/Φ110 mm (drive pipe) |
| Penetration rate | 1.2 m/min |
| Penetration force | 2.5 t |
| Hydraulic pressure | 10 MPa (Penetration)/12 MPa (Extraction) |
| Cone tip resistance range | 50 Mpa |
| Side friction force | 1 Mpa |
| Cone tip cross-sectional area | 10 cm2 |
| Sample diameter | 75 mm |
| Sampling depth | 5 m |
| SBT Zone Robertson et al. (1986) | Proposed Common SBT Description |
|---|---|
| 1 | Sensitive fine-grained |
| 2 | Clay—organic soil |
| 3 | Clays: clay to silty clay |
| 4 & 5 | Silt mixtures: clayey silt & silty clay |
| 6 & 7 | Sand mixtures: silty sand to sandy silt |
| 8 | Sands: clean sands to silty sands |
| 9 & 10 | Dense sand to gravelly sand |
| 12 | Stiff sand to clayey sand |
| 11 | Stiff fine-grained |
| Station | S1 | S2 | S3 | S4 | S5 | S6 | S7 | S8 | S9 | S10 |
|---|---|---|---|---|---|---|---|---|---|---|
| SNC (%) | 4 | 9 | 34 | 15 | 13 | 22 | 3 | 11 | 89 | 85 |
| Soil Group | Soil Types |
|---|---|
| Sand | Gravelly sand to sand (very loose to very silty sand) |
| Clean sand to silty sand (very loose to very dense) | |
| Clay | Organic clay |
| Sensitive fine grained | |
| Mixed soil | Silty sand to sand silty |
| Clayey silty to silty clay | |
| Clay to silty clay |
| Station | S1 | S2 | S3 | S4 | S5 | S6 | S7 | S8 | S9 | S10 |
|---|---|---|---|---|---|---|---|---|---|---|
| VVIlog (%) | 82 | 94 | 96 | 99 | 79 | 98 | 99 | 83 | 77 | 46 |
| Station | S1 | S2 | S3 | S4 | S5 | S6 | S7 | S8 | S9 | S10 |
|---|---|---|---|---|---|---|---|---|---|---|
| VVIqc (%) | 58 | 66 | 29 | 48 | 10 | 33 | 42 | 3 | 6 | 3 |
| Station | S1 | S2 | S3 | S4 | S5 | S6 | S7 | S8 | S9 | S10 |
|---|---|---|---|---|---|---|---|---|---|---|
| VVI (%) | 52 | 60 | 43 | 52 | 10 | 24 | 46 | 21 | 37 | 28 |
| Station | S1 | S2 | S3 | S4 | S5 | S6 | S7 | S8 | S9 | S10 |
|---|---|---|---|---|---|---|---|---|---|---|
| HVI | 44 | 45 | 38 | 59 | 56 | 66 | 45 | 43 | 42 | 35 |
Publisher’s Note: MDPI stays neutral with regard to jurisdictional claims in published maps and institutional affiliations. |
© 2021 by the authors. Licensee MDPI, Basel, Switzerland. This article is an open access article distributed under the terms and conditions of the Creative Commons Attribution (CC BY) license (https://creativecommons.org/licenses/by/4.0/).
Share and Cite
Yang, Z.; Liu, X.; Guo, L.; Cui, Y.; Su, X.; Ling, X. Soil Classification and Site Variability Analysis Based on CPT—A Case Study in the Yellow River Subaquatic Delta, China. J. Mar. Sci. Eng. 2021, 9, 431. https://doi.org/10.3390/jmse9040431
Yang Z, Liu X, Guo L, Cui Y, Su X, Ling X. Soil Classification and Site Variability Analysis Based on CPT—A Case Study in the Yellow River Subaquatic Delta, China. Journal of Marine Science and Engineering. 2021; 9(4):431. https://doi.org/10.3390/jmse9040431
Chicago/Turabian StyleYang, Zhongnian, Xuesen Liu, Lei Guo, Yuxue Cui, Xiuting Su, and Xianzhang Ling. 2021. "Soil Classification and Site Variability Analysis Based on CPT—A Case Study in the Yellow River Subaquatic Delta, China" Journal of Marine Science and Engineering 9, no. 4: 431. https://doi.org/10.3390/jmse9040431