1. Introduction
Global warming due to emissions of greenhouse gases (GHG) is increasing the need to move towards a low carbon economy. In parallel, energy planners need to keep satisfying a growing electricity demand which is expected to grow by 80% by 2040 [
1]. Research & Development in renewable energy sources (RES) and its commercialization and deployment in the electrical grid is one of the partial solutions to the problems of carbon dependency in electricity production and climate change. Although wave power is seen as a considerable opportunity for clean renewable energy supply, to date, most of the wave energy technology developed still requires further research and demonstration tests to prove its reliability. As the Marine Renewable Energy (MRE) sector develops, it is important to ensure that the technology proves to be a sustainable alternative [
2].
As a form of renewable energy, wave energy sources are low-impact and contribute to a more sustainable energy supply. However, it is not environmentally friendly per se [
3]. since energy is consumed and pollutants are emitted during the construction, operation and decommissioning of the energy converters. Holistic analyses with an energy trilemma perspective—economics, security of supply and environmental impacts—have been widely employed to assess potential benefits. However, to date, most studies provide only a qualitative analysis of the potential environmental impacts. There is little qualitative evidence to support decision makers. In particular, questions over whether these new technologies will deliver a net reduction in GHG emissions lead to the need for the use of a life cycle based approach, in order to assess all the emissions and energy consumption of a device [
4]. The life cycle assessment (LCA) methodology is an established technique for the identification and evaluation of the inputs, outputs and potential environmental impacts of products and services [
5]. It has been widely recognized as an efficient methodology to assess clean energy technologies’ environmental performance over their life cycle.
The development of the LCA on wave energy technologies is critical to overcome the current limitations and seize several advantages in the sector by identifying the most critical stages of the life cycle of a system. Besides being useful for technology developers when deciding on the best design option for a certain device, it provides quantitative evidence to support decision making amongst potential investors, energy and government authorities before investing or commissioning a project [
6]. Furthermore, its quantitative nature fosters the comparison of environmental impacts associated with alternative energy generation systems [
7].
Knowledge of the potential direct and indirect environmental impacts generated by marine renewable energy projects due to materials, processes and energy required is still scarce. Based on this, the application of the LCA methodology produces metrics and indicators such as embodied carbon and energy and energy and carbon payback times accounting for the whole life cycle of the project. To date, LCA methodology has been performed on very few wave and tidal energy converters [
4,
6,
8,
9,
10] with a focus on the assessment of GHG emissions as the most significant contributor to climate change and hence adopted as an indicator to evaluate the environmental performance of renewable energies.
The current study presents a preliminary LCA of the MegaRoller wave energy converter, aiming to support decision making regarding the least carbon and energy intensive design choices. It will help identifying the most important life cycle stages of the device regarding respective environmental impacts and a scenario analysis will support the identification of alternatives with the least impact considering all life cycle stages. Results will then be compared with other marine renewable technology and traditional means of electricity generation with the aim of identifying the benefits of using wave energy in comparison with other technologies. In the broader picture, this study contributes to a recent but rising number of existing LCA studies on the wave energy sector.
Life Cycle Assessment Methodology
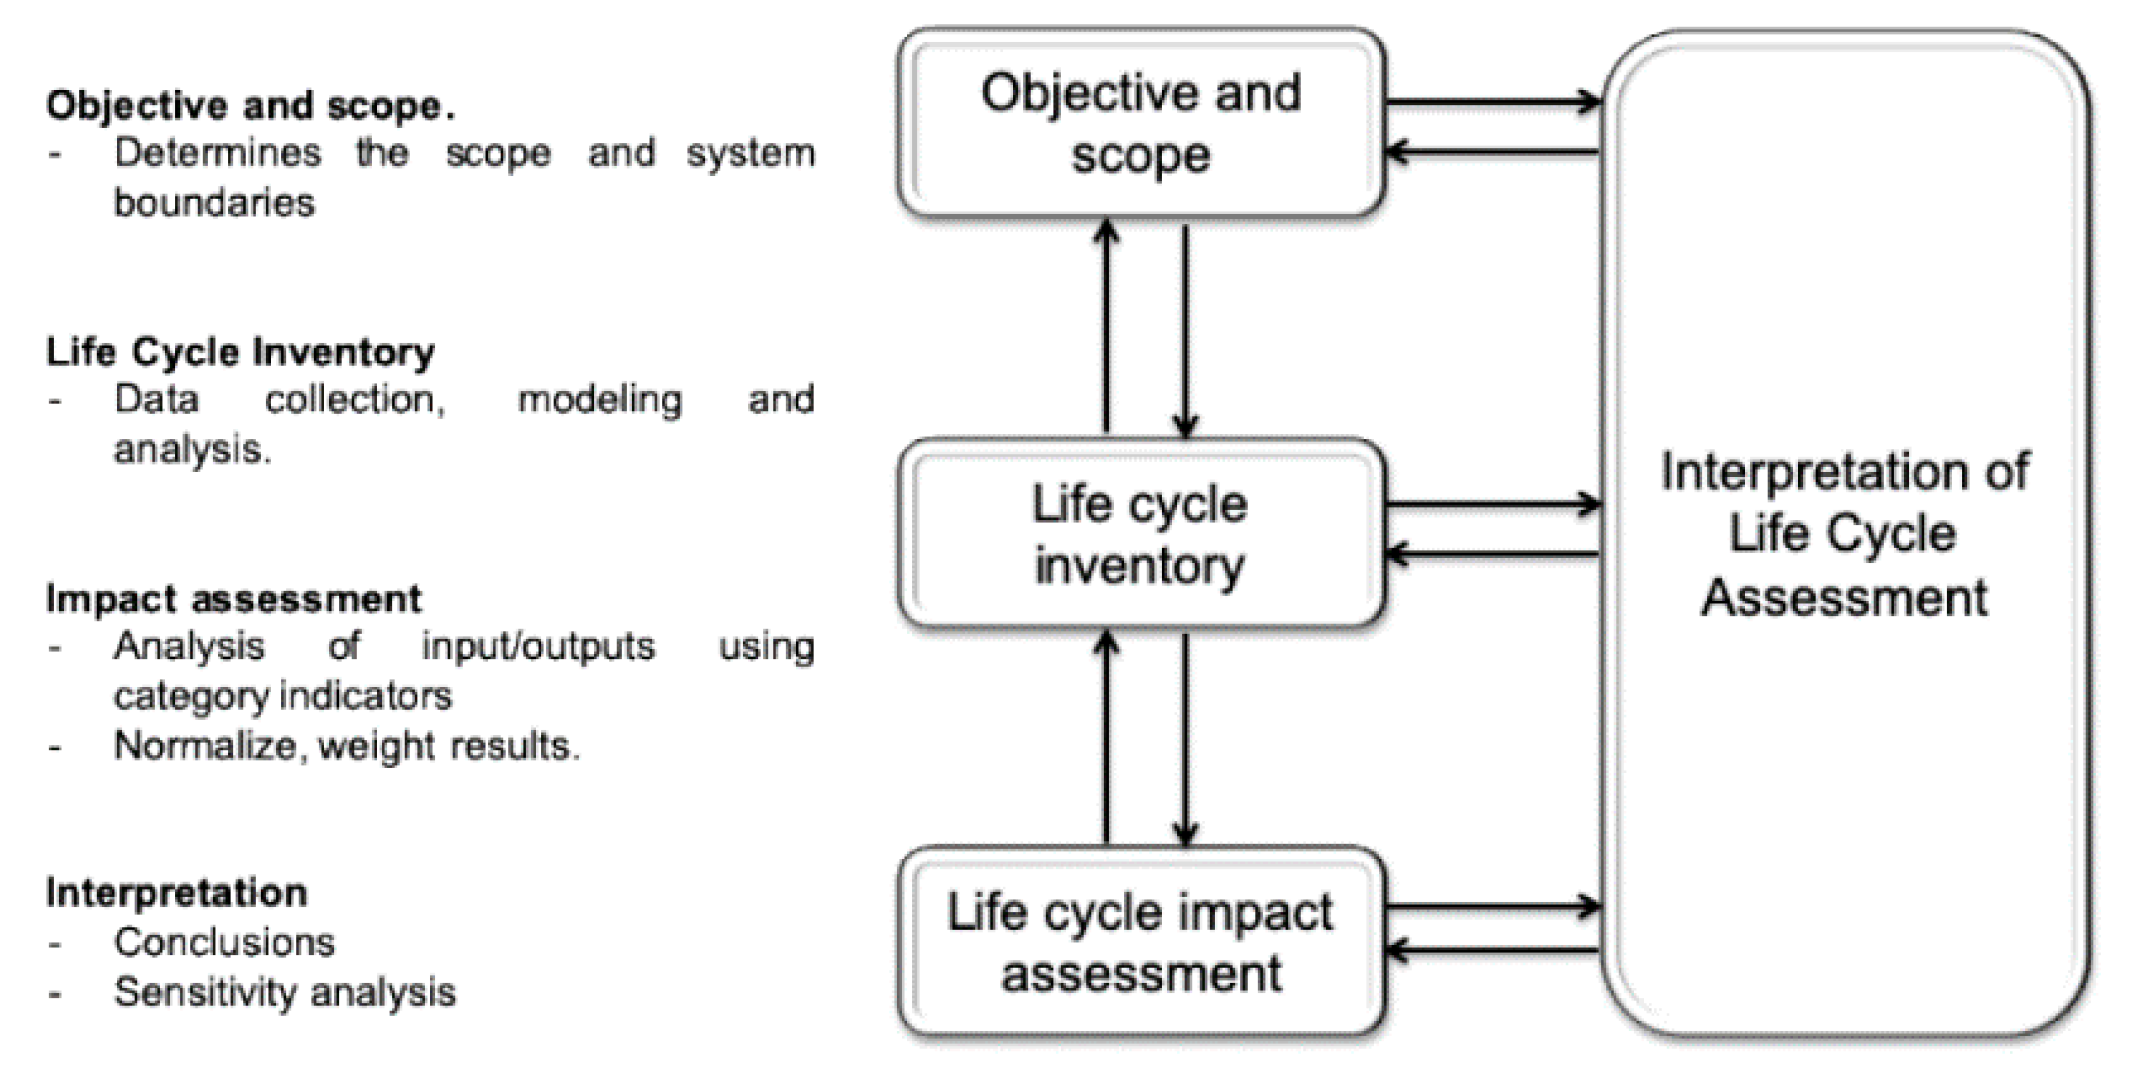
Life Cycle Assessment (LCA) has been recognized as an efficient tool to quantitatively assess the cumulative environmental impacts of a product or service throughout its life cycle by encompassing all materials, energy, emissions and waste products associated with all stages from raw material extractions to disposal and end-of-life. This methodology is regulated by the International Standards Organization (ISO): ISO 14040:2006 [
5] and ISO 14044:2006 [
11], which suggest the principles, framework, requirements and guidelines for conducting this type of assessment. It is a comprehensive stepwise method which consists of four interrelated stages: goal and scope definition; life cycle inventory (LCI) analysis; life cycle impact assessment (LCIA) and interpretation (
Figure 1).
2. Methods
2.1. System Description—The MegaRoller Device
The MegaRoller concept is based on the existing design implemented and commercialized as WaveRoller, an oscillating wave surge converter (OWSC). This class of wave power technology uses bottom-hinged plates oscillating in pitch following the surge movement of the water particles in the nearshore zone (10–25 m water depth) and is designed to absorb wave energy through horizontal motion of the prime mover. The wave surge moves the device’s panel which is installed at approximately 8–20 m of depth, approximately 400 m from shore. The device is anchored to the seabed and depending on tidal conditions it is mostly or fully submerged. A set of key parameters established within the MegaRoller project for the preliminary device design and relevant for the present LCA analysis is summarized in
Table 1.
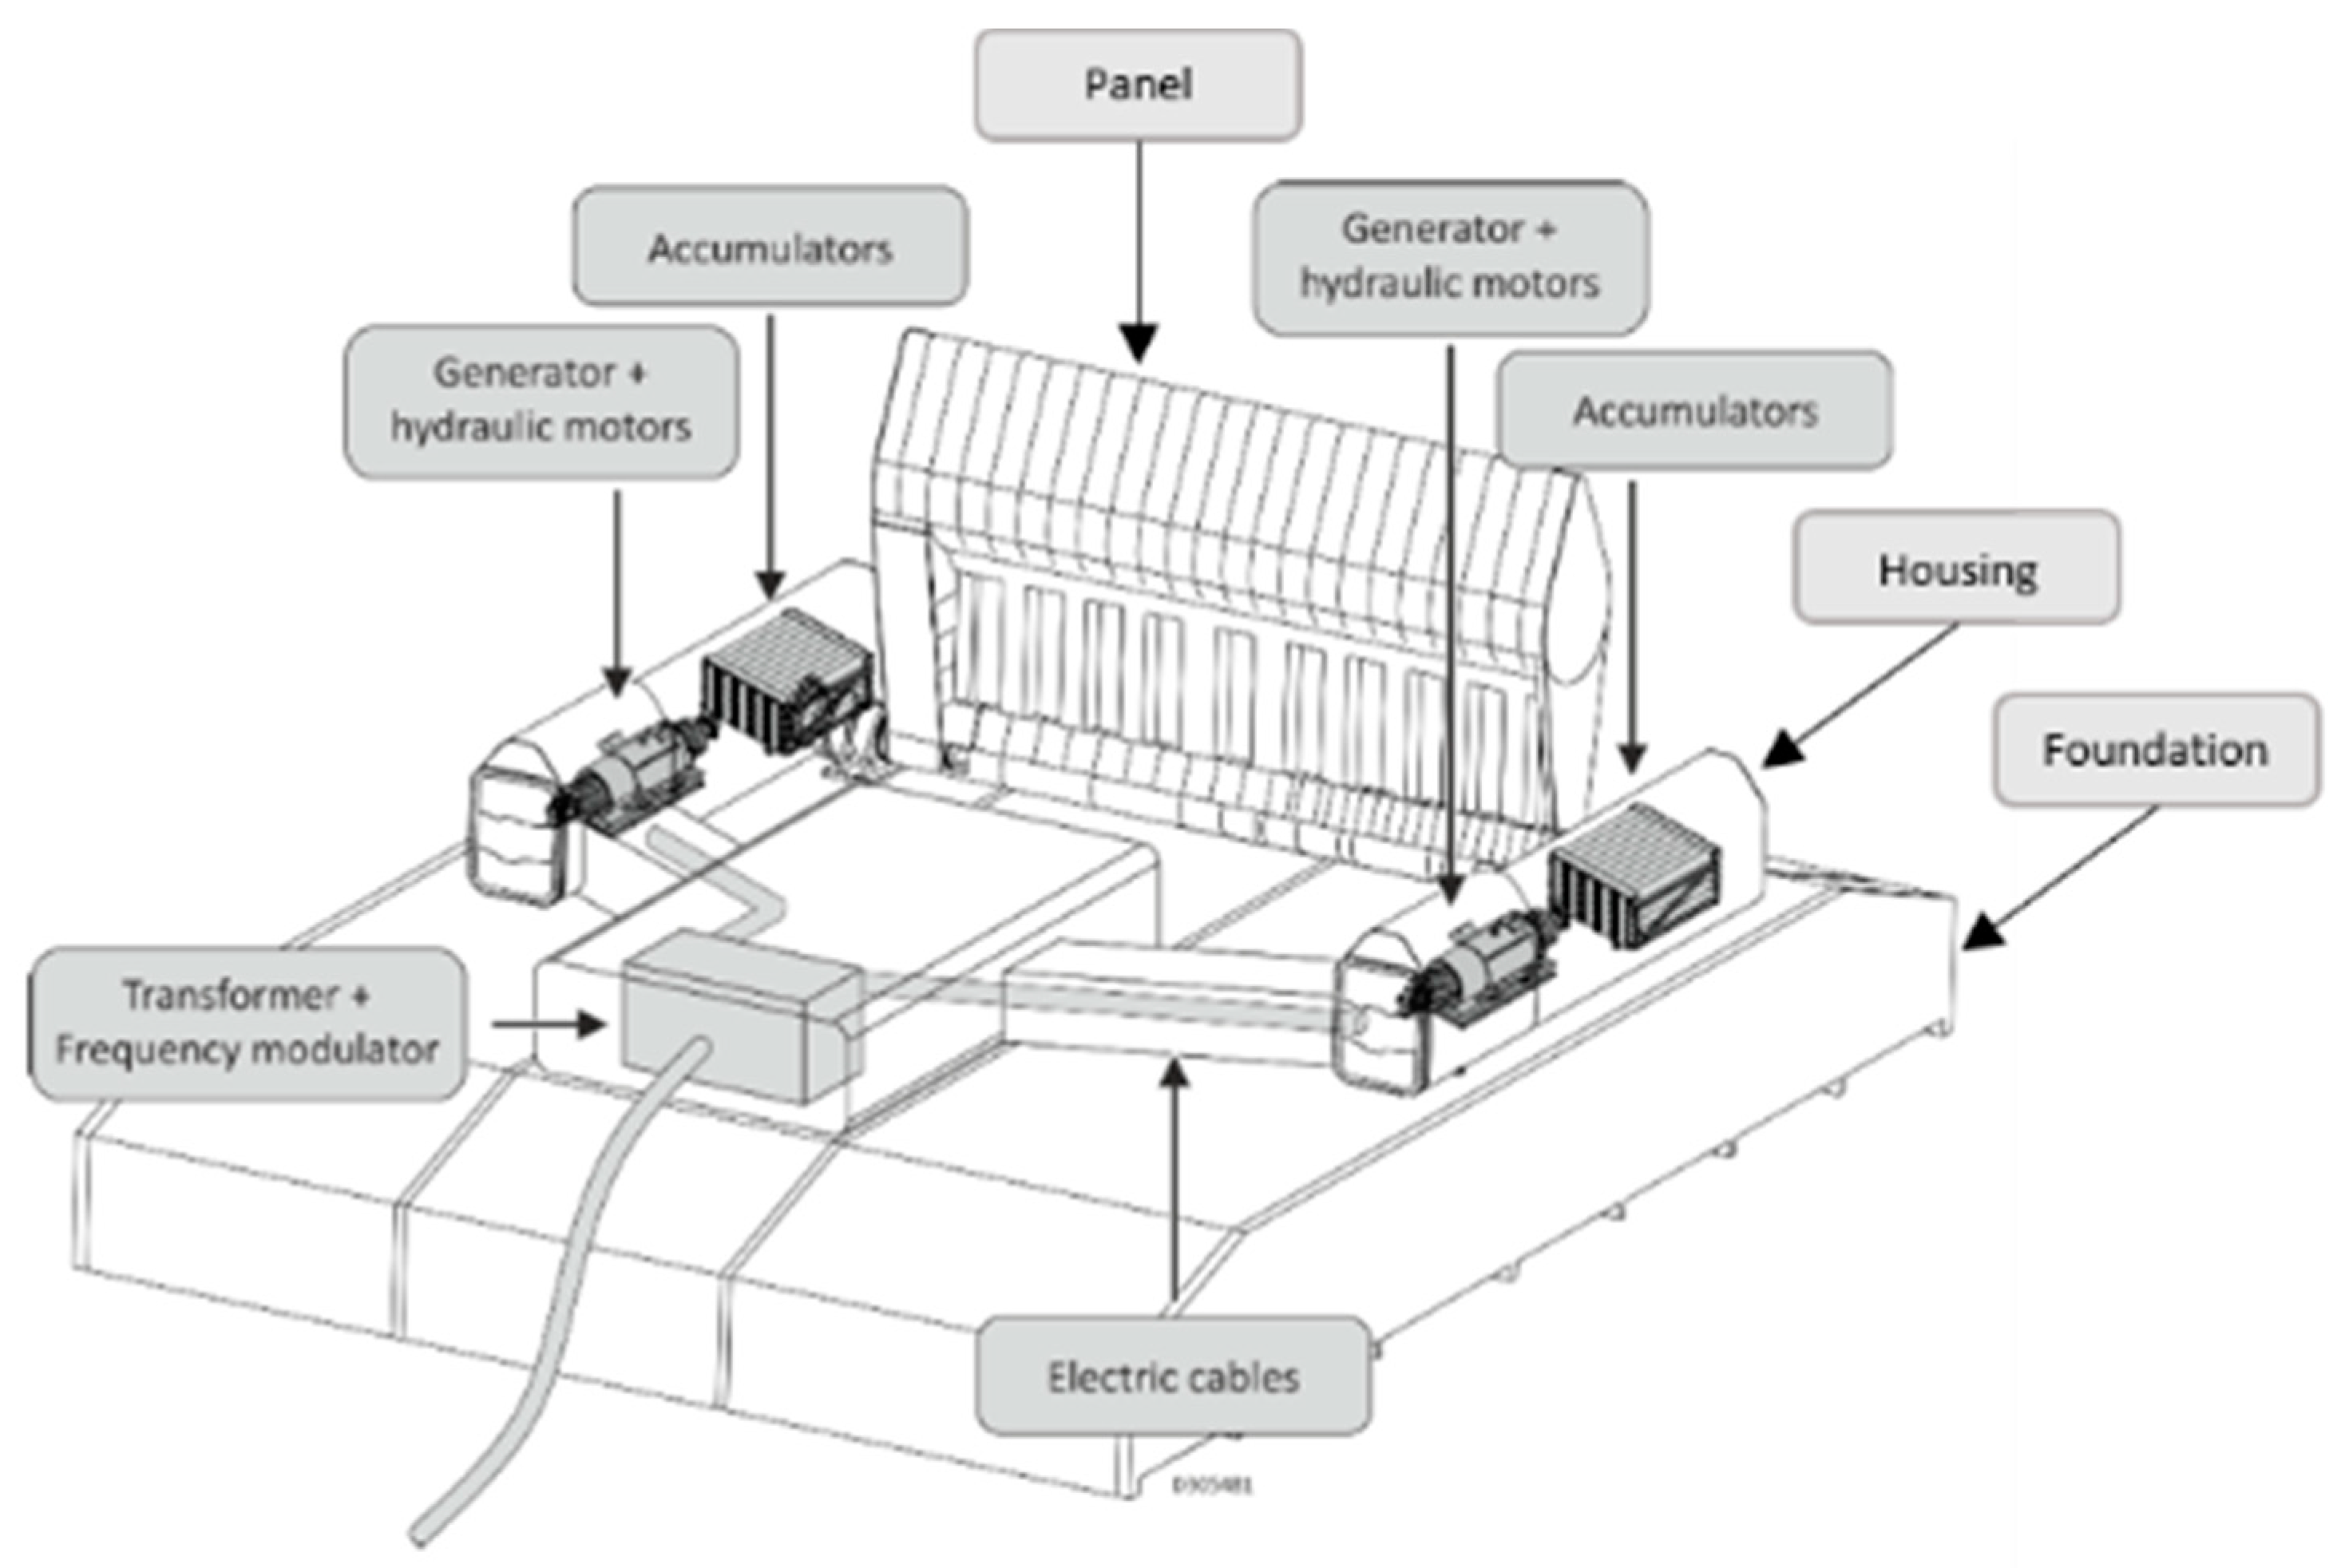
The wave energy converted into motion by the panel is transmitted through a drivetrain to the power take-off (PTO). The PTO is the core component that converts wave-induced oscillations from mechanical energy to electricity. It consists of two-cylinder units and one standardized power unit. As the panel moves back-and-forth, the PTO’s hydraulic pistons pump hydraulic fluids inside a closed hydraulic circuit inside a hermetic structure. These cylinders are composed of single action pistons, one cylinder acting when the panel moves towards the coast, and another when the movement has the opposite direction. These high-pressure fluids are fed into a hydraulic motor that drives an electricity generator. The cylinders are sealed in a watertight compartment and are not exposed to the marine environment. The cylinders use the mechanical power applied to the pistons to compress the hydraulic fluid and store it in the accumulators. The accumulators help to attenuate the variation of the power produced, caused by the irregular profile of the incident waves. The energy stored in the accumulators is transferred through pressurized hydraulic flow to a hydraulic motor, followed by an electric generator that converts it into electrical energy. The electrical output is then connected to the electric grid via a subsea cable [
12].
The MegaRoller project aims at developing the PTO of the first MW-level OWSC generation, with a nominal capacity of 1 MW. The focus of the project is to design, build and validate a generic high performance, cost-efficient and reliable PTO that can be integrated into OWSC designs and therefore globally deployed in the energy sector.
Figure 2 shows the main components of the MegaRoller device excluding the mooring system.
2.2. Goal and Scope
The goal of the LCA is to assess the environmental impacts of the early design phase of the MegaRoller device. The functional unit (FU) used is 1 kWh of electricity delivered to the Portuguese electricity network by a 1 MW wave energy device with a reference flow of 1 MegaRoller device, as recommended by The International EPD System [
13]. A single device is estimated to produce an average of 2.65 GWh/year over its 20-year lifespan. The LCA was conducted according to the International Reference Life Cycle Data (ILCD) System Handbook for LCA [
14].
2.3. System Boundaries
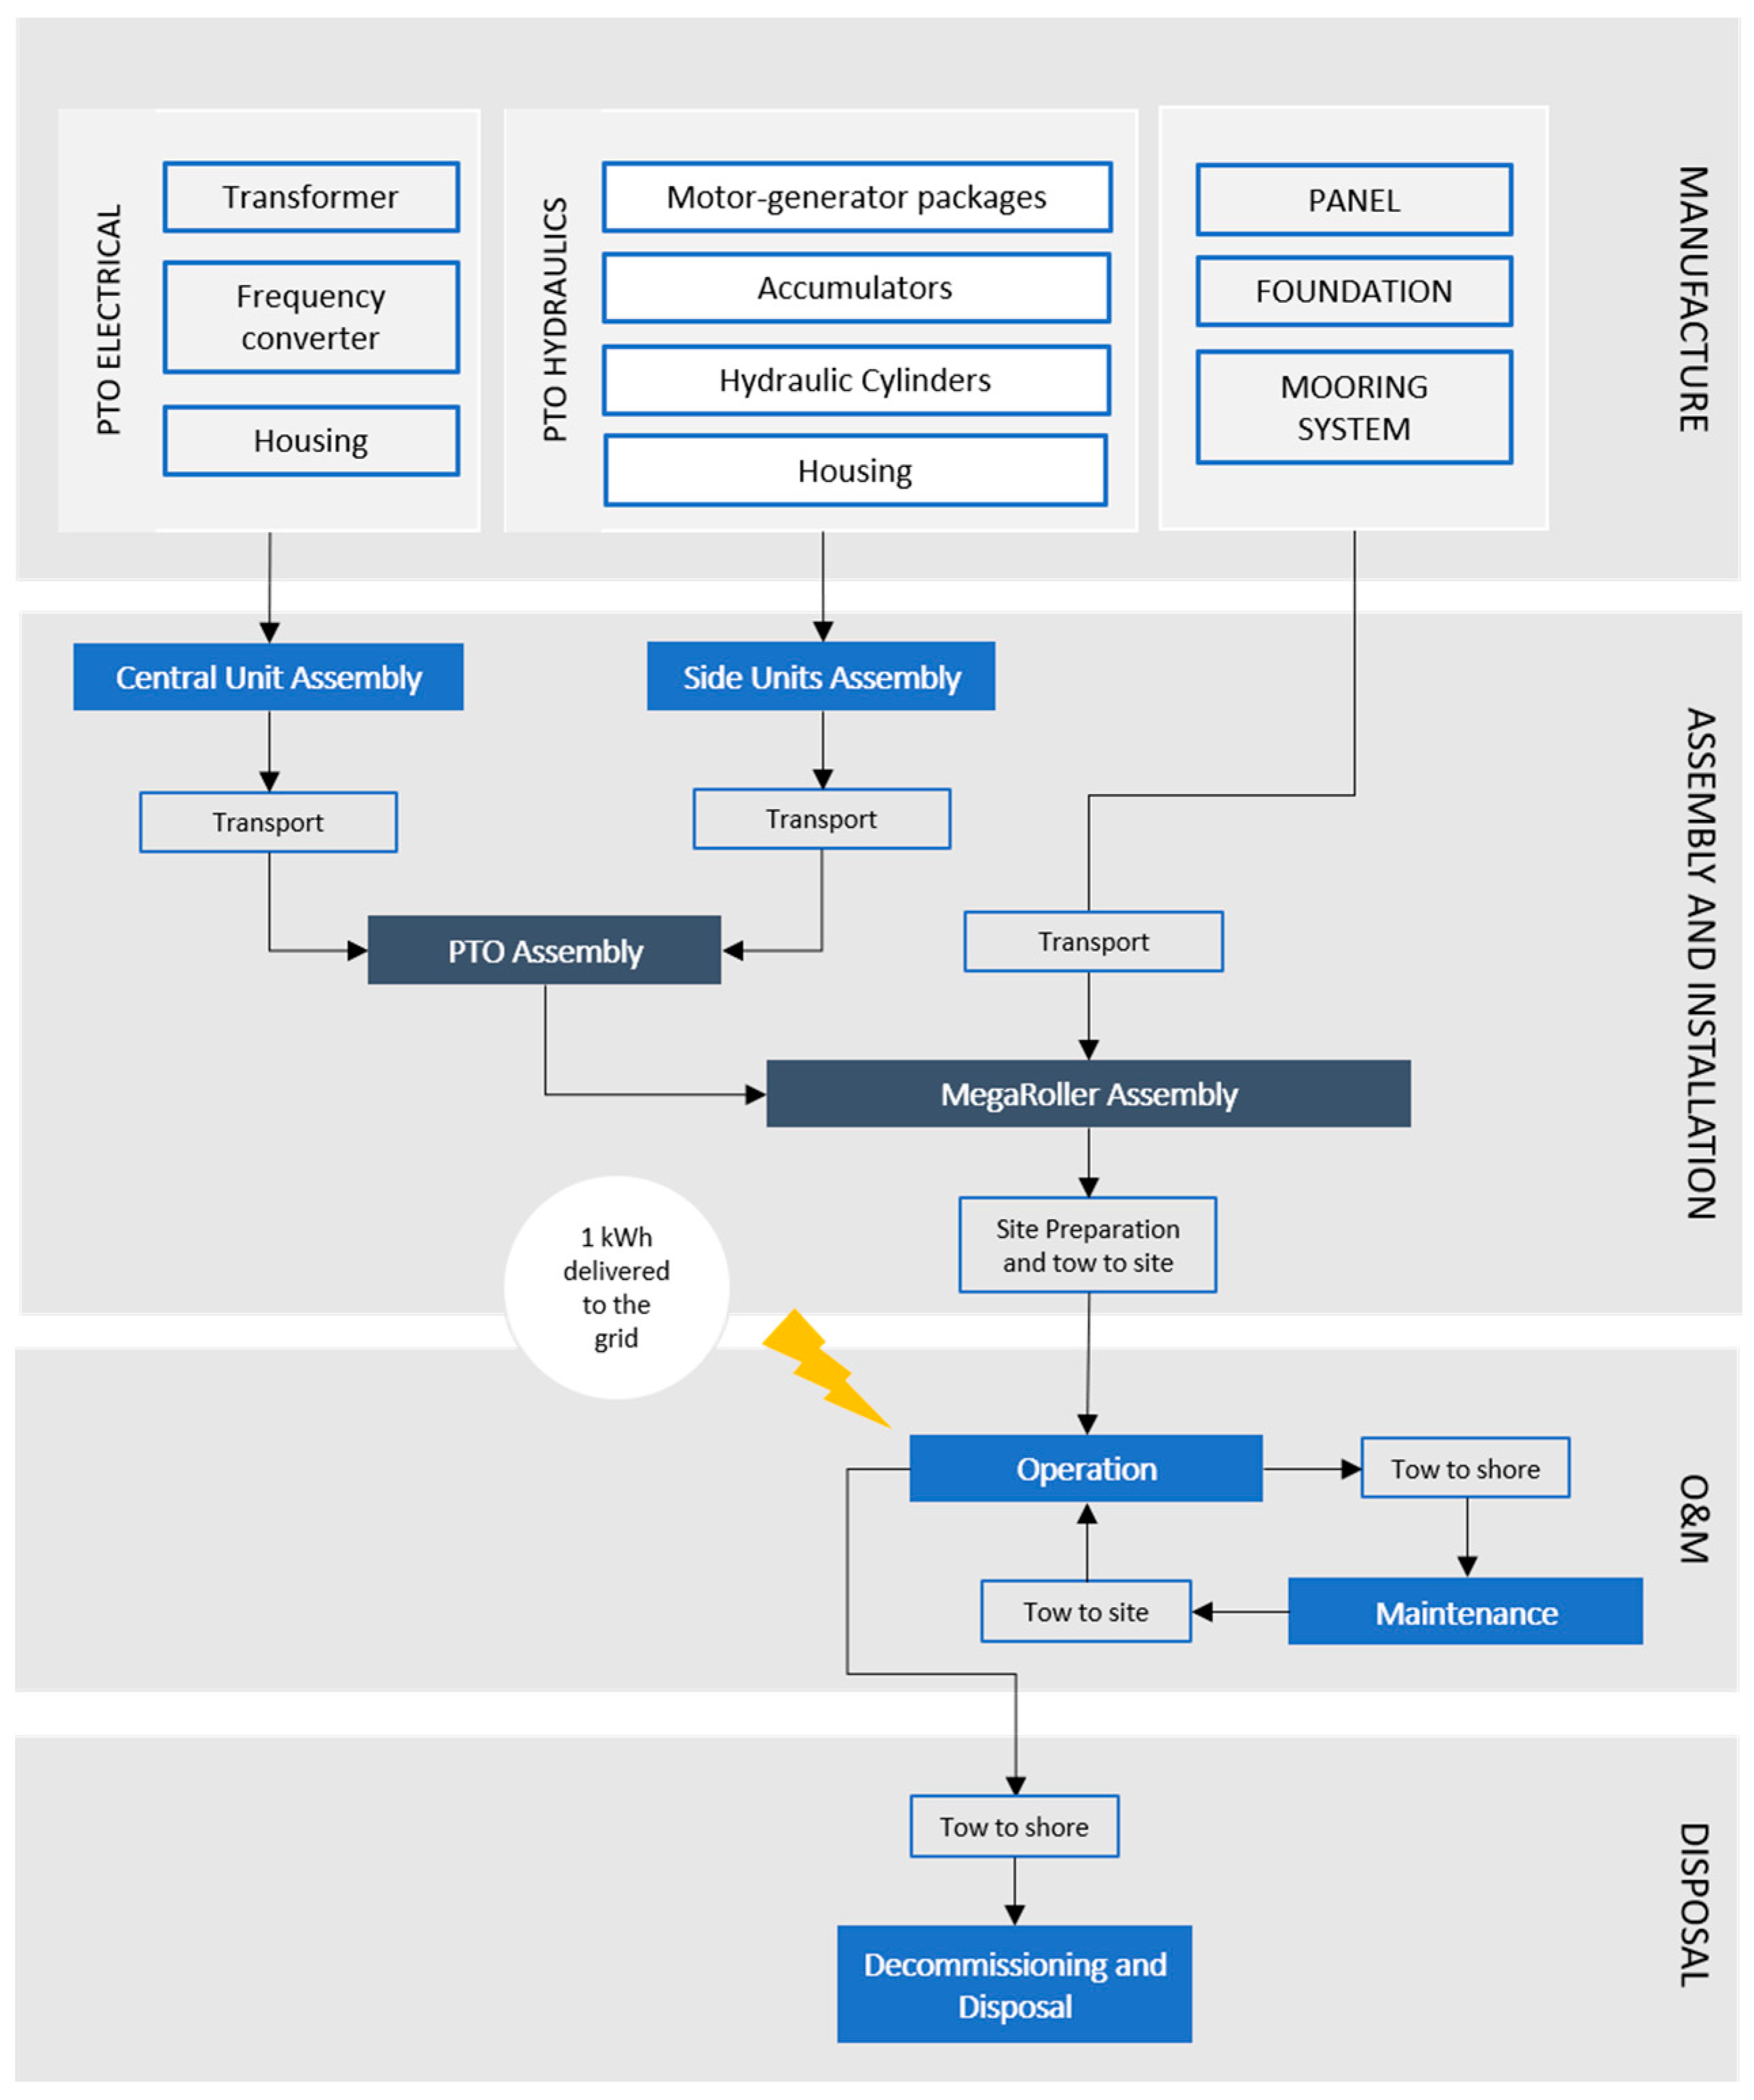
The system boundary encompasses all life cycle stages from “cradle-to-grave” as recommended by [
15], taking into consideration the production of each component part, their assembly and transport to the installation site, deployment and O&M, as well as the process of decommissioning and disposal, as illustrated in
Figure 3. The PTO manufacture comprises electrical subcomponents (transformer, frequency converter and housing) which are located in the device’s central unit and hydraulic subcomponents (motor-generator packages, accumulators, hydraulic cylinders and housing) which are to be located in the side units. Apart from the PTO itself, the analysis also covers the panel, foundation and mooring system. The subsea cable connection to the grid as well as the substation and all parts of the onshore electricity network are outside the scope of this analysis. The central and side units’ assembly is followed by the PTO subassembly. This is followed by the final MegaRoller assembly of the PTO with the panel, foundation and mooring system and deployment. The O&M stage follows throughout the project lifetime after which the device is towed to shore and decommissioned. All life cycle stages are detailed as part of the Life Cycle Inventory (
Section 2.5).
Since this is a descriptive study aiming at understanding the impact of a product and comparing it with other products with the same functional unit, the modelling principle for the Life Cycle Inventory (LCI) followed an attributional LCA approach [
14].
The LCA will reflect a wave power device to be built in the near future. Regarding the geographical boundaries, the device will be placed off the coast of Portugal, in Praia da Almagreira, Peniche. Manufacture is assumed to take place in Finland and Portugal, and the final assembly is assumed to take place in a fabrication yard in Estaleiros Navais de Peniche (ENP) followed by the device’s installation. All data regarding extraction of raw materials, semi-finished products, and components reflect the geographical region where the processes are assumed to take place. To allow comparison with other marine renewable technology and traditional means of electricity generation, carbon dioxide equivalent emissions per produced electricity (g CO2 eq/kWh) was the main unit defined for the study. This measure accounts for all six Kyoto GHG emissions: carbon dioxide (CO2), methane (CH4), nitrous oxide (N2O), Hydrofluorocarbons (HFC’s), Perfluorocarbons (PFCs) and Sulphur Hexafluoride (SF6).
2.4. Tools and Impact Assessment Methods
SimaPro v8.5.2 was the LCA software used to model the system, with LCI data sourced from the Ecoinvent database (version 3.4). SimaPro is a tool used to collect, analyze and monitor the sustainability performance data of products and services. The software can be used for several applications, e.g., sustainability reporting, carbon and water foot printing, product design, generating environmental product declarations and determining key performance indicators. Ecoinvent is the LCI database containing over 16.000 unique datasets covering a wide array of products, services and processes, from building materials to food and from resource extraction to waste management.
The Life Cycle Impact Assessment (LCIA) was carried out with the ReCiPe 2016 Midpoint method [
16], one of the most widely used midpoint impact assessment methods. Although all impact categories were analyzed, climate change was the main target since the results are easier to communicate due to the current political focus on the field and because it was proved adequate for the identification overall hotspots [
17]. In addition, an energy input assessment was carried out using Cumulative Energy Demand (CED) method to calculate the total direct and indirect amount of energy consumed throughout the life cycle [
18].
2.5. Life Cycle Inventory
2.5.1. Data Collection
Foreground or primary data were collected from the project design team, material experts and engineers. All background or secondary data were ultimately derived from the Ecoinvent database. Since the Ecoinvent database does not contain all inventory information, assumptions and approximations (explained in this section) were made for some manufacture processes according to the energy consumed using data sourced elsewhere and new materials were created based on previous studies. Most data in this database reflects average European conditions. One exception is electricity production, for which data is provided by country. This means that, for manufacturing processes assumed to take place e.g., in Finland, the electricity mix used was changed to Finish electricity mix. For processes taking place in an unknown (European or global) location, the average European (code RER) or global (code GLO) electricity mix was used.
Given the expected small contribution of some electronic and electrical systems to the overall embodied carbon and considering their complexity, a cut-off criterion of 1% was applied throughout the life cycle to exclude minor impacts and help set boundaries for the total system inventory [
19].
2.5.2. Raw Materials and Manufacture
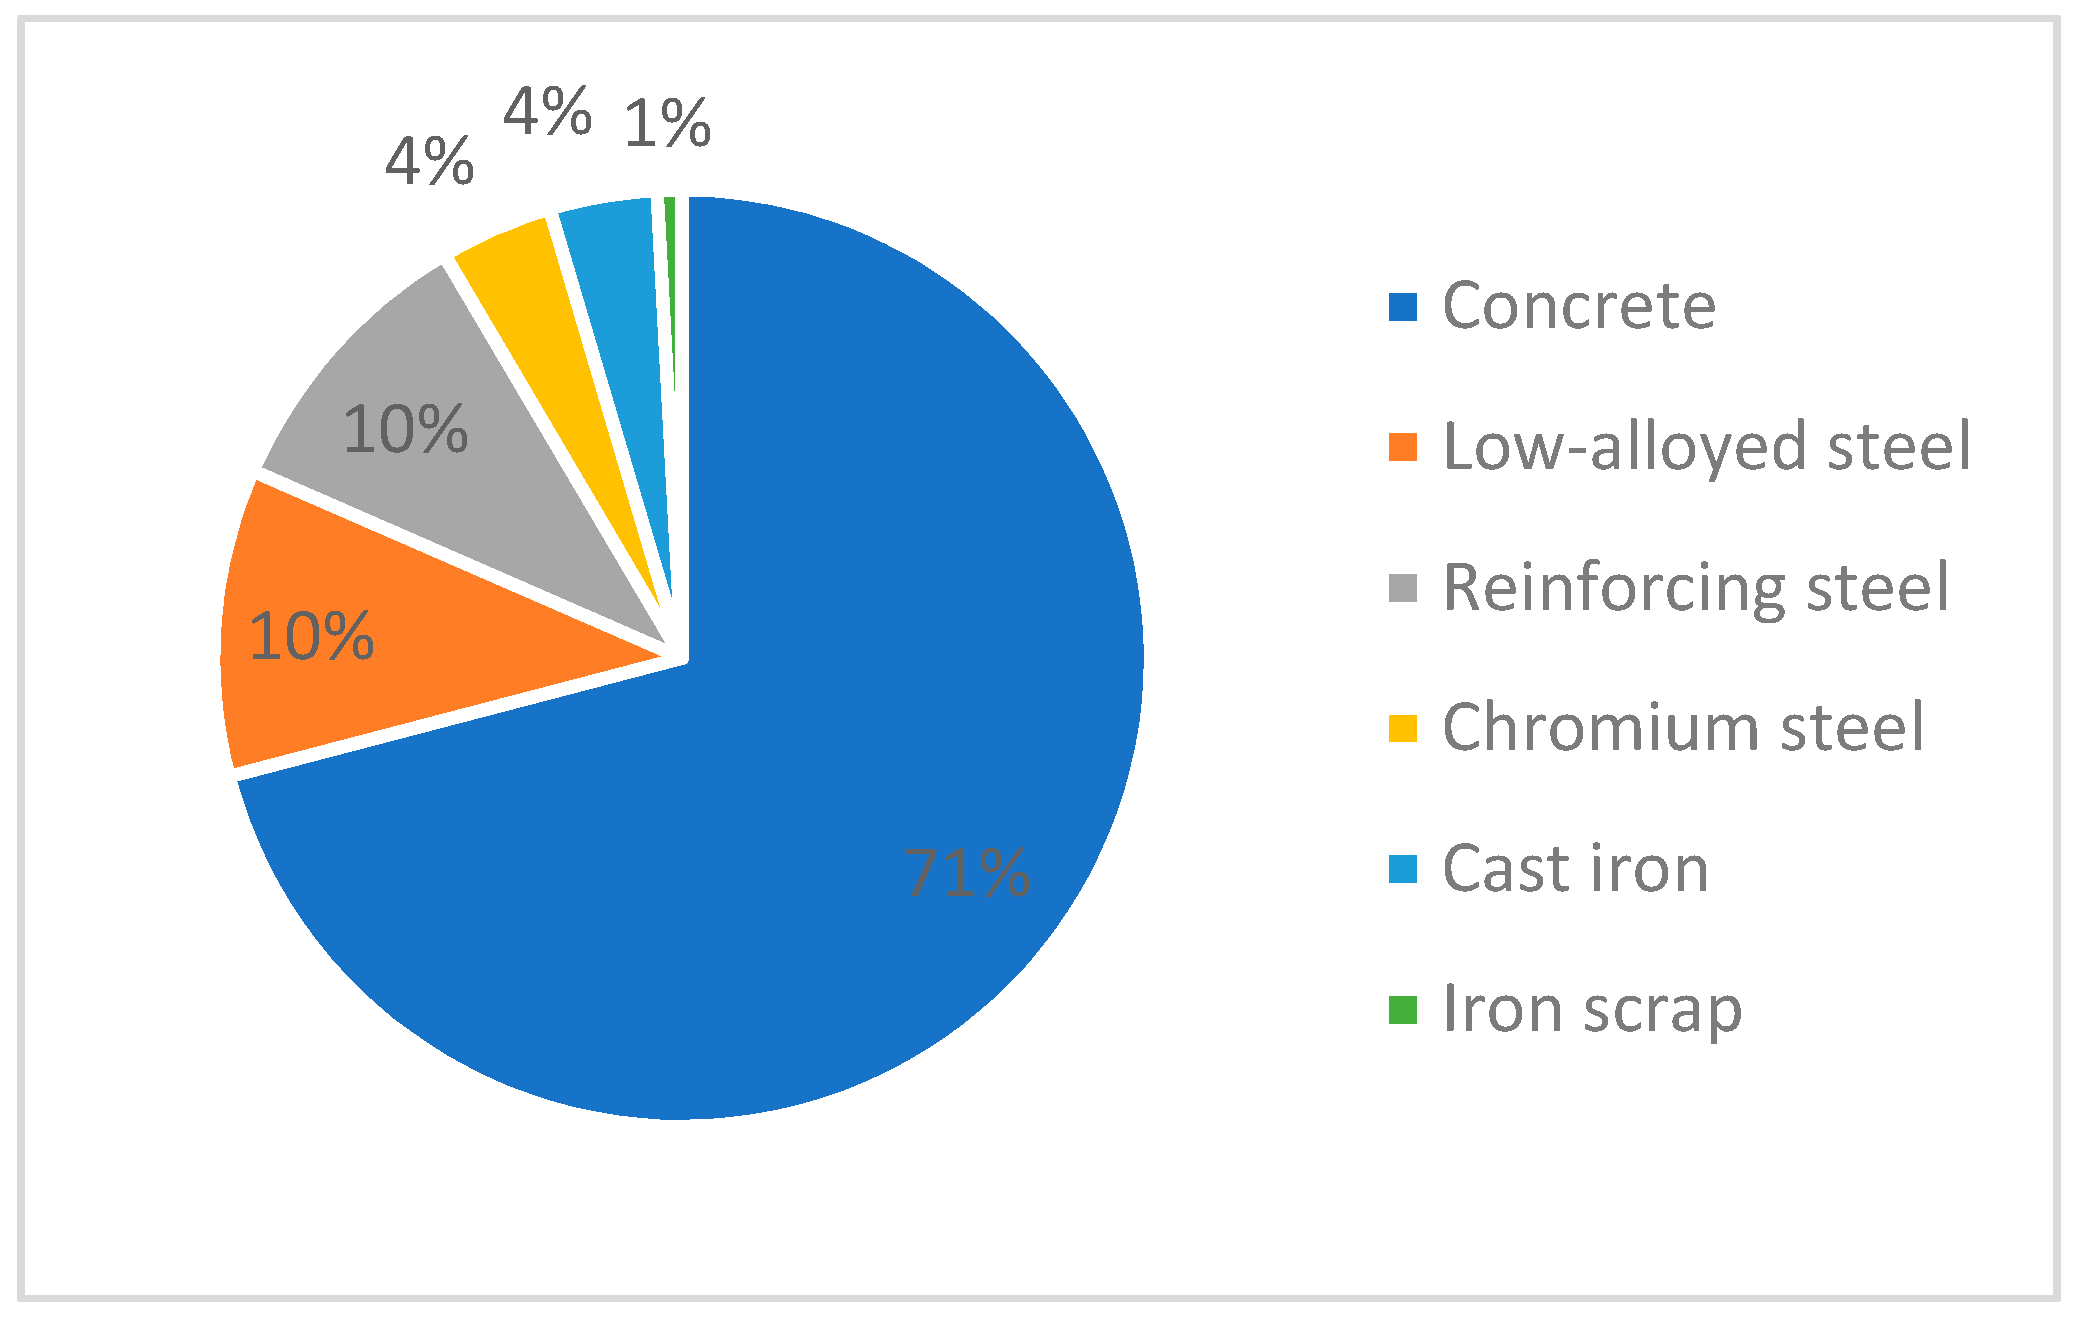
The life cycle begins with the raw material extraction and processing followed by the manufacture phase which comprises the molding and shaping of the materials to form the device sub-components. MegaRoller is largely constructed from steel and cement. Steel is cut and welded to shape before being painted with corrosion-resistant paint. A mass-based analysis was carried out for the device with a breakdown of the materials used in
Figure 4 and
Figure 5 with data provided by the manufacturer. Over 70% of the total mass of the MegaRoller is concrete.
2.5.3. Foundation
The foundation is of a gravitational type and made of reinforced concrete, weighing approximately 3215 tons, according to the technology developer data. The structure is manufactured in ENP, through processes of molding, steel reinforcing, placing and curing of concrete. Since Ecoinvent doesn’t include processes of manufacture deemed appropriate, the study considered only an estimate of the energy consumption for concrete molding [
20].
2.5.4. Panel
It is estimated by the manufacturer that the panel will be a 26 × 10 m structure and 4.7 m thick at its thickest point. It will have an approximate mass of 358 tons consisting of a welded steel structure and it is assumed to be manufactured in Finland. Panel castings are assumed to be manufactured in Turkey. Final subassembly, including assembly with panel bearings, is assumed to take place in ENP. The steel plates go through processes of welding, machining and hot rolling until desired shape after which the panel is assumed to be painted with a corrosion-resistant paint. The process of painting was created based on assumptions made by [
21]. The energy consumption for the machining processes was based on [
22] assuming an average consumption of 8 MJ/kg of processed steel and 10 MJ/kg for casting iron. Calculations for the welding process were undergone assuming a need of 4.35 kg of weld steel per meter [
23].
2.5.5. Power Take-off (PTO)
The PTO is structured in two main systems: hydraulic system and electrical system. All the hydraulic components of the PTO are contained in the two side units - hydraulic cylinders, accumulators (approximately 350 in total), motors. The electrical central unit (ECU) contains only electrical components: transformer and frequency converter. The central unit is connected to the side units (hulls) via electric cables. Since the hydraulic components of the ECU are all contained in one hull, each entire hydraulic module can be manufactured, assembled, tested and delivered ready for deployment. This limits the potential environmental impact by decreasing the amount of assembly that needs to occur on the barge. Excepting the component housing and hydraulic cylinders (the latter go through manufacture processes of welding, machining, casting and hot rolling), the electrical and hydraulic system components are prefabricated and therefore their manufacture processes were excluded from the analysis. The components’ housing is painted with the same type of paint as the panel but, since no data was given for the dimensions, the process of painting was excluded from the analysis.
2.5.6. Mooring System
The mooring system is assumed to comprise 4 sets of chromium steel chains connected to a concrete anchor. The set will attach to the device to ensure that it remains where it will be installed, given the highly dynamic and energetic characteristics of this coastal area. Since two anchors are already on site, the analysis only considers the manufacture of 4 chains and 2 anchors. Each chain is assumed to have 130 m of length and weigh approximately 28.5 tons [
24]. Welding (for chains) and heavy machining (for anchors) were the processes considered. Chains are assumed to be manufactured through arc welding [
23], whose heating source is the use of an electric arc that is placed between the tip of a covered electrode and the desired surface of the metal being weld [
25].
2.5.7. Raw Materials and Manufacture
The assembly involves the transport of each subcomponent to the fabrication yard for final device assembly before the installation (
Table 2). Foundation was not included since it is manufactured in the harbor. The ‘tkm’ is the functional unit for transport and represents the transport of 1000 kg goods over 1 km. Estimates for distances were made based on the location between ENP and the main port in each case. The PTO’s subassembly is assumed to take place in Finland with the final device assembly taking place in ENP (Portugal).
A 60-tonne overhead crane and fork-lift trucks are needed for final assembly. A 60-tonne overhead crane was assumed to work for 4.7 h consuming 18 kWh from the Portuguese grid. A typical fork-lift truck is estimated to consume 2.55 L/hr [
26]. After final assembly, specialist sea vessels are required to install moorings, prepare the seabed, tow and install the device. The device is towed for about 16 km from the harbor to the installation site. The overall estimated duration of the installation stage is 12 h. According to the manufacturer data, two tugboats will be required to tow the device for 4 h and to stand-by during deployment for another 8 h which accounts for a total diesel consumption of 8800 L.
2.5.8. Operation and Maintenance
Maintenance activities will be essentially onsite by activating the buoyancy system, requiring an inspection vessel for small interventions (
Table 3). It was assumed 1.3 days of sea vessel operations per year and a fuel consumption of 500 L/day (21). According to previous studies on the WaveRoller, major maintenance is assumed to be undergone every 5 years and these are expected to take place in the ENP. The system is lifted back to the surface by pumping air into the chambers. Then the MegaRoller is towed to the harbor. This results in an estimation of 3 days of operations, including tow to shore and redeployment, over the device’s lifetime. It is assumed that no major part must be replaced during the 20-year lifetime which may underestimate impacts from this stage.
2.5.9. Decommissioning and Disposal
Decommissioning the MegaRoller will require the use of sea vessels to unlatch the technology, tow the device to the harbor of Peniche and recover some of the mooring system. Type of sea vessels and fuel consumption at this stage were assumed to be the same as in during the installation of the device as shown in
Table 3. The disposal scenario of the MegaRoller device is expected to follow two different End-of-Life (EoL) routes based on literature—recycling and landfilling (
Table 4). Following similar assumptions made in other studies for the technology, metal components are assumed to be transported to a recycling center and the concrete blocks re crushed and re-used. Following a similar methodology adopted in a previous study [
17], recycling leads to materials recovery, thus avoiding respective production from virgin sources.
3. Results
3.1. Life Cycle Impact Assessment (LCIA)
The ReCiPe and CED impact assessment methods were applied to characterize the results of the LCIA, and the environmental impacts are summarized in
Table 5. The global warming potential (GWP) was found to be 33.8 g CO
2 eq/kWh and the CED to be 432 kJ/kWh. These values rise to 75.1 g CO
2 eq/kWh and 1010 kJ/kWh if the disposal scenario is excluded, highlighting the crucial role this uncertain stage plays in the overall life cycle. Since ocean energy is being broadly considered as a technology that will contribute to a low-carbon energy system, the analysis of ReCiPe method results focuses on the global warming potential (GWP). Nevertheless, an overview of all 18 impacts is presented.
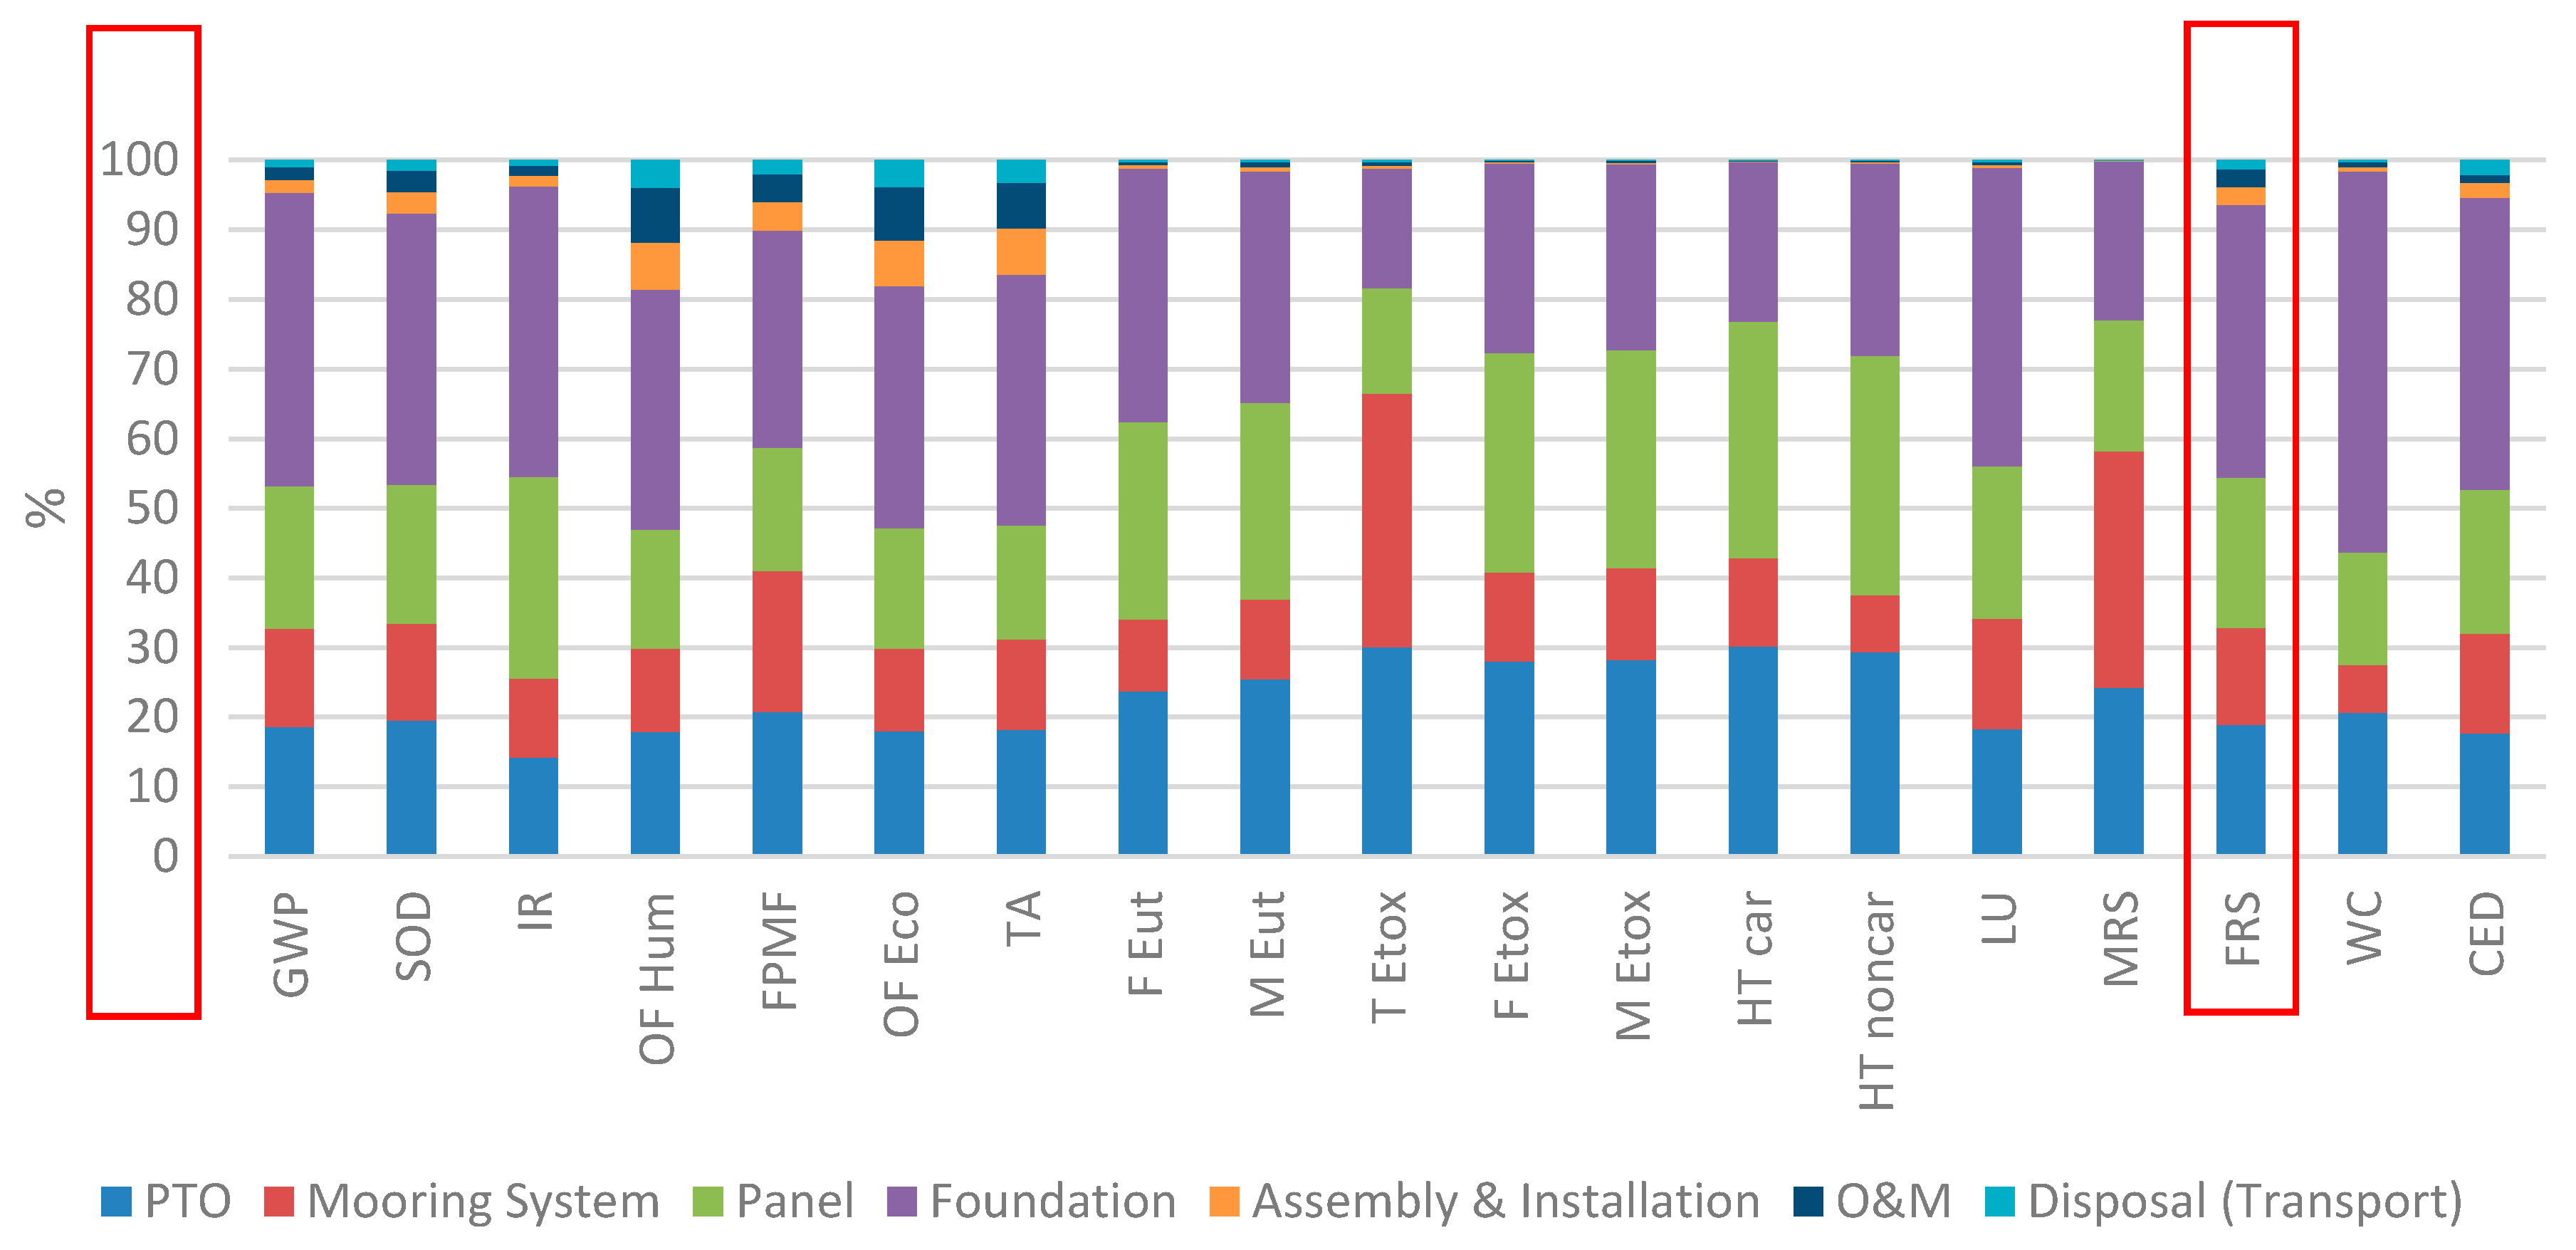
Figure 6 illustrates the contribution of the life cycle stages to each impact category. The manufacture of each individual subcomponent is displayed separately. Transport of the subcomponents to the harbor for final assembly as well as the transport of the device to the installation site are included in the Assembly & Installation. For almost all impact categories, it can be observed that manufacture contributes the most environmental impacts, particularly the foundation. Freshwater and marine eutrophication and mineral resource scarcity impacts are linked mainly to the manufacture of steel. Energy consumption (due to electricity generation) has effects on categories such as human toxicity and global warming potential.
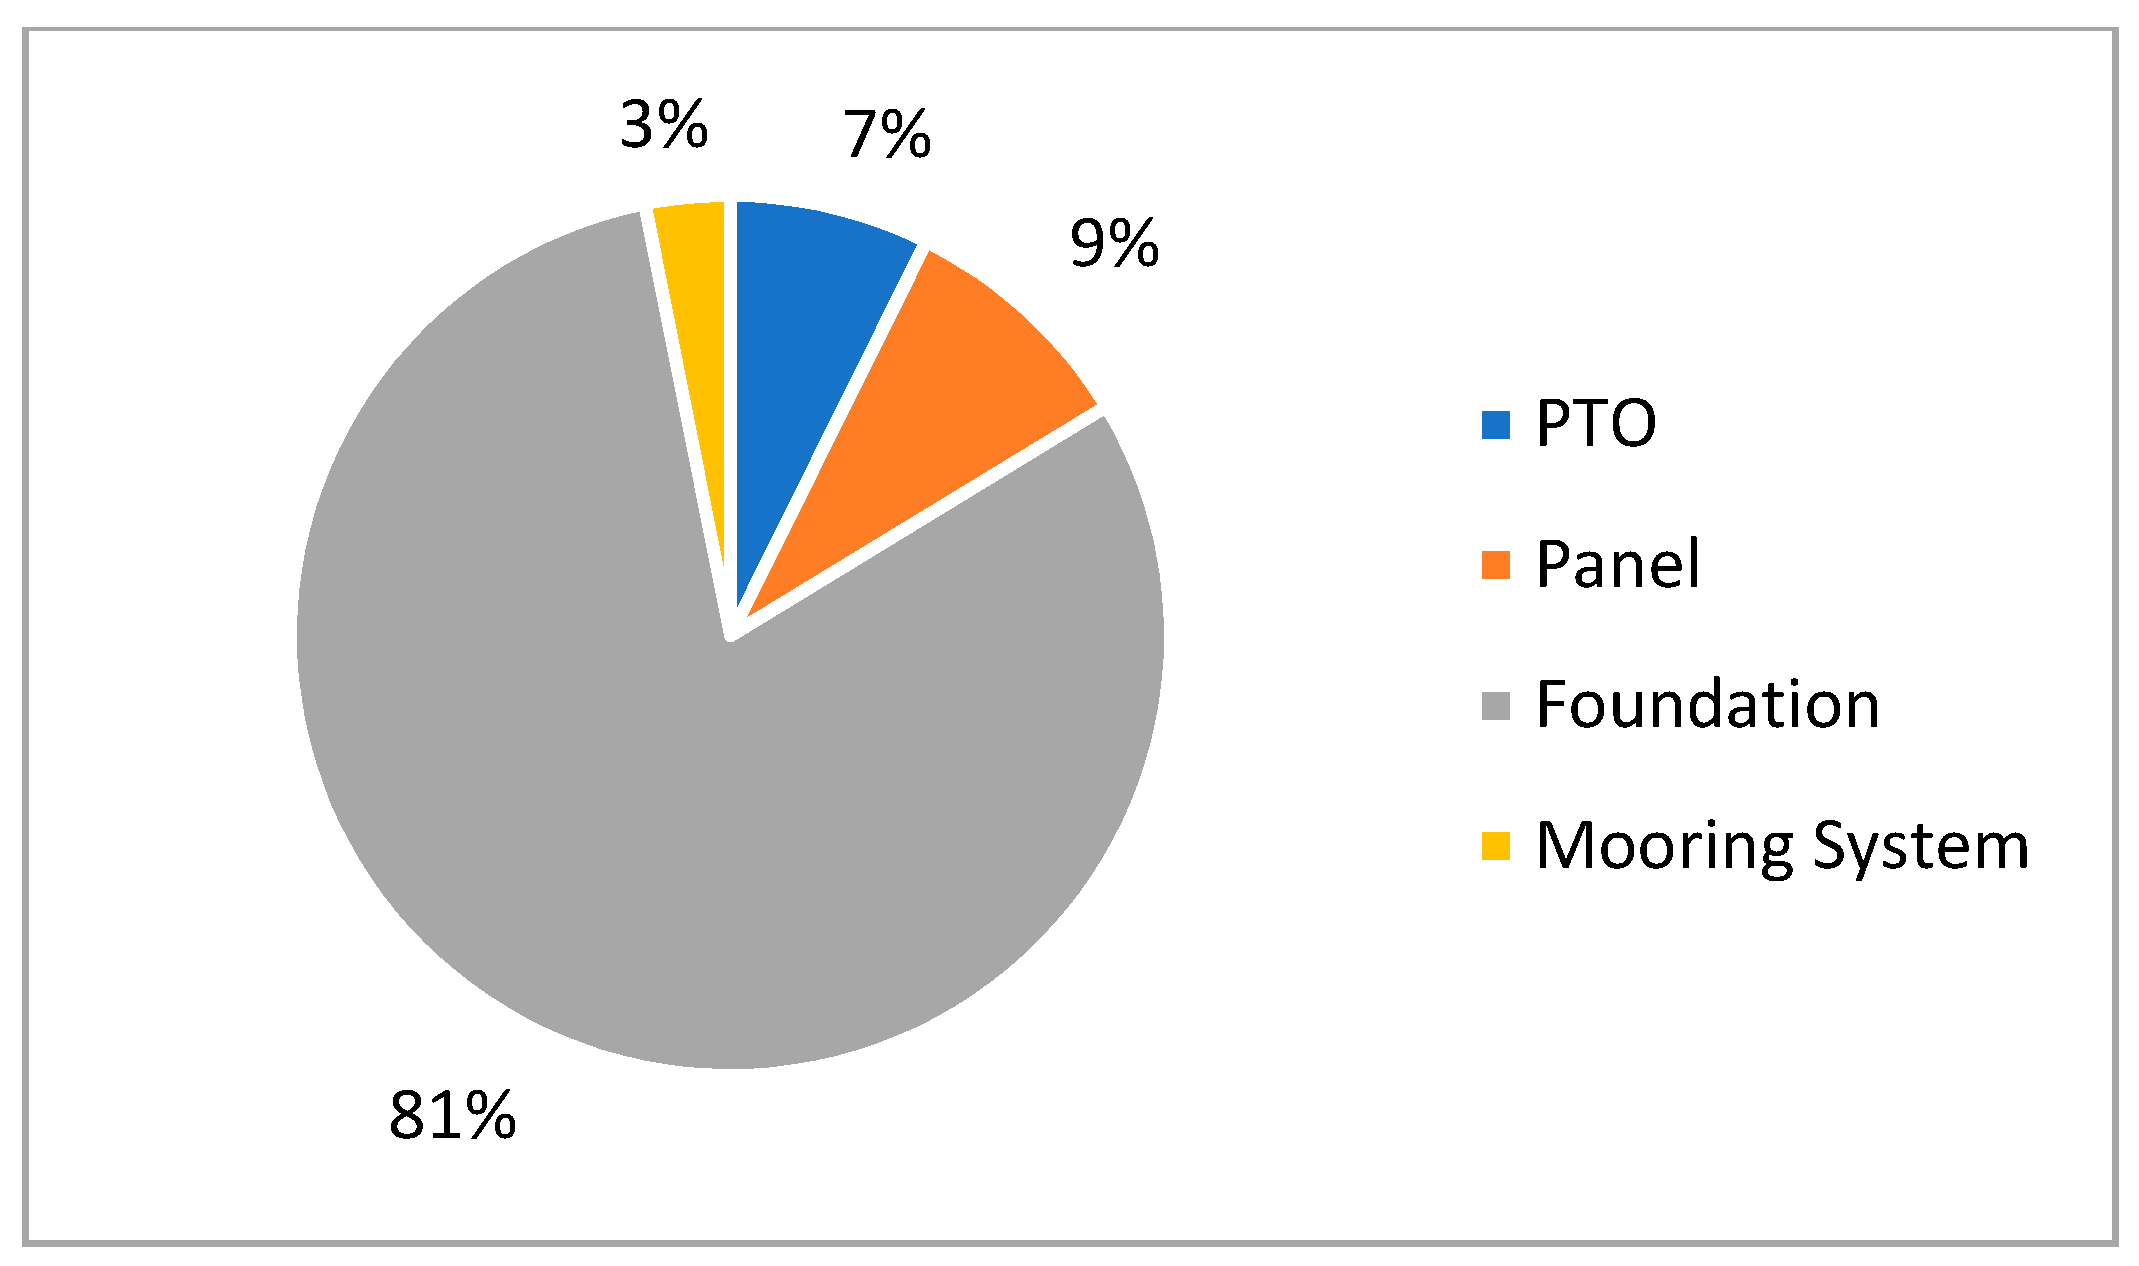
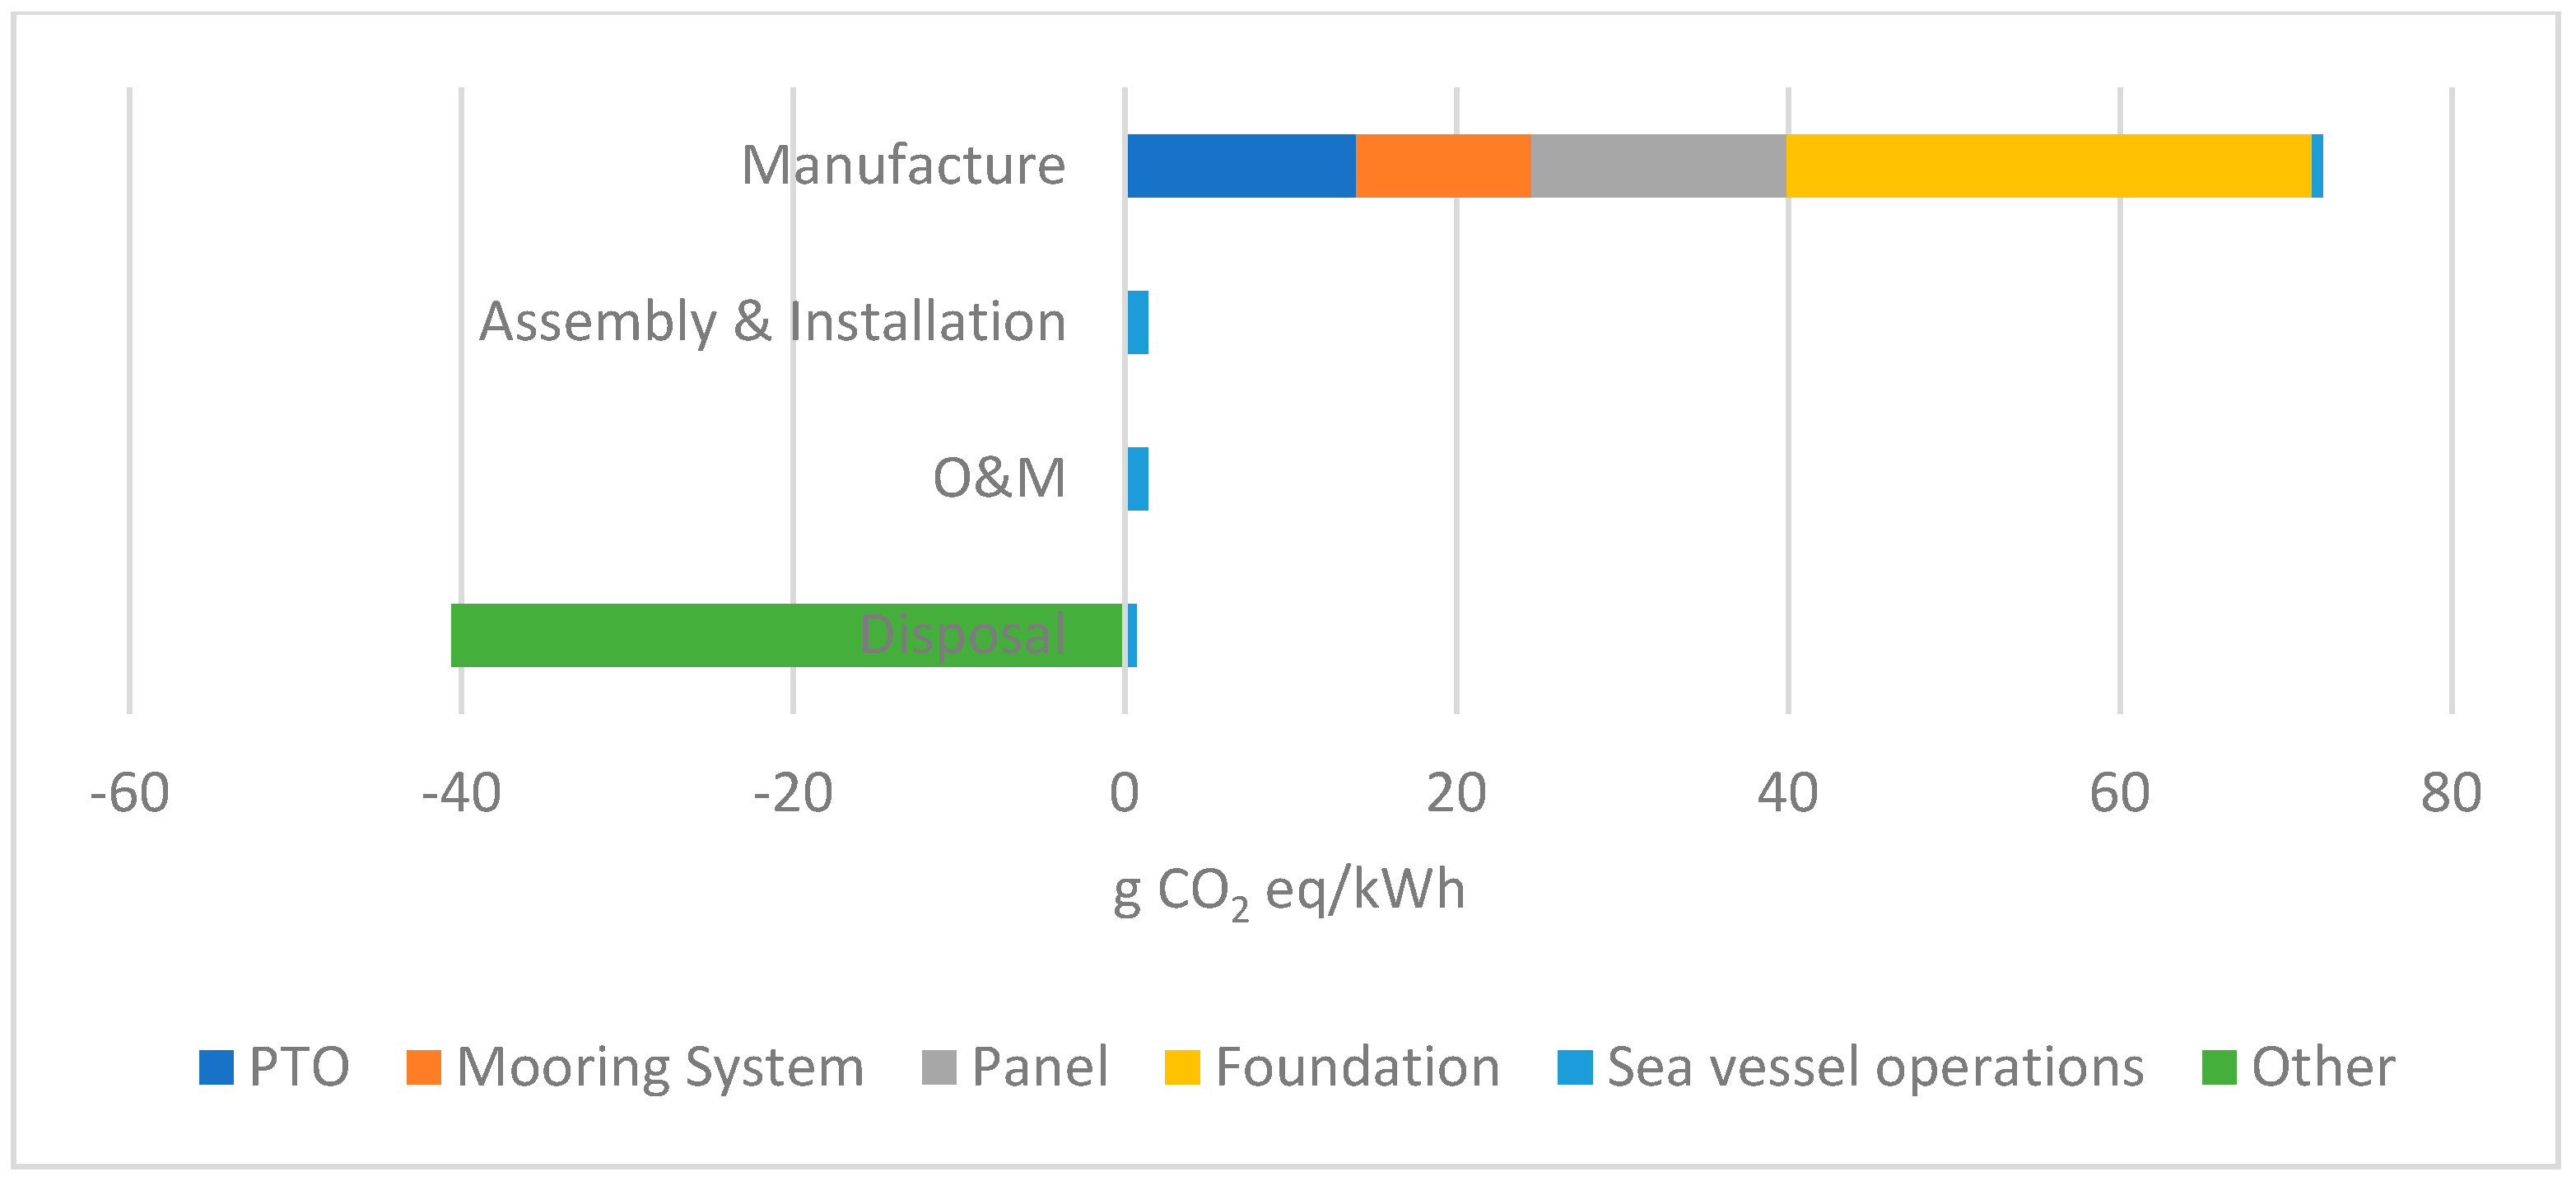
The results for the impact category GWP are shown in
Figure 7 in g CO
2 eq/kWh. Impacts related to Assembly & Installation and O&M (1.88% and 1.89%, respectively) have a small impact on the overall results whereas the manufacture stage has the biggest impact of all lice cycle stages. Transport contributes 5.3% to the overall GWP results. The manufacture of the foundation accounts for 42% (approx. 32 g CO
2 eq/kWh) of the impacts during this stage (before applying credits for recycling). These impacts are largely due to the fact that cement production is very energy-intensive, and thus contributes substantial GHG emissions. The manufacture of the PTO, mooring system and panel account for 18.6%, 14.8% and 21.5%, respectively.
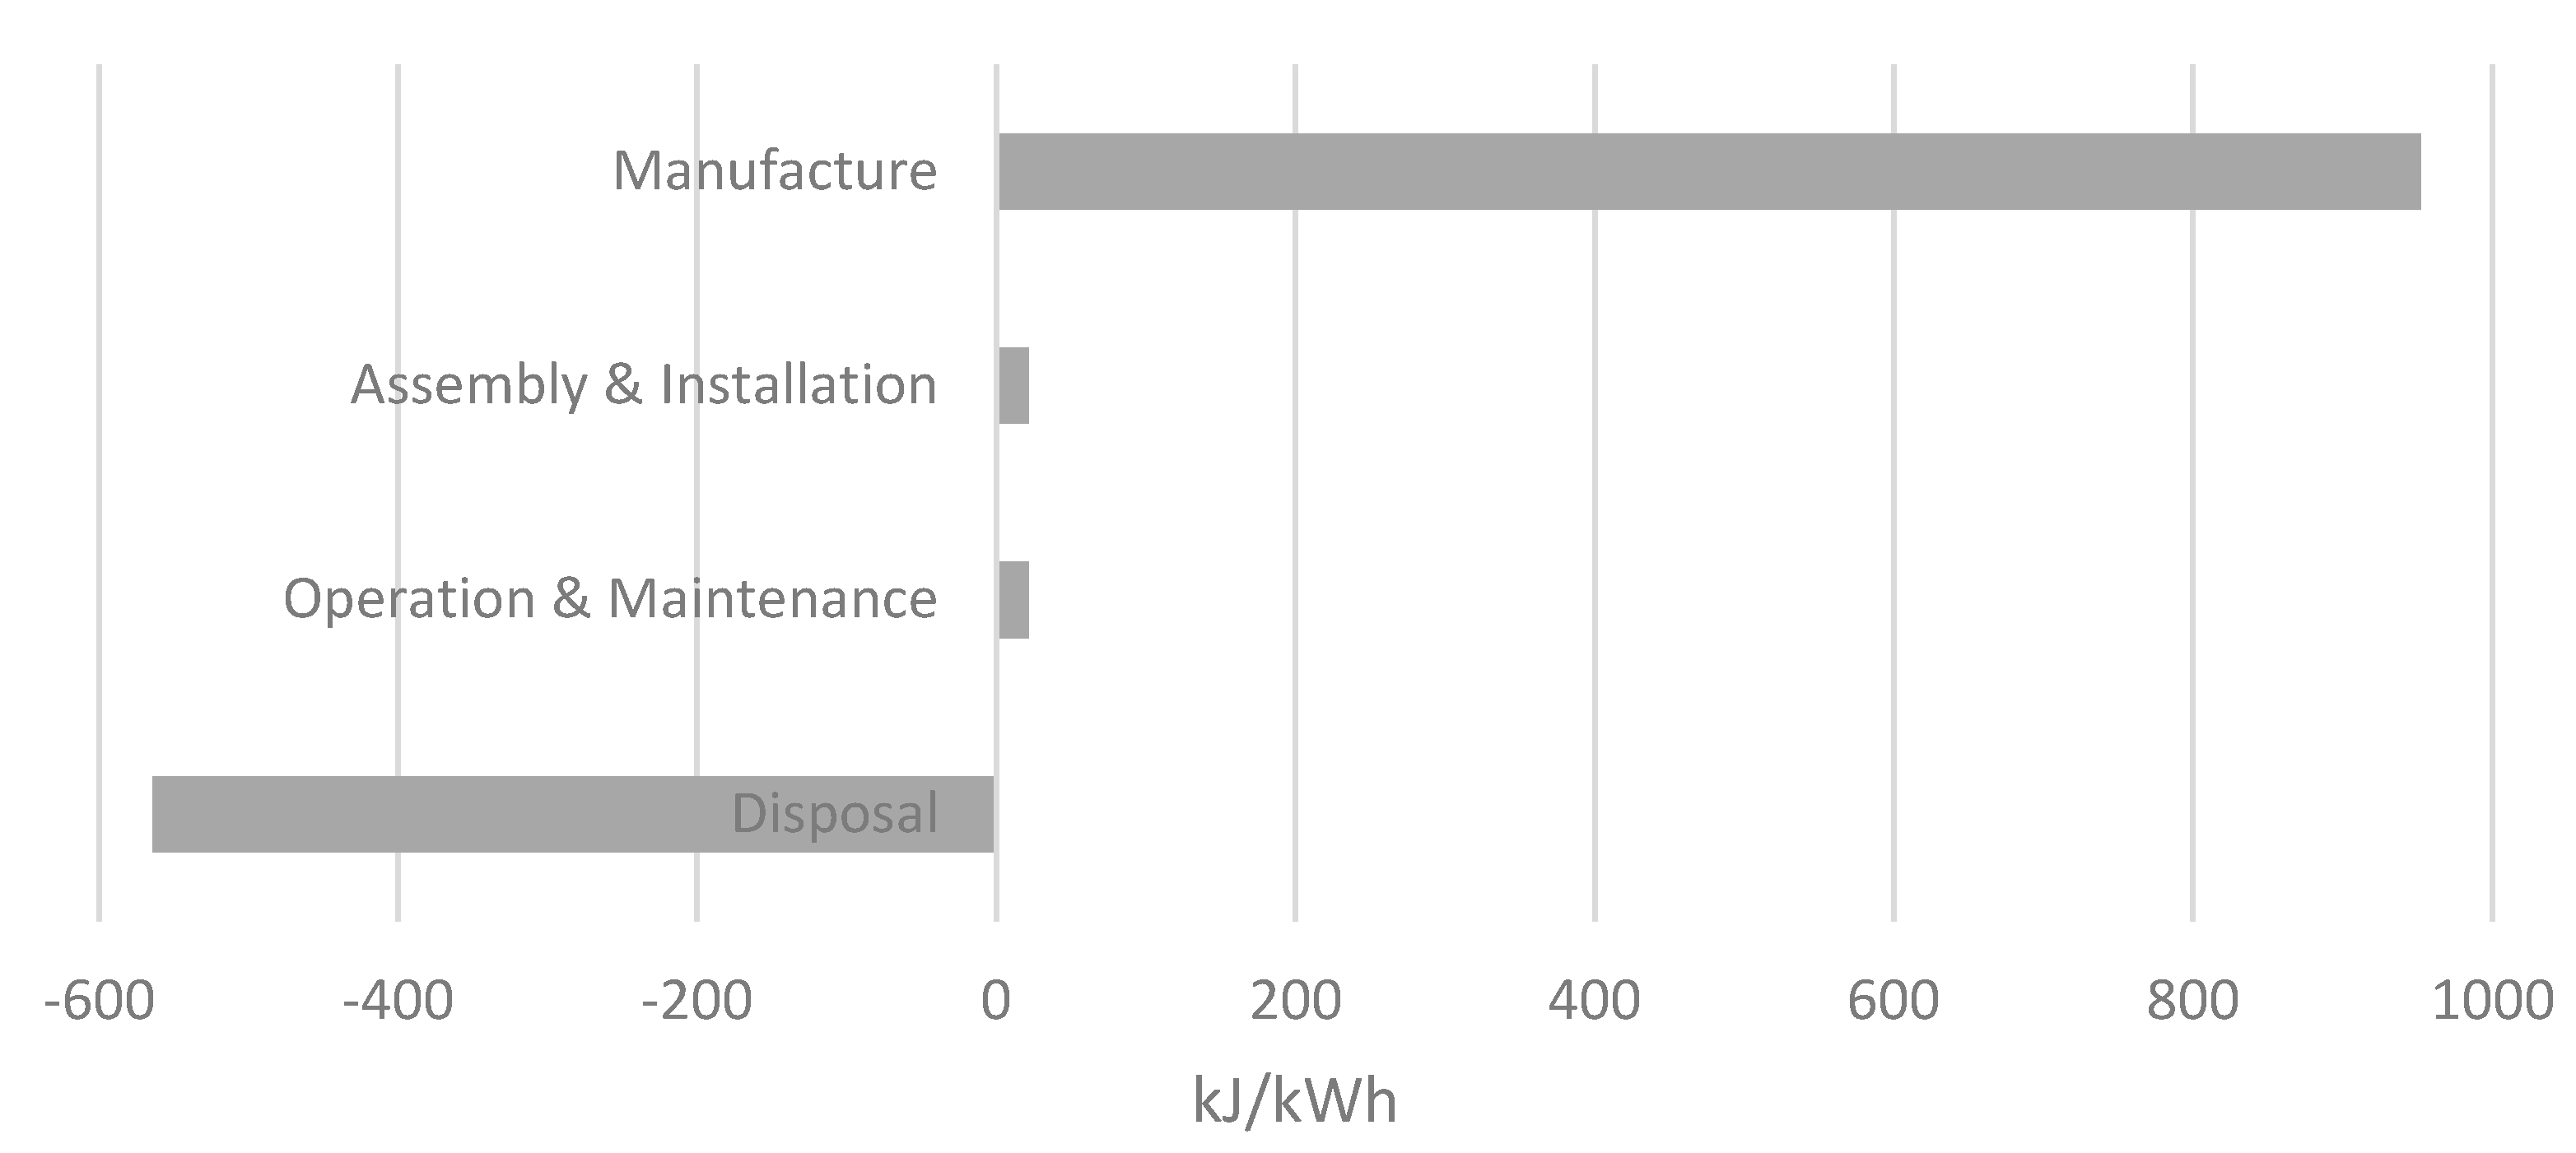
The CED is calculated for five classes of primary energy carriers: fossil, nuclear, hydro, biomass, and others (wind, solar and geothermal). Differences for different types of cumulative energy demands are mainly due to the consideration of location-specific electricity mixes. A breakdown of embodied energy by component is showed in
Figure 8.
3.2. Energy and Carbon Payback Times
Energy and Carbon payback time (EPT and CPT, respectively) are important indicators for evaluating the degree of acceptability of renewable resources. CPT measures the period (months) required for the MegaRoller to offset the carbon emissions generated throughout the device’s life cycle process and is calculated according to Equation (1).
The
Energy payback time (EPT) represents the amount of time that the system needs to run for in order to produce the amount of energy that was consumed throughout its lifetime. It is calculated according to Equation (2),
where
Life Cycle Embodied Energy represents the primary energy demand throughout all stages considered in the LCA, and Energy produced (EP) per year represents the annual energy production. EPB values depend mainly on annual energy production, device life and type of materials required.
The carbon avoided by the device will depend on what generation is displaced and is time and location dependent. However, it is accepted practice to assume that the electricity offset by the device will be the average of the Portuguese grid, with a CO
2 intensity of 0.295 kg CO
2/kWh [
27]. The GWP and CED were found in
Section 4 to be 33.8 g CO
2 eq/kWh and 432 kJ/kWh, respectively. These values correspond to a CPT of 2.3 years and an EPT of 2.4 years.
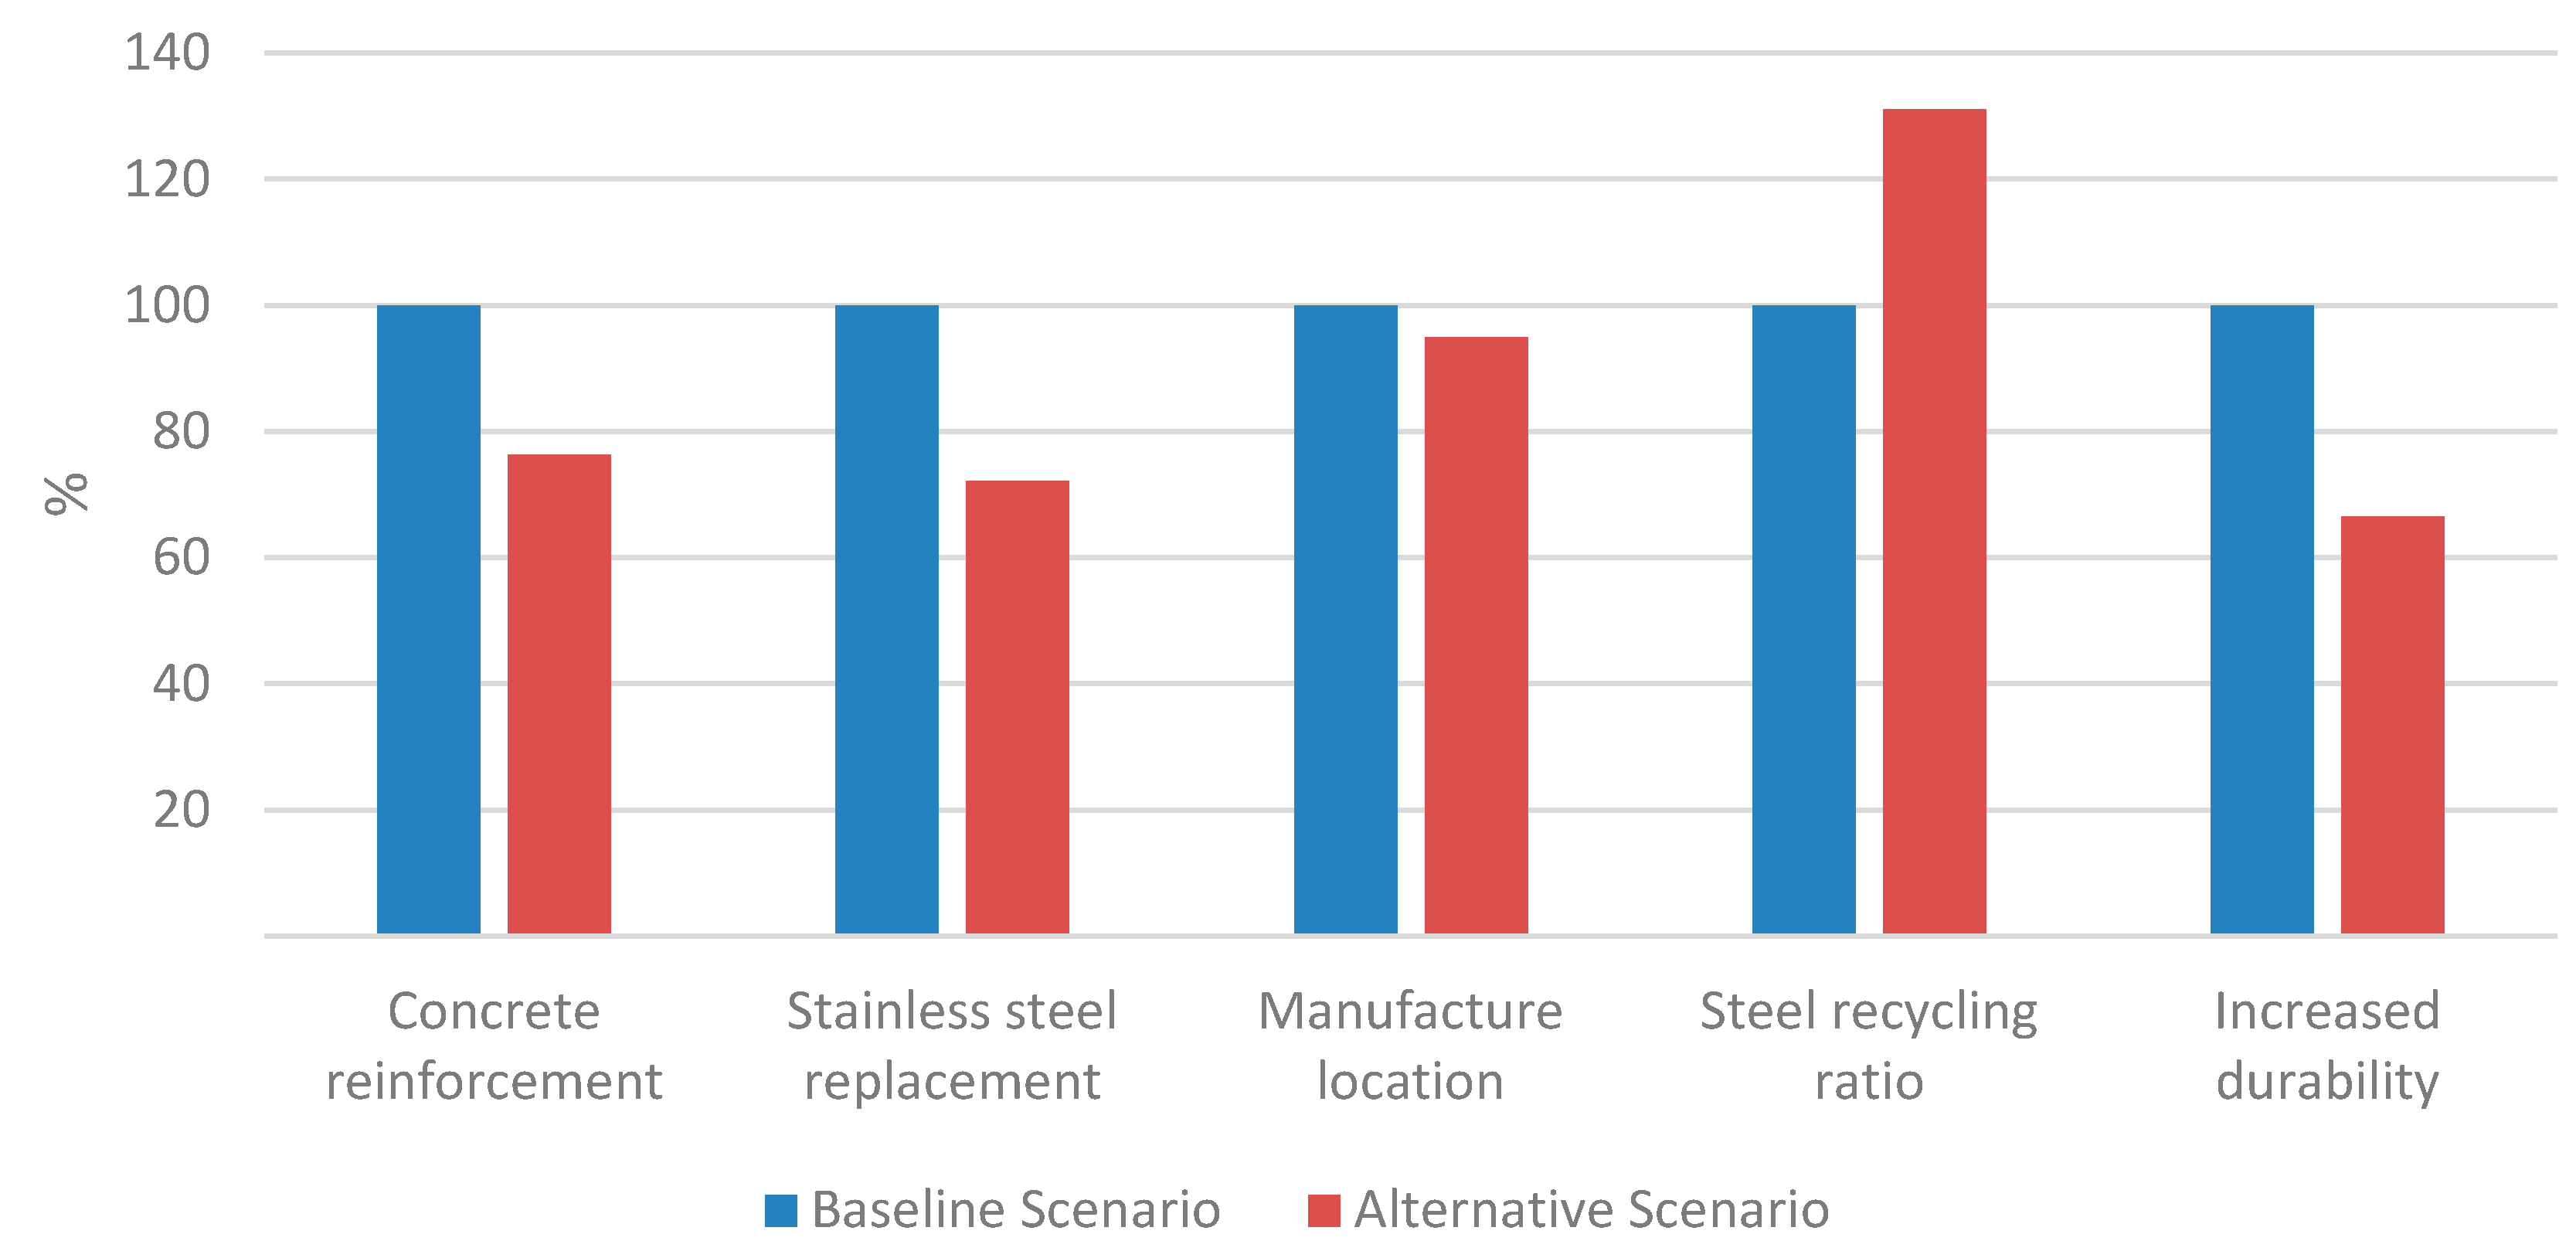
3.3. Alternative Scenario Analysis
A range of scenarios was drawn (
Table 6) to model potential improvements in MegaRoller’s life cycle environmental impact. Results illustrated in
Figure 9 are indicative and their interpretation needs further study regarding the sensitivity of each parameter variation. Although concrete makes about 90% of the overall foundation’s weight, reinforcing steel is responsible for 54.3% of the GWP in the manufacture of the foundation. As such, a scenario was drawn for the substitution of steel reinforced concrete foundation by a glass fiber reinforced concrete foundation. Considering this substitution happens on a percentage of 0.5% of the concrete weight [
28], a potential reduction of 24% in GHG emissions can be observed. Such a significative reduction should be considered when studying this and other alternative materials for this component. Considering the large contribution that stainless steel makes to environmental impacts, the whole amount of this material needed for the MegaRoller manufacture was substituted by low alloyed steel, resulting in a decrease of 28% in the overall carbon intensity. By assuming the manufacture of the whole device near the installation site, a potential reduction of 5% in carbon intensity can be observed, which might indicate that transport of components is not significant in the overall global warming potential impacts. An alternative scenario was drawn for waste treatment, by varying the recycling ratio for steel. A decrease of 35% in the recycling ratio for steel resulted in an increase of almost 24% in the carbon emissions. This variation shows the importance of this parameter and that special attention should be given for the EoL of the MegaRoller device. Further attention should also be given to the recycling ratio of concrete. Increasing the device’s lifetime means increasing the average production of the device over its lifetime from 53 GWh to 79.5 GWh. This alternative results in a carbon intensity of 22.4 g CO
2 eq/kWh, which means a decrease of 33% compared to the baseline scenario.
MegaRoller demands a high input of materials per installed capacity (3987 kg/kW) when compared with other renewable energy technologies, e.g., 330 to 360 kg/kW for photovoltaic systems [
29] and 340 to 770 kg/kW for wind turbines [
30]. Therefore, since steel is one of the largest contributors to the overall GWP impacts, another scenario considered was the use of lightweight materials such as the use of aluminum. This would involve greater specific environmental impacts per kg of material but also a possible reduction in impacts due to the lower amount of material used. However, there was a lot of uncertainty around this scenario e.g. the extent to which the structural weight could be reduced, so the results were not considered to be robust enough; this might be studied in future technologies.
4. Discussion
4.1. Comparison with Other Studies of Ocean Energy
Overall, results show that most of the CO2 emissions generated by these type of devices come from the manufacture of structural components such as foundations and mooring (particularly materials such as stainless steel, concrete and cast iron). Furthermore, the environmental impacts resulting from assembly, installation, operation and maintenance are not significant.
LCA analysis has been applied to other MRE converters. The study results are consistent with Uihlein’s results on GWP for a similar device [
4] as part of a very complete study on LCA of ocean energy technologies which analyses the GWP for 15 tidal and wave technologies. It concludes that total GHG emissions range from 15 g CO
2 eq/kWh for enclosed-tip devices to 105 g CO
2 eq/kWh for point absorber and rotating mass devices, with an average of 53 ± 29 g CO
2 eq/kWh for all technologies. However, the PTO was the subcomponent that accounted for more GHG emissions for the OWSC device assessed in this study, whereas the foundation is the biggest contributor in the case of MegaRoller during manufacture. Like MegaRoller though, the proportions of O&M and Assembly & Installation are negligible for all device types.
Table 7 shows the studies used for comparison of MegaRoller results with other MRE projects. Dahlsten [
19] conducted a LCA of a WEC and concluded that most of the impacts are related to the material used besides installation and maintenance, and decommissioning cannot be disregarded. Offshore wind converters are the least carbon intensive technologies (also compared with other means of electricity generation as observed in
Section 4.2). Thomson et al. [
21] revealed that Pelamis WEC emits 35 g CO
2 eq/kWh and has a CED of 493 kJ/kWh from the results of an LCA study, the closest values from MegaRoller results among the reviewed literature. Walker and Howell [
31] used LCA to assess environmental burdens of Oyster wave energy converter and SeaGen tidal turbine, comparatively. Despite both being oscillating body systems with hydraulic PTOs and largely made of steel, differences in results between Pelamis and Oyster might be due to differences in technology, but could also be due to variations in analysis methodology and assumptions. The carbon footprint of Wave Dragon, a floating overtopping device, is comparatively lower, which might be because it is predominantly made of concrete. Douglas et al. [
6] assessed the carbon and energy intensity of SeaGen, a marine current turbine, having identified manufacture as the main contributor to the results, and suggested a couple of improvements through the use of alternative materials with greater recycling potential. Ref [
32] identified the cradle to gate phase as the most intensive phase for all parameters. Some studies conclude that recycling in the disposal stage represents a significant reduction in the GHG emissions [
6,
33].
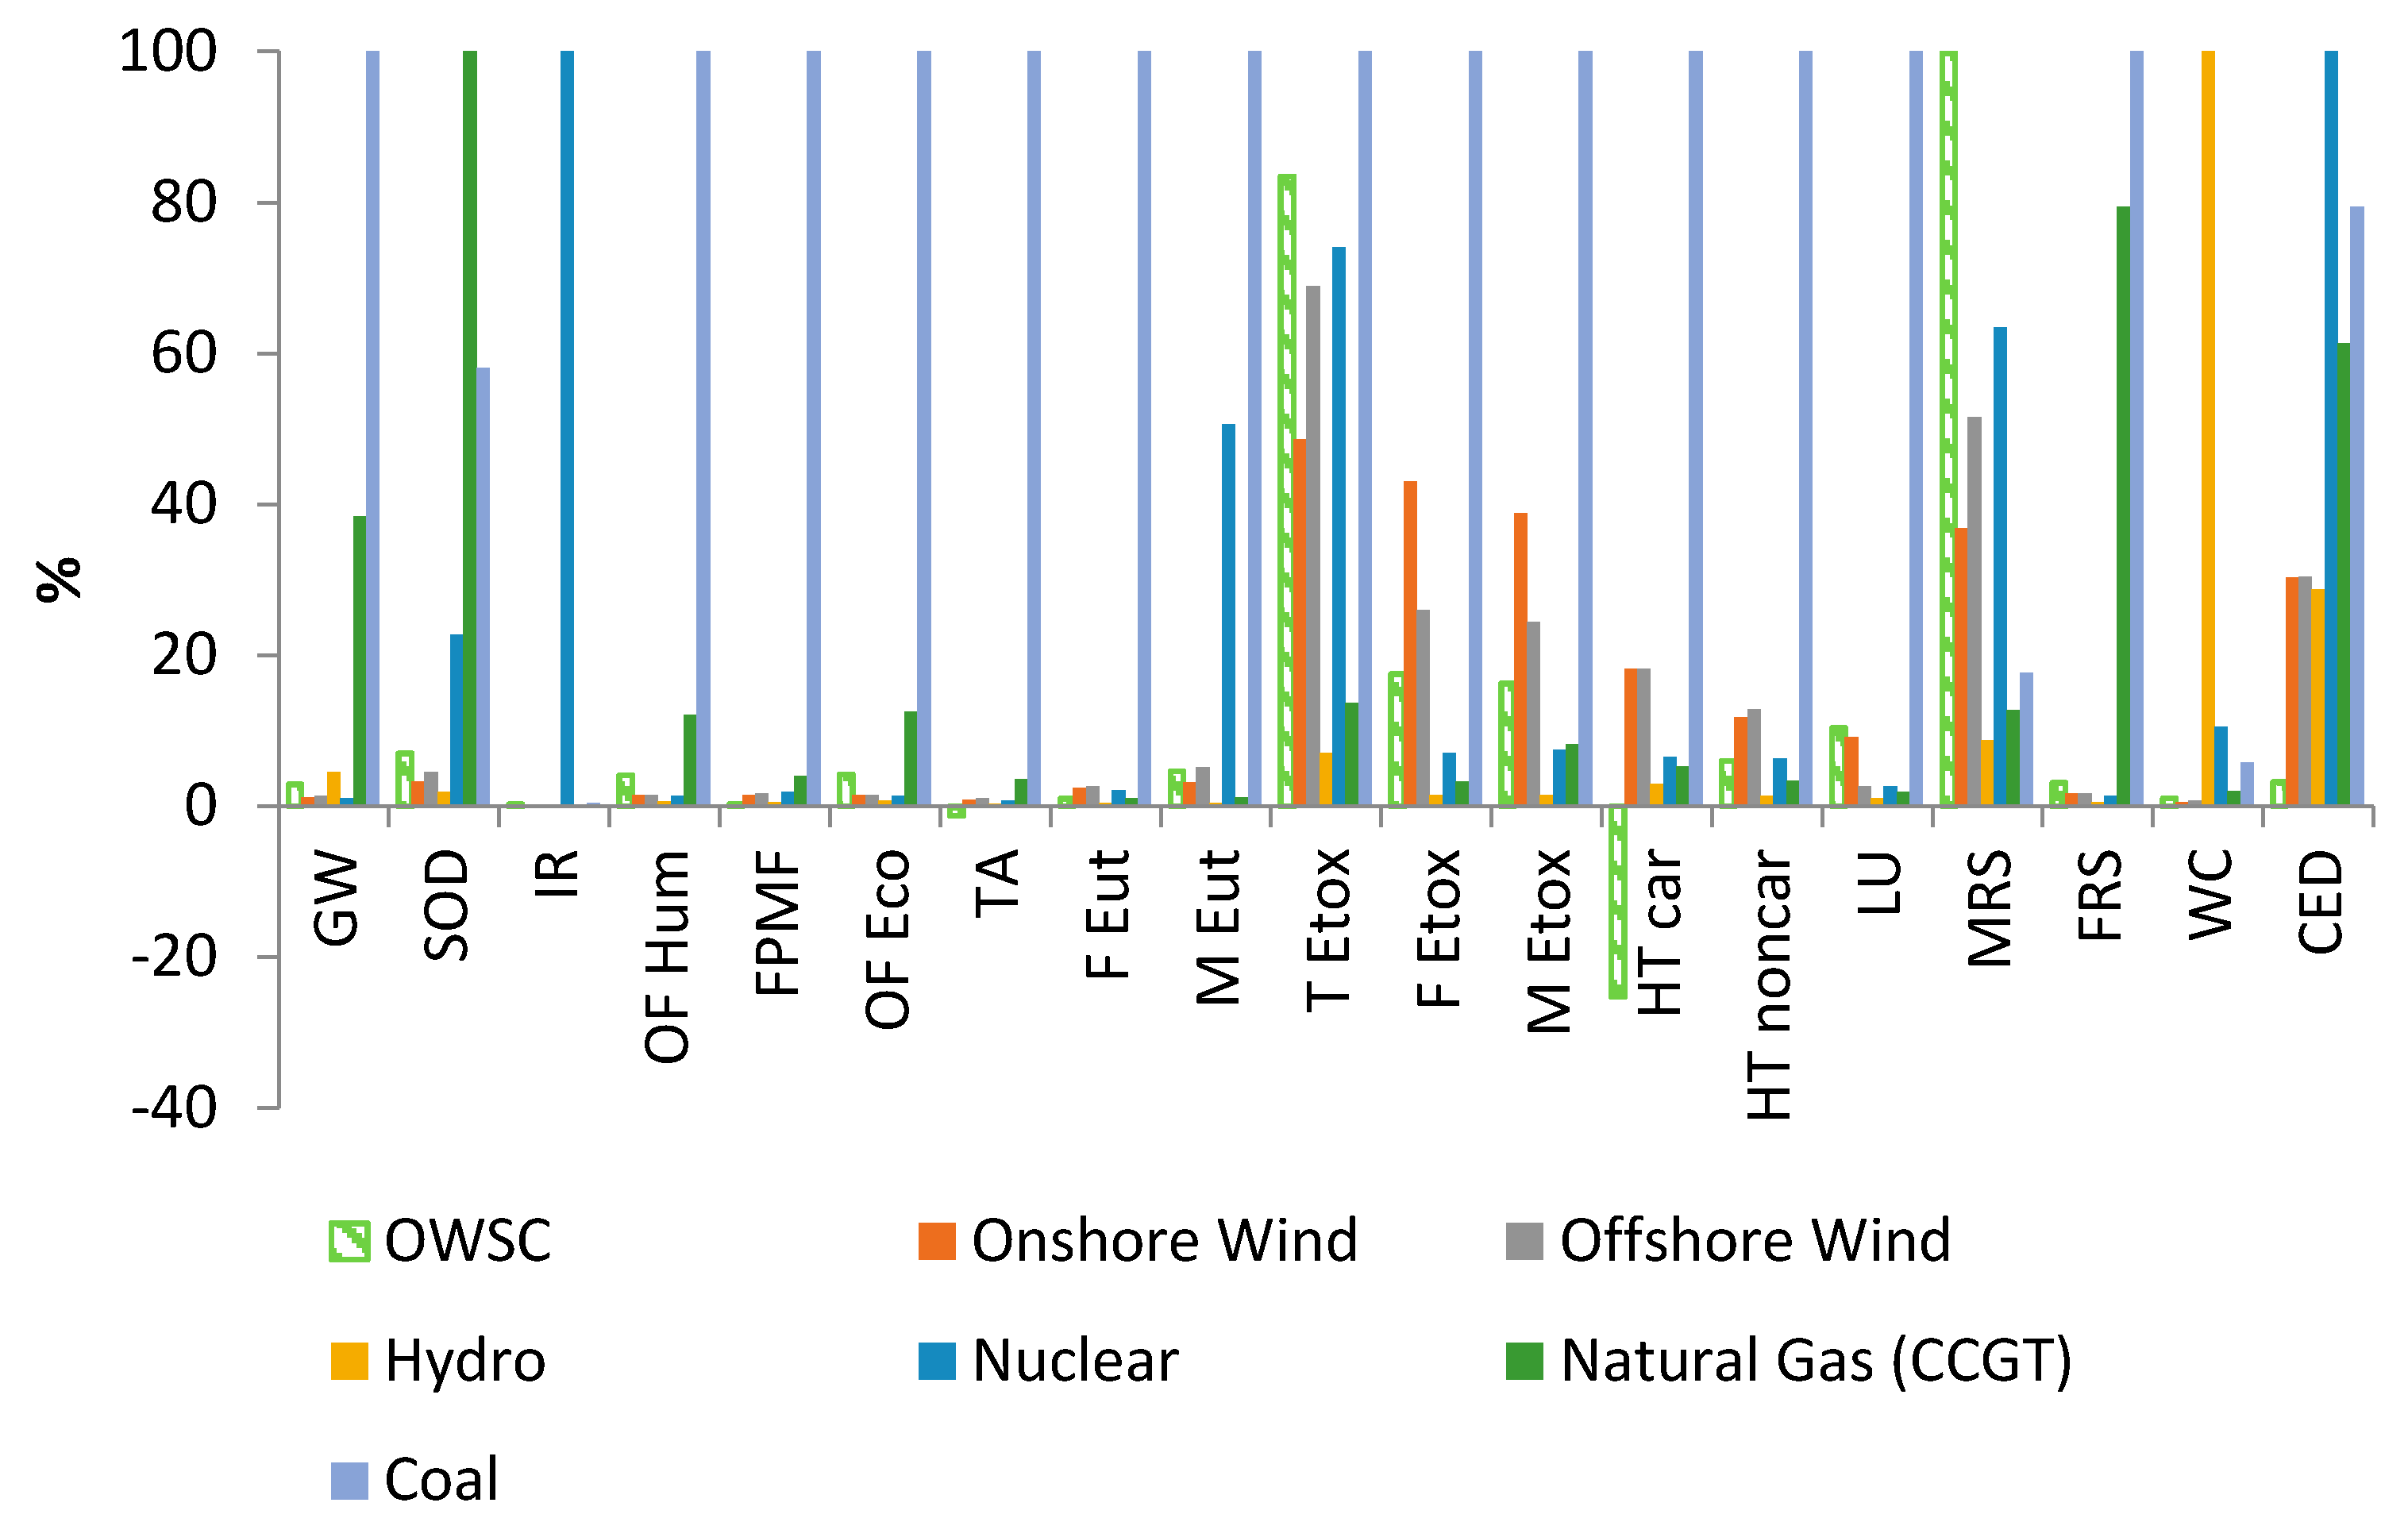
4.2. Comparison with Other Sources of Electricity Generation
The MegaRoller aims to be a low-carbon alternative to conventional power generation, but it is expected that it will have lower environmental impacts across all categories, in particular eutrophication, depletion of fossil fuels, toxic effects on humans and ecosystems and ozone formation.
Figure 10 summarizes the environmental impacts caused by the production of 1 kWh of electricity by a range of other means of electricity generation from the Ecoinvent database. Values are shown as relative to the highest score in each impact category. MegaRoller has significantly lower impacts than coal and gas-fired generation (combined cycle gas turbine or CCGT) in GWP, ozone formation and depletion, fossil resource scarcity and CED. However, nuclear and CCGT have a better performance in a range of other categories such as Land use or Ecotoxicity. MegaRoller was found to have the highest impacts in mineral resource scarcity – this category uses quantity of minerals and fossil fuels used and converts this LCA data to a ratio of quantity of resource used versus quantity of resource left in the reserve. Regarding GWP, onshore and offshore wind and nuclear perform better than MegaRoller. This comparison shows the importance of assessing more than the GWP and energy consumption for renewable technologies.
It can also be seen that other renewable technologies such as onshore and offshore wind perform better than MegaRoller in terms of GHG emissions. Offshore wind was in fact found to be the technology with the lowest GHG emissions for electricity and heat generation from renewable energy technologies (RETs) according to Amponsah et al. [
39], with a carbon intensity of 5.3–13.0 g CO
2 eq/kWh. Some studies come to energy and carbon intensity levels that are in range with those of MegaRoller, namely 35 to 50 g CO
2 eq/kWh for wind and solar PV respectively [
40], 20–80 g CO
2 eq/kWh for concentrated solar power [
41] and 40–80 g CO
2 eq/kWh for geothermal [
42]. However, it is very important to remember that these are much more established technologies than MRE. As demonstrated, almost all the energy consumed throughout the device’s life cycle derives from fossil fuels, which is a direct effect of the current fossil-based global economy. This will potentially change as global infrastructure and technology evolves.
5. Conclusions
This preliminary LCA was intended to choose the least carbon intensive design option for the WEC and opt for the most efficient processes throughout the device’s life cycle. The resulting carbon intensity of 33.8 g CO2 eq/kWh and energy intensity of 432 kJ/kWh are generally comparable with earlier studies for wave and tidal technologies and are very low when compared to other power generating technologies. Results are aligned with all previous studies on MRE technologies in concluding the main environmental impacts are due to materials use and manufacture, while Assembly & Installation and O&M do not show significant impacts. High GWP and CED levels during manufacture are due to high amounts of material used, particularly steel. Results are based on a high rate of recycling of steel and concrete being achieved. Significant differences in relative contributions of each life cycle stage across all 18 impact categories shows the importance of assessing more categories than the GWP and energy consumption for renewable technologies. Both preliminary energy and carbon payback times were found to be slightly below 2.5 years emphasizing once again the capability of renewable energy sources of paying back the energy and GHG emissions embedded in their life cycle.
The scenario analysis showed that there are alternative process and design choices that may improve the energy consumption and GHG emissions throughout the life cycle. While some scenarios showed a modest influence, others such as varying recycling rates and alternative material for stainless steel resulted in significant variations in the overall results. This is indicative of the importance of an in-depth analysis of the sensitivity of several parameters throughout the life cycle.
EoL is currently excluded from operational boundaries of the majority of MRE developments and its inclusion in eco-design initiatives is challenged by uncertainties on a temporal, technological and business level such as uncertainties regarding recycling ratios. This report corroborated previous studies by proving the importance of the EoL scenario to the overall environmental performance and highlighted that a significative positive effect can be achieved if virgin materials can be replaced by recycled materials. Therefore, further efforts should be undertaken to better understand how to properly model this stage.
An opportunity to reduce environmental impacts could lie with the substitution of reinforcing steel in the manufacture of the foundation (responsible for 42% of the overall GHG emissions) by another material such as glass fiber. The improvement of the MegaRoller mooring system should also be an area of further research, which is currently being undertaken by AW Energy by replacing stainless-steel chains with steel wire.
In order to understand the realistic impacts of wave energy devices at a commercial scale, this study should also be carried out considering not one MegaRoller device but an array of devices, which would certainly reduce environmental impacts per kWh of electricity produced since sharing some components (e.g. foundation systems) will certainly reduce the material intensity.
Author Contributions
Conceptualization, M.A. and T.S.; methodology, M.A.; software, M.A.; validation, M.A. and T.S.; formal analysis, M.A.; investigation, M.A.; resources, M.A. and T.S.; data curation, M.A. and T.S..; writing—original draft preparation, M.A.; writing—review and editing, M.A. and T.S.; visualization, M.A. and T.S.; supervision, M.A. and T.S.; project administration, M.A.; funding acquisition, T.S. All authors have read and agreed to the published version of the manuscript.
Funding
This research has received funding from the European Union’s Horizon 2020 research and innovation program under grant agreement No 763959.
Conflicts of Interest
The authors declare no conflict of interest.
References
- World Energy Outlook 2019; OECD, 2019; (World Energy Outlook); Available online: https://www.oecd-ilibrary.org/energy/world-energy-outlook-2019_caf32f3b-en (accessed on 2 December 2020).
- Collins, E. Alternative Design Considerations for a Wave Energy Converter: A Sustainability Approach. Master’s Thesis, Oregon State University, Corvallis, OR, USA, 2014. [Google Scholar]
- Thomson, R.C.; Harrison, G.P.; Chick, J.P. Full life cycle assessment of a wave energy converter. In Proceedings of the IET Conference on Renewable Power Generation (RPG 2011), Edinburgh, UK, 6–8 September 2011; IET, 2011; p. 63. Available online: https://digital-library.theiet.org/content/conferences/10.1049/cp.2011.0124 (accessed on 15 November 2020).
- Uihlein, A. Life cycle assessment of ocean energy technologies. Int. J. Life Cycle Assess. 2016, 21, 1425–1437. Available online: http://link.springer.com/10.1007/s11367-016-1120-y (accessed on 2 December 2020). [CrossRef] [Green Version]
- ISO 14040. Environmental Management—Life Cycle Assessment: Principles and Framework; International Organization for Standardization: Geneva, Switzerland, 2006. [Google Scholar]
- Douglas, C.A.; Harrison, G.P.; Chick, J.P. Life cycle assessment of the Seagen marine current turbine. Proc. Inst. Mech. Eng. Part M J. Eng. Marit. Environ. 2008, 222, 1–12. Available online: http://journals.sagepub.com/doi/10.1243/14750902JEME94 (accessed on 15 November 2020). [CrossRef] [Green Version]
- Elginoz, N.; Bas, B. Life Cycle Assessment of a multi-use offshore platform: Combining wind and wave energy production. Ocean Eng. 2017, 145, 430–443. Available online: https://linkinghub.elsevier.com/retrieve/pii/S0029801817305243 (accessed on 15 November 2020). [CrossRef]
- Parker, R.P.M.; Harrison, G.P.; Chick, J.P. Energy and carbon audit of an offshore wave energy converter. Proc. Inst. Mech. Eng. Part A J. Power Energy 2007, 221, 1119–1130. Available online: http://journals.sagepub.com/doi/10.1243/09576509JPE483 (accessed on 20 November 2020). [CrossRef] [Green Version]
- Santos-Herran, M.; Medina-Lopez, E.; Entwistle, L.; Jeffrey, H. Energy and carbon audit of a tidal array equipped with an innovative power take-off. In Proceedings of the 13th European Wave and Tidal Energy Conference, Napoli, Italy, 1–6 September 2019. [Google Scholar]
- Magagna, D.; Monfardini, R.; Uihlein, A. JRC Ocean Energy Status Report: 2016 Edition EUR 28407 EN; Publications Office of the European Union JRC104799: Luxembourg, 2016. [Google Scholar]
- ISO 14044. Environmental Management—Life Cycle Assessment: Requirements and Guidelines; International Organization for Standardization: Geneva, Switzerland, 2006. [Google Scholar]
- AW Energy. WaveRoller Technology. 2018. Available online: http://aw-energy.com/waveroller/ (accessed on 20 November 2020).
- The International EPD System. UN CPC 171 and 173—Electricity, Steam and Hot/Cold Water Generation and Distribution (Version 2.02); Stockholm, Sweden, 2013; Available online: https://test1.environdec.com/PCR/PCR-Development/PCR-Forum/Electricity-Steam-and-Hot-and-Cold-Water-Generation-and-Distribution/ (accessed on 17 February 2021).
- EC-JRC. International Reference Life Cycle Data System (ILCD) Handbook—General Guide for Life Cycle Assessment—Detailed Guidance; Publications Office of the European Union: Luxembourg, 2010. [Google Scholar]
- Raventós, A.; Simas, T.; Moura, A.; Harrison, G.; Thomson, C.; Dhedin, J.-F. Life Cycle Assessment for Marine Renewables; European Union, 2010; Available online: https://core.ac.uk/download/pdf/13721464.pdf (accessed on 17 February 2021).
- ReCiPe. ReCiPe v1.13. 2016. Available online: htp://www.lcia-recipe.net/ (accessed on 8 November 2020).
- Bonou, A.; Laurent, A.; Olsen, S.I. Life cycle assessment of onshore and offshore wind energy-from theory to application. Appl. Energy 2016, 180, 327–337. [Google Scholar] [CrossRef] [Green Version]
- Frischknecht, R.; Jungbluth, N.; Althaus, H.-J.; Bauer, C.; Doka, G.; Dones, R.; Nemecek, T.; Hellweg, S.; Humbert, S.; Margni, M.; et al. Implementation of Life Cycle Impact Assessment Methods; Ecoinvent Report No. 3, v2.0; Swiss Centre for Life Cycle Inventories: Dübendorf, Switzerland, 2007. [Google Scholar]
- Dahlsten, H. Life Cycle Assessment of Electricity from Wave Power; Uppsala, Sweden, 2009; Available online: https://stud.epsilon.slu.se/5364/1/dahlsten_h_130321.pdf (accessed on 17 February 2021).
- Duque Ciceri, N.; Gutowski, T.G.; Garetti, M. A tool to estimate materials and manufacturing energy for a product. In Proceedings of the 2010 IEEE International Symposium on Sustainable Systems and Technology, Arlington, VA, USA, 17–19 May 2010; pp. 1–6. Available online: http://ieeexplore.ieee.org/document/5507677/ (accessed on 3 January 2021).
- Thomson, R.C.; Chick, J.P.; Harrison, G.P. An LCA of the Pelamis wave energy converter. Int. J. Life Cycle Assess. 2019, 24, 51–63. Available online: http://link.springer.com/10.1007/s11367-018-1504-2 (accessed on 3 January 2021). [CrossRef] [PubMed] [Green Version]
- Ashby, M.F. Materials and the Environment—Eco-Informed Material Choice, 2nd ed.; Elsevier: Amsterdam, The Netherlands, 2013. [Google Scholar]
- Lincoln Electric. The Full Solution for Submerged Arc Welding. 2019. Available online: https://www.lincolnelectric.com/assets/EU/EN/subarc-eng.pdf (accessed on 3 January 2021).
- Zepeda, L.G. Life Cycle Assessment of a Wave Energy Converter; Stockholm, Sweden, 2017; Available online: https://www.diva-portal.org/smash/record.jsf?pid=diva2:1092837 (accessed on 17 February 2021).
- Kou, S. Welding Metallurgy; John Wiley & Sons: Hoboken, NJ, USA, 1987. [Google Scholar]
- Caterpillar. Engine Powered Lift Trucks Specifications 1.5–3.5 Tonnes; Caterpillar: Peoria, CA, USA, 2019. [Google Scholar]
- Moro, A.; Lonza, L. Electricity carbon intensity in European Member States: Impacts on GHG emissions of electric vehicles. Transp. Res. Part D Transp. Environ. 2018, 64, 5–14. [Google Scholar] [CrossRef] [PubMed]
- Preetha, V.; Belarmin, X.; Narayanan, K.P. Strenght properties of steel fibre and glass fibre composites. Int. J. Civ. Eng. Technol. 2014, 5, 188–193. [Google Scholar]
- Krauter, S.C.W. Solar Electric Power Generation—Photovoltaic Energy Systems; Springer: Berlin/Heidelberg, Germany, 2006. [Google Scholar]
- Guezuraga, B.; Zauner, R.; Pölz, W. Life cycle assessment of two different 2 MW class wind turbines. Renew. Energy 2012, 37, 37–44. [Google Scholar] [CrossRef]
- Walker, S.; Howell, R. Life cycle comparison of a wave and tidal energy device. Proc. Inst. Mech. Eng. Part M J. Eng. Marit. Environ. 2011, 225, 325–337. Available online: http://journals.sagepub.com/doi/10.1177/1475090211418892 (accessed on 5 January 2021). [CrossRef]
- Dalton, G.; Madden, D.; Clare Daly, M. Life Cycle Assessment of the Wavestar. In Proceedings of the 2014 Ninth International Conference on Ecological Vehicles and Renewable Energies (EVER), Monte-Carlo, Monaco, 25–27 March 2014. [Google Scholar]
- Walker, S.; Howell, R.; Hodgson, P.; Griffin, A. Tidal energy machines: A comparative life cycle assessment study. Proc. Inst. Mech. Eng. Part M J. Eng. Marit. Environ. 2015, 229, 124–140. Available online: http://journals.sagepub.com/doi/10.1177/1475090213506184 (accessed on 3 January 2021). [CrossRef] [Green Version]
- Chr, H.; Sørensen Stefan, N.; Stefan, A.; Hauschild, M.Z. Life Cycle Assessment of the Wave Energy Converter: Wave Dragon. In Proceedings of the Poster session presented at Conference in Bremerhaven, Bremerhaven, Germany, 26–27 June 2007. [Google Scholar]
- Zhai, Q.; Zhu, L.; Lu, S. Life Cycle Assessment of a Buoy-Rope-Drum Wave Energy Converter. Energies 2018, 11, 2432. Available online: https://www.mdpi.com/1996-1073/11/9/2432 (accessed on 6 January 2021). [CrossRef] [Green Version]
- Patrizi, N.; Pulselli, R.M.; Neri, E.; Niccolucci, V.; Vicinanza, D.; Contestabile, P.; Bastianoni, S. Lifecycle Environmental Impact Assessment of an Overtopping Wave Energy Converter Embedded in Breakwater Systems. Front. Energy Res. 2019, 7, 32. Available online: https://www.frontiersin.org/article/10.3389/fenrg.2019.00032/full (accessed on 6 January 2021). [CrossRef] [Green Version]
- Elmehag, E.; Torosian, R. Life Cycle Assessment of an Ocean Energy Power Plant: Evaluation and Analysis of the Energy Payback Time with Comparison between Sweden and Tanzania; University of Skövde: Skövde, Sweden, 2013. [Google Scholar]
- Rule, B.M.; Worth, Z.J.; Boyle, C.A. Comparison of Life Cycle Carbon Dioxide Emissions and Embodied Energy in Four Renewable Electricity Generation Technologies in New Zealand. Environ Sci Technol. 2009, 43, 6406–6413. [Google Scholar] [CrossRef] [PubMed]
- Yaw Amponsah, N.; Troldborg, M.; Kington, B.; Aalders, I.; Hough, R.L. Greenhouse gas emissions from renewable energy sources: A review of life cycle considerations. Renew. Sustain. Energy Rev. 2014, 39, 461–475. [Google Scholar] [CrossRef]
- Nugent, D.; Sovacool, B.K. Assessing the lifecycle greenhouse gas emissions from solar PV and wind energy: A critical meta-survey. Energy Policy 2014, 65, 229–244. Available online: https://linkinghub.elsevier.com/retrieve/pii/S0301421513010719 (accessed on 6 January 2021). [CrossRef]
- Burkhardt, J.J.; Heath, G.; Cohen, E. Life Cycle Greenhouse Gas Emissions of Trough and Tower Concentrating Solar Power Electricity Generation. J. Ind. Ecol. 2012, 16, S93–S109. Available online: http://doi.wiley.com/10.1111/j.1530-9290.2012.00474.x (accessed on 13 January 2021). [CrossRef]
- Frick, S.; Kaltschmitt, M.; Schröder, G. Life cycle assessment of geothermal binary power plants using enhanced low-temperature reservoirs. Energy 2010, 35, 2281–2294. Available online: https://linkinghub.elsevier.com/retrieve/pii/S0360544210000708 (accessed on 13 January 2021). [CrossRef] [Green Version]
| Publisher’s Note: MDPI stays neutral with regard to jurisdictional claims in published maps and institutional affiliations. |
© 2021 by the authors. Licensee MDPI, Basel, Switzerland. This article is an open access article distributed under the terms and conditions of the Creative Commons Attribution (CC BY) license (http://creativecommons.org/licenses/by/4.0/).


