Article

Morphological Traits and Capture Depth of the Norwegian Skate (Dipturus nidarosiensis (Storm, 1881)) from Two Mediterranean Populations

1
COISPA Tecnologia & Ricerca, Via dei Trulli 18/20, 70126 Bari, Italy
2
Dipartimento di Scienze della Vita e dell’Ambiente, Università di Cagliari, Via T. Fiorelli 1, 09126 Cagliari, Italy
3
CoNISMa Consorzio Nazionale Interuniversitario per le Scienze Mare, Piazzale Flaminio 9, 00196 Rome, Italy
*
Author to whom correspondence should be addressed.
J. Mar. Sci. Eng. 2021, 9(12), 1462; https://doi.org/10.3390/jmse9121462
Submission received: 29 October 2021 / Revised: 10 December 2021 / Accepted: 16 December 2021 / Published: 20 December 2021
(This article belongs to the Special Issue Deep-Sea Ecosystem Management)

Abstract

:
The Norwegian skate Dipturus nidarosiensis (Storm, 1881) has only recently been recorded in the western-central Mediterranean Sea. It was hypothesized a more ancient presence of the species, which has not been detected due to a misidentification with other species of the same genus. This situation could lead to underestimate the risk of a dramatic decline of the spawning stock. In the IUCN Red List, the species is listed as near threatened and considered rare in both the northeast Atlantic and the Mediterranean areas. In the Mediterranean Sea, Norwegian skates were repeatedly caught mostly in two areas between 2005 and 2020: Sardinia Seas and Adriatic-Ionian Seas. In total, 58 specimens were caught, and 28 morphological length measurements were taken on all specimens. The Canonical Discriminant Analysis proved the presence of significant differences only for assemblages made on the basis of the specimen’s area of capture, but not on the basis of sex or ontogenetic development. This analysis could be the first step to highlight the differences between the populations of Norwegian skate in the Mediterranean basin. Moreover, a preliminary analysis of depth of capture was performed as a first step to study this species vertical distribution.

1. Introduction

The Norwegian skate Dipturus nidarosiensis (Storm, 1881) is geographically distributed along the Northeast Atlantic, from Iceland, the Faroe Islands and northern Norway to Madeira and northern Mauritania [1]. The species presence has been frequently observed in the Northeast Atlantic and in Bay of Biscay [2,3,4], however, recently, it has been also recorded in Mediterranean basin, mainly in the northwestern part, in particular along the southern Sardinia coast [5,6,7,8,9,10,11], off Algeria [7] and in the Alboran Sea [12]. Furthermore, more recently, the species has been caught in the central Mediterranean, in particular in South Adriatic Sea [13,14], in North-Western Ionian Sea [13] and in Strait of Sicily [15]. The first catch of Norwegian skate specimens in Western Mediterranean basin dates back to 2005 in Sardinia [5], while the other records are more recent: 2012–2016 in Alboran Sea [12], 2008–2016 in South Adriatic [13,14], 2011 in Ionian Sea [13] and 2017 in Strait of Sicily [15]. On the bases of the abovementioned studies, two hypothesis on the origin of the species presence in the Mediterranean Sea were formulated: either a recent entry of this species across the Atlantic via the Strait of Gibraltar [5] or an ancient presence of the Norwegian skate, which had not been detected due to a misidentification between D. nidarosiensis and D. batis [13]. The latter hypothesis could be supported by the fact that the Norwegian skate is an often-misidentified species both in the Atlantic Ocean and in the Mediterranean basin [5,7,12,16,17]. Misidentification issues seems indeed to be particularly significant in the genus Dipturus [17,18]. In Atlantic Ocean as well as in the Mediterranean basin, such misidentification includes Dipturus batis (Linnaeus, 1758), Dipturus oxyrinchus (Linnaeus, 1758) and D. nidarosiensis. The species misidentification could lead to an incorrect estimation of the population status, which in turn may cause incorrect management choices that may even increase the species extinction risk, especially for cartilaginous species. Indeed, as with most elasmobranchs, D. nidarosiensis shows a k-selected life strategy, characterized by a slow growth rate, long life spans, late-age at sexual maturity, and low fecundity [6]. All these biological characteristics make the species particularly vulnerable to fishing exploitation [19,20]. Nonetheless, classification errors are still frequent mostly for the skate species e.g., [17,21]. However, in recent decades, species discrimination based on the DNA has been applied [22] in an ever-increasing number of cases [23]. The use of molecular markers has been recognized as a useful tool in several ray species identification occasion e.g., [7,21,24,25,26,27,28] including D. nidarosiensis [5,7,13]. Still, the molecular analysis is costly and time-consuming tool and certainly it could not be used routinely in the laboratory or on board [13]. The Norwegian skate is listed as near threatened [29] and considered rare both in Atlantic Ocean and in the Mediterranean Sea [5,30]. For this reason, up to date the total amount of available information about its life history appeared very limited, especially in the Mediterranean basin, where our knowledge is only based on specimens caught around Sardinia Island (Western Mediterranean) [6,11]. For this reason, updating information on geographical distribution, depth catch and/or morphological traits is considered extremely important to deepen the knowledge on this species. Morphometric characters can be used to elucidate the evolutionary significance of a certain trait [31]. Moreover, morphometric analysis is considered one powerful, cost-effective tools to identify and characterize fish stocks [31,32,33], to determinate the structure of fish assemblages [34] and to distinguish between fish populations [34,35,36]. The identification of the populations within the same species through multifactorial discriminant analysis can lead to a better knowledge of a species in term of evolution, ecology and behavioral characteristic [31,36], contributing to its management within a conservation strategy perspective [37,38]. Indeed, fish stocks are considered as the key units in marine management research [39] and reference within. Marine fish are often considered as mixed stocks due to the population connectivity and complexity of fish life history [39,40]. Stock identification has been used in fisheries for classifying mixed stocks and tracking species movement or migration. Thus, successful discrimination of stocks is critical for investigating population dynamics [41], and defining stock boundaries [39]. Stock management based on stock discrimination is increasingly used for providing guidance on fishery resources assessment, evaluating the condition of exploitation of a population and implement appropriate management strategies [41]. The phenotypic as well the morphometric character of a population is one of the most used techniques for fish stock identification and discriminate mixed stocks [33].
In consideration of the above, the present study aims in describing and characterizing from morphological points of view for the first time, the Norwegian skate specimens caught in two area: the South Adriatic-Ionian Sea (Central Mediterranean) and Sardinia waters (Western Mediterranean). Morphological comparisons with specimens from these two sampling area, life-stages (juvenile and adult) and sex were made in order to provide a deep morphological description of this species from the Mediterranean basin. Moreover, this study provides an updated information about the Mediterranean geographical and depth catch of D. nidarosiensis.

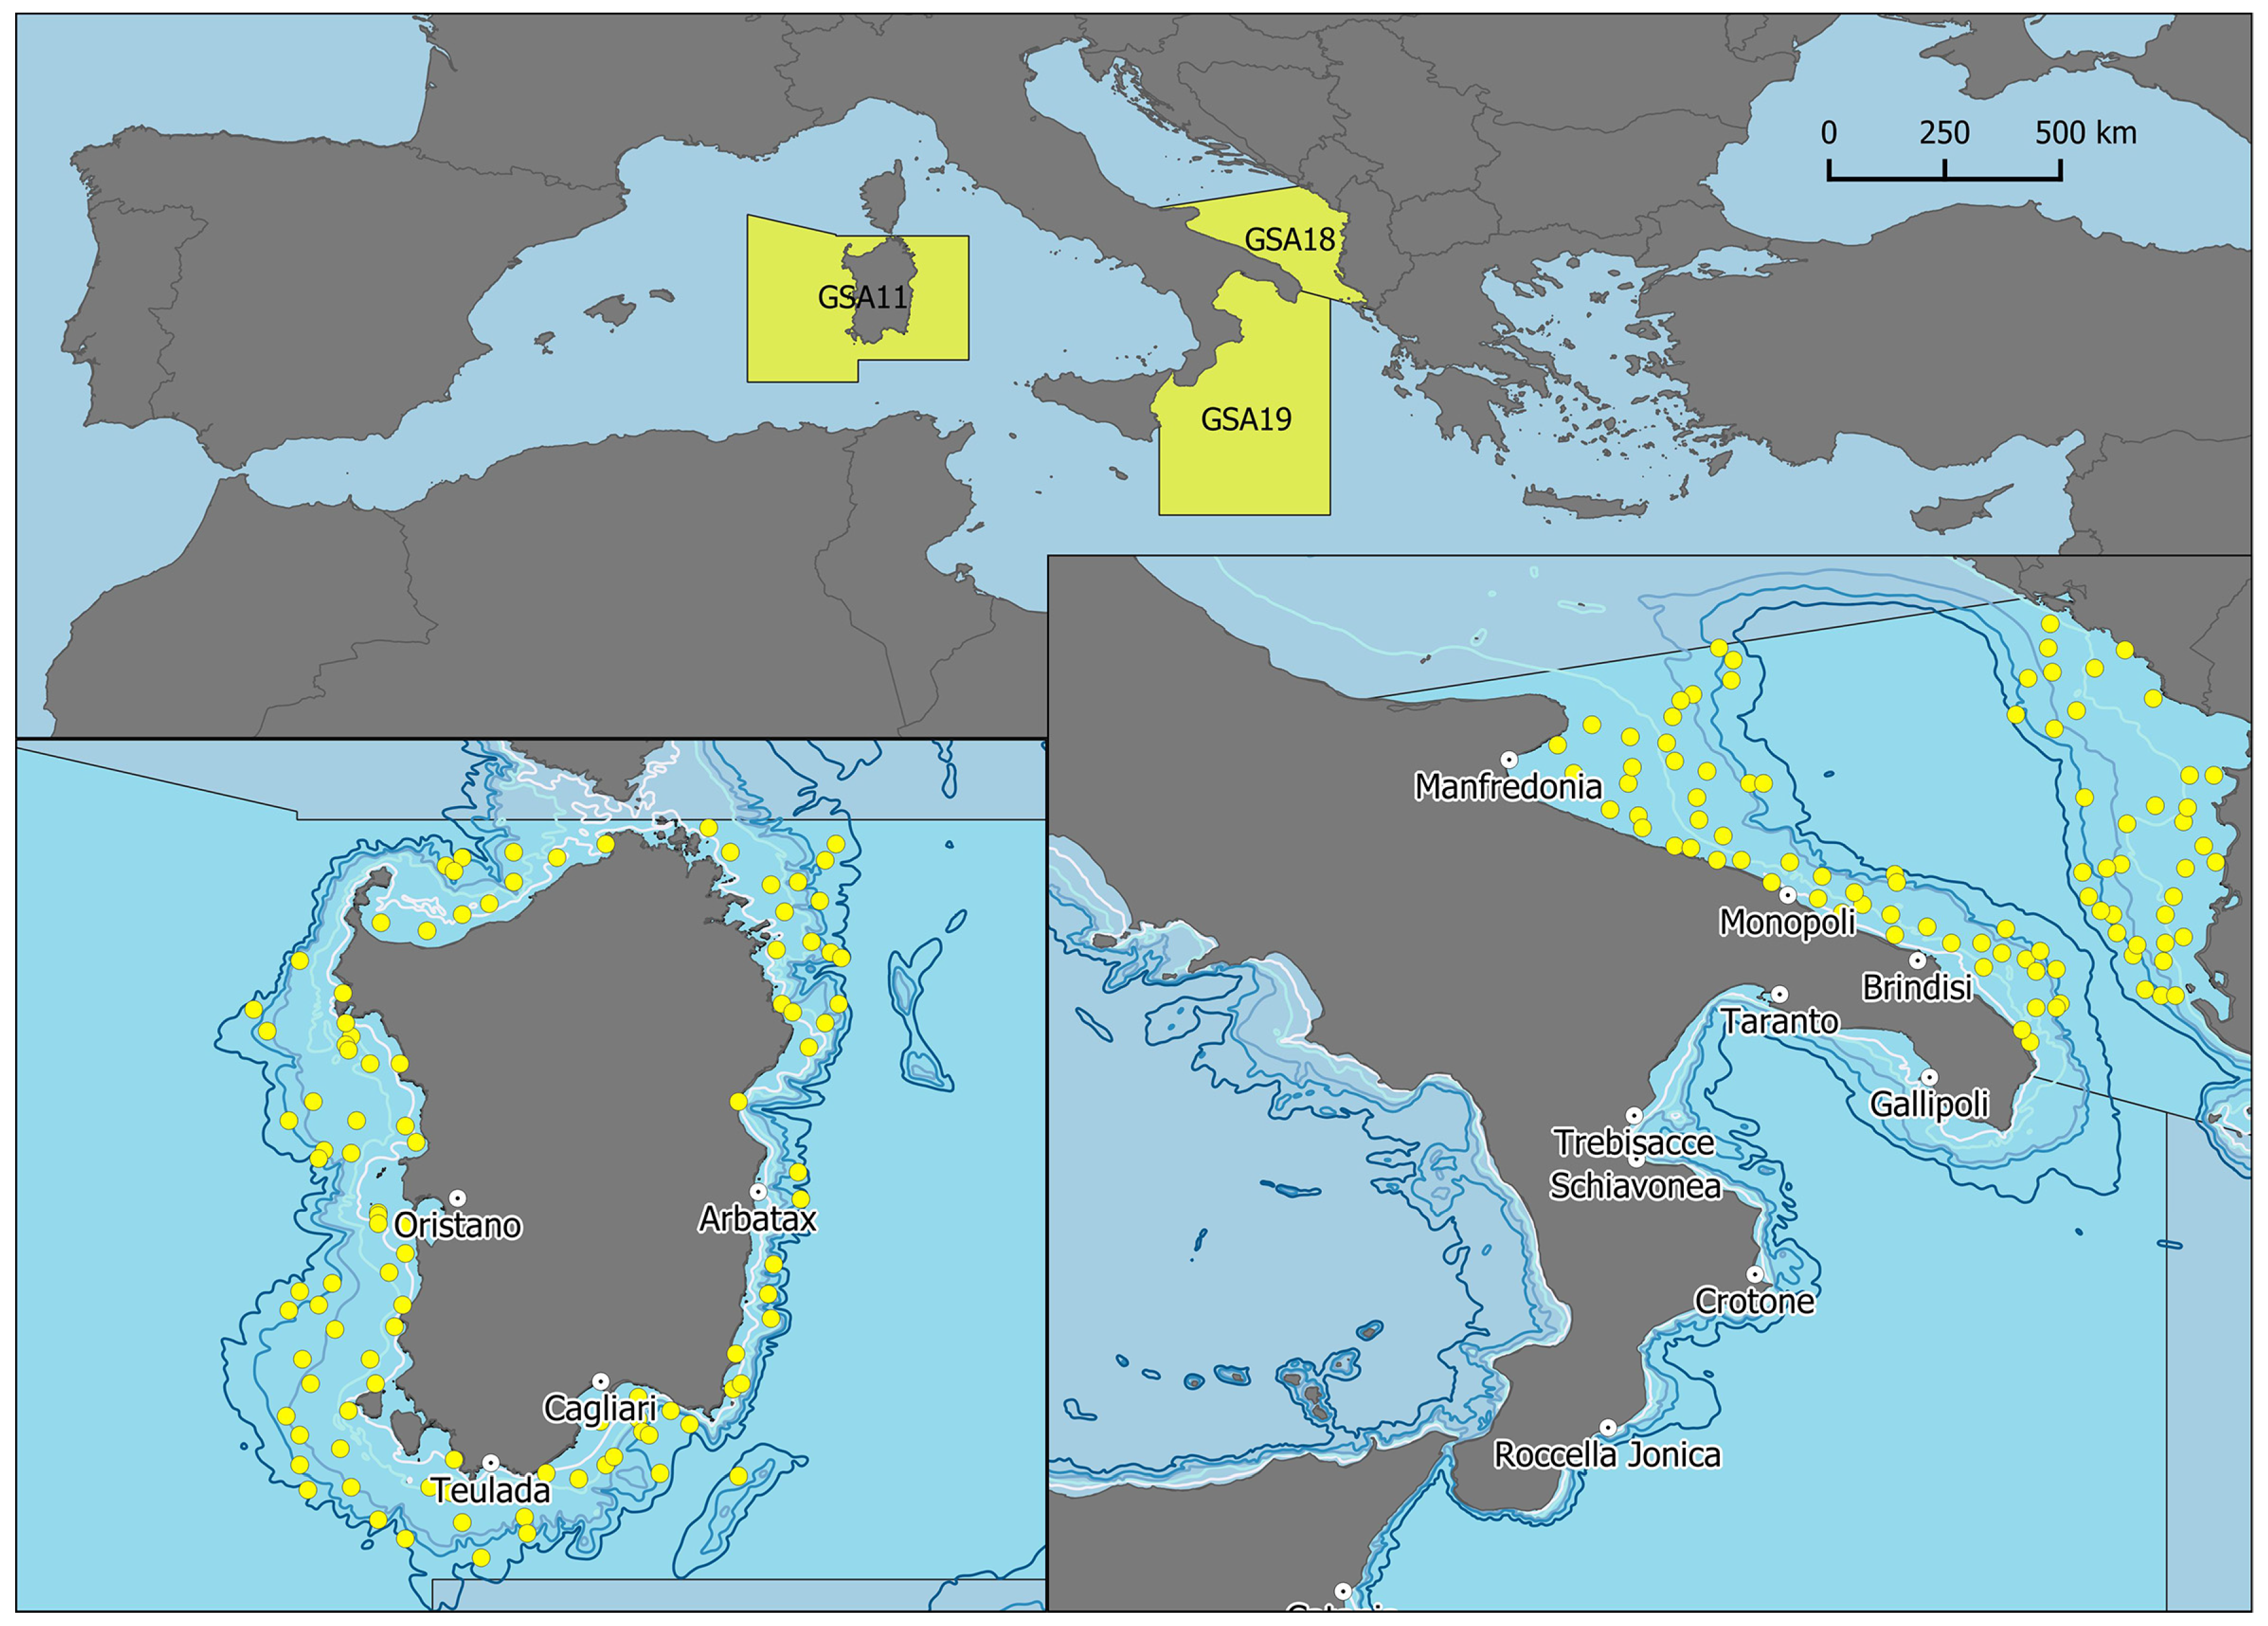
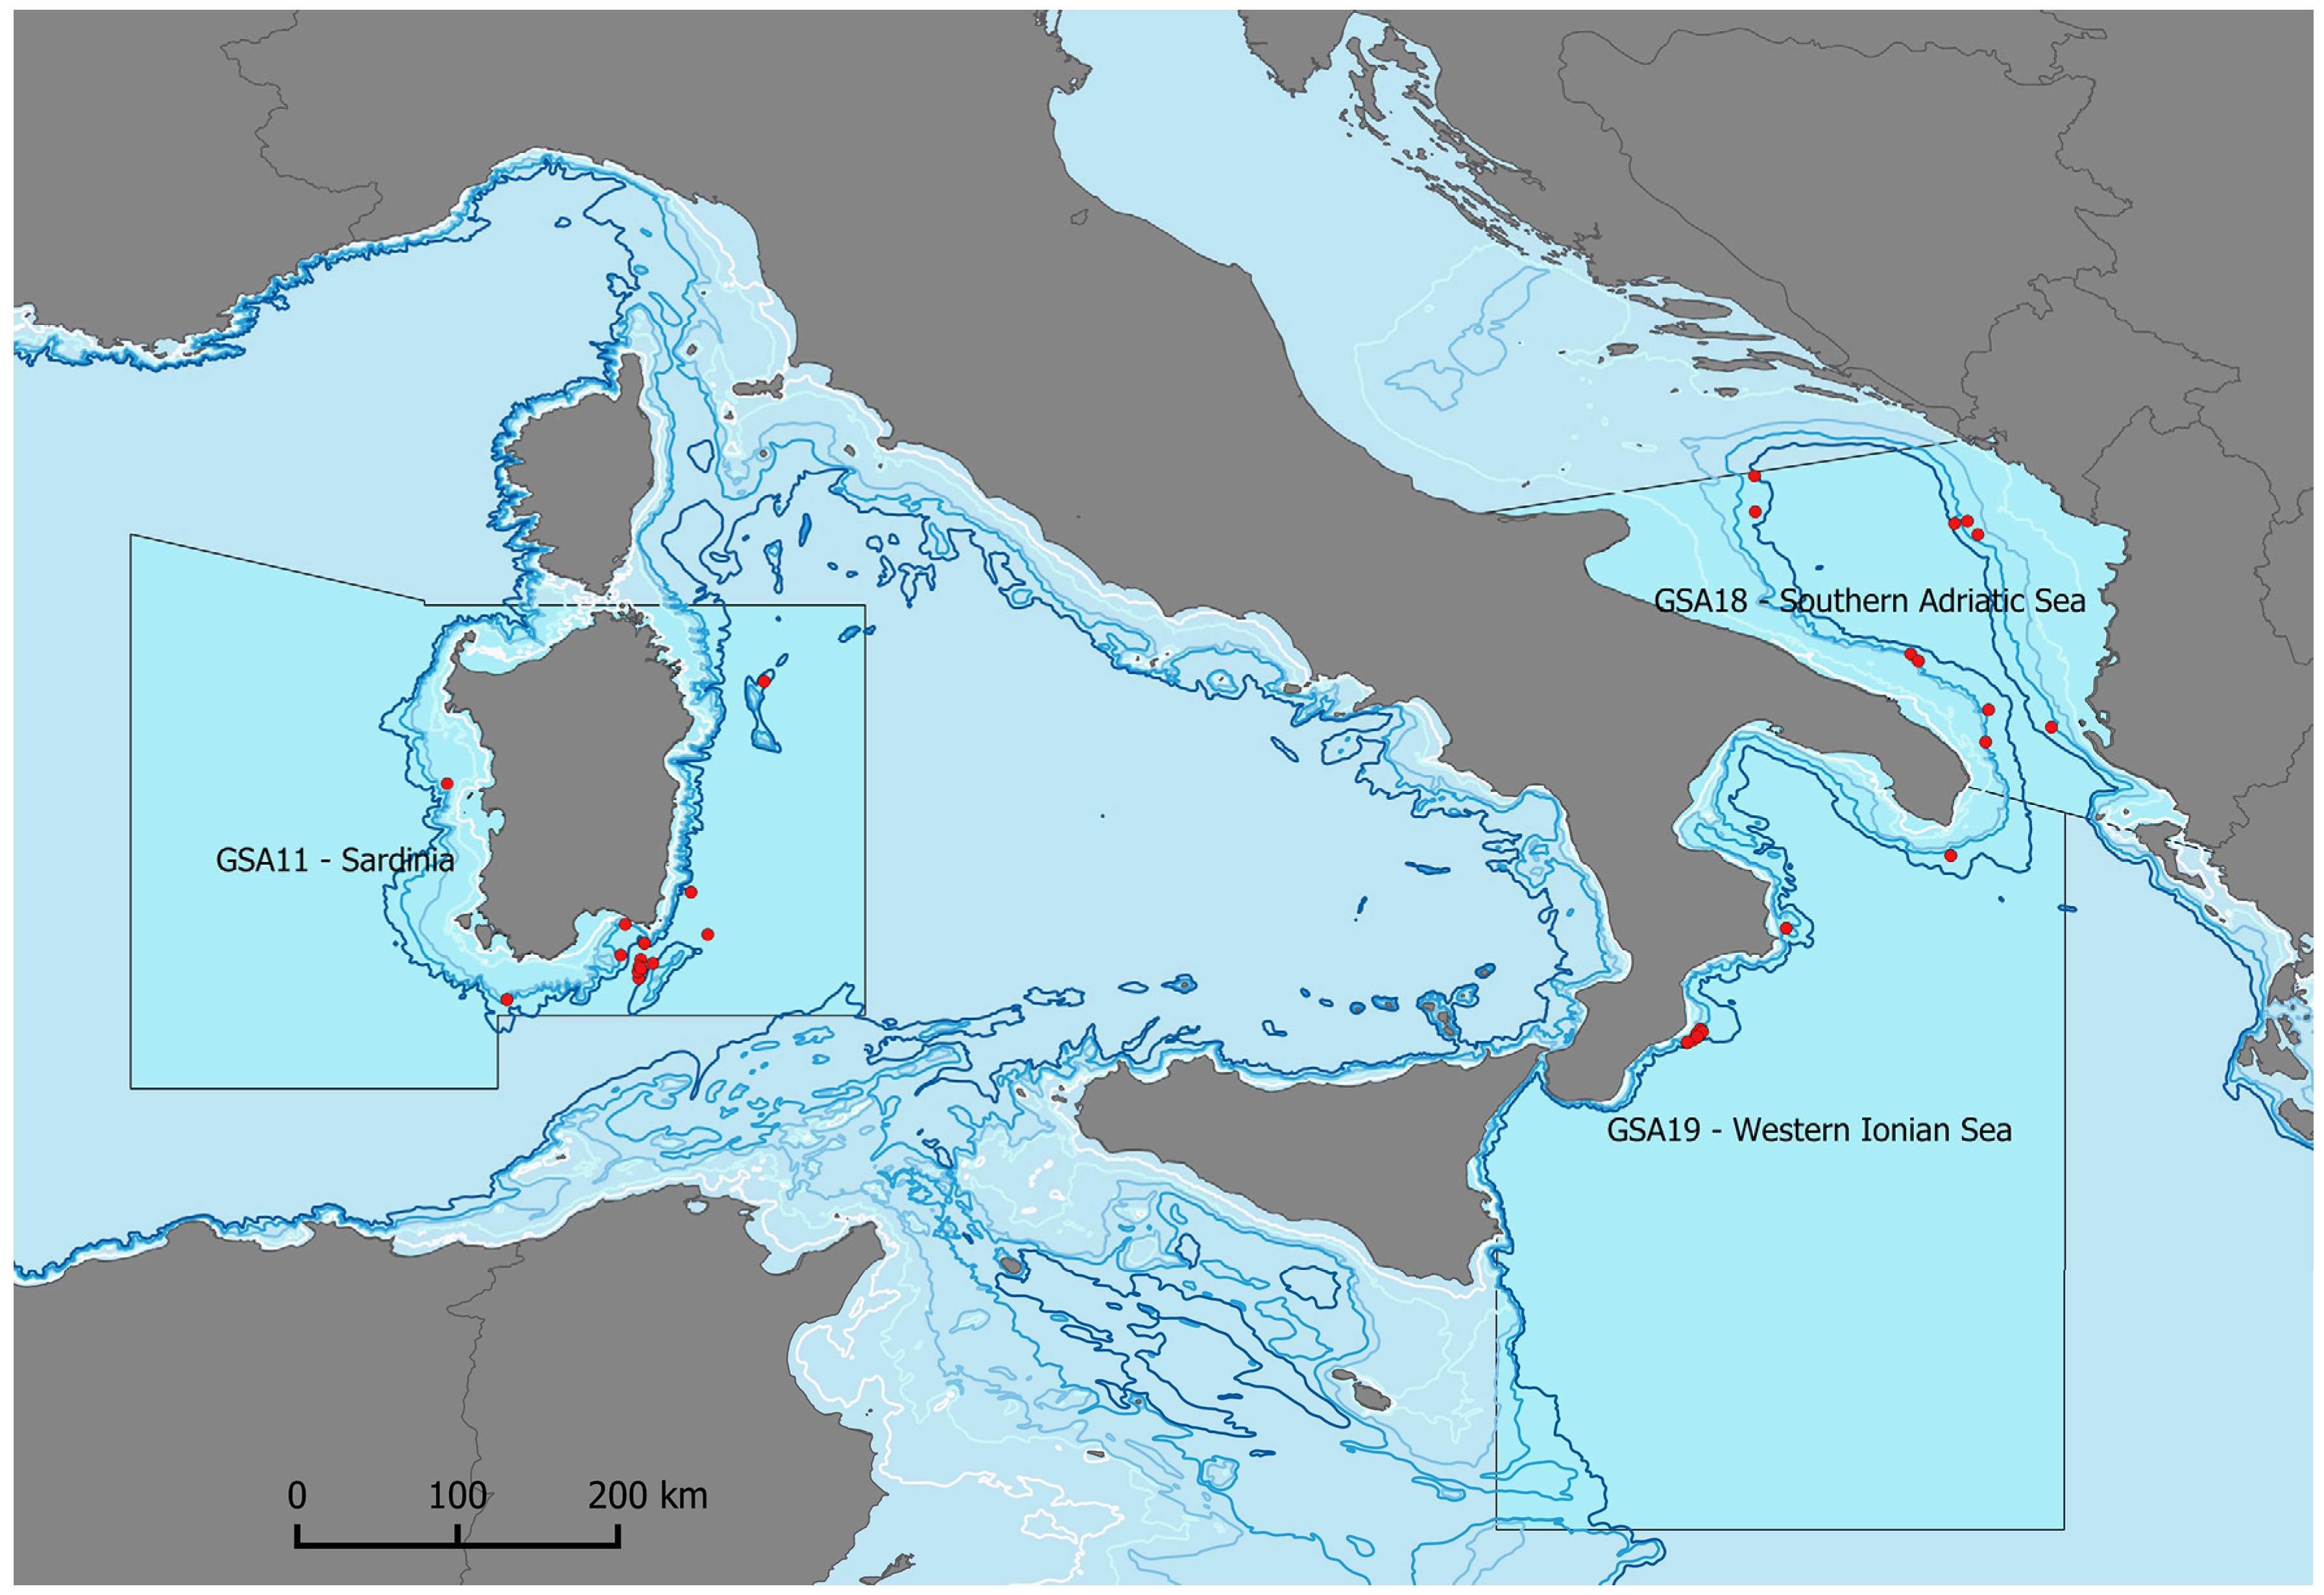
2. Materials and Methods
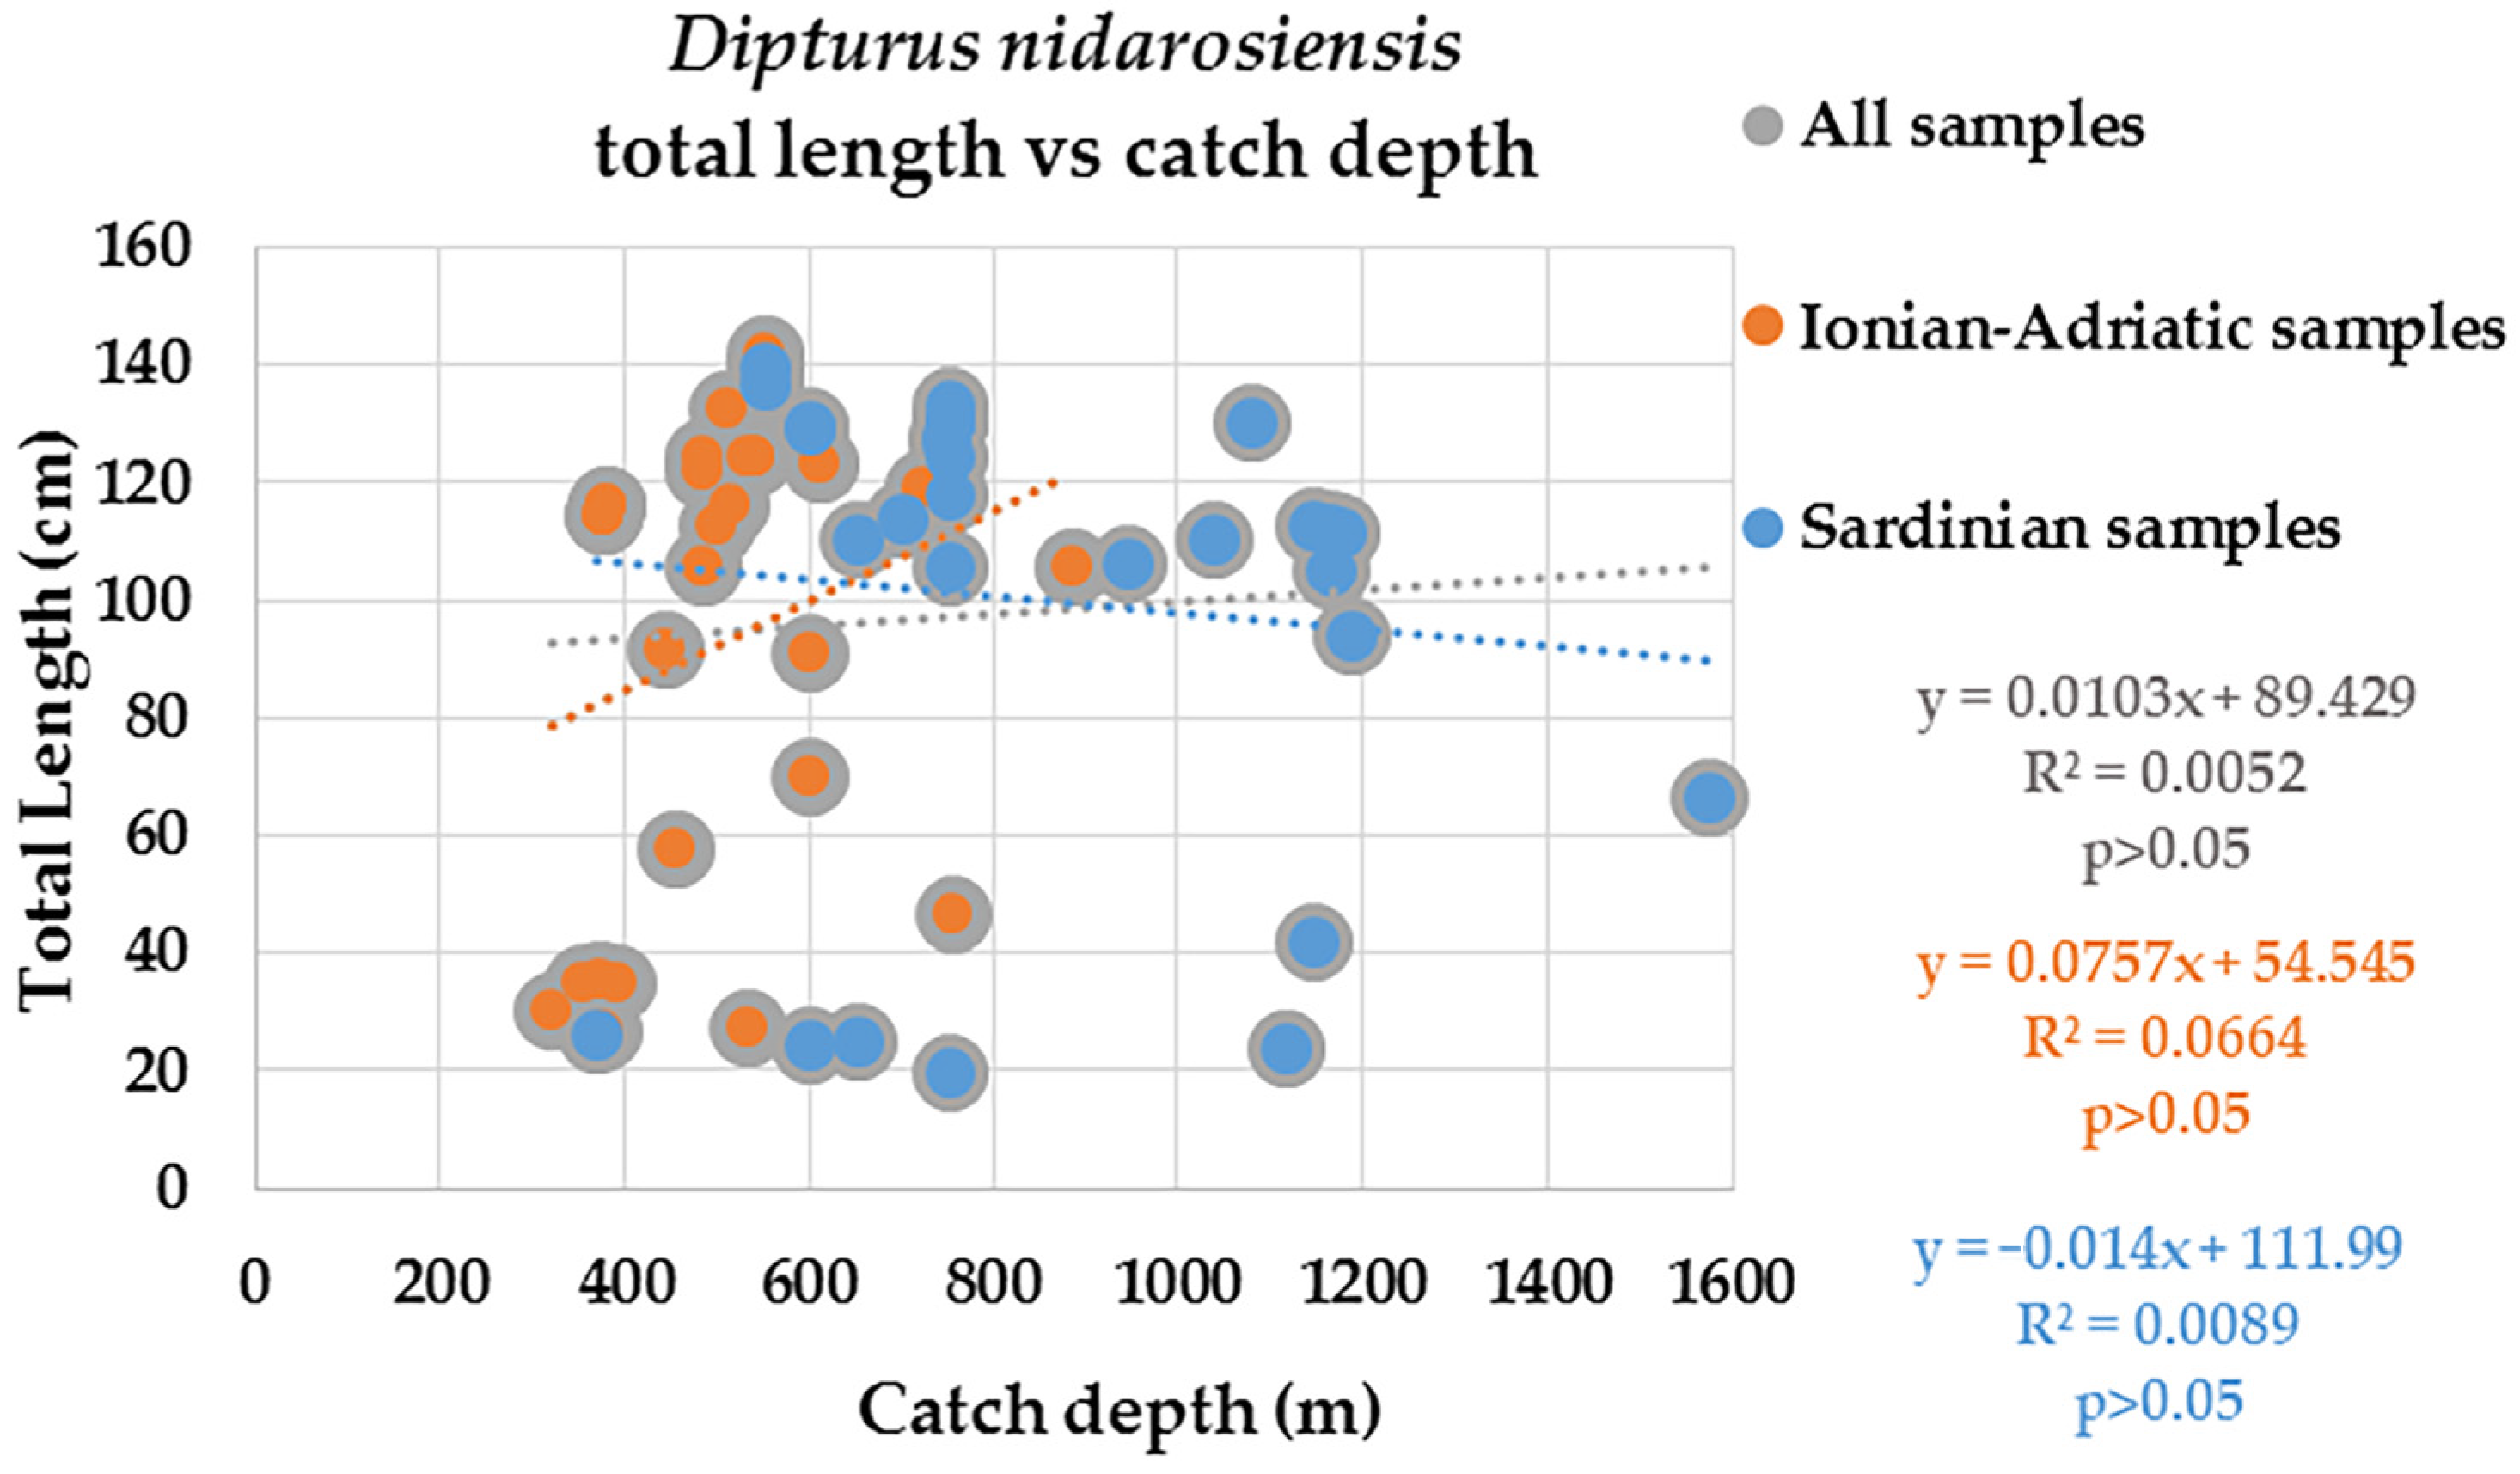
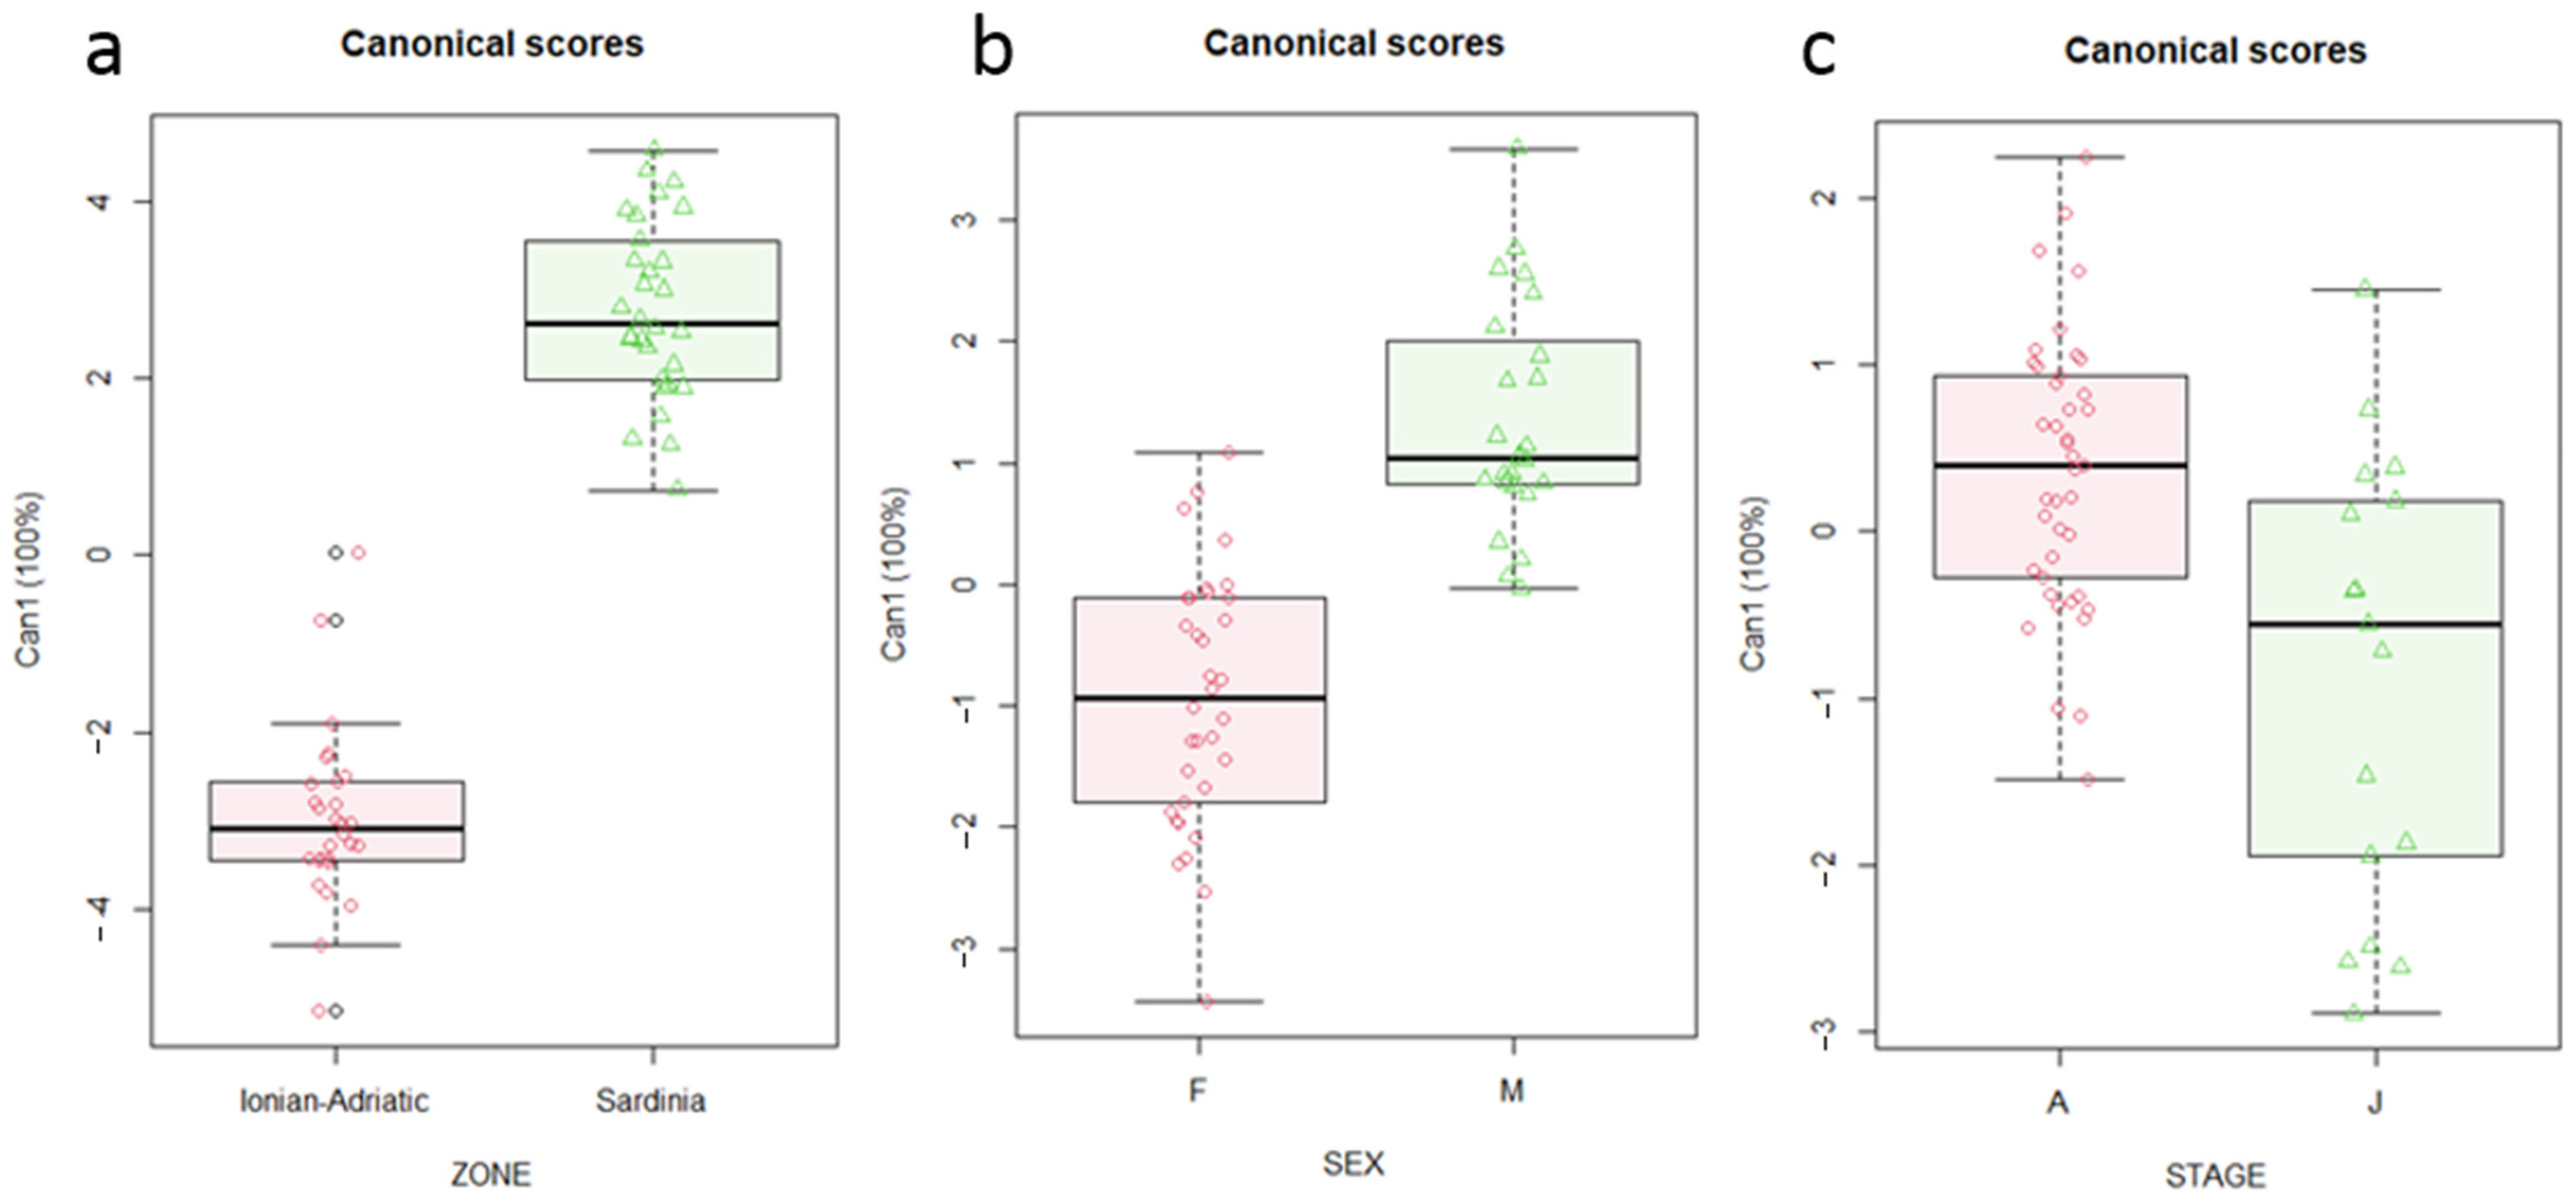
The Norwegian skate specimens were collected from the fishery (landing and discard) monitoring program (Data Collection Framework EU Regulation 1004/2017) and from scientific trawl survey (Mediterranean International Trawl Survey—MEDITS) [42].
The sampling area includes the Sardinia Waters (Geographical Sub-Area (GSA) 11; GSA sensu General Fisheries Commission for the Mediterranean (GFCM)) by DCF and MEDITS survey, South Adriatic Sea (GSA 18) by DCF and MEDITS survey and North-West Ionian Sea (GSA19) by DCF (Figure 1). Thus, all specimens either came from the landing, discard or catches during MEDITS survey, or from experimental deep-sea trawl fishing campaign organized in GSA 11 by the University of Cagliari.
Morphometric measurements (MM) and total weight (TW) were recorded following [43] to the nearest 0.1 cm and 1 g, respectively. In total, 28 measurements (Figure 2) were taken: total length (TL), disc width (DW), disc length (DL), snout-max width (SMW), snout length (preorbital) (SLPOR), Eyeball length (EBL), orbit diameter (OD), orbit and spiracle length (OSL) spiracle length (SL), distance between orbits (DBOR), distance between spiracles (DBS), distance snout-cloaca (DSC), tail length at 1st dorsal fin (C2DF1), tail length at 2nd dorsal fin (C2DF2), tail length between the posterior margin of the cloaca and caudal tip (C2CT), snout length (pre jaw) (SLPJ), pre-nasal length (PL), mouth width (MW), distance between nostrils (DBN), 1st gill opening width (GOW1), 5th gill opening width (GOW2), distance between first gill slit (DB1GS), distance between fifth gill slit (DB2GS), first dorsal fin base–length (D1BL), first dorsal fin height (D1H), first dorsal fin origin to caudal fin tip (D1), second dorsal fin origin to caudal fin tip (D2), distance between first and second dorsal fin inter-dorsal distance (ID).
Moreover, sex and maturity stage were determined macroscopically, in particular, gonadal maturity was classified using the MEDITS maturity scale [44,45]. The MEDITS maturity scale includes the following maturity stages: 1 (virgin immature); 2 (maturing); 3A (mature); 3B (mature/extruding active); 4A (resting); 4B (regenerating). In order to classify the specimen following the life stage (juveniles and adult), the specimens with maturity stage 1 and 2 were classified as juveniles and 3A, 3B, 4A and 4B as adult [13,45].
In addition, data on the capture of each specimen were collected, such as: date, geographical coordinates and capture depth.
The linear relationship between the TL and each 27 MM were calculated and tested using the analysis of variance for regression. In addition, the TL-TW relationship was calculated by area with the following power equation
TW = a TLb
where a is the intercept and b is the regression coefficient [46].
The Canonical Discriminant Analysis (CDA) was used to verify if the groups subdivided by the areas of origin (Sardinia, Ionian-Adriatic), sexes (males and females) and life stages (juveniles, adults) were significantly different and which morphological indices were most important in the specimen segregation. The canonical scores of individuals were projected in the reduced space of the canonical axes of the CDA with the variables mostly contributing to the morphological differences in the body shape of analyzed groups [47].
Linear discriminant analyses (LDA) [48] was used to test the morphological discontinuities in the groups in which significant differences were identified. Its purpose is to predict the membership of individuals to predefined classes (e.g., origin area, sex, life stage) by building discriminant linear axes maximizing the standard deviation between groups, while minimizing it within groups [48].
To avoid the possible biases produced by the effect of body size in the CDA and LDA all MM, which showed a significant linear relationship with TL, were standardized as following [49]:
Mst = M × (LTs/LT)b
where, Mst is measurement standardized, M is the original measurement, LTs is the mean of the total length of all fish samples, LT is the Total Length of the fish, and b is estimated for each character from the observed data as the slope of the regression of log M on log LT using all fish sampled.
A correlation analysis (CA) was performed (linear correlation models) in order to select the MM mutually not correlated each other. The relationship between morphometric variables was evaluated by mean of the absolute value of Pearson’s correlation coefficient (r) and using a threshold of |0.5| to determinate the correlation between the MM [50]. In order to retain the highest possible number of MM in the analysis, an iterative selection process was used to reject the variables showing the highest number of correlations with the other MM.
The CDA and the LDA were carried out with the new set of retained variable without autocorrelations in order to assess the differences in the analysis responses.
Some authors hypothesized a size segregation for the Norwegian skate [6,13]. Thus, the linear relationships between the TL and catch depth was tested by mean of the analysis of variance.

3. Results

In total 58 Norwegian skates were caught: 30 in the GSA 11 and 28 in GSA 18–19 (Figure 3). In GSA 11 and in the GSA 18–19 the TL of the specimens sampled were included between 20.2–139.9 and 26.8–142.2 cm respectively.
The Norwegian skates catches in GSA11 were concentrated in southern part of Sardinia, while in the Adriatic-Ionian Sea around the Bari pit and in north and central part of GSA 19. The minimum and maximum depth catch of D. nidarosiensis were: 370 and 1573 m for the GSA 11 and 320–885 m for GSA 18–19.
The linear regression between specimens TL and depth of capture did not show any significant relationship (p > 0.05) both in the GSA 11 and GSA 18–19 samples separately and all samples grouped together (Figure 4). The skates did not show a depth segregation per size.
The linear relationship equations and coefficients estimated between TL and each MM and the relative R2 values are reported in the Table 1 for all samples together and for the samples from Sardinia and Ionian-Adriatic area. In Table 1 the length weight relationships are also reported.
The Canonical Distribution analysis (Figure 5) showed that, among the tested assemblages, only the specimen’s area of origin (Sardinia vs. Ionian-Adriatic) produces significant different groups (p < 0.05). While individuals grouped by sex and life stage did not produce any significantly different groups (p > 0.05).
Moreover, CDA (Figure 6) shows in the case of origin area of specimens the MM which give a more contribute (score |>0.4|) to the significant segregation of groups are: D1BL (first dorsal fin base–length), ID (distance between first and second dorsal fin interdorsal distance), SL (Spiracle length), DBN (Distance between nostrils), DBS (Distance between spiracles), SMW (Snout-max width).
The results of LDA for the specimens grouped by areas are showed in the Table 2 and they revealed that 93.1% of samples are correctly classified in term of origin area.
The results of CA are reported in the Figure 7, following the selection criteria among the 27 MM tested the subsequent MM SMW, EBL, OSL, DBOR, DBS, PL, MW, GOW2, DBSGS, D1H, D2 and ID were considered in the CDA and LDA.
CDA confirms that the only assemblage that produced significantly different (p < 0.05) groups (Sardinia vs. Ionian-Adriatic) was the area (Figure 8a). While the assemblages by sex (male vs. female) (Figure 8b) and vital stage (juvenile vs. adult) (Figure 8c) did not produce significantly different groups (p > 0.05).
The results of LDA for the specimens grouped by areas are showed in the Table 3 and in the case of selected MM a lower number of samples are correctly classified in term of origin area (89.7%) in comparison to the LDA carried out on all MM.
On the bases of the CDA and LDA results that show a significant difference between the origin area assemblages, the differences between sexes (male and female) and life stages (juveniles and adult) assemblages were tested within each area (Sardinia and Adriatic-Ionian). A correlation analysis (CA) was performed (linear correlation models) in order to select the MM mutually not correlated each other in each sampling area (Sardinia and Adriatic-Ionian).
The results of CA for each area are reported in the Figure 9 (A: Adriatic-Ionian; B: Sardinia). Among the 27 morphometric measurements tested are selected 13 MM for the Adriatic-Ionian (DL, OSL, SL, DBOR, SLPJ, PL, DBN, GOW2, DB5GS, D1BL, D1H, D2, and ID) and 12 MM for the Sardinia (SMW, EBL, OSL, SL, DBS, C2DF2, DB1GS, DB5GS, D1BL, D1H, D2 and ID).
The Canonical Distribution analysis (Figure 10 and Figure 11) showed that, neither of the tested assemblages’ sex (Female and Male) and life stage (Adult and Juvenile) for each area of origin is significantly different (p > 0.05).

4. Discussion

The catch depth of the D. nidarosiensis here found in both explored areas, is in accordance with the bathymetric distribution reported for this species both in Mediterranean [5,9,11,13] and Atlantic coasts [30,51]. Indeed, the Norwegian skate is a species typically found from the slope to a depths > 1500 m. Some authors hypothesized a size segregation with juveniles living in shallower (slope) waters and adults in deep waters (bathyal) [6,13]. However, this particular bathymetric pattern seemed to be present in none of the two areas analyzed in the present study, furthermore, not even the data combined for both areas seemed to support this hypothesis. Indeed, in the study areas juvenile and adult were caught both in slope and deeper water. However, it should be emphasized that it was not possible, due to the low the sample numbers and season coverage, to test the hypothesis that adults can migrate during the reproductive period [6]. Certainly, if this hypothesis was true, it could mask a certain depth segregation by life stages or by sex.
The geographical distribution here reported confirms the presence of the Norway skate in Sardinian waters in the southernmost part of the Island. Nonetheless, on the other one hand, the catch of a specimens in northeast and of another on the western coasts of Sardinia, reported here for the first time, returns a more precise picture of the real distribution of this species around the island, in this regards, future samplings could confirm a much wider distribution than what is known so far [5,6,7,8,9,10,11,38]. Indeed, the scarcity of catches in the western part of Sardinia could be due to a lower pressure of deep fishing targeting red shrimps (A. foliacea and A. antennatus) [52] in the area, resulting in fewer opportunities to catch a species with such a deep distribution as that of D. nidarosiensis. Considering also that most of the catches in GSA 11 came from an experimental deep-sea trawl fishing campaign (800–1700 m) organized by the University of Cagliari, other hypotheses in terms of habitat differences than the mere possibility of capture should also be investigated. In this regard, a continuous monitoring of the catch of both fishery depending (landing and discard) and independent (scientific trawl survey) should be endorsed in order to fill the gaps in distribution knowledge on this species and other deep-sea elasmobranchs [38].
Concerning the Ionian and Adriatic area, the geographical distribution of D. nidarosiensis here reported includes the area around the Bari’s pit and Otranto’s Chanel in GSA18 and the northern part of GSA 19 already reported in [13], moreover new catch locations in central (off Crotone) and southern part (off Rocella) of Western Ionian Sea. Both these new catch locations belong to the local red shrimps fishing ground [53]. Indeed, deep-sea fisheries targeting the red shrimp species are recognized as the main source of rays by-catches [54]. D. nidarosiensis in the GSA 18–19 were captured around the Bari Pit (maximum depth 1233 m) in an area connected with the Ionian through the Otranto channel and which is part of a wider system of currents that exchange and mix the deep waters from the eastern Mediterranean until the northern Adriatic [55,56]. In the southern Adriatic and Ionian Sea the bathyal zone seems charcacterized by an absence of gene flow barriers as well as it was demonstrated for another deep species: A. antennatus [57]. Indeed, in the case of A. antennatus the continuous movements of individuals from deeper grounds to upper areas [58] was recognized, among the other reasons, as explanatory reasons which determined the absence of genetic barriers throughout the Adriatic and Ionian areas [57]. In consideration of the above, the reproductive movements on D. nidarosiensis from the bathyal zone towards the slope suggested by [6] could indicate that the Adriatic and Ionian specimens are part of the same population [13].
However, it is important to point out that the depth of the main fishing activity only partially overlaps the deep distribution of the Norwegian skate. Moreover, in the sites where Norwegian skate specimens were found in Mediterranean, the sea bottom is mainly characterized by canyons, steep ground and slopes of high depths which are unfavorable to the trawling activity [59]. Therefore, it is foreseeable that in the near future there may be new reports of this species in other areas than those already reported in recent [13,15,38].
On the bases of the morphological analysis results the only assemblage where the groups show significant differences is the samples origin area (Sardinia and Ionian-Adriatic). While assemblages by sex (males and females) and life stages (juveniles and adult) did not show any significant differences.
The fact that our analysis failed in finding morphological assemblages by sex could appear strange considering that the most common characteristic of sexual dimorphism is the body size/shape as a result of several factors including food competition or reproductive process energy investment [60]. Morphological dimorphism can also include body shape in this regard a better knowledge of these aspects serves to better understand the ecology and biology of skate species in general [61,62] and in particular for a little-known species such as D. nidarosiensis [3]. Martinez and coauthors [62] analysing the shape of pectoral fin found the existence of sexual dimorphism in 131 species belonging to 33 genera, including Dipturus. Although morphological dimorphism is very common among ray its changes in term of consistence and magnitude among the skate species [62,63,64]. Moreover, [62] found that among the species belonging to the Dipturus genera (not D. nidarosiensis) showed a lower dimorphism level. In this regard, the absence of dimorphism found among the 27 MM analysed in this study for Norwegian skate could be attributable to the variability of sexual dimorphism between species and populations especially for a genus for which this character is not a typifying trait [62]. Additionally, in the case of analysis carried out for each sampling area the assemblage driven by sex seems not to be significantly different.
In many ray species the gonads growth and maturation caused several skeletal and body shape changes [62,65], starting to the clasper growing [66]. However, on the bases of this study results, the 27 considered MM were not able to define significant differences in morphology between the immature and adult specimens of D. nidarorsiensis, both in the analysis carried out on the entire data set and on the data analyzed by each sampling area. Nevertheless, these results cannot exclude that some other morphological measurements the difference between juveniles and adult could be significant. Indeed both [12,13] hypothesized a greater tail length in proportion to total length in juveniles than in adults. The sample size of the abovementioned studies was limited to only 8 specimens, thus this aspect should be better investigated with a higher samples availability coming from a wider area.
The analysis (CDA and LDA) on the origin area assemblages shows that the Sardinia specimens are significant different from those coming from Ionian-Adriatic at least on base of the 27 MM taken in consideration here. The CDA and LDA are often used to identify morphological differences among fish population e.g., [31,63,67], indeed it has been known that genetic and environmental factors, as well as their interaction can influence the morphological characteristics of fishes [68]. The effect of environmental factors, including for example temperature, salinity or food availability, can potentially determine morphometric differentiations of fishes [69,70]. Nonetheless, morphometric variation is not always totally based on genetic differences. Indeed, the phenotype variability may not reflect the population differentiation at the molecular level [39,71] and several studies have proved its relation with environmental factors including for example temperature, salinity, habitat and substrate types [32,72,73,74]. Nonetheless, morphometric variations are still considered an important tool to characterize and identify different populations [33,75,76,77].
Therefore, taking into account on one hand, that fish morphological characteristics can show high plasticity in response to different environmental conditions [78], and on the other that it is well known that skates generally show low dispersal ability [79,80], the presence of two morphologically distinct populations of Norwegian skate in the Mediterranean basin seems to constitute a robust hypothesis. Moreover, this morphological differentiation could be evidence that the presence of D. nidarosiensis in the Mediterranean is not relatively recent [13], indeed the environmental selection had the time [77,81] to produce two morphologically distinct populations.
From a genetic point of view, the Atlantic and Mediterranean populations seem to have a low level of differentiation [38], but this result is not necessarily in contrast with the presence of different phenotypes in the Mediterranean [39,71]. Our results, however, cannot determine whether the observed differences in body shape among populations is due to phenotypic plasticity, genetic differentiation, or a combination of both. Future studies could determine whether the observed morphological differences among populations have a genetic basis. Likewise, future molecular work on D. nidarosiensis could also assess genetic differentiation, gene flow, and population interconnectedness [5,7,13,38].
The morphometric parameters that seem to mainly contribute to the definition of two morphotypes of Norwegian skate in the Mediterranean are those related to the shape of the tail (D1BL and ID) and to the anterior part (nostrils DBN, spiracles DBS-SL and width of the head SMW) of the body. The tail in Batoids species is well known not to be involved in propulsion, but rather in the balance of swimming as well as support of electric organs [82], spines or thorns. Thus, the tail seems directly or indirectly linked with predator activity of skate as well as the head portion of body. Indeed, Capapè and coauthors [82] found that thornback rays specimens with tail shape anomaly showed a lower relative weight in comparison of the specimens with normally shaped tail. Definitely, predation has received much attention in morphometric studies, because it has been recognized as an important selective pressure factor on fish body shape [75,83,84,85,86,87]. Thus, further study on the feeding behavior will be able to determine if these morphological differences are also linked to a different diet of these two Mediterranean population of D. nidarosiensis.

Author Contributions

Conceptualization, P.C. and M.C.F.; methodology, P.C., A.B., W.Z.; software, P.C., A.B., W.Z.; formal analysis, P.C., A.B., W.Z., M.D., P.G., C.N.; investigation, P.C., A.B., W.Z., M.D., P.G., C.N.; data curation, P.C., A.B., W.Z.; writing—original draft preparation, P.C.; writing—review and editing, P.C., A.B., M.C.F.; supervision, P.C., M.C.F. All authors have read and agreed to the published version of the manuscript.

Funding

The samples were collected within the Data Collection Framework supported by the Italian Ministry of Agriculture, Food and Forestry Policy (MiPAAF) and by the European Commission (EU Reg. 1004/2017).

Institutional Review Board Statement

All Norwegian skate (Dipturus nidarosiensis) collected in this study come either from commercial fishing monitoring or from authorized bottom survey (DCF; EU Reg. 1004/2017). All the specimens sampled in this study were already dead at the time of sampling both the specimens sampled at the landing and on board (discard monitoring and scientific survey when the specimens brought on-board).

Informed Consent Statement

Not applicable.

Data Availability Statement

The data presented in this study are available from the corresponding author on request.

Conflicts of Interest

The authors declare no conflict of interest.

References

  1. Stehmann, M. Rajidae. In Check-List of the Fishes of the Eastern Tropical Atlantic; Quero, J.C., Hureau, J.C., Karrer, C., Post, A., Saldanha, L., Eds.; Junta Nacional de Investigacao Cientifica e Tecnológica: Lisbon, Portugal, 1990; Volume 1, pp. 29–50. [Google Scholar]
  2. Stehmann, M.; Bürkel, D.L. Rajidae. In Fishes of the Northeastern Atlantic and Mediterranean; Whitehead, P.J., Bauchot, M.L., Hureau, J.C., Tortonese, E., Eds.; Unesco: Paris, France, 1984; pp. 163–196. [Google Scholar]
  3. Priede, I.; Godbold, J.A.; King, N.J.; Collins, M.A.; Baile, Y.D.M.; Gordon, J.D.M. Deep-sea demersal fish species richness in the Porcupine Seabight, NE Atlantic Ocean: Global and regional patterns. Mar. Ecol. 2010, 31, 247–260. [Google Scholar] [CrossRef]
  4. Rodríguez-Cabello, C.; Pérez, M.; Sánchez, F. New records of chondrichthyans species caught in the Cantabrian Sea (southern Bay of Biscay). J. Mar. Biolog. Assoc. 2013, 93, 1929–1939. [Google Scholar] [CrossRef]
  5. Cannas, R.; Follesa, M.C.; Cabiddu, S.; Porcu, C.; Salvadori, S.; Iglesias, S.P.; Deiana, A.M.; Cau, A. Molecular and morphological evidence of the occurrence of the Norwegian skate Dipturus nidarosiensis in the Mediterranean Sea. Mar. Biol. Res. 2010, 6, 341–350. [Google Scholar] [CrossRef]
  6. Follesa, M.C.; Cannas, R.; Cabiddu, S.; Cau, A.; Mulas, A.; Porcu, C.; Cau, A. Preliminary observations of the reproductive biology and diet for the Norwegian skate Dipturus nidarosiensis (Rajidae) from the Central Western Mediterranean Sea. Cybium 2012, 36, 473–477. [Google Scholar]
  7. Cariani, A.; Messinetti, S.; Ferrari, A.; Arculeo, M.; Bonello, J.J.; Bonnici, L.; Cannas, R.; Carbonara, P.; Cau, A.; Charilaou, C.; et al. Improving the Conservation of Mediterranean Chondrichthyans: The ELASMOMED DNA Barcode Reference Library. PLoS ONE 2017, 12, 170244. [Google Scholar] [CrossRef]
  8. Marongiu, M.F.; Porcu, C.; Bellodi, A.; Cannas, R.; Cau, A.; Cuccu, D.; Mulas, A.; Follesa, M.C. Temporal dynamics of demersal chondrichthyan species in the central western Mediterranean Sea: The case study in Sardinia Island. Fish. Res. 2017, 193, 81–94. [Google Scholar] [CrossRef]
  9. Porcu, C.; Marongiu, M.F.; Bellodi, A.; Cannas, R.; Cau, A.; Melis, R.; Mulas, A.; Soldovilla, G.; Vacca, L.; Follesa, M.C. Morphological descriptions of the eggcases of skates (Rajidae) from the central-western Mediterranean, with notes on their distribution. Helgol. Mar. Res. 2017, 71, 10. [Google Scholar] [CrossRef] [Green Version]
  10. Porcu, C.; Marongiu, M.F.; Olita, A.; Bellodi, A.; Cannas, R.; Carbonara, P.; Cau, A.; Mulas, A.; Pesci, P.; Follesa, M.C. The demersal bathyal fish assemblage of the Central-Western Mediterranean: Depth distribution, sexual maturation and reproduction. Deep-Sea Res. I Oceanogr. Res. Pap. 2020, 166, 103394. [Google Scholar] [CrossRef]
  11. Mulas, A.; Bellodi, A.; Carbonara, P.; Cau, A.; Marongiu, M.F.; Pesci, P.; Porcu, C.; Follesa, M.C. Bio-Ecological Features Update on Eleven Rare Cartilaginous Fish in the Central-Western Mediterranean Sea as a Contribution for Their Conservation. Life 2021, 11, 871. [Google Scholar] [CrossRef] [PubMed]
  12. Ramírez-Amaro, S.; Ordines, F.; Puerto, M.Á.; García, C.; Ramon, C.; Terrasa, B.; Massutí, E. New morphological and molecular evidence confirm the presence of the Norwegian skate Dipturus nidarosiensis (Storm, 1881) in the Mediterranean Sea and extend its distribution to the western basin. Mediterr. Mar. Scie. 2017, 18, 251–259. [Google Scholar] [CrossRef] [Green Version]
  13. Carbonara, P.; Cannas, R.; Donnaloia, M.; Melis, R.; Porcu, C.; Spedicato, M.T.; Zupa, W.; Follesa, M.C. On the presence of Dipturus nidarosiensis (Storm, 1881) in the Central Mediterranean area. PeerJ 2019, 7, 7009. [Google Scholar] [CrossRef] [Green Version]
  14. Isajlović, I.; Dulčić, J.; Piccinetti, C.; Vrgoč, N.; Manfredi, C.; Dragičević, B. Additional records of Norwegian skate Dipturus nidarosiensis (Storm, 1881) (Pisces: Rajidae) in the Adriatic Sea. Acta Adriat. 2020, 61, 217–222. [Google Scholar] [CrossRef]
  15. Geraci, M.L.; Di Lorenzo, M.; Falsone, F.; Scannella, D.; Di Maio, F.; Colloca, F.; Vitale, S.; Serena, F. The occurrence of norwegian skate, Dipturus nidarosiensis (Elasmobranchii: Rajiformes: Rajidae), in the Strait of Sicily, Central Mediterranean. Acta Ichthyol. Piscat. 2019, 49, 202–208. [Google Scholar] [CrossRef] [Green Version]
  16. Follesa, M.C.; Porcu, C.; Mulas, A.; Deiana, A.M.; Cau, A. Deep-water fish assemblages in the central-western Mediterranean (south Sardinian deepwaters). J. Appl. Ichthyol. 2011, 27, 129–135. [Google Scholar] [CrossRef]
  17. Iglesias, S.P.; Toulhoat, L.; Sellos, D.Y. Taxonomic confusion and market mislabeling of threatened skates: Important consequences for their conservation status. Aquat. Conserv. 2010, 20, 319–333. [Google Scholar] [CrossRef]
  18. Griffiths, A.M.; Sims, D.W.; Cotterell, S.P.; El Nagar, A.; Ellis, J.R.; Lynghammar, A.; McHugh, M.; Neat, F.C.; Pade, N.G.; Queiroz, N.; et al. Molecular markers reveal spatially segregated cryptic species in a critically endangered fish, the common skate (Dipturus batis). Proc. Royal Soc. 2010, 277, 1497–1503. [Google Scholar] [CrossRef] [Green Version]
  19. Ferretti, F.; Osio, G.C.; Jenkins, C.J.; Rosenberg, A.A.; Lotze, H.K. Long-term change in a meso-predator community in response to prolonged and heterogeneous human impact. Sci. Rep. 2013, 3, 1057. [Google Scholar] [CrossRef] [PubMed] [Green Version]
  20. Dulvy, N.K.; Fowler, S.L.; Musick, J.A.; Cavanagh, R.D.; Kyne, P.; Harrison, L.R.; Carlson, J.K.; Davidson, L.N.; Fordham, S.V.; Francis, M.P.; et al. Extinction risk and conservation of the world’s sharks and rays. eLife 2014, 3, 00590. [Google Scholar] [CrossRef] [Green Version]
  21. Frodella, N.; Cannas, R.; Velonà, A.; Carbonara, P.; Farrell, E.D.; Fiorentino, F.; Follesa, M.C.; Garofalo, G.; Hemida, F.; Mancusi, C.; et al. Population connectivity and phylogeography of the Mediterranean endemic skate Raja polystigma and evidence of its hybridization with the parapatric sibling R. montagui. Mar. Ecol. Prog. Ser. 2016, 554, 99–113. [Google Scholar] [CrossRef] [Green Version]
  22. Hebert, P.D.N.; Ratnasingham, S.; deWaard, J.R. Barcoding animal life: Cytochrome c oxidase subunit 1 divergences among closely related species. Proc. R. Soc. B 2003, 270, 96–99. [Google Scholar] [CrossRef] [PubMed] [Green Version]
  23. Spouge, J.L. Measurement of a barcode’s accuracy in identifying species. In DNA Barcoding in Marine Perspectives; Trivedi, S., Ansari, A., Ghosh, S., Rehman, H., Eds.; Springer: Cham, Switzerland, 2016. [Google Scholar]
  24. Ball, R.E.; Serra-Pereira, B.; Ellis, J.; Genner, M.J.; Iglésias, S.; Johnson, A.F.; Jones, C.S.; Leslie, R.; Lewis, J.; Mariani, S.; et al. Resolving taxonomic uncertainty in vulnerable elasmobranchs: Are the Madeira skate (Raja maderensis) and the thornback ray (Raja clavata) distinct species? Conserv. Genet. 2016, 17, 565–576. [Google Scholar] [CrossRef] [Green Version]
  25. Cerutti-Pereyra, F.; Meekan, M.G.; Wei, N.W.; O’Shea, O.; Bradshaw, C.J.; Austin, C.M. Identification of rays through DNA barcoding: An application for ecologists. PLoS ONE 2012, 7, 36479. [Google Scholar] [CrossRef] [Green Version]
  26. Ordines, F.; Baro, J.; Ramírez-Amaro, S.; Serena, F.; Sobrino, I. First substantiated record of Raja asterias Delaroche, 1809 (Elasmobranchii: Rajiformes: Rajidae) in the Gulf of Cádiz, North-eastern Atlantic. Acta Ichthyol. Piscat. 2017, 47, 101–106. [Google Scholar] [CrossRef] [Green Version]
  27. Vella, A.; Vella, N.; Schembri, S. A molecular approach towards taxonomic identification of elasmobranch species from Maltese fisheries landings. Mar. Genom. 2017, 36, 17–23. [Google Scholar] [CrossRef]
  28. Ward, R.D.; Holmes, B.H.; White, W.T.; Last, P.R. DNA barcoding Australasian chondrichthyans: Results and potential uses in conservation. Mar. Freshw. Res. 2008, 59, 57–71. [Google Scholar] [CrossRef]
  29. Stehmann, M.F.W.; Ellis, J.; Walls, R.; Lynghammar, A. Dipturus nidarosiensis . In The IUCN Red List of Threatened Species; 2015; e.T161729A48927468; Available online: https://www.iucnredlist.org/resources/media (accessed on 2 December 2021).
  30. Williams, T.; Helle, K.; Aschan, M. The distribution of chondrichthyans along the northern coast of Norway. ICES J. Mar. Sci. 2008, 65, 1161–1174. [Google Scholar] [CrossRef] [Green Version]
  31. Chaklader, M.R.; Siddik, M.A.B.; Nahar, A.; Hanif, M.A.; Alam, M.J.; Mahmud, M. Morphometric parameters and allometric growth in paradise threadfin Polynemus paradiseus (Linnaeus, 1758) from a coastal river of Bangladesh. J. Aquac. Res. Dev. 2016, 7, 417. [Google Scholar]
  32. Mir, J.I.; Saxena, N.; Patiyal, R.S.; Sahoo, P.K. Phenotypic differentiation of Barilius bendelisis (Cypriniformes: Cyprinidae) in four rivers from Central Indian Himalaya. Rev. Biol. Trop. (Int. J. Trop. Biol.) 2015, 63, 165–173. [Google Scholar]
  33. Vieira, A.R.; Rodrigues, A.S.B.; Sequeira, V.; Neves, A.; Paiva, R.B.; Paulo, O.S.; Serrano Gordo, L. Genetic and Morphological Variation of the Forkbeard, Phycis phycis (Pisces, Phycidae): Evidence of Panmixia and Recent Population Expansion along Its Distribution Area. PLoS ONE 2016, 11, e0167045. [Google Scholar] [CrossRef] [PubMed] [Green Version]
  34. Cheng, Q.; Lu, D.; Ma, L. Morphological differences between close populations discernible by multivariate analysis: A case study of genus Coilia (Teleostei: Clupeiforms). Aquat. Living Resour. 2005, 18, 187–192. [Google Scholar] [CrossRef]
  35. Siddik, M.A.B.; Hanif, M.A.; Chaklader, M.R.; Nahar, A.; Fotedar, R. A multivariate morphometric investigation to delineate stock structure of gangetic whiting, Sillaginopsis panijus (Teleostei: Sillaginidae). SpringerPlus 2016, 5, 520. [Google Scholar] [CrossRef] [PubMed] [Green Version]
  36. AnvariFar, H.; Khyabani, A.; Farahmand, H.; Vatandoust, S.; AnvariFar, H.; Jahageerdar, S. Detection of morphometric differentiation between isolated up- and downstream populations of Siah Mahi (Capoeta capoeta gracilis) (Pisces: Cyprinidae) in the Tajan River (Iran). Hydrobiologia 2011, 673, 41–52. [Google Scholar] [CrossRef]
  37. Muchlisin, Z.A.; Zulkarnaini, B.; Purnawan, S.; Muhadjier, A.; Fadli, F.; Cheng, S.H. Morphometric variations of three species of harvested cephalopods found in northern sea of Aceh Province, Indonesia. Biodiversitas 2014, 15, 142–146. [Google Scholar] [CrossRef]
  38. Carugati, L.; Melis, R.; Cariani, A.; Cau, A.; Crobe, V.; Ferrari, A.; Follesa, M.C.; Geraci, M.L.; Iglésias, S.P.; Pesci, P.; et al. Combined COI barcode-based methods to avoid mislabelling of threatened species of deep-sea skates. Anim. Conserv. 2021. Available online: https://zslpublications.onlinelibrary.wiley.com/doi/full/10.1111/acv.12716 (accessed on 2 December 2021). [CrossRef]
  39. Cabral, H.N.; Marques, J.F.; Rego, A.L.; Catarino, A.L.; Figueiredo, J.; Garcia, J. Genetic and morphological variation of Synaptura lusitanica Capello, 1868, along the Portuguese coast. J. Sea. Res. 2003, 50, 167–175. [Google Scholar] [CrossRef]
  40. Bacha, M.; Jemaa, S.; Hamitouche, A.; Rabhi, K.; Amara, R. Population structure of the European anchovy, Engraulis encrasicolus, in the SW Mediterranean Sea, and the Atlantic Ocean: Evidence from otolith shape analysis. ICES J. Mar. Sci. 2014, 71, 2429–2435. [Google Scholar] [CrossRef]
  41. Pita, A.; Casey, J.; Hawkins, S.J.; Villarreal, M.R.; Gutiérrez, M.; Cabral, H.; Carocci, F.; Abaunza, P.; Pascual, P.; Presa, P. Conceptual and practical advances in fish stock delineation. Fish. Res. 2016, 173, 185–193. [Google Scholar] [CrossRef]
  42. Spedicato, M.T.; Massutí, E.; Mérigot, B.; Tserpes, G.; Jadaud, A.; Relini, G. The MEDITS trawl survey specifications in an ecosystem approach to fishery management. Sci. Mar. 2019, 83, 9–20. [Google Scholar] [CrossRef]
  43. Ebert, D.A.; Fowler, S.; Compagno, L.J.V. Sharks of the World; Wild Nature Press: Plymouth, UK, 2013; p. 528. [Google Scholar]
  44. Follesa, M.C.; Carbonara, P. Atlas of the Maturity Stages of Mediterranean Fishery Resources. In Studies and Reviews N. 99; FAO: Rome, Italy, 2019; p. 268. [Google Scholar]
  45. Follesa, M.C.; Agus, B.; Bellodi, A.; Cannas, R.; Capezzuto, F.; Casciaro, L.; Cau, A.; Cuccu, D.; Donnaloia, M.; Fernandez-Arcaya, U.; et al. The MEDITS maturity scales as a useful tool for investigating the reproductive traits of key species in the Mediterranean Sea. Sci. Mar. 2019, 83S1, 235–256. [Google Scholar] [CrossRef] [Green Version]
  46. Froese, R. Cube law, condition factor and weight-length relationships: History, meta-analysis and recommendations. J. Appl. Ichthyol. 2006, 22, 241–253. [Google Scholar] [CrossRef]
  47. Oliveira, E.F.; Goulart, E.; Breda, L.; Minte-Vera, C.V.; de Souza Paiva, L.R.; Vismara, M.R. Ecomorphological patterns of the fish assemblage in a tropical floodplain: Effects of trophic, spatial and phylogenetic structures. Neotrop. Ichthyol. 2010, 8, 569–586. [Google Scholar] [CrossRef]
  48. Fisher, R. The use of multiple measurements in taxonomic problems. Ann. Eugen. 1936, 7, 179–188. [Google Scholar] [CrossRef]
  49. Elliott, N.G.; Haskard, K.; Koslow, J.A. Morphometric analysis of orange roughy (Hoplostethus atlanticus) off the continental slope of southern Australia. J. Fish Biol. 1995, 46, 202–220. [Google Scholar] [CrossRef]
  50. Asuero, A.G.; Sayago, A.; González, A.G. The Correlation Coefficient: An Overview. Crit. Rev. Anal. Chem. 2006, 36, 41–59. [Google Scholar] [CrossRef]
  51. Ellis, J.R.; Cruz-Martínez, A.; Rackham, B.D.; Rogers, S.I. The distribution of chondrichthyan fishes around the British Isles and implications for conservation. J. Northwest Atl. Fish. Sci. 2005, 37, 195–213. [Google Scholar] [CrossRef]
  52. Follesa, M.C.; Locci, I.; Pesci, P.; Floris, E.; Cau, A. Lo stato delle risorse nei mari italiani: GSA11–mari di Sardegna. In Lo Stato della Pesca e Dell’acquacoltura nei Mari Italiani, Monografie Scientifiche; Cataudella, S., Spagnolo, M., Eds.; Ministero delle Politiche Agricole, Alimentari e Forestali: Rome, Italy, 2011; pp. 132–140. [Google Scholar]
  53. Russo, T.; Bitetto, I.; Carbonara, P.; Carlucci, R.; D’Andrea, L.; Facchini, M.T.; Lembo, G.; Maiorano, P.; Sion, L.; Spedicato, M.T.; et al. A holistic approach to fishery management: Evidence and insights from a Central Mediterranean case study (Western Ionian Sea). Front. Mar. Sci. 2017, 4, 193. [Google Scholar] [CrossRef] [Green Version]
  54. Bensch, A.; Gianni, M.; Gréboval, D.; Sanders, J.S.; Hjort, A. Worldwide Review of Bottom Fisheries in the High Seas, FAO Fisheries and Aquaculture Technical Paper; Food and Agriculture Organization of the United Nations: Rome, Italy, 2009; Volume 1, p. 522. [Google Scholar]
  55. Artegiani, A.; Bregant, D.; Paschini, E.; Pinardi, N.; Raicich, F.; Russo, A. The Adriatic Sea general circulation. Part I: Air-sea interaction and water mass structure. J. Phys. Oceanogr. 1997, 27, 1492–1514. [Google Scholar] [CrossRef]
  56. Vilibic, I.; Orlic, M. Adriatic water masses, their rates of formation and transport through the Otranto Strait. Deep-Sea Res. I Oceanogr. Res. Pap. 2002, 16, 171–178. [Google Scholar] [CrossRef]
  57. Marra, A.; Mona, S.; Sà, R.M.; D’Onghia, G.; Maiorano, P. Population Genetic History of Aristeus antennatus (Crustacea: Decapoda) in the Western and Central Mediterranean Sea. PLoS ONE 2015, 10, e0128609. [Google Scholar]
  58. D’Onghia, G.; Maiorano, P.; Capezzuto, F.; Carlucci, R.; Battista, D.; Giove, A.; Sion, L.; Tursi, A. Further evidences of deep-sea recruitment of Aristeus antennatus (Crustacea: Decapoda) and its role in the population renewal on the exploited bottoms of the Mediterranean. Fish. Res. 2009, 95, 236–245. [Google Scholar] [CrossRef]
  59. Mannini, A.; Sabatella, R.F. Annuario sullo stato delle risorse e sulle strutture produttive dei mari italiani. Biol. Mar. Mediterr. 2015, 22, 358. [Google Scholar]
  60. Badyaev, A.V. Growing apart: An ontogenetic perspective on the evolution of sexual size dimorphism. Trends Ecol. Evol. 2002, 17, 369–378. [Google Scholar] [CrossRef]
  61. Castillo Geniz, J.L.; Nishizaki, O.S.; Perez Jiménez, J.C. Morphological variation and sexual dimorphism in the California skate, Raja inornata Jordan and Gilbert, 1881 from the Gulf of California, Mexico. Zootaxa 2007, 1545, 1–16. [Google Scholar] [CrossRef]
  62. Martinez, C.M.; Kao, B.H.; Sparks, J.S.; Wainwright, P.C. Pectoral Dimorphism Is a Pervasive Feature of Skate Diversity and Offers Insight into their Evolution. Integr. Org. Biol. 2019, 1, obz012. [Google Scholar] [CrossRef] [Green Version]
  63. Bolnick, D.I.; Doebeli, M. Sexual dimorphism and adaptive speciation: Two sides of the same ecological coin. Evolution 2003, 57, 2433–2449. [Google Scholar] [CrossRef]
  64. Orlov, A.M.; Cotton, C.F. Sexually dimorphic morphological characters in five north Atlantic deepwater skates (Chondrichthyes: Rajiformes). J. Mar. Sci. 2011, 2011, 842821. Available online: https://www.hindawi.com/journals/jmb/2011/842821/ (accessed on 2 October 2021). [CrossRef] [Green Version]
  65. Frisk, M.G. Life history strategies of batoids. In Sharks and Their Relatives II: Biodiversity, Adaptive Physiology and Conservation; Carrier, J.C., Musick, J.A., Heithaus, M.R., Eds.; CRC Press: Boca Raton, FL, USA, 2010; pp. 283–316. [Google Scholar]
  66. Sosebee, K.A. Maturity of Skates in Northeast United States Waters. J. Northwest Atl. Fish. Sci. 2005, 35, 141–153. [Google Scholar] [CrossRef]
  67. Poulet, N.; Berrebi, P.; Crivelli, A.J.; Lek, S.; Argillier, C. Genetic and morphometric variations in the pikeperch (Sander lucioperca L.) of a fragmented delta. Arch. Hydrobiol. 2004, 159, 531–554. [Google Scholar] [CrossRef]
  68. Hendry, A.P.; Kelly, M.L.; Kinnison, M.T.; Reznick, D.N. Parallel evolution of the sexes? Effects of predation and habitat features on the size and shape of wild guppies. J. Evol. Biol. 2006, 19, 741–754. [Google Scholar] [CrossRef]
  69. Bhagat, Y.; Fox, M.G.; Ferreira, M.T. Morphological differentiation in introduced pumpkinseed Lepomis gibbosus (L.) occupying different habitat zones in Portuguese reservoirs. J. Fish. Biol. 2006, 69, 79–94. [Google Scholar] [CrossRef]
  70. Ihssen, P.E.; Booke, H.E.; Casselman, J.M.; Mc-Glade, J.M.; Payne, N.R.; Utter, E.M. Stock identification: Materials and methods. Can. J. Fish. Aquat. Sci. 1981, 38, 1838–1855. [Google Scholar] [CrossRef]
  71. Abaunza, P.; Murta, A.G.; Campbell, N.; Cimmaruta, R.; Comesaña, A.S.; Dahle, G.; Gallo, E.; García Santamaría, M.T.; Gordo, L.S.; Iversen, S.A.; et al. Considerations on sampling strategies for an holistic approach to stock identification: The example of the HOMSIR project. Fish. Res. 2008, 89, 104–113. [Google Scholar] [CrossRef]
  72. Sharker, M.R.; Siddik, M.A.B.; Nahar, A.; Shahjahan, M.; Faroque, A.A. Genetic differentiation of wild and hatchery populations of Indian major carp Cirrhinus cirrhosis in Bangladesh. J. Environ. Biol. 2015, 36, 1223–1227. [Google Scholar]
  73. Misawa, R.; Narimatsu, Y.; Endo, H.; Kai, Y. Population structure of the ocellate spot skate (Okamejei kenojei) inferred from variations in mitochondrial DNA (mtDNA) sequences and from morphological characters of regional populations. Fish. Bull. NOAA 2018, 117, 24–36. [Google Scholar] [CrossRef]
  74. Costa, L.J.; De Almeida, P.R.; Costa, M.J. A morphometric and meristic investigation of Lusitanian toadfish Halobatrachus didactylus (Bloch and Schneider 1801): Evidence of population fragmentation on Portuguese coast. Sci. Mar. 2003, 67, 219–231. [Google Scholar] [CrossRef] [Green Version]
  75. Murta, A.G. Morphological variation of horse mackerel (Trachurus trachurus) in the Iberian and North African Atlantic: Implications for stock identifications. ICES J. Mar. Sci. 2000, 57, 1240–1248. [Google Scholar] [CrossRef]
  76. Turan, C. Stock identification of Mediterranean horse mackerel (Trachurus trachurus) using morphometric and meristic characters. ICES J. Mar. Sci. 2004, 61, 774–781. [Google Scholar] [CrossRef] [Green Version]
  77. Wimberger, P.H. Trophic polymorphisms, plasticity, and speciation in vertebrates. In Advances in Fish Foraging Theory and Ecology; Stouder, D.J., Fresh, K., Eds.; Belle Baruch Press: Columbia, SC, USA, 1994; pp. 19–43. [Google Scholar]
  78. Carbonara, P.; Bellodi, A.; Palmisano, M.; Mulas, A.; Porcu, C.; Zupa, W.; Donnaloia, M.; Carlucci, R.; Sion, L.; Follesa, M.C. Growth and Age Validation of the Thornback Ray (Raja clavata Linnaeus, 1758) in the South Adriatic Sea (Central Mediterranean). Front. Mar. Sci. 2020, 7, 1100. [Google Scholar] [CrossRef]
  79. Farrugia, T.J.; Goldman, K.J.; Tribuzio, C.; Seitz, A.C. First use of satellite tags to examine movement and habitat use of big skates Beringraja binoculata in the Gulf of Alaska. Mar. Ecol. Prog. Ser. 2016, 556, 209–221. [Google Scholar] [CrossRef]
  80. Spreitzer, M.L.; Mautner, S.; Makasa, L.; Sturmbauer, C. Genetic and morphological population differentiation in the rock-dwelling and specialized shrimp-feeding cichlid fish species Altolamprologus compressiceps from Lake Tanganyika, East Africa. Hydrobiologia 2012, 682, 143–154. [Google Scholar] [CrossRef] [Green Version]
  81. Koester, D.M. Anatomy and motor pathways of the electric organ of skates. Anat. Rec. A Discov. Mol. Cell. Evol. Biol. 2003, 273, 648–662. [Google Scholar] [CrossRef]
  82. Capapé, C.; Ali, M.; Saad, A.; Alkusairy, H.; Reynaud, C. Atypical characteristics in the longnosed skate Dipturus oxyrinchus (Linnaeus, 1758) from the coast of Syria (Eastern Mediterranean). Thalassia Salent. 2015, 37, 71–80. [Google Scholar]
  83. Burns, J.G.; Di Nardo, P.; Rood, F.H. The role of predation in variation in body shape in guppies Poecilia reticulata: A comparison of field and common garden phenotypes. J. Fish. Biol. 2009, 75, 1144–1157. [Google Scholar] [CrossRef]
  84. Webster, M.M.; Atton, N.; Hart, P.J.B.; Ward, A.J.W. Habitat-specific morphological variation among threespine sticklebacks (Gasterosteus aculeatus) within a drainage basin. PLoS ONE 2011, 6, e21060. [Google Scholar] [CrossRef] [PubMed] [Green Version]
  85. Lazzarotto, H.; Barros, T.; Louvise, J.; Pellegrini Caramaschi, E. Morphological variation among populations of Hemigrammus coeruleus (Characiformes: Characidae) in a Negro River tributary, Brazilian Amazon. Neotrop. Ichthyol. 2017, 15, e160152. [Google Scholar] [CrossRef] [Green Version]
  86. van Rijssel, J.C.; Witte, F. Adaptive responses in resurgent Lake Victoria cichlids over the past 30 years. Evol. Ecol. 2013, 27, 253–267. [Google Scholar] [CrossRef]
  87. Araújo, M.S.; Perez, S.I.; Magazoni, M.J.C.; Petry, A.C. Body size and allometric shape variation in the molly Poecilia vivipara along a gradient of salinity and predation. BMC Evol. Biol. 2014, 15, 1–11. [Google Scholar]
Figure 1. Study area. In the upper figure are indicated the Geographical Sub-Area where it was conducted the study. In lower part of figure the geographic allocation of the hauls conducted during the MEDITS trawl surveys in GSA 18 (South Adriatic Sea) and GSA 11 (Sardinia), indicated by yellow points. The fishing ports sampled in GSAs 11, 18 and 19 (North-Western Ionian Sea) are also indicated (white points).
Jmse 09 01462 g001
Figure 2. The morphological measurements taken on each specimens: total length (TL), disc width (DW), disc length (DL), snout-max width (SMW), snout length (preorbital) (SLPOR), Eyeball length (EBL), orbit diameter (OD), orbit and spiracle length (OSL) spiracle length (SL), distance between orbits (DBOR), distance between spiracles (DBS), distance snout-cloaca (DSC), tail length at 1st dorsal fin (C2DF1), tail length at 2nd dorsal fin (C2DF2), tail length between the posterior margin of the cloaca and caudal tip (C2CT), snout length (pre jaw) (SLPJ), pre-nasal length (PL), mouth width (MW), distance between nostrils (DBN), 1st gill opening width (GOW1), 5th gill opening width (GOW2), distance between first gill slit (DB1GS), distance between fifth gill slit (DB2GS), first dorsal fin base–length (D1BL), first dorsal fin height (D1H), first dorsal fin origin to caudal fin tip (D1), second dorsal fin origin to caudal fin tip (D2), distance between first and second dorsal fin inter-dorsal distance (ID).
Jmse 09 01462 g002
Figure 3. Map of the captured specimens’ locations.
Jmse 09 01462 g003
Figure 4. Linear relationship between Total Length and Catch Depth of each specimen grouped by area (Ionian-Adriatic and Sardinia) and combined (all data). The equation, R2 and statistical significance results are also reported.
Jmse 09 01462 g004
Figure 5. Canonical score results in the three assemblages tested: origin area (Zone: Ionian-Adriatic and Sardinia) (a), sexes (Sex: Female F and Male M) (b) and life stage (Stage: Adult A and Juveniles J) (c).
Jmse 09 01462 g005
Figure 6. The correlation for each morphometric measurement with the canonical structure coefficients on the dimensions considered (Can1).
Jmse 09 01462 g006
Figure 7. Correlation Analysis among the Morphometric Measurements. In the scale the Pearson’s correlation coefficient (r) is reported.
Jmse 09 01462 g007
Figure 8. Canonical score results with selected MM in the three assemblages tested: origin area (Zone: Ionian-Adriatic and Sardinia) (a), sexes (Sex: Female F and Male M) (b) and life stage (Stage: Adult A and Juveniles J) (c).
Jmse 09 01462 g008
Figure 9. Correlation Analysis among the Morphometric Measurements. In the scale the Pearson’s correlation coefficient (r) is reported. Specifically, the Correlation analysis for the Adriatic-Ionian Area (a) and for the Sardinia area (b) are shown.
Jmse 09 01462 g009
Figure 10. Canonical score results with selected MM in the sex assemblages (Female F and Male M) within the sampling area: Ionian-Adriatic (a); Sardinia (b).
Jmse 09 01462 g010
Figure 11. Canonical score results with selected MM in the life stage assemblages (Adult A and Juvenile J) within the sampling area: Ionian-Adriatic (a); Sardinia (b).
Jmse 09 01462 g011
Table 1. The linear equations between TL and each MM and length-weight power relationship. For each equation a, b and R2 values are reported.
EquationabR2EquationabR2
TW = a + TLb (Sardinia)0.00093.3870.970ID = a + b TL (Sardinia) 0.0320.0290.870
TW = a + TLb (Ionian-Adriatic)0.00073.3550.996ID = a + b TL (Ionian-Adriatic)0.0380.3110.948
TW = a + TLb (Combined)0.00073.3880.975ID = a + b TL (Combined)0.0330.2700.817
DW = a + b TL (Sardinia)0.719−0.7660.991C2CT = a + b TL (Sardinia)0.4003.5250.976
DW = a + b TL (Ionian-Adriatic)0.709−0.2950.995C2CT = a + b TL (Ionian-Adriatic)0.4053.1850.967
DW = a + b TL (Combined)0.715−0.6010.993C2CT = a + b TL (Combined)0.4023.3780.972
DL = a + b TL (Sardinia)0.611−1.4950.986SLPJ = a + b TL (Sardinia)0.1950.1960.960
DL = a + b TL (Ionian-Adriatic)0.596−1.3490.984SLPJ = a + b TL (Ionian-Adriatic)0.1900.6520.956
DL = a + b TL (Combined)0.606−1.5770.985SLPJ = a + b TL (Combined)0.1930.4150.959
SMW = a + b TL (Sardinia)0.363−0.7310.981PL = a + b TL (Sardinia)0.1790.1320.960
SMW = a + b TL (Ionian-Adriatic)0.3111.4990.964PL = a + b TL (Ionian-Adriatic)0.1790.2150.949
SMW = a + b TL (Combined)0.3420.0270.960PL = a + b TL (Combined)0.1790.1810.956
SLPOR = a + b TL (Sardinia)0.200−0.2820.965MW = a + b TL (Sardinia)0.089−0.1790.957
SLPOR = a + b TL (Ionian-Adriatic)0.1940.4490.980MW = a + b TL (Ionian-Adriatic)0.089−0.0740.953
SLPOR = a + b TL (Combined)0.1970.0810.972MW = a + b TL (Combined)0.089−0.1150.956
EBL = a + b TL (Sardinia)0.0220.1610.801DBN = a + b TL (Sardinia)0.0930.2470.960
EBL = a + b TL (Ionian-Adriatic)0.0200.1250.936DBN = a + b TL (Ionian-Adriatic)0.095−0.7210.964
EBL = a + b TL (Combined)0.0220.1120.839DBN = a + b TL (Combined)0.095−0.3080.955
OD = a + b TL (Sardinia)0.0290.1380.879GOW1 = a + b TL (Sardinia)0.017−0.0430.944
OD = a + b TL (Ionian-Adriatic)0.0310.1090.946GOW1 = a + b TL (Ionian-Adriatic)0.016−0.0440.902
OD = a + b TL (Combined)0.0300.1340.911GOW1 = a + b TL (Combined)0.017−0.0540.924
OSL = a + b TL (Sardinia)0.0430.1840.951GOW2 = a + b TL (Sardinia)0.015−0.1140.949
OSL = a + b TL (Ionian-Adriatic)0.0440.1490.953GOW2 = a + b TL (Ionian-Adriatic)0.012−0.0280.929
OSL = a + b TL (Combined)0.0430.1830.951GOW2 = a + b TL (Combined)0.014−0.0880.925
SL = a + b TL (Sardinia)0.017−0.0950.874DB1GS = a + b TL (Sardinia)0.162−0.6800.978
SL = a + b TL (Ionian-Adriatic)0.022−0.1360.923DB1GS = a + b TL (Ionian-Adriatic)0.158−0.8030.957
SL = a + b TL (Combined)0.019−0.0670.832DB1GS = a + b TL (Combined)0.161−0.8000.968
DBOR = a + b TL (Sardinia)0.061−0.6600.970DB5GS = a + b TL (Sardinia)0.113−0.7230.972
DBOR = a+ b TL (Ionian-Adriatic)0.051−0.2090.973DB5GS = a + b TL (Ionian-Adriatic)0.114−1.2960.950
DBOR = a + b TL (Combined)0.057−0.4960.956DB5GS = a + b TL (Combined)0.114−1.0580.960
DBS = a + b TL (Sardinia)0.075−0.3690.986D1BL = a + b TL (Sardinia)0.0440.3590.804
DBS = a + b TL (Ionian-Adriatic)0.071−0.3910.951D1BL = a + b TL (Ionian-Adriatic)0.0340.0730.889
DBS = a + b TL (Combined)0.074−0.4340.965D1BL = a + b TL (Combined)0.0410.0710.736
DSC = a + b TL (Sardinia)0.556−1.6710.981D1H = a + b TL (Sardinia)0.034−0.5120.852
DSC = a + b TL (Ionian-Adriatic)0.562−2.1900.955D1H = a + b TL (Ionian-Adriatic)0.0300.0250.933
DSC = a + b TL (Combined)0.558−1.9150.970D1H = a + b TL (Combined)0.032−0.2350.879
C2DF1 = a + b TL (Sardinia)0.2481.4490.972D1 = a + b TL (Sardinia)0.1671.5670.942
C2DF1 = a + b TL (Ionian-Adriatic)0.252−0.2920.971D1 = a + b TL (Ionian-Adriatic)0.1741.7720.938
C2DF1 = a + b TL (Combined)0.2520.4410.968D1 = a + b TL (Combined)0.1691.7780.936
C2DF2 = a + b TL (Sardinia)0.3012.9740.984D2 = a + b TL (Sardinia)0.1020.9790.917
C2DF2 = a + b TL (Ionian-Adriatic)0.3230.4140.981D2 = a + b TL (Ionian-Adriatic)0.1021.4630.921
C2DF2 = a + b TL (Combined)0.3121.6780.982D2 = a + b TL (Combined)0.1011.2710.917
Table 2. The number of specimens from predefined group (origin area) in term of estimate (Predicted) and real (Actual) membership.
Actual
Ionian-AdriaticSardinia
PredictedIonian-Adriatic273
Sardinia127
Table 3. The number of specimens from predefined group (origin area) in term of estimate (Predicted) and real (Actual) membership, using a selection of MM.
Actual
Ionian-AdriaticSardinia
PredictedIonian-Adriatic253
Sardinia327
Publisher’s Note: MDPI stays neutral with regard to jurisdictional claims in published maps and institutional affiliations.

