1. Introduction
From 1 January 2020, the International Maritime Organization (IMO) has tightened the requirements for the sulphur content in residual marine fuel (from 3.50 down to 0.50 weight per cent), which is related to environmental protection and human health concerns and is important in the implementation of the UNESCO’s Sustainable Development Goals [
1,
2]. Petroleum-based fuels have historically been used as marine fuels. However, aiming to decrease the SO
x emissions from vessels and reduce the greenhouse effect, alternative fuels have also been proposed, e.g., LNG as a low-sulphur marine fuel [
3,
4]. Currently, this has been implemented only on LNG-tankers [
5]. The limited distribution of LNG in ports and refuelling bases remains the main issue [
6]. The analysis of the results of studies [
7,
8,
9] shows that the substitution of most of the hydrocarbon resources with the alternative cannot be achieved in the nearest future, thus the processing of oil stock and obtaining residual marine fuels will stay relevant.
The most difficult technical challenge is the production of low-sulphur fuel oils (LSFOs) from petroleum feedstock [
10]. The existing methods for LSFO production can be divided into two main classes: direct and indirect hydrogenation [
11]. Indirect hydrogenation is the cheapest method that does not require large capital investments (e.g., ExxonMobil [
12], Shell [
13], Sunoco Partners Marketing & Terminals L.P. [
14], Mawetal [
15]). In this case, the LSFO is obtained by selective compounding of sulphur residual oil fractions of primary or secondary oil refining processes with low-sulphur middle distillate fractions of hydrogenation processes. As the latter, various types of diesel and gas oil fractions with a high content of paraffinic/naphthenic hydrocarbons (from 50–85 to 100%) in their composition (ExxonMobil [
12], Shell [
13], Sunoco Partners Marketing & Terminals L.P. [
14]) are usually used.
Besides the saturated aromatic compounds and resins, the residual petroleum fractions contain asphaltenes—high molecular weight carbon compounds that are generally identified as substances insoluble in normal alkane solvents, e.g., n-heptane (heptane-insoluble or HI); however, they are soluble in aromatic solvents [
16,
17,
18].
Thus, obtaining LSFOs by selective compounding requires solving the problem of incompatibility arising when mixing the fuel components of paraffinic/naphthenic and asphaltene base [
19,
20]. As a result, marine fuel, as a multicomponent petroleum product, loses its sedimentation stability during storage and transportation and asphalt-resinous-paraffin deposits (ARPDs) stratify, coagulate, and precipitate on pipelines and in storage tanks [
21,
22,
23,
24].
Asphaltenes are high molecular weight components of crude oils and petroleum products that include polyaromatic rings with long or short aliphatic chains, various functional groups, and heteroatoms. The structure and properties of asphaltenes strongly depend on their origin. For example, compared with natural asphaltenes, thermal asphaltenes originating from thermodestructive processes have a lower molecular weight and are predominantly concentrated in the plane [
16,
18,
20,
25,
26,
27,
28,
29].
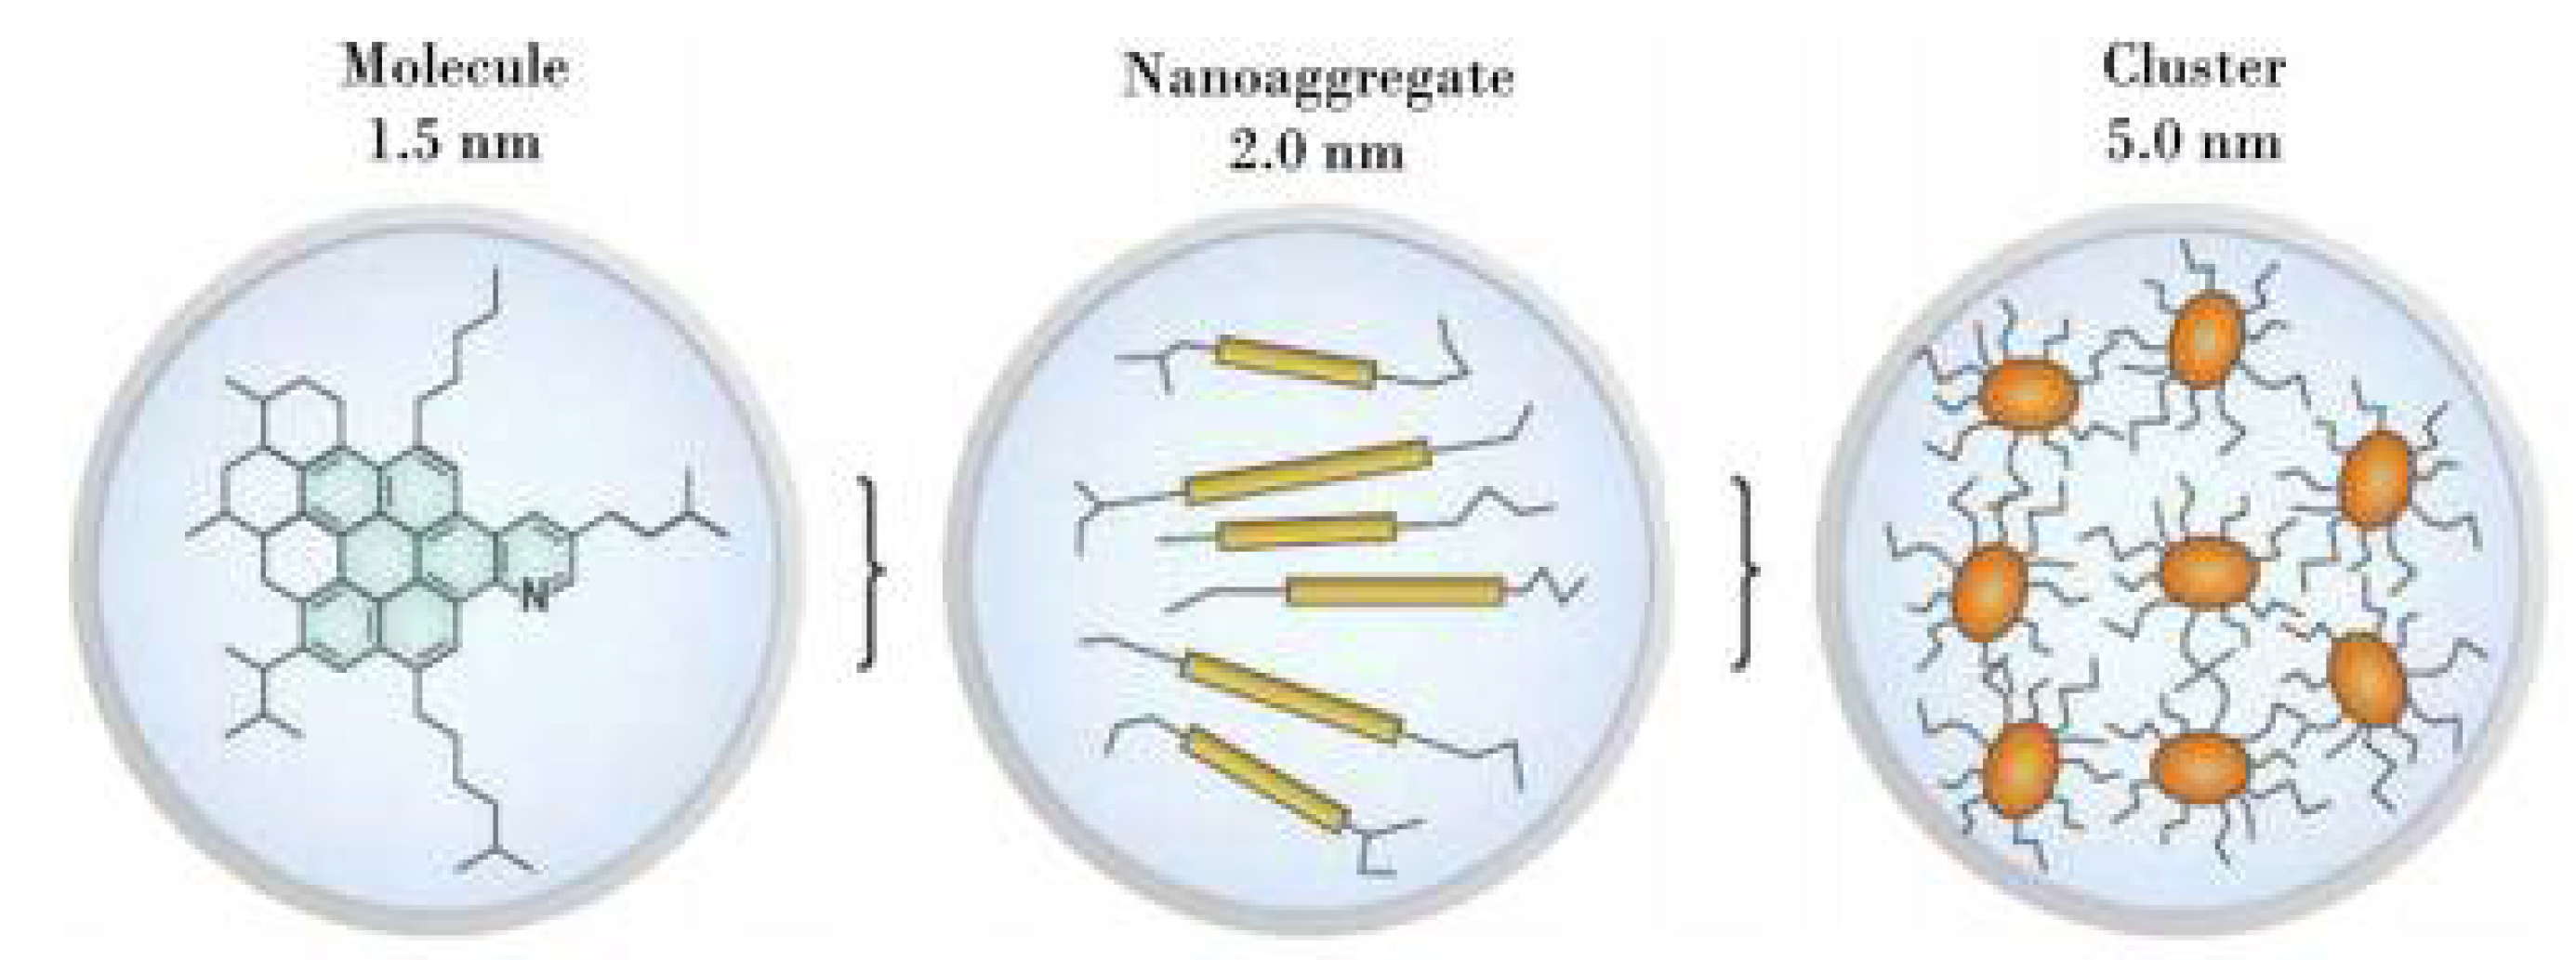
With an increase in the concentration of asphaltenes in marine fuel, their molecules form nano-aggregates and, with a further increase in the concentration, the nano-aggregates form clusters and precipitate. Because of the asphaltenes’ tendency towards aggregation, precipitation, and deposition on various surfaces, the study of the structure of these materials and of the mechanism of their formation has always remained relevant.
Figure 1 shows the modified Yen model, which has the greatest agreement with experimental data among the existing models [
16,
25].
In the review by Zhang Y. et al., the mechanism of asphaltenes’ aggregation is represented as pancake bonding, occurring through the heteroassociation between radical particles and polycyclic aromatic hydrocarbons (PAHs) and/or PAHs with heteroatoms [
16].
Various analytical methods are used to determine the composition and structure of petroleum asphaltenes, e.g., as nuclear magnetic resonance (NMR) measurements, determination of the molecular structure using X-ray diffraction (XRD), and simulated distillation for composition analysis [
30,
31].
According to the Richardson’s solvent method, the group components can be classified into maltenes (γ-fraction, heptane-soluble—HS), asphaltenes (β-fraction, heptane-insoluble and toluene-soluble—HI-TS), carbenes (α2-fraction, toluene-insoluble and quinoline-soluble—TI-QS), and carbides (α1-fraction, toluene-insoluble and quinoline-insoluble—TI-QI).
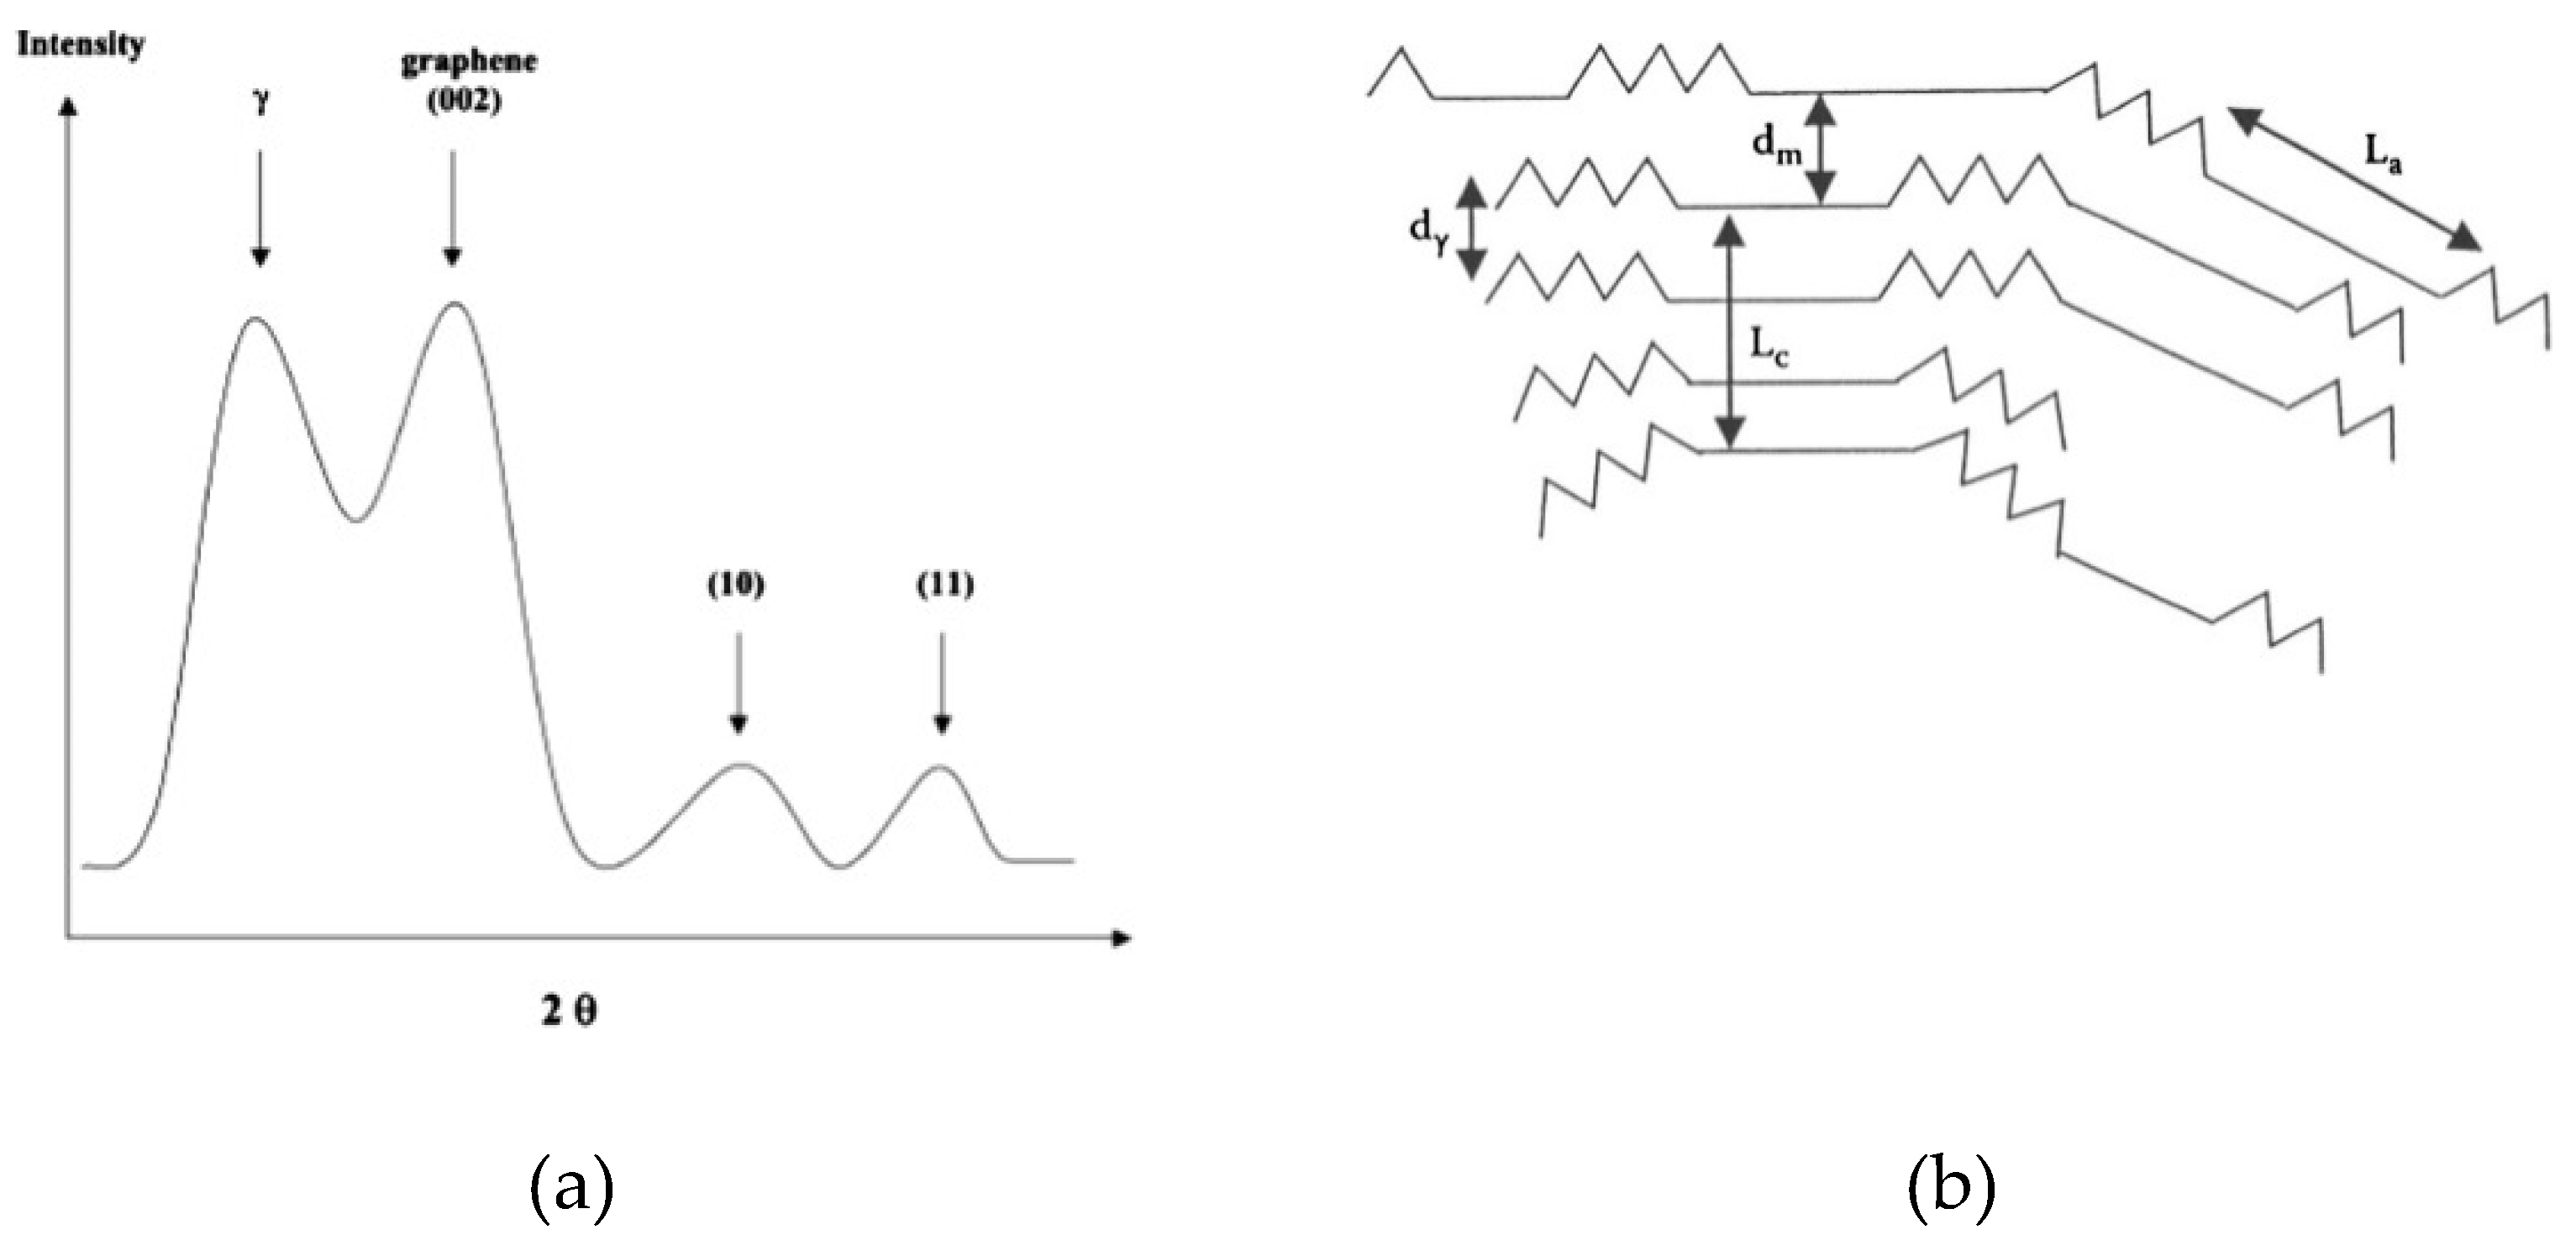
X-ray diffraction analysis (XRD) can be used to quantify the fine structure of petroleum asphaltenes. This method can be used to obtain information on the parameters of the asphaltene cluster. These parameters are the interplanar spacings between the aliphatic chains (
dγ), interplanar spacings between the aromatic shields (
d002 or
dm), cluster diameter (
La), cluster height (
Lc), number of aromatic sheets in a cluster (
NOar), and aromaticity (
fa) [
32].
X-ray diffraction patterns of petroleum asphaltenes consist of four main peaks or bands (reflections), namely, a γ-band, a graphene band or (002), a (100) band, and a (110) band.
Figure 2 shows a general image of a typical X-ray diffraction pattern and a cross-sectional view of a petroleum asphaltene model with marked interplanar spacings and cluster sizes.
The γ-band characterizes the spacing between saturated structures, which arises from X-rays scattered by condensed naphthenic rings or aliphatic chains. The graphene or (002) band, on the other hand, results from X-ray diffraction from a cluster of aromatic sheets located one below the other. The reflections of the (100) and (110) bands come from the in-plan structure of the aromatic sheets, which indicates the average cluster diameter. The size of the aromatic sheet is often calculated from the (100) band because the (110) band is often not visible owing to its very low intensity.
The positions of the bands or reflections in the X-ray diffraction pattern are determined by the double Bragg diffraction angle (2
θ) and are about 20° for the γ-band, about 26° for the (002) band, about 43° for the (100) band, and about 77° for the (110) band [
32,
33,
34,
35,
36].
An important conclusion about the regularities of changes in the structure of asphaltenes under thermal effects is that, with an increase in the degree of conversion, the cluster diameter (
La) decreases and aromaticity (
fa) increases, which is mainly associated with the loss of aliphatic carbon in the side chains owing to dealkylation reactions and with a decrease in the number of aromatic sheets (
NOar) in the cluster [
32].
In residual marine fuel oils, the amount and structure of asphaltenes affect the characteristics relevant to the storage and use of the fuel. For example, in the heavy fuel oil (HFO), the ignition delay time (IDT) in an internal combustion engine decreases with the decrease in the asphaltene amount [
37].
The aim of the study is to compare the effects of VacRes and VisRes asphaltenes’ structures on the sedimentation stability of residual marine fuels.
2. Materials and Methods
2.1. Materials
Components of residual marine fuels were selected from a Siberian industrial plant processing a mixture of West Siberian oils. Visbreaking residue (VisRes) and vacuum residue (VacRes) were selected as the test asphaltenes carriers. The raw material of the visbreaking unit is the vacuum residue. Ultra-low sulphur diesel (ULSD) from a diesel hydrotreatment unit and light gas oil catalytic cracking (light cycle gasoil) (LCGO)/light gas oil catalytic cracking from a catalytic cracking unit (fluid catalytic cracking) (FCC) for the preparation of the sample models of residual marine fuels were also selected and studied.
Table 1 shows the physical and chemical quality indicators and SARA (saturates, aromatics, resins, asphaltenes) analysis of the selected oil products.
Two types of heavy oil residues were taken as basic high-viscosity components to identify the effect of petroleum asphaltenes (HI-fraction) on the sedimentation stability of residual marine fuel: (1) straight-run—the residual fraction of the vacuum distillation process of oil stock (VacRes), (2) thermodestructive—the residual fraction of tar visbreaking (VisRes). The HI-fraction also contains carbenes and carbides (as in the product of a thermodestructive process) [
38].
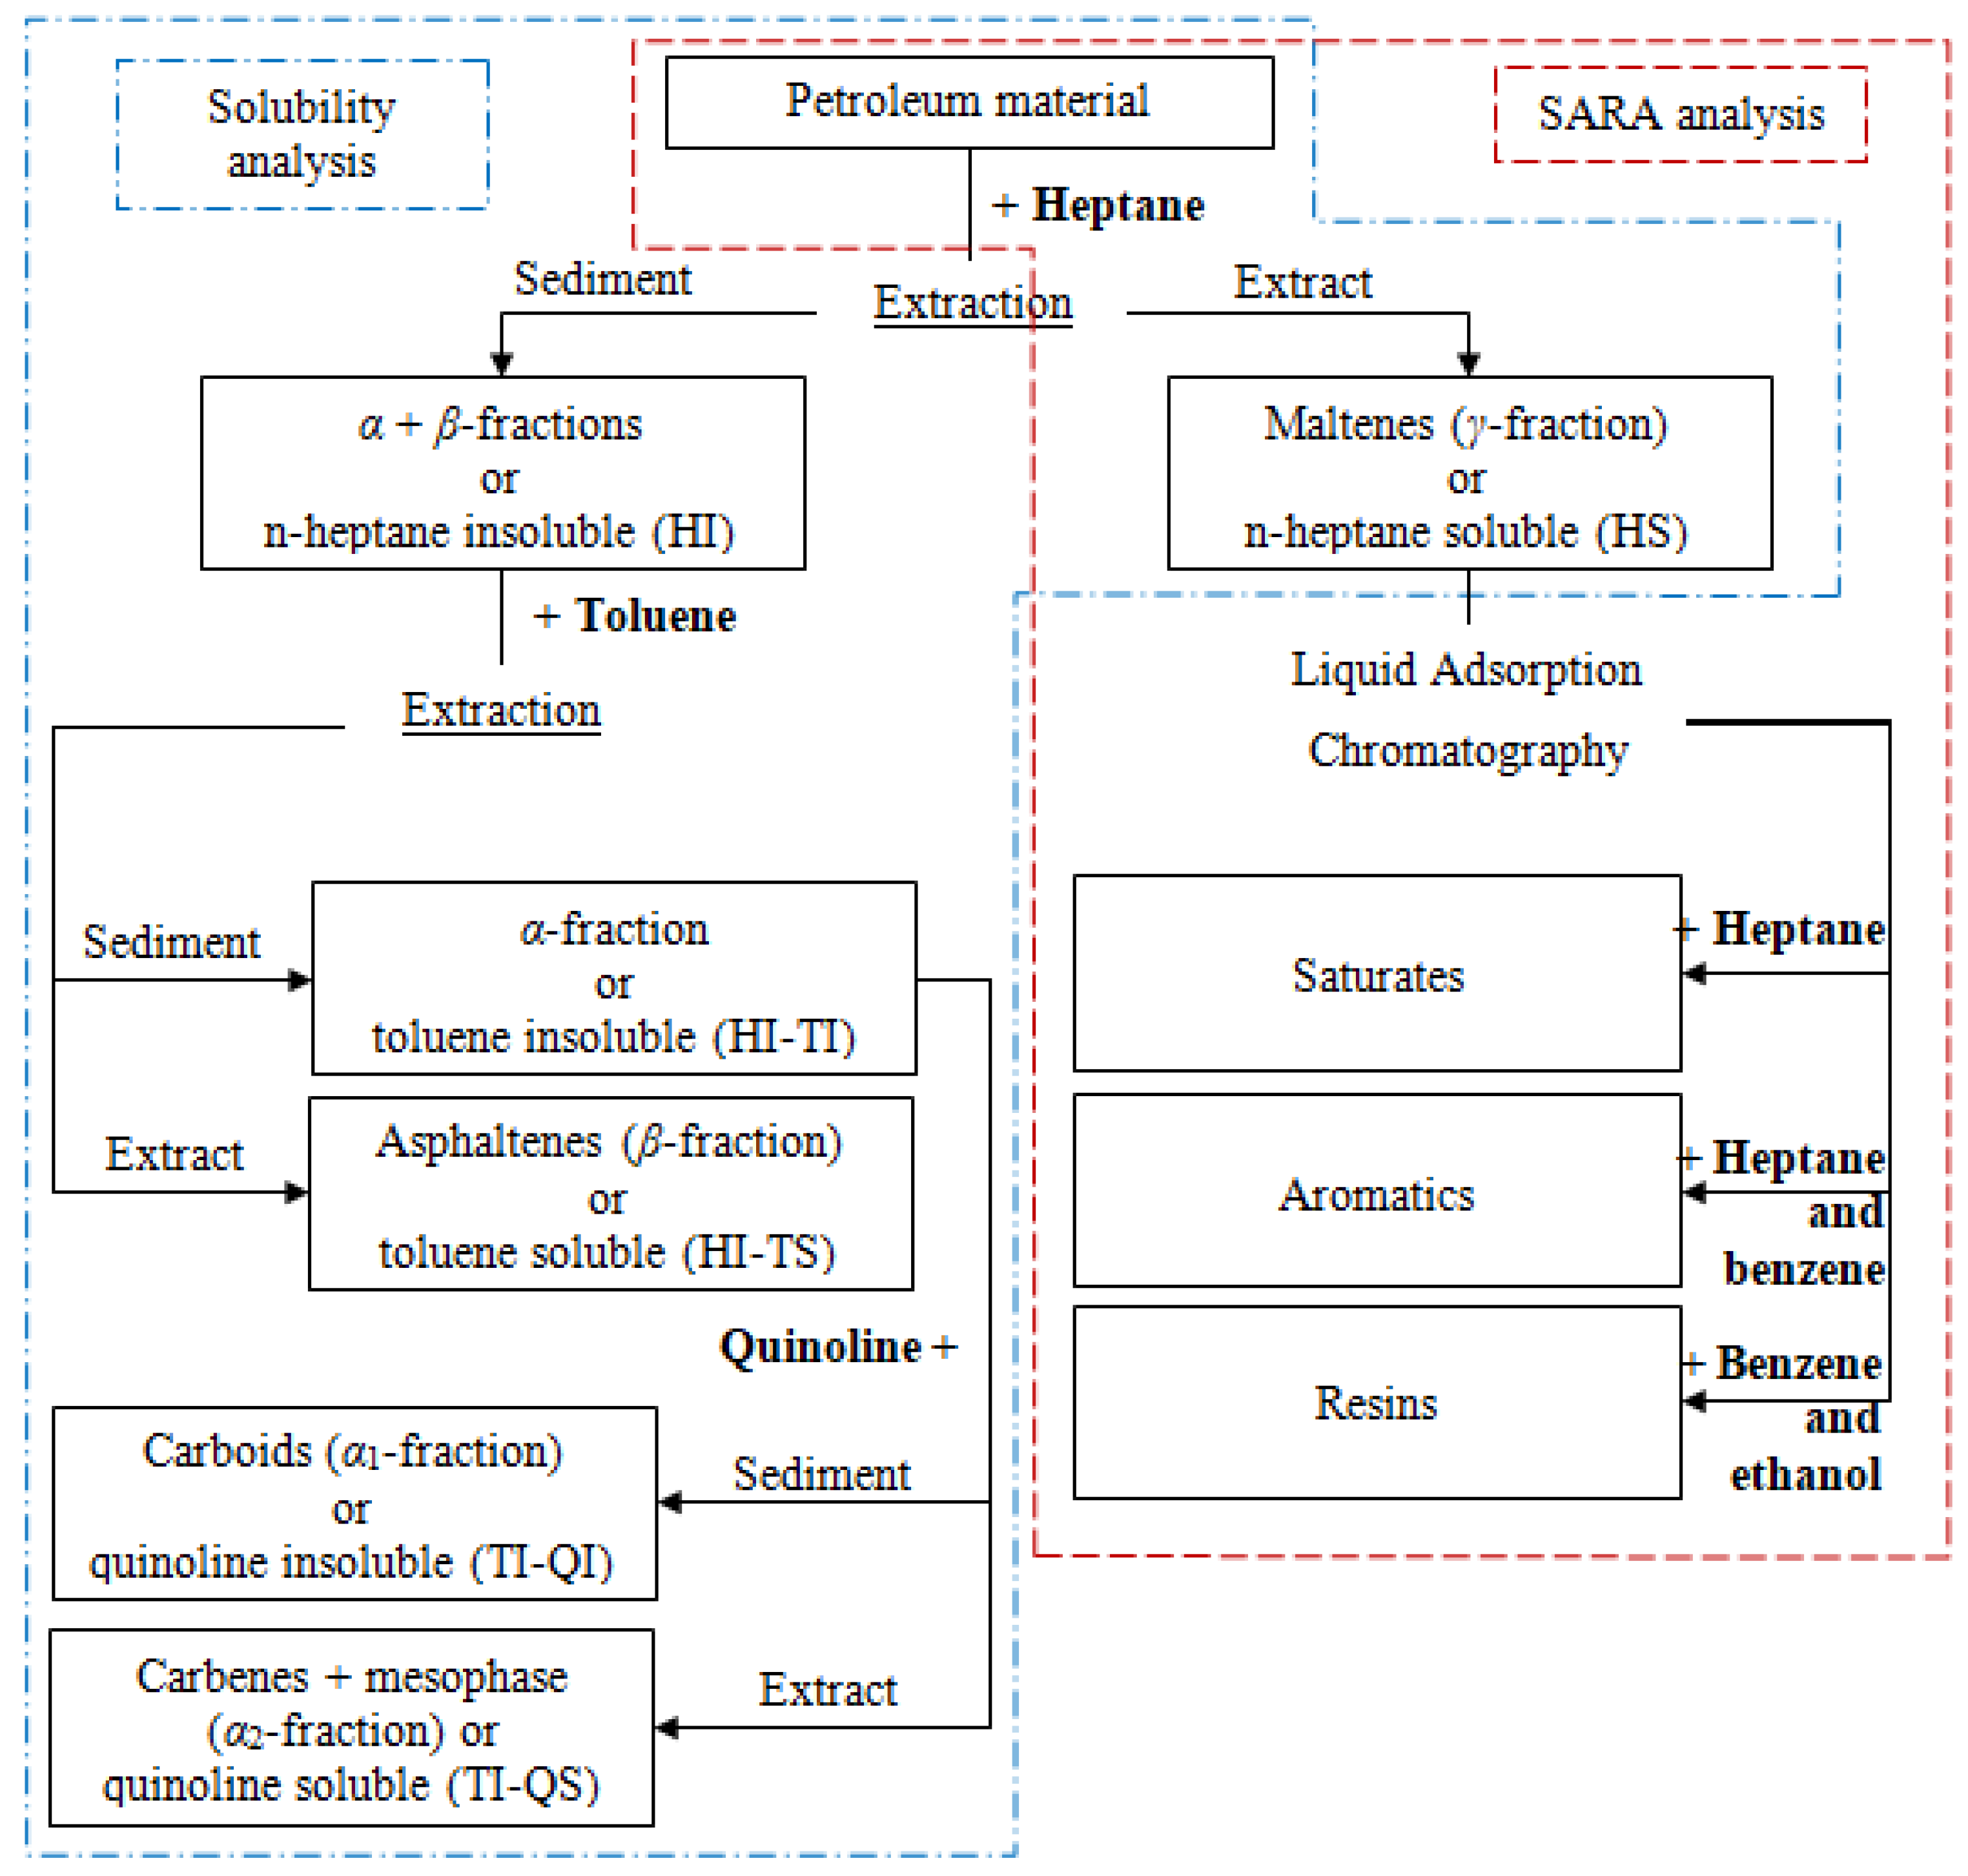
2.2. SARA Analysis of Vacuum and Visbreaking Residues
SARA analysis is one of the simple and widely used laboratory methods for breaking heavy oil residues into components. In this method, the compounds are separated into four analytic groups by solubility: saturated hydrocarbons, aromatic compounds, resins, and asphaltenes (respectively, saturates, aromatics, resins, asphaltenes—SARA).
Figure 3 shows a general flowchart of analysis of group hydrocarbon composition of residual oil fractions.
At the first stage, oil residues (vacuum residue, visbreaking residue) were mixed at an n-heptane/residue ratio = 40:1, then the mixture was stored for 24 h in a dark place at room temperature, after which the β-fraction (asphaltenes) and α-fraction (carbenes and carbides) were filtered from maltenes using a filter. After deasphalting, maltenes were analyzed by liquid adsorption chromatography.
2.3. XRF Analysis of Petroleum Asphaltene Composition
The quantitative content of the microelement composition of petroleum asphaltenes was carried out on an XRF-1800 Shimadzu wavelength X-ray fluorescence spectrometer without preliminary ashing of the samples and using the classical method of additions (CaCl
2). The cathode current was 90 mA and the tube voltage was 40 kV. For the calculations, a method of fundamental parameters with a standard algorithm taking into account the effect of the carbon matrix of the sample on the absorption of X-ray radiation was used [
39]. A sample weighed around 0.1 g. We used a method for calibrating the detector by one element, the essence of which is as follows:
(1) First, 1 ml of a CaCl2 solution in isopropanol (concentration of 2 mg Ca per 1 ml of isoprapanol) was added to a weighed portion of asphaltene and dried at 120 °C. Each sample was shot twice. The first time without additive and the second time with additive. Moreover, in both cases, the carbon content was postulated to be the same and was taken as equal to 98% of the mass. The remaining 2% were distributed according to the standard algorithm by the method of semi-quantitative analysis between the detected elements.
(2) Then, two ratios were calculated: A = % Ca/% S in the original sample and B = % Ca/% S in the sample with the addition of calcium. Naturally, B is always greater than A, for no sulphur was added. An equation of the form (D + A·X·M)/(X·M) = B. Here, D is the mass of calcium addition (2 mg), M is the mass of the sample (100 mg), and X is the true mass fraction of sulphur in the sample (it is unknown).
(3) Solving the equation for X, we get X = D/(M·(B − A))—the true mass fraction of sulphur. The quantitative content of the remaining elements is calculated by the proportion from the data for the sample without additive. That is, we believe that, if the content of calcium in the results of the analysis of a sample without additive is 10 times less than that of sulphur, then its true content is also 10 times less than that of X.
(4) If the sum of all impurities differs from 2% by more than 10% (that is, more than 2.2 or less than 0.18%), then a correction was made to the carbon content in the sample. Well, that is, if the sum of all elements turns out to be 3%, then the calculations are repeated from the very beginning with % C = 97. The procedure converges. Usually, 3–4 iterations are needed.
(5) This method was verified by analyzing artificial carbon mixtures and compared with the classical calibration curve method. It has always turned out to be much better, as the concentration ratios are subject to less variation than the concentrations themselves. A similar technique is widely used in quantitative gas chromatographic analysis.
2.4. XRD Analysis of the Structure of Petroleum Asphaltenes
X-ray structural analysis of samples of petroleum asphaltenes was carried out using an XRD-7000 Shimadzu X-ray powder diffractometer (Cu Kα-radiation, 2.7 kW) at room temperature. X-ray diffraction patterns were taken with long integration times (2 s) and a scan step size of 0.02. The obtained peaks (reflections) of petroleum asphaltenes with a maximum at double Bragg diffraction angles 2θ characterize certain structural components.
To identify the sizes of clusters of petroleum asphaltenes, the obtained X-ray diffraction patterns were deconvoluted into individual peaks. To do this, the spectrum was decomposed into individual Gaussians, as given by Equation (1):
where
and
are the parameters responsible for the height and width of the peak and
is the coordinate of the peak maximum.
The resulting spectrum was determined as the sum of four Gaussians with maxima around 20° (γ-band), 26° ((002) band), 40° ((100) band), and 21° (paraffin impurity band), as given by Equation (2):
where
C is the background level.
The first three peaks represent the peaks of the investigated asphaltenes. The fourth peak results from the presence of paraffin in the sample; taking this peak into account improves the quality of spectrum deconvolution. The background signal level (
C) was calculated by averaging the signal at the end of the spectrum (85–90°). The parameters
,
, and
for each Gaussian of the function
g (
x) were calculated by the confidence interval method from the SciPy package (method=’trf’) [
40]. A restriction
, where
corresponds to the maximum of the respective peak, was imposed on the parameter
. The parameters
and
were calculated without imposing restrictions.
The Wulff–Bragg’s equation [
41,
42] (3) was used to determine the interplanar spacings
d002 (or
dm),
d100, or
d110 in Å of the obtained samples of petroleum asphaltenes:
where
λ is the X-ray wavelength, e.g., equal to 1.5406 Å for CuKα;
θ is the Bragg’s diffraction angle, rad.
The spacing between the saturated structures of asphaltenes was measured according to the modified Wulff–Bragg’s equation proposed by Yen et al. [
33,
35,
43], as given by (4):
The average linear cluster size
Lc (average cluster height) and
La (average cluster diameter) were determined in Å according to the Scherer (5) and Warren (6) equations, respectively [
44,
45]:
where 0.89 is the Scherer’s constant, which is conventionally set to be the same for the sake of consistency in the published results [
46]; 11.84 is the coefficient derived by Warren for two-dimensional particle size; and
β is the full width at half maximum (FWHM) of the diffraction band height (in rad) minus the instrumental peak width
b of 0.14°.
The number of aromatic sheets per stacked cluster was determined by Equation (7):
The average number of aromatic rings per aromatic sheet (layer) was determined from Equation (8):
The aromaticity of asphaltene molecules (
fa) was calculated from the area (
A) of the peaks for γ-bands and graphene bands (002) using Equation (9):
where
CS,
CA, and
C are the number of saturated, aromatic, and total carbon atoms per structural unit, respectively. It should be noted that the calculation of the aromaticity
fa is based only on the aromatic carbon cluster, which contributes to the formation of the graphene peak (002), and not on the total aromatic carbon in asphaltene, thus it does not represent the true aromaticity of the asphaltene molecule [
32].
2.5. The Analysis of Stability of Residual Marine Fuels Using Ternary Phase Diagrams
One of the best graphic ways to describe the composition dependence on the relative quantity of phases is the phase diagrams, which were proposed by J. W. Gibbs and H. W. Roozeboom [
47]. The method of building and analyzing the composition–property diagrams was formulated by N.S. Kurnakov [
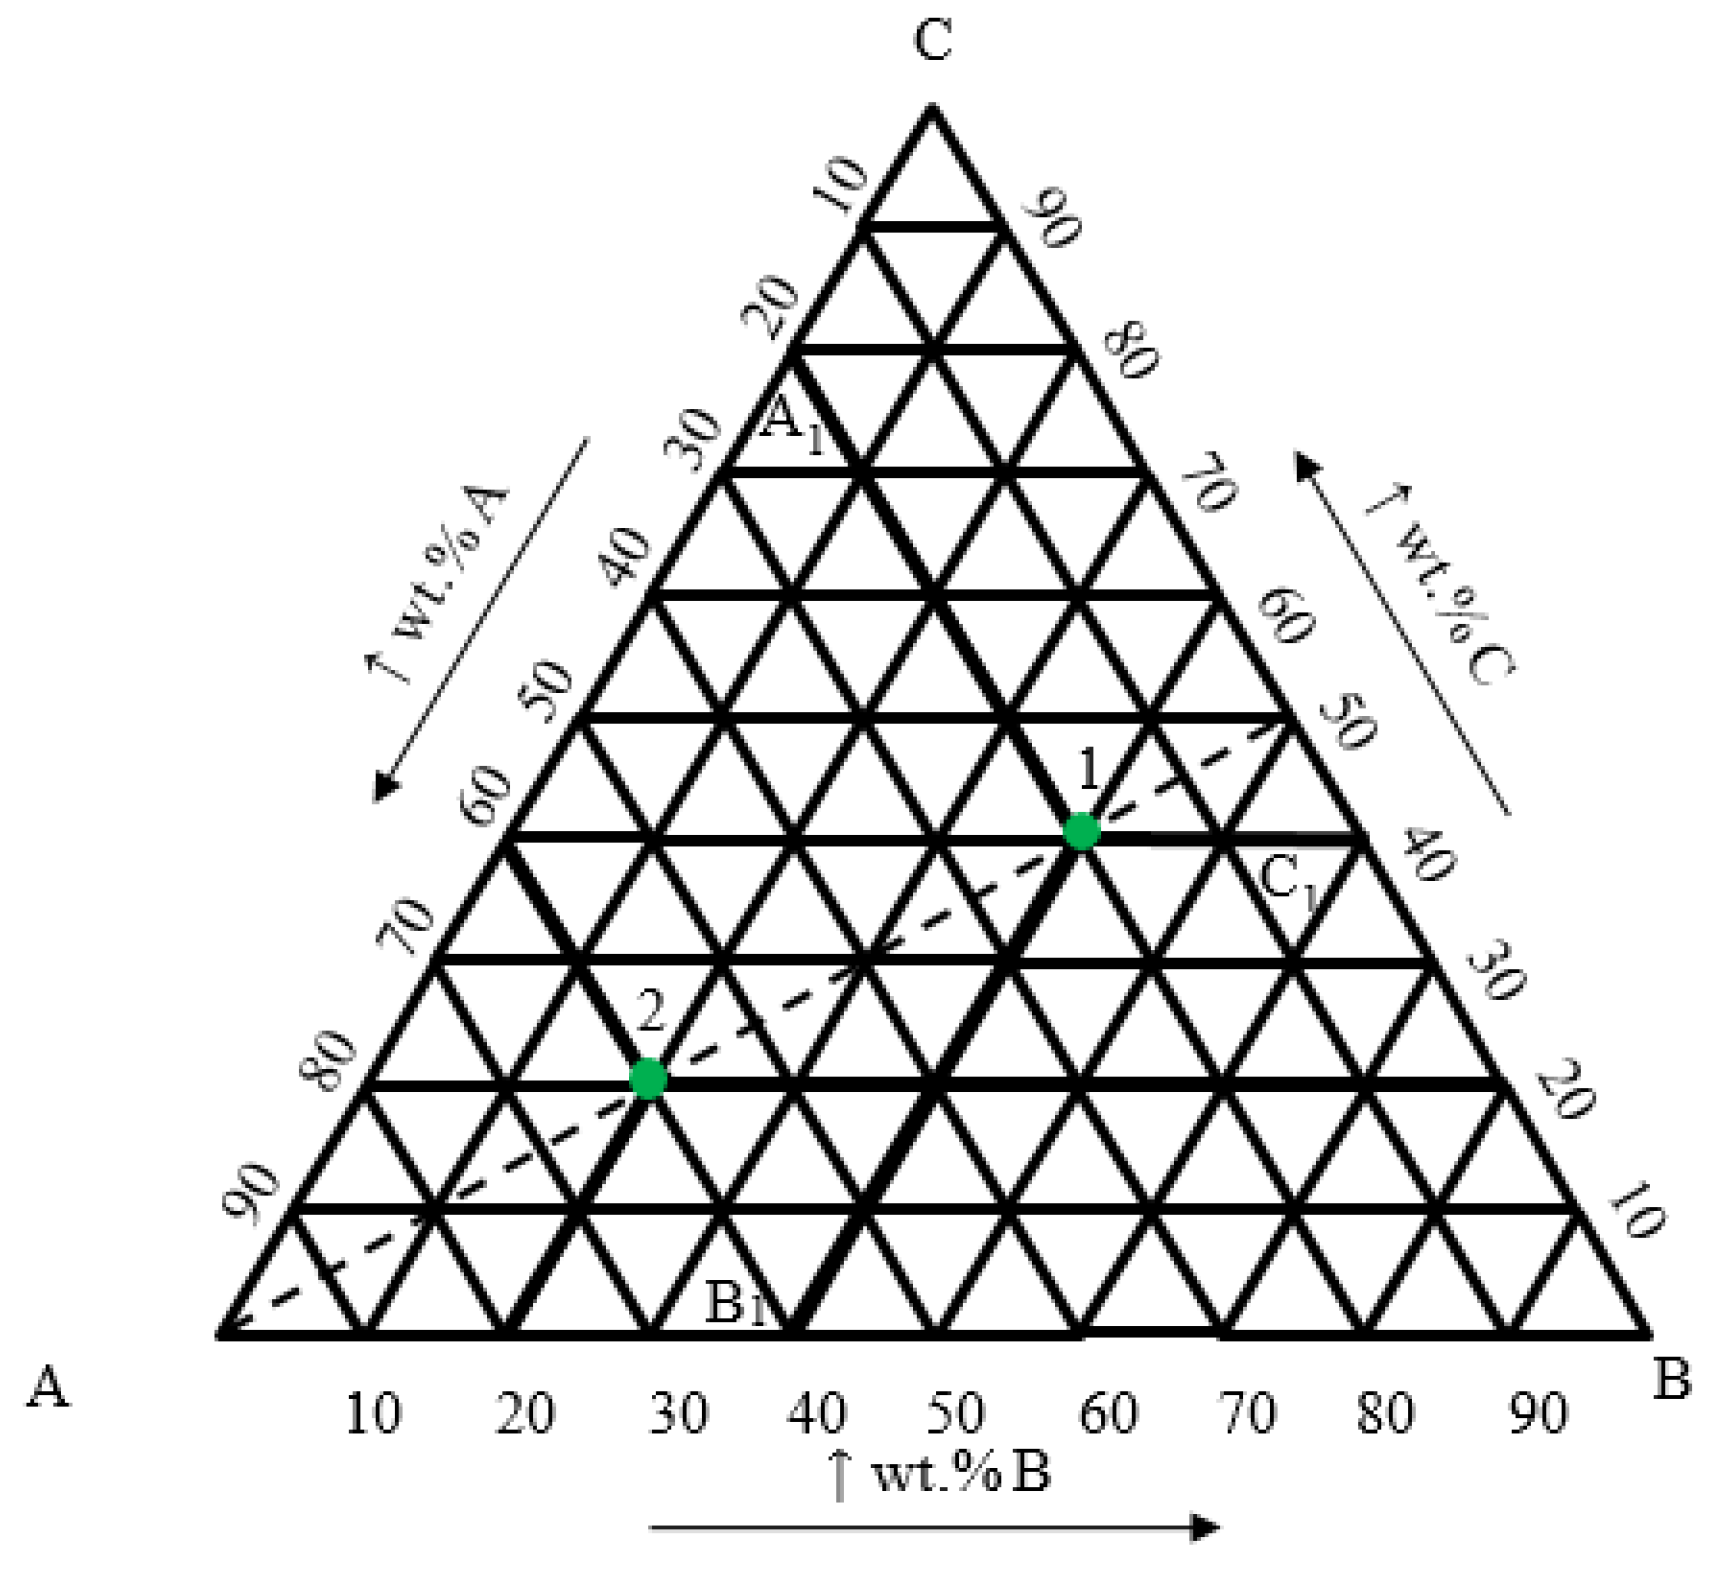
48]. The composition of three-component condensed systems on a plane is represented using an equilateral triangle—a triangle of concentrations (
Figure 4). Pure components (A, B, and C) are located in the apices of the triangle of concentrations, two-component systems (AB, BC, and CA) correspond to points on the sides of the triangle, and three-component systems correspond to points (e.g., points 1 and 2) within the triangle of concentrations.
The amount of all three components of a concentration triangle can be determined by drawing lines parallel to the sides of the triangle through a point selected in the triangle, and using the scale of the triangle sides. Let us, for example, determine the component composition of Sample 1. Let us draw a line parallel to the BC side and passing through the point A—we get an A11 line. Point A1 on the CA side demonstrates the relative amount of the component A. Similarly, we can obtain the amounts of the B and C components.
In this work, as external conditions, the parameters of the experiment in accordance with ISO 10307-1-2009 (analysis of “total sediment after chemical aging”—TSA) are used. The molecules of asphaltene hydrocarbons are either in a colloid dispersed form (liquid phase) or precipitated (solid phase). With a step size of 10 weight percent at each point of the ternary phase diagram, the indicator “total sediment after ageing” characterizing the stability of the fuel was determined. Stable fuel compositions are combined into a "stability area".
2.6. The Effect of Adding VacRes and VisRes Asphaltenes to the Commercial Residual Marine Fuel on the TSA Index
The HI-fraction (asphaltenes) isolated from the vacuum and visbreaking residues was filtered, dried, and crushed. Residual marine fuel was warmed up to 70 °C. Then, asphaltenes were introduced into residual marine fuel in parts during 1 h with heating and stirring. Then, the resulting mixture was stirred for 5 h until the mixture was homogeneous at a temperature of 70 °C.
3. Results and Discussion
3.1. Composition and Morphology of Petroleum Asphaltenes
The HI-fraction content is 16.0% for VacRes and 26.6% for VisRes (
Table 1). The results of XRF analysis were used to determine the microelement composition of asphaltene impurities (
Table 2). As expected, the main impurity in asphaltenes isolated from both VacRes and VisRes is sulphur, with contents of 4.74 and 3.58 wt%, respectively. The amount of potentially valuable elements of oil stock in the isolated asphaltenes—V and Ni—is from 0.099 to 0.108 wt% and from 0.028 to 0.036 wt%, respectively. The sulphur content of VisRes asphaltenes is 24.4% less than that of VacRes asphaltenes. This is due to the thermal cracking of VisRes asphaltenes, which results in the cracking of aliphatic chains containing sulphur. As a result of cracking, the bonds are broken, which includes sulphur, which is removed in the form of volatile compounds. This amount is comparable in content to petroleum cokes. The content of Ni and V in VacRes and VisRes is insignificant and is within the measurement error of the device. The amount of Ca, Si, and Al is from 0.00812 to 0.01131 wt%, from 0.00903 to 0.01508 wt%, and from 0.00271to 0.00471 wt%, respectively. Ca, Si, and Al are not destroyed during cracking, but remain part of the asphaltene. However, as the mass of the hydrocarbon part decreases, while the masses of Ca, Si, and Al remain constant, the content of these heteroatoms increases.
3.2. Petroleum Asphaltenes Structure
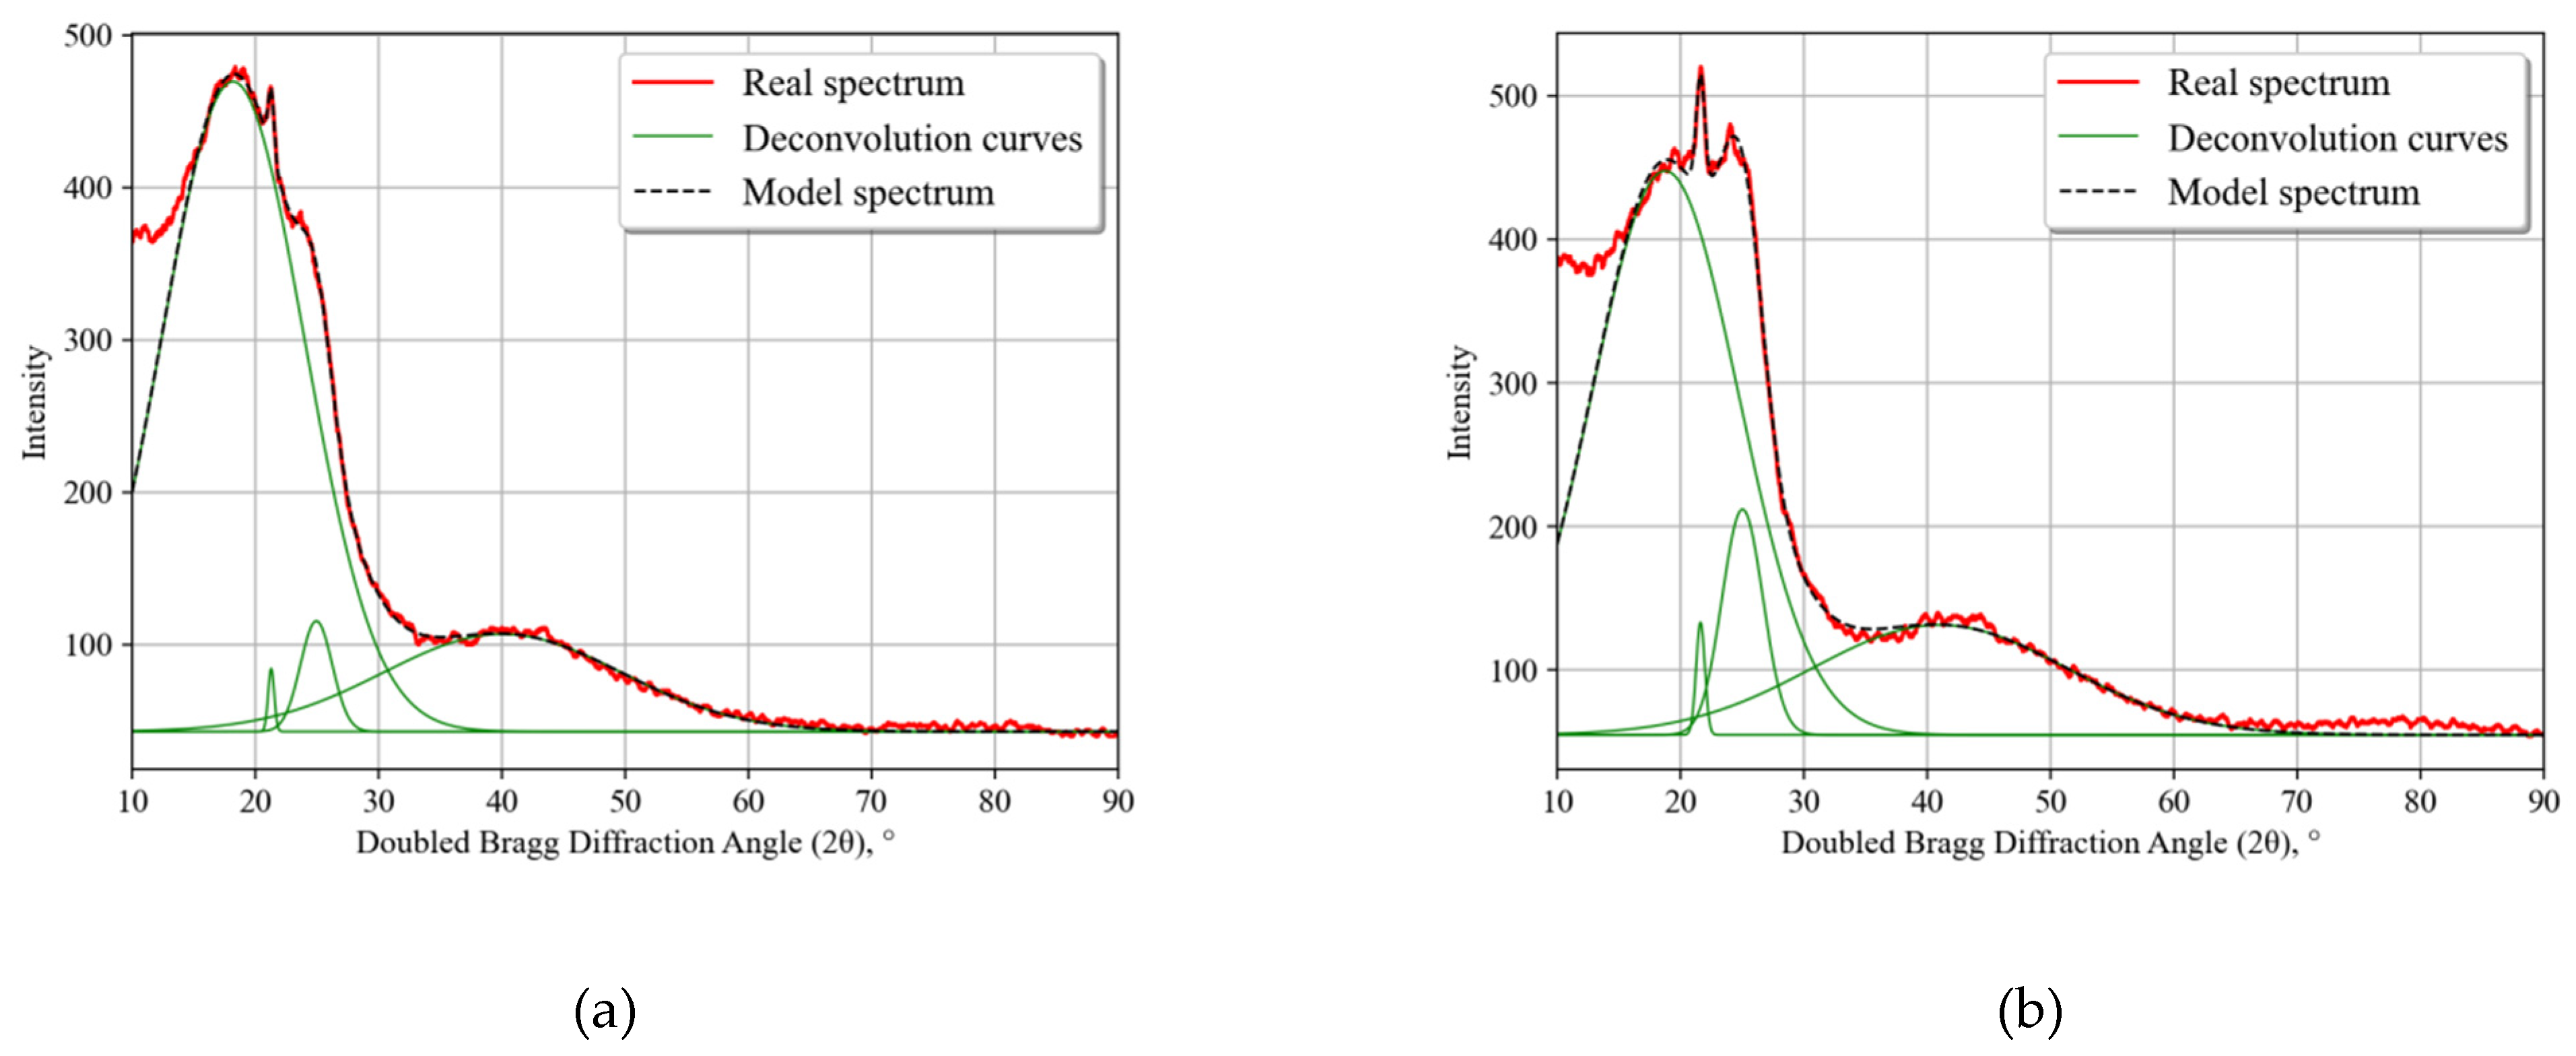
Figure 5 shows the diffractograms of VacRes (
Figure 5a) and VisRes (
Figure 5b) asphaltenes for real spectra and curve deconvolution. After the deconvolution of the XRD patterns of VacRes and VisRes asphaltenes, four peaks (bands) were obtained.
One of the peaks, located at a 2
θ angle of about 21°, is not characteristic of asphaltenes and is caused by the presence of long-chain crystallized n-paraffinic hydrocarbons, which, in some cases, co-precipitate with the asphaltenes [
49]. The other three peaks are characteristic of asphaltenes and are located at about 20° (γ-band), 26° (band (002) or graphene band), and 40° (band (100)). The results of the values measured during XRD analysis and the calculated parameters of the fine structure of asphaltenes are given in
Table 3.
The spacing between the saturated structures (dγ) is larger for VacRes asphaltenes than for VisRes asphaltenes, and is about 6.1 and 5.9 Å, respectively. This is due to a decrease in the length of aliphatic chains due to cracking reactions.
The interplanar spacing between aromatic sheets d002, on the contrary, is higher for asphaltenes from VisRes (3.88 Å) than for asphaltenes from VacRes (3.57 Å). The increase in the spacing between the neighboring aromatic sheets after thermal cracking is due to the removal of side-chains and, as a result, the cluster compactness loosening.
As a result of cracking, for the cluster size, Lc and La are reduced (from 26.72 to 20.78 Å, respectively, and from 7.68 to 7.20 Å for asphaltenes from VacRes and VisRes, respectively) owing to the rupture of aliphatic chains between aromatic sheets in the cluster. Because of the division of the cluster into parts, there is a decrease in the number of aromatic sheets per stacked cluster M cluster (from 8 to 7) and a decrease in the average number of aromatic rings in the NOar sheets (from 2.9 to 2.7).
As a result of the thermolysis reaction, cracking of aliphatic chains occurs, their number decreases, the proportion of the densification reaction is insignificant, and the number of aromatic rings practically does not change, which is confirmed by an increase in the aromaticity of asphaltene molecules (fa from 0.04 to 0.10).
3.3. Stability of the Residual Marine Fuel Oil
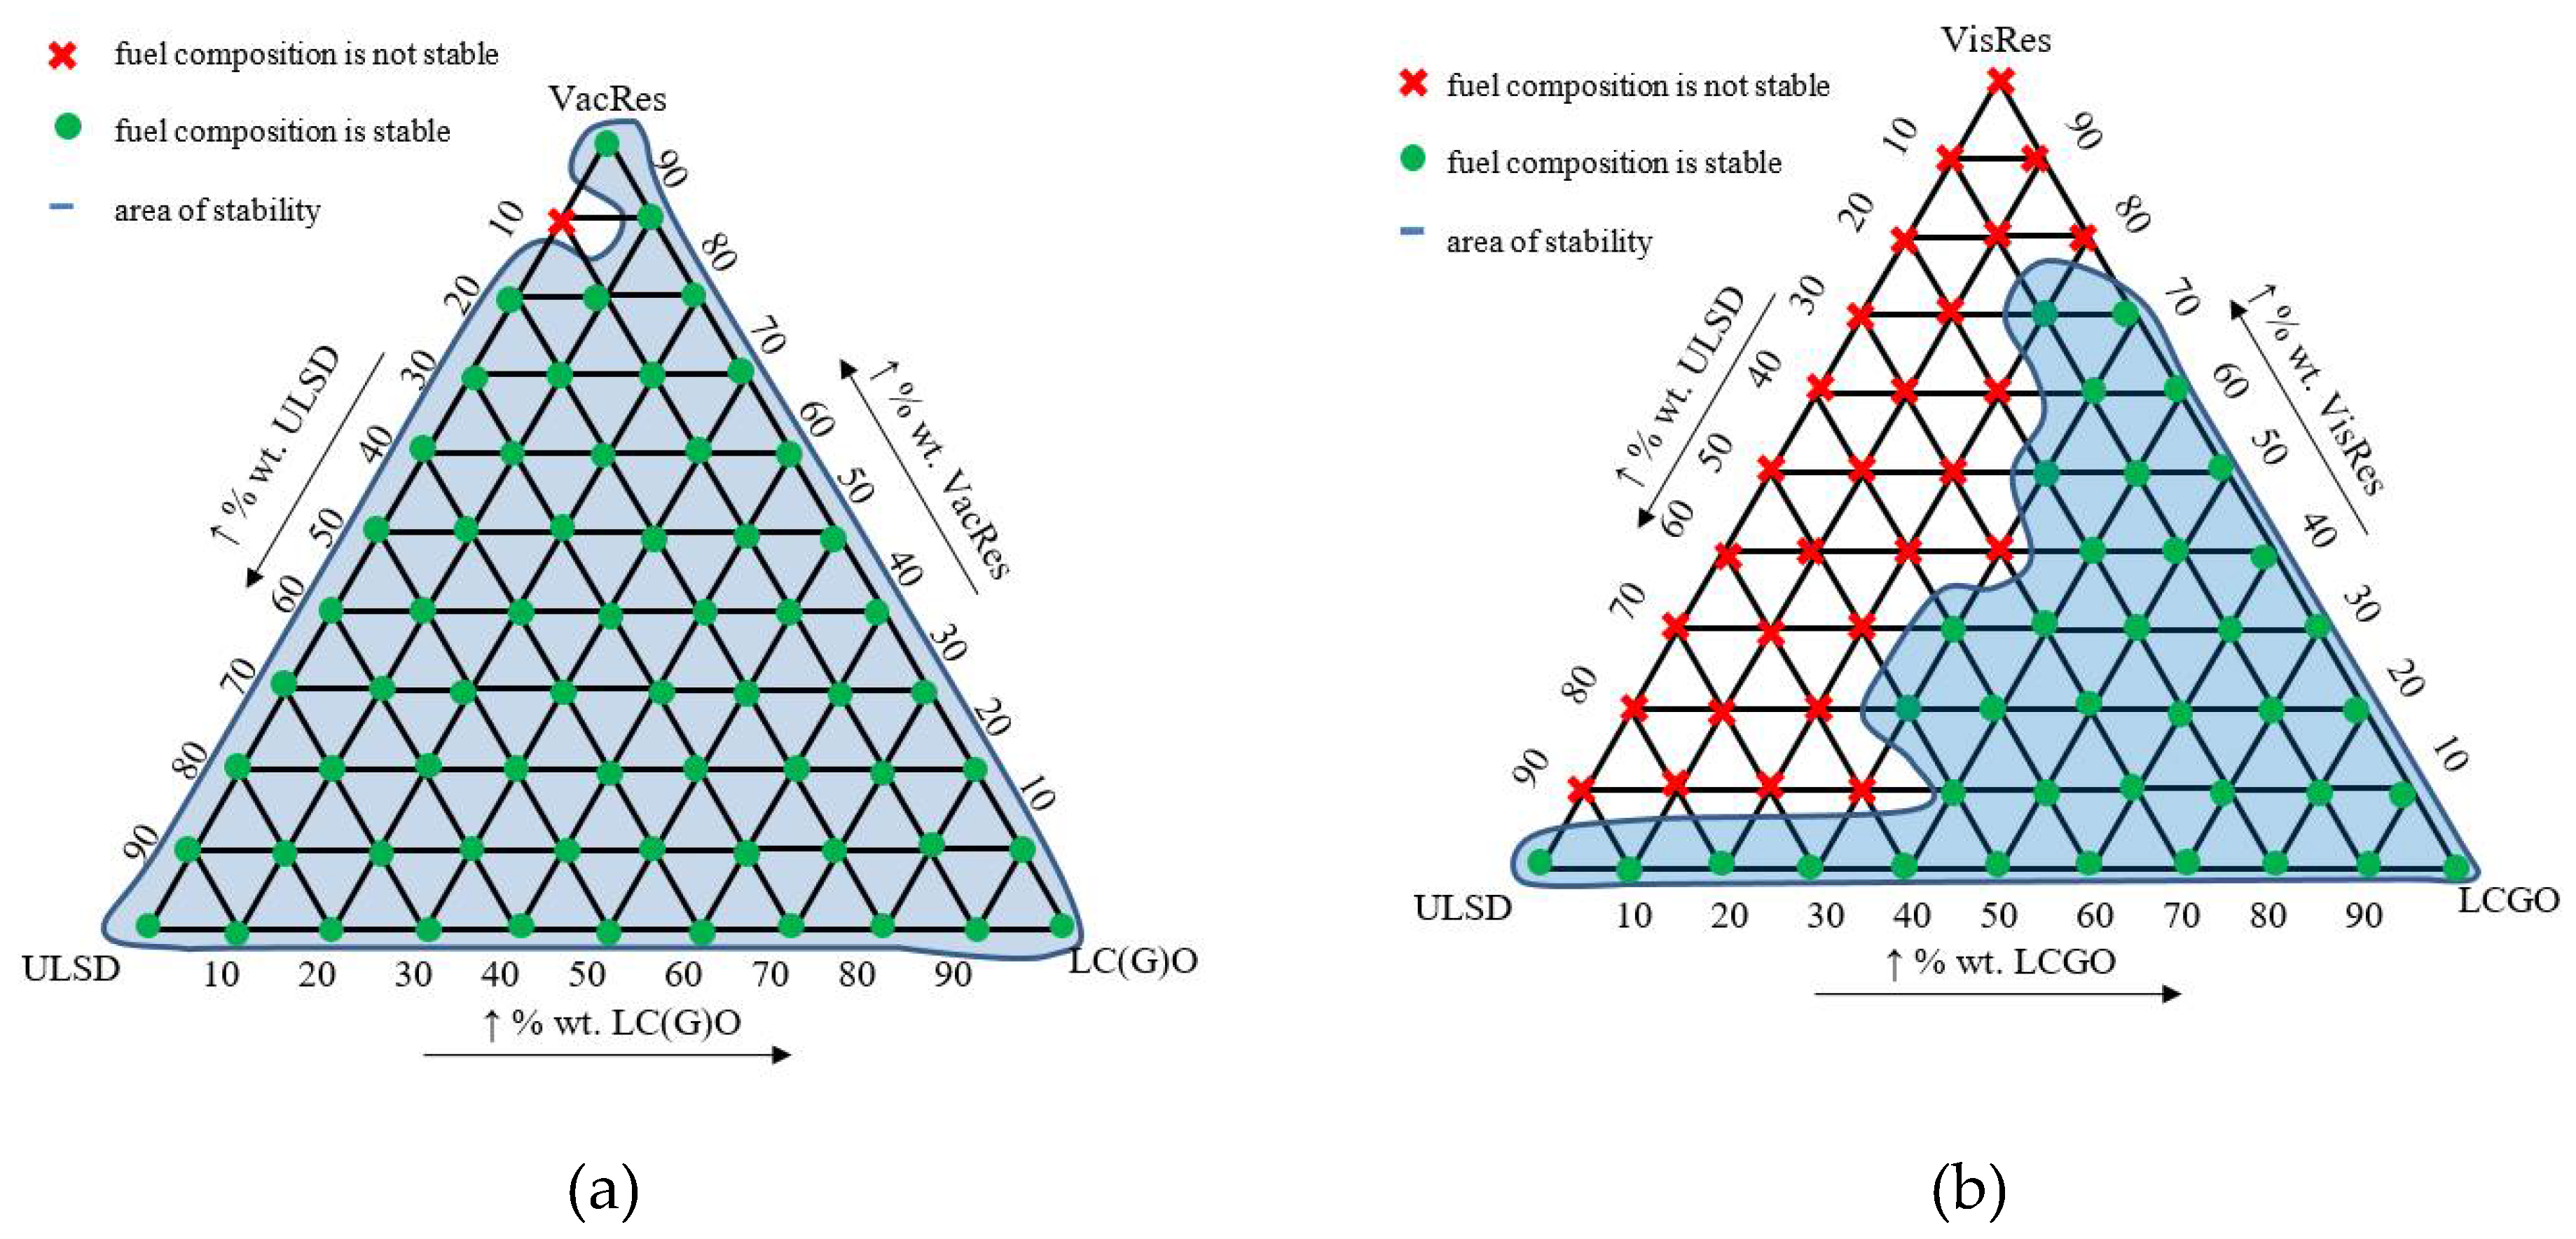
Figure 6 shows the ternary phase diagrams of stability of the residual marine fuel oil (VacRes–ULSD–LCGO and VisRes–ULSD–LCGO).
It can be seen from the phase diagrams of sedimentation stability (ISO 10307-1-2009) that the obtained results differ dramatically for marine fuels based on primary processing residues (VacRes) and thermodestructive process residues (VisRes). Vacuum and visbreaking residues contain about 37.0 wt% of resinous-asphaltene substances, where vacuum residue contains 16.0 wt% of asphaltenes, and VisRes contains 26.6 wt% of HI-fractions, which, in addition to asphaltenes, also contains carbenes and carbides. Carbenes and caborides are more condensed structures than asphaltenes. In addition, their solubility is lower than the solubility of asphaltenes in hydrocarbons. Thus, carbenes and carbides are more prone to sediment formation. The ratio of the 65 stable compositions (number of green dots in
Figure 6) to the total number of possible compositions of 66 was 98.5% for residual marine fuel comprising a mixture VacRes–ULSD–LCGO. Meanwhile, the ratio of the 38 stable compositions (number of green dots in
Figure 6) to the total number of possible compositions of 66 was 57.6% for residual marine fuel comprising a mixture VisRes–ULSD–LCGO.
Additional studies have been conducted to support the claim that differences in asphaltene structure have a significant impact on the stability of residual marine fuel. The isolated asphaltenes from VacRes and VisRes were added in amounts of 2.5 and 5.0% wt., respectively, into commercial residual marine fuel of RMG 380. Quality indicators of commercial residual marine fuel RMG 380 are presented in
Table 4. The results of determining TSA are presented in
Table 5.
TSA of residual marine fuel with the addition of 2.5% asphaltenes from VacRes increases 1.2 times, while adding asphaltenes from VisRes increases it 3.7 times. TSA of residual marine fuel with the addition of 5.0% asphaltenes from VacRes increases 4.8 times and, with the addition of asphaltenes from VisRes, it increases 9.9 times compared with the initial TSA value. Thus, the additional study confirms that the structure of asphaltenes is an important factor affecting the change in the stability region of residual marine fuel. The group hydrocarbon composition (SARA) of the fuel has a significant effect on the stability of residual marine fuel, but the degree of condensation of asphaltenes, cluster parameters, microstructure, and morphology also have a huge effect on the stability of the fuel system. This is because it is the decrease in the solubility of asphaltenes of heavy oil residues that is the main reason for the loss of fuel stability, which in turn depends on these parameters.
4. Conclusions
The stability of residual marine fuel is influenced not only by the component and hydrocarbon composition, but also by the structure of asphaltenes.
The main reason for the instability of residual marine fuel is the component and hydrocarbon composition, which is confirmed using three-component phase diagrams. Vacuum and visbreaking residues contain about 37.0 wt% of resinous-asphaltene substances, where vacuum residue contains 16.0 wt% of asphaltenes and VisRes contains 26.6 wt% of HI-fractions. Paraffin-naphthenic hydrocarbons (96%) contained in ULSD have a significant effect on the stability of the fuel system, especially n-paraffins, the content of which reaches 43%. With an increase in their concentration in the mixture, VacRes/ULSD, and reaching the critical concentration, the hydrocarbon composition of the mixture changes so much that the fuel mixture becomes unstable. LCGO has a high content of aromatic hydrocarbons, which, when added even in an amount of 20%, increase the solubility of asphaltenes and make the entire fuel mixture stable.
In addition, asphaltenes of different nature, which are the main cause of the instability of residual marine fuel, have a different structure.
As a result of cracking, for the cluster size, Lc and La are reduced (from 26.72 to 20.78 Å, respectively, and from 7.68 to 7.20 Å for asphaltenes from VacRes and VisRes, respectively) owing to the rupture of aliphatic chains between aromatic sheets in the cluster. Because of the division of the cluster into parts, there is a decrease in the number of aromatic sheets per stacked cluster M cluster (from 8 to 7) and a decrease in the average number of aromatic rings in the NOar sheets (from 2.9 to 2.7).


 ,
, 


