1. Introduction
In small islands, pocket beaches quite often represent one of the most important tourist assets [
1], and this is even more true for those in the Mediterranean Sea [
2,
3], where a strong transition from traditional activities (agriculture and fishing) to tertiary activities (almost exclusively tourism) occurred in the 20th century [
4,
5]. Furthermore, in small islands, pocket beaches with a limited sediment stock are extremely vulnerable to sedimentary input reduction [
6], which is frequently produced by the abandonment of cultivated lands [
7]. In those sites where attractive landscape values support beach tourism, shore protection projects based on the emplacement of hard structures should be limited and artificial nourishment preferred, at best associated with small containment structures. This is the most sustainable option to preserve the natural scenic beach value and all beach-related activities [
8,
9,
10].
Beach nourishment projects on small islands are quite complex because their limited surface and complex orography often prevent finding suitable natural borrow materials in land deposits, and the importing of sediments from the mainland is extremely expensive [
11]. In addition, environmental constraints do not allow shelf sediment dredging and, in any case, mob-demob cost for deep operating dredges is not justified by the small volumes of sediments usually required. Riverbed quarrying, which however is forbidden in Italy, reduces sediment input to the coast and cannot be a solution to contrast coastal erosion.
Therefore, one option is rock crushing to produce gravel to create coarse sediment beaches, whose pros are:
Higher stability than sand beaches [
12];
Higher dry beach expansion at a given fill volume [
13];
Clearer water, since there are no fine sediments that can be suspended [
14];
No sticking on the beachgoers’ skin [
16].
However, some cons must be considered, e.g.,:
Less ease in walking and lying on the beach and entering the sea [
17];
Steeper swash zone, which is an obstacle for elderly, children and disabled people [
17];
Reduced play possibilities for children and limitations to beach games and sports [
18,
19].
In Italy, gravel and grains have been used both to build a new beach where it was completely lost, e.g., at Cala Gonone [
20], Marina di Pisa [
21], or to expand an eroding sand beach, e.g., at Massa [
22] and Terracina [
23]. The case considered in this paper refers to a pocket beach in front of a small village named Cavo, in the eastern coast of the Elba Island, in the Thyrrhenian Sea, Italy (
Figure 1).
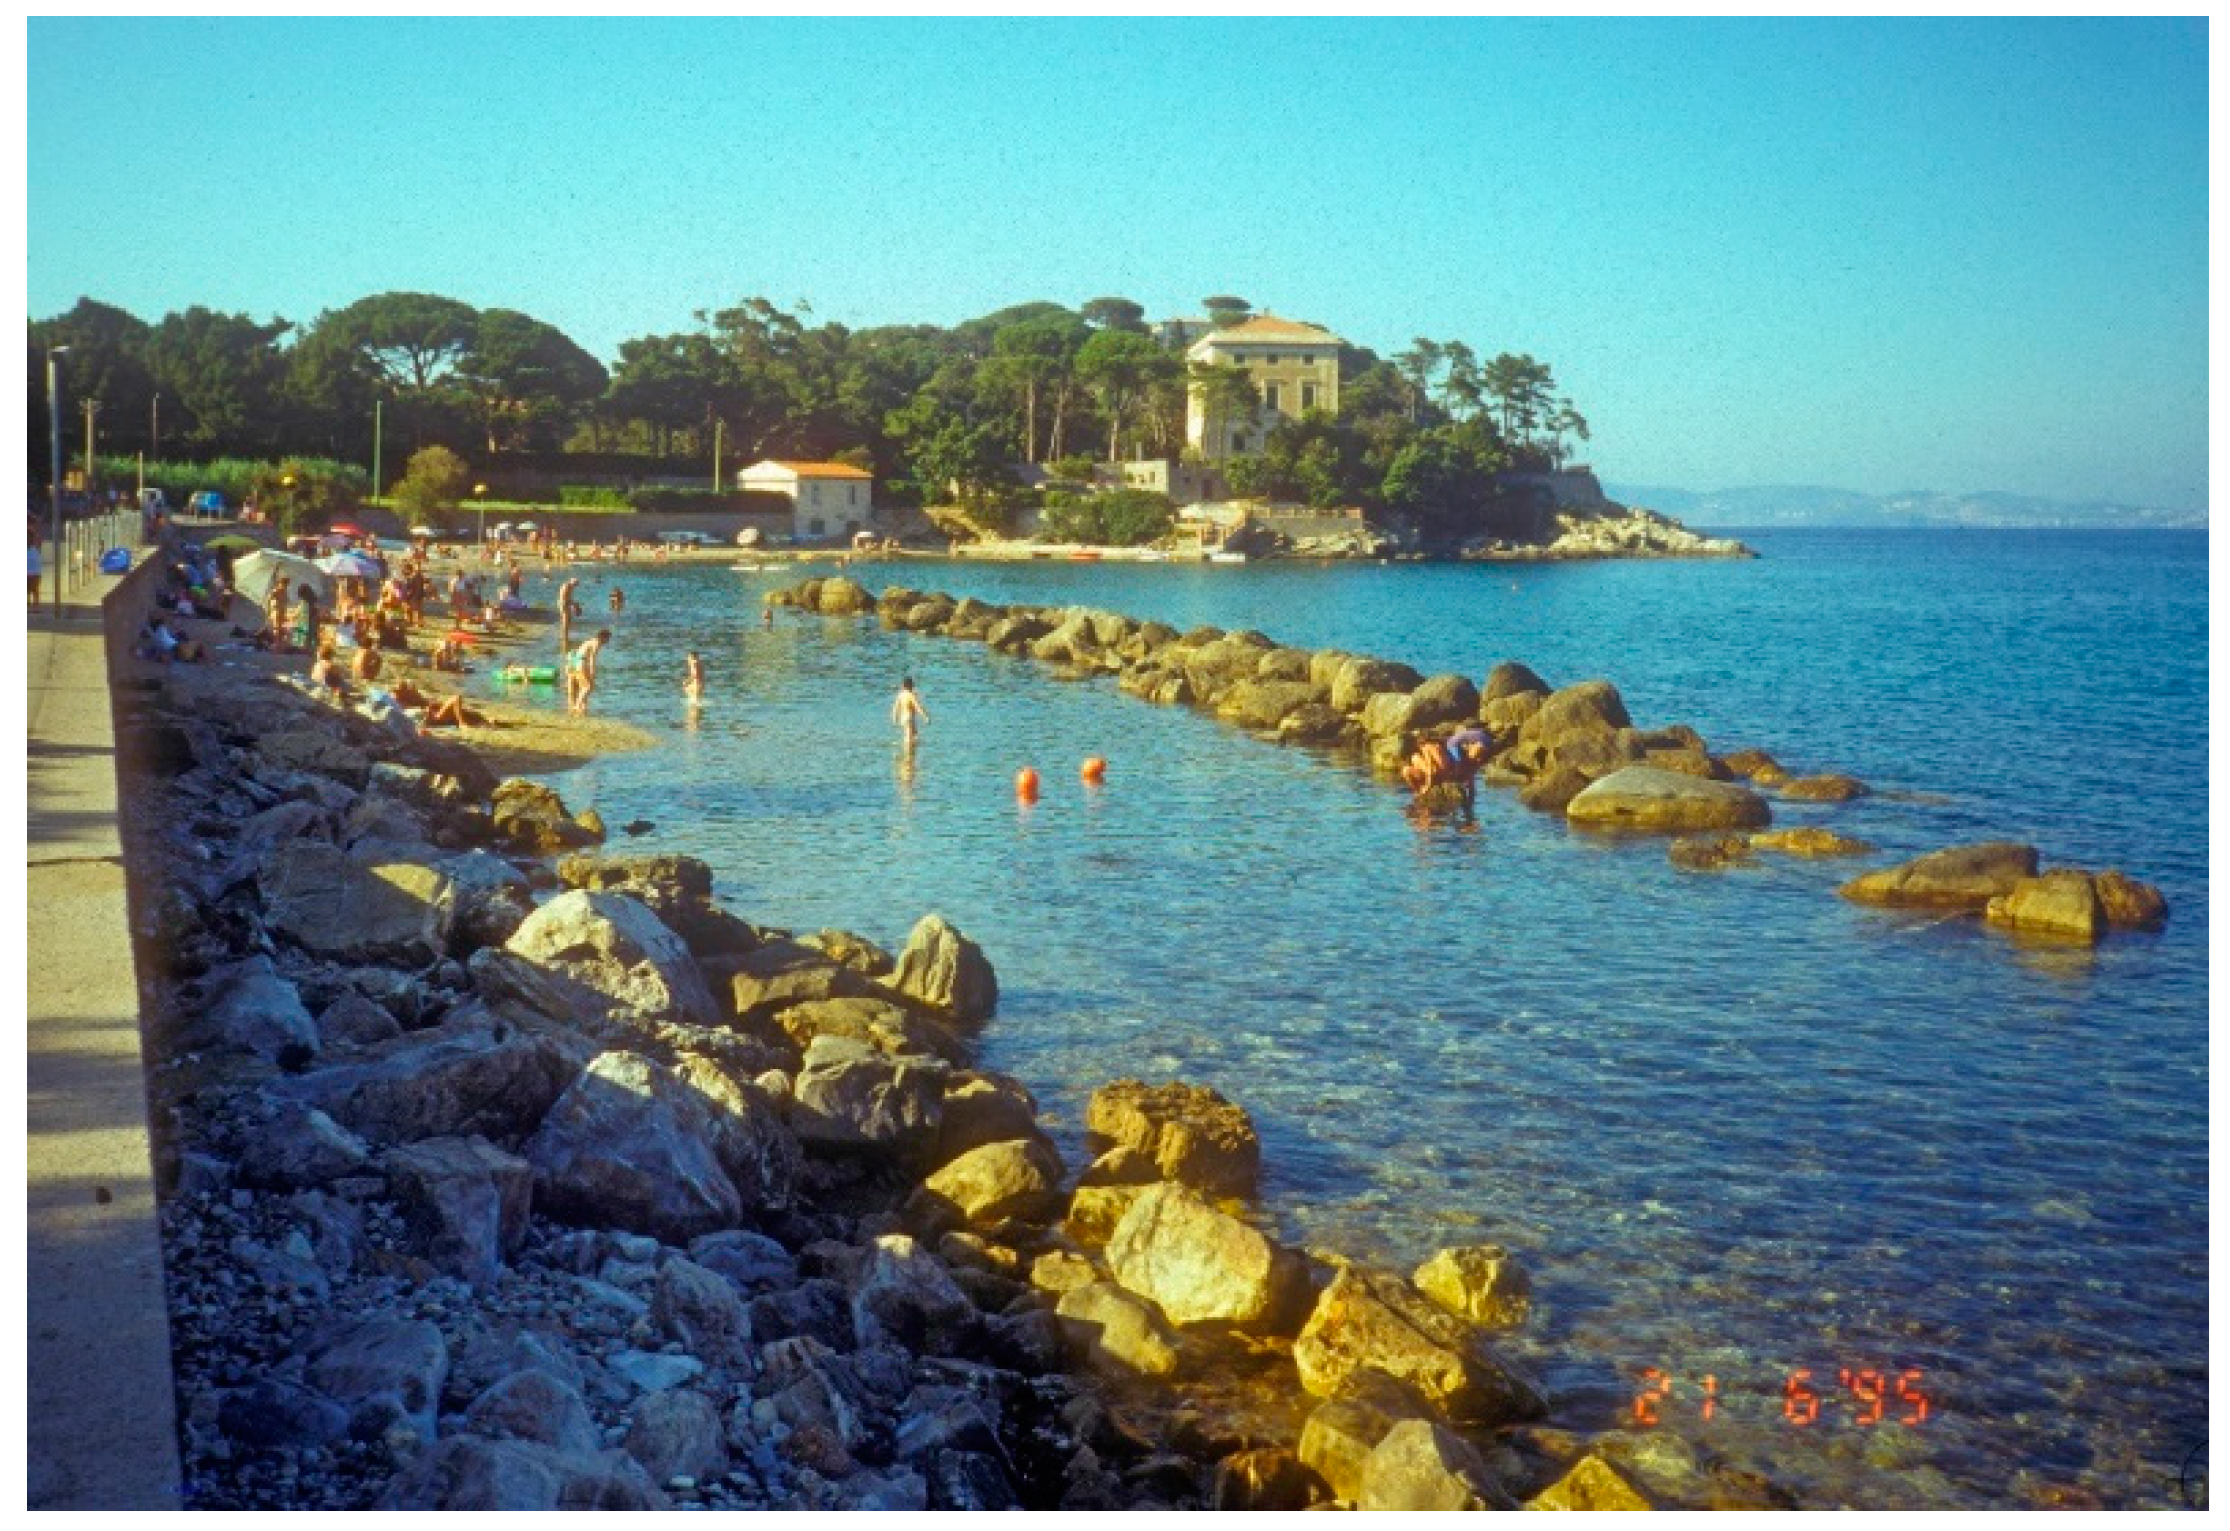
At such beach, in the 1970s, sand was almost completely lost, and a revetment was positioned adjacently to the coastal road and two detached breakwaters were constructed, thus preventing access to the sea and creating very dangerous nearshore conditions (
Figure 2). After an attempt to restore the original mixed sediment sand and gravel beach carried out in 1999 (
Figure 3), which created a hard surface disliked by tourists, and environmental concern for the water turbidity on the
Posidonia oceanica meadow, a pure gravel beach was constructed in 2006–2008 (
Figure 3) with the satisfaction of beachgoers and local stakeholders.
The artificial fill was not accompanied by a specific monitoring, as frequently happens for coastal defence projects in Italy. However, for this case, a three-year monitoring was commissioned to the University of Florence (Italy) by the works contracting entity (the Provincia di Livorno, i.e., the provincial administration), and results of such studies appeared only in grey literature and essentially concerned administrative and project management issues. Ten years later, a survey of Cavo beach was commissioned by the Regione Toscana (i.e., the regional administration) within the framework of a wide regional project focused on the monitoring of all regional beaches. Despite the nonhomogeneous temporal spacing of acquired data regarding Cavo beach evolution, this paper describes the different coastal projects actuations and assesses the effectiveness of the nourishment project carried out in 2006–2008, giving only some indications on a previous project performed in 1999 for which data are extremely poor. Results, which demonstrate the fill stability and the approval of the type of material by beachgoers, are of interest to coastal planners and can be useful for designing new gravel beaches or to expand eroding ones in similar environments.
2. The Beach at Cavo (Elba Island, Italy)
The beach of Cavo (
Figure 1) is located inside a bay facing NNE (fetch width from 32° N to 107° N) sheltered by the Central Tuscany coast. Fetch length at the extremes of the angle is 6.3 and 17.0 nautical miles (nmi), respectively (13.4 nmi along the bisector of the opening angle 69.5° N). No physical or virtual wave gouges are present in this sea sector, and data on wave climate can be obtained from the “Wind and Wave Atlas of the Mediterranean” [
24], where the nearest point is 22 nmi south of Cavo at 25 nmi from the coast, thus has a longer fetch than the real one observed at Cavo. At such point, waves approach from the 30–120° N sector and significant wave height (H
s) > 2.0 m approach from 30° N and represent 0.2% of records. Tidal range is 36 cm at the Livorno Gouge, on the continental coast [
25].
2.1. The Loss of the Beach
Cavo is a little village located on the eastern side of Elba Island (
Figure 1) where, since Roman times, the main traditional activity has been iron mining, flanked by some agriculture consisting mainly of vine cultivation, the main occupation in the rest of the Island.
After WWII, all the island recorded a transformation of the economic activity, from agriculture to tourism, but such a shift took place a bit later on the eastern side, since mining activity lasted, although with reduced production, until 1981 [
26]. All the beaches at Elba Island are eroding because sediment input was reduced when the crops were abandoned, and the forest grew [
27,
28,
29]. On the eastern side, additional sediment input to beaches was linked to mining activity because waste materials from excavations were abandoned on the slopes of mountains and thus easily transported by run-off processes to the coast [
30]. Therefore, the beach of Cavo and others on the eastern coast, formed thanks to land erosion of cultivated areas and erosion of quarry waste deposits, but when both activities were interrupted, coastal retreat also interested this part of the island. In addition, a small pier with impermeable root was created on the southern side of the bay as a docking structure for ferries connecting the island to the continent and a small marina added at its northern side. These structures interrupted the limited longshore sediment transport and contributed to the urban beach disappearance, a loss only apparently compensated by the expansion of the beach placed updrift, the latter being in a marginal area of lesser tourist value.
At the same time, this village also started to look for new opportunities in 3S (Sun, Sea and Sand) tourism, with few hotels and some second houses, but the beach was almost inexistent and could not support this activity.
2.2. The Making of the Gravel Beach
At the end of the 1990s, the beach in front of the village of Cavo was constituted by only two narrow strips of sand, one close to the northern headland and one leaned on the marina downcoast dock. In addition, the coastal road was defended by two detached breakwaters and by a revetment (before 1954) making difficult and extremely dangerous the use the beach for bathing activity (
Figure 2).
The wide beach, which is now in front of the village, is the result of a complex and controversial story that presents technical and legal aspects, both of which were important for the achievement of the design solution that led to the current configuration of the coastline. This story can be synthetized in two projects: the first carried out in 1999 and the second between 2006 and 2008; the latter being the main topic of this paper.
2.2.1. The First Project (1999)
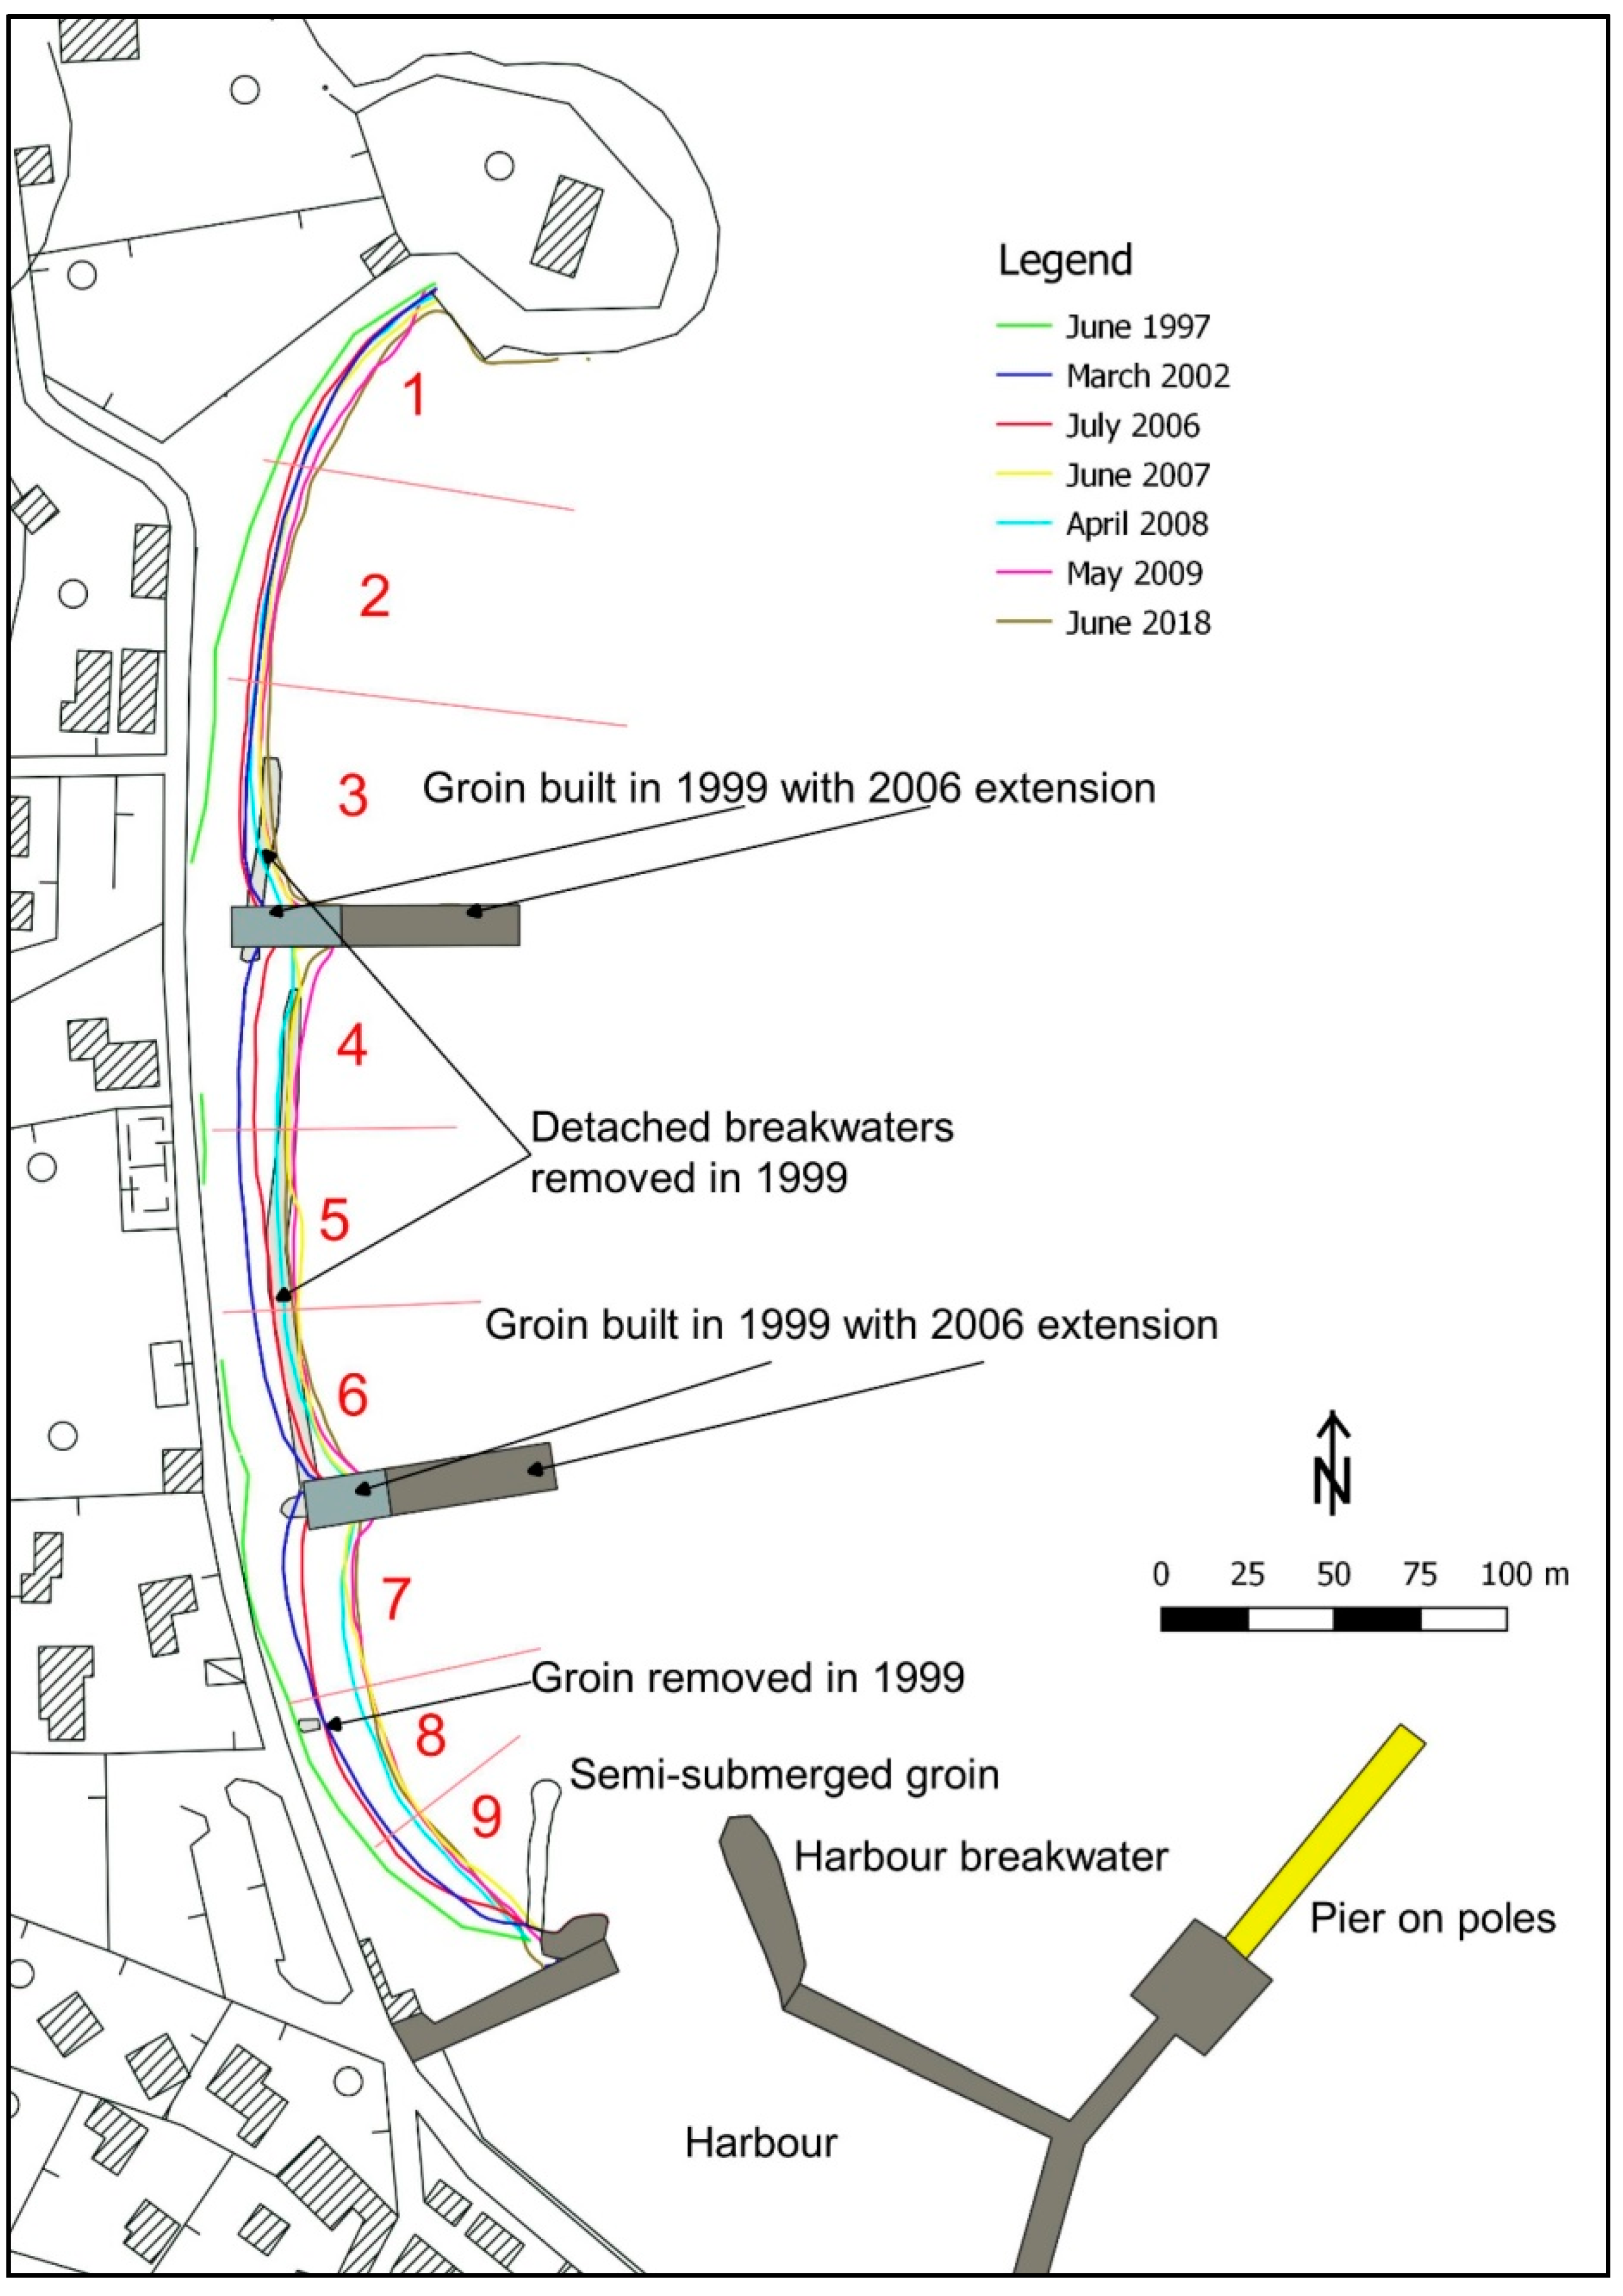
In 1999 a project was carried out to create a 10-meter-large beach in front of the street wall. The previous detached breakwaters and the revetment were removed, and two short groins constructed to divide in three parts the 497 m long coastal sector delimited by the headland to the north and the marina to the south (
Figure 3).
Due to the lack of suitable natural aggregate deposits on the Island, wastes of the old iron mines were used as borrow material. They consisted of unsorted sand and gravel, with a high percentage of fines (silt and clay = 13%) formed by yellow-red iron oxides [
29]. The presence of heavy minerals in excess respect to environmental regulations was later assessed as well.
The nourishment was carried out just before the tourist season, but results were not those expected: the sea water acquired a red colour that persisted during all the summer and several tourists cancelled their hotel reservations. The Posidonia oceanica meadow, present in the nearshore, was covered by a thin layer of clay and the risk of some permanent ravages was raised. Local stakeholders claimed environmental and economic damages, and the case arrived at the court. Monitoring of the Posidonia proved that no long−lasting injury was done, and economic loss not motivated. As far as heavy minerals are concerned, further analyses showed that all the beaches present along the eastern side of the Island have similar concentrations, mostly deriving from more than two thousand years of mining activity.
In the months after the nourishment, the borrow material compacted and became impermeable because something similar to a beach rock was formed (
Figure 4) so that, during the following winter storms, run up water was not able to infiltrate into beach sediments and reached the coastal road [
31]. Permeability measurements were performed by the University of Florence in three points of the beach (north, centre, south), giving a permeability coefficient (K
s) between 5.0 × 10
−6 and 1.3 × 10
−7 m/s (typical of silty to silty-clay sediments).
2.2.2. The Second Project (2006–2008)
In the following years, the eventuality of removing all the material still present ashore was considered but the risk of favouring further fines and heavy minerals offshore dispersion discouraged such a solution. This led to the design a new gravel beach, large and high enough to allow run-up water percolation even during extreme storms. This solution forced a modification of the groin configuration by elevating the crest and extending it offshore to host a higher and wider berm (
Figure 3). Nourishment comprised approx. 30,000 m
3 (
ca. 80 m
3/m for the project sector) of gravel 4.0–4.5 phi (16–24 mm) in mean size (
Figure 5). To not increase water turbidity, local authorities asked to maintain the quantity of fines (<0.063 mm) lower than 2%, as occurred for many projects carried out in Italy in sensible sites (e.g., at Cala Gonone, Sardinia [
20]).
As in the 1999 project, aggregates were transported by truck and downloaded directly on the beach and later distributed with a bulldozer, pushing them even into the water.
Work initiated in January 2006 with the groins modification and ended in May 2008, with interruptions during the summer tourism seasons. Circa 25,000 m3 of gravel were deposited. In addition, a small (unknown) volume of very fine sand dredged at the harbour entrance was discharged in the sectors near the marina, but being a volume moved inside the area, it did not change the overall sedimentary budget.
Dry beach expansion, on the 497-meter-long coast, was 3777 m
2. Mean shoreline progradation was 7.48 m, with important differences from the southern and central sectors (10 to 14 m) and the northern one (less than 3 m) where the original beach was not nourished with iron-rich materials and did not necessitate additional protection. In spring 2008, a volume of 3000 m
3 was placed to complete the project [
31].
Part of the gravel was deposited in front of the swash zone, as feeding groins [
16] that theoretically allow to have a more natural beach profile since wave action should move grains onshore, after a first phase in which grains are in situ cleaned and rounded.
An extensive beach scraping was performed in March 2009 to redistribute sediments accumulated in December 2008 in front of the promenade wall during a severe storm, but similar works are frequently carried out at the beginning of the summer season to flatten the storm berm crest that constitutes an obstacle to dive for children and elderly or disabled people. This activity does not influence the fill stability assessment, since beach volume is not modified, and the profile soon adapts to the autumn–winter storms.
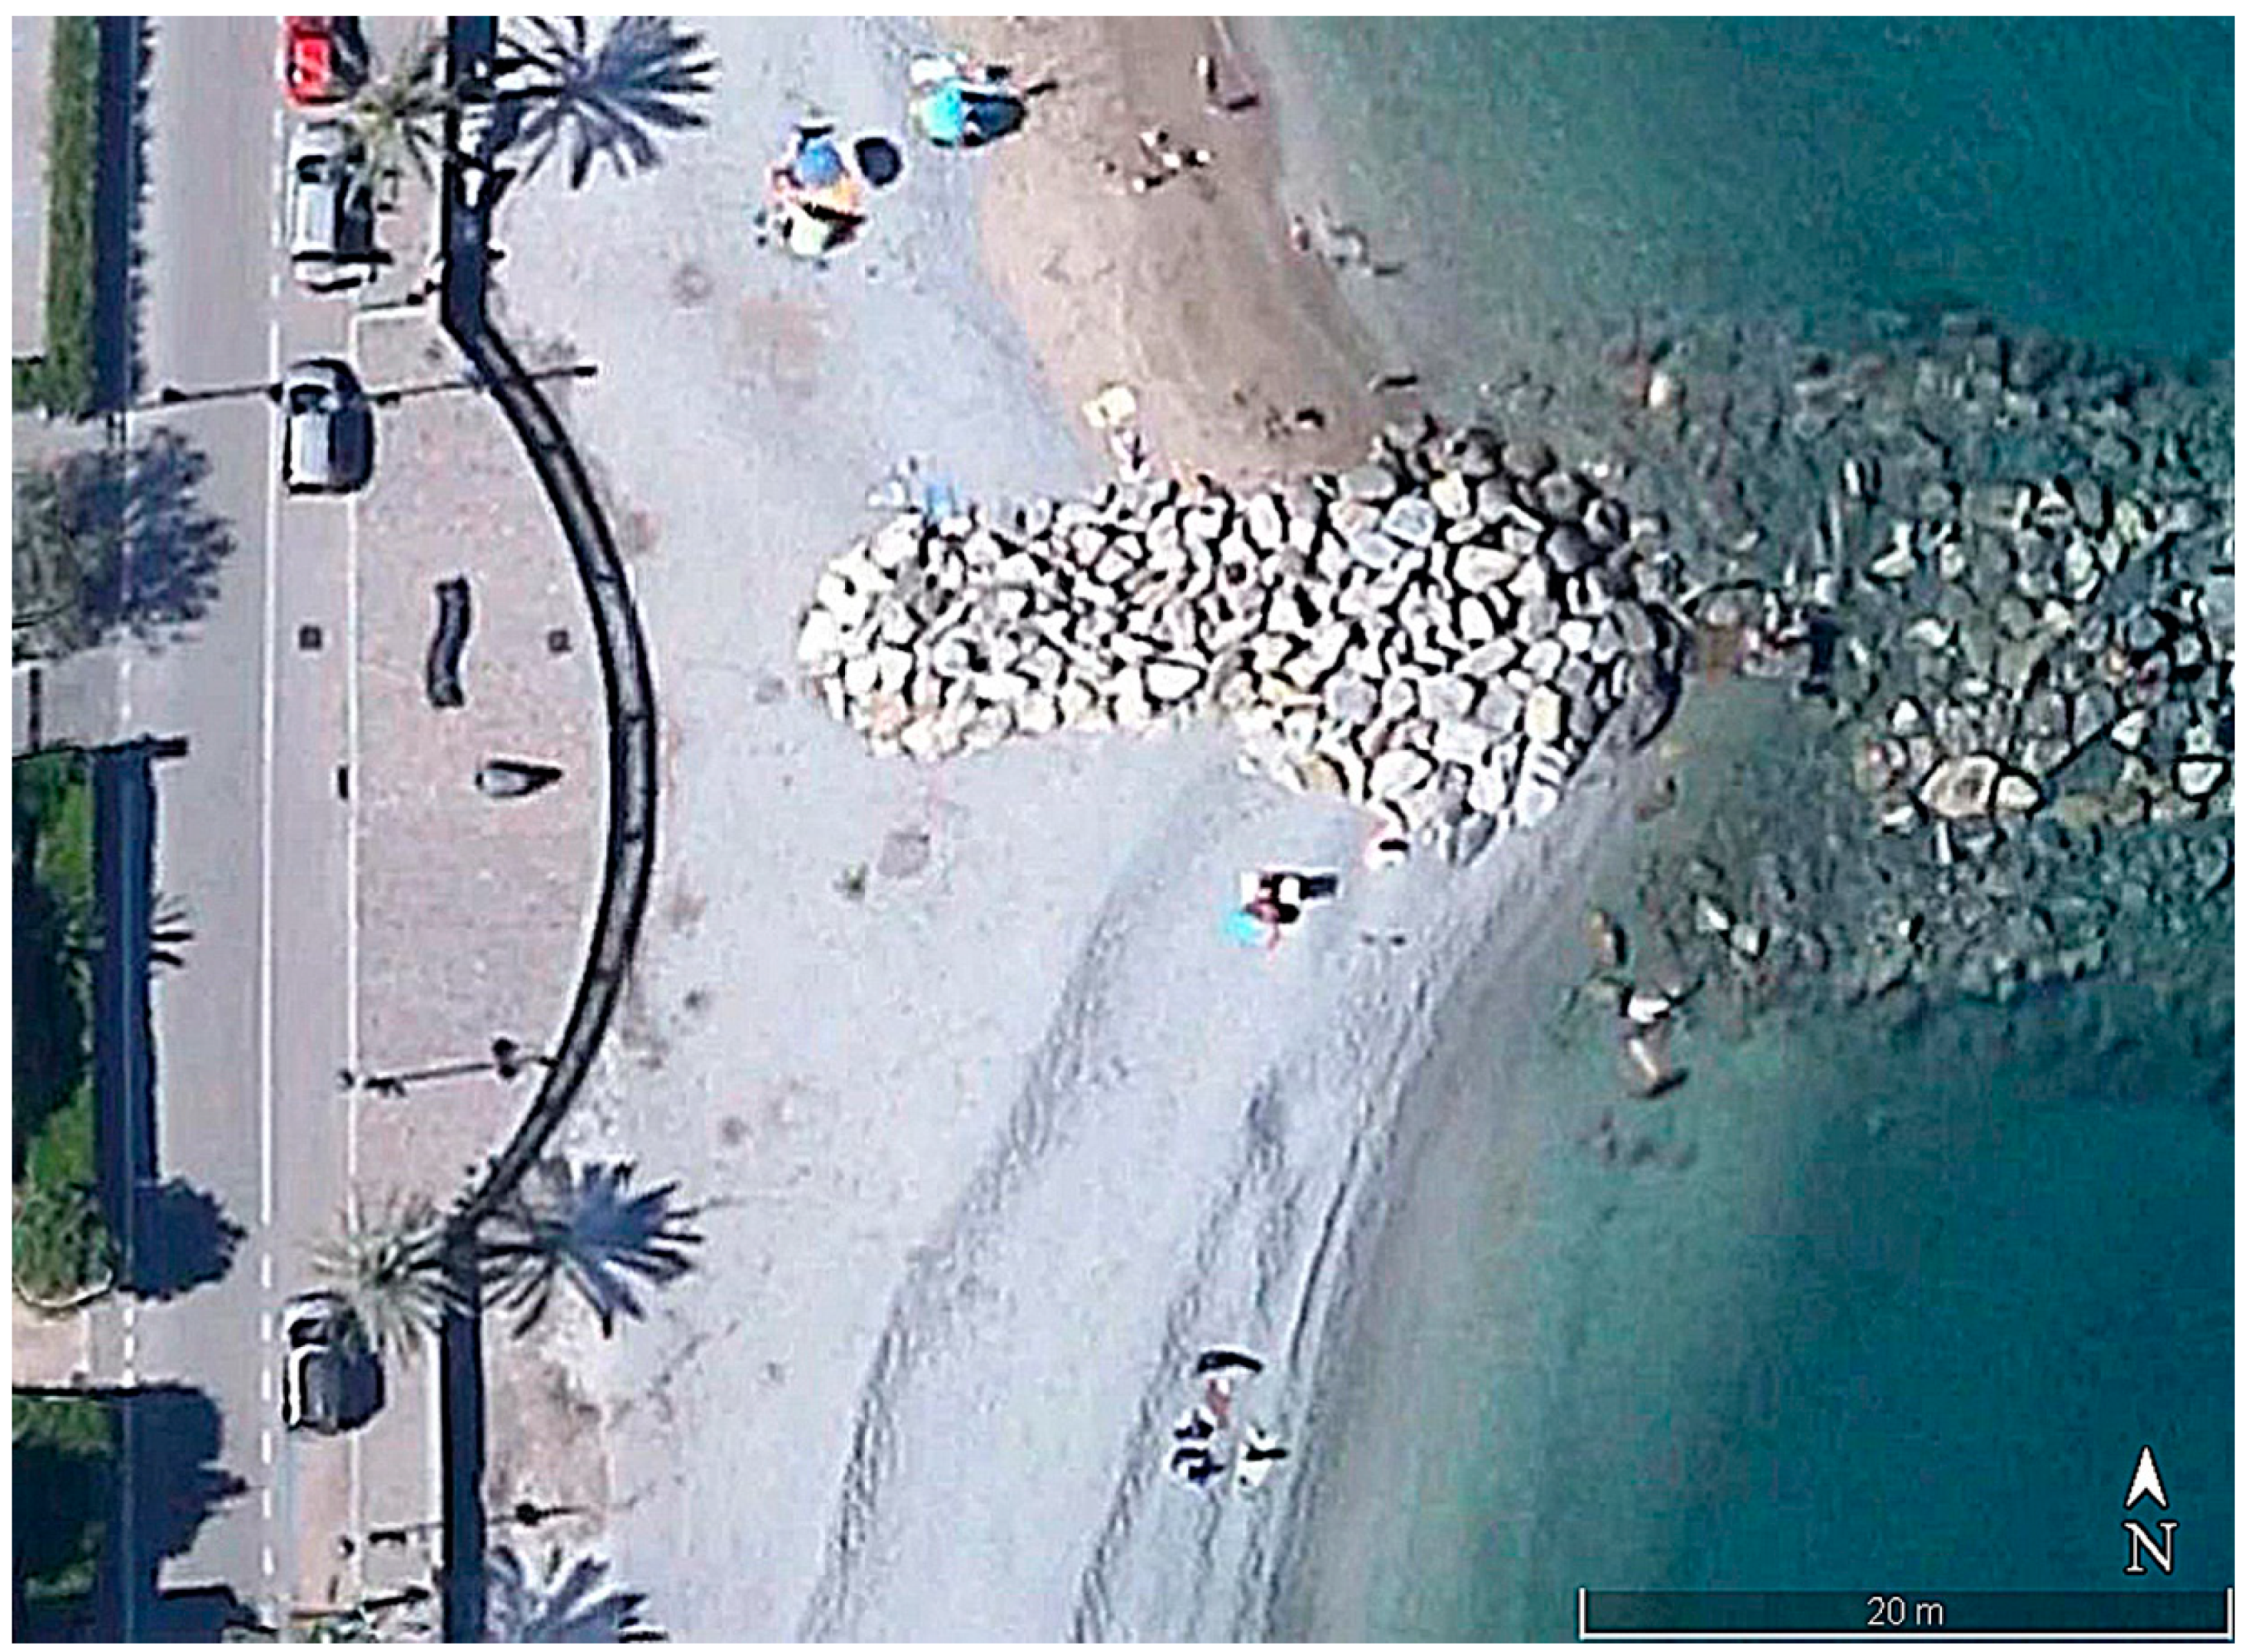
The overall beach expansion and stabilization allowed to provide the coastal road with a large sidewalk with a balustrade and trees, which transformed it into a promenade. In this way, part of the fill material is delimitated by the promenade wall and is no more part of the beach sediment stock. This partially explains why the volume of sediments added resulting from the comparison of the two first surveys (pre- and post-works) is lower than what was actually deposited on the beach. At the root of the two groins, where the beach was expected to be wider and stable, the promenade was expanded into semi-circular exedras (
Figure 6). All this transformed the coastal landscape and triggered a revival of the tourist activity of this location.
3. Materials and Methods
As explained in the Introduction, different topographic, bathymetric and sedimentological surveys (not homogeneously spaced in time,
Table 1) are available to assess the evolution of nourishment projects realised in 1999 and in 2006–2008 at Cavo. They were performed within (i) a scientific research agreement between the Province of Livorno and the Earth Science Department of the University of Florence and (ii) the surveys commissioned in 2018 by the Regione Toscana to monitor several beaches at Elba Island, including the one at Cavo.
Shoreline position was acquired by means of GPS surveys (LEICA system RX 900, Leica Geosystems, Heerbrugg, Swiss), in June 1997 and RTK-GPS (GPS NRTK 1250, Leica Geosystems, Heerbrugg, Swiss) in the following surveys: June 1997, March 2002, July 2006, June 2007, April 2008, May 2009 and June 2018 (
Figure 3,
Table 1). Bathymetric surveys, consisting of 34 single beam (Hydrotrac, Teledyne Odom, Slangerup, Denmark) profiles each, were performed in March 2002, June 2007 and May 2009, whereas a multibeam survey (Seabat 7k, Teledyne Reason, Slangerup, Denmark) was performed in 2018. Together with the 2002, 2007 and 2009 surveys, sediment samples (N = 91, 42 and 35) were collected with a Van Veen grab along 6 profiles from +2 m to −5 m, and grain size analysis via dry sieving was performed to obtain Folk and Ward (1957) textural parameters [
32].
Shoreline evolution was analysed dividing the coast in 9 sectors, each approximately 55 m long, 3 in each cell in which the beach is divided by the two groins. Mean shoreline displacement was computed for each sector (Table 2) using the Surface Based Analysis (SBA), since the traditional Profile Based Analysis (PBA) was not considered reliable due to the nonlinear shape of the shoreline given by the groins [
33]. Surface measurements were performed with QGIS Rel. 3.0.
Beach morphology evolution was studied by comparing pairs of surveys with Surfer Rel. 14 and producing vertical changes maps for the time intervals 2002–2007, 2007–2009 and 2009–2018. Although surveys were performed with standard calibrations (check bar, tide and draft, pitch and roll) and linked to geodetic points, further corrections were done on sea-true points located on some rocky shoals at the border of the bay. Despite all the above, the accuracy of vertical changes in bathymetric maps was approximately 20 cm [
34] and, therefore, such maps were only used for a semi-quantitative assessment. Sedimentological maps were drawn to represent Mean size (Mz) and Sorting (σ
I) parameters, and a Mean size
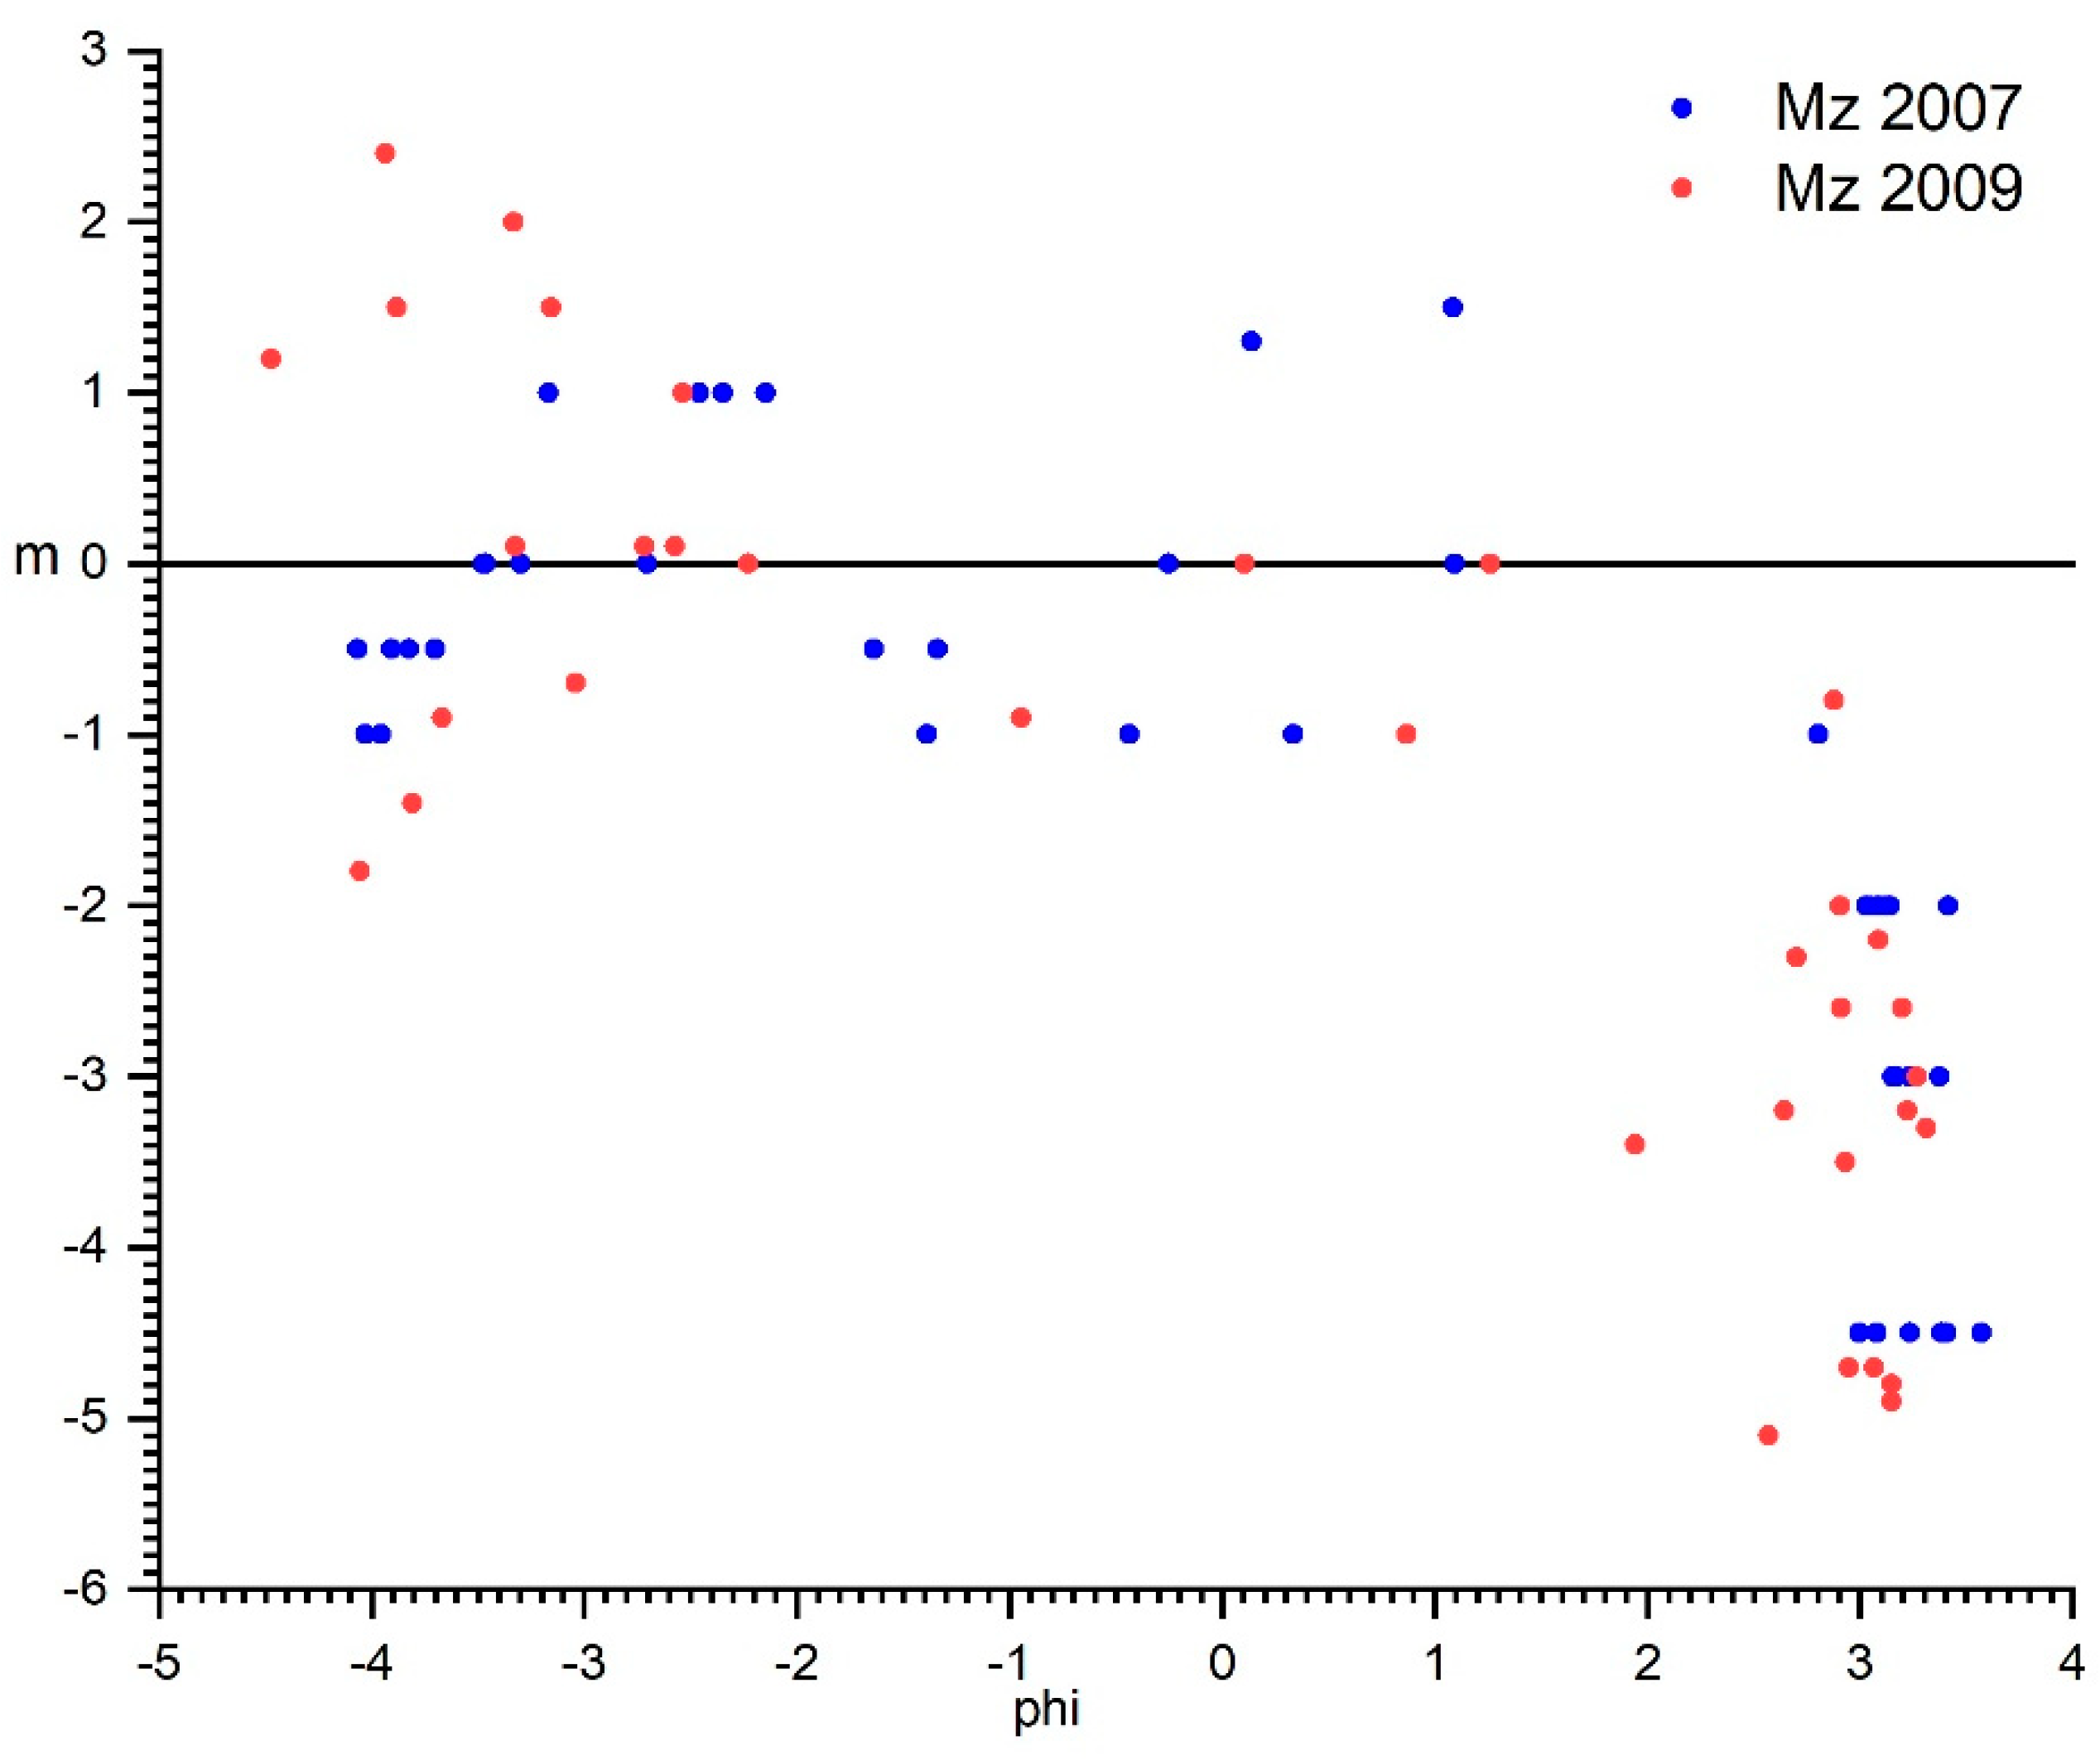
vs Depth graph was plotted.
No measured wave data are available for this bay, and reference can be done only with two buoys operated by the Tuscany Region, one near Gorgona Island, 75 km NNE of Cavo, the other near Giannutri Island, 90 km SE of Cavo, but considering that this coast is exposed to the East, towards the nearby continent (approx. 10 km), wave energy is significantly lower. However, after the last survey, on 31 December 2018a storm with significant wave height (Hs) of 5.40 m at Gorgona and 6.50 m at Giannutri was registered, the highest since the buoys were installed (2008).
4. Results
4.1. General Considerations on the First Nourishment Evolution
As previously stated, no specific monitoring was performed on this project, and beach transformation could be evaluated only by the comparison between two surveys done by the University of Florence in 1997 (two years before the fill), within a regional study on Elba Island beaches erosion, and one in 2002 as a basis of a second project. A further survey, performed in June 2006 (before the second nourishment), allows to assess fill evolution in the following four years.
The first nourishment induced a notable dry beach expansion, with the March 2002 beach 9.8 m wider on average respect to the June 1997 one (
Figure 3 and
Figure 7;
Table 2).
Obviously, fines were lost only from the upper part of the deposits, which strongly modified optical properties of the nearshore water that acquired a deep red colour induced by the fact that the grainsize fraction was mostly composed by clay (and not silt). Actually, a very limited fill volume was dispersed.
From March 2002 to July 2006 the beach was as a whole stable, with only some sediment shift from the side sectors to the central ones (no. 4 to no. 7;
Figure 3;
Table 1), favoured by the low groins height.
4.2. Second Nourishment Evolution Assessment
Shoreline Displacement
The survey performed in June 2007 shows the beach as it was immediately after the end of the main works (i.e., without the 3000 m3 of the 2008 additional filling) and its comparison with the July 2006 allows to quantify the enlargement artificially obtained.
This beach nourishment was not homogeneous along the coast but concentrated where the beach was narrower. The different dry beach expansion is visible in
Figure 3 and
Figure 7 and in
Table 2: external sectors 1, 2 and 9 received a limited or null volume of sediments, whereas the central ones obtained more (
Table 2). Such distribution of nourished sediments was essentially aimed to cover the previously deposited iron-rich material (1999 nourishment), more than to expand the beach.
Mean shoreline progradation was 7.48 m, ranging from 2.24 (sector 1) to 13.39 m (sector 7). Adding these values to what was obtained with the 1999 nourishment, the beach was 18.42 m wider on average than it was in 1997. However, part of this increment will be later used to enlarge the coastal road adding a wide footstep and two exedras.
From June 2007 to April 2008, i.e., in the first winter after the nourishment, all the sectors of the beach recorded moderate erosion (
Figure 3): overall beach surface reduction was approximately 1189 m
2, with a mean beach retreat of 2.26 m.
Concerning beach morphology, the beach profile constructed during the nourishment works was flat and wide; in the following months, after the impacts of winter waves, storm berm crests were observed. This involved the migration of material from the swash zone to a more internal position, with a reduction of the beach surface, but without changes in gravel volume, as proved by elevation change maps (
Figure 8).
In the following year (April 2008–May 2009) advancement is recorded in all the sectors with an average dry beach expansion of 3.42 m, resulting in a beach wider than the one obtained immediately after the works.
When comparing the evolution of the different sectors (
Figure 3), a very homogeneous behaviour is observed and characterised by synchronous accretion and erosion in the period 2006–2009, showing that no significant beach rotation occurred in each cell.
It is only in the nine following years (May 2009–June 2018) that the three cells show a slightly different behaviour. In the northern one (sectors 1–3), sector no. 1 accretes more than the others, which results in a slight clockwise rotation, although within a general beach progradation. On the contrary, the central cell (sectors 4–6) behaves in an opposite way, with the first sectors eroding and the latter accreting, with an anticlockwise rotation and limited beach erosion. In the southern cell (sectors 7–9) a widespread but limited beach accretion is measured, especially at the central segment (no. 8,
Figure 3).
All those mentioned changes represent small variations (between +4 m and −2 m) for a long period, with negative values in the central cell only, which is the most exposed to the incoming waves. All these data show that waves strong enough to move these coarse sediments approach the coast almost orthogonally.
Unfortunately, no high temporal resolution data are available for these nine years, but several inspections and photographs show that the beach was almost stable, so much that the municipality built public toilets at the base of the promenade and gave some surfaces in concession to carry out commercial activities (e.g., beach bars).
A stable and attractive beach was the goal of the project, and collected data, although incomplete, show that this was achieved. Its expansion, necessary to cover the nourishment of 1999, was a welcome side effect of the project.
4.3. Nearshore Morphology Evolution
To assess the morphological evolution of the beach, and the sediment budget of the emerged and the submerged parts, 3D topo-bathymetric models produced in each survey were compared limiting the offshore part to that in which full overlapping was possible, i.e., down to ca. 5 m water depth (
Figure 8).
From May 2002 to June 2007 the direct effect of the nourishment is visible with beach surface rising both on the dry beach and on the submerged profile, especially in the central cell, where most of the volume was deposited. At the centre of this cell a lobe is evident, where the main feeding groin was positioned (
Figure 9).
In the following eleven years (2007–2018), limited morphological changes occurred, except the disappearance of what remained of the filling groin that experienced a concentrated lowering of ca. 1.5 m (evident the blue area in the central cell in
Figure 7). However, it must be considered that small morphological changes and volumetric variations at the beginning of the tourist season are associated with artificial beach smoothing carried out to eliminate storm berms crest (
Figure 10), as a result the emerged profile is expanded and amounts of sediments are moved to the nearshore. Therefore, beach scraping makes the interpretation of the post-nourishment beach evolution more complex, but it is a procedure frequently carried out also in sand beaches with relevant tourist use.
Beach volume increase on the dry beach and decrease on the wet one in the 2007–2018 period can be explained with the onshore sand moving, very likely induced by the higher permeability and porosity of the gravel fill, as observed in other gravel nourishments [
21]. Similar to what was observed by previous authors, sand patches are seldom present in the swash zone and sand saturates the pores of the gravel as evident in some trenches excavated on the berm.
Tentative sediment budget estimation was performed and presented in
Table 3. Data concerning the dry beach volumes are reliable since topographic measurements have the accuracy of few centimetres (i.e., gravel size) but, unfortunately, it is not the case for the nearshore. As previously said, accuracy of bathymetric data is approximately ±10 cm, which corresponds to changes in height of 20 cm between surveys. Since the study area surface is approximately 40,000 m
2, a volume change of ca. 8000 m
3 is within the accuracy of the methodology used.
However, according to our data, the artificial input of ca. 30,000 m3 of gravel did not produce an equivalent increase in the beach sediment budget. One reason could be that part of the gravel forms now, together with stones, asphalt and different aggregates, the promenade embankment, which is out of the area considered in this study. Analysis of dry beach evolution confirms the stability of nourished sediments, which is not demonstrated when the sedimentary balance is calculated up to a depth of 5 m.
4.4. Sedimentological Evolution
A first sedimentological study was performed in June 2007 (
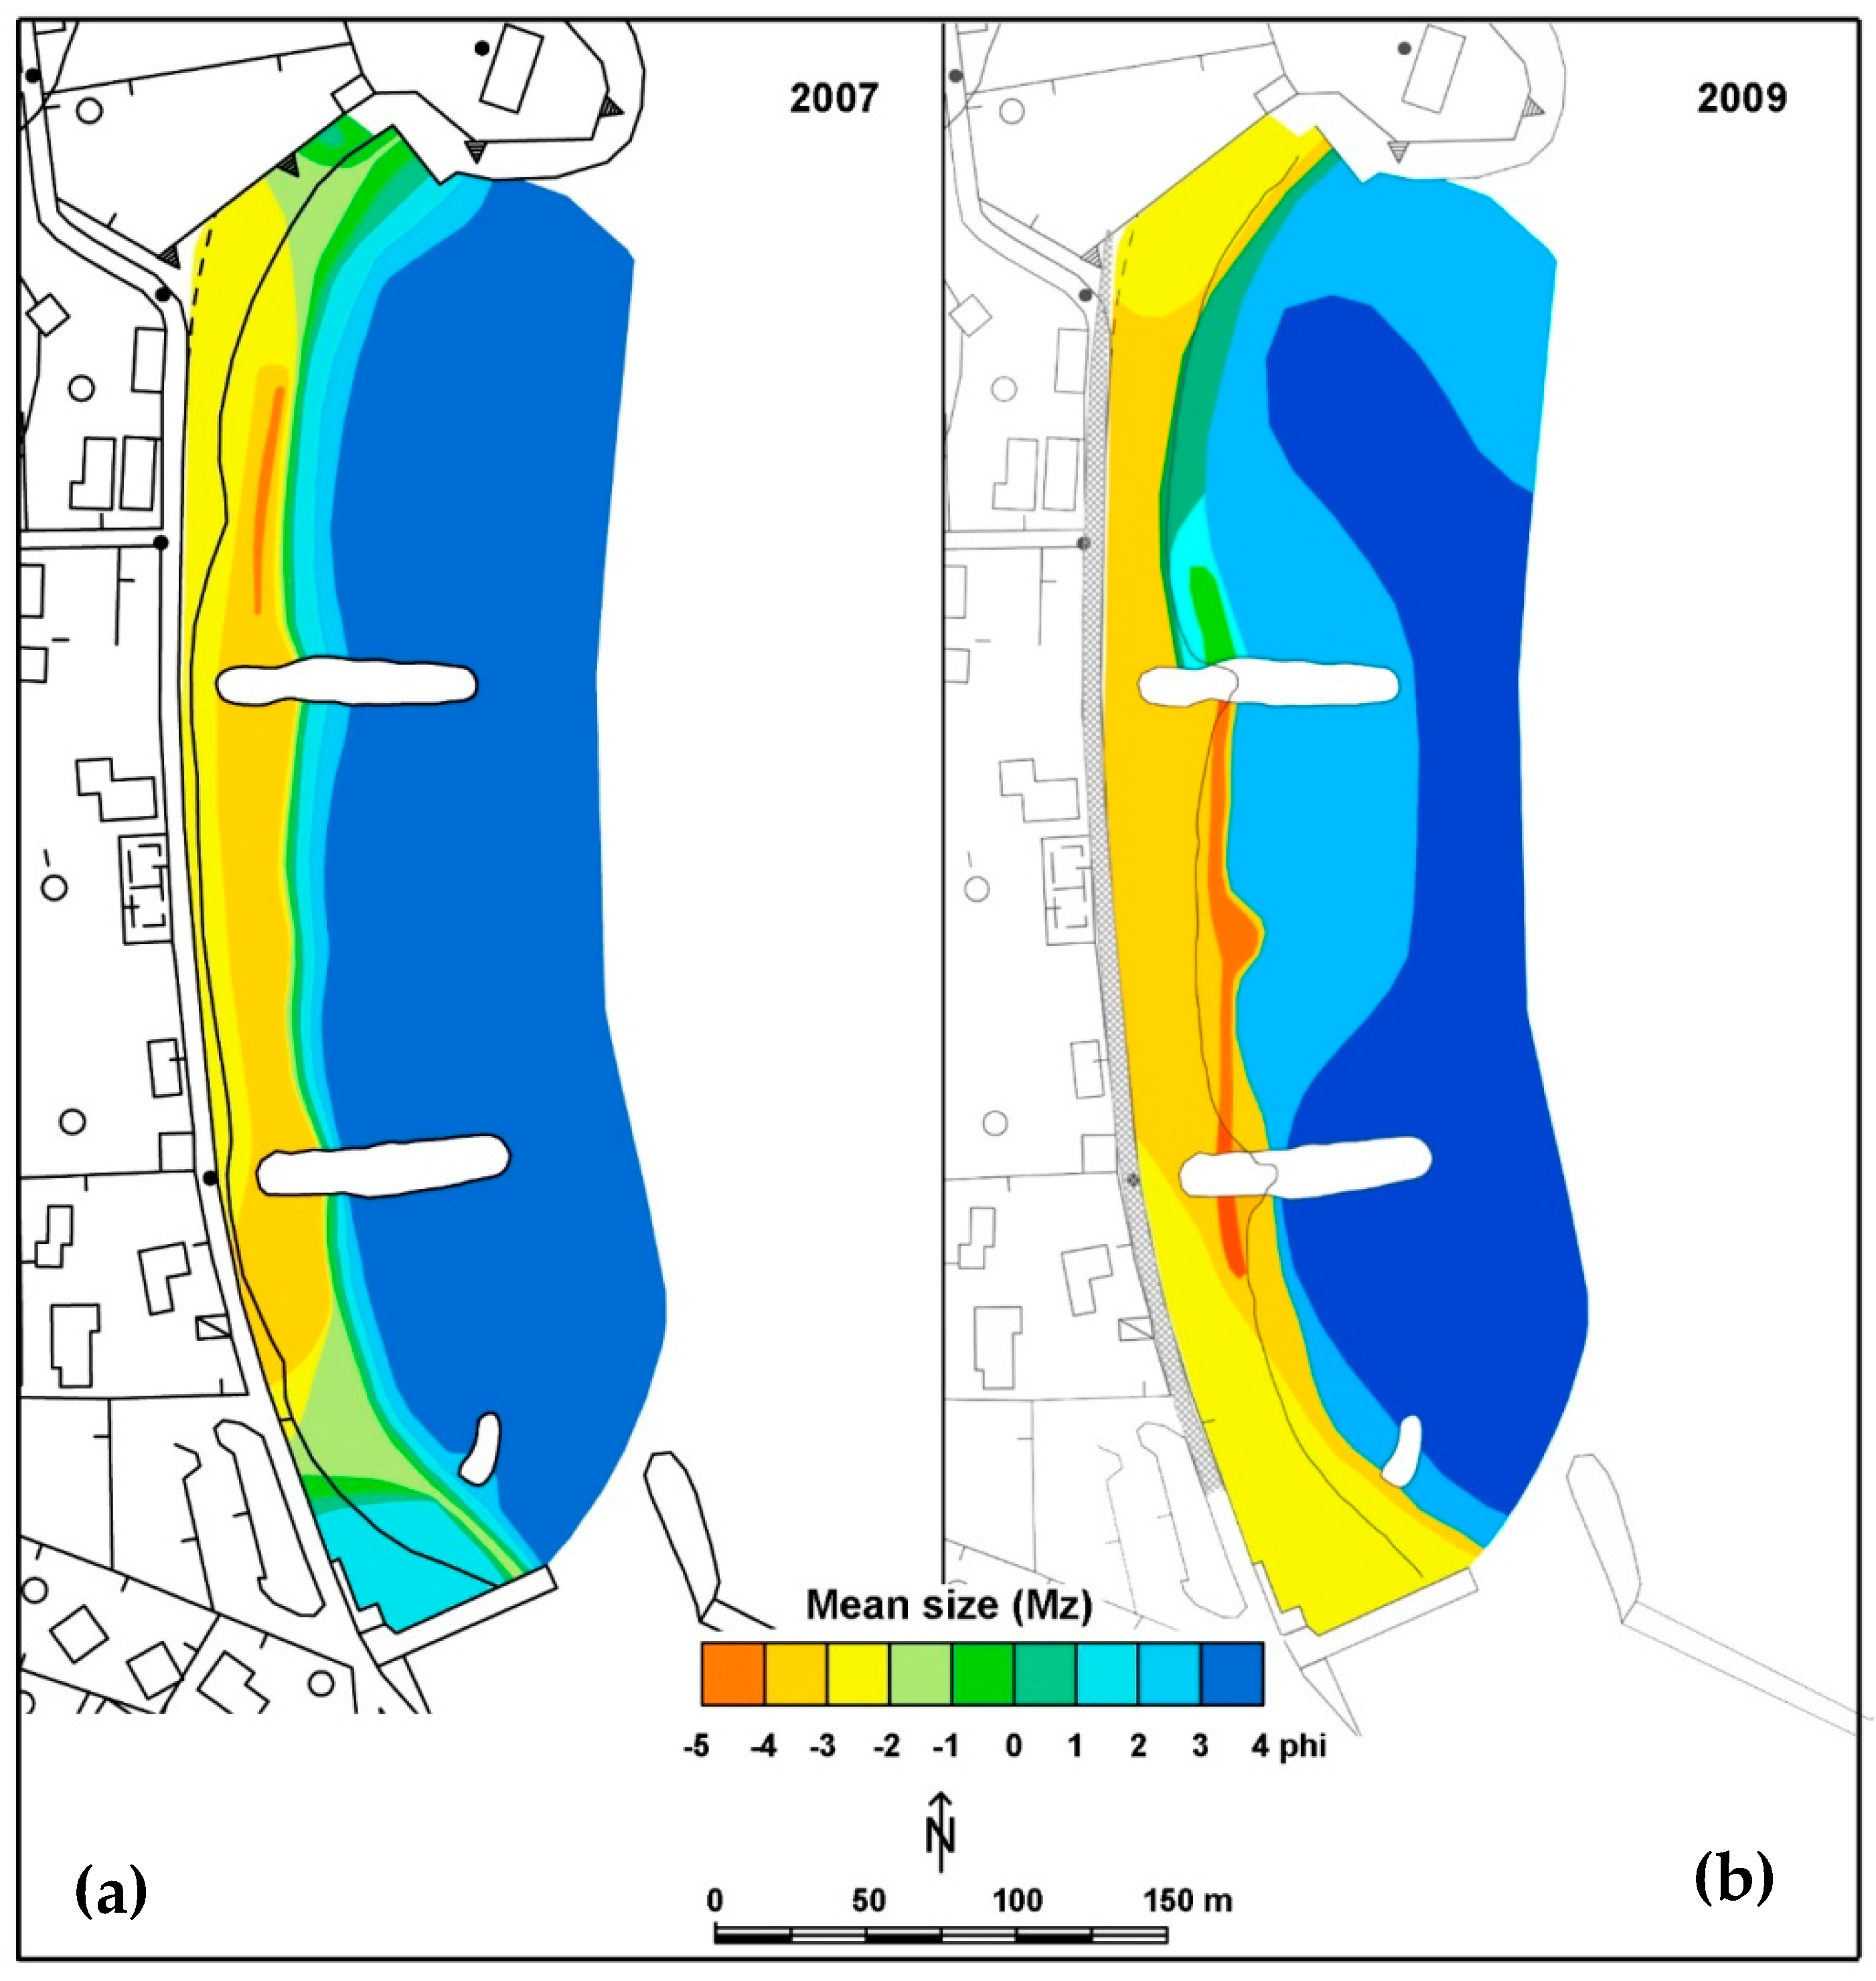
Figure 11a), i.e., at the end of the second nourishment work, when sediments have not yet been sorted by wave action and still have their original size (between −4 and −3 phi; 16–8 mm). A very thin strip of coarse to medium sand (0.0–2.0 phi) runs on the seaside of the gravel, but its bi-modal distribution shows that it is a mixture of the fill gravel and the native sand previously present on the nearshore and in the two lateral segment of the bay. Pure sand is present only offshore of the investigated depth.
A second sedimentological survey was performed in May 2009, before beach raking, to assess whether offshore gravel displacement occurred or not. Results (
Figure 11b) show that all the gravel remained in the dry beach or in the nearshore close to the shoreline, with no sediments coarser than 2.0 phi (0.250 mm) offshore of the 2 m isobath, confirming the cross-shore sorting of sediments observed in other natural [
34,
35,
36,
37] and artificially nourished beaches [
21,
37]. The coarsest grains of the nourishment, between −5 and −4 phi (16 and 32 mm) were found in the central cell, all along the beach step and, between −1.5 m and −2.0 m, in the point where the filling groin was located. There, coarse and very well sorted lag deposits are present. In addition to this, evident is a lobe of 2–3 phi (0.250–0.125 mm) sediments in the central area, possibly due to a limited migration of the fine grains present in the fill material.
Both 2007 and 2009 grain size data show that below the 2 m isobath, where wave energy is lower, no gravel is present (
Figure 12).
5. Discussion
The discontinuity of the data, with a long temporal gap from 2009 to 2018, the known but not quantified reshaping of the beach carried out to better satisfy tourism purposes, and the absence of in situ wave climate data, make the study of the evolution of this gravel nourishment very difficult.
Nevertheless, it is important to share this experience within the scientific and technical community, since this kind of nourishment is more and more frequently performed, being cost effective in terms of shore protection and sustainability.
It is sure that the fill proved to be very stable since, after twelve years, almost all the deposited volume is still on the beach, and the beach width is approximately the same as it was after the nourishment.
The behaviour of gravel to gather on the dry part of the profile, as occurred in other gravel nourishments, is confirmed together with the fact that in the case of highly permeable beach sediments, sand can approach the coast and fill the intergranular space [
20,
21].
Interviews done to beach goers [
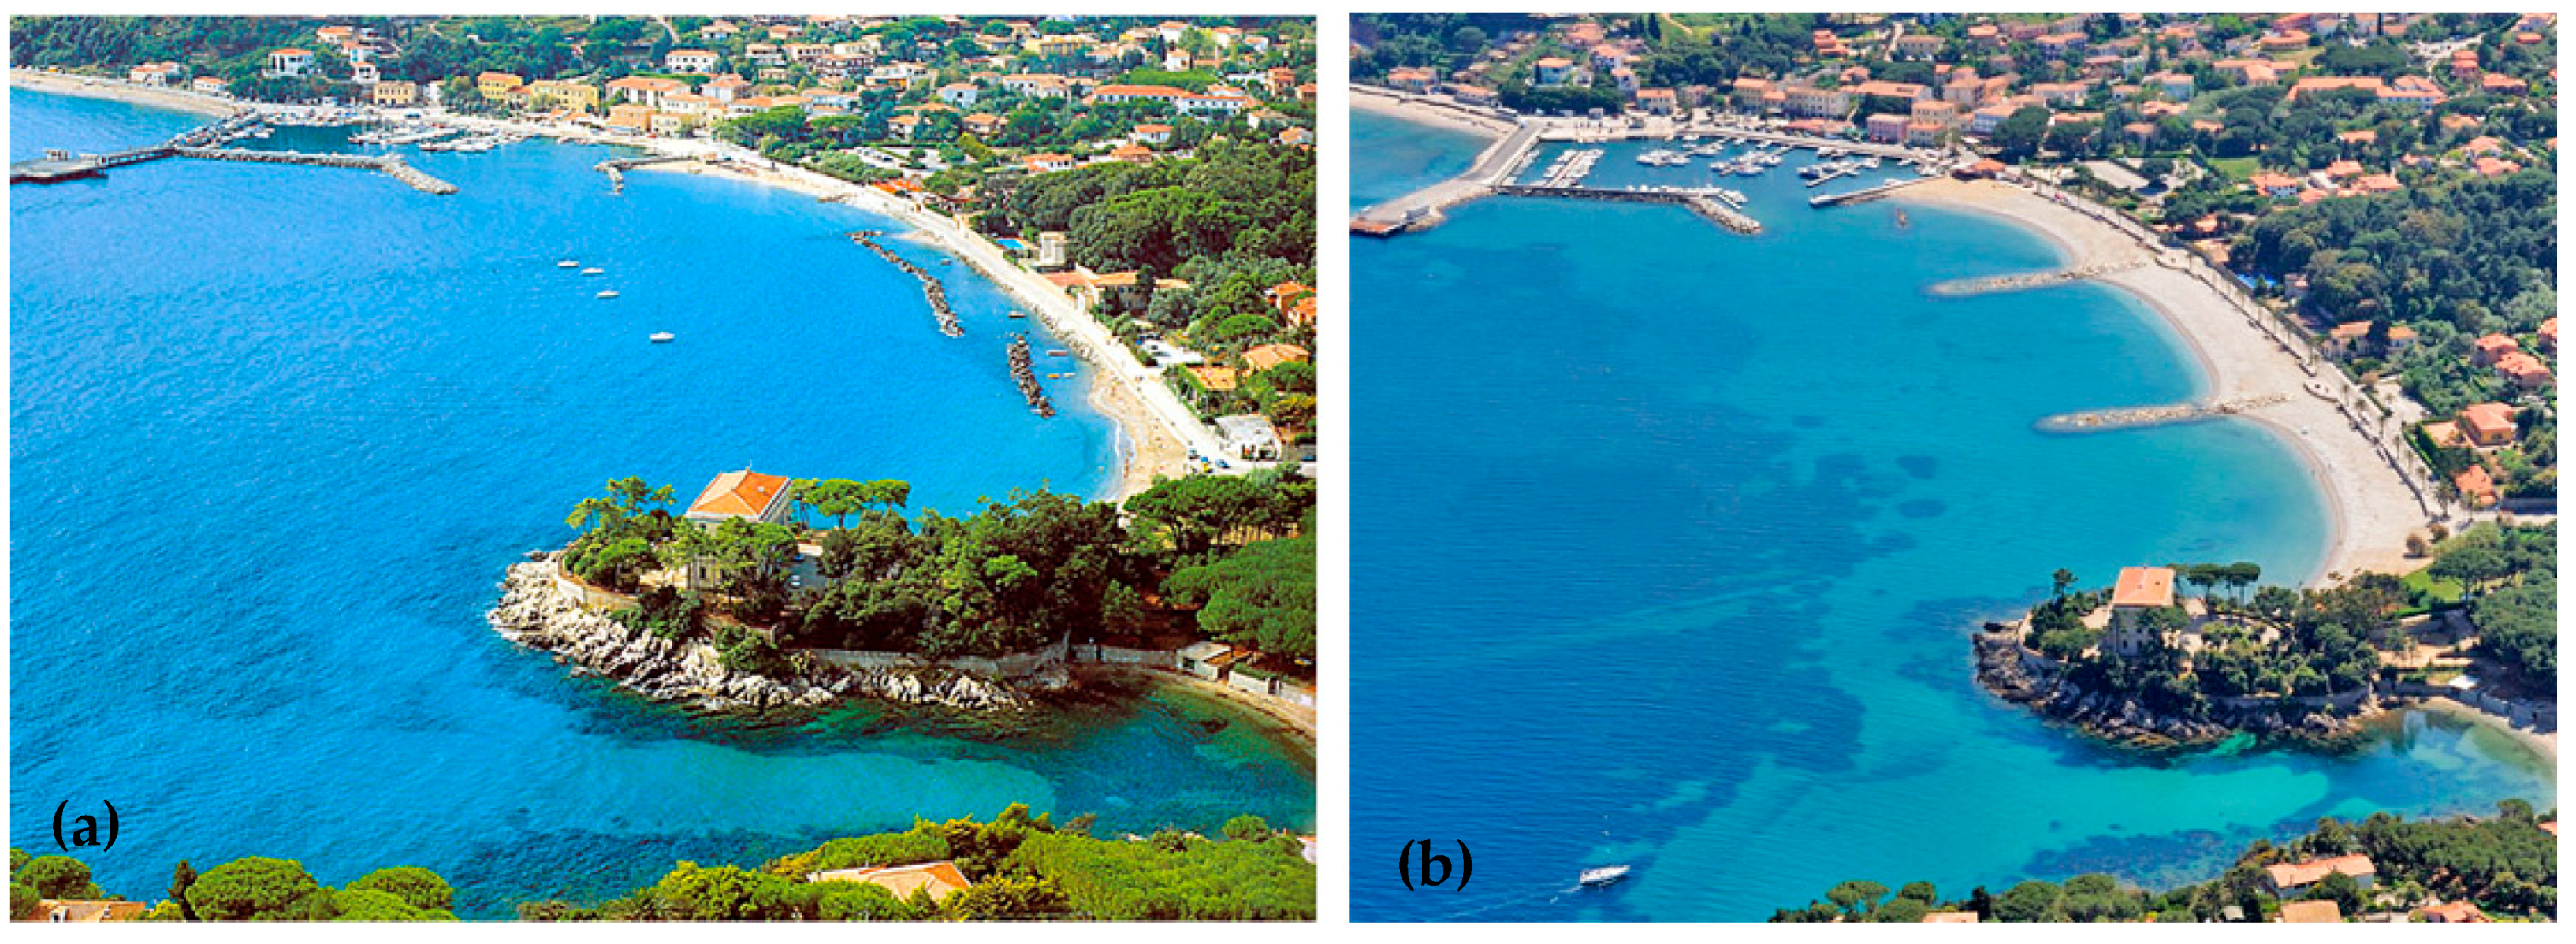
38] show that this kind of sediments are strongly appreciated, and traditional frequenters of this beach recognize that the coastal environment has improved, for water transparency, beach width (
Figure 13) (that gave the possibility to expand the promenade and provide beach services,
Figure 14), and for the fact that grains do not stick to the skin. As grain sharpness is concerned, only 30% of the interviewed claimed it as a negative element.
6. Conclusions
The beach at Cavo was almost completely lost in the 1970s and a revetment and two detached breakwaters were built to protect the coastal road. However, it made this coastal segment very dangerous for diving and unsuitable for the tourist industry. An attempt to give the site a beach again was carried out with iron ore waste, which was rejected by the stakeholders and posed several environmental issues.
The gravel beach, created to cover this ugly and potentially dangerous material, was effective at this end and proved to be very stable and appreciated by the beachgoers.
The wide beach, the transparent coastal water, the new promenade (
Figure 13), and beach services (
Figure 14), were all made possible thanks to the choice to build a gravel beach, demonstrating that coarse sediment nourishment can be a viable solution to beach erosion, especially in areas where sand is not available, or its use should be accompanied with harder shore protection structure.
7. Update
The 31 October 2018, storm severely hit the entire Tuscany coast, so much that the region implemented an emergency plan to allow municipalities to dredge sediment in the nearshore to feed the beach in order to allow tourist activity in the following summers. Approximately 11 million euros were spent at that end for 17 small projects.
The beach of Cavo was very little affected by the storm, with a shoreline retreat of approximately 2 m (data from Regione Toscana), and the coastal road was not reached by the waves; therefore the gravel beach proved to be not only suitable for tourism, but also an effective shore protection structure.
Author Contributions
Conceptualization, E.P. and E.B.; methodology, E.P., L.R. and I.C.; software, I.C.; validation, G.A., E.B. and L.R.; formal analysis, I.C.; writing—original draft preparation, I.C.; writing—review and editing, G.A., L.R., E.P.; supervision, E.P. All authors have read and agreed to the published version of the manuscript.
Funding
This research received no external funding.
Institutional Review Board Statement
Not applicable.
Informed Consent Statement
Not applicable. The study did not involve humans or animals.
Data Availability Statement
Data supporting reported results can be asked to the first author.
Acknowledgments
This research is a contribution to the Ibero-American Beach Management and Certification Network—PROPLAYAS and to the Andalusia PAI Research Group ‘RNM-328′.
Conflicts of Interest
The authors declare no conflict of interest.
References
- Peña-Alonso, C.; Ariza, E.; Hernández-Calvento, L.; Pérez-Chacón, E. Exploring multi-dimensional recreational quality of beach socio-ecological systems in the Canary Islands (Spain). Tour. Manag. 2018, 64, 303–313. [Google Scholar] [CrossRef]
- Andreadis, O.; Hasiotis, T.; Psarros, F.; Chatzipavlis, A.; Velegrakis, A. Erosion and sediment transport processes along Eresos coastal zone (Lesvos, Greece). In Proceedings of the 15th International Conference on Environmental Science and Technology, Rhodes, Greece, 31 August–2 September 2017. [Google Scholar]
- Gómez-Pujol, L.; Orfila, A.; Morales-Márquez, V.; Compa, M.; Pereda, L.; Fornós, J.J.; Tintoré, J. Beach Systems of Balearic Islands: Nature, Distribution and Processes. In The Spanish Coastal Systems; Springer: Berlin/Heidelberg, Germany, 2018; pp. 269–287. [Google Scholar]
- Tsartas, P. Tourism Development in Greek Insular and Coastal Areas: Sociocultural Changes and Crucial Policy Issues. J. Sustain. Tour. 2003, 11, 116–132. [Google Scholar] [CrossRef]
- Taboada, T.; Carta, A.; Müller, J.V. Diachronic analysis using aerial photographs across fifty years reveals significant land use and vegetation changes on a Mediterranean island. Appl. Geogr. 2018, 98, 78–86. [Google Scholar]
- Nobre Silva, A.; Rui Taborda, R.; Andrade, C.; Ribeiro, M. The future of insular beaches: Insights from a past-to-future sediment budget approach. Sci. Total. Environ. 2019, 676, 692–705. [Google Scholar] [CrossRef] [PubMed]
- Cipriani, L.E.; Pranzini, E.; Rosas, V.; Wetzel, L. Landuse changes and erosion of pocket beaches in Elba Island (Tuscany, Italy). J. Coast. Res. 2011, 64, 1774–1778. [Google Scholar]
- Anfuso, G.; Williams, A.T.; Casas, G.M.; Botero, C.M.; Cabrera, J.A.; Pranzini, E. Evaluation of the scenic value of 100 beaches in Cuba: Implications for coastal tourism management. Ocean. Coast. Manag. 2017, 142, 173–185. [Google Scholar] [CrossRef]
- Mir Gual, M.; Pons, G.X.; Martín Prieto, J.A.; Rodríguez Perea, A. A critical view of the Blue Flag beaches in Spain using environmental variables. Ocean. Coast. Manag. 2015, 105, 106–115. [Google Scholar] [CrossRef]
- Semeoshenkova, V.; Newton, A. Overview of erosion and beach quality issues in three Southern European countries: Portugal, Spain and Italy. Ocean. Coast. Manag. 2016, 118, 12–21. [Google Scholar] [CrossRef]
- Ebejer, J. Creating a sandy beach in St. George’s Bay. A new experience for Malta. In Proceedings of the 1st International Conference on the Nanagement of Coastal Resources, La Valletta, Malta, 20–23 October 2004; pp. 161–167. [Google Scholar]
- Pranzini, E.; Anfuso, G.; Munoz-Perez, J.J. A probabilistic approach to borrow sediment selection in beach nourishment projects. Coast. Eng. 2018, 139, 32–35. [Google Scholar] [CrossRef]
- Bitan, M.; Zviely, D. Sand beach nourishment: Experience from the mediterranean coast of Israel. J. Mar. Sci. Eng. 2020, 8, 273. [Google Scholar] [CrossRef] [Green Version]
- Peterson, C.H.; Bishop, M.J. Assessing the Environmental Impacts of Beach Nourishment. BioScience 2005, 55, 887–896. [Google Scholar] [CrossRef] [Green Version]
- Sherman, D.J.; Hotta, S. Aeolian sediment transport: Theory and measurement. In Coastal Dunes: Form and Process; Nordstrom, K.F., Psuty, N., Carter, B., Eds.; Edward Arnold: London, UK, 1990; pp. 17–37. [Google Scholar]
- Pranzini, E.; Anfuso, G.; Botero Saltaren, C. Nourishing tourist beaches. In Beach Management Tools—Concepts, Methodologies and Case Studies; Botero, C.M., Cervantes, O.D., Finkl, C.W., Eds.; Springer: Cham, Switzerland, 2018; pp. 293–318. [Google Scholar]
- Nordstrom, K.C.; Pranzini, E.; Jackson, N.; Coli, M. The Marble beaches of Tuscany. Geogr. Rev. 2008, 98, 280–300. [Google Scholar] [CrossRef]
- Obrador, P. Building Castles in the Sand: Repositioning Touch on the Beach. Senses Soc. 2009, 4, 195–210. [Google Scholar] [CrossRef]
- Rainis, M. French beach sports culture in the twentieth century. Int. J. Hist. Sport 2000, 17, 144–158. [Google Scholar] [CrossRef]
- Pacini, M.; Pranzini, E.; Sirito, G. Beach nourishment with angular gravel at Cala Gonone (Eastern Sardinia, Italy). In Proceedings of the MEDCOAST, Qawra, Malta, 11–14 November 1997; pp. 1043–1058. [Google Scholar]
- Cammelli, C.; Jackson, N.L.; Nordstrom, K.F.; Pranzini, E. Assessment of a gravel-nourishment project fronting a seawall at Marina di Pisa, Italy. J. Coast. Res. 2006, 39, 770–775. [Google Scholar]
- Aminti, P.; Pelliccia, F.; Pranzini, E. Evoluzione del profilo di spiaggia a seguito di un ripascimento artificiale in ghiaia su di una spiaggia altamente protetta. Studi Costieri 2002, 5, 47–57. [Google Scholar]
- Medatlas Group. Wind and Wave Atlas of the Mediterranean Sea, W.E.A.O. Res. Cell 2004. Available online: https://core.ac.uk/download/pdf/52757034.pdf (accessed on 10 October 2021).
- Istituto Idrografico della Marina. Tavole di Marea, Mediterraneo e Mar Rosso, Genova, II-3133.
- Berriolo, G. Interventi di riequilibrio delle spiagge della provincia di Latina. In La Difesa dei Litorali in Italia; Aminti, L., Pranzini, E., Eds.; Edizioni delle Autonomie: Roma, Italy, 1993; pp. 153–173. [Google Scholar]
- Tanelli, G.; Benvenuti, M.; Costagliola, P.; Dini, A.; Lattanzi, P.; Maineri, C.; Mascaro, I.; Ruggieri, G. The iron mineral deposits of Elba Island: State of the art. Ofioliti 2001, 26, 239–248. [Google Scholar]
- Mannori, S.; Pranzini, E. From agriculture to tourism: A cause of beach erosion. In Proceedings of the 1st International Conference on the Management of Coastal Recreational Resources, La Valletta, Malta, 20–23 October 2004; pp. 79–85. [Google Scholar]
- Pranzini, E.; Rosas, V. Pocket beach response to high energy—Low frequency floods (Elba Island, Italy). J. Coast. Res. 2007, 50, 969–977. [Google Scholar]
- Pranzini, E.; Rosas, V.; Jackson, N.L.; Nordstrom, K.F. Beach changes due to sediment delivered by streams to pocket beaches during a major flood. Geomorphology 2013, 199, 36–47. [Google Scholar] [CrossRef]
- Nordstrom, K.F.; Jackson, N.L.; Pranzini, E. Beach sediment alteration by natural processes and human action: Elba Island, Italy. Ann. Ass. Am. Geogr. 2004, 94, 794–806. [Google Scholar]
- Bartoletti, E.; Bini, A.; Marasco, I.; D’Oriano, V.; Mercantelli, A.; Sani, L. La Spiaggia Ritrovata. ACER 2008, 6, 53–55. [Google Scholar]
- Folk, R.; Ward, W.C. Brazos river bar: A study in the significance of grain size parameters. J. Sediment. Petrol. 1957, 27, 3–26. [Google Scholar] [CrossRef]
- Anfuso, G.; Bowman, D.; Danese, C.; Pranzini, E. Transect Based Analysis versus Area Based Analysis to quantify shoreline displacement: Spatial resolution issues. Environ. Monit. Assess. 2016, 188, 568. [Google Scholar] [CrossRef] [PubMed]
- Pranzini, E. Misurare la Spiaggia per Gestire la Costa; Edifir: Firenze, Italy, 2019; 128p. [Google Scholar]
- King, C.A.M. Beches and Coasts, 2nd ed.; Edward Arnold: London, UK, 1972; 570p. [Google Scholar]
- Pontee, N.I.; Pye, K.; Blott, S.J. Morphodynamic Behaviour and Sedimentary Variation of Mixed Sand and Gravel Beaches, Suffolk, UK. J. Coast. Res. 2004, 20, 256–276. [Google Scholar] [CrossRef]
- Horn, D.P.; Walton, S.M. Spatial and temporal variations of sediment size on a mixed sand and gravel beach. Sediment. Geol. 2007, 202, 509–528. [Google Scholar] [CrossRef]
- Saitta, M. Valutazione Dell’efficacia di un Ripascimento in Ghiaia nel Golfo di Follonica (GR); University of Florence: Florence, Italy, 2021; Unpublished thesis. [Google Scholar]
Figure 1.
Location map of central-northern part of Italy (a) and Elba Island (b) (Google Earth).
Figure 1.
Location map of central-northern part of Italy (a) and Elba Island (b) (Google Earth).
Figure 2.
The central part of the beach at Cavo in June 1995.
Figure 2.
The central part of the beach at Cavo in June 1995.
Figure 3.
Shoreline (zero isobath) evolution at Cavo from 1997 (before the first nourishment) to 2018 (ten years after the end of the second nourishment). In red sectors number.
Figure 3.
Shoreline (zero isobath) evolution at Cavo from 1997 (before the first nourishment) to 2018 (ten years after the end of the second nourishment). In red sectors number.
Figure 4.
The beach at Cavo in January 2002, after the nourishment performed with iron rich materials with puddles showing the low permeability of the sediments (a); outcropping of the consolidated and impermeable fill material layer (b).
Figure 4.
The beach at Cavo in January 2002, after the nourishment performed with iron rich materials with puddles showing the low permeability of the sediments (a); outcropping of the consolidated and impermeable fill material layer (b).
Figure 5.
Fill materials used at Cavo: on the left side the iron rich mining waste, on the right side the new carbonate sandstone of the second nourishment. One euro coin for reference at the centre of the photo.
Figure 5.
Fill materials used at Cavo: on the left side the iron rich mining waste, on the right side the new carbonate sandstone of the second nourishment. One euro coin for reference at the centre of the photo.
Figure 6.
One of the two exedras constructed along the promenade (Google Earth).
Figure 6.
One of the two exedras constructed along the promenade (Google Earth).
Figure 7.
Location of sectors (a) and sectors and total mean beach width evolution (b) from 1997 to 2018. First nourishment 1999; second nourishment 2006–2008.
Figure 7.
Location of sectors (a) and sectors and total mean beach width evolution (b) from 1997 to 2018. First nourishment 1999; second nourishment 2006–2008.
Figure 8.
Beach vertical changes (m) at Cavo considering the 2002−2007 (a) and 2007–2018 (b) surveys.
Figure 8.
Beach vertical changes (m) at Cavo considering the 2002−2007 (a) and 2007–2018 (b) surveys.
Figure 9.
Northward (a) and southward (b) views of the remains of the filling groins on 18 June 2008.
Figure 9.
Northward (a) and southward (b) views of the remains of the filling groins on 18 June 2008.
Figure 10.
Storm berm crest on the Northern Cell, October 2018 (Google Earth).
Figure 10.
Storm berm crest on the Northern Cell, October 2018 (Google Earth).
Figure 11.
Sediment mean size (Mz) in June 2007 (a) and May 2009 (b).
Figure 11.
Sediment mean size (Mz) in June 2007 (a) and May 2009 (b).
Figure 12.
Mean size (phi) vs. Depth (m) for the sediments at Cavo in June 2007 and May 2009.
Figure 12.
Mean size (phi) vs. Depth (m) for the sediments at Cavo in June 2007 and May 2009.
Figure 13.
The beach at Cavo before (a) and after (b) the works (Courtesy Elbaworld).
Figure 13.
The beach at Cavo before (a) and after (b) the works (Courtesy Elbaworld).
Figure 14.
A small bar (a) and toilets (b) on the new gravel beach (April, 2017).
Figure 14.
A small bar (a) and toilets (b) on the new gravel beach (April, 2017).
Table 1.
Available data concerning Cavo beach area.
Table 1.
Available data concerning Cavo beach area.
| | June
1997 | March
2002 | July
2006 | June
2007 | April 2008 | May
2009 | June
2018 |
|---|
| Shoreline | ● | ● | ● | ● | ● | ● | ● |
| Bathymetry | | ● | | ● | | ● | ● |
| Sedimentology | | ● | | ● | | ● | |
Table 2.
Mean shoreline displacement (m) in the different periods from June 1997 to June 2018 in the 9 considered beach sectors and in the entire beach.
Table 2.
Mean shoreline displacement (m) in the different periods from June 1997 to June 2018 in the 9 considered beach sectors and in the entire beach.
| Sect. no. | June 1997
March 2002 | March 2002
July 2006 | July 2006
June 2007 | June 2007
April 2008 | April 2008
May 2009 | May 2009
June 2018 |
|---|
| 1 | 5.60 | −1.32 | 2.24 | −1.05 | 4.13 | 0.94 |
| 2 | 10.03 | −2.11 | 2.89 | −0.86 | 2.78 | 1.10 |
| 3 | 12.97 | −1.53 | 6.33 | −2.68 | 2.94 | 2.03 |
| 4 | 12.10 | 4.43 | 9.72 | −2.29 | 5.92 | −3.16 |
| 5 | 10.58 | 5.41 | 9.40 | −4.89 | 4.52 | −1.99 |
| 6 | 13.05 | 4.33 | 5.58 | −1.48 | 2.55 | 1.02 |
| 7 | 10.02 | 3.63 | 13.39 | −1.79 | 3.32 | 0.37 |
| 8 | 7.95 | −1.25 | 12.45 | −2.56 | 2.64 | −0.89 |
| 9 | 6.09 | −0.03 | 8.67 | −3.31 | 1.82 | 0.31 |
| Entire beach | 9.85 | 1.09 | 7.48 | −2.26 | 3.42 | 0.07 |
Table 3.
Beach volumetric changes during the studied period (m3).
Table 3.
Beach volumetric changes during the studied period (m3).
| | Dry Beach | From 0 to −5 m | Total |
|---|
| March 2002–June 2007 | 3730 | 696 | 4426 |
| June 2007–June 2018 | 4017 | −97 | 3920 |
| Publisher’s Note: MDPI stays neutral with regard to jurisdictional claims in published maps and institutional affiliations. |
© 2021 by the authors. Licensee MDPI, Basel, Switzerland. This article is an open access article distributed under the terms and conditions of the Creative Commons Attribution (CC BY) license (https://creativecommons.org/licenses/by/4.0/).


 ,
, 


