Article

A New Cross-Platform Instrument for Microstructure Turbulence Measurements

1
College of Information Science and Engineering, Ocean University of China, No. 238 Songling Rd., Qingdao 266100, China
2
College of Ocean Science and Engineering, Shandong University of Science and Technology, No. 579 Qianwangang Rd., Qingdao 266590, China
3
College of Engineering, Ocean University of China, No. 238 Songling Rd., Qingdao 266100, China
4
Shenyang Institute of Automation Chinese Academy of Sciences, Shenyang 110016, China
5
School of Information and Control Engineering, Qingdao University of Technology, Qingdao 266525, China
*
Author to whom correspondence should be addressed.
J. Mar. Sci. Eng. 2021, 9(10), 1051; https://doi.org/10.3390/jmse9101051
Submission received: 14 August 2021 / Revised: 17 September 2021 / Accepted: 21 September 2021 / Published: 24 September 2021
(This article belongs to the Section Ocean Engineering)

Abstract

:
This study developed a new cross-platform instrument for microstructure turbulence measurement (CPMTM) and evaluated its performance. The CPMTM is designed as an “all-in-one” payload that can be easily integrated with a variety of marine instrumentation platforms. The sensors in the CPMTM include two shear probes, a fast-response temperature probe, and an accelerometer for monitoring vibrations. In addition, a custom-designed flexible connection vibration-damping device is used to isolate platform vibrations. To validate the CPMTM performance, a direct comparison was carried out with a reference acoustic Doppler velocimeter in a controlled flume for four background turbulence levels. The results of the comparison show that the velocity spectra measured by the CPMTM and ADV w components are in agreement, which demonstrates the ability of the CPMTM to acquire accurate turbulence data. Furthermore, the CPMTM was integrated into the long-range Sea-Whale 2000 AUV and tested in the northern South China Sea in September 2020. The data collected by the CPMTM show that the measured shear spectrum of the noise reduction agrees well with the empirical Nasmyth spectrum. Turbulent kinetic energy dissipation rates as low as 7 × 10⁻¹⁰ W kg−1 can be resolved. Laboratory and field experiments illustrate that the CPMTM has an extraordinarily low noise level and is validated for turbulence measurements.

1. Introduction

Ocean turbulence is an important process in the global ocean circulation, affecting the diapycnal transport of heat and salt as well as biogeochemical substances, such as nutrients, carbon, and sediment [1]. Studying the geographical distribution and temporal variability of turbulent mixing is very important for understanding and predicting climate change [2].
Over the past seven decades, small-scale velocity and thermohaline fluctuations associated with oceanic turbulence have been measured with specialized platforms that can generally be categorized as either vertical or horizontal profiles (for a review of such techniques, see Lueck et al. (2002)) [3]. Recently, several small mobile platforms have been developed and used to measure ocean turbulence. These include (1) AUVs [4,5,6,7], (2) gliders [8,9,10], and (3) profiling floats [11,12]. These mobile platforms provide high-resolution turbulence data with very good temporal and spatial densities in near real time. Despite these efforts, all turbulence measurement platforms have been custom built, although they have very similar functions and hardware. Sensors, usually shear probes and thermistors, analog signal conditioning, and data acquisition systems are used to capture turbulent microstructure information. There is no modular turbulence package that can be applied to different platforms, which undoubtedly increases the difficulty and operational costs of turbulence measurement.
This study presents a newly developed cross-platform microstructure turbulence measurement (CPMTM) package, which is designed not for a specific platform but as an interoperable scientific package available for a platform of opportunity. The CPMTM combines multiple turbulence sensors and an independent high-speed signal acquisition system, which is a versatile instrument package for turbulence measurements that can be easily integrated with a variety of platforms, such as AUVs, gliders, profiling floats, and moorings. In Section 2, we describe the CPMTM, the sensors and sampling, and the vibration-damping device. Section 3 describes the results of a laboratory experiment conducted to evaluate the performance of the CPMTM. Section 4 describes the integration of the CPMTP into the long-range Sea-Whale 2000 AUV and discusses the turbulence data from a sea trial in the northern South China Sea (nSCS). Section 5 provides a summary and conclusions.

2. CPMTM Design

2.1. General Considerations

The CPMTM is designed as an “all-in-one” payload that can be integrated with a variety of marine instrumentation platforms and only requires power and an ON/OFF signal from the supporting platform. The basic design philosophy includes the following: First, the CPMTM needs to be small to allow implementation on a wide variety of platforms. Second, it must carry the necessary sensors and supporting electronics for turbulence measurements, as a unit module can be measured alone, and another important consideration is that the CPMTM must be kept at a low vibration level during the measurement. This is because vibration can contaminate the measured turbulent velocity shear signal, rendering the measurement invalid [13]. Therefore, to be suitable for different platforms, the CPMTP must be designed with a vibration-damping device.

2.2. Instrument Design

The CPMTM is shown in Figure 1a. Its fuselage is machined from acetal plastic into a cylindrical shape with a streamlined nose to reduce resistance. The CPMTM diameter is 0.08 m, with an overall length of 0.60 m (with probe), and it weighs 2.8 kg in air, and 0 kg in water; the depth is rated as 1000 m, with a safety factor of 1.5.
Inside the CPMTM fuselage are two separated pressure cases, the data acquisition pressure case and the data logger pressure case (Figure 1c), both of which are made of corrosion-resistant 6061 T6 aluminum. The two separated pressure cases are mechanically connected by a stainless-steel mounting bracket and a vibration-damping device (described in Section 2.4). The outer dimension of the data acquisition pressure case is 200 mm long and 32 mm in diameter, and it contains turbulence sensors and signal acquisition electronics. The front cap of the data acquisition pressure case is designed to fit a turbulence sensor array (Figure 1b) with the smallest possible diameter. We designed three positions for the sensor mounting with a diameter of 32 mm. All sensors are fixed to the front cap using screws. The data logger pressure case diameter is 78 mm, with a length of 220 mm. In this case, three electronic boards are mounted. These are the power boards that supply power to the system, the platform interface board that allows the platform to control the starting and stopping of data acquisition via an RS-232 communication link, and a data storage board for data storage. The data storage board has a capacity of 64 GB. A sea cable bulkhead connector and pressure sensor are installed on the bottom cap of the data logger pressure case.

2.3. Sensors and Sampling

The CPMTM includes several sensors that measure the turbulent flow properties and the instrument performance, including two airfoil shear probes, a fast thermistor, a 3-axis accelerometer, and a pressure sensor. The sensor specifications are listed in Table 1. The turbulent velocity fluctuations are measured using a shear probe. The operating principle, calibration, signal handling, and limitations of the probe have been described in many studies [13,14]. The output of the shear probe ( E ) is a voltage proportional to the instantaneous cross-stream component of the velocity field.
E = 2 2 S U w
where U is the speed of the sensor through the water, S is the sensitivity of the probe, and w is the velocity fluctuation. The shear probe is sensitive to only one cross-stream flow component. Therefore, the CPMTM consists of two orthogonally installed shear probes, where one probe is oriented to sense vertical velocity fluctuations ∂z⁄∂x, while the other responds to the lateral component ∂y⁄∂x. Microstructure temperature fluctuations are measured with a fast thermistor (FP07), installed 13 mm below the shear probe. The sensor response time is approximately 7 ms. The thermistor electronics produce two signals: one is a linear function of temperature, T, and the other is proportional to the temperature plus its rate of change, T + (∂T⁄∂t). To determine the level of vibration during profiling, the CPMTM is equipped with a highly sensitive 3-axis accelerometer, which is positioned inside the data acquisition pressure case near its point of attachment to the shear probe. Body vibrations can be removed from shear signals during data post-processing. The depth is measured by a pressure sensor, rated at 2000 dbar, manufactured by Keller, Inc.
The signal acquisition electronics inside the CPMTM are specific for measuring the signals of either the shear probe or the thermistor. The basic principle is as follows: first, the signals from each sensor are filtered by a 0.1 Hz high-pass filter and an active low-pass filter with a cut-off frequency of 159 Hz; then, these signals are amplified, conditioned, and converted to a digital signal by a 16-bit AD converter; finally, the digital signal is transmitted to the data storage board via the cable. The sampling frequencies for the shear probe and thermistor signal, 3-axis accelerometer, and pressure sensor are 1024 Hz, 512 Hz, and 10 Hz, respectively.

2.4. Vibration-Damping Device

As the shear probes are essentially transverse force sensors, they are sensitive to vibration noise, and any vibration within the turbulence bandwidth will appear as a spurious signal in the measured shear signal [8], which will reduce the lower resolution limit of the turbulent kinetic energy dissipation rate [15,16]. Therefore, the most important consideration for turbulence measurement using shear probes is to eliminate the noise caused by platform vibration, both at the high frequencies associated with the moving machinery and at the low frequencies associated with the rigid body motions of the entire platform. Traditionally, rubber and urethane foam have often been used to isolate the mechanical vibration sources and the turbulence package, which significantly reduces the high-frequency vibrational noise transmitted to the turbulence package [4,6]. However, in a long-term environment, rubber or urethane foam easily loses its damping effect due to deformation, which makes it impossible to realize vibration noise elimination.
To increase the versatility and improve the measurement accuracy, the CPMTM must be designed to suppress vibrations. In this study, we propose a flexible connection vibration-damping device, as shown in Figure 2, which adopts the design of eight extension springs with a symmetrical distribution and an inclined tension structure. The middle ring of the vibration-damping device is fixed on the mounting bracket, and the two side rings are fixed in the data acquisition pressure case. It can achieve a soft connection between the data acquisition pressure case and the data logger pressure case of the CPMTM and cut off the path of vibration transmitted to the airfoil shear sensor.
In the oceanic environment, the variance of the shear resides mainly at wavenumbers (k) between 1 and 100 cpm (cycles per meter). To measure the total wavenumbers of turbulence, the observation frequency (F) range of microstructure turbulence is 0.3 to 100 Hz, which is calculated by (2).
F = U k       ( 0.3   m / s < U < 1   m / s )
Therefore, we carried out modeling, numerical simulation analysis, and vibration tests on the vibration-damping device in the range of 0–200 Hz to select the appropriate parameters (for the details, refer to Nie et al. (2020)) [17]. When satisfying the intensity and reliability condition, the wire diameter, mean coil diameter, and free length of the extension spring are 0.8 mm, 4.8 mm, and 35.6 mm, respectively. By comparing and analyzing the time–frequency domain characteristics of vibration acceleration before and after the vibration-damping device, the results show that the vibration acceleration is significantly reduced, especially above 54 Hz, whereupon the average damping efficiency is more than 64%, which verifies the validity of this method [17]. Thus, the device has the advantages of deep-sea pressure resistance, corrosion resistance, and high efficiency in vibration reduction.

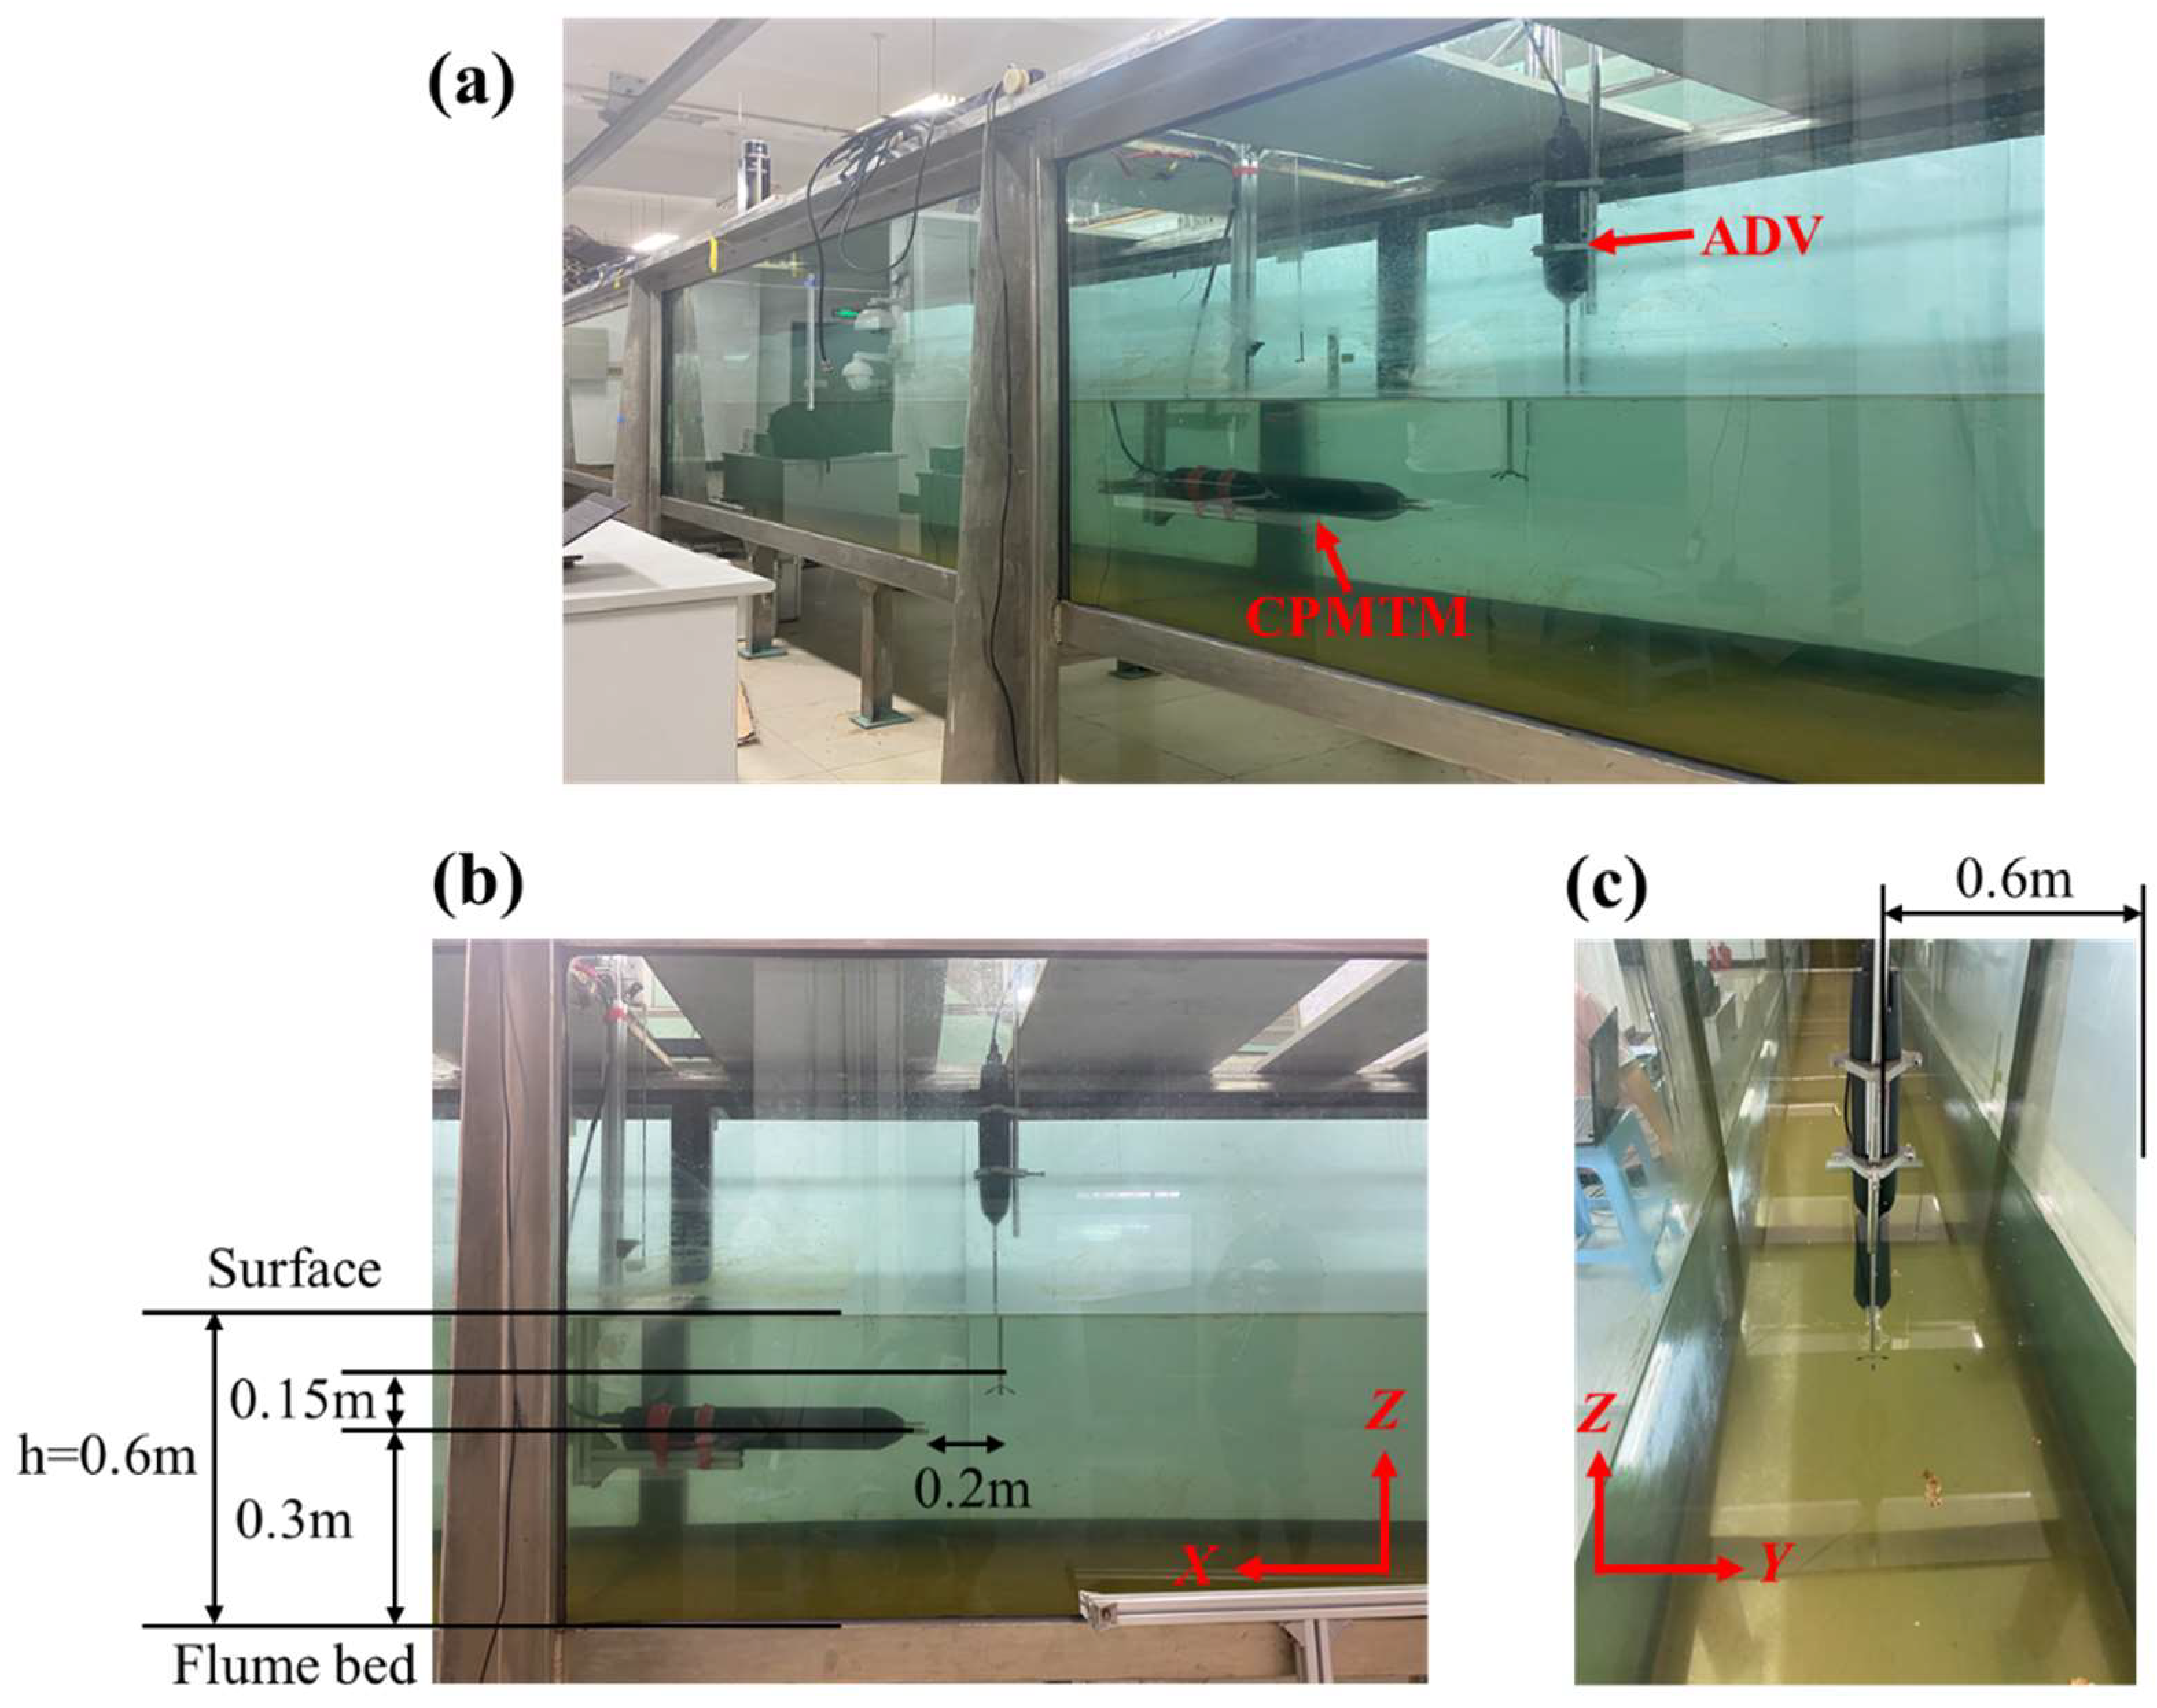
3. Laboratory Experiment

To validate the CPMTM and demonstrate its functionality, a direct comparison was carried out with an acoustic Doppler velocimeter (ADV) in a flume at the Ocean University of China. The ADV can measure three-dimensional instantaneous velocity, turbulence characteristics, and power spectral density and has been widely used in experimental flumes and fields [18,19,20]. A schematic of the experiment is presented in Figure 3. Both instruments were deployed in the flume, and simultaneous measurements were undertaken at current velocities ranging from 0.3 to 0.6 m s−1. The experimental results enabled us to evaluate the performance of the CPMTM under controlled conditions.

3.1. Acoustic Doppler Velocimeter

The ADV used in this experiment was a bistatic sonar developed by Nortek (model Vector-300-Vectrino, www.nortekgroup.com/products/vector-300-m (accessed on 17 March 2020). It consists of one transmit and four receive transducers, which are spaced at 90° azimuthal angles around the transmitter, and each receive transducer is slanted at 120° from the axis of the transmitter. The ADV uses the Doppler effect to measure the instantaneous three-dimensional current velocity by transmitting 6 MHz short acoustic pulse pairs, listening to their echoes, and measuring the change in frequency of the returned sound. The measurement volume is located at the intersection of the transmitter and receivers, 150 mm below the transmitter, and is approximately 5 ~ 20 mm long and 15 mm in diameter. The maximum sampling frequency of the ADV is 64 Hz, with a sampling accuracy of 0.5% of the measurement value of ±1 mm/s.

3.2. Experimental Setup and Procedure

The experiments were conducted in a flume 60 m long, 1.2 m wide, and with a 0.6 m water depth, composed of glass sidewalls and a steel bottom bracket (Figure 3a). The water was circulated by a centrifugal pump, and the rpm of the pump was controlled by an electrical control unit. In the experiment, the orthogonal coordinate system was defined as follows: the X-axis was oriented along the main flow and parallel to the flume bed, the Y-axis was oriented to the flume sidewall, and the Z-axis was perpendicular to the water surface. The instantaneous velocities along the X-, Y-, and Z-axes are represented by the symbols u ˜ , v ˜ , and w ˜ , and their averages are
{ U = u ˜ ¯ V = v ˜ ¯ W = w ˜ ¯
where the average is computed over 180 s records during which the downstream velocity in the flume is held constant. The instantaneous turbulent velocity fluctuations are given by
{ u = u ˜ U v = v ˜ V w = w ˜ W
The measuring section was set 25 m downstream from the entrance, and the flow was fully developed before entering the measuring position. The CPMTM was placed horizontally in the flume (h = 0.3 m, y = 0.6 m) with the sensor nose pointing in the direction of the oncoming flow (Figure 3b,c). The instrument was held rigid to the flume superstructure by a T-shaped bracket, which effectively prevents heaving and pitching motions that occur when the instrument is pushed downstream by the oncoming flow. As the ADV’s noise level is the lowest for the w component, we aligned the shear probe direction of sensitivity with that axis in the experiment.
The ADV was mounted vertically to a fixed structure using clamps, and the probe was oriented so that u was positive upstream, and w was positive upward. To ensure that the ADV sampling volume was level with the position of the shear probe, the ADV probe was 0.15 m below the water surface with a lateral distance of 0.6 m. However, due to mechanical constraints, the ADV sampling volume was positioned 0.2 m upstream of the shear probe. Despite this small horizontal displacement, the statistical properties of the turbulence are expected to be the same at both locations.
Experiments were conducted at four speeds, which were nominal downstream flow speeds of U = 0.3, 0.4, 0.5, and 0.6 m s−1. The flow was allowed to stabilize for approximately one hour before each measurement. Each measurement time for the two instruments was 10 min.

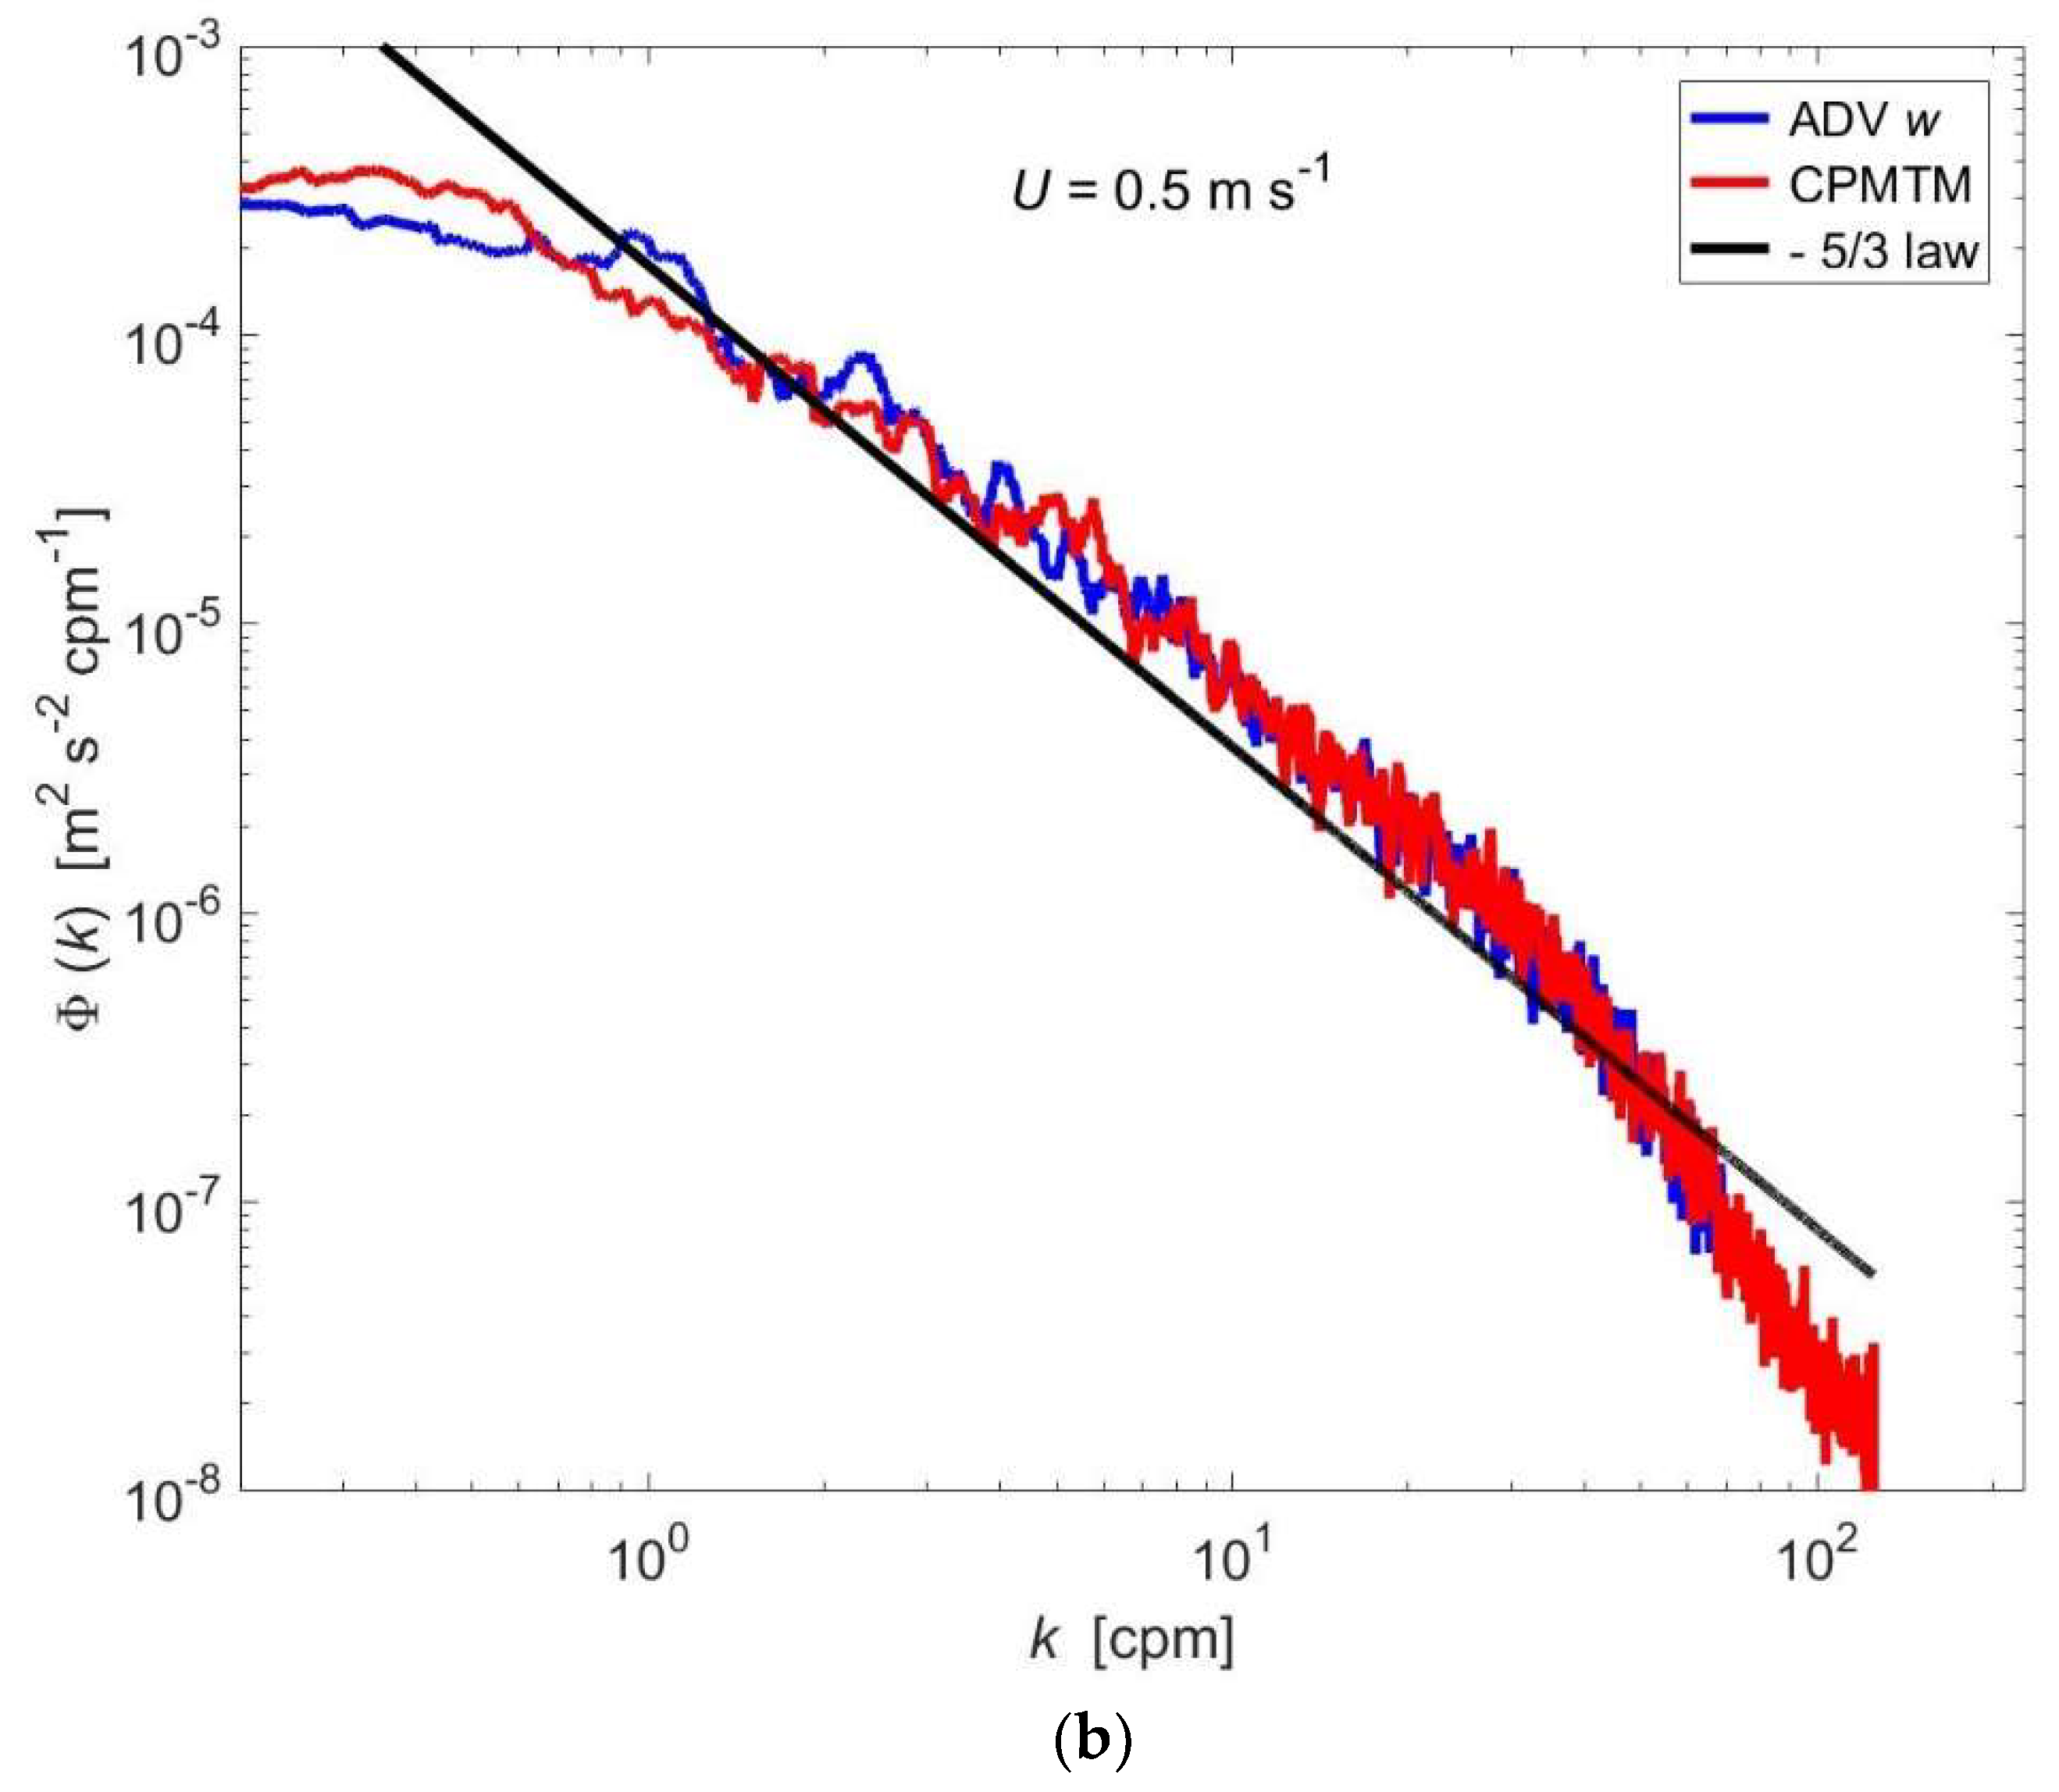
3.3. Comparison between CPMTM and ADV

Although the shear probe and ADV operate on different principles, both measure velocity fluctuations. The shear spectrum measured by the CPMTM can be converted to the velocity spectrum using the calculation method described by Wolk et al. (2002) [8]. Thus, the performance of the CPMTM was discussed by comparing it with the velocity spectrum of the w component measured by the ADV at different flow speeds.
Figure 4 presents the corresponding results for the speeds with U = 0.3 and 0.5 m s−1. The CPMTM is shown as red lines, and the ADV w component is shown as blue lines. The black line is the -5/3 decay law as a consistent indicator, which is predicted by Kolmogorov’s theory for homogeneous isotropic turbulent flow [21,22]. The results show excellent agreement between the CPMTM and ADV w components in the wavenumber range of approximately two decades. Starting at 0.8 cpm, the energy of the CPMTM and ADV w component decayed as the wavenumber increased, following the theoretical -5/3 law. Both spectra broke from the -5/3 law at approximately 60 cpm. The velocity spectrum for the other two speeds exhibited the same characteristics as those shown in Figure 4. Thus, the velocity fluctuations measured by both the CPMTM and ADV are consistent. The CPMTM performance was validated using experimental laboratory results.

4. Field Experiment

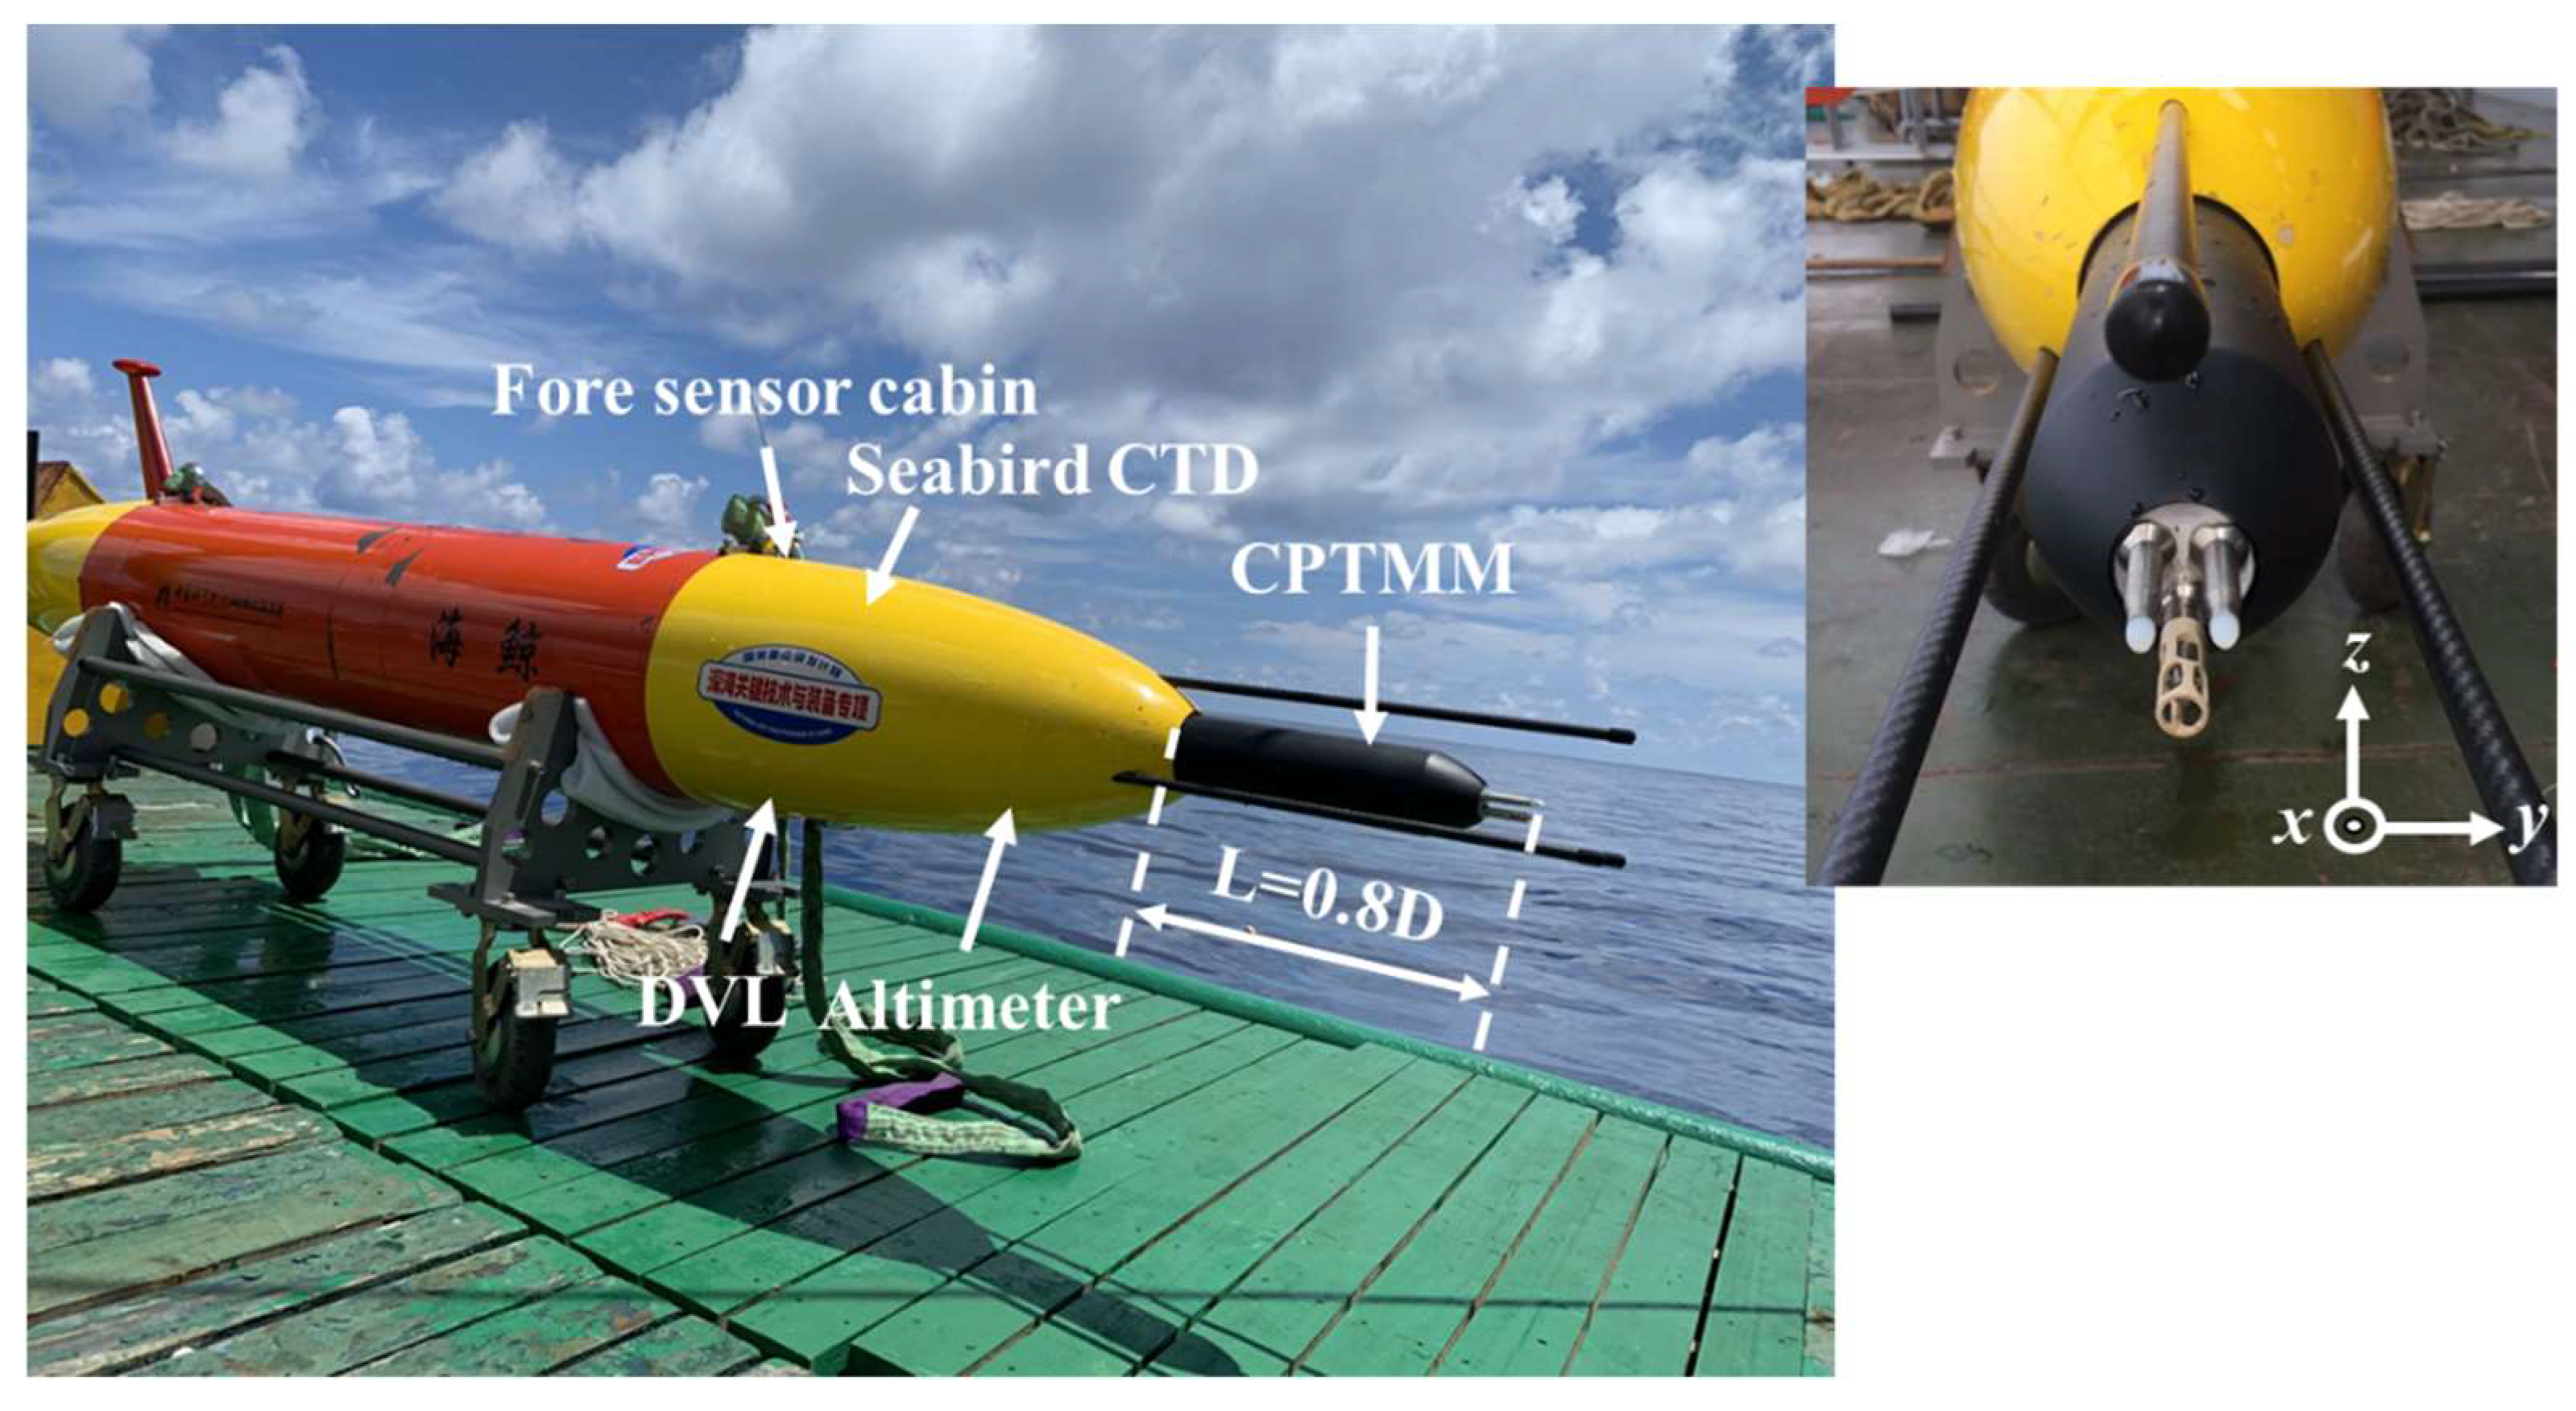
4.1. Implementation on the AUV

Small AUVs offer the possibility of conducting four-dimensional space–time measurements of significant regions in the ocean. Therefore, we chose the long-range Sea-Whale 2000 AUV developed by the Shenyang Institute of Automation, CAS [23], as the CPMTM observation platform (Figure 5). The Sea-Whale 2000 AUV is 3 m long and 0.35 m in diameter. It can dive to 2000 m underwater for ocean surveys and has a 1500 km endurance at a speed of 0.5 m s−1. The AUV onboard sensors include a downward-looking 1 MHz Doppler velocity log (DVL), a Seabird conductivity, temperature, and depth (CTD) data logger, a three-dimensional compass module, and an altimeter. The Sea-Whale 2000 AUV can operate in multiple working modes, such as depth-following mode, yo-yo mode like a glider, and the mode combining depth-following and yo-yo modes.
The implementation of the CPMTM on the Sea-Whale 2000 AUV must ensure accurate measurement while minimizing its effect on the AUV’s flight characteristics [24,25]. Therefore, the CPMTM was mounted in the center of the fore sensor cabin of the AUV, with the shear probes’ 0.8 body diameters ahead of the fore sensor cabin, outside of the region of flow deformation. The CPMTM/AUV coordinate systems are coincident so that high-resolution vertical velocity fluctuations (∂z⁄∂x) and lateral velocity fluctuations (∂y⁄∂x) can be obtained simultaneously.

4.2. Site and Deployment

The field experiment was conducted between 10 and 17 September 2020 on board the R/V Yuezhanyuke 8 over the slope of the nSCS. The location of the experiment within the nSCS is shown in Figure 6a, and the detailed track of the Sea-Whale 2000 AUV is shown in Figure 6b. The AUV was observed from east to west along the 18°30′ N section, starting at 06:00 on 14 September 2020 (local time), and ending at 17:00 on 14 September 2020. The working mode was a combination of yo-yo and depth-following modes, in which the yo-yo mode had a pitch angle of approximately 13° between the surface and 200 m, and the depth-following mode had a duration of 5 min at a depth of 200 m. As a result of the measurements, a total of 10 continuous profiles with a horizontal distance of 25 km were completed, and numerous high-quality spatiotemporal turbulence data of the upper ocean were obtained.

4.3. Data Analysis

The AUV flight performance of all profiles yielded similar results. Figure 7 shows a summary of the data recorded by the AUV during one profile (from 7:45 to 8:35), covering time series of depth, heading, roll, pitch (θ), vertical speed (W), and speed along the AUV path (U). During this mission, the flight path was a straight line from west to east with a constant heading of 270° (Figure 7b), and the AUV performed in depth-following mode for approximately 5 min at 200 m depth (Figure 7a). The roll angle was stable between 0° and 2° (Figure 7c). The average pitch angle was -13.42 ± 1.31°/12.78 ± 1.24° (mean ± standard deviation) during descent/ascent (Figure 7d). The pitch angle and the vertical speed (Figure 7e) allowed us to estimate the speed of the AUV along its flight path, U = W/sin (θ). The average speed along the AUV path was 0.58 m s−1/0.65 m s−1 during descent/ascent and 0.51 m s−1 in the depth-following mode (Figure 7f). The flight performance of the AUV was stable and met the requirements of turbulence observation.
In this study, we report only the results of shear probes. A sample of time series for the velocity shear, 120 s long and collected during a steady descent, is shown in Figure 8. The velocity shear amplitudes for both shear probe #1 and shear probe #2 varied from −0.5 to 0.5 s−1 and were fairly uniform. There was a large singular value in shear probe #1 near t = 35 s, and the data segment was discarded in the analysis.
A standard parameter used in oceanographic research to describe the strength of turbulence is the dissipation rate of the turbulent kinetic energy (ɛ). Assuming isotropic turbulence [26,27], ɛ can be calculated by integrating the spectra of the measured velocity shear variance over wavenumbers (k) at which turbulent dissipation occurs [28]:
ɛ i = 15 2 v ( u i x ) 2 ¯ = 15 2 v k m i n k m a x Φ u i ( k ) d k  
where i (=1, 2) identifies the shear probe number ( u 1 = z and u 2 = y), ν is the kinematic viscosity of seawater (≈1 × 10⁻⁶ m2 s−1), the overbar denotes averaging, and Φ u i ( k ) is the calculated spectrum of velocity shear variance for every 4 s segment [29]. The lower integration limit, k m i n , is usually set to 1 ~ 2 cpm. The upper limit of integration, k m a x , is determined by comparing the shear spectrum with the theoretical Nasmyth spectrum [13,30]. The k m a x increases (decreases) if the shear spectrum is well above (below) the theoretical Nasmyth spectrum. The Nasmyth spectrum indicates that 90% of the variance is resolved by integrating to 0.5 k k , where k k = ( 2 π ) 1 ( ɛ / v 3 ) 1 / 4 is the Kolmogorov wavenumber [31]. Before calculating the dissipation rate, to minimize contamination from vehicular motions and vibrations, we removed the acceleration-related coherent noise from the shear signal using an algorithm developed specifically for AUVs by Goodman et al. (2006) [32].
Figure 9a shows the shear spectrum of the data collected in the nSCS at 78 ~ 80 m. There was good agreement between Φ u 1 ( k ) (shear probe #1) and Φ u 2 ( k ) (shear probe #2), and Φ u 1 ( k ) and Φ u 2 ( k ) agree well with the corresponding Nasmyth spectrum between 1 and 40 cpm. The dissipation rates were estimated by (4), which are ɛ1 = 1.5 × 10⁻⁸ W kg−1 with k k   = 38 cpm, and ɛ2 = 2.3 × 10⁻⁸ W kg−1 with k k   = 46 cpm, respectively. The shear spectrum calculated for the low turbulence is shown in Figure 9b. The dissipation rates computed for the two shear probes were ɛ1 = 7 × 10⁻¹⁰ W kg−1 and ɛ2 = 5.6 × 10⁻¹⁰ W kg−1. This shows that the Sea-Whale 2000 AUV with the CPMTM has extraordinarily low noise levels, indicating that the system can accurately resolve open ocean turbulence levels and is an acceptable turbulence measurement platform.

5. Conclusions

A CPMTM was designed and manufactured, which consists of multiple turbulence sensors (shear probes and fast-response thermistor), an independent high-speed signal acquisition system, and a flexible connection vibration-damping device. The CPMTM is a small, highly integrated, and versatile instrument package for turbulence measurements that can be easily integrated with a variety of platforms, such as AUVs, gliders, and profiling floats, and only requires power and an ON/OFF signal from the supporting platform.
Data from laboratory and field experiments were used to gauge the CPMTM performance. A direct comparison between the CPMTM and an ADV was performed using a flume. The velocity spectra from both instruments at different flow velocities showed excellent agreement and followed the theoretical -5/3 law in the range of approximately 0.8 ~ 60 cpm. The CPMTM performance was validated using experimental laboratory results. The CPMTM was successfully implemented on the Sea-Whale 2000 AUV and tested in the nSCS in September 2020. During the test, the AUV traveled from east to west in a combination of yo-yo and depth-following modes, and a total of 10 continuous profiles between 0 and 200 m and at a horizontal distance of 25 km were collected. The tests obtained high-quality turbulence data over a total of 10 h. The flight performance of the AUV was stable and met the requirements of turbulence observation. The average speed along the AUV path was 0.58 m s−1/0.65 m s−1 during descent/ascent and 0.51 m s−1 in the depth-following mode. The velocity shears recorded by the orthogonally mounted shear probes of the CPMTM were in good agreement, and the shear spectra of the noise reduced from the two probes were in good agreement with the Nasmyth spectrum. At low shear turbulence, the level of the dissipation rate of turbulent kinetic energy calculated from shear probe data was as low as 7 × 10⁻¹⁰ W kg−1, which is comparable to the performance of most vertical free-fall profilers. All indications are that the developed CPMTM has extraordinarily low noise levels that can accurately resolve open ocean turbulence levels and is an acceptable turbulence measuring instrument.

Author Contributions

Conceptualization, Y.N.; methodology, Y.N.; software, X.L.; validation, H.Y. and D.S.; formal analysis, Y.H.; resources, H.Y.; writing—original draft preparation, Y.N.; writing—review and editing, Y.N. and X.H.; project administration, H.Y. All authors have read and agreed to the published version of the manuscript.

Funding

This research was funded by the National Natural Science Foundation of China, grant numbers 61871354 and 61727806, the National Natural Science Foundation of China, grant number 62001262, the Nature Science Foundation of Shandong Province, grant number ZR2020QF008, and the National Key R&D Plan of China, grant number 2017YFC0305803.

Institutional Review Board Statement

Not applicable.

Informed Consent Statemen

Not applicable.

Data Availability Statement

The data supporting this study are provided within this paper.

Acknowledgments

We would like to especially thank Dalei Song and Hua Yang for their guidance, and all teams involved in the research and development for their help.

Conflicts of Interest

The authors declare no conflict of interest. The funders had no role in the design of the study; in the collection, analyses, or interpretation of data; in the writing of the manuscript, or in the decision to publish the results.

Abbreviation

CPMTMCross-platform instrument for microstructure turbulence measurement
AUVAutonomous underwater vehicle
nSCSNorthern South China Sea
ADAnalog-digital
ADVAcoustic Doppler velocimeter
CASChinese Academy of Sciences
DVLDoppler velocity log
CTDConductivity, temperature, and depth
cpmCycles per meter

References

  1. Yasutaka, G.; Ichiro, Y.; Maki, N. Comparison of Turbulence Intensity from CTD-Attached and Free-Fall Microstructure Profilers. J. Atmos. Ocean. Technol. 2017, 35, 147–162. [Google Scholar]
  2. Shang, X.D.; Liang, C.D.; Chen, G.Y. Spatial distribution of turbulent mixing in the upper ocean of the south china sea. Ocean Sci. 2017, 13, 503–519. [Google Scholar] [CrossRef] [Green Version]
  3. Lueck, R.G.; Wolk, F.; Yamazaki, H. Oceanic velocity microstructure measurements in the 20th century. J. Oceanogr. 2002, 58, 153–174. [Google Scholar] [CrossRef]
  4. Dhanak, M.R.; Holappa, K. An Autonomous Ocean Turbulence Measurement Platform. J. Atmos. Ocean. Technol. 1999, 16, 1506–1518. [Google Scholar] [CrossRef]
  5. Goodman, L.; Wang, Z. Turbulence Observations in the Northern Bight of Monterey Bay from a Small AUV. J. Mar. Syst. 2009, 77, 441–458. [Google Scholar] [CrossRef]
  6. Tippenhauer, S.; Dengler, M.; Fischer, T.; Kanzow, T. Turbulence and finestructure in a deep ocean channel with sill overflow on the mid-Atlantic ridge. Deep-Sea Res. Part I 2015, 99, 10–22. [Google Scholar] [CrossRef]
  7. Fisher, A.W.; Nidzieko, N.J.; Scully, M.E.; Chant, R.J.; Hunter, E.J.; Mazzini, P.L.F. Turbulent Mixing in a Far-Field Plume During the Transition to Upwelling Conditions: Microstructure Observations From an AUV. Geophys. Res. Lett. 2018, 45, 9765–9773. [Google Scholar] [CrossRef]
  8. Wolk, F.; Lueck, R.G.; St. Laurent, L. Turbulence measurements from a glider. In Proceedings of the OCEANS 2009, MTS/IEEE Biloxi—Marine Technology for Our Future: Global and Local Challenges, Biloxi, MS, USA, 26–29 October 2009. [Google Scholar]
  9. Creed, E.; Ross, W.; Lueck, R.; Stern, P.; Douglas, W.; Wolk, F.; Hall, R. Integration of a RSI microstructure sensing package into a Seaglider. In Proceedings of the OCEANS 2015—MTS/IEEE Washington 2015, Washington, DC, USA, 19–22 October 2015. [Google Scholar]
  10. Todd, R.E. High-frequency internal waves and thick bottom mixed layers observed by gliders in the Gulf Stream. Geophys. Res. Lett. 2017, 44, 6316–6325. [Google Scholar] [CrossRef]
  11. Nagai, T.; Inoue, R.; Tandon, A.; Yamazaki, H. Evidence of enhanced double-diffusive convection below the main stream of the Kuroshio Extension. J. Geophys. Res. Ocean. 2015, 120, 8402–8421. [Google Scholar] [CrossRef] [Green Version]
  12. Liu, X.; Luan, X.; Deng, Z.D.; Song, D.; Zang, S.; Yang, H.; Xin, J.; Chen, X. Autonomous ocean turbulence measurements from a moored upwardly rising profiler based on a buoyancy-driven mechanism. Mar. Technol. Soc. J. 2017, 51, 12–22. [Google Scholar] [CrossRef]
  13. Wolk, F.; Yamazaki, H.; Seuront, L.; Lueck, R.G. A New Free-Fall Profiler for Measuring Biophysical Microstructure. J. Atmos. Ocean. Technol. 2002, 19, 780. [Google Scholar] [CrossRef]
  14. Osborn, T.R.; Crawford, W.R. An Airfoil Probe for Measuring Turbulent Velocity Fluctuations in Water. In Air-Sea Interaction; Springer: Boston, MA, USA, 1980. [Google Scholar]
  15. Moum, J.N.; Lueck, R.G. Causes and implications of noise in oceanic dissipation measurements. Deep Sea Res. Part A Oceanogr. Res. Pap. 1985, 32, 379–390. [Google Scholar] [CrossRef]
  16. Prandke, H.; Stips, A. Test measurements with an operational microstructure-turbulence profiler: Detection limit of dissipation rates. Aquat. Sci. 1998, 60, 191. [Google Scholar] [CrossRef]
  17. Nie, Y.; Luan, X.; Song, D.; Gao, Q.; Yang, H. Soft Connection Based Vibration Reduction for an Autonomous Ocean Turbulence Measurement Platform. J. Vib. Shock. 2020, 39, 82–88. [Google Scholar]
  18. Song, T.; Chiew, Y.M. Turbulence measurement in nonuniform open-channel flow using Acoustic Doppler Velocimeter (ADV). J. Eng. Mech. 2001, 127, 219–232. [Google Scholar] [CrossRef]
  19. García, C.M.; Cantero, M.I.; Niño, Y.; García, M.H. Turbulence Measurements with Acoustic Doppler Velocimeters. J. Hydraul. Eng. 2005, 131, 1062–1073. [Google Scholar] [CrossRef]
  20. Sulaiman, M.S.; Sinnakaudan, S.K.; Shukor, M.R. Near bed turbulence measurement with acoustic doppler velocimeter (ADV). KSCE J. Civ. Eng. 2013, 17, 1515. [Google Scholar] [CrossRef]
  21. Kolmogorov, A.N. The local structure of turbulence in an incompressible viscous fluid for very large Reynolds number. Proc. R. Soc. Lond. Ser. A Math. Phys. Sci. 1991, 434, 9–13. [Google Scholar]
  22. Gratiot, N.; Mory, M.; Auchère, D. An acoustic Doppler velocimeter (ADV) for the characterisation of turbulence in concentrated fluid mud. Cont. Shelf Res. 2000, 20, 1551–1567. [Google Scholar] [CrossRef]
  23. Huang, Y.; Qiao, J.; Yu, J.; Wang, Z.; Xie, Z.; Liu, K. Sea-Whale 2000: A Long-range Hybrid Autonomous Underwater Vehicle for Ocean Observation. In Proceedings of the OCEANS 2019-Marseille, Marseille, France, 17–20 June 2019; 20 June 2019. [Google Scholar]
  24. Wyngaard, J.C.; Rockwell, L.; Friehe, C.A. Errors in the measurement of turbulence upstream of an axisymmetric body. J. Atmos. Ocean. Technol. 1985, 2, 605–614. [Google Scholar] [CrossRef]
  25. Fer, I.; Paskyabi, M.B. Autonomous Ocean Turbulence Measurements Using Shear Probes on a Moored Instrument. J. Atmos. Ocean. Technol. 2014, 31, 474–490. [Google Scholar] [CrossRef] [Green Version]
  26. Taylor, G.L. Statistical theory of turbulence. Proc. R. Soc. Lond. Ser. 1935, A151, 421–444. [Google Scholar] [CrossRef] [Green Version]
  27. Oakey, N.S. Determination of the rate of dissipation of turbulent energy from simultaneous temperature and velocity shear microstructure measurements. J. Phys. Oceanogr. 1982, 12, 256–271. [Google Scholar] [CrossRef] [Green Version]
  28. Scheifele, B.; Waterman, S.; Carpenter, J. Turbulent dissipation rates, mixing, and heat fluxes in the Canadian Arctic from glider-based microstructure measurements. In Proceedings of the International Symposium on Stratified Flows, San Diego, CA, USA, 29 August–1 September 2016. [Google Scholar]
  29. Osborn, T.R. Estimates of the local rate of vertical diffusion from dissipation measurements. J. Phys. Oceanogr. 1980, 10, 83–89. [Google Scholar] [CrossRef] [Green Version]
  30. Nasmyth, P.W. Oceanic Turbulence. Ph.D. Thesis, Department of Physics, University of British Columbia, Vancouver, BC, Canada, 1970; p. 69. [Google Scholar]
  31. Fer, I.; Peterson, A.K.; Ullgren, J.E. Microstructure Measurements from an Underwater Glider in the Turbulent Faroe Bank Channel Overflow. J. Atmos. Ocean. Technol. 2014, 31, 1128–1150. [Google Scholar] [CrossRef] [Green Version]
  32. Goodman, L.; Levine, E.R.; Lueck, R.G. On Measuring the Terms of the Turbulent Kinetic Energy Budget from an AUV. J. Atmos. Ocean. Technol. 2006, 23, 977–990. [Google Scholar] [CrossRef] [Green Version]
Figure 1. Design of the CPMTM: (a) schematic overview of the CPMTM; (b) array of turbulence sensors in the nose; (c) CPMTM with flexible connection vibration-damping device and other internal structures.
Jmse 09 01051 g001
Figure 2. Structure of flexible connection vibration-damping device. (a) Front view. (b) Side view.
Jmse 09 01051 g002
Figure 3. General view of laboratory experiment. (a) shows the schematic of the recirculating flume and the equipment installation; (b) the elevation view of the experimental setup and sampling location; (c) the side view of panel (b).
Jmse 09 01051 g003
Figure 4. The velocity spectrum measured by the CPMTM and the ADV in a flume at two speeds (U = 0.3 and 0.5 m s−1), where the red line is the CPMTM, the blue line is the ADV w component, and the black lines are the—5/3 decay law. (a) Measurement results at U = 0.3 m s−1; (b) Measurement results at U = 0.5 m s−1.
Jmse 09 01051 g004aJmse 09 01051 g004b
Figure 5. Photograph of the Sea-Whale 2000 AUV with the CPMTM and other oceanographic sensors. The CPMTM is housed in the center of the fore sensor cabin with the shear probes ahead of the nose by 0.8 diameters. Detailed diagram showing the location of the microstructure probes in the upper right corner.
Jmse 09 01051 g005
Figure 6. (a) Topography of the northern South China Sea and the measurement location (red rectangle). (b) Enlarged view of the area inside the red rectangle indicated in panel (a), showing the AUV start/end points and path, as well as the local bathymetry. In both panels, color indicates water depth (m).
Jmse 09 01051 g006
Figure 7. Sea-Whale 2000 AUV (with the CPMTM) flight performance parameters of one profile. Time series are shown for (a) depth, (b) heading, (c) roll, (d) pitch, (e) vertical speed (W), and (f) speed along the AUV path (U).
Jmse 09 01051 g007
Figure 8. Measured time series of the velocity shear.
Jmse 09 01051 g008
Figure 9. Examples of the shear spectrum at 78–80 m depth (a) and low turbulence segment (b). The heavy lines (blue lines are from shear probe #1 and red lines are from shear probe #2) represent the shear spectrum after removal of shear variance correlated with vehicle acceleration. The corresponding Nasmyth spectrum is indicated by the black line. The arrows (blue, red) indicate the integration limit. The dissipation rate estimate for each shear spectrum is presented in the upper left corner of each plot.
Jmse 09 01051 g009
Table 1. Parameters measured with CPMTM, sensor types, and sensor specifications.
ParameterSensorRangePrecision ResolutionFrequency
Velocity shearShear probe0–10 s−15%10−3 s−11024 Hz
High-resolution temperatureFP07−5–35 °C0.005 °C10−5 °C1024 Hz
VibrationAccelerometer±2 g±1%10−5 g512 Hz
PressureKeller2000 dbar0.1% of Fs 0.001 dbar10 Hz
Publisher’s Note: MDPI stays neutral with regard to jurisdictional claims in published maps and institutional affiliations.

