Article

Performance Analysis of Combined Cycle with Air Breathing Derivative Gas Turbine, Heat Recovery Steam Generator, and Steam Turbine as LNG Tanker Main Engine Propulsion System

Department of Mechanical Engineering, Universitas Indonesia, Kampus Baru UI, Jawa Barat 16424, Indonesia
*
Author to whom correspondence should be addressed.
J. Mar. Sci. Eng. 2020, 8(9), 726; https://doi.org/10.3390/jmse8090726
Submission received: 1 September 2020 / Revised: 13 September 2020 / Accepted: 14 September 2020 / Published: 20 September 2020
(This article belongs to the Special Issue Marine Power Systems)

Abstract

:
This study explains the performance analysis of a propulsion system engine of an LNG tanker using a combined cycle whose components are gas turbine, steam turbine, and heat recovery steam generator. The researches are to determine the total resistance of an LNG tanker with a capacity of 125,000 m3 by using the Maxsurf Resistance 20 software, as well as to design the propulsion system to meet the required power from the resistance by using the Cycle-Tempo 5.0 software. The simulation results indicate a maximum power of the system of about 28,122.23 kW with a fuel consumption of about 1.173 kg/s and a system efficiency of about 48.49% in fully loaded conditions. The ship speed can reach up to 20.67 knots.

1. Introduction

Transportation of natural gas between islands can be done in various ways, such as through transmission pipes or by using sea transportation modes [1]. The transportation of natural gas using pipes has several limitations; namely, limited mobility requires a large investment; handling the compressor system is quite complicated, i.e., the further the supplied distance, the bigger compressor must be used; and the environmental safety management is quite difficult considering that the pressure in the pipeline is very high so that a little leak can be fatal to the environment [2,3,4]. Therefore, for cross-sea transportation with long distances, ships are chosen as the mode of transportation [5]. In its development, natural gas transportation using ships is divided into two broad lines, namely, transporting natural gas in the gas phase/compressed natural gas (CNG) and in the liquid phase/liquefied natural gas (LNG). The disadvantage of transporting in the gas phase is the need for pressure vessels that are able to withstand high pressures and large volumes, so in general, the transportation of natural gas through ships is done by the liquid/LNG phase, namely, by maintaining a charged temperature that causes the natural gas to be in the liquid phase [6,7,8,9,10]. LNG tankers are an option for transporting large amounts of natural gas for long distances [11]. At present, LNG tankers of various types and sizes are widely available in the world. Based on data from the International Gas Union (IGN), there were 373 active ships with capacities above 30,000 m3 in 2015, and as many as 28 ships are under construction [12]. The value of charter vessels dropping to $40,000/day in the third quarter of 2014 due to the decreased number of cross-Pacific–Atlantic shipments and the construction of large vessels in 2015 caused the LNG freight market share to decline [13]. Old ships that still use the inefficient steam turbine propulsion system must be able to compete with ships that use new propulsion systems that are far more efficient [14]. This condition encourages owners to build ships with more efficient propulsion systems. One of the factors that influence the level of efficiency of gas transportation using LNG tankers is the propulsion system used. Currently, LNG tankers in the world generally still use a steam turbine with boilers that use fuel from boil-off gas [15,16,17,18]. Several alternative propulsion systems have been developed by engineers to increase the efficiency value of the main engine driving LNG tankers, such as the dual-fuel diesel engine (DFDE) [19] and the combined cycle [20,21,22]. The majority of active LNG ships in the world currently use a steam turbine propulsion system with a low level of efficiency; therefore, today engineers continue to develop an efficient propulsion system at the range of the power required by LNG ships. Propulsion systems with diesel engines and ones with combined cycles have different dimensions due to the different equipment components are used to support the performance of the engines [16,23]. Large and heavy engines cause the ship to lose volume and weight that could otherwise be used to transport cargo. This can be circumvented by designing machines that also produce the right power but are smaller and lighter with an efficient arrangement of the engine room [23,24]. Combined cycle is an alternative propulsion system that can be applied to LNG tankers engine of power between 20 to 50 MW, by considering its overall efficiency. It can be seen that the combined cycle systems have higher total efficiency than other propulsion system engines. Currently, large-capacity LNG tankers require at least 25 MW for propulsion and auxiliary systems on board [25,26,27,28,29,30]. Therefore, further studies are needed for a marine combined-cycle gas steam turbine power plant. This paper has two main objectives, namely, designing the propulsion system in an LNG tanker with a combined-cycle propulsion system and calculating the performance of the combined-cycle system with an air-breathing derivative gas turbine, heat recovery steam generator (HRSG), and steam turbine as the LNG tanker’s main engine propulsion system. Based on these objectives, the formulated problem is to design combined gas–electric steam (COGES) propulsion systems on LNG tankers with engine power requirements related to ship resistance at a certain speed, and to determine the tools needed to support the performance of the propulsion system.

2. Methodology

2.1. Research Stages

The following is a design methodology that was carried out in this design:
1. Field Study
Conduct a search and study of LNG tankers that would be implemented using the combined-cycle gas steam turbine propulsion system for the power requirements of the propulsion system and the ship’s auxiliary systems.
2. Literature Study
Learn the basics of propulsion systems using a combined-cycle gas steam turbine and the tools needed to support the operation of the propulsion system.
3. Problem Statement
Identify the propulsion power requirements of the ship to be designed for the propulsion system. Determine the tools needed to support the performance of the propulsion system.
4. Design and Analysis
Design and calculate the design of the propulsion system with the parameters available from the ship to be applied to the propulsion system, to get the power in accordance with the needs of the ship. In this design study, the Maxsurf Resistance 20 software was used to obtain the resistance value using this method for each desired value of the ship’s speed. This software can estimate resistance and power requirements for ships designed using industry-standard prediction techniques. The data input required from this software is the shape of the hull of the ship. In this case, the main dimensions of the hull are shown in Table 1. Apart from determining the ship’s power requirements, the analysis of the thermodynamic calculations of the propulsion system was designed using the Cycle-Tempo 5.1 software. In simulations using the software, several parameters are needed to simulate a steam turbine, such as pressure, temperature, and mass flow rate of the steam, for the calculation of the isentropic efficiency of the steam turbine component is used based on relevant references.

2.2. Data Used

In this design study, some reference data needed to get the appropriate design of the system were as follows:
1. LNG Tanker
Table 1 shows the specification of the LNG tanker with a capacity of 125,000 m3 [31].
2. Ship Load Data
Data of the shipload were obtained from the operation report of the comparison ship, LNG Aquarius, as shown in Table 2 [32].
3. Shipping Conditions
The LNG tanker propulsion system in this study is designed for LNG shipping between Bontang, East Kalimantan to Japan. The assumption of the environmental conditions of the journey are shown in Table 3 [33]:

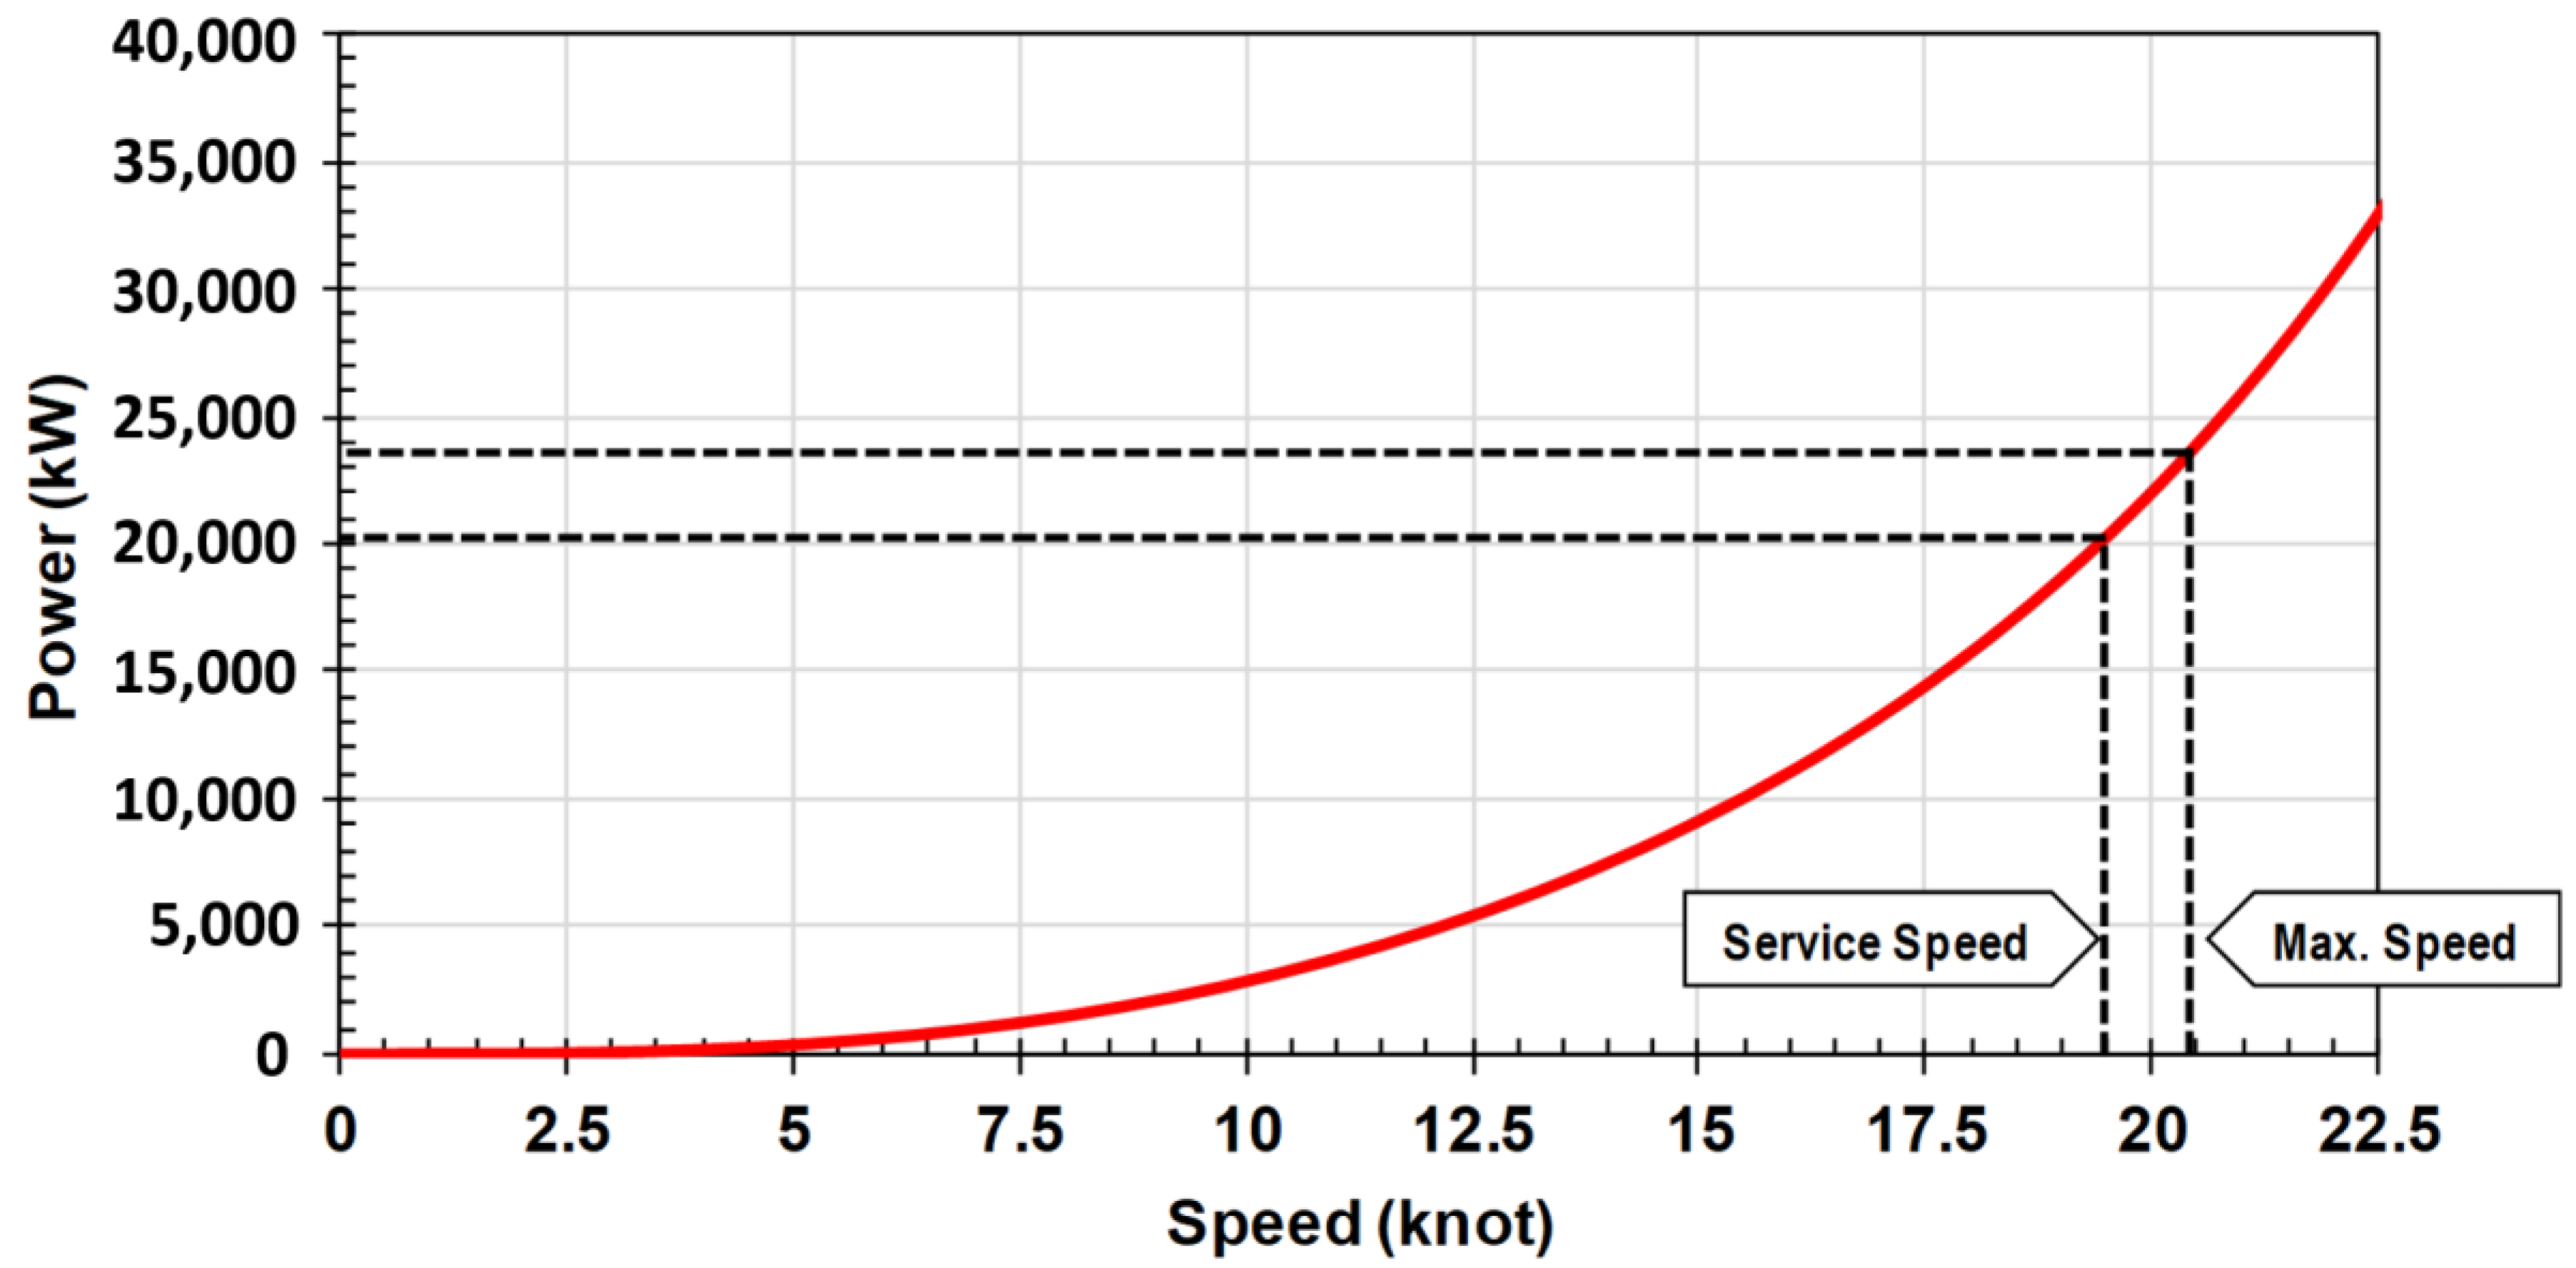
2.3. Calculation of Ship Resistance

In this design, we needed some data to get an appropriate design, including the amount of power needed by the ship to go at the required speed, so the calculation of the value of the obstacle for 125,000 m3 LNG tankers was needed. In this design study, the application of Maxsurf Resistance 20 software provided the steps to be followed for determining the value of the ship’s resistance [34]. Figure 1 shows a graph of the results of a resistance simulation using the Holtrop method with a speed range between 0 and 22.5 knots.

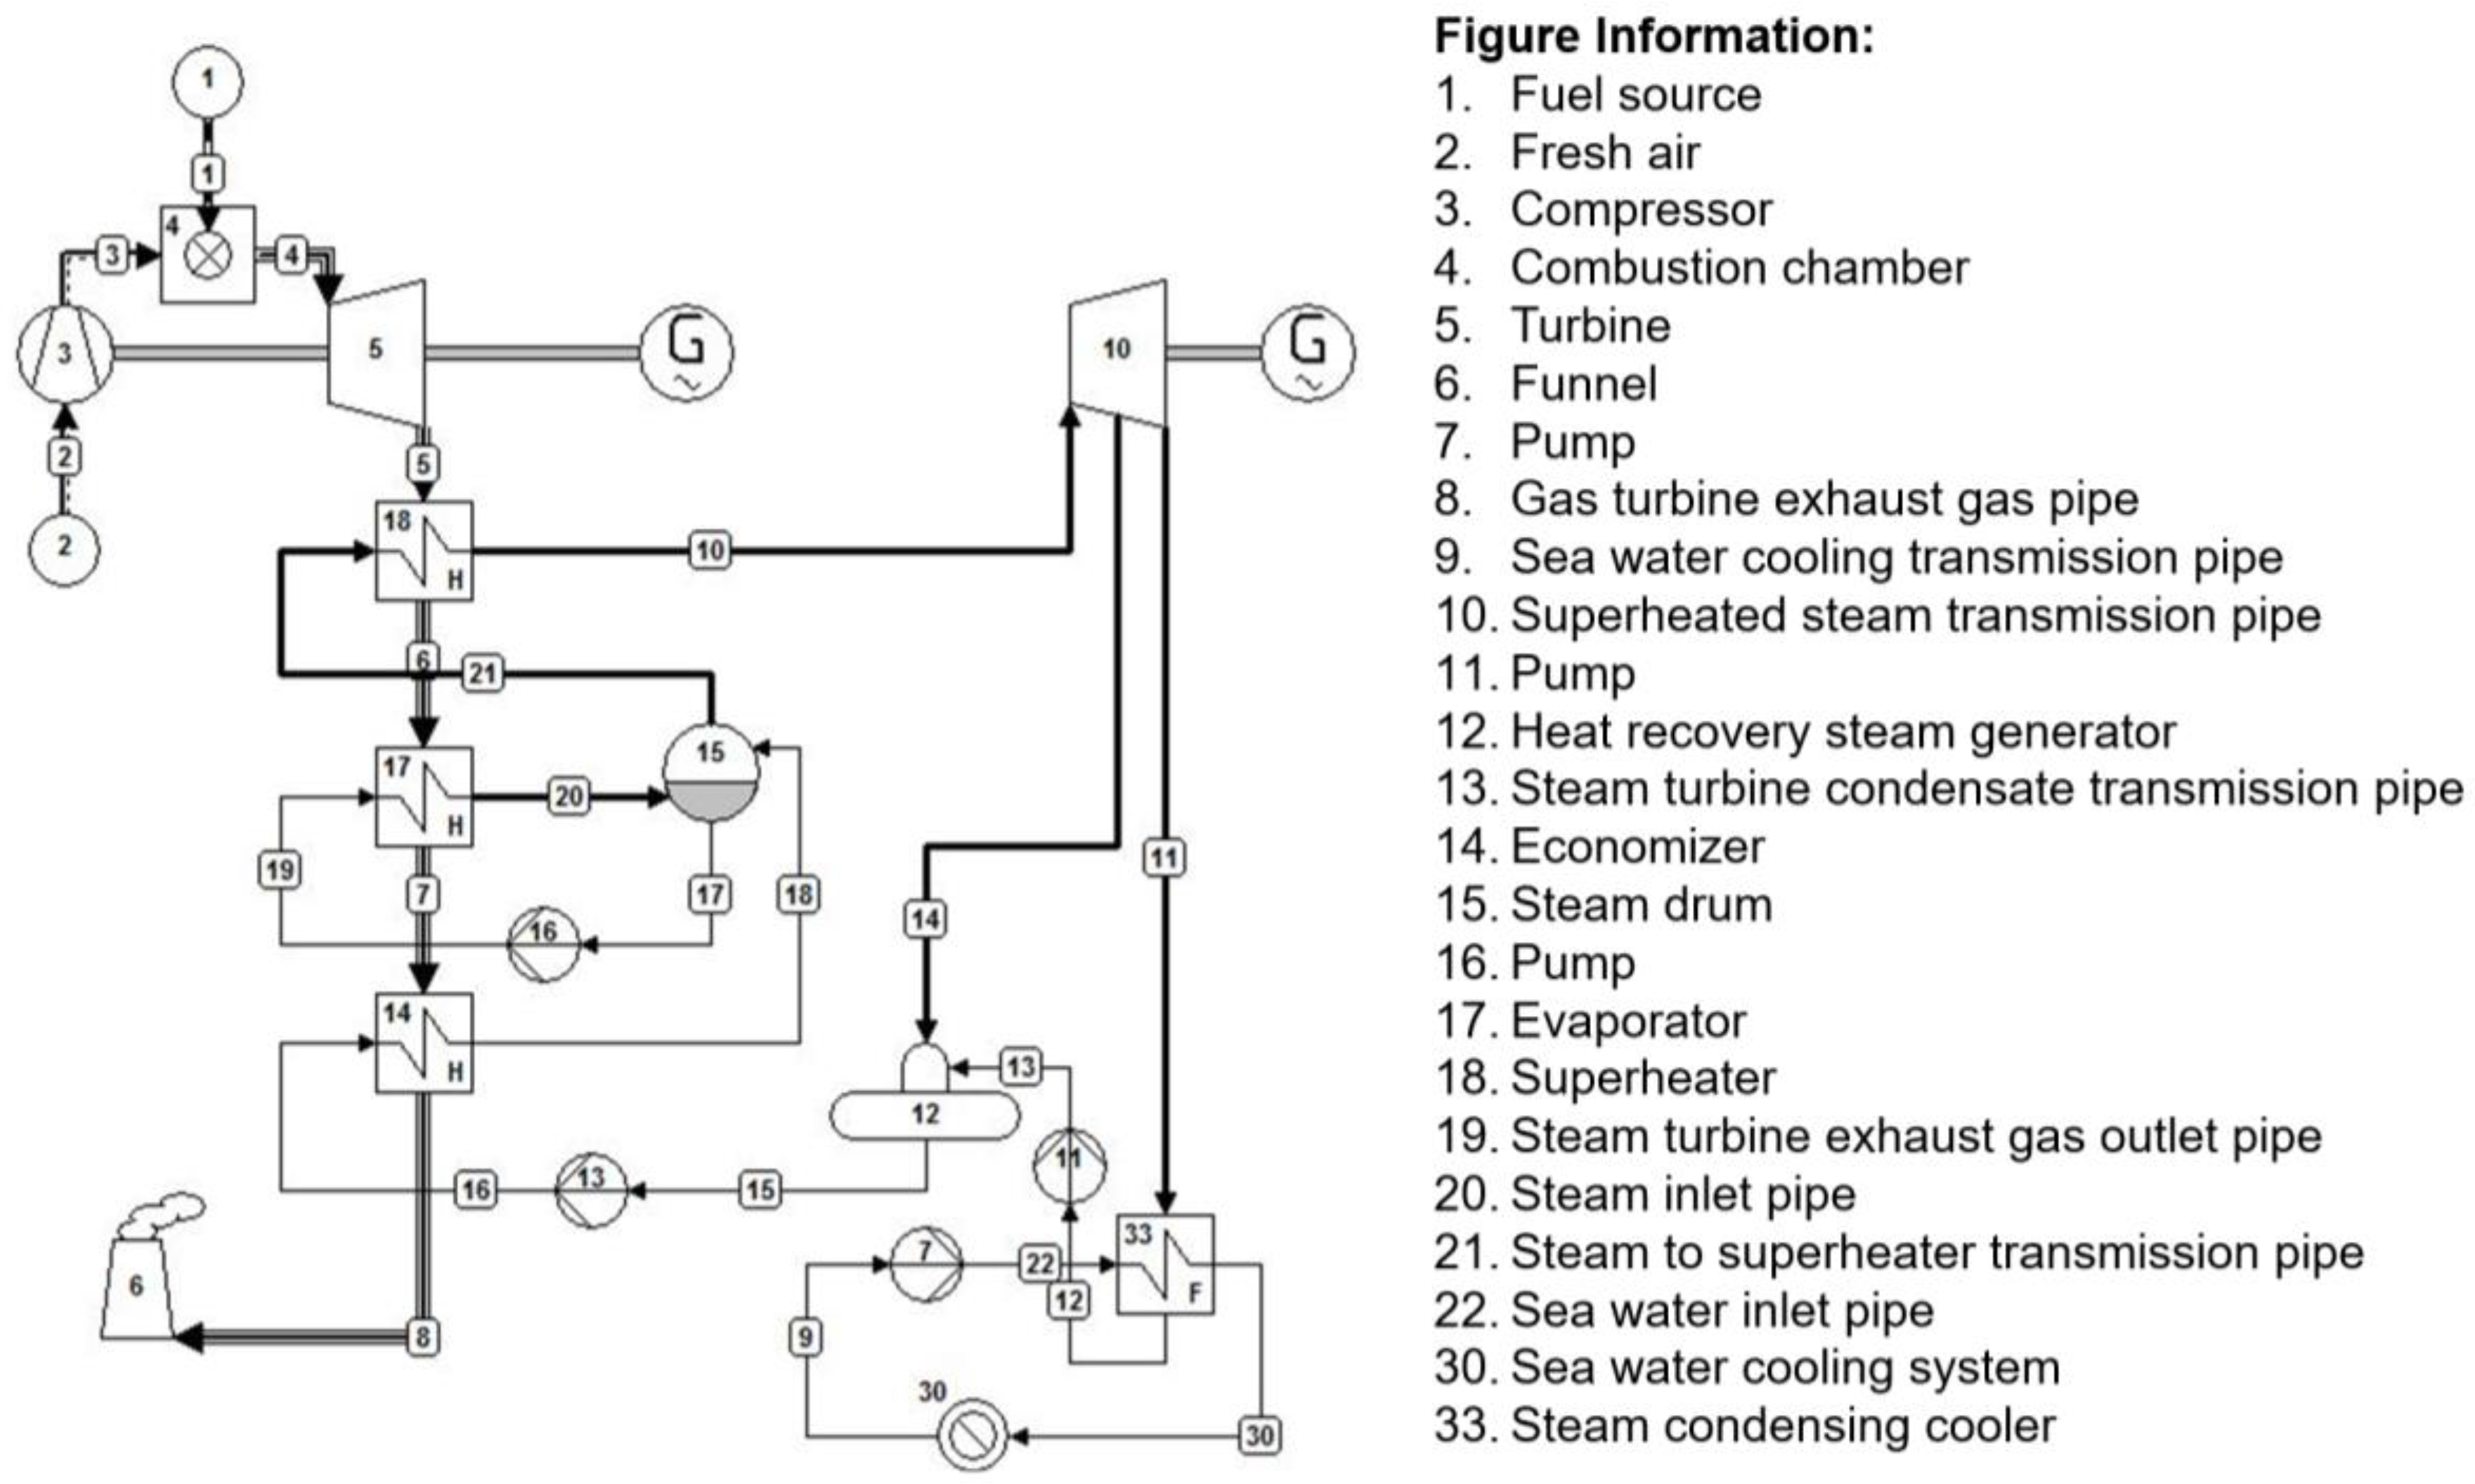
2.4. Design of Combined-Cycle Propulsion System

After getting the data resistance of the LNG tanker, which would be designed to be able to determine the amount of power for ship propulsion, the next step was to design a propulsion system to meet the power requirements of the ship. The design of the combined-cycle system was done using the Cycle-Tempo software so that each component of the designed system could be connected and in accordance with the desired results. Figure 2 presents a scheme of this propulsion system. The processes in the systems are shown in Figure 2 as well. The design of this system consisted of gas turbine components, which consisted of (3) compressor, (4) combustion chamber, and (5) turbine, using fuel sourced from (1) the fuel source. Then this component was directly connected by the shaft to rotate the electric generator.
The working fluid, after coming out of the steam turbine, was still in the saturated vapor phase (saturated steam). Then this fluid entered (33) the condenser, which then turned into saturated liquid phase. To change the phase of the working fluid, the condenser got the cooling medium from (30) the sea water pump. Then the water that had been used as a cooler was discharged into the environment. HRSG is a device that utilizes heat energy from gas turbine flue gas to be used as a source of steam turbine cycle energy. The working fluid was pumped after it exited the condenser and then entered (14) the economizer, where the working fluid temperature was increased. Then it was forwarded to (17) the evaporator where the working fluid phase was changed into saturated steam. Then the steam entered (18) the superheater where the saturated steam phase changed to superheated steam. After that the working fluid, i.e., superheated steam, entered the steam turbine to be converted into mechanical energy to turn the electric generator. After leaving the steam turbine, the working fluid returned to the condenser.
To be able to simulate the design of a combined-cycle propulsion system, several parameter values of the system components to be designed were needed, including:
1. Fuel
The fuel used was natural gas from boil-off cargo gas that was transported. The carried cargo was natural gas from a liquefaction plant in Bontang, East Kalimantan, whose composition and characteristics are shown in Table 4.
2. Gas Turbine
The basis of the selection of the gas turbine specifications used in this design study was the output power, based on the availability of gas turbine types on the market for the required power range. The appropriate gas turbine model was obtained as shown in Table 5. Data supporting the simulations in this design study used sources from a datasheet from the manufacturer, as well as data sourced from research results. In operation, the gas turbine must be within the operating range of the gas turbine to prevent the condition of chocking and surging. Therefore, in this simulation, the gas turbine operation was adjusted to the performance characteristic map issued by the manufacturer.
3. Steam Turbine
In simulations using the Cycle-Tempo software, several parameters were needed to do a steam turbine simulation, such as pressure, temperature, and mass vapor flow rate, for the calculation of the isentropic efficiency of the steam turbine component used based on the method set by general electric vapor pressure, which was chosen at 25 bar based on the recommendations of the results of an optimization study conducted by Følgesvold [37,38]. The specifications of the steam turbine used were an inlet vapor pressure of 25 bar and isentropic efficiency in the range of 0.8–0.88%.
4. HRSG
The once-through steam generator (OTSG) HRSG was chosen as the most suitable choice for this simulation. This simulation included three main components of the HRSG, namely, superheater, evaporator, and economizer. In its operating conditions, the economizer is useful as a preheater to raise the temperature of the working fluid into the saturated liquid phase; then the working fluid enters the evaporator, then exits the phase change into saturated steam, then enters the superheater so it enters the boiler in the superheated steam phase. The parameters used in the simulation were the superheater temperature (Δ Thi) was 30 °C and the evaporator temperature (Δ Tpinchpoint) was 25 °C.
An upper terminal difference temperature of 30 °C and a pinch point of 25 °C were chosen to provide enough energy to move the steam turbine cycle. According to Saravanamuttoo, this difference in temperature values was chosen to maintain the size and weight of the HRSG [39].
5. Supporting Parameters
Other supporting data used in the simulation were the isentropic pump efficiency used was 85%, the deaerator pressure (Pin) was 2 bar, the pressure drop in the condenser was 0.1 bar, and the mechanical efficiency in the generator was 97.5%.

2.5. The Equation Used

To be able to find out the appropriateness of the calculations using the Cycle-Tempo software with manual calculations, a manual calculation was made to load the system at maximum (100%). The calculation of T2 and T3 under isentropic conditions in gas turbines is as follows:
T 2 T 1 = ( P 2 P 1 ) k 1 k
where T, P, and k are the temperature, pressure, and heat capacity ratio of the gas, respectively, and subscripts 1 and 2 denote the state before and after the isentropic compression process, respectively. The equations for the calculation of air mass flow rate (mair) and processes (3–4), are the following:
Q i n = m f u e l × L H V
Q i n = m a i r + f u e l h 3 m a i r h 2
where mfiel and LHV are the mass flow rate and lower heating value of the fuel, respectively, whereas mair+fuel, mair, h3, and h2 are the mass flow rate of the air and fuel mixture, mass flow rate of the air, specific enthalpy of the air after the isobaric combustion process, and specific enthalpy of the air before the combustion, respectively. The values for enthalpies h2 and h3 were determined by interpolation of the relevance values in the table of water properties. The actual work of a gas turbine is:
W G a s   T u r b i n e = W S t e a m   T u r b i n e W C o m p r e s s o r
where WGas Turbine and WSteam Turbine are the work output of the gas turbine and steam turbine, respectively, and WCompressor is the compressor work. The work of a steam turbine is:
W S t e a m   T u r b i n e = m   ( h 4 h 3 ) v Δ P
where m, h4, h3, v, and ΔP are the mass flow rate of the working fluid, fluid enthalpy before entering the steam turbine, fluid enthalpy after exiting the turbine, specific volume of the working fluid, and pressure drop before and after the fluid enters the turbine, respectively. Looking for the value of the mass flow rate of the working fluid in the vapor cycle, the heating value (Qin) was obtained from the heat recovery steam generator (HRSG), where this equation applied:
Q E x h a u s t   g a s = Q i n
m E x h a u s t   g a s c p Δ T = m f l u i d ( h 4 h 3 )
where QExhaust gas, mExhaust gas, cp, and ΔT are the heat output, mass flow rate, isobaric specific heat, and temperature difference of the exhaust gas from the gas turbine, respectively, whereas Qin, mfluid, h4, and h3 are the heat input from the exhaust gas, mass flow rate, and specific enthalpies before and after the heating of the working fluid. The h4 and h3 values were obtained from the interpolation of the relevance values in the properties table for saturated water and superheated steam. Pump work calculation used the following equation:
W p u m p s = v Δ P η
where Wpump and η are the work output and efficiency of the pump, respectively. The recommended pressure was 25 bar or 2500 kPa. Based on the literature, the η (efficiency) of the pump was 87.5%. Then the total work of the Rankine cycle is:
W R a n k i n e = m f l u i d ( 3460 2680 ) W p u m p s
Therefore, we get the total system efficiency as:
η t o t a l =   T o t a l   P o w e r   ( k W ) m f u e l   ( k g s ) ×   L H V ( k J k g )
There were result differences between the manual calculations and the calculations using the Cycle-Tempo software due to the less accuracy in manual calculations. The plotted values of the fluid properties, i.e., the enthalpy, specific heat capacities cp and cv, were determined by interpolation in manual calculation whereas more accurate digital calculations were performed in the application software. Therefore, a slight difference in the values of the system power and system efficiency under the maximum loading conditions which result the total efficiency of the systems using empirical equations by manual calculation is 52.7%, and based on the simulation software is 48.49%.

3. Results and Discussions

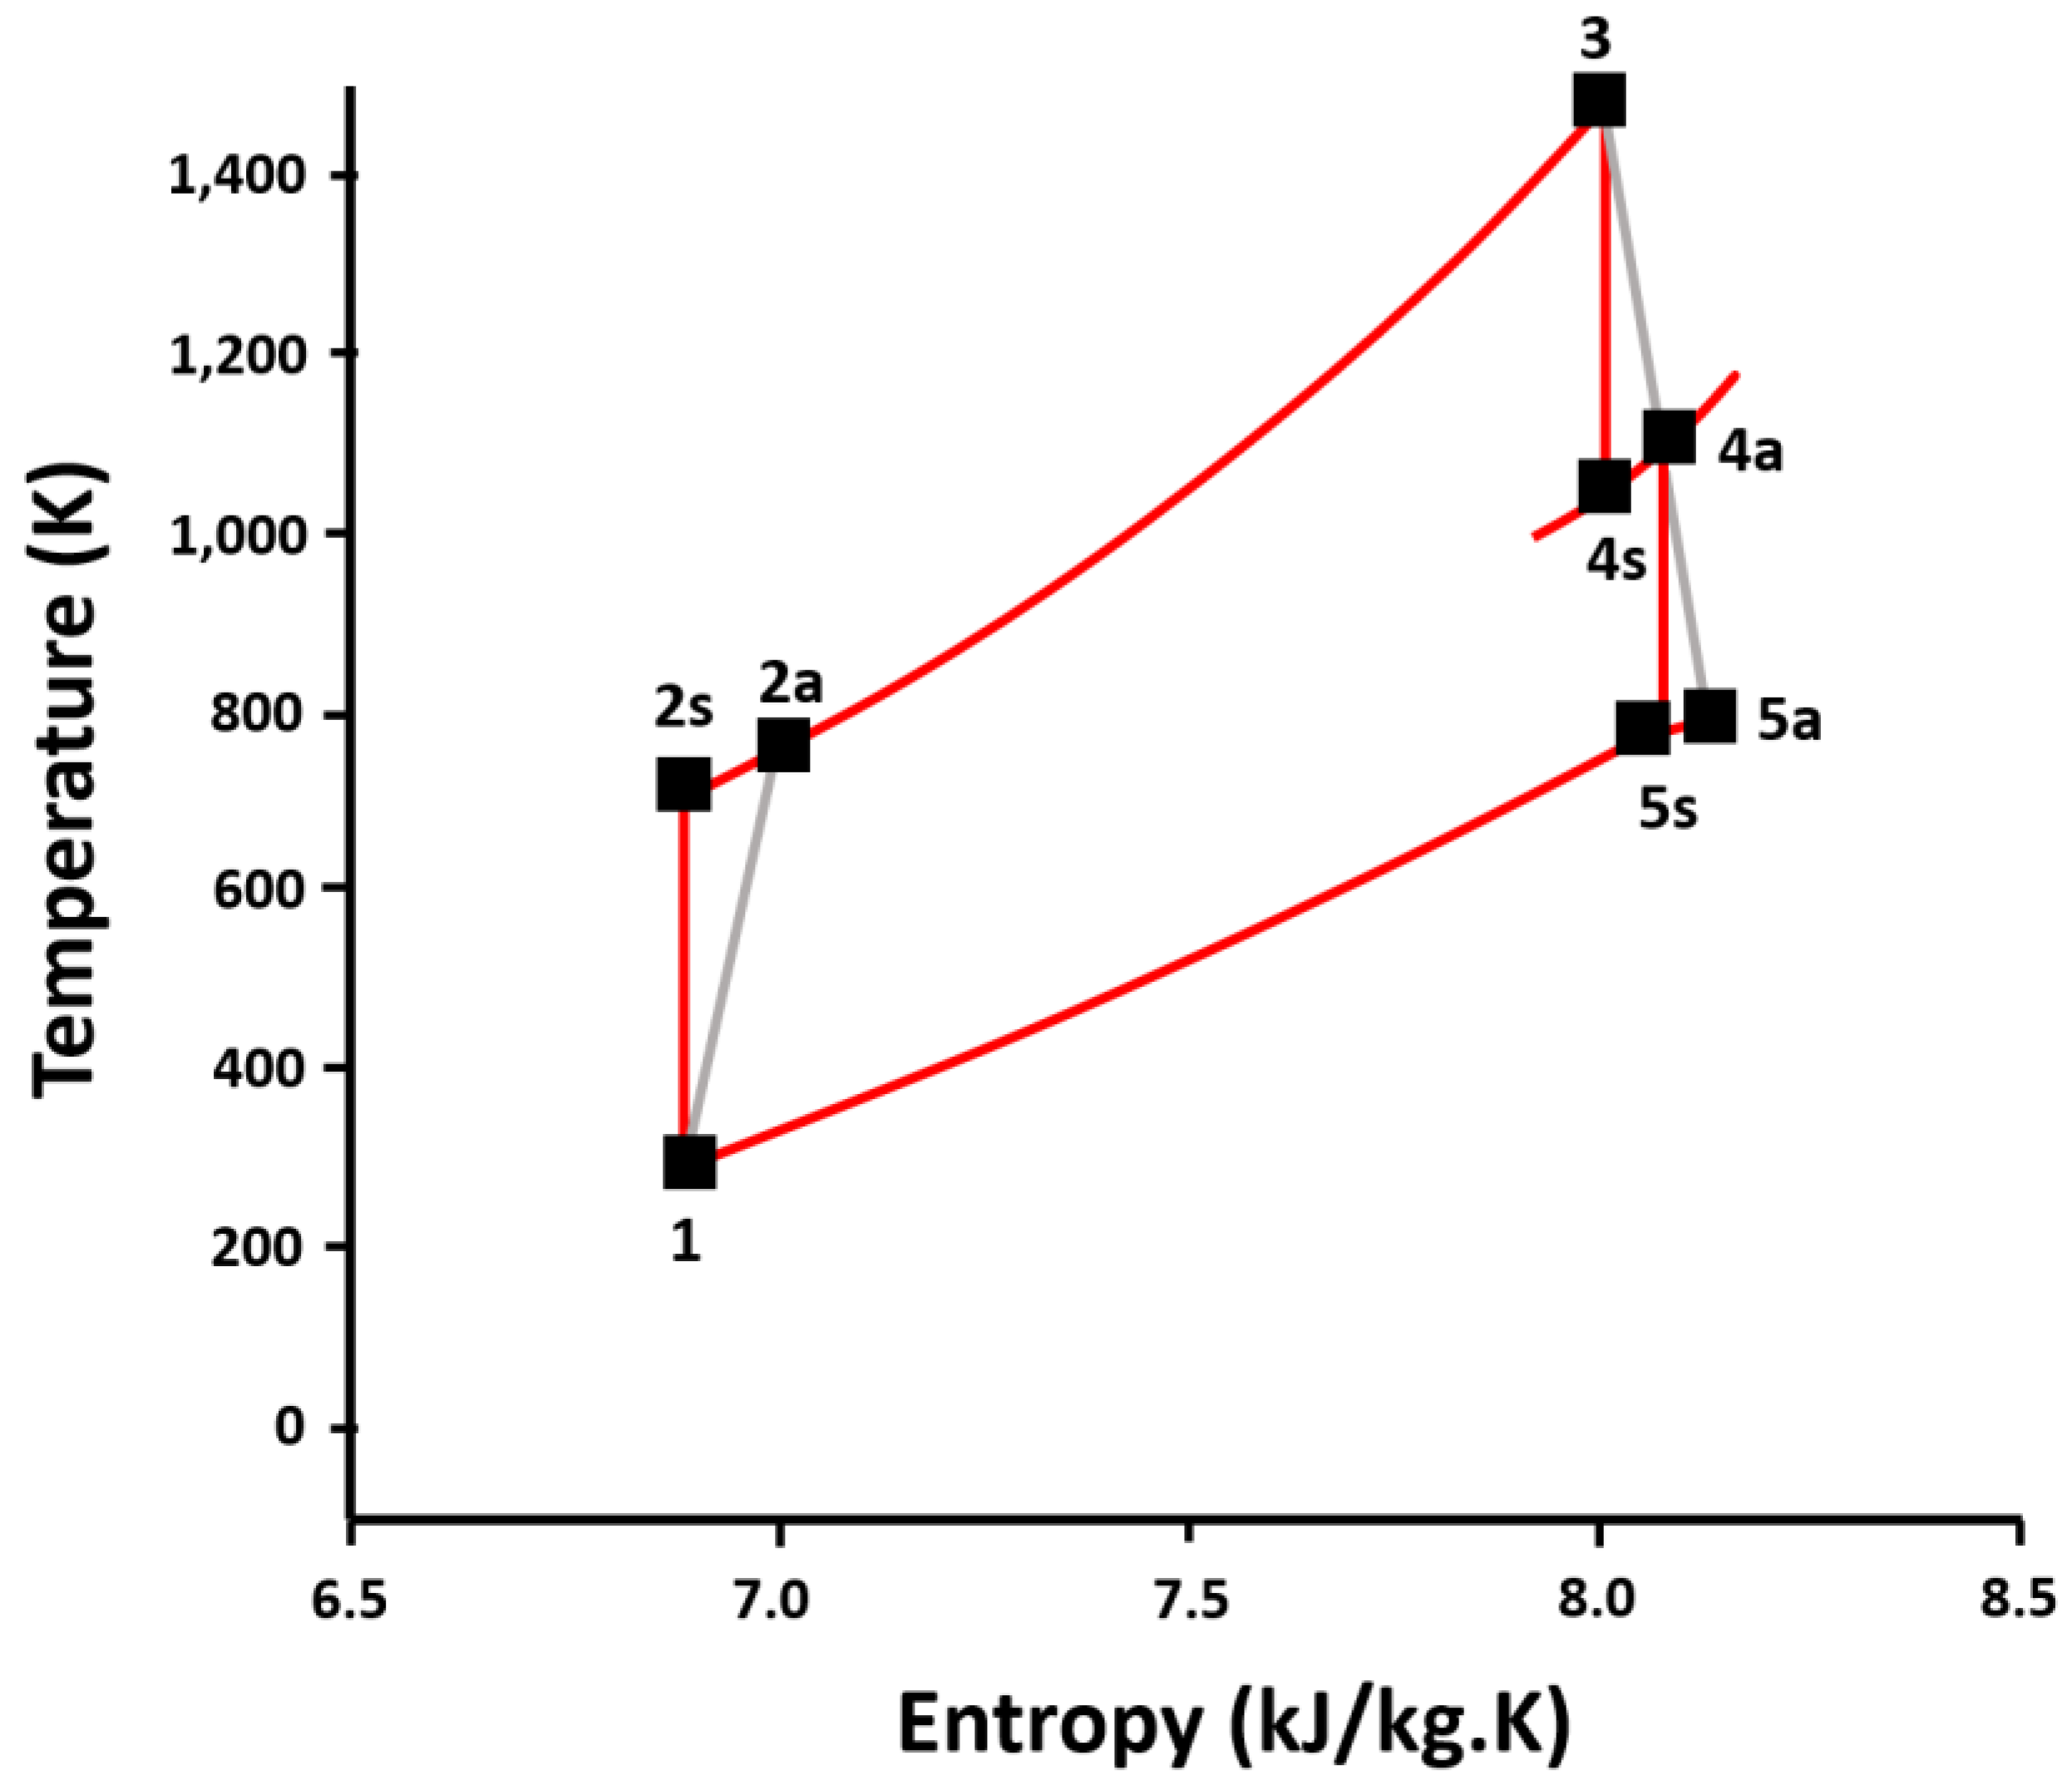
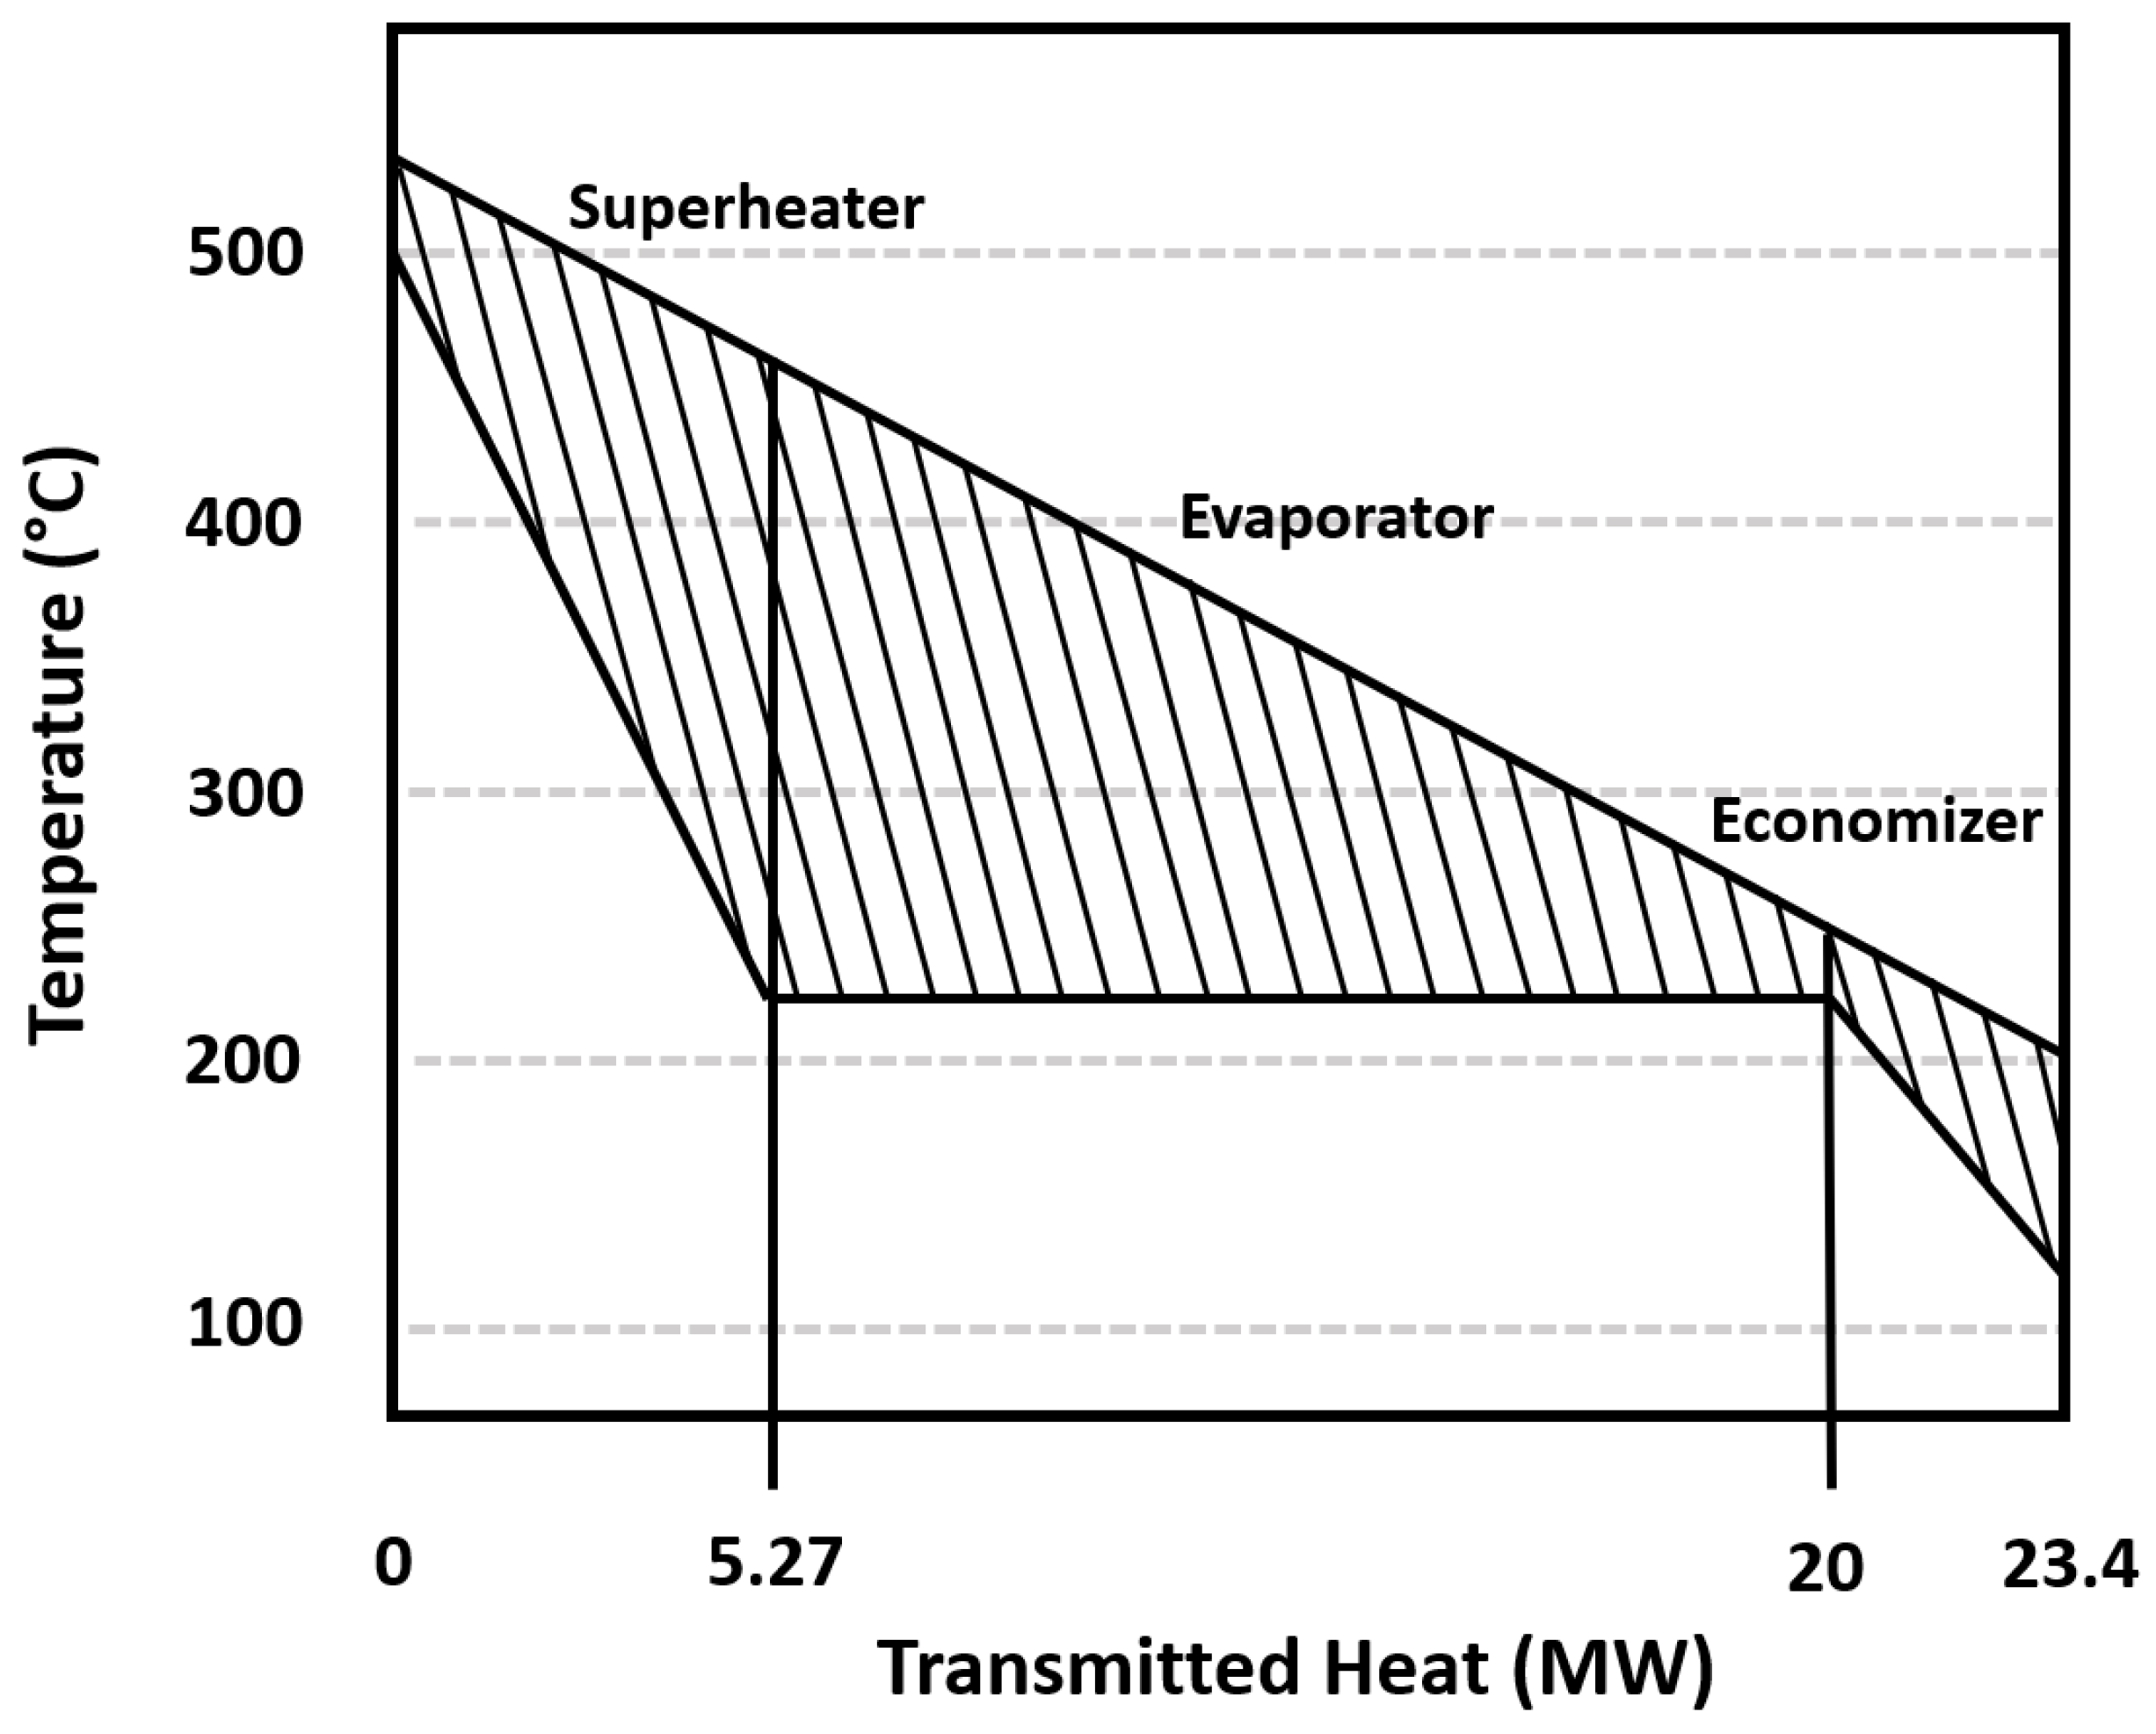
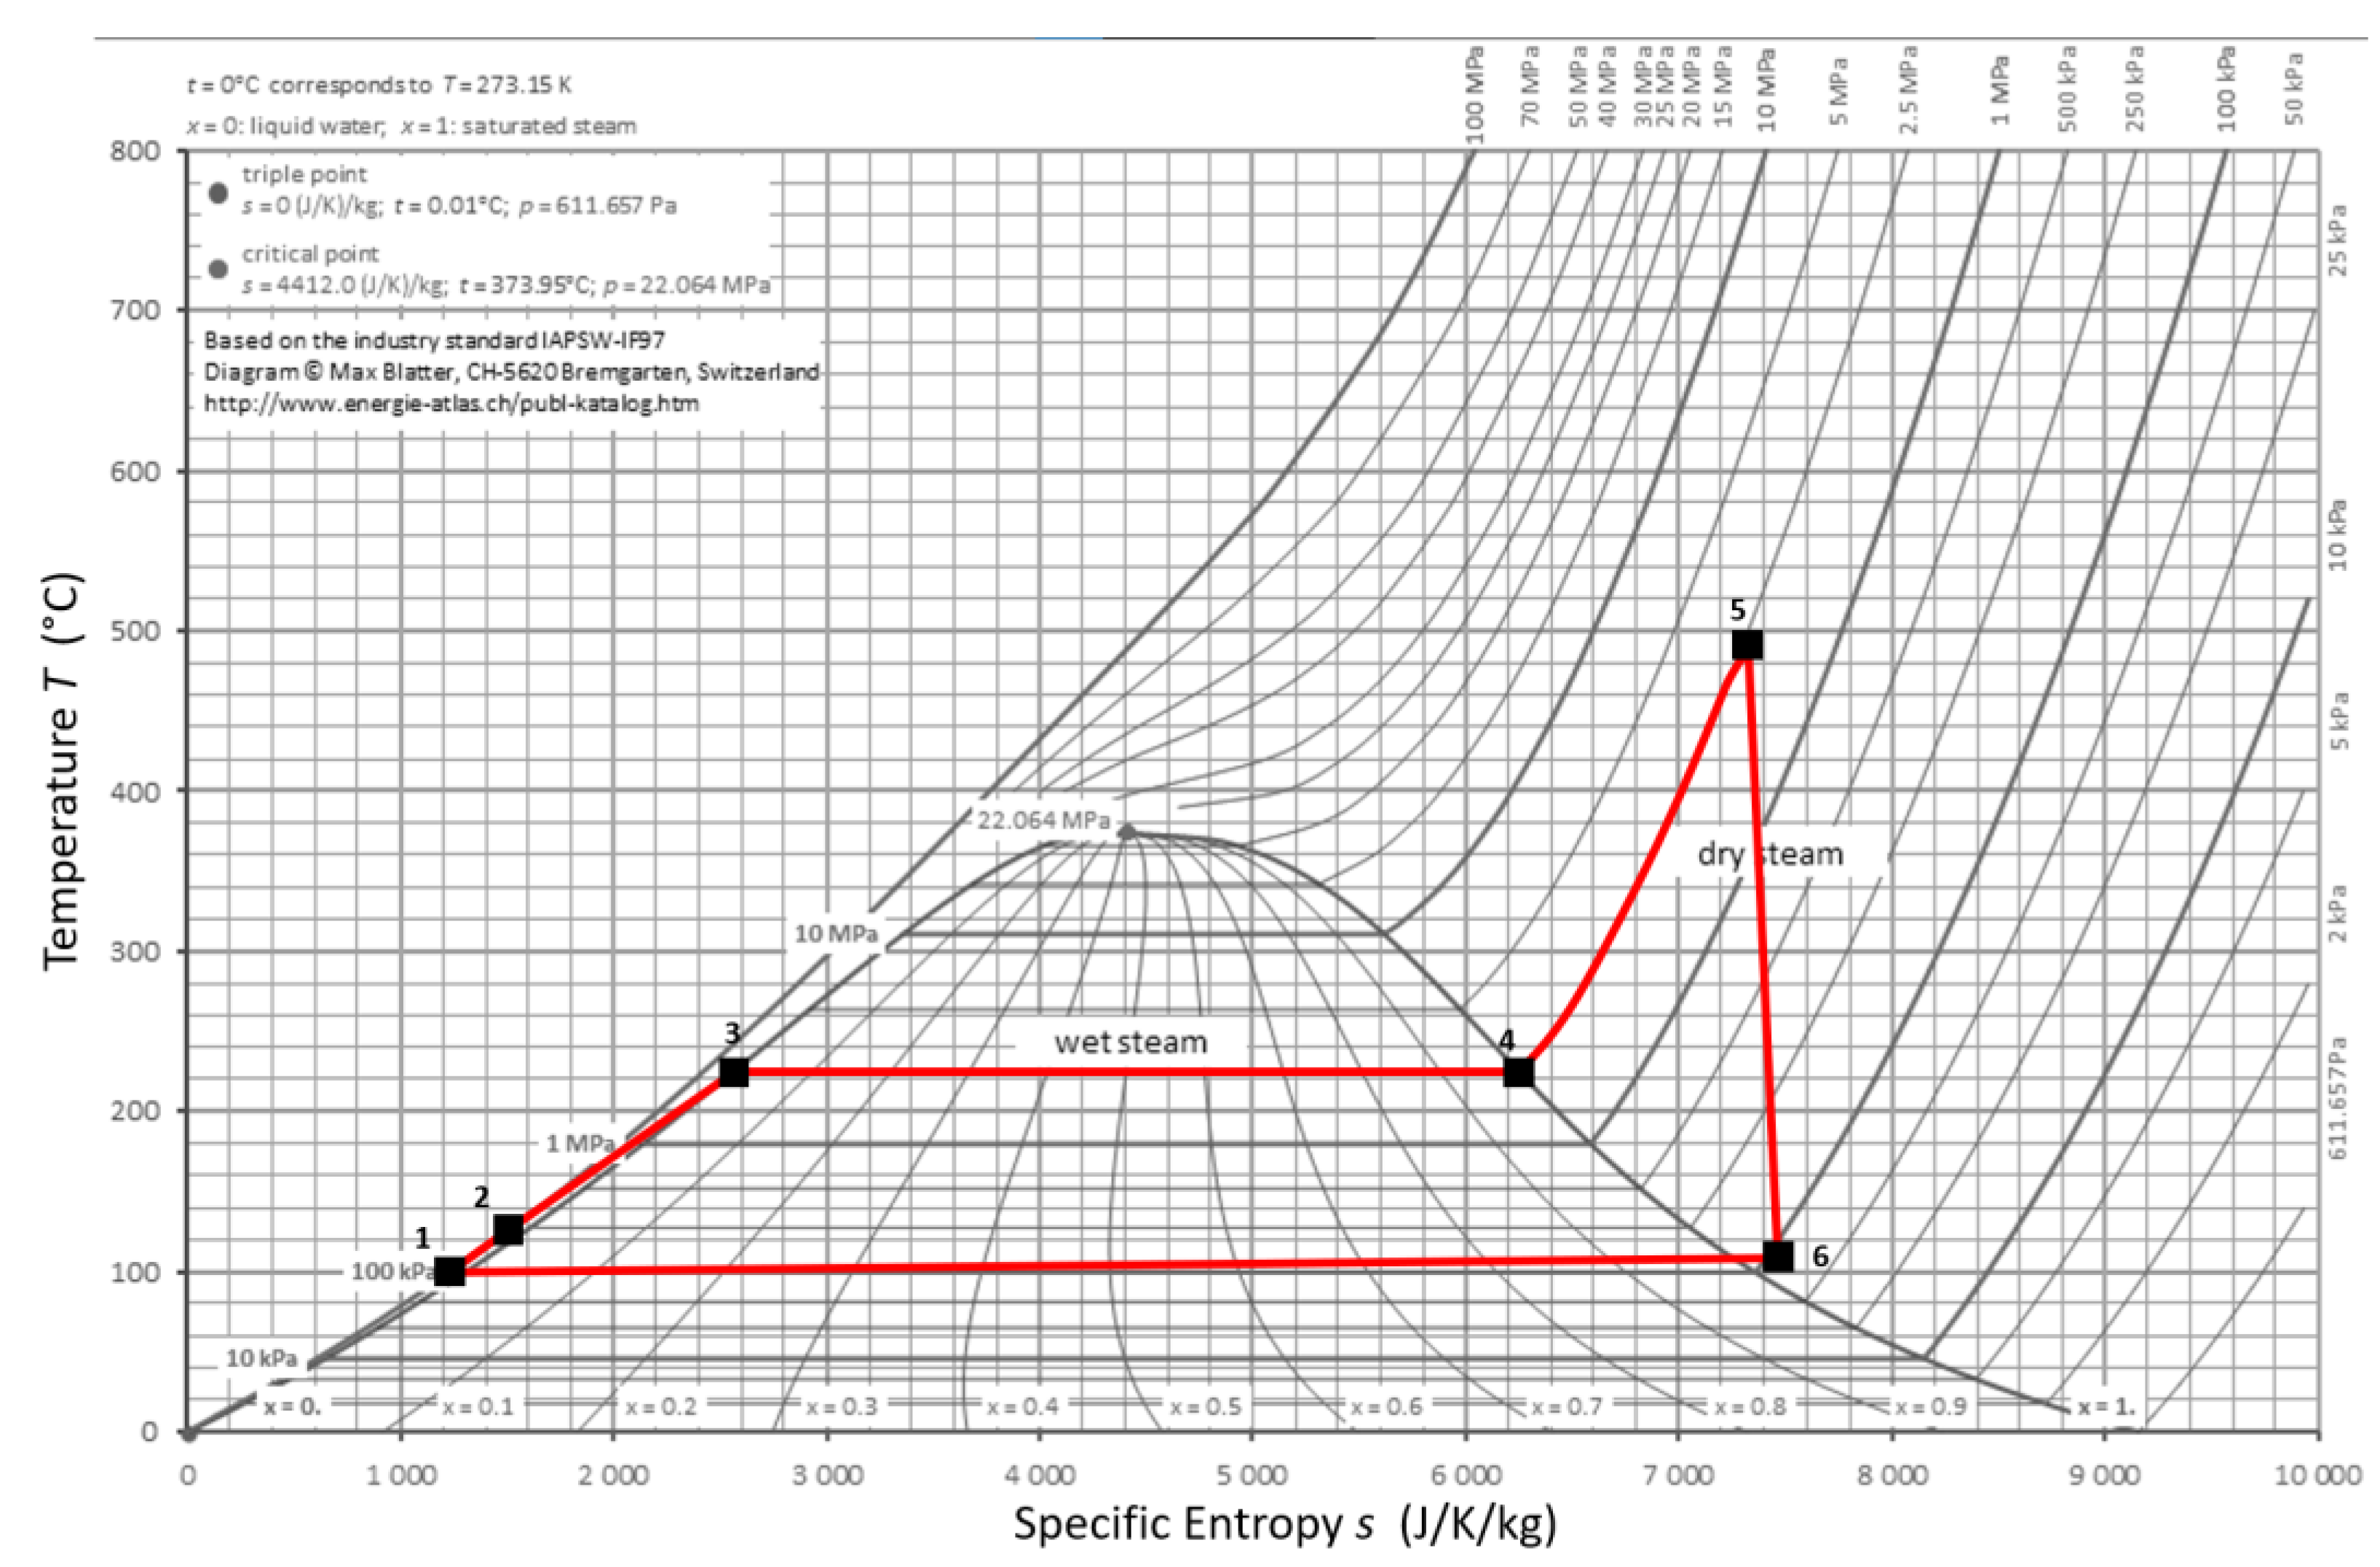
3.1. Thermodynamic Cycle Analysis

Figure 3 is a T-s diagram of the actual gas turbine cycle with a dual shaft configuration. Point 1 is the environmental condition. Actual compressor work is illustrated by 1–2a. Then actual work of the gas turbine generator is illustrated by line 3–4a, and the work of the power turbine is represented by points 4a–5a. The temperature of this cycle at the time of maximum loading (100% load) was 1215.87 °C, while the inlet air temperature was 27 °C. Heat discharged Qout, i.e., at point 5a–1 in the graph of Figure 3, was then used for the next cycle below (bottoming cycle) as the heat input in the HRSG unit.
In Figure 4 can be seen the Q-T diagram for the heat recovery steam generator (HRSG) at maximum loading. The inlet temperature of the working fluid was 120 °C, while the exhaust gas temperature of the gas turbine was 530 °C. The upper terminal difference was 30 °C, and the value of the pinch point temperature was 25 °C. The exhaust gas was released into the environment through a stack at a temperature of 198 °C.
In this design power generation cycle, as can be seen in Figure 5, the incoming heat (Qin) was heat taken from the gas turbine exhaust gas. Point 1–2 is the work of the pump (feed water pump). Then the water was pumped into the HRSG system. Point 2–3 is an economizer component that acts as a preheater. Water increased in temperature but was still in the saturated liquid phase. Then point 3–4 is the heat transfer process in an evaporator component. Here, the working fluid changed its phase into saturated steam. Then point 4–5 is a superheater. This system worked at a pressure of 25 bar. Point 5–6 is the un-isentropic expansion or work of the steam turbine. The inlet temperature in the steam turbine was 500 °C at the maximum loading of the gas turbine.

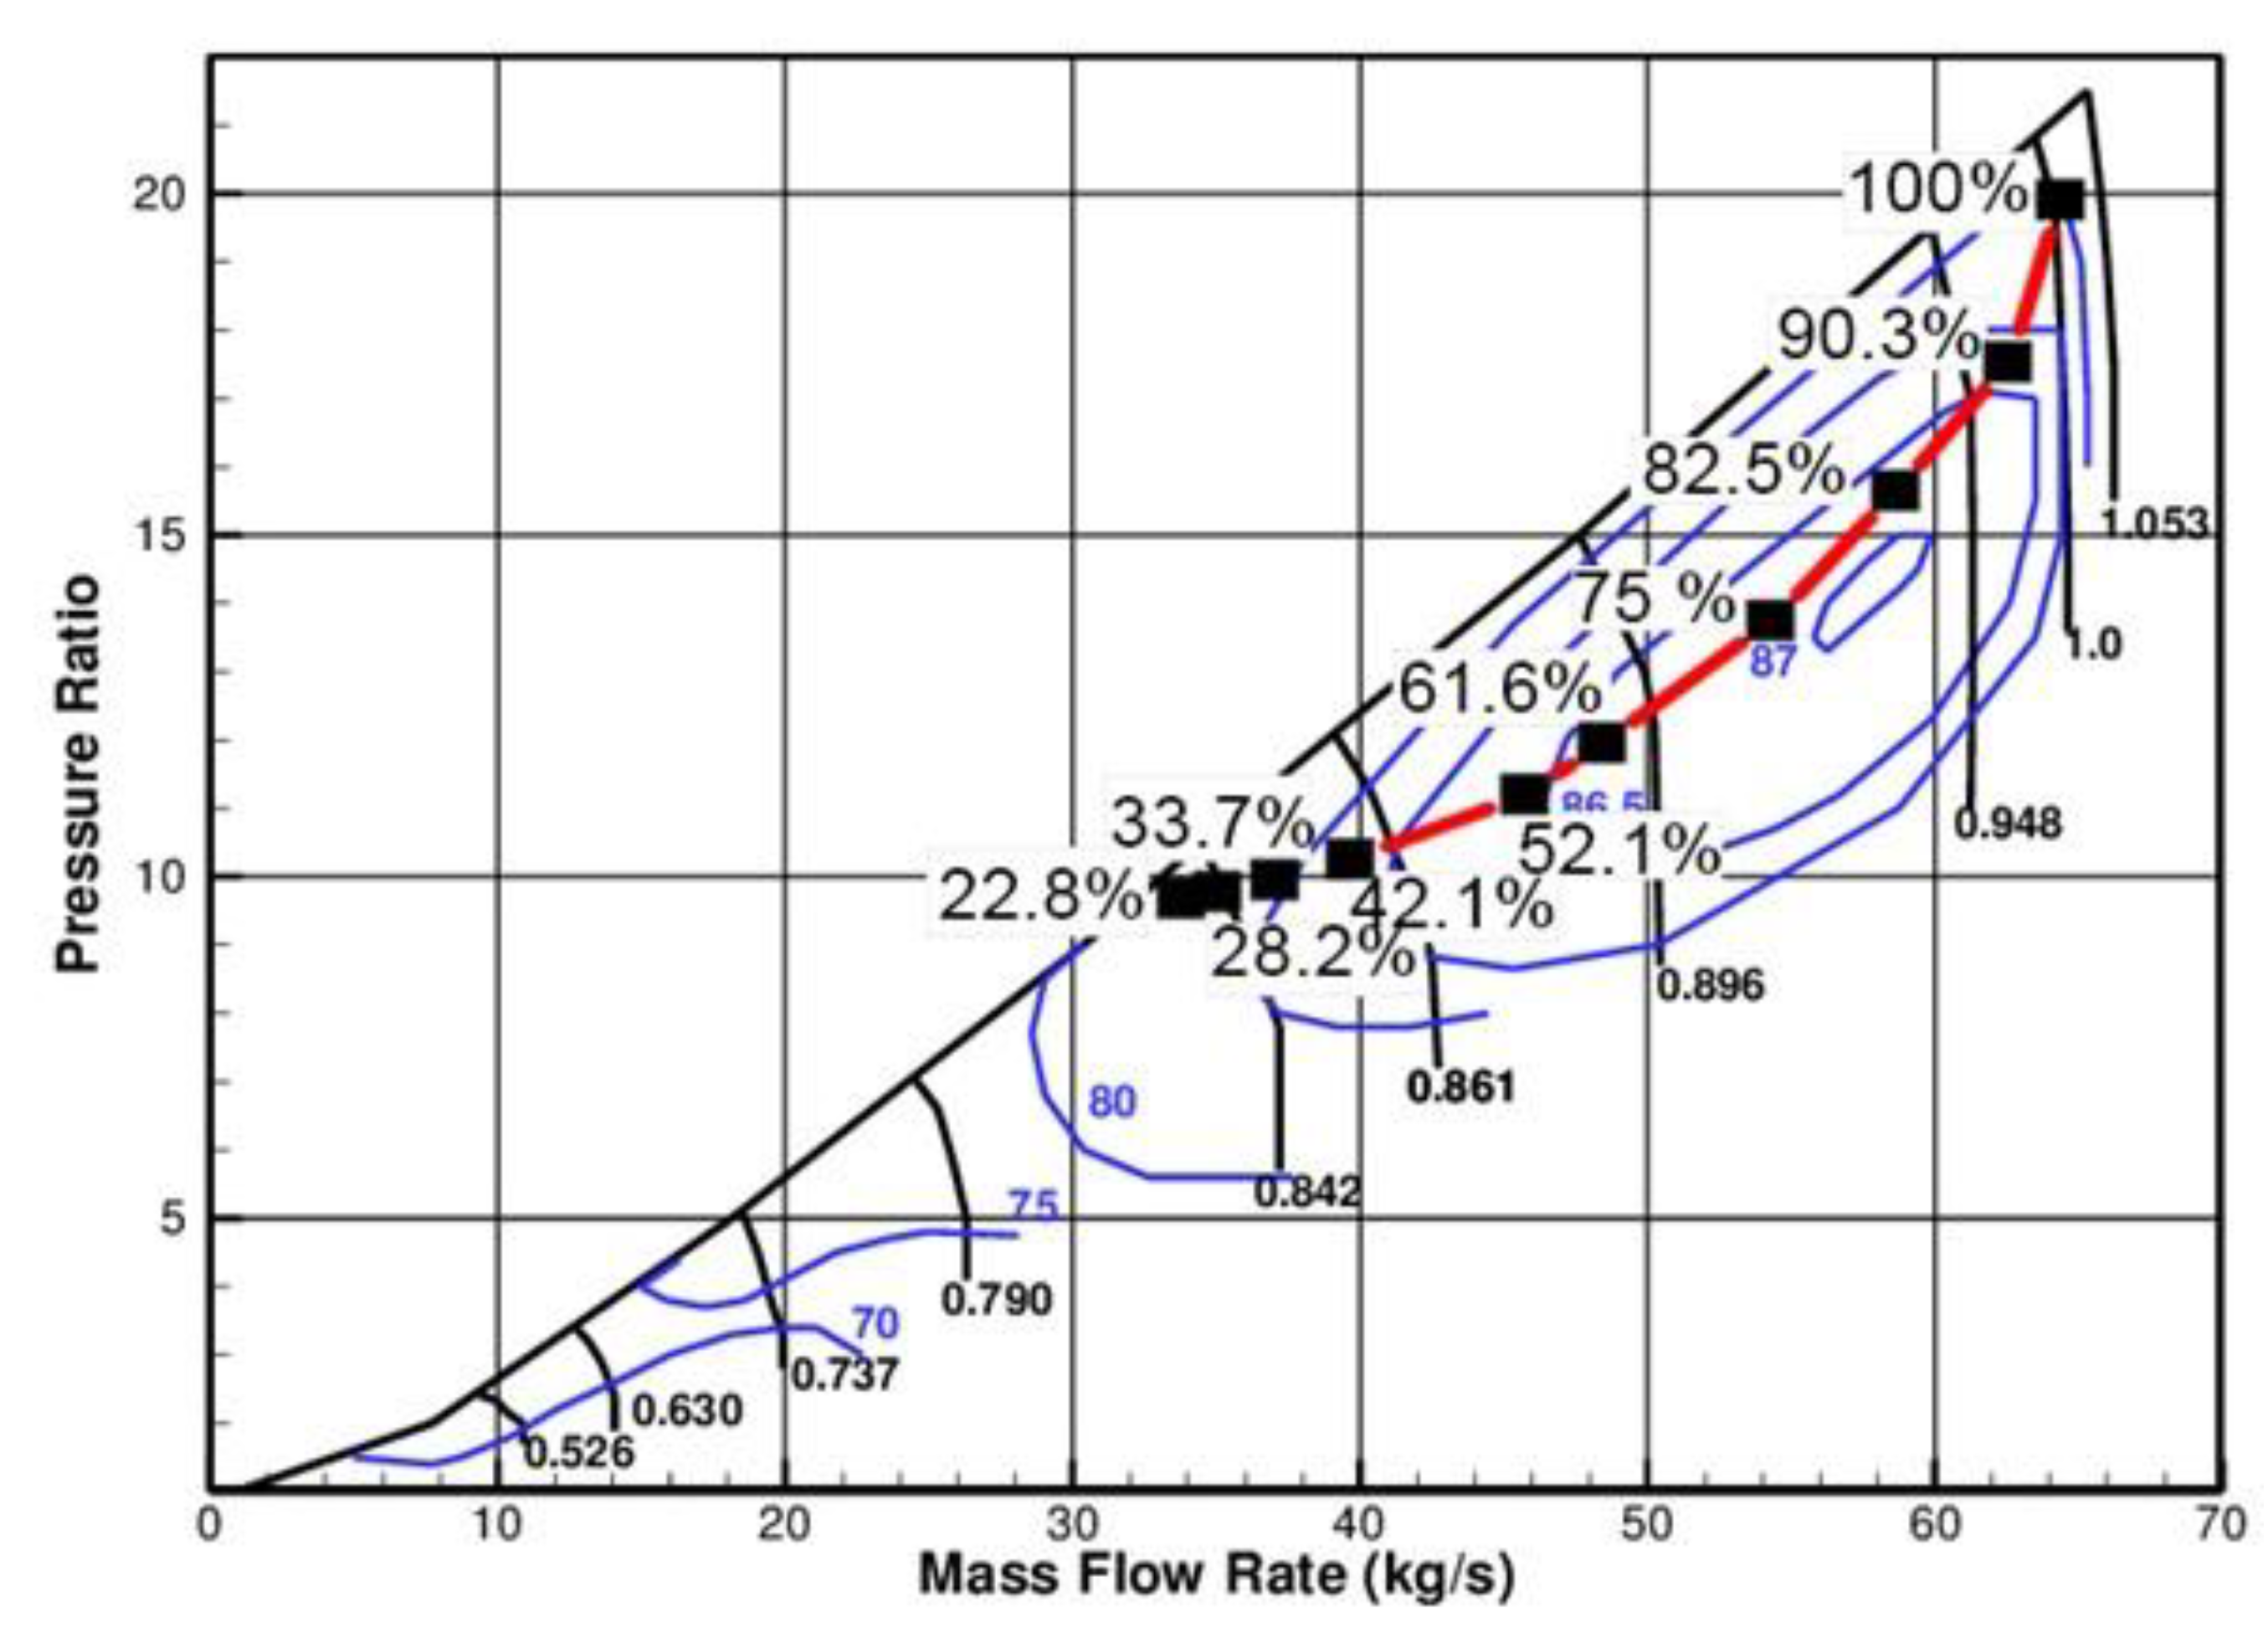
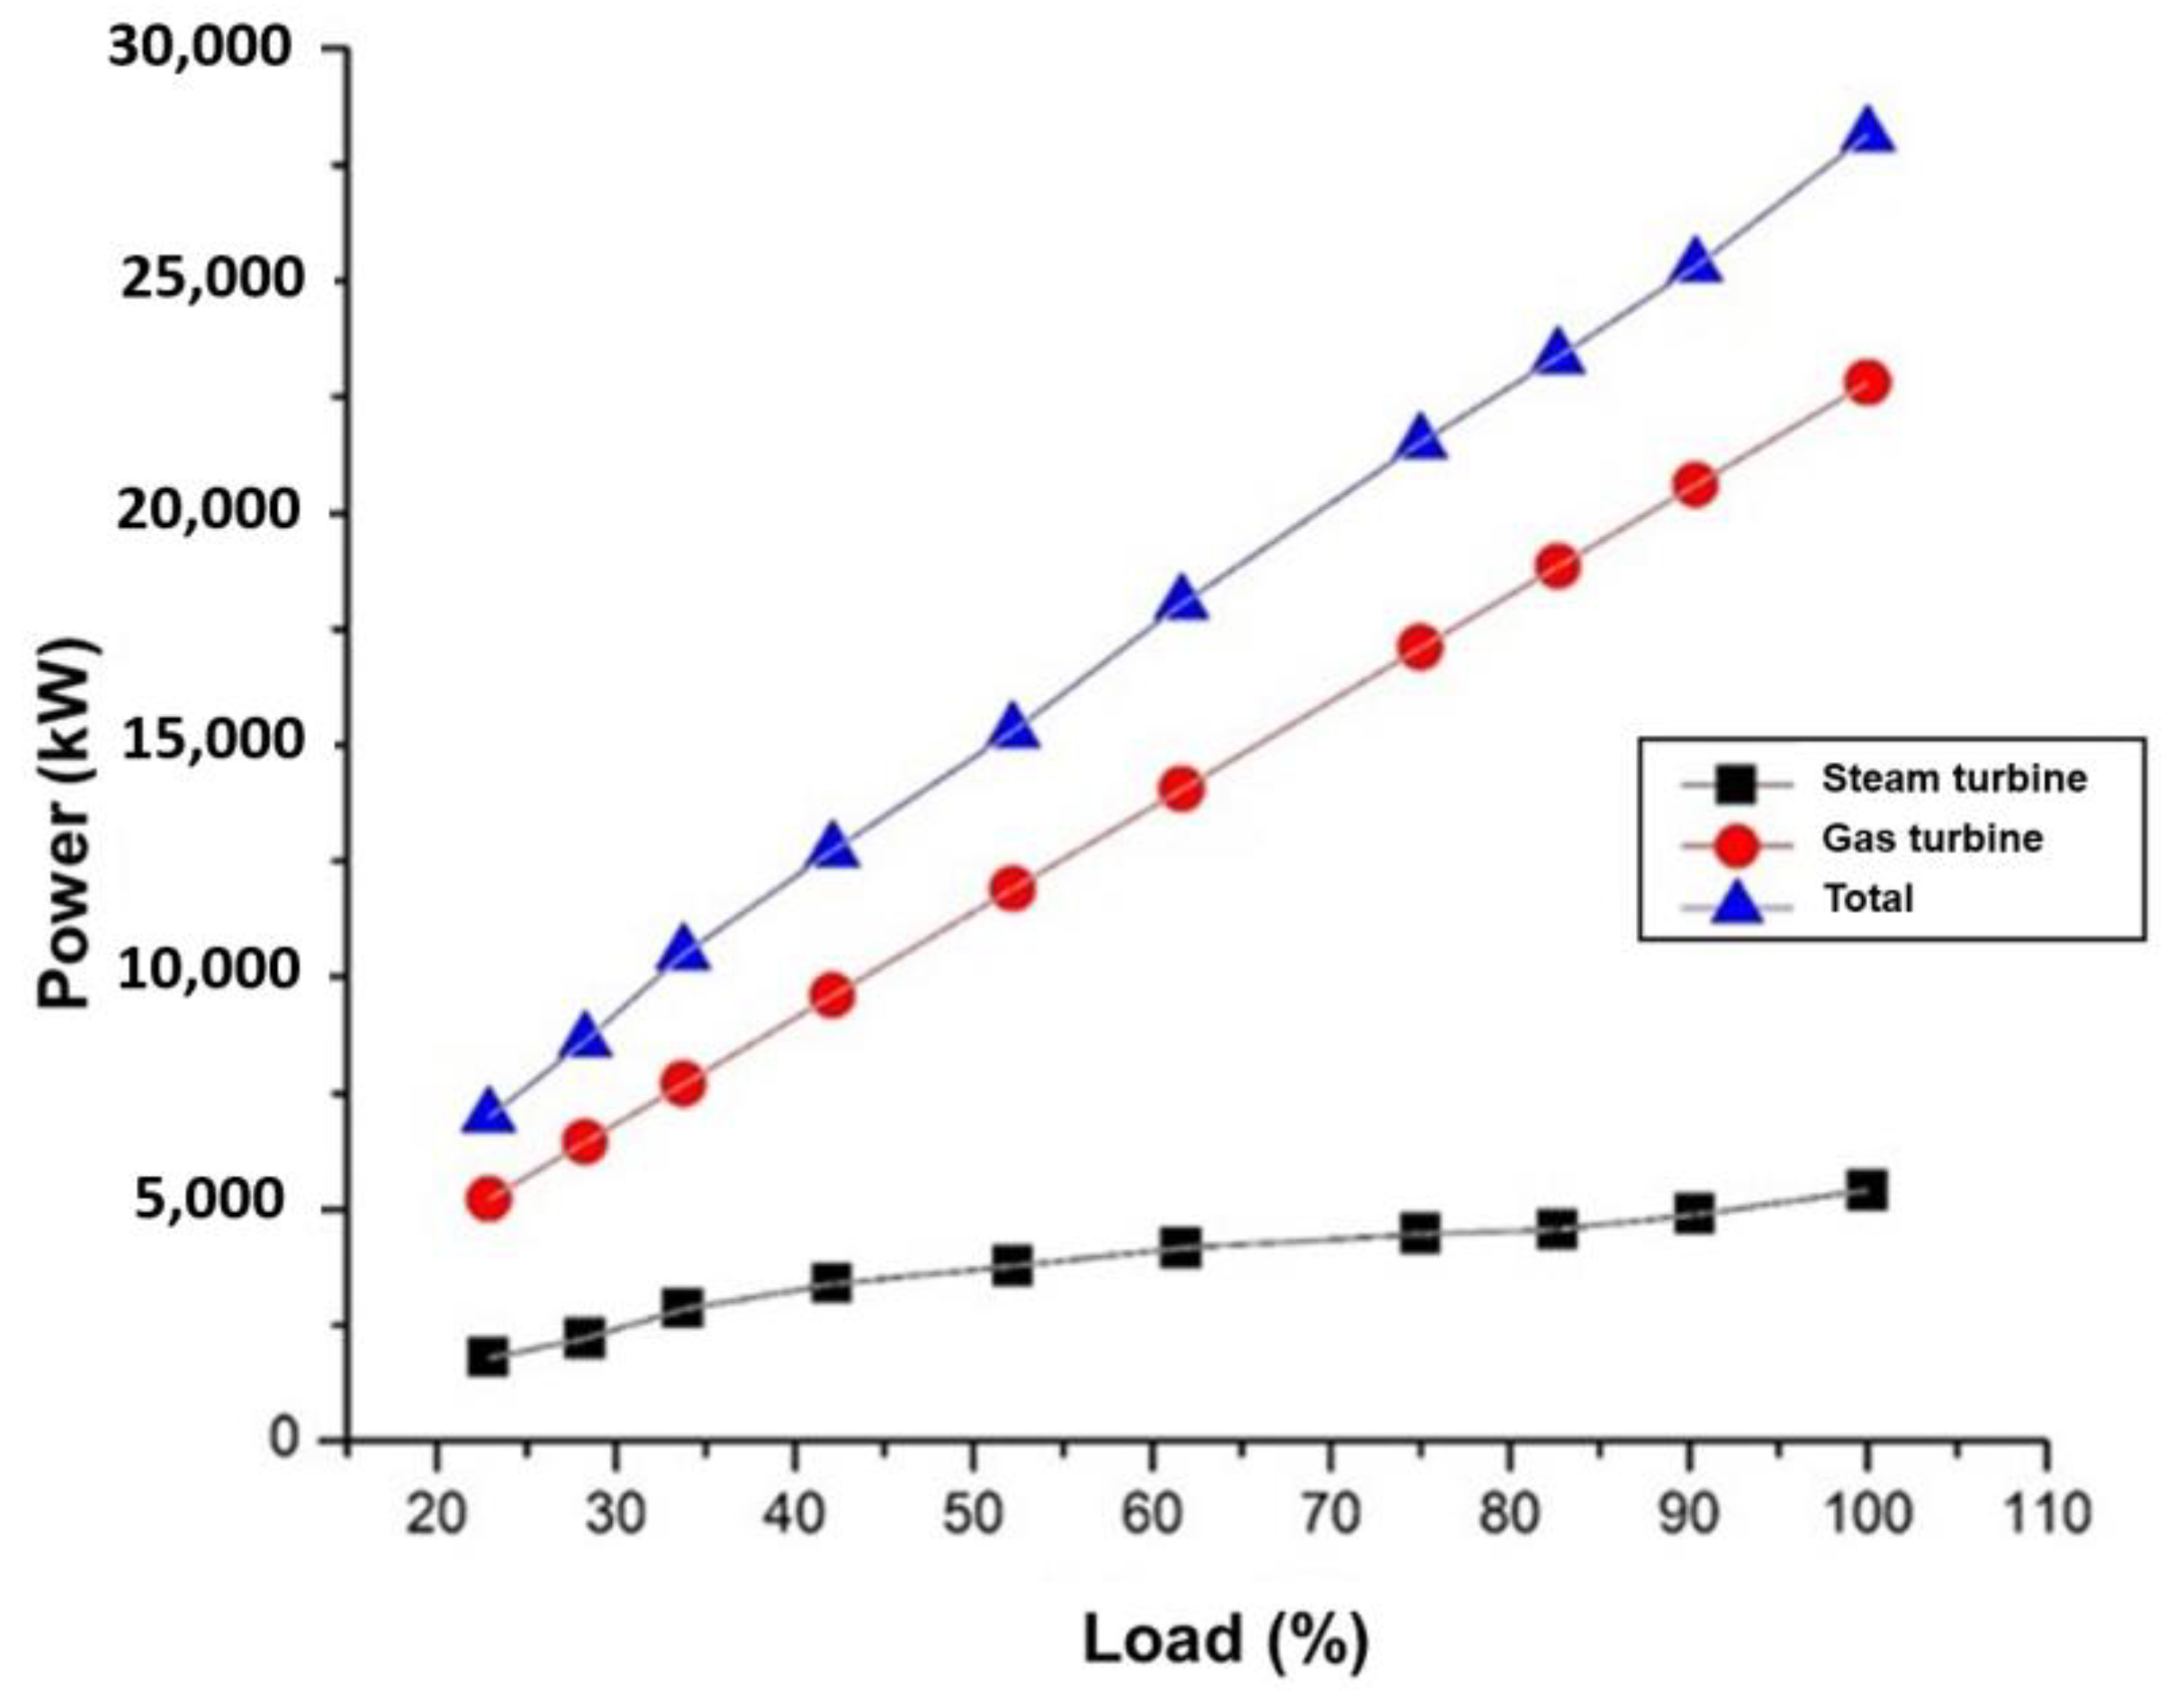
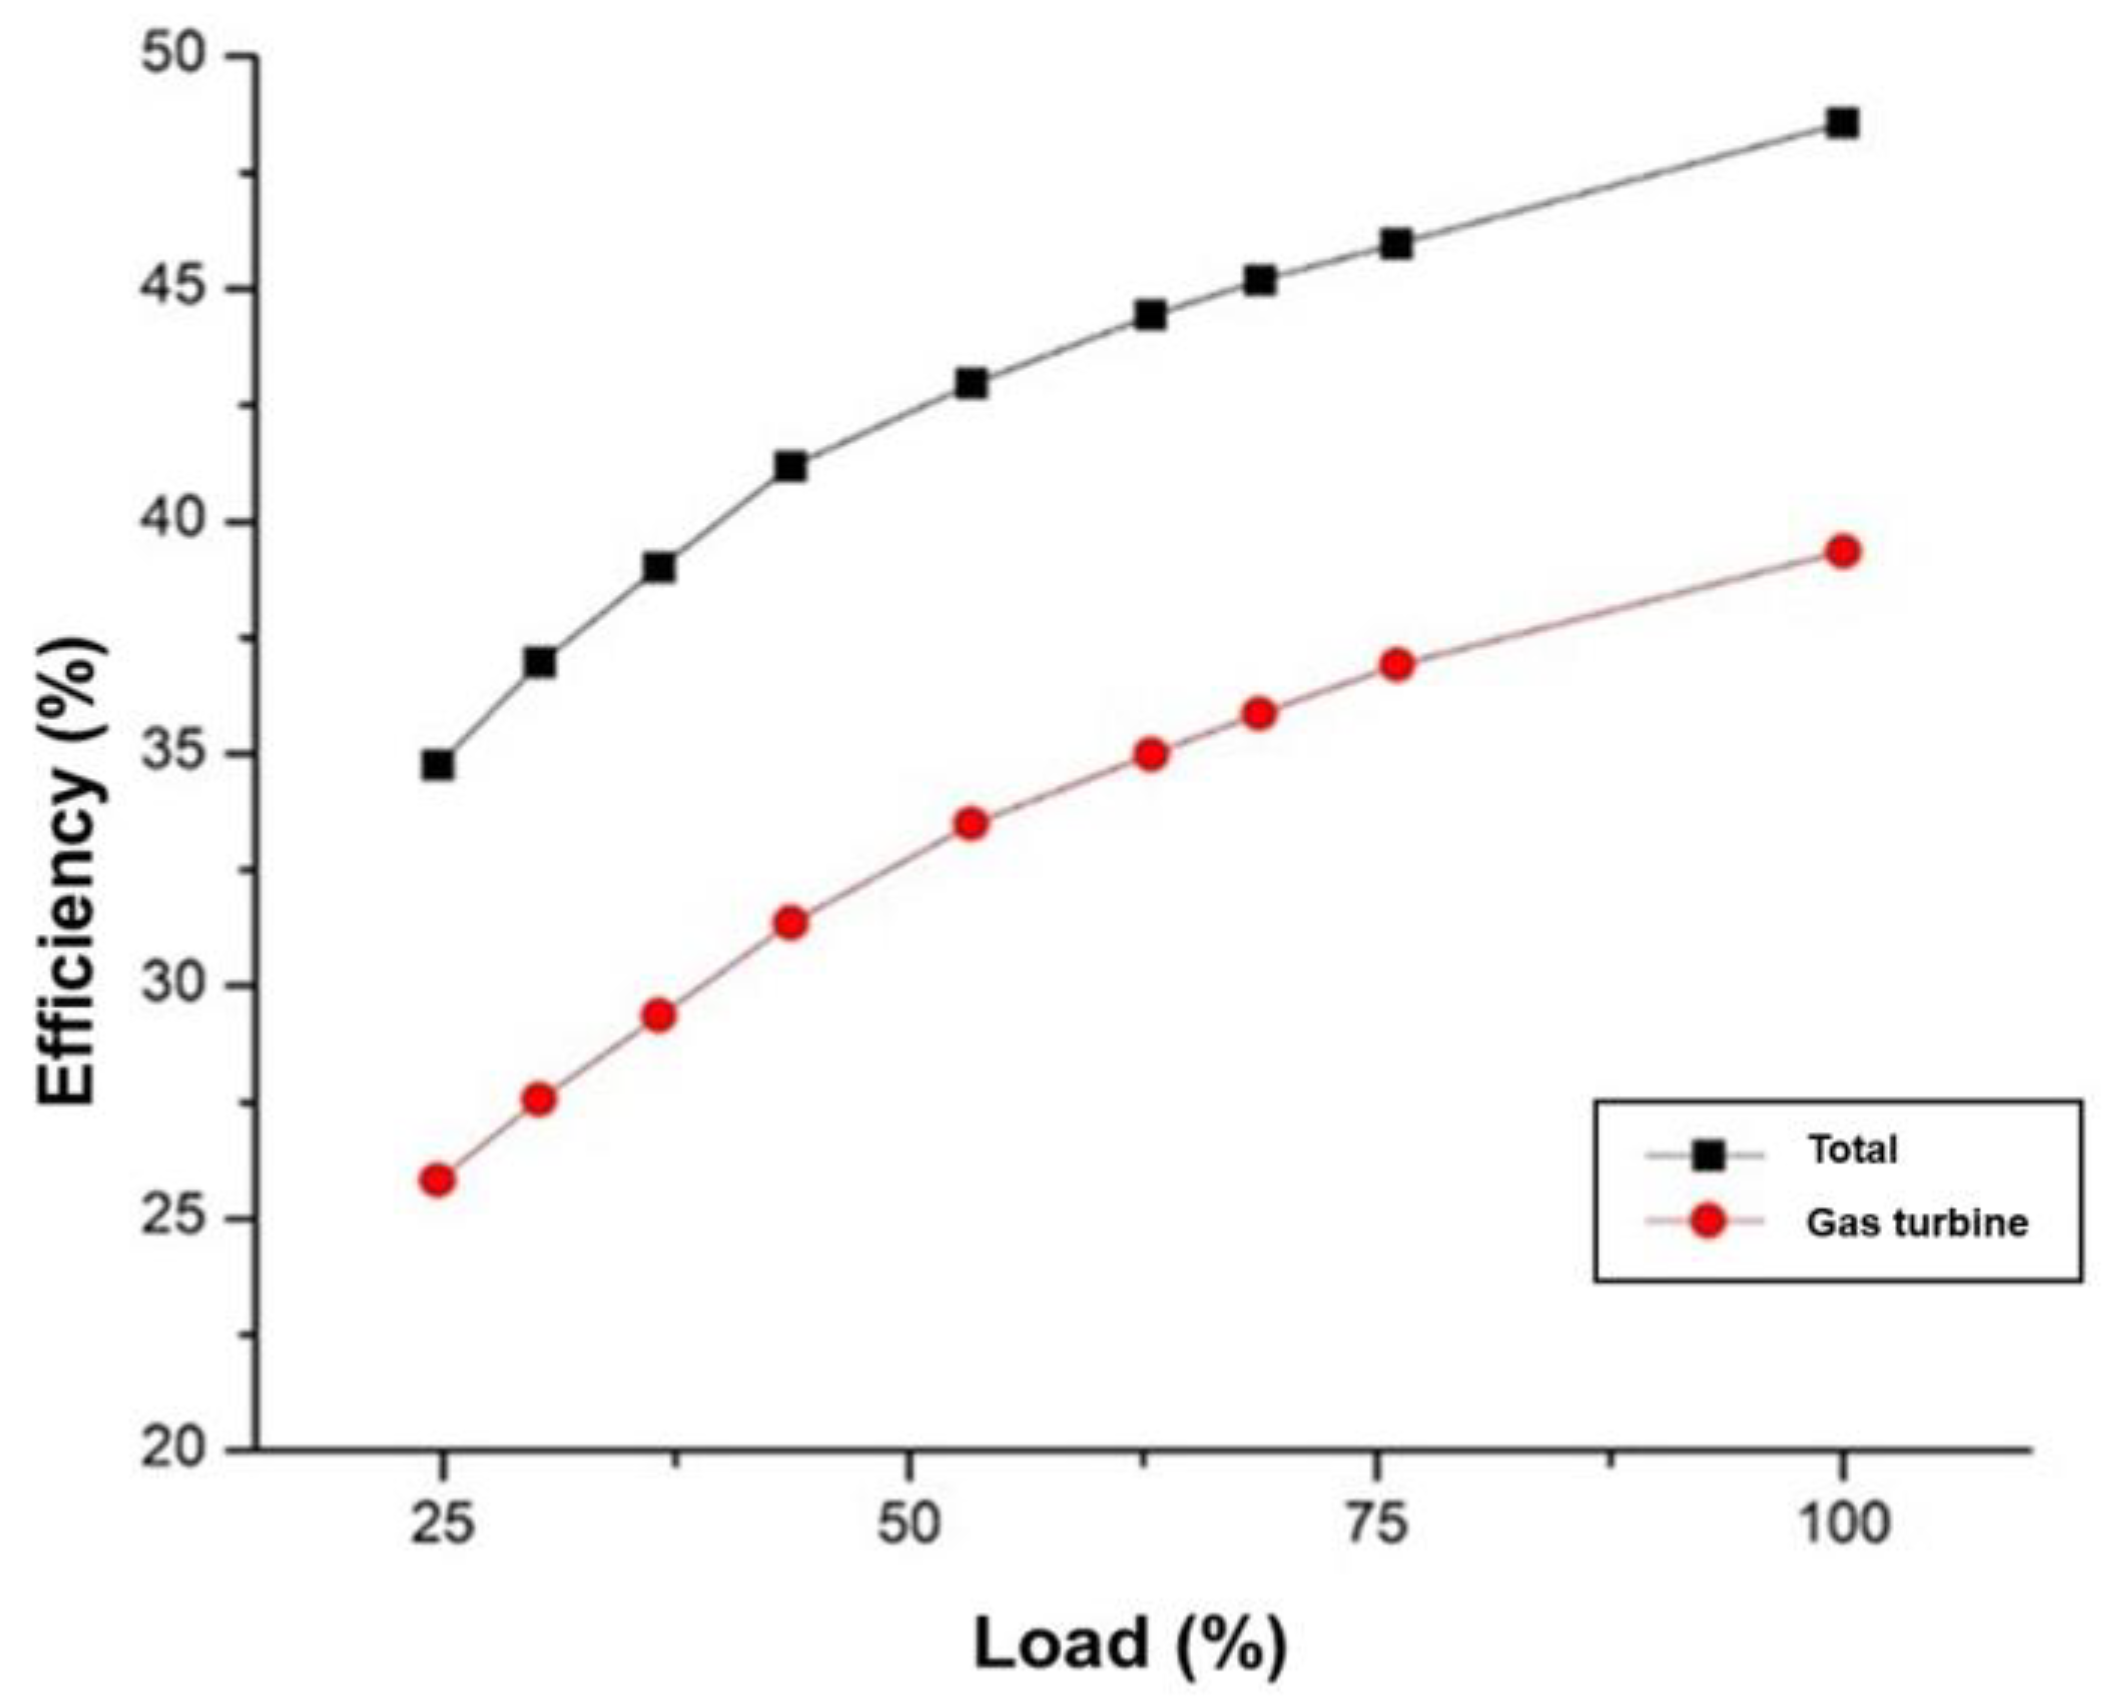
3.2. Analysis of System Performance

In designing this propulsion system, energy supply only came from gas turbines, because there was no further combustion in the HRSG. Therefore, it is important in determining the performance limits of gas turbines because this can affect the bottom generation cycle. Gas turbines work in a relatively narrow range of performance that can be described in the performance curve of the axial compressor or axial turbine. Figure 6 is a graph plot of the variations of loading with pressure ratio to corrected mass flow of the LM 2500 gas turbine compressor. Gas turbines experience the phenomenon of surging when operated at a loading below 22.8%, so this limit is a reference of gas turbine operations in the design of this system. In plotting the operating points in the performance curve, the designer must consider the magnitude of the mass flow rate and pressure ratio. The blue line represents the constant isentropic efficiency line so that keeping the operating point at a high-efficiency value can result in a more efficient system.

3.3. Data Analysis of Simulation Results

Based on data obtained from software simulation results, a graph is made to facilitate the drawing of conclusions from the observed data. Figure 7 presents a graph that shows the propulsion power at every percentage of the load of the engines, which can be seen the gas turbine engine become more dominant as the load increases. The gas turbine was taken as the reference for loading since it was the source of the overall heat system. The load or load percentage is the generated power of the gas turbine compared to the maximum power of the gas turbine. The total propulsion power of the system is the summation of the steam turbine power and the gas turbine power so that the value of the maximum total power of the system was 28,122.23 kW and the minimum power of the system was 6,990.9 kW. The limits of minimum loading were discussed in the previous subchapter. From the relationship between power and load, it could be seen that the power of the steam turbine decreased significantly at 33.77% loading. So, also be seen that the overall system power was decreased slightly. However, the rest of the total power needed was fulfilled by the power generated from the gas turbine.
Figure 8 shows that the total power efficiency follows on the gas turbine efficiency since the power of the steam turbine unit were relative constant at higher power load. The power efficiency is the total power of the gas turbine and steam turbine divided by the LHV fuel combustion power which is occur only in the gas turbine combustion chamber. Also, the maximum total propulsion system efficiency is at 48.49% at the maximum loading. This total efficiency will decrease as the loading percentage decrease. At minimum load, the total system efficiency is just 34.03%. Gas turbine characteristics have best performance at the high design load. So, therefore part loading of the propulsion system causes the efficiency system to significantly decrease, along with the decrease of the performances of both the gas turbine and the steam turbine engines. The steam cycle, which gets heat from the gas turbine exhaust gas, experiences a decrease in performance due to reducing mass flow rate and the exhaust gas temperature of the gas turbine low load.
Figure 9 explains the relationship between the load of the system and the speed that can be achieved by the ship. This simulation was carried out on the conditions of an empty ship or ballast condition as well as the ship at loaded condition. Both conditions are at maximum propulsion power loading. The loaded condition ship which is containing the cargo can reach a maximum speed of 20.67 knots, whereas for the ballast condition ship which is not containing a cargo can reach a maximum speed of 21.7 knots. Both at maximum propulsion power load.
In Figure 10 a and b, it can be seen that the relationship between the required fuel consumption and the boil-off gas availability in LNG vessels, at the time of fully loaded cargo delivery (a) and when returning to port for loading (b). Based on the simulation results, there is no problem on the fuel consumption at the cargo delivery conditions ship. However if the ship sails on low speed, some considerations must be taken to anticipate problems from the increasing of the boil-off gas producing in the cargo space due to the lower fuel consumption with longer journey time. For loaded conditions ship to the destination port, the fuel availability from the boil-off gas produced in shipping will be 725,788.8 kg at maximum speed, whereas at lower speed of 13 knots, will be 1,154,004.3 kg. Then there will be differences of residual boil-off gas that was not consumed as engine fuel. It will be 235,896.2 kg after maximum speed sailing and 877,524.32 kg after sailing speed of 13 knots.
For empty ship conditions or ballast conditions with maximum sailing speed, the fuel needed during the cruise is 466,639.6 kg, while the available boil-off gas will be 445,401.7 kg. The fuel consumption will exceed the producing of availability of boil-off gas in the cargo. So, therefore a sailing speed selection is important for maintaining the fuel availability for ship. At a speed of 20 knots, for fully loaded condition ship the propulsion system fuel requirements is 488,320.86 kg, whereas for ballast condition ship the needed fuel consumption is 410,832 kg. This shows that the choice of speed and load of the engine greatly affects the producing availability of boil-off gas for engine fuel.

4. Conclusions

In this study, the design of the combined-cycle propulsion system was carried out on an LNG tanker with analytical calculation and simulation approaches using the Cycle-Tempo software. Combined cycle was used in the LNG tanker propulsion system with COGES (combined gas–electric steam) turbine configuration with the main components: gas turbine, steam turbine, heat recovery steam generator (HRSG), condenser, pump, deaerator, and generator. In accordance with the limits of gas turbine performance on the compressor performance characteristic map, gas turbines have a minimum loading limit of 22.8% due to the limits of the surge line. The maximum temperature of the gas turbine cycle at maximum loading is 1,215.87 °C with a flue gas temperature of 530 °C, and the inlet pressure on the steam turbine is 25 bar. From the simulation results, the maximum power from the resulting system was 28,139.25 kW. With the maximum power, the ship can cruise with a maximum speed of 20.67 knots at fully loaded conditions and 21.7 knots at ballast ship conditions. There is a maximum speed difference of 1.03 knots between fully loaded conditions and ballast conditions. In addition, the availability of fuel from boil-off gas in shipping to the port of destination is calculated to be 725,788.8 kg at maximum speed, while at a speed of 13 knots is 1,154,004.3 kg. There are residual boil-off gas differences that are not utilized as engine fuels of 235,896.2 kg at maximum speed and 877,524.32 kg at a speed of 13 knots. From the results, it can be concluded that the combined-cycle propulsion system using boil-off gas is feasible for LNG vessels. From the designed system, at fully loaded conditions, a maximum power of the system of about 28,122.23 kW is obtained with fuel consumption of about 1.173 kg/s, system efficiency of about 48.49% and the vessel speed can be reached up to 20.67 knots as well.

Author Contributions

Conceptualization, W.N., M.A.B. and R.M.; methodology, W.N., M.A.B. and R.M.; software, W.N., M.A.B. and R.M.; validation, W.N., M.A.B. and R.M.; formal analysis, W.N., M.A.B. and R.M.; investigation, W.N., M.A.B. and R.M.; resources, W.N.; data curation, W.N., M.A.B. and R.M.; writing—original draft preparation, W.N., R.M.; writing—review and editing, W.N., M.A.B.; visualization, W.N., M.A.B.; supervision, W.N.; project administration, W.N., M.A.B.; funding acquisition, W.N., M.A.B. All authors have read and agreed to the published version of the manuscript.

Funding

The research received only internal funding from the University of Indonesia as a research grant UI/PUTI Q2/2020 program number NKB-1683/UN2.RST/HKP.05.00/2020.

Acknowledgments

The authors would like to express their gratitude to the Directorate Research and Development of Universitas Indonesia (DRPM UI) for the grant support. This paper and its publication are supported by the UI/PUTI Q2/2020 program number NKB-1683/UN2.RST/HKP.05.00/2020. The authors also thank the Department of Mechanical Engineering at Universitas Indonesia for providing the supporting facilities during the research.

Conflicts of Interest

The authors are declaring that there are no conflict of interests in this research. The funders, i.e., the University of Indonesia, had no role in the design of the study; in the collection, analyses, or interpretation of data; in the writing of the manuscript, or in the decision to publish the results.

References

  1. Javanmardi, J.; Nasrifar, K.; Najibi, S.; Moshfeghian, M. Economic evaluation of natural gas hydrate as an alternative for natural gas transportation. Appl. Therm. Eng. 2005, 25, 1708–1723. [Google Scholar] [CrossRef]
  2. Brito, A.; de Almeida, A.; de Almeida, A.T. Multi-attribute risk assessment for risk ranking of natural gas pipelines. Reliab. Eng. Syst. Saf. 2009, 94, 187–198. [Google Scholar] [CrossRef]
  3. Folga, S.M. Natural Gas Pipeline Technology Overview; Argonne National Lab: Argonne, IL, USA, 2007. [Google Scholar] [CrossRef] [Green Version]
  4. Montiel, H.; Vílchez, J.A.; Arnaldos, J.; Casal, J. Historical analysis of accidents in the transportation of natural gas. J. Hazard. Mater. 1996, 51, 77–92. [Google Scholar] [CrossRef]
  5. Budiyanto, M.A.; Riadi, A.; Buana, I.S.; Kurnia, G. Study on the LNG distribution to mobile power plants utilizing small-scale LNG carriers. Heliyon 2020, 6, e04538. [Google Scholar] [CrossRef]
  6. Bennett, C.P. Marine Transportation of LNG at Intermediate Temperature; Springer: Boston, MA, USA, 1980; pp. 751–756. [Google Scholar] [CrossRef]
  7. Wagner, J.V.; Van Wagensveld, S. Marine Transportation of Compressed Natural Gas a Viable Alternative to Pipeline or LNG. In Proceedings of the SPE Asia Pacific Oil & Gas Conference and Exhibition, Society of Petroleum Engineers, Melbourne, Australia, 8–10 October 2002. [Google Scholar] [CrossRef]
  8. Stenning, D.G.; Cran, J.A. Ship Based System for Compressed Natural Gas Transport. 1997. Available online: https://patents.google.com/patent/US5803005A/en (accessed on 20 January 2020).
  9. Feng, L.; Shuanshi, F. Transmission and economy of shipping NGH. Tsinghua Tongfang Knowl. Netw. 2005, 7. Available online: http://en.cnki.com.cn/Article_en/CJFDTOTAL-TRQG200507043.htm (accessed on 20 January 2020).
  10. Sinor, J.; Consultants, J. Comparison of CNG and LNG Technologies for Transportation Applications; Department of Energy: Golden, CO, USA, 1992. [Google Scholar] [CrossRef] [Green Version]
  11. Maxwell, D.; Zhu, Z. Natural gas prices, LNG transport costs, and the dynamics of LNG imports. Energy Econ. 2011, 33, 217–226. [Google Scholar] [CrossRef]
  12. International Gas Union. 2018 World LNG Report; International Gas Union: Barcelona, Spain, 2018; Available online: https://www.igu.org/sites/default/files/node-document-field_file/IGU_LNG_2018_0.pdf (accessed on 20 January 2020).
  13. The Oxford Institute for Energy Studies. The LNG Shipping Forecast: Costs Rebounding, Outlook Uncertain; The Oxford Institute for Energy Studies: Oxford, UK, 2018; Available online: https://www.oxfordenergy.org/wpcms/wp-content/uploads/2018/02/The-LNG-Shipping-Forecast-costs-rebounding-outlook-uncertain-Insight-27.pdf (accessed on 20 January 2020).
  14. Mrzljak, V.; Poljak, I.; Mrakovčić, T. Energy and exergy analysis of the turbo-generators and steam turbine for the main feed water pump drive on LNG carrier. Energy Convers. Manag. 2017, 140, 307–323. [Google Scholar] [CrossRef]
  15. Pamitran, A.S.; Budiyanto, M.A.; Maynardi, R.D.Y. Analysis of ISO-Tank Wall Physical Exergy Characteristic: Case Study of LNG Boil-off Rate from Retrofitted Dual Fuel Engine Conversion. Evergreen 2019, 6, 134–142. [Google Scholar] [CrossRef]
  16. Haglind, F. A review on the use of gas and steam turbine combined cycles as prime movers for large ships. Part II: Previous work and implications. Energy Convers. Manag. 2008, 49, 3468–3475. [Google Scholar] [CrossRef]
  17. Senary, K.; Tawfik, A.; Hegazy, E.; Ali, A. Development of a waste heat recovery system onboard LNG carrier to meet IMO regulations. Alex. Eng. J. 2016, 55, 1951–1960. [Google Scholar] [CrossRef] [Green Version]
  18. Attah, E.E.; Bucknall, R. An analysis of the energy efficiency of LNG ships powering options using the EEDI. Ocean Eng. 2015, 110, 62–74. [Google Scholar] [CrossRef]
  19. Budiyanto, M.A.; Pamitran, A.S.; Wibowo, H.T.; Murtado, F.N. Study on the Performance Analysis of Dual Fuel Engines on the Medium Speed Diesel Engine. J. Adv. Res. Fluid Mech. Therm. Sci. J. 2020, 68, 163–174. [Google Scholar] [CrossRef]
  20. Fernández, I.A.; Gómez, M.R.; Gómez, J.R.; Insua, Á.B. Review of propulsion systems on LNG carriers, Renew. Sustain. Energy Rev. 2017, 67, 1395–1411. [Google Scholar] [CrossRef]
  21. Chang, D.; Rhee, T.; Nam, K.; Chang, K.; Lee, D.; Jeong, S. A study on availability and safety of new propulsion systems for LNG carriers. Reliab. Eng. Syst. Saf. 2008, 93, 1877–1885. [Google Scholar] [CrossRef]
  22. Sinha, R.P.; Nik, W.M.N.W. Investigation of propulsion system for large LNG ships. In Proceedings of the 1st International Conference on Mechanical Engineering Research 2011 (ICMER2011), IOP Conference Series: Materials Science and Engineering, Kuantan, Pahang, Malaysia, 5–7 December 2011; pp. 1–16. [Google Scholar] [CrossRef] [Green Version]
  23. Haglind, F. A review on the use of gas and steam turbine combined cycles as prime movers for large ships. Part III: Fuels and emissions. Energy Convers. Manag. 2008, 49, 3476–3482. [Google Scholar] [CrossRef]
  24. Lee, D.-M.; Kim, S.-Y.; Moon, B.-Y.; Kang, G.-J. Layout design optimization of pipe system in ship engine room for space efficiency. J. Korean Soc. Mar. Eng. 2013, 37, 784–791. [Google Scholar] [CrossRef]
  25. Budiyanto, M.A.; Nasruddin; Nawara, R. The optimization of exergoenvironmental factors in the combined gas turbine cycle and carbon dioxide cascade to generate power in LNG tanker ship. Energy Convers. Manag. 2020, 205, 112468. [Google Scholar] [CrossRef]
  26. Hansen, J.F.; Lysebo, R. Comparison of Electric Power and Propulsion Plants for LNG Carriers with Different Propulsion Systems. 2007. Available online: http://www.dieselduck.info/machine/02propulsion/2007ComparisonLNGcarrierpropulsion.pdf (accessed on 20 January 2020).
  27. Wiggins, E.G. COGAS propulsion for LNG ships. J. Mar. Sci. Appl. 2011, 10, 175–183. [Google Scholar] [CrossRef]
  28. Dimopoulos, G.; Frangopoulos, C. Thermoeconomic Simulation of Marine Energy Systems for a Liquefied Natural Gas Carrier. Int. J. Thermodyn. 2008, 11, 195–201. Available online: https://dergipark.org.tr/en/pub/ijot/issue/5770/76768 (accessed on 20 January 2020).
  29. Jefferson, M.; Zhou, P.L.; Hindmarch, G. Analysis by computer simulation of a combined gas turbine and steam turbine (COGAS) system for marine propulsion. J. Mar. Eng. Technol. 2003, 2, 43–53. [Google Scholar] [CrossRef]
  30. Oka, M.; Kazuyoshi, H.; Kenji, T. Development of Next-Generation LNGC Propulsion Plant and HYBRID System. MHI Tech. Rev. 2004, 41. Available online: http://www.mhi.co.jp/technology/review/pdf/e416/e416322.pdf (accessed on 20 January 2020).
  31. Hanochem Shipping, LNG AQUARIUS. Available online: http://www.gts-internasional.com/lng-aquarius (accessed on 20 January 2020).
  32. Cuneo, J. Service Experience with 125.000 m3 LNG Vessel of Spherical-Tank Design. Soc. Nav. Arch. Mar. Eng. Trans. 1980, 88. Available online: https://www.sname.org/pubs/journals1 (accessed on 20 January 2020).
  33. BMKG. Meteorology, Climatology, Data Online Center Database. Available online: http://dataonline.bmkg.go.id/home (accessed on 16 July 2019).
  34. Bentley Systems, Maxsurf 20.00 V8i Release Notes—MAXSURF|MOSES|SACS—Wiki—MAXSURF|MOSES|SACS—Bentley Communities. Available online: https://communities.bentley.com/products/offshore/w/wiki/14169/maxsurf-20-00-v8i-release-notes (accessed on 21 January 2020).
  35. Garjito, A.; Sumarno, A. Indonesia LNG and the Badak Plant; Indonesian Petroleum Association: South Jakarta, Indonesia, 1981; pp. 459–474. Available online: http://archives.datapages.com/data/ipa/data/010/010001/459_ipa0100459.htm (accessed on 20 January 2020).
  36. Aviation, G.E. Marine Gas Turbine. 2014. Available online: https://www.geaviation.com/sites/default/files/datasheet-25mw.pdf (accessed on 15 January 2020).
  37. Asimptote, B.V. Cycle-Tempo Manual Technical Notes. Available online: http://www.asimptote.nl/assets/media/7d155f62-ffe2-4a9e-9f33-bb003c80bd2b.pdf (accessed on 20 January 2020).
  38. Følgesvold, E.R.; Skjefstad, H.S.; Riboldi, L.; Nord, L.O. Combined Heat and Power Plant on Offshore Oil and Gas Installations. 2011. Available online: http://papers.itc.pw.edu.pl/index.php/JPT/article/view/842 (accessed on 20 January 2020).
  39. Saravanamuttoo, H.I.; Rogers, G.F.; Cohen, H. Gas Turbine Theory; Addison-Wesley Longman: Boston, MA, USA, 1996. [Google Scholar]
Figure 1. Power prediction using Holtrop methods.
Jmse 08 00726 g001
Figure 2. Schematic of a combined-cycle propulsion system.
Jmse 08 00726 g002
Figure 3. T-s diagram for the actual gas turbine cycle of the designed system.
Jmse 08 00726 g003
Figure 4. Q-T diagram for HRSG.
Jmse 08 00726 g004
Figure 5. T-s diagram for the actual steam turbine cycle of the designed system.
Jmse 08 00726 g005
Figure 6. Plot curve performance of the LM 2500 gas turbine compressor against variations in loading from the system.
Jmse 08 00726 g006
Figure 7. Power to the loading of the propulsion system.
Jmse 08 00726 g007
Figure 8. Efficiency of the system versus engine load.
Jmse 08 00726 g008
Figure 9. Graph of loading of the system and ship speed.
Jmse 08 00726 g009
Figure 10. Availability of boil-off gas and fuel requirements of ships at the time of fully loaded condition (a) and ballast condition (b).
Jmse 08 00726 g010
Table 1. LNG tankers with a capacity of 125,000 m3.
Ship NameLNG Aquarius
LOA285.3 m
LBP273.4 m
Beam43.74 m
Depth to main deck24.99 m
Full-load draft10.97 m
Scantling draft11.53 m
Engine typeSteam turbine
Number of propellers1
Trial speed20.4 knots
Service speed19.5 knots
Cargo tank capacity (−160 °C)126,400 m3
Tank designSpherical aluminum
Crew number31
Table 2. LNG cargo handling averages.
Cargo Aboard
After loading125,400 m3
Before discharge123,400 m3
Heel aboard
After loading1,900 m3
Before discharge600 m3
Cargo loaded124,800 m3
Cargo discharged121,500 m3
Boil-off
Loaded leg2,000 m3
Ballast leg1,300 m3
Table 3. Assumed environmental shipping conditions.
Air Temperature27 °C (Average Daily Temperature at Bontang)
Sea water temperature28 °C
Environmental pressure1.01 bar
Mileage2,400 nautical miles
Total sailing hours316.2
Total sailing days13.2
Table 4. The composition and characteristics of natural gas [35].
CH491.20%
C2H65.50%
C3H82.40%
C4H100.90%
O20.10%
N20.00%
Lower heating value (LHV)49,426.97 kJ/kg
Liquid density (LNG)456 kg/m3
Gas density (CNG)0.801 kg/m3 (0 °C, 1 atm)
Expansion ratio (Gas/Liq)568 m3 (gas)/m3 (liq) (0 °C, 1 atm)
Table 5. Gas turbine specifications [36].
ModelLM 2500
ManufacturerGeneral Electric
Power ISO condition (100% load)25 MW
Power ambient condition (27 °C, 1.01 bar)22.8 MW
FuelNatural gas
Exhaust gas temperature (100% load)530 °C
Isentropic compressor efficiency70–87%

