Comprehensive Study of the Sand Spit Evolution at Tidal Inlets in the Central Coast of Vietnam

 ,
,  ,
, 
 ,
, 
Abstract
:1. Introduction
2. Materials and Methods
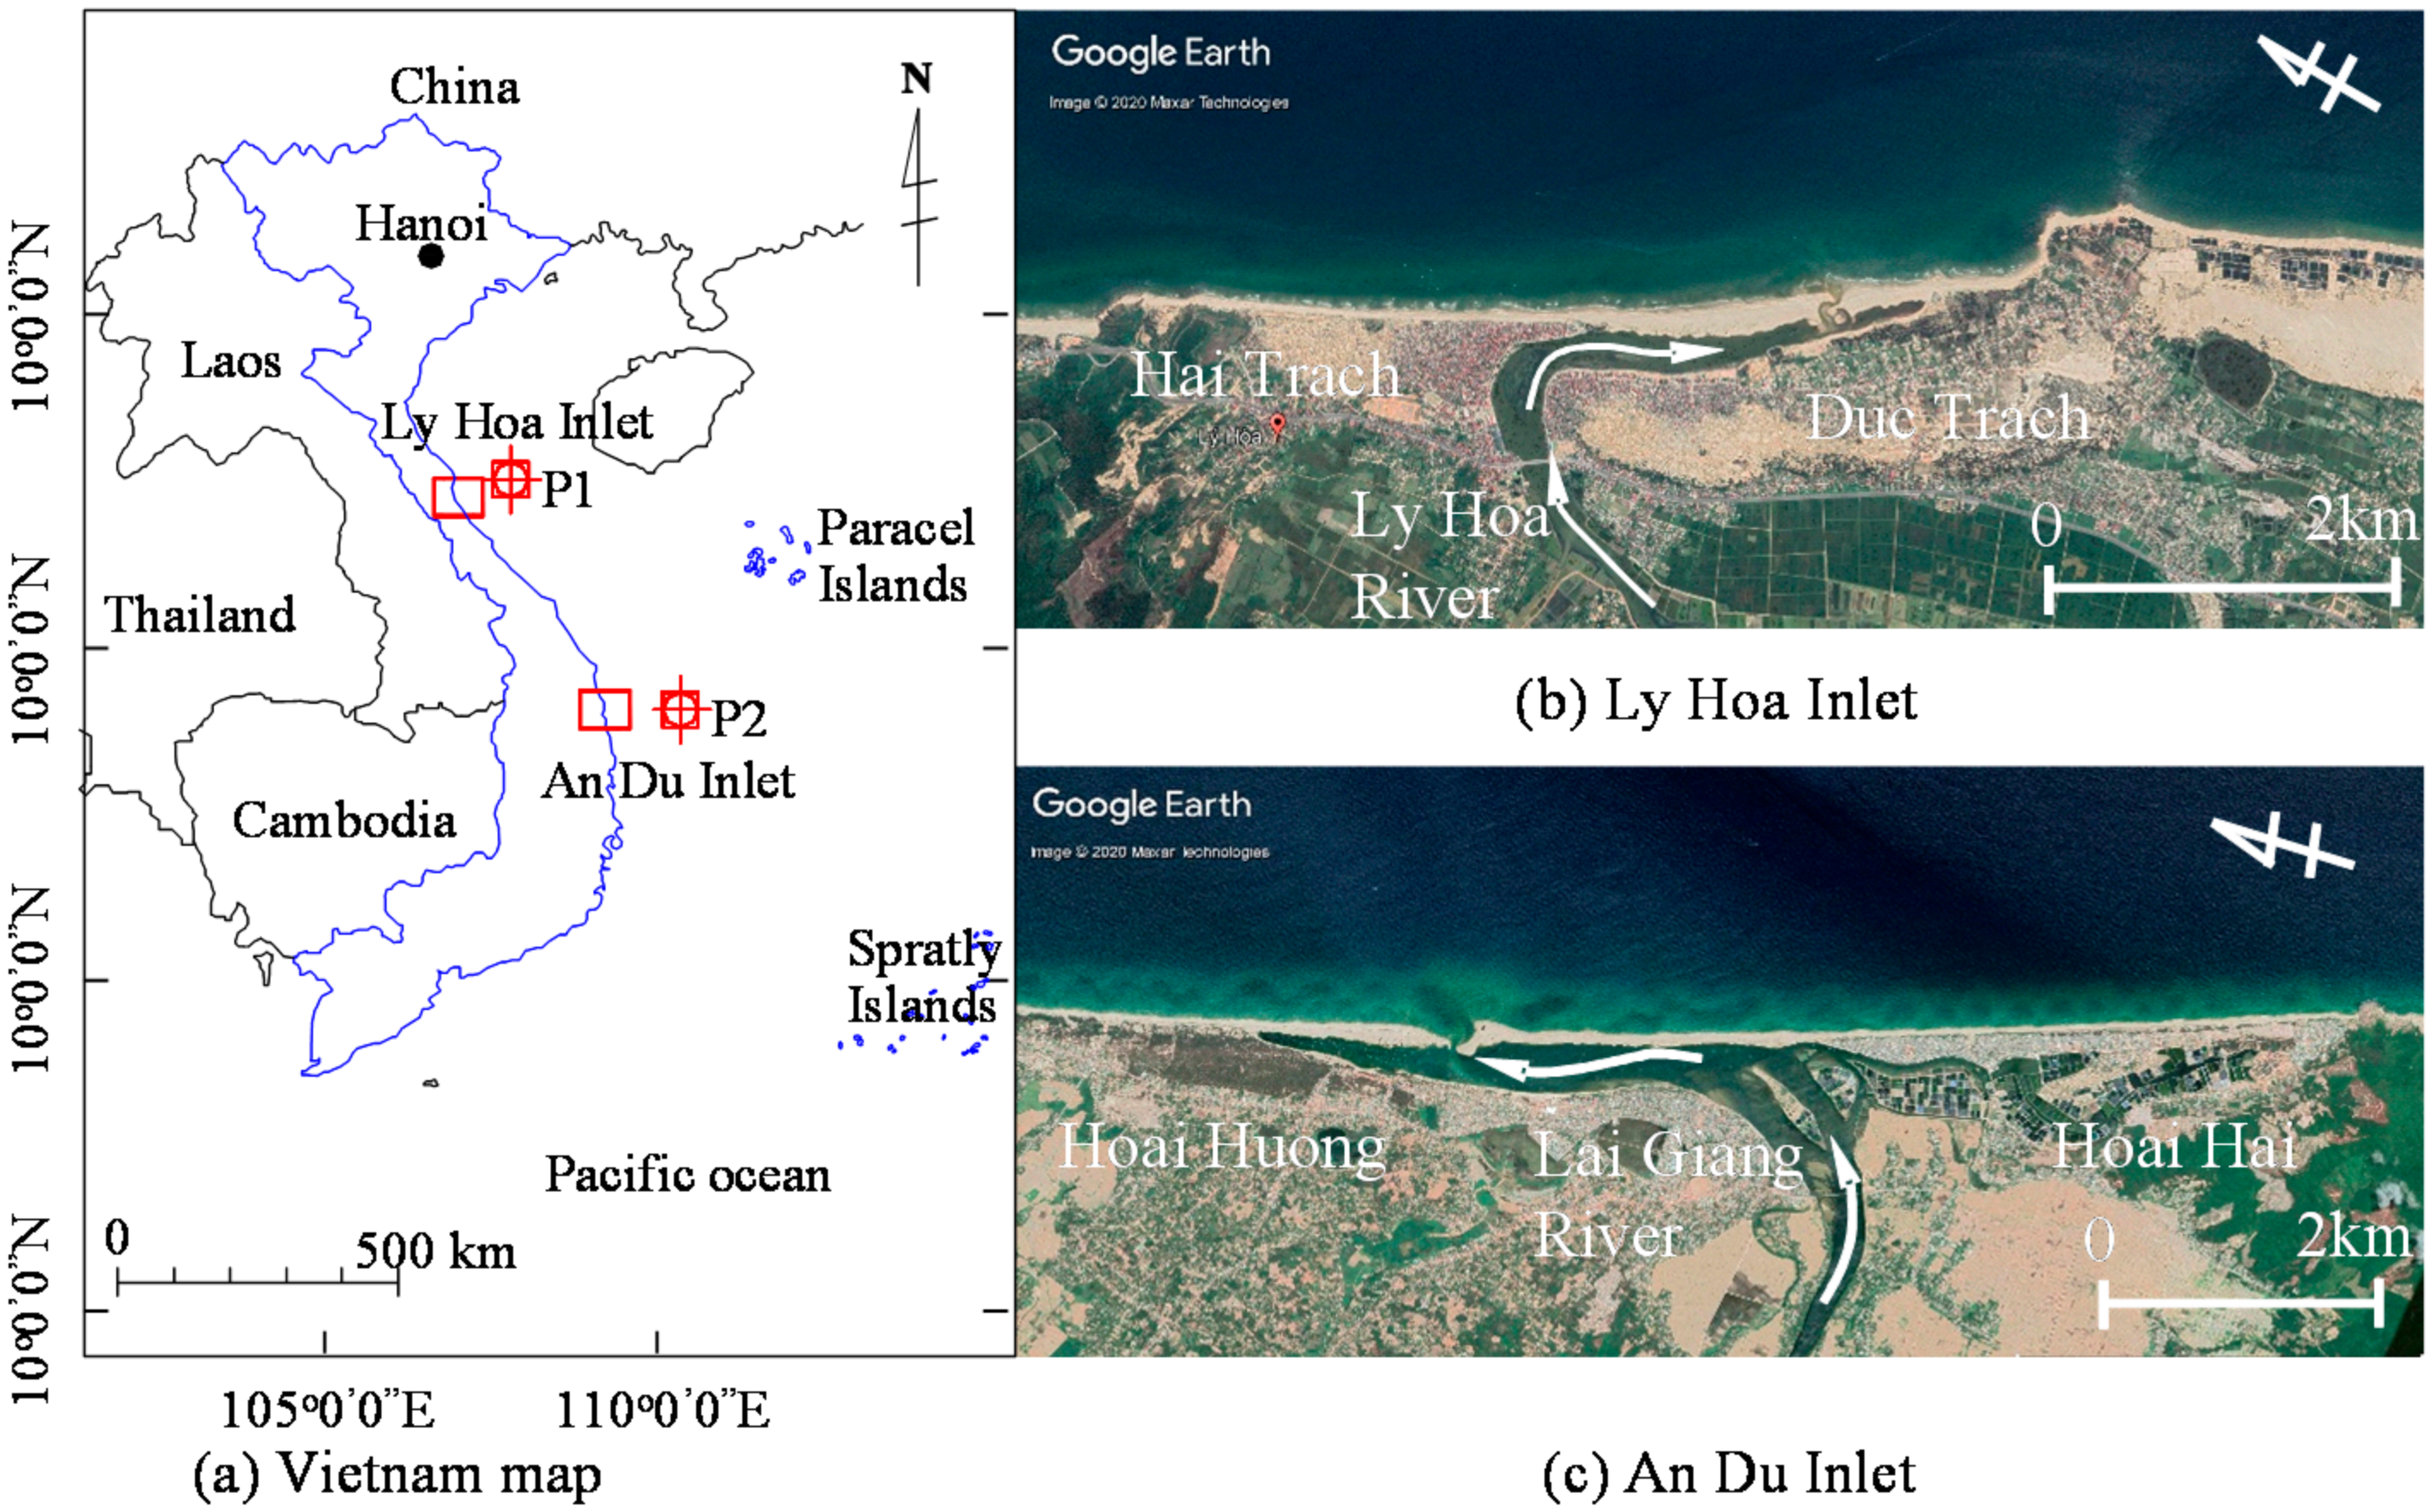
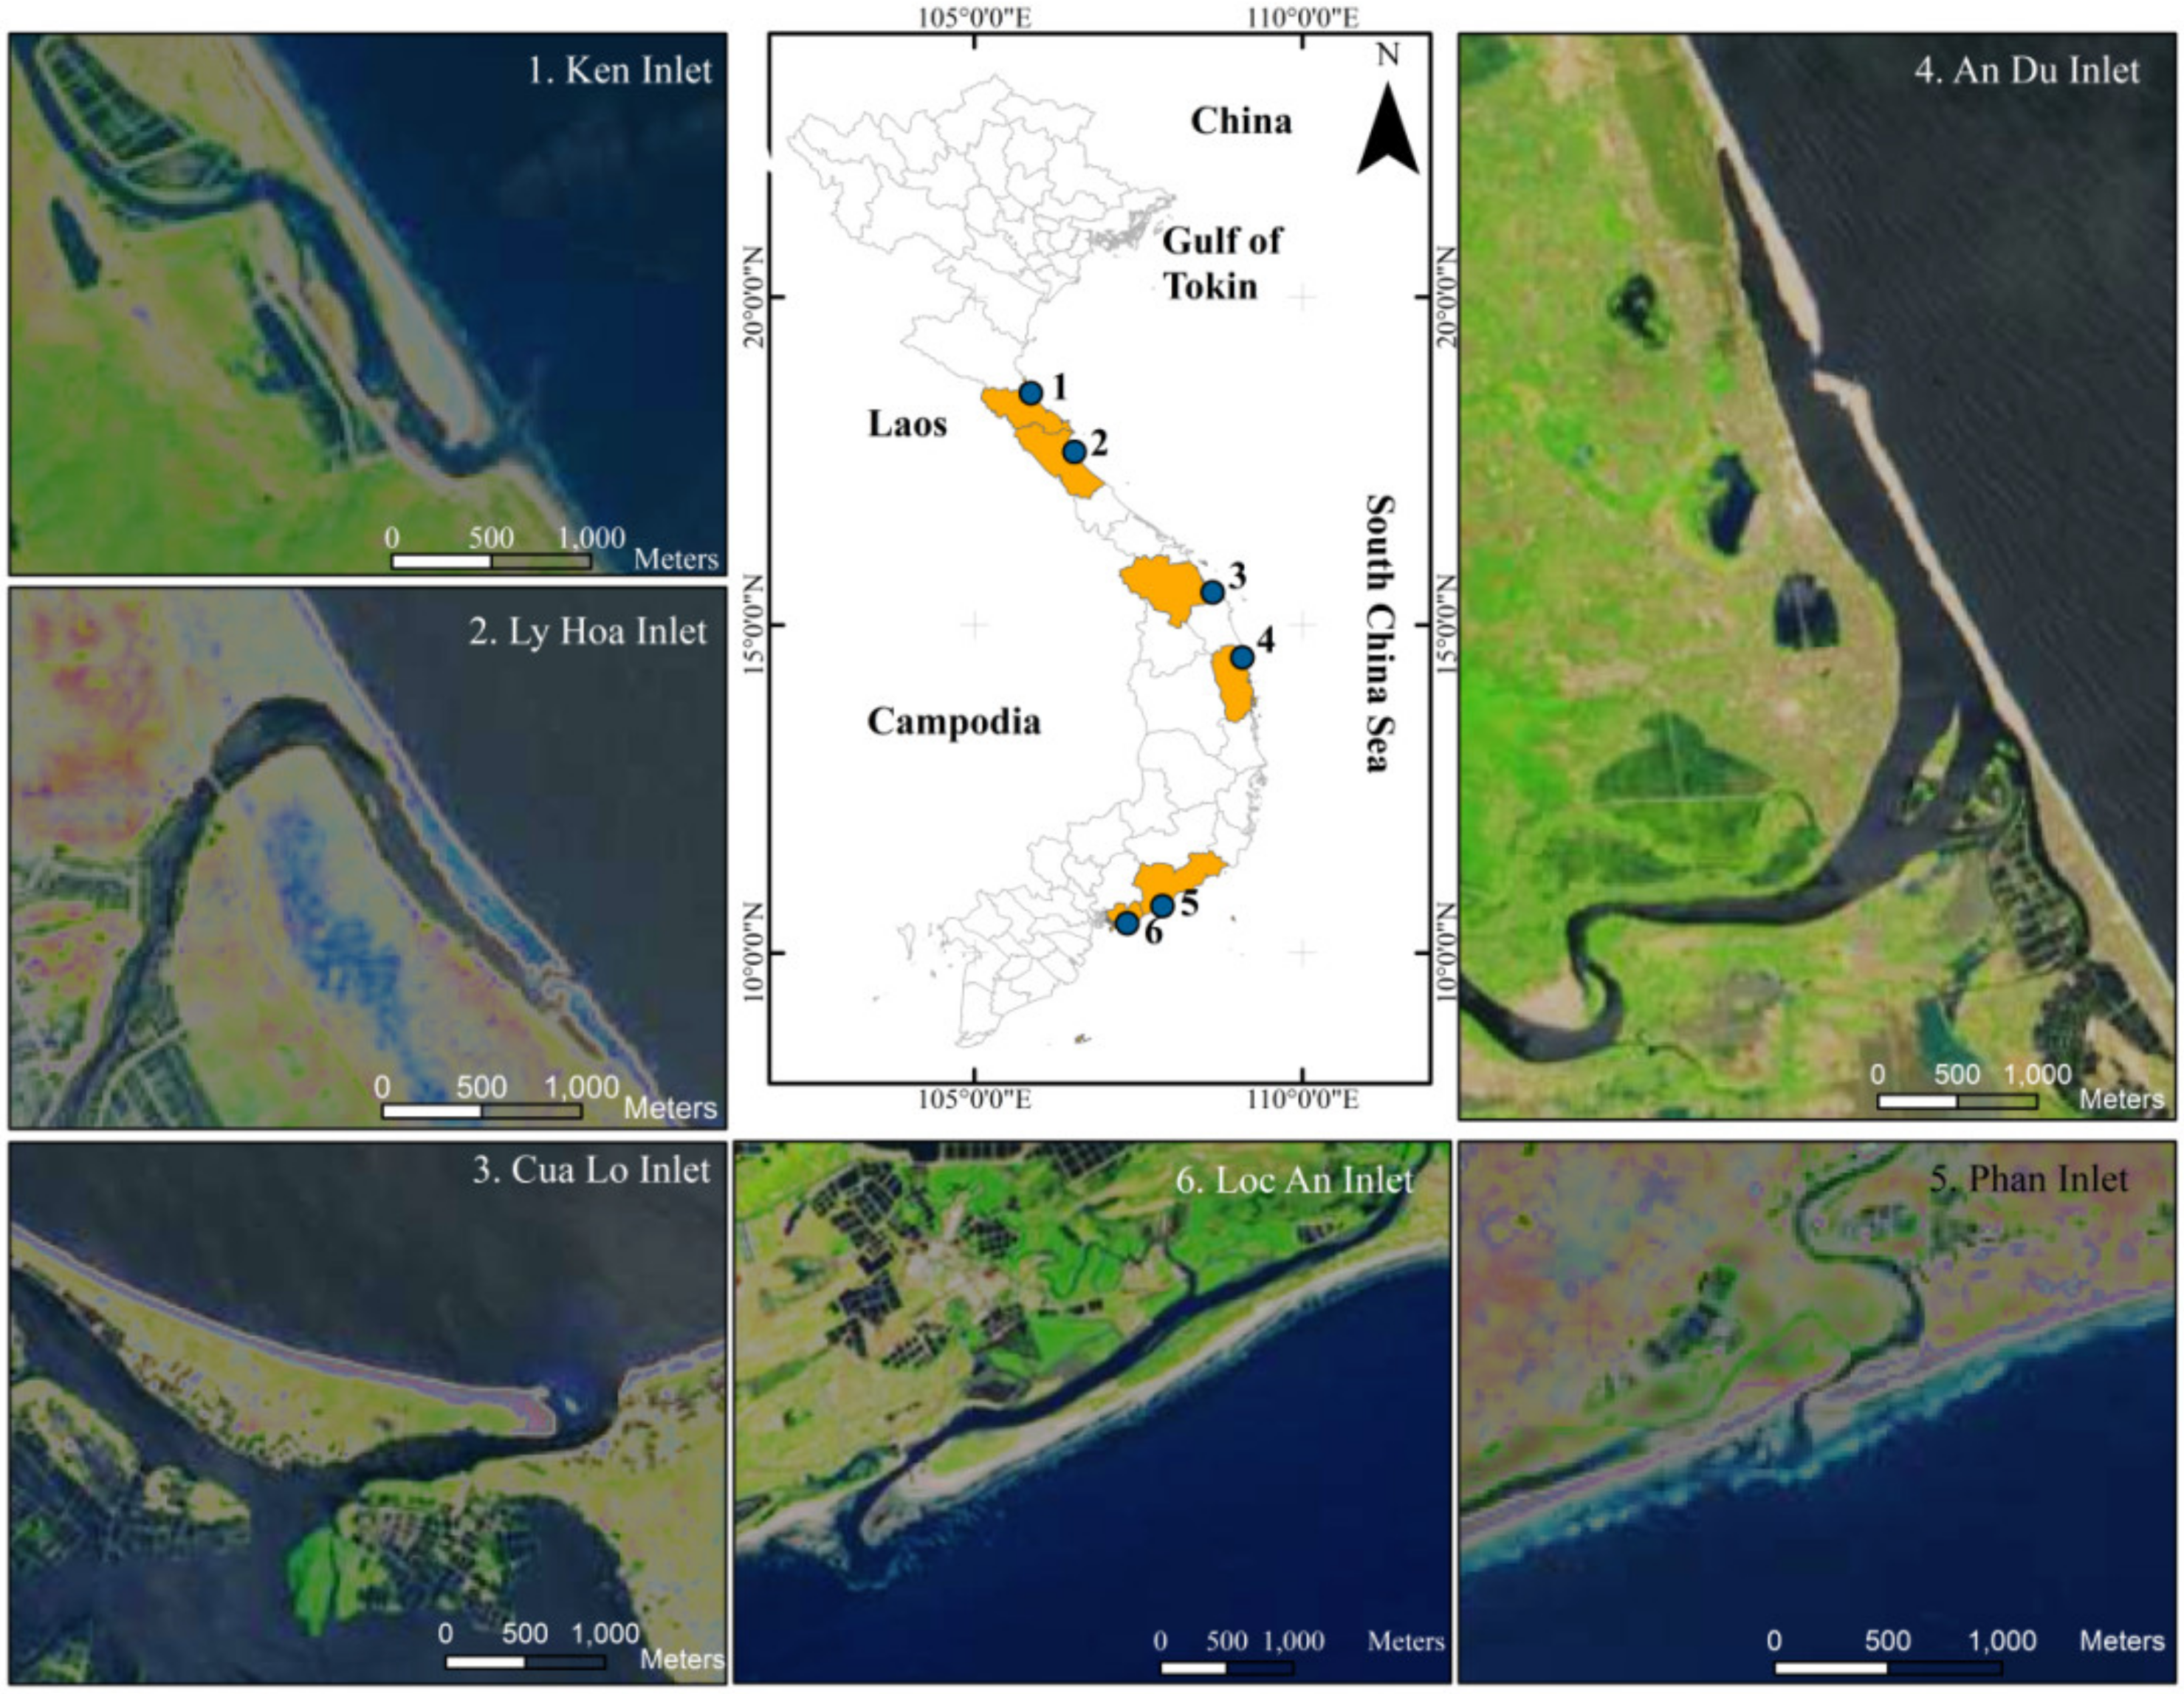
2.1. Study Areas
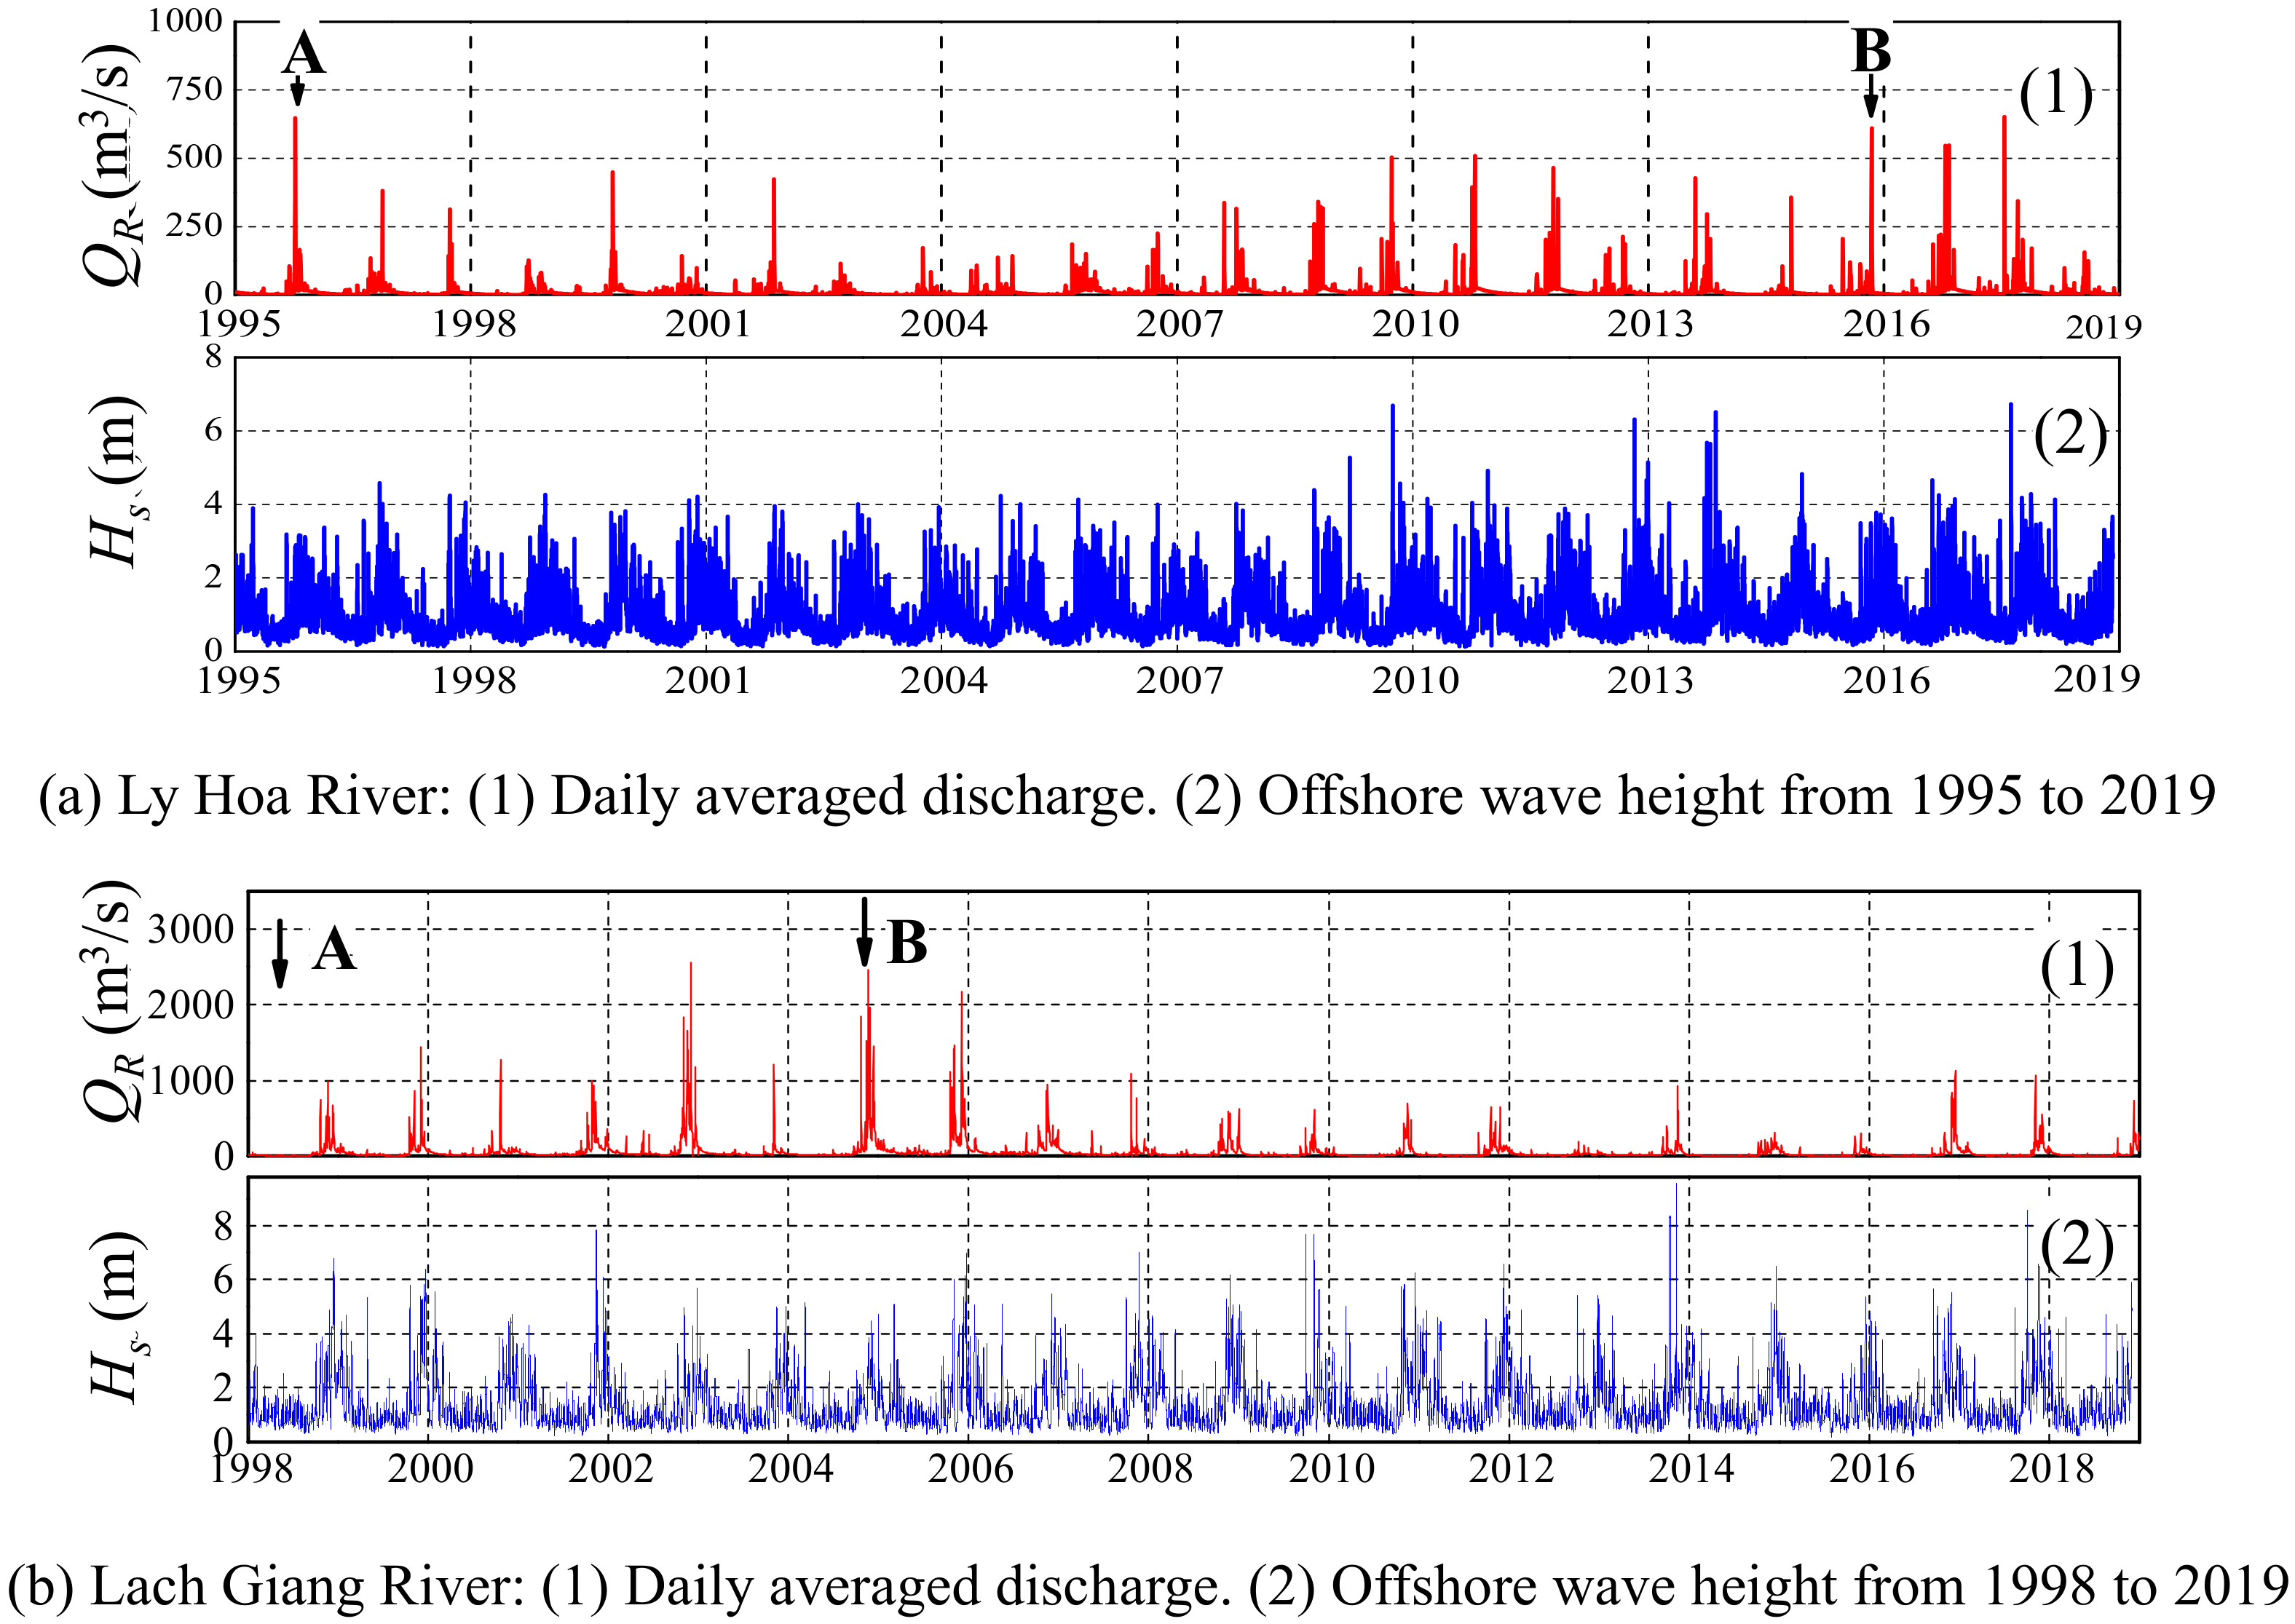
2.2. Data Collections
2.3. Image Rectification and Shoreline Extraction Methods
2.4. Longshore Sediment Transport Rates Estimation Method
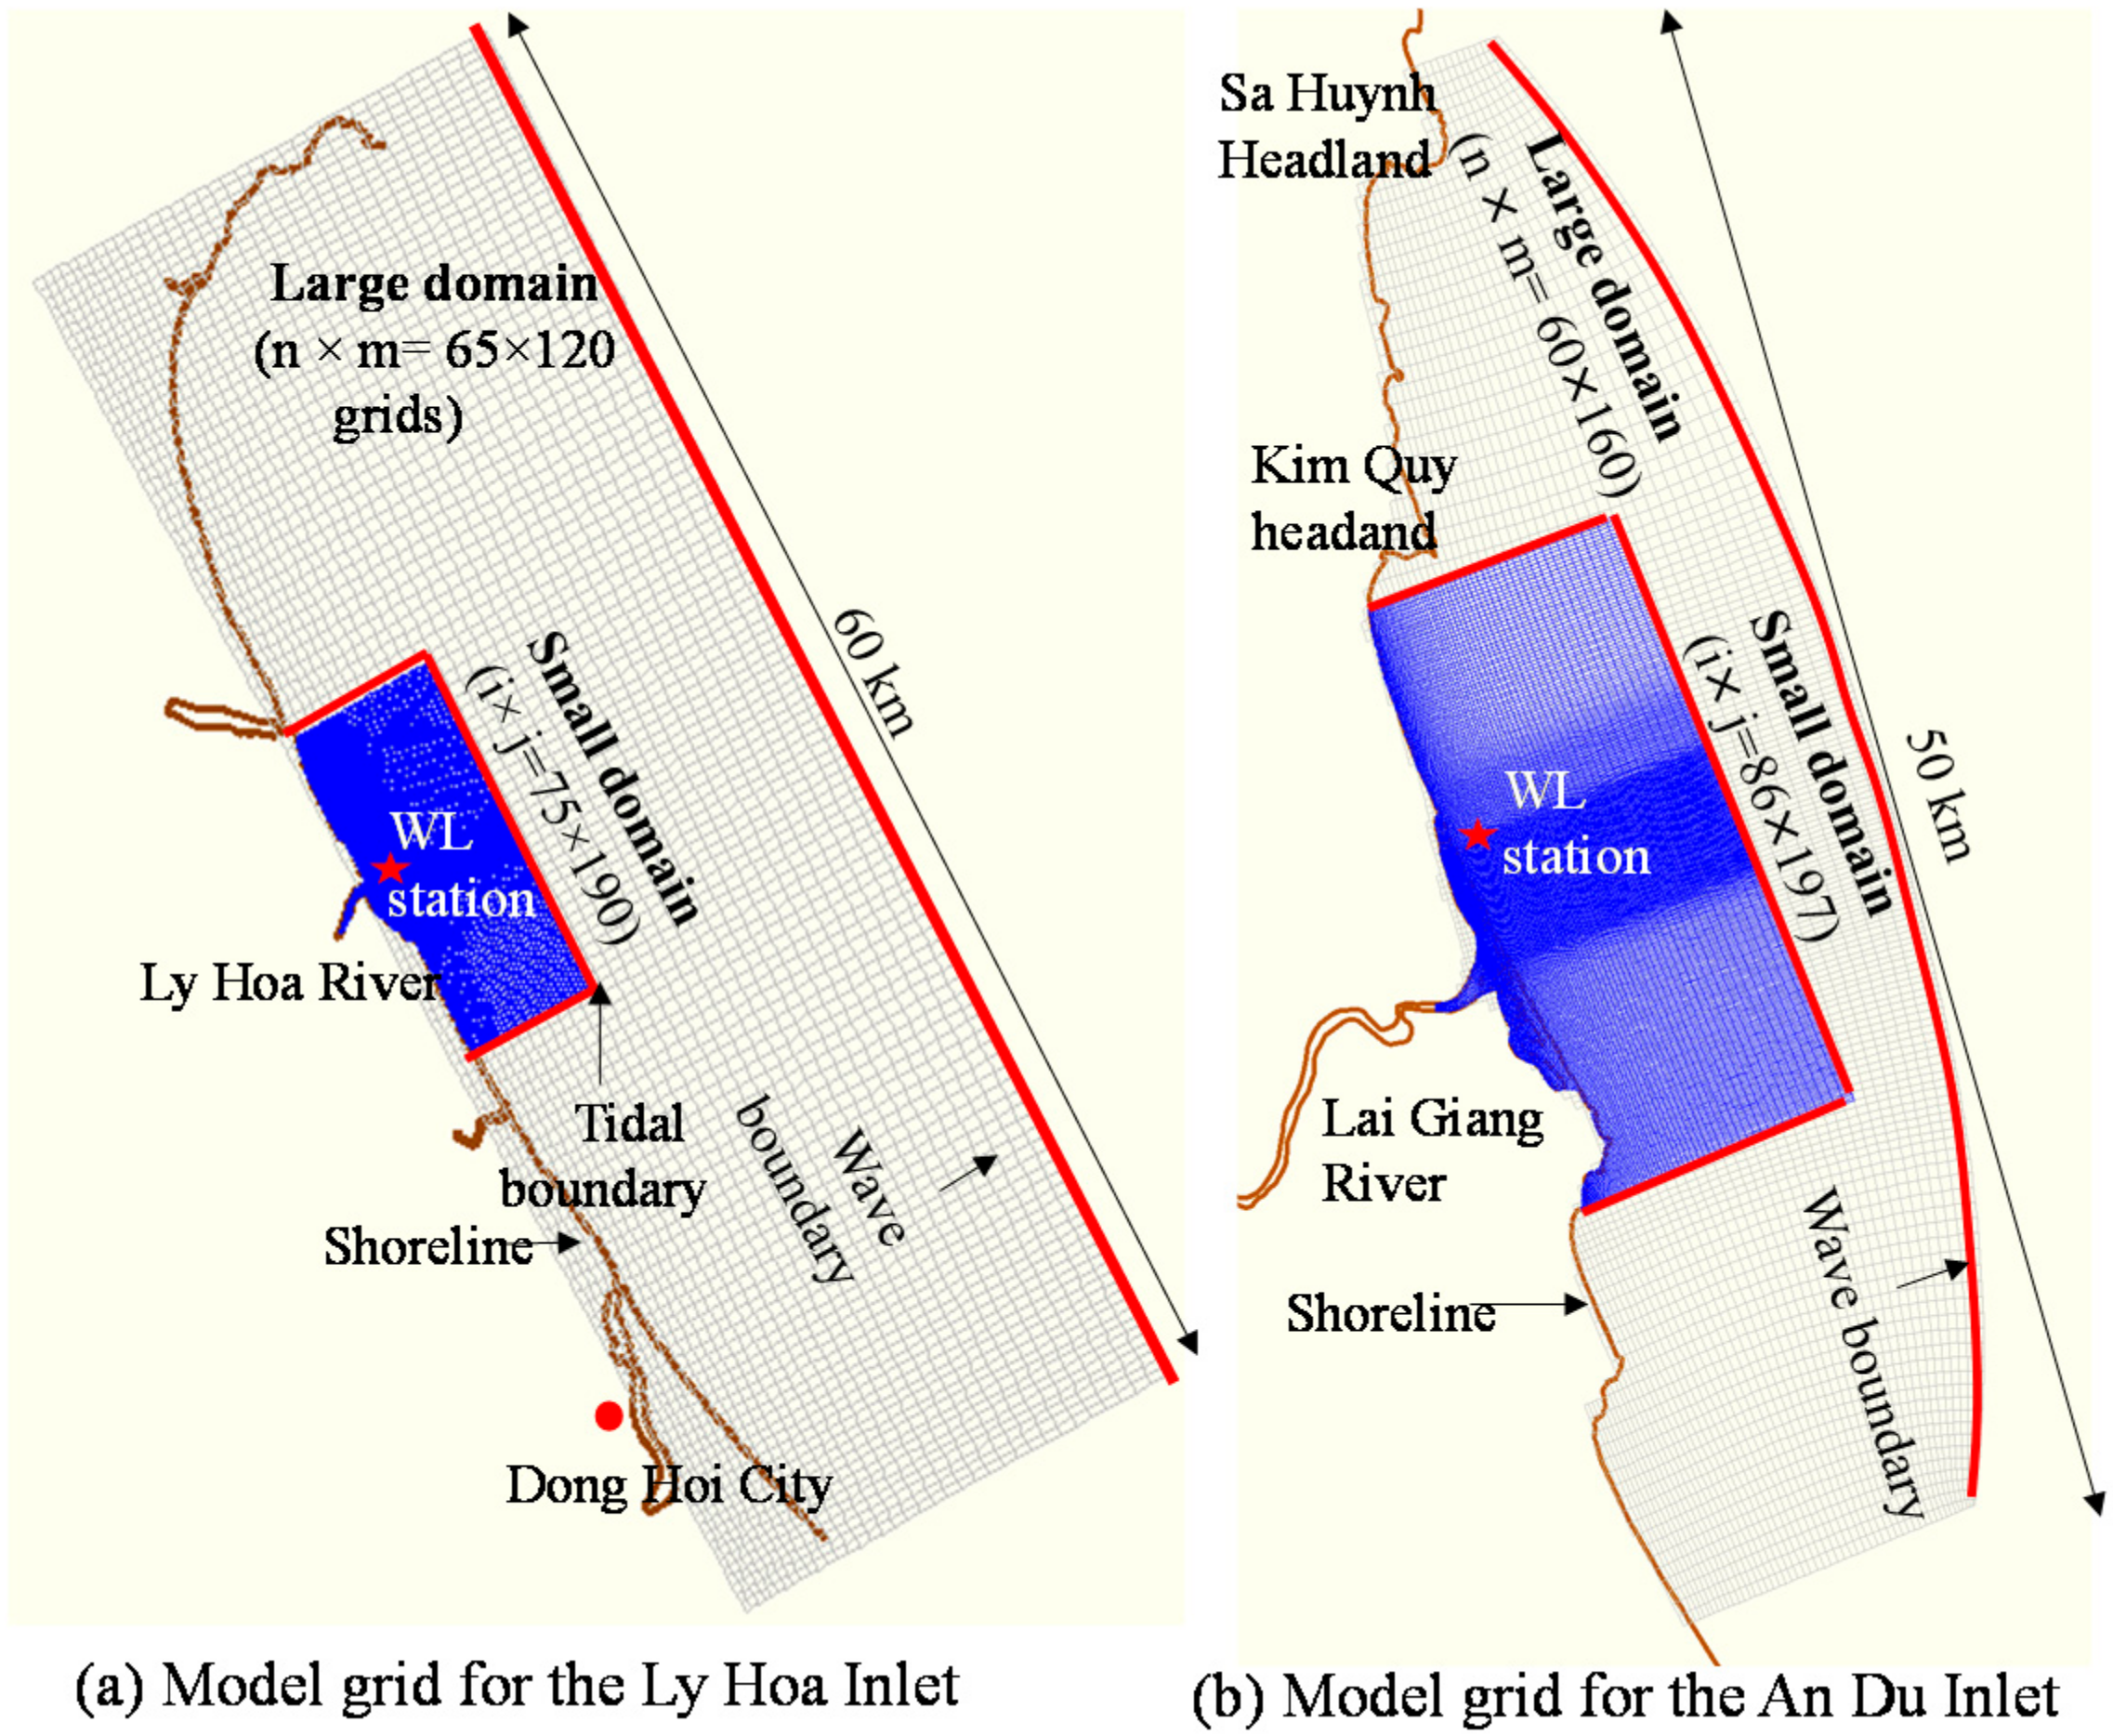
2.5. Numerical Simulation Method
3. Sand Spit Evolution at Ly Hoa Inlet and An Du Inlet
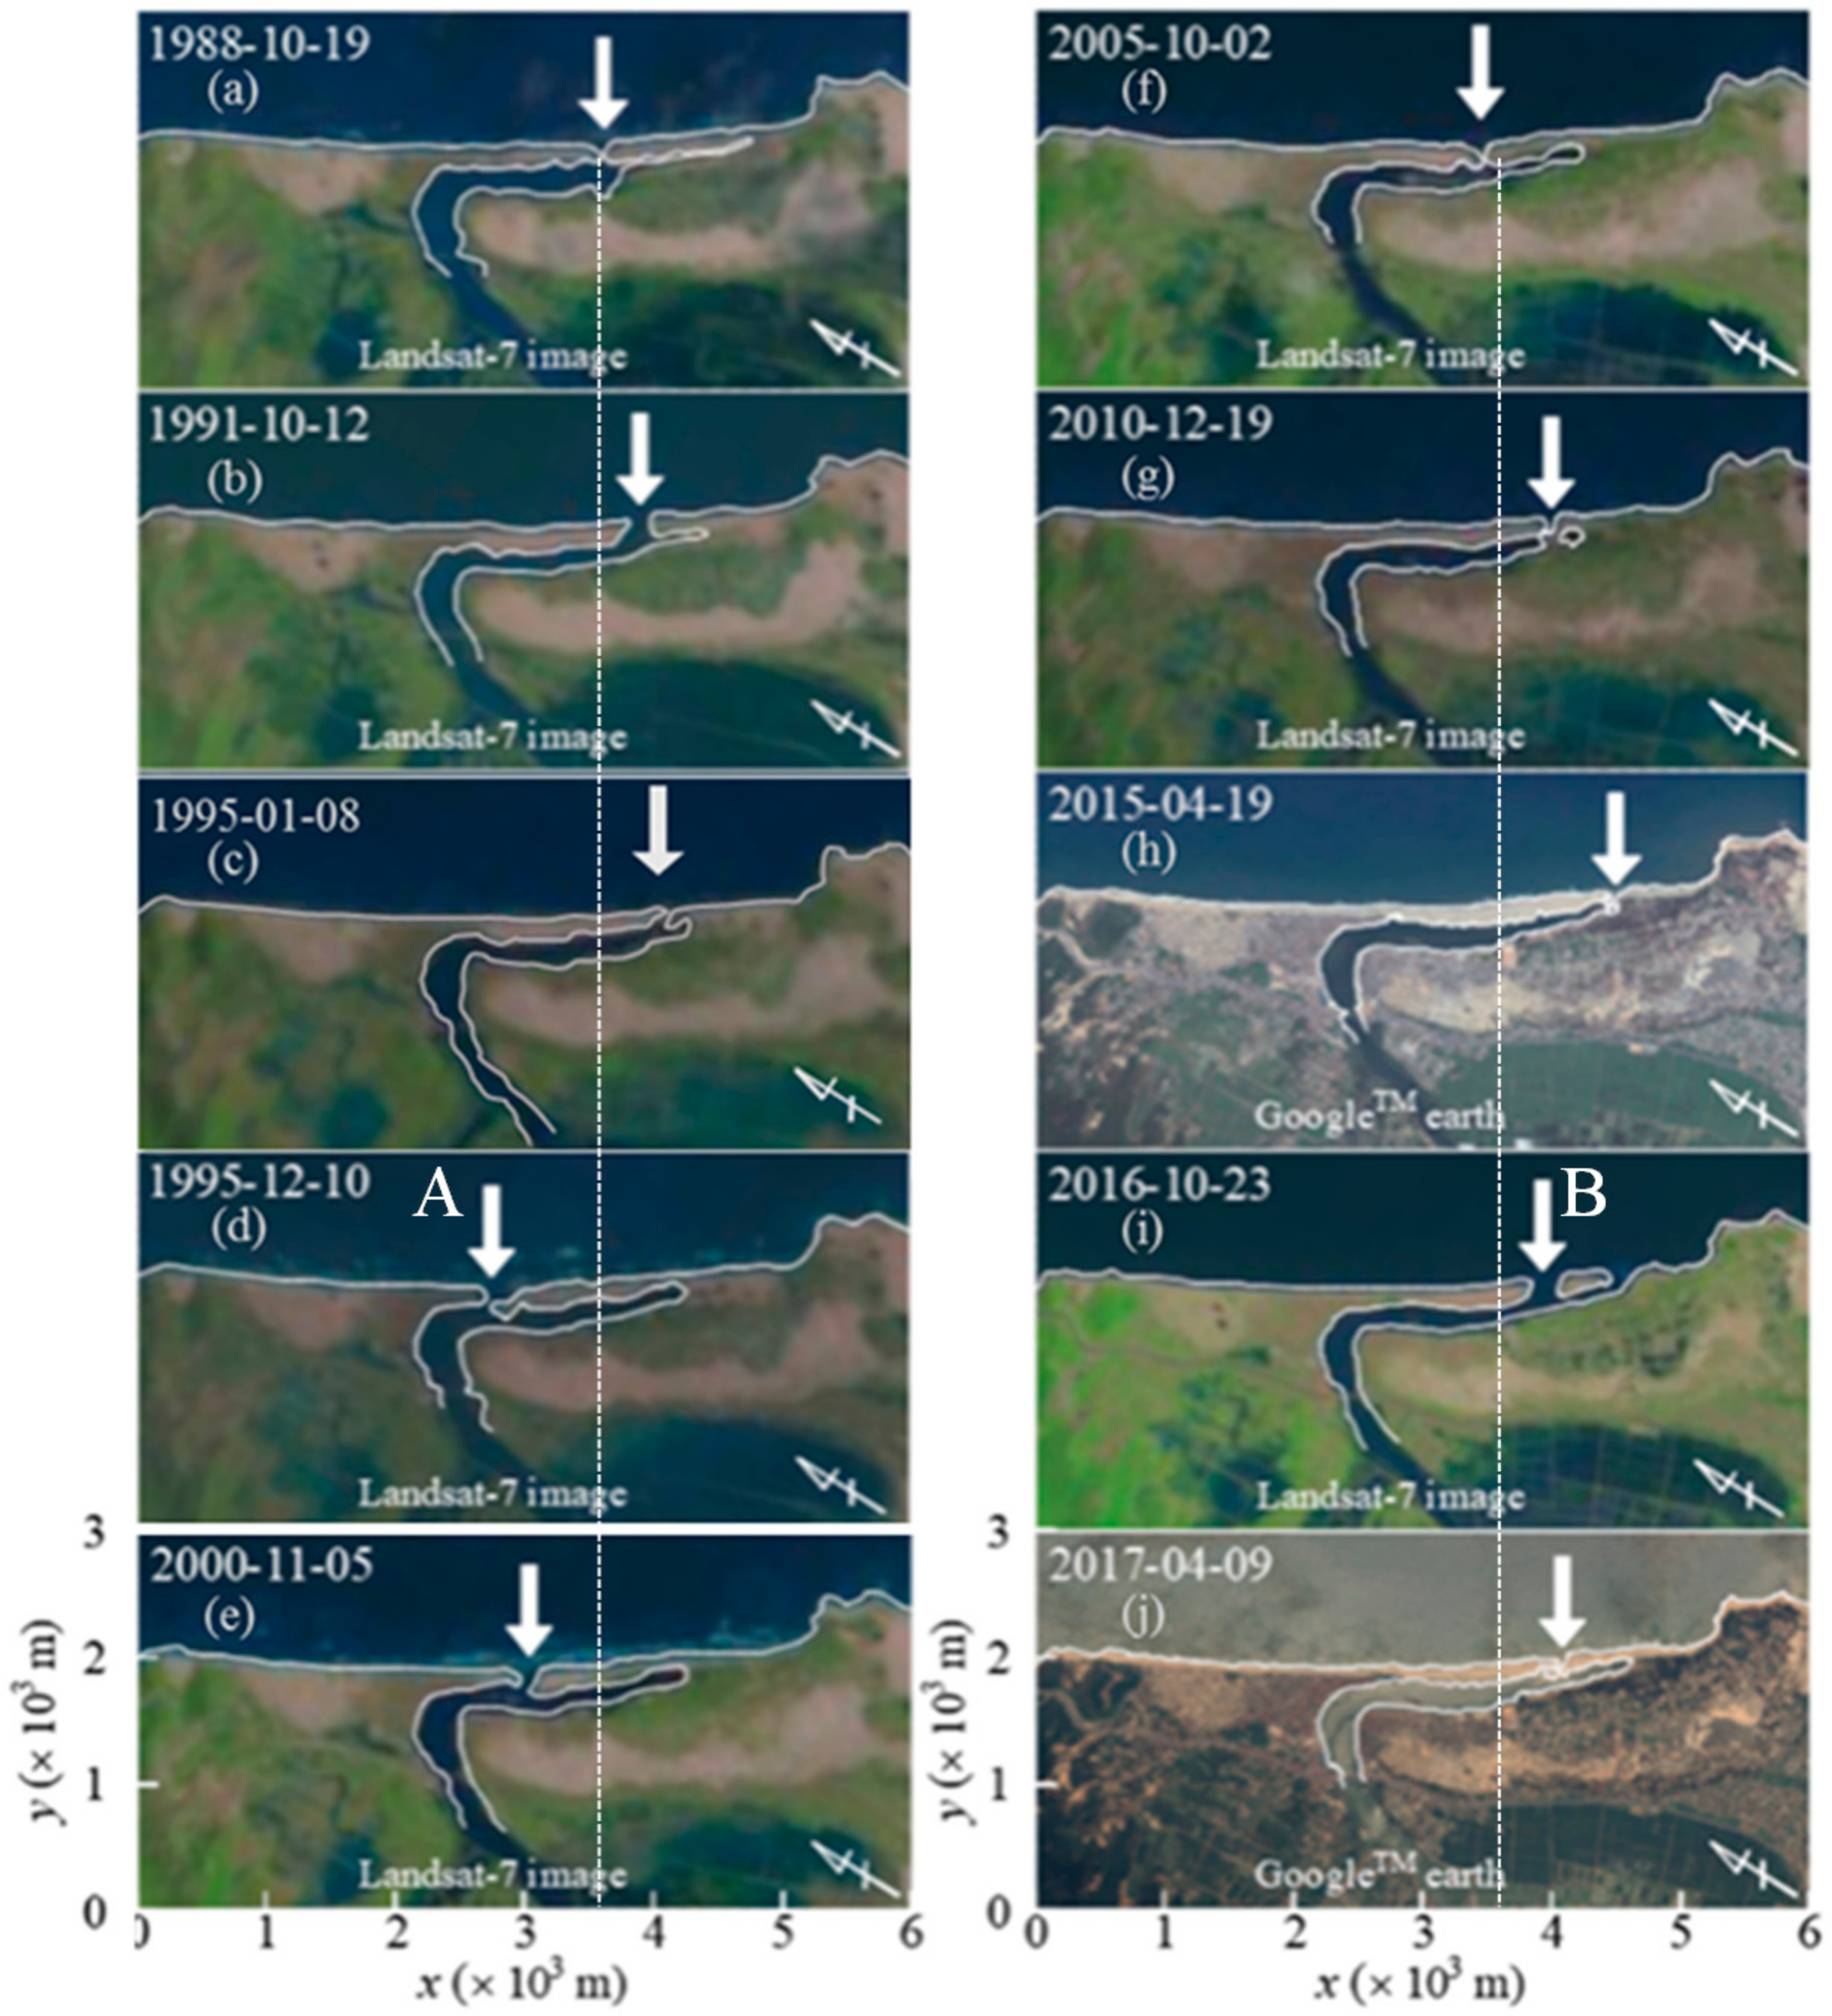
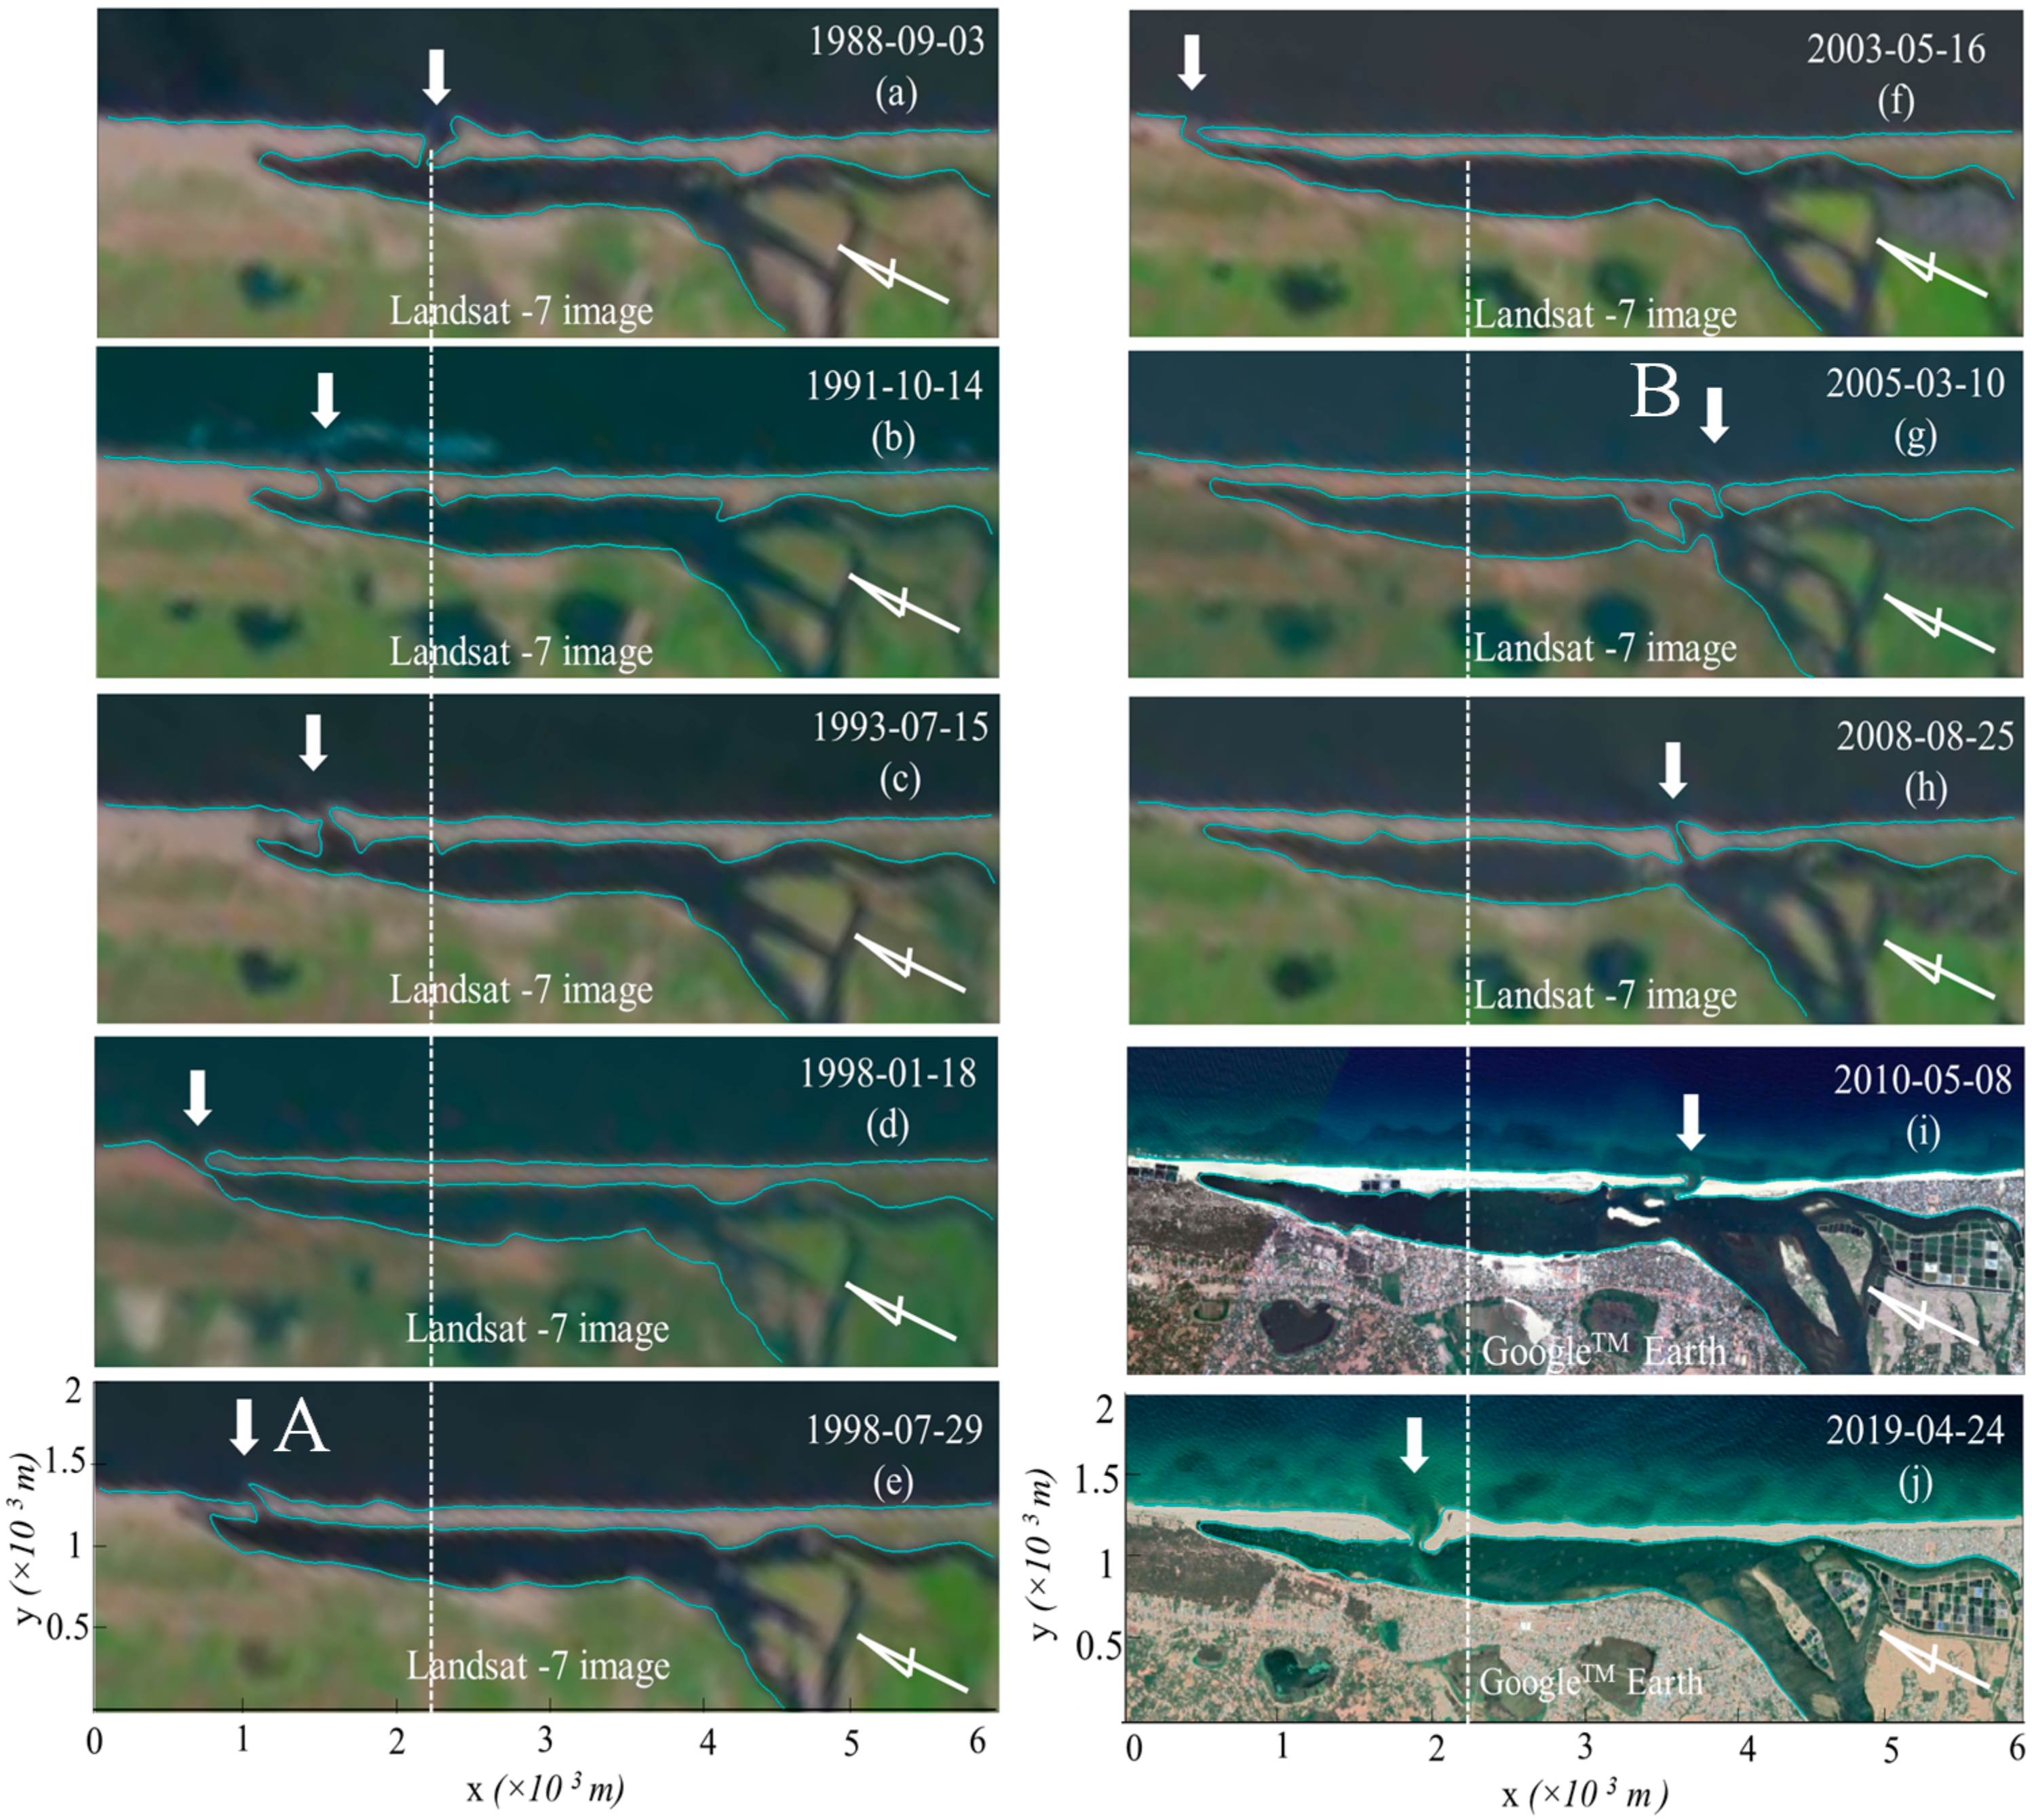
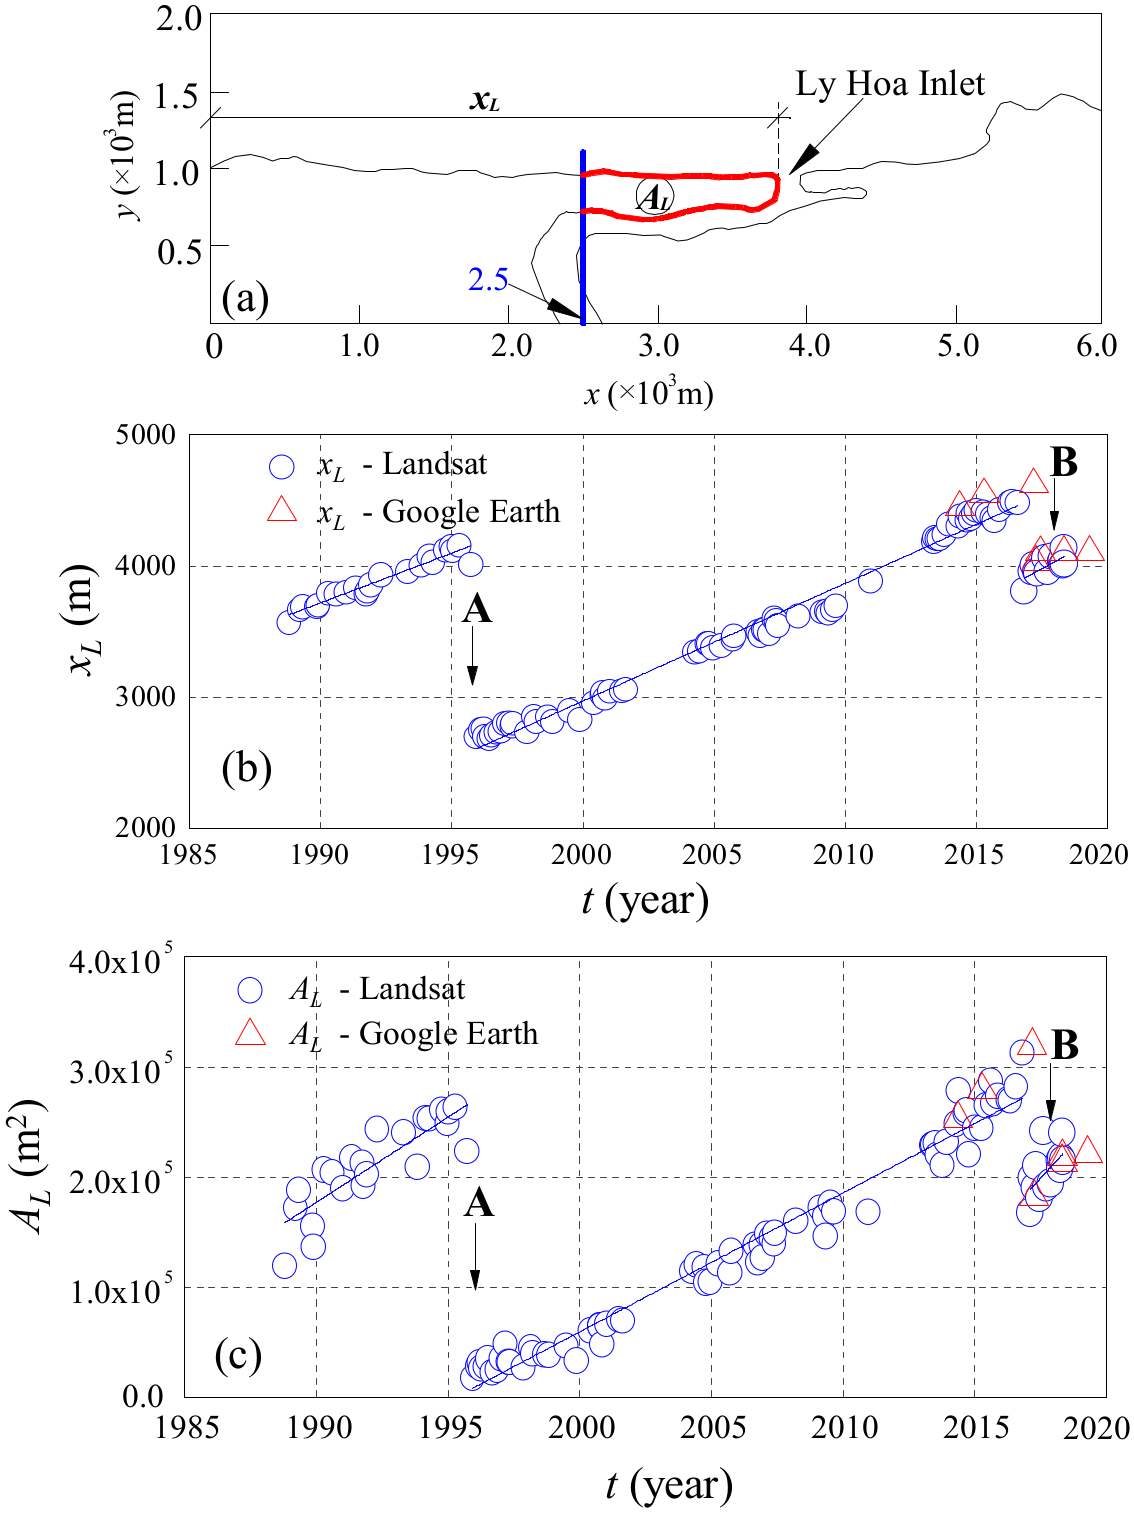
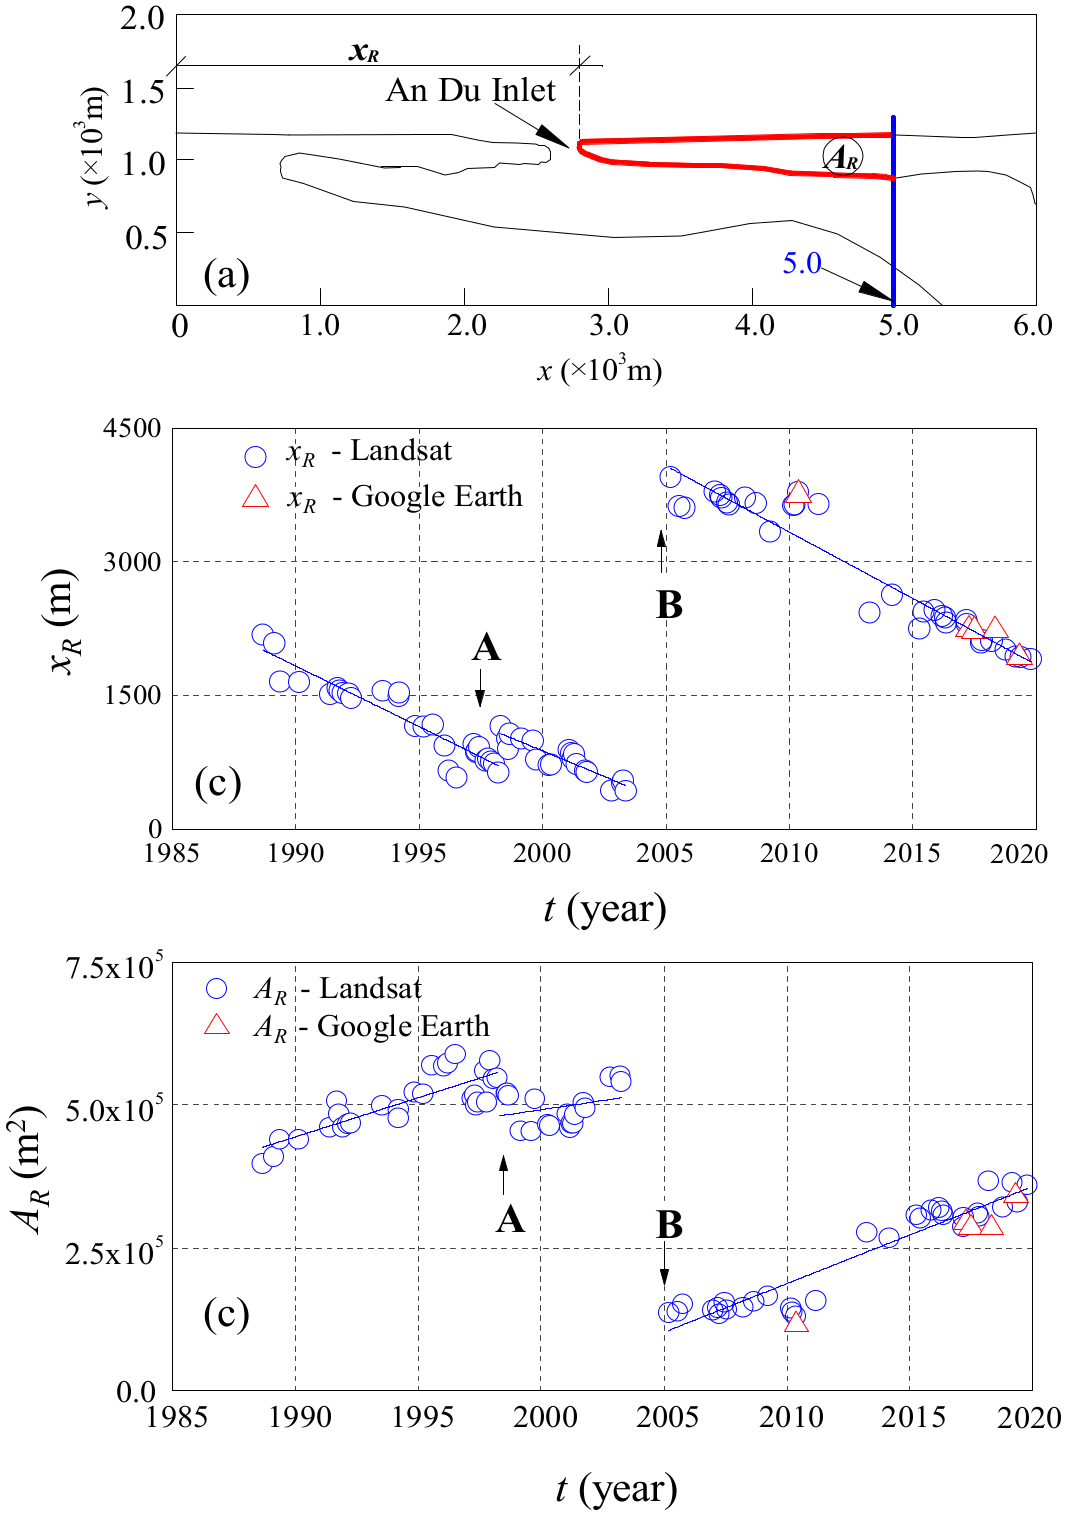
3.1. Long-Term Morphological Changes in the Ly Hoa Inlet and An Du Inlet by Satellite Image Analysis
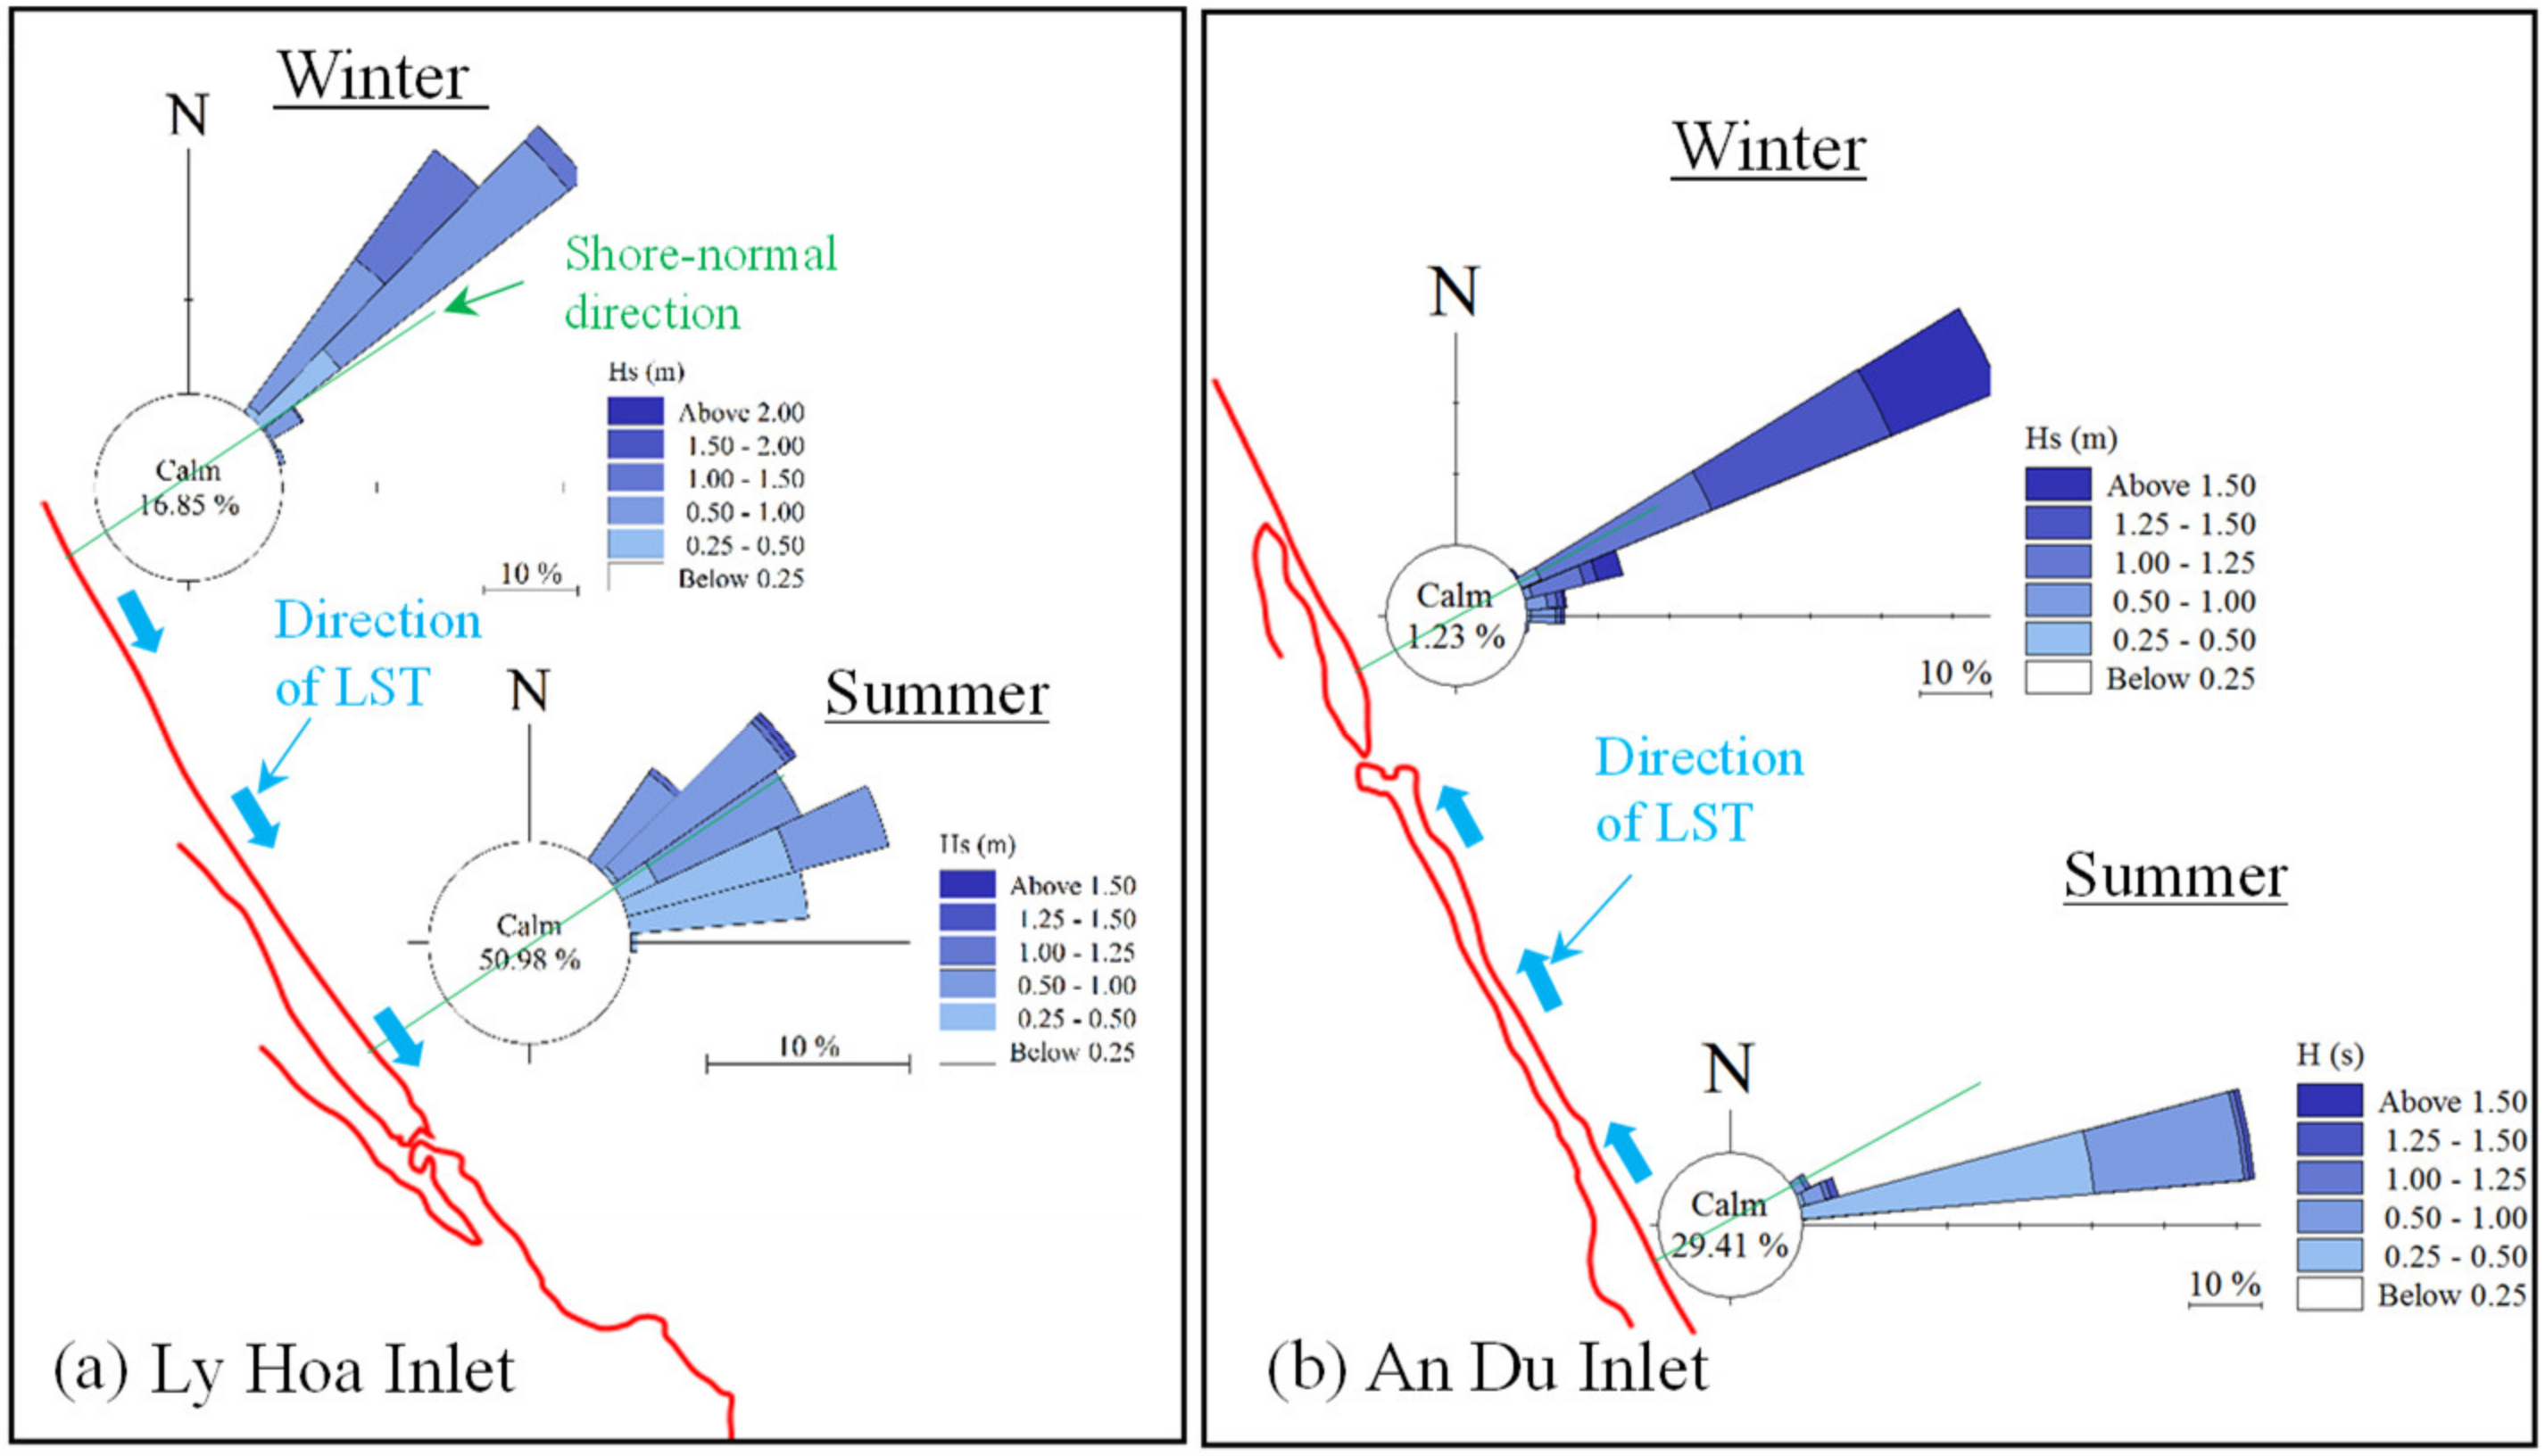
3.2. Evaluation of the Longshore Sediment Transport Rate at the Ly Hoa Inlet and An Du Inlet by Satellite Images
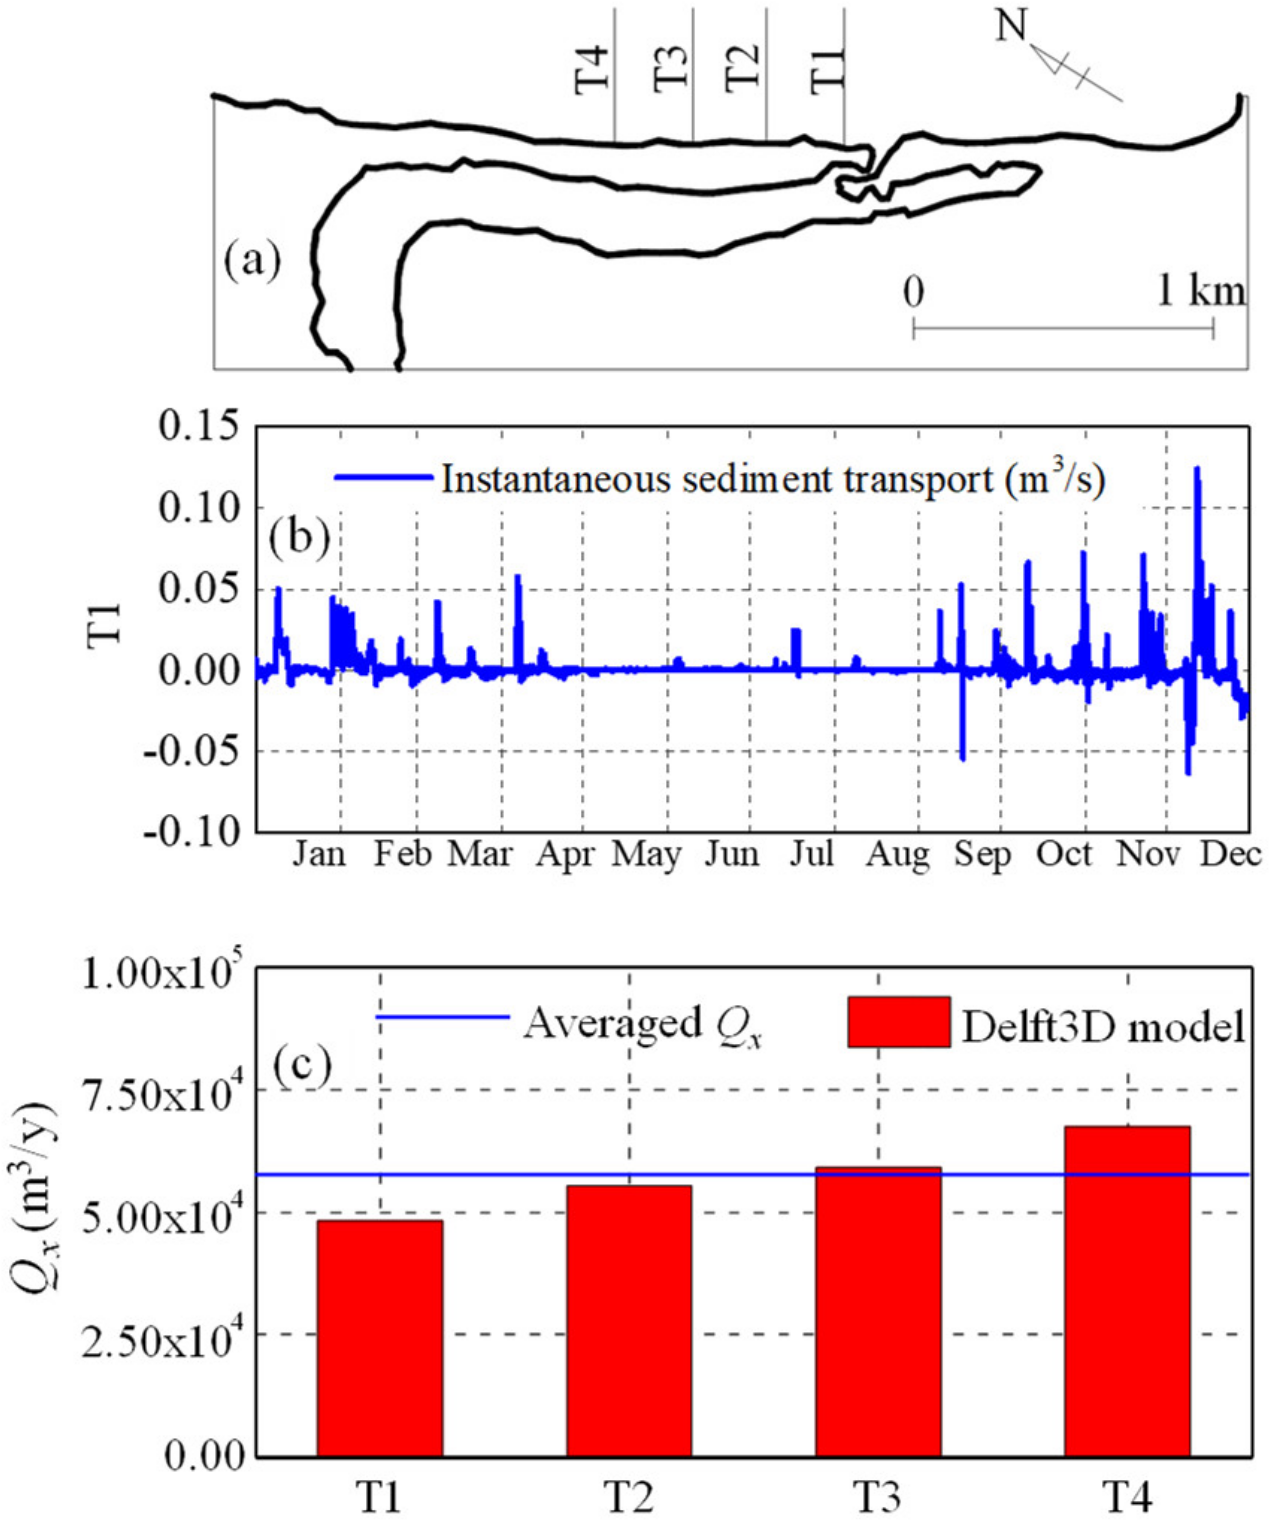
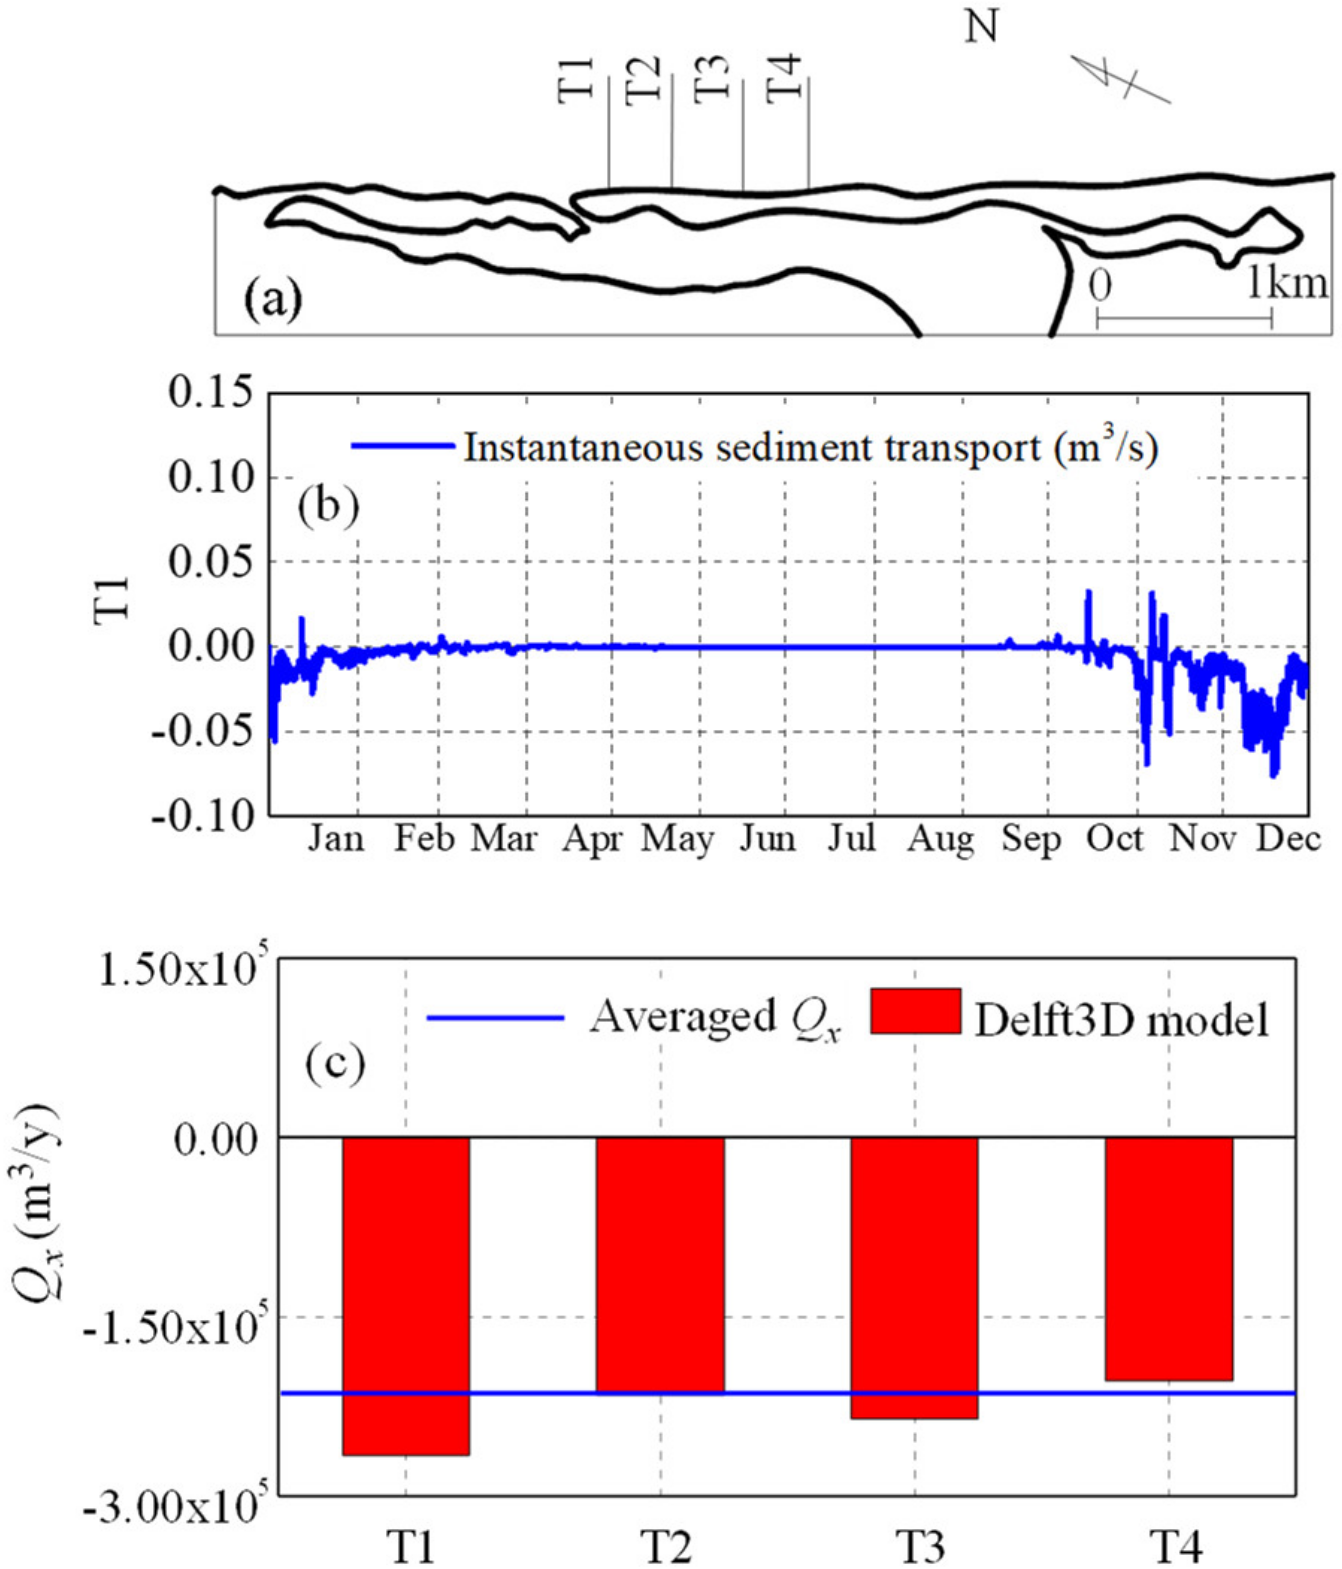
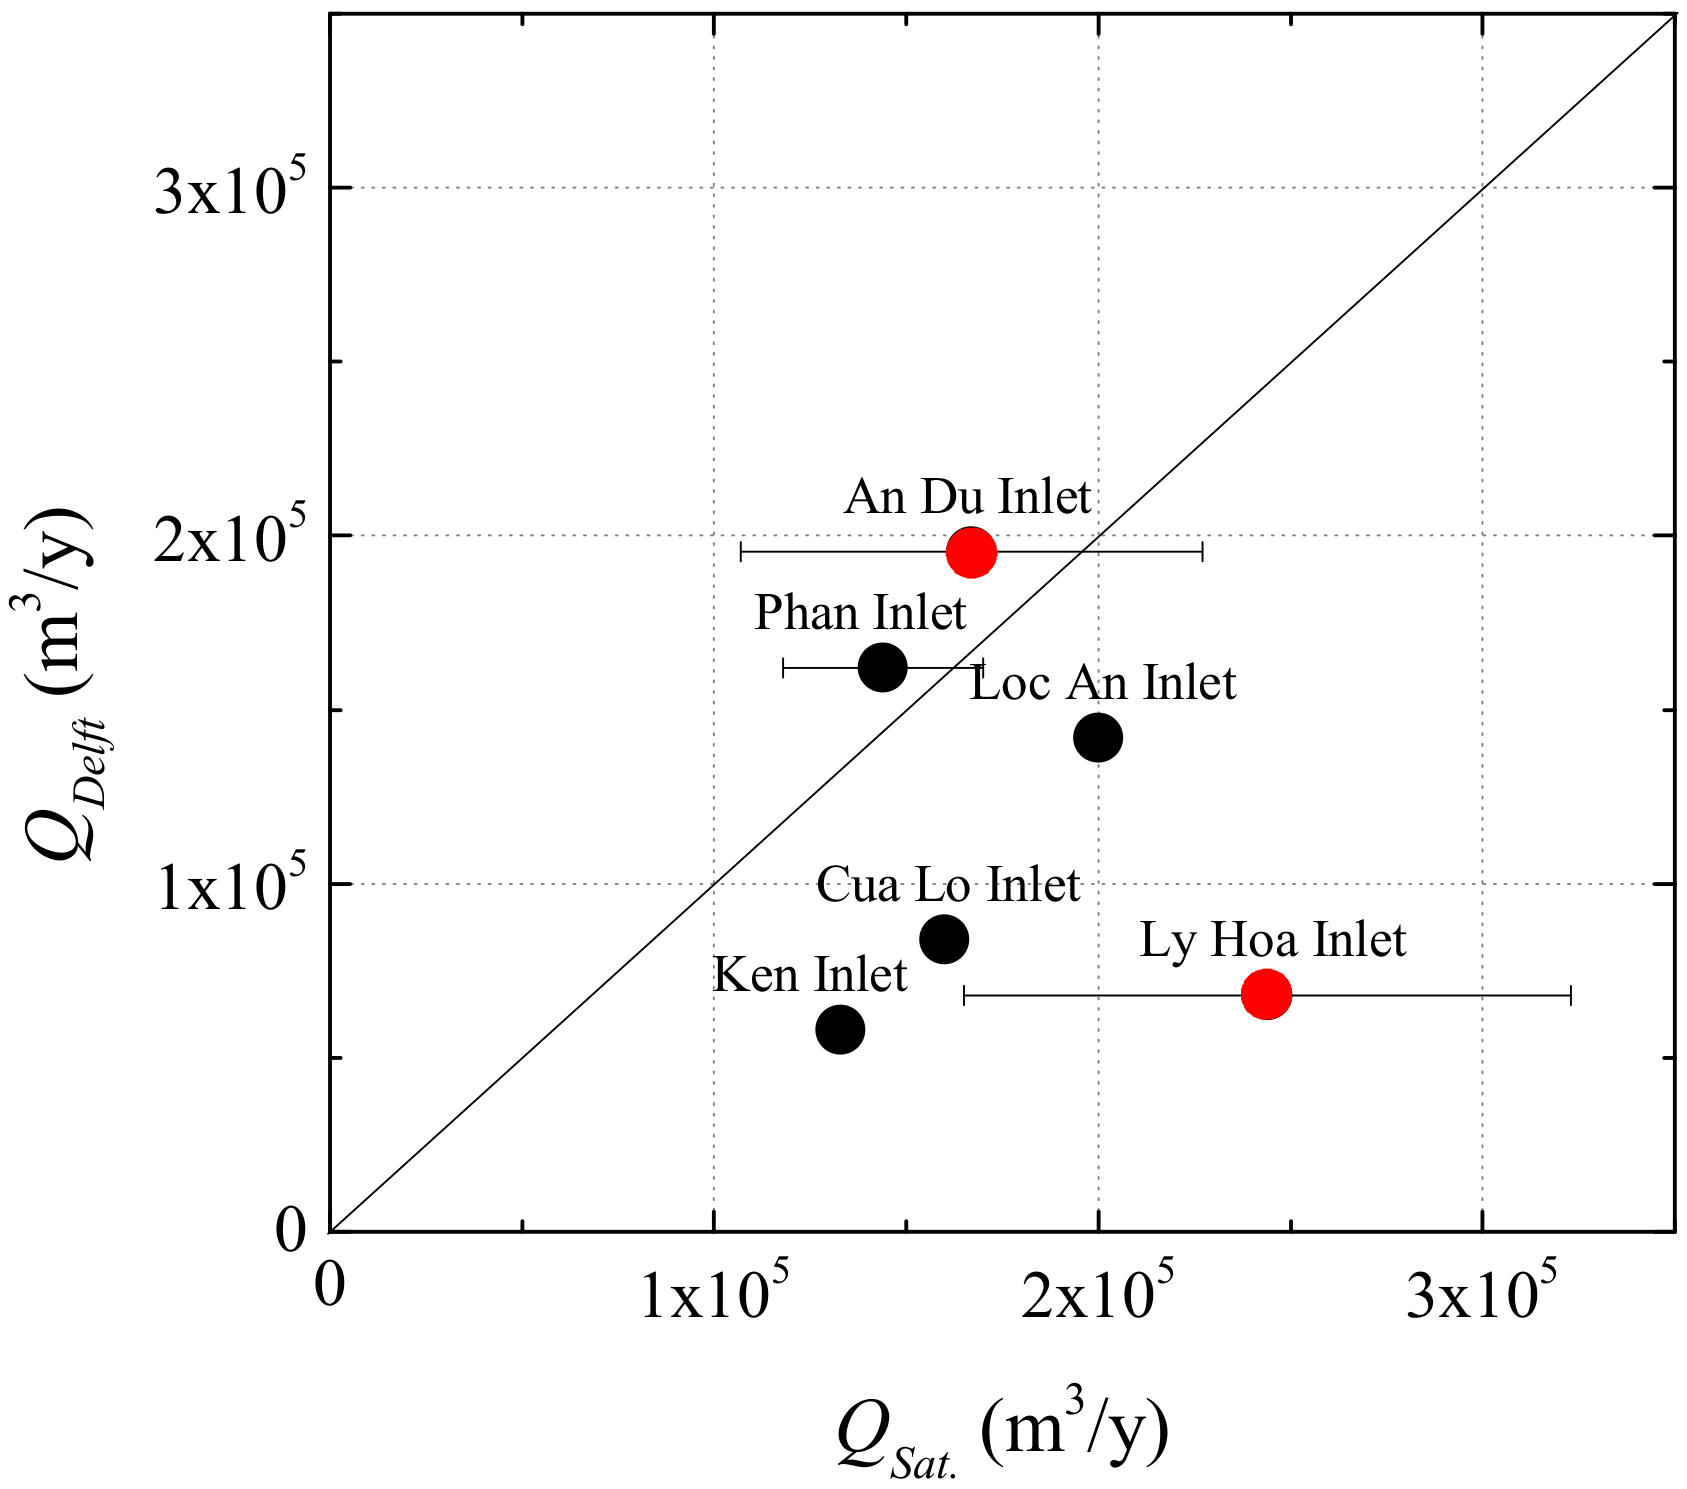
3.3. Evaluation of the Longshore Sediment Transport Rate at the Ly Hoa Inlet and An Du Inlet by the Delft3D Numerical Model
4. Comprehensive Study on the Sand Spit Evolution at Tidal Inlets in the Central Coast of Vietnam
4.1. Summary of Study Sites
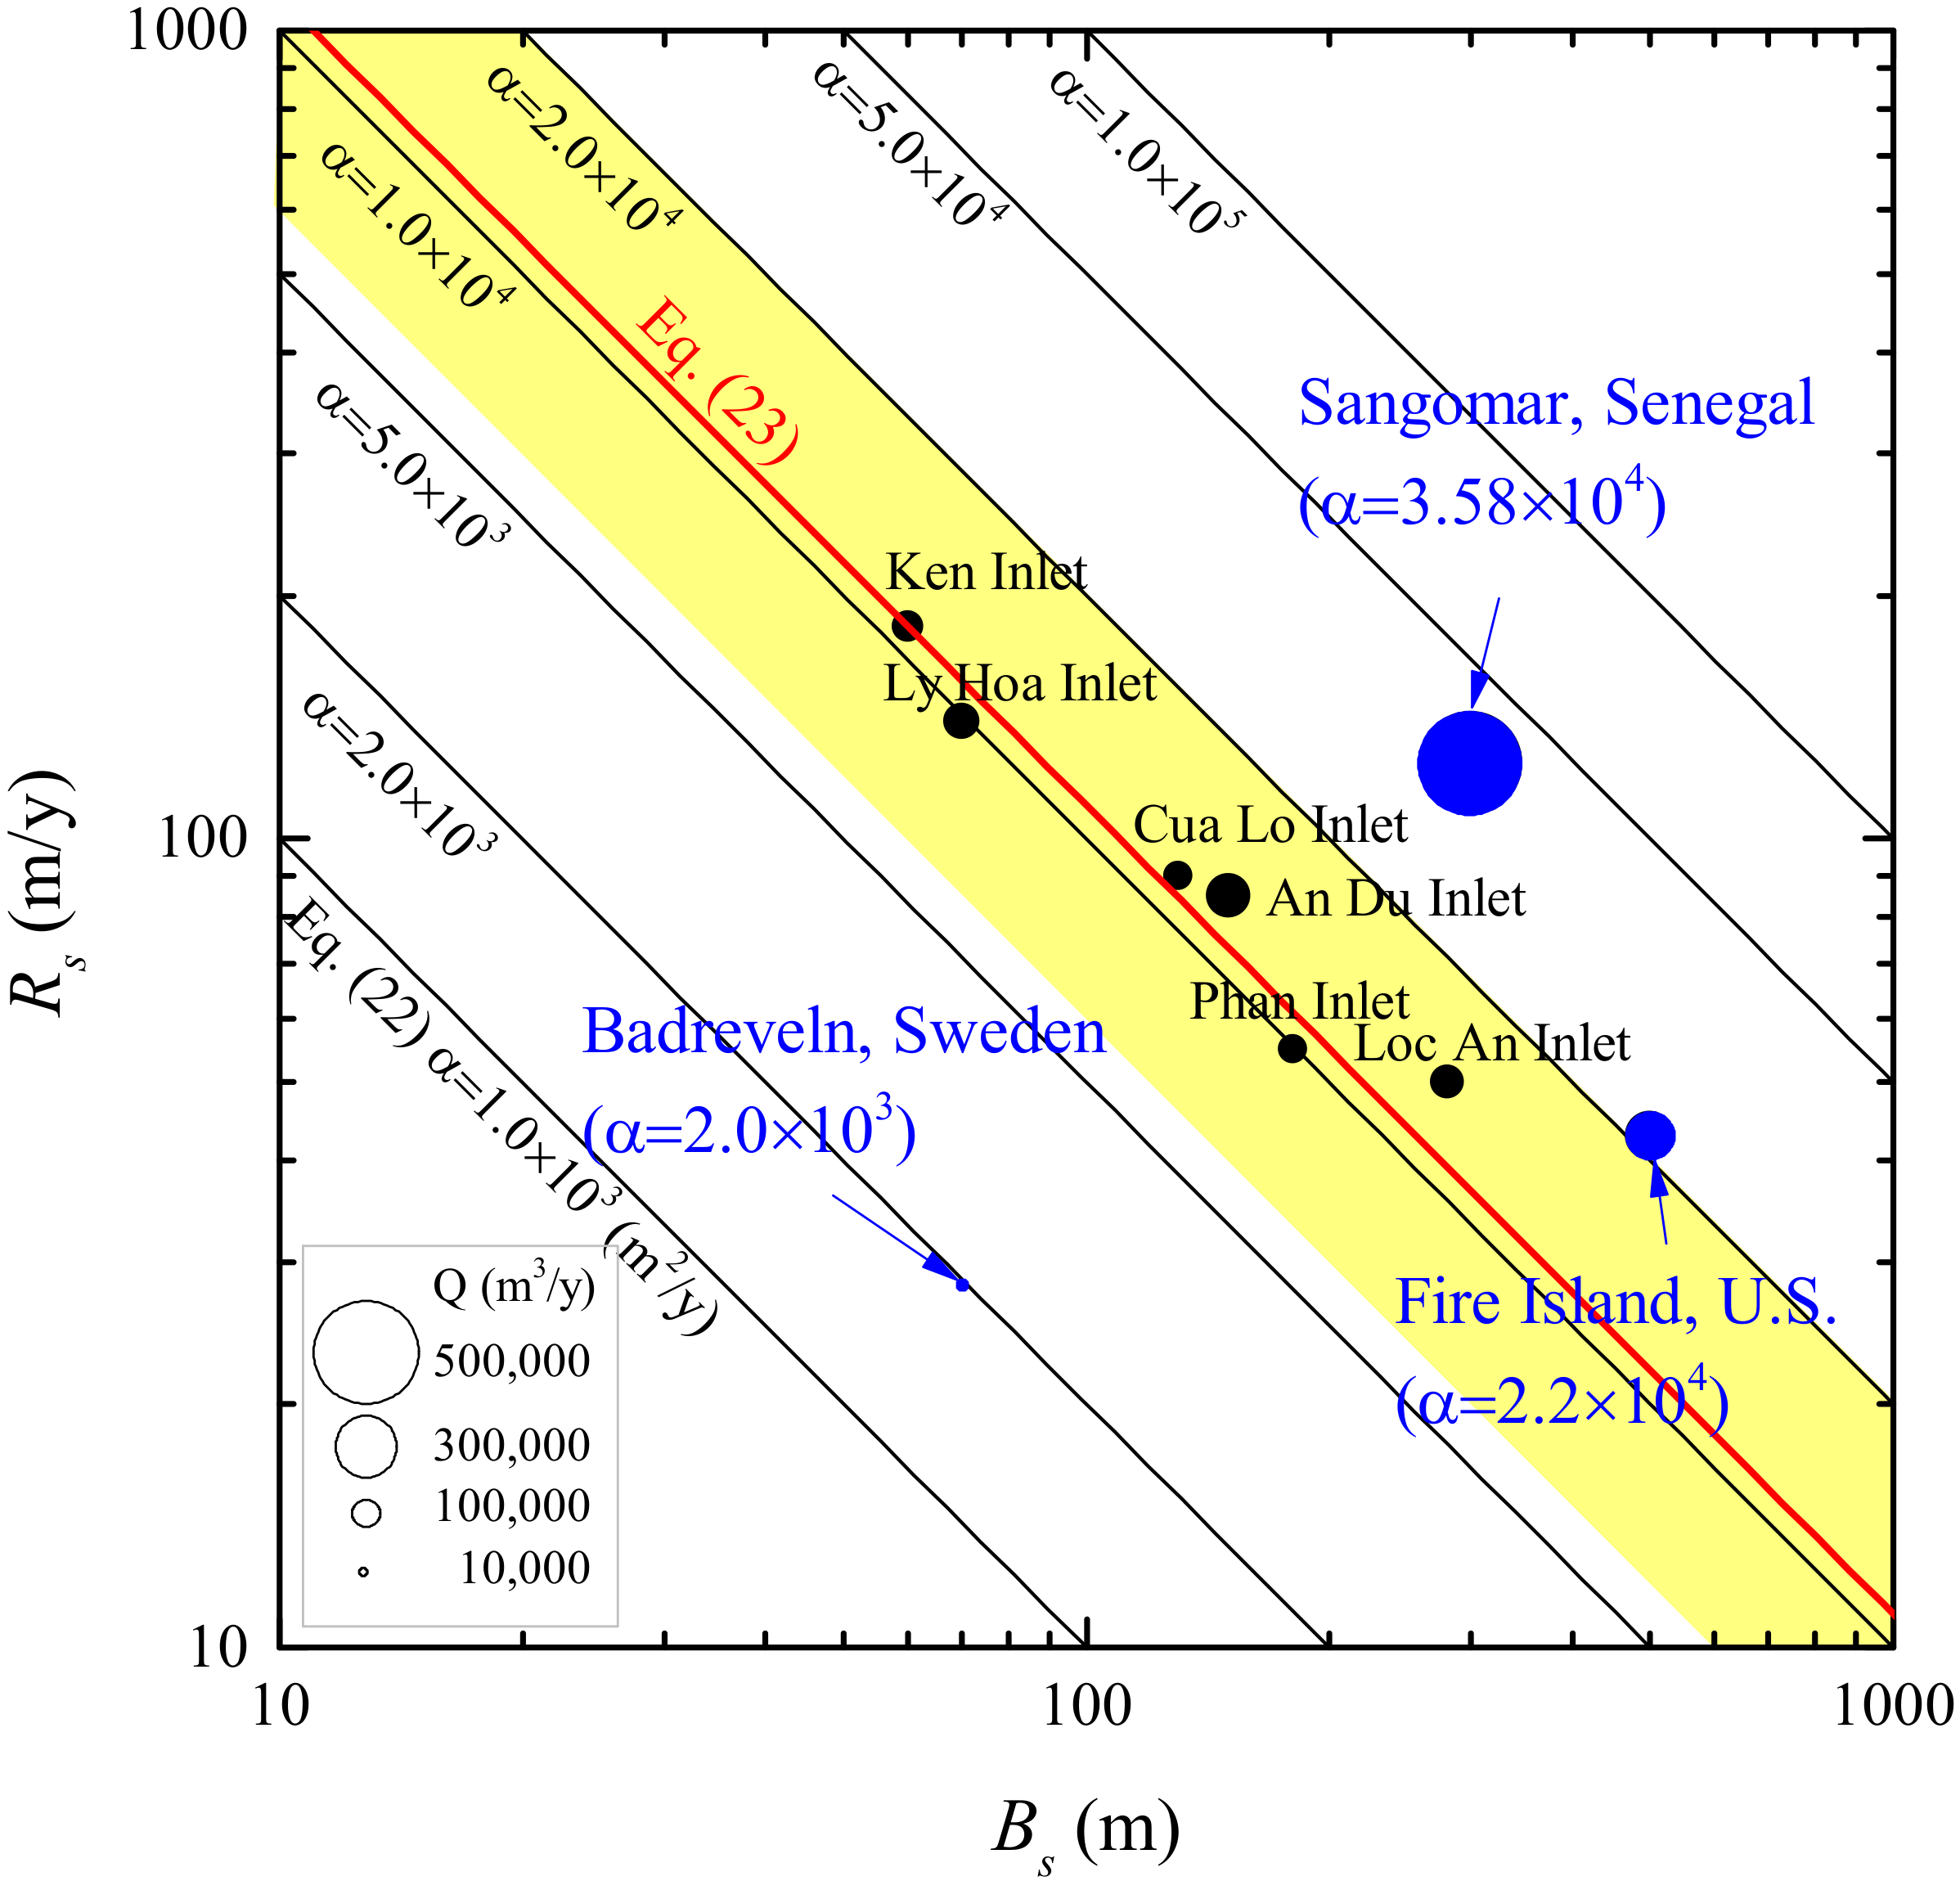
4.2. Estimation of the Sand Spit Growth Rate
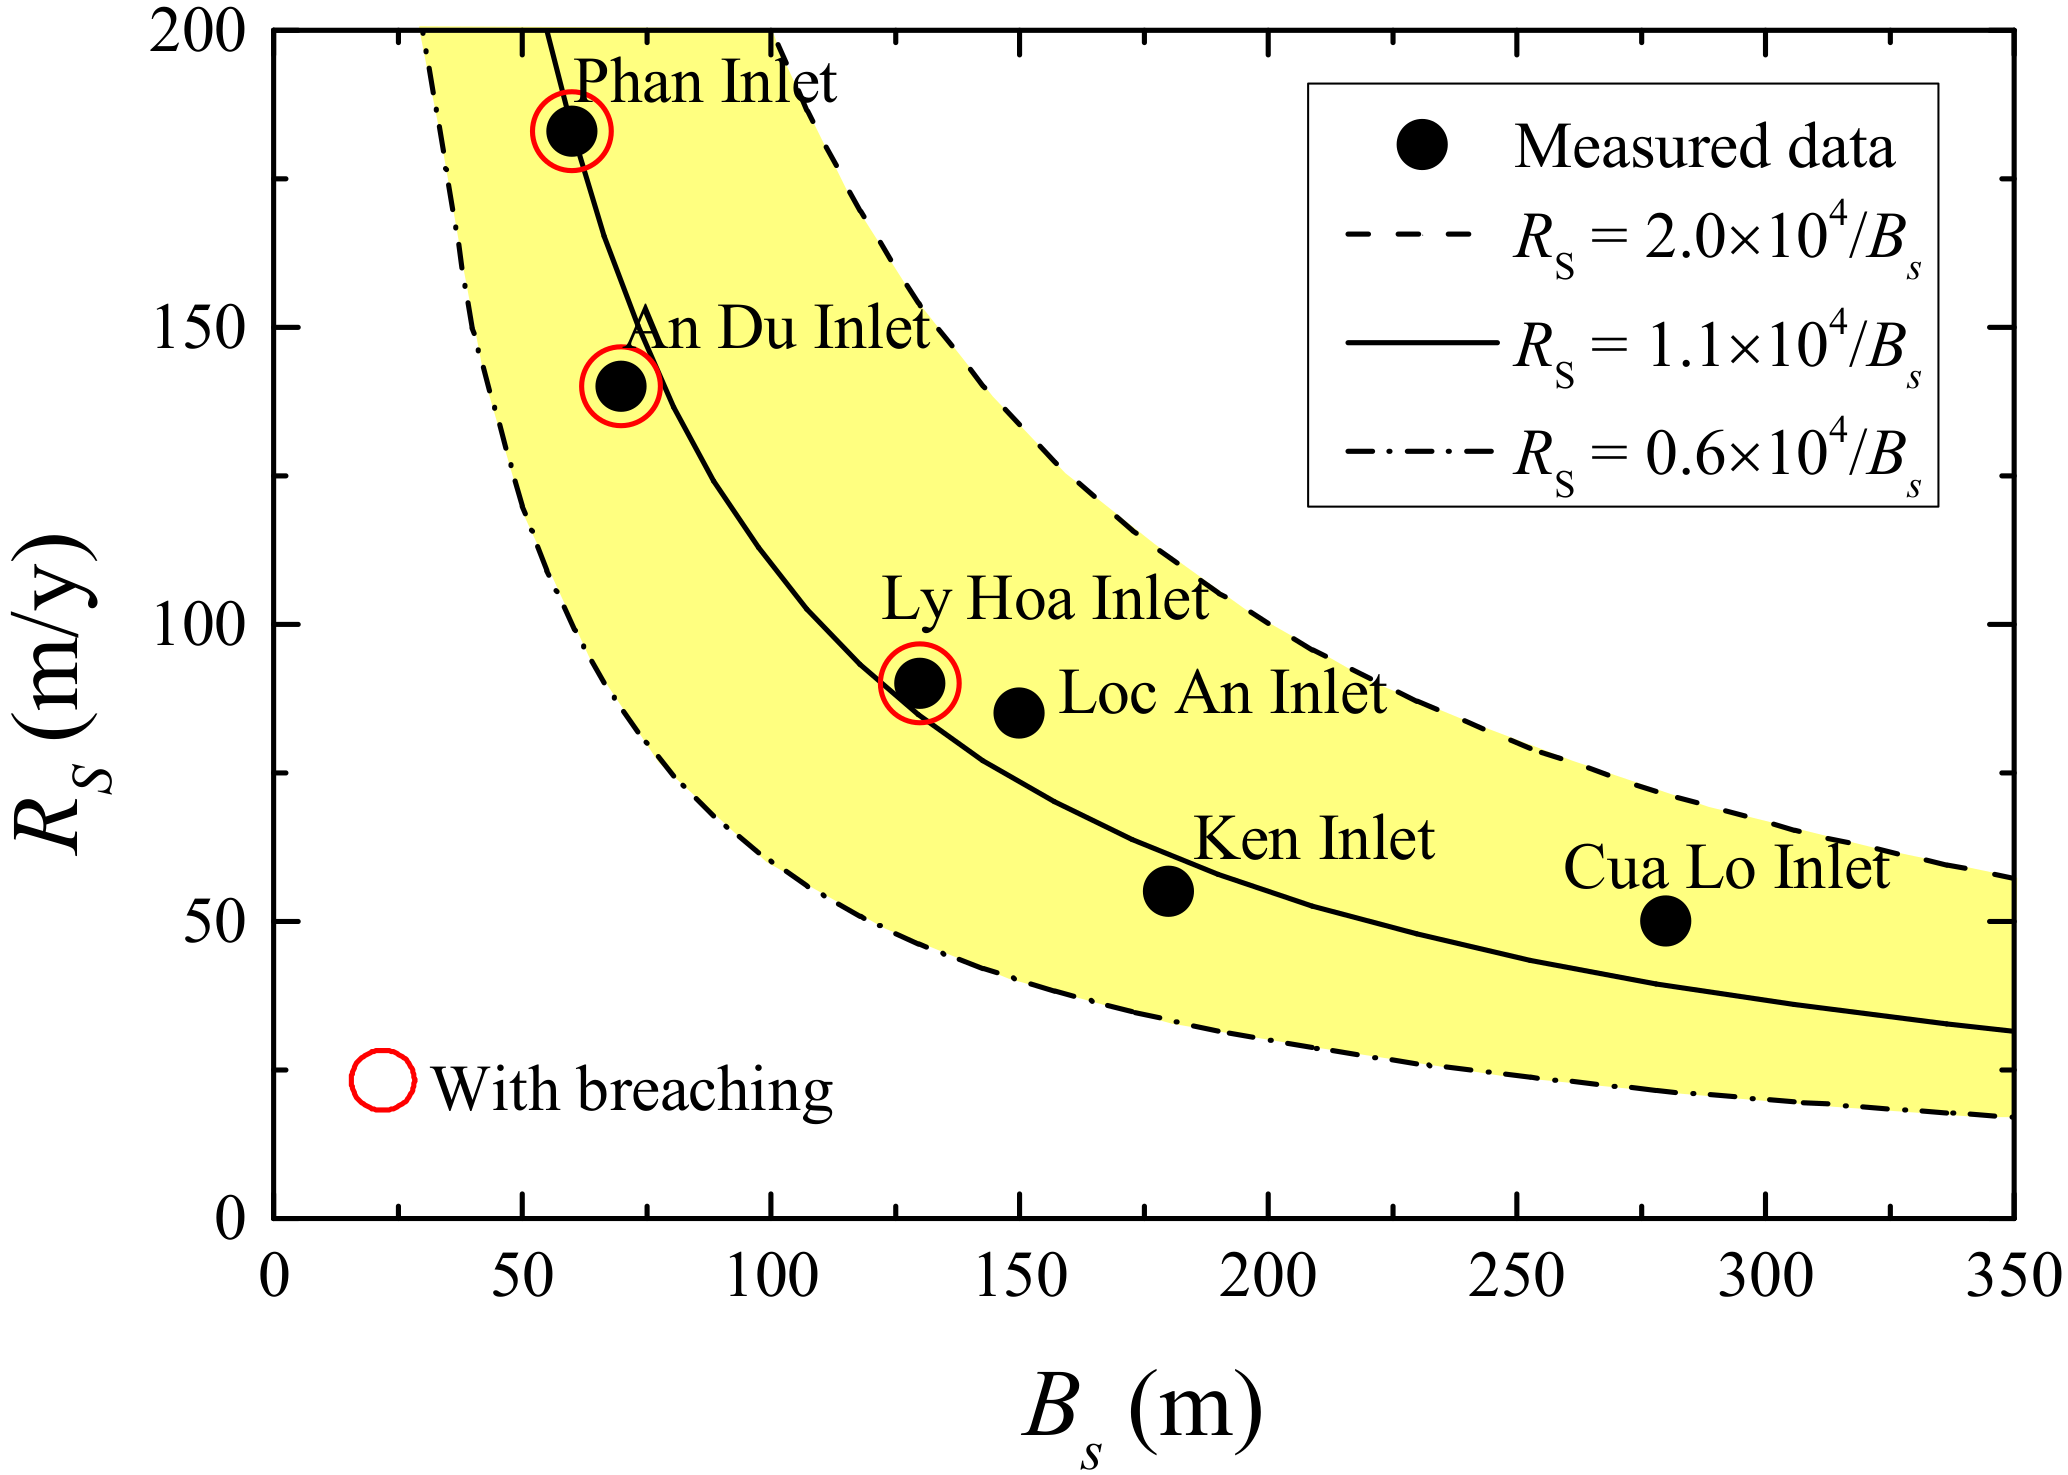
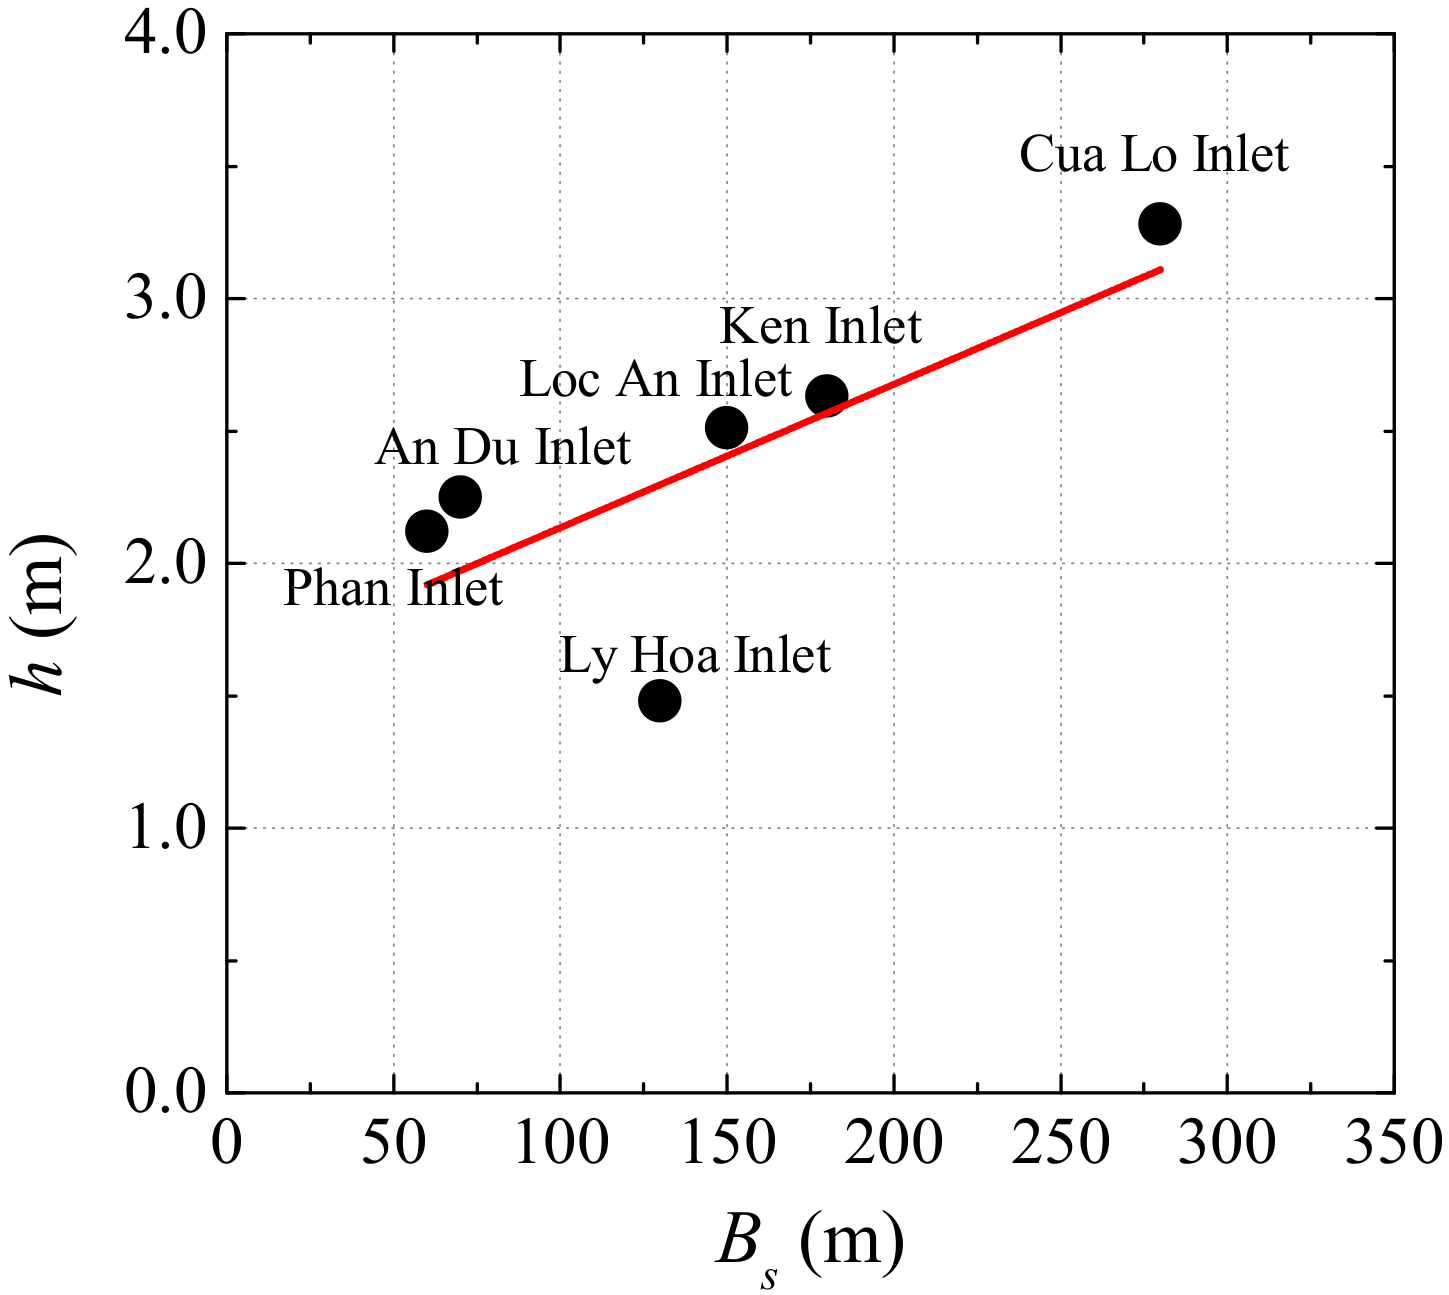
4.3. Relationship of the Sand Spit Width and Inlet Water Depth
5. Conclusions
Author Contributions
Funding
Acknowledgments
Conflicts of Interest
References
- Pradhan, U.; Mishra, P.; Mohanty, P.K.; Behera, B. Formation, growth and variability of sand spit at Rushikulya River Mouth, South Odisha Coast, India. In Proceedings of the 8th International Conference on Asian and Pacific Coasts (APAC), Chennai, India, 7–10 September 2015; Volume 116, pp. 963–970. [Google Scholar]
- Allard, J.; Bertin, X.; Chaumillon, E.; Pouget, F. Sand spit rhythmic development: A potential record of wave climate variations? Arçay Spit, western coast of France. Mar. Geol. 2008, 253, 107–131. [Google Scholar]
- Tribe, H.M. The Geomorphology of Farewell Spit and Its Sensitivity to Sea-level Rise. Master’s Thesis, School of Geography, Environment and Earth Sciences, Victoria University of Wellington, Wellington, New Zealand, June 2008. [Google Scholar]
- Stancheva, M.; Ratas, U.; Orviku, K.; Palazov, A.; Rivis, R.; Kont, A.; Peychev, V.; Tõnisson, H.; Stanchev, H. Sand dune destruction due to increased human impacts along the Bulgarian Black Sea and Estonian Baltic Sea Coasts. J. Coast. Res. 2011, 64, 6. [Google Scholar]
- Aubrey, D.G.; Gaines, A.G. Rapid formation and degradation of barrier spits in areas with low rates of littoral drift. Mar. Geol. 1982, 49, 257–277. [Google Scholar] [CrossRef]
- Cayocca, F. Long-term morphological modelling of a tidal inlet: The Arcachon Basin, France. Coast. Eng. 2001, 42, 115–142. [Google Scholar] [CrossRef]
- McNinch, J.E.; Brodie, K.L.; Slocum, R.K. Radar Inlet Observing System (RIOS): Continuous remote sensing of waves, currents, and bathymetry at tidal inlets. Oceans 2012, 1, 14–19. [Google Scholar]
- Sutherland, W.; Pullin, A.; Dolman, P.; Knight, T. The need for evidence based conservation. Trends Ecol. Evol. 2004, 19, 305–308. [Google Scholar] [CrossRef]
- van Rijn, L.C.; Walstra, D.J.R.; Grasmeijer, B.; Sutherland, J.; Pan, S.; Sierra, J.P. The predictability of cross-shore bed evolution of sandy beaches at the time scale of storms and seasons using process-based profile models. Coast. Eng. 2003, 47, 295–327. [Google Scholar] [CrossRef]
- Ridderinkhof, W.; de Swart, H.E.; van der Vegt, M.; Hoekstra, P. Modeling the growth and migration of sandy shoals on ebb-tidal deltas. J. Geophys. Res. Earth Surf. 2016, 121, 1351–1372. [Google Scholar]
- Tung, T.T.; Walstra, D.R.; van de Graaff, J.; Stive, M.J.F. Morphological modeling of tidal inlet migration and closure. J. Coast. Res. 2009, SI56, 1080–1084. [Google Scholar]
- Tinh, N.X.; Thanh, T.M.; Tanaka, H.; Viet, N.T.; Dien, D.C.; Mitobe, Y. Numerical investigation of seasonal variation of depth of closure and shoreline change. Intl. J. Sed. Res. 2020, in press. [Google Scholar]
- Benveniste, J.; Cazenave, A.; Vignudelli, S.; Fenoglio-Marc, L.; Shah, R.; Almar, R.; Andersen, O.; Birol, F.; Bonnefond, P.; Bouffard, J.; et al. Requirements for a coastal hazards observing system. Front. Mar. Sci. J. 2019, 6, 348. [Google Scholar]
- Rogowski, P.; de Paolo, T.; Terrill, E.; McNinch, J. X-band radar mapping of morphological changes at a dynamic coastal inlet. J. Geophys. Res. Earth Surf. 2018, 123, 3034–3054. [Google Scholar] [CrossRef]
- Honegger, D.A.; Haller, M.C.; Holman, R.A. High-resolution bathymetry estimates via X-band marine radar: 2. Effects of currents at tidal inlets. Coast. Eng. 2020, 156, 103626. [Google Scholar]
- Duc Anh, N.Q.; Tanaka, H.; Tinh, N.X.; Viet, N.T. Sand spit morphological evolution at tidal inlets by using satellite images analysis: Two case studies in Vietnam. J. Sci. Tech. Civil. Eng. 2020, 14, 17–31. [Google Scholar]
- Duc Anh, N.Q.; Duy, D.V.; Tanaka, H.; Viet, N.T. Elongation of sand spit at the Loc An river mouth, Southern Vietnam. J. JSCE Ser.B3 (Ocean Eng.) 2018, 74, I_695–I_700. [Google Scholar] [CrossRef] [Green Version]
- Besset, M.; Anthony, E.J.; Brunier, G.; Dussouillez, P. Shoreline change of the Mekong River delta along the southern part of the South China Sea coast using satellite image analysis (1973–2014). Géomorph. Relief Processus Environ. 2016, 22, 137–146. [Google Scholar] [CrossRef]
- Hung, N.M.; Larson, M. Coastline and river mouth evolution in the central part of the Red River Delta. In Coastal Disasters and Climate Change in Vietnam—Engineering and Planning Perspectives; Thao, N.D., Takagi, H., Esteban, M., Eds.; Elsevier Inc.: Amsterdam, The Netherlands, 2014; pp. 43–79. [Google Scholar]
- Duy, D.V.; Tanaka, H.; Mitobe, Y.; Duc Anh, N.Q.; Viet, N.T. Sand spit elongation and sediment balance at Cua Lo inlet in Central Vietnam. J. Coast. Res. 2018, 81, 32–39. [Google Scholar]
- Teodoro, A.C.; Pais-Barbosa, J.; Gonçalves, H.; Veloso-Gomes, F.; Taveira-Pinto, F. Extraction of Cabedelo sand spit area (Douro estuary) from satellite images through image processing techniques. J. Coast. Res. 2011, 64, 1740–1744. [Google Scholar]
- Avinash, K.; Deepika, B.; Jayappa, K.S. Evolution of spit morphology: A case study using a remote sensing and statistical based approach. J. Coast. Cons. 2013, 17, 327–337. [Google Scholar] [CrossRef]
- Dien, D.C.; Hung, N.M. Calibration and verification of a storm wave model in the coastal zones of the East Sea. In Proceedings of the 8th National Conference on Fluid Mechanics, Hanoi, Vietnam, 26–28 July 2006; Volume 8, pp. 25–35. [Google Scholar]
- Goda, Y. Examination of the influence of several factors on longshore current computation with random waves. Coast. Eng. 2006, 53, 157–170. [Google Scholar] [CrossRef]
- Tung, T.T. Morphodynamics of Seasonal Closed Coastal Inlets at the Central Coast of Vietnam. Ph.D. Thesis, Delft University of Technology, Delft, The Netherlands, 2011; 166p. [Google Scholar]
- General Bathymetric Chart of the Oceans (GEBCO). GEBCO_2014 Grid, Version 20141103. Br. Oceanogr. Data Cent., Liverpool, U.K. 2014. Available online: http://www.gebco.net (accessed on 1 June 2019).
- Anders, F.J. Accuracy of shoreline change rates as determined from maps and aerial photographs. Shore Beach 1991, 11, 17–26. [Google Scholar]
- Goshasby, A.A. Theory and Applications of Image Registration; John Wiley & Sons: Hoboken, NJ, USA, 2017; 520p. [Google Scholar]
- Moore, L.J. Shoreline mapping techniques. J. Coast. Res. 2000, 16, 111–124. [Google Scholar]
- Pradjoko, E.; Tanaka, H. Aerial photograph of Sendai coast for shoreline behavior analysis. In Proceedings of the 32nd Conference on Coastal Engineering, Shanghai, China, 30 June–5 July 2010; Volume 1. [Google Scholar]
- Tanaka, H.; Takahashi, A.; Takahashi, F. Complete closure at the Nanakita River mouth in 1995. In Proceedings of the 25th International Conference on Coastal Engineering, Orlando, FL, USA, 2–6 September 1996; Volume 25, pp. 4545–4556. [Google Scholar]
- Kraus, N.C. Analytical Model of Spit Evolution at Inlets. In Proceedings of the Coastal Sediment, ASCE, Long Island, NY, USA, 21–23 June 1999; pp. 1739–1754. [Google Scholar]
- Larson, M.; Wikramanayake, N.; Hanson, H.; Ranasinghe, R. Seasonal closure of Chilaw Inlet, Sri Lanka: Physical processes and mathematical modeling. In Proceedings of the Coastal Dynamics, Tokyo, Japan, 7–11 September 2009. CD-ROM, Paper No. 97. [Google Scholar]
- Duong, T.M.; Ranasinghe, R.; Luijendijk, A.; Waltsra, D.J.R.; Roelvink, D. Assessing climate change impacts on the stability of small tidal inlets-Part 1: Data poor environments. Mar. Geol. 2017, 390, 331–346. [Google Scholar] [CrossRef]
- Duong, T.M.; Ranasinghe, R.; Thatcher, M.; Mahanama, S.; Zheng, B.W.; Dissanayake, P.K.; Hemer, M.; Luijendijk, A.; Bamunawala, J.; Roelvink, D. Assessing climate change impacts on the stability of small tidal inlets: Part 2-Data rich environments. Mar. Geol. 2018, 395, 65–81. [Google Scholar] [CrossRef]
- Reniers, A.J.H.M.; Roelvink, J.A.; Thornton, E.B. Morphodynamic modeling of an embayed beach under wave group forcing. J. Geophys. Res. 2004, 109, C01030. [Google Scholar] [CrossRef]
- Van Rijn, L.C. Unified view of sediment transport by currents and waves. I: Initiation of motion, bed roughness and bed-load transport. J. Hydraul. Eng. 2007, 133, 649–667. [Google Scholar]
- Van Rijn, L.C. Unified view of sediment transport by currents and waves. II: Suspended transport. J. Hydraul. Eng. ASCE 2007, 133, 668–689. [Google Scholar]
- Tanaka, H.; Shuto, N. Hydraulic characteristics measured at the mouth of Same River in Japan. In Proceedings of the 5th Conference on Ocean Engineering, Hualien, Taiwan, 30 September–1 October 1981; pp. 377–395. [Google Scholar]
- Tanaka, H.; Srivihok, P. Impact of Port Construction on Coastal and River Mouth Morphology-A Case Study at Sendai Port; Tsinghua University Press: Beijing, China, 2004; pp. 406–415. [Google Scholar]
- Hung, N.M. Coastal and Estuarine Evolution in Vietnam; Vietnam Academy of Science and Technology (VAST): Ho Chi Minh City, Vietnam, 2010; 379p. [Google Scholar]
- Palalane, J.; Larson, M.; Hanson, H. Analytical model of sand spit evolution. In Proceedings of the 34th International Conference on Coastal Engineering, Seoul, Korea, 15–20 June 2014. [Google Scholar]
- Hoan, L.X.; Hanson, H.; Larson, M.; Kato, S. A mathematical model of spit growth and barrier elongation: Application to Fire Island Inlet (USA) and Badreveln Spit (Sweden). J. Estua. Coast. Shelf Sci. 2011, 93, 468–477. [Google Scholar] [CrossRef]
- Dennis, K.C.; Niang-Diop, I.; Nicholls, R.J. Sea-level rise and Senegal: Potential impacts and consequences. J. Coast. Res. 1995, 14, 243–261. [Google Scholar]


| Type of Images | Ly Hoa Inlet | An Du Inlet | Resolution |
|---|---|---|---|
| Landsat 4, 5, 7, 8 | 116 images | 80 images | 15 ÷ 30 m/pixel |
| Google Earth | 6 images | 5 images | 2.1 m/pixel |
| Models | Type of Paramaters | Ly Hoa Inlet | An Du Inlet |
|---|---|---|---|
| Wave model | Model domain | 65 × 120 nodes | 60 × 160 nodes |
| Model time step | 60 min | 60 min | |
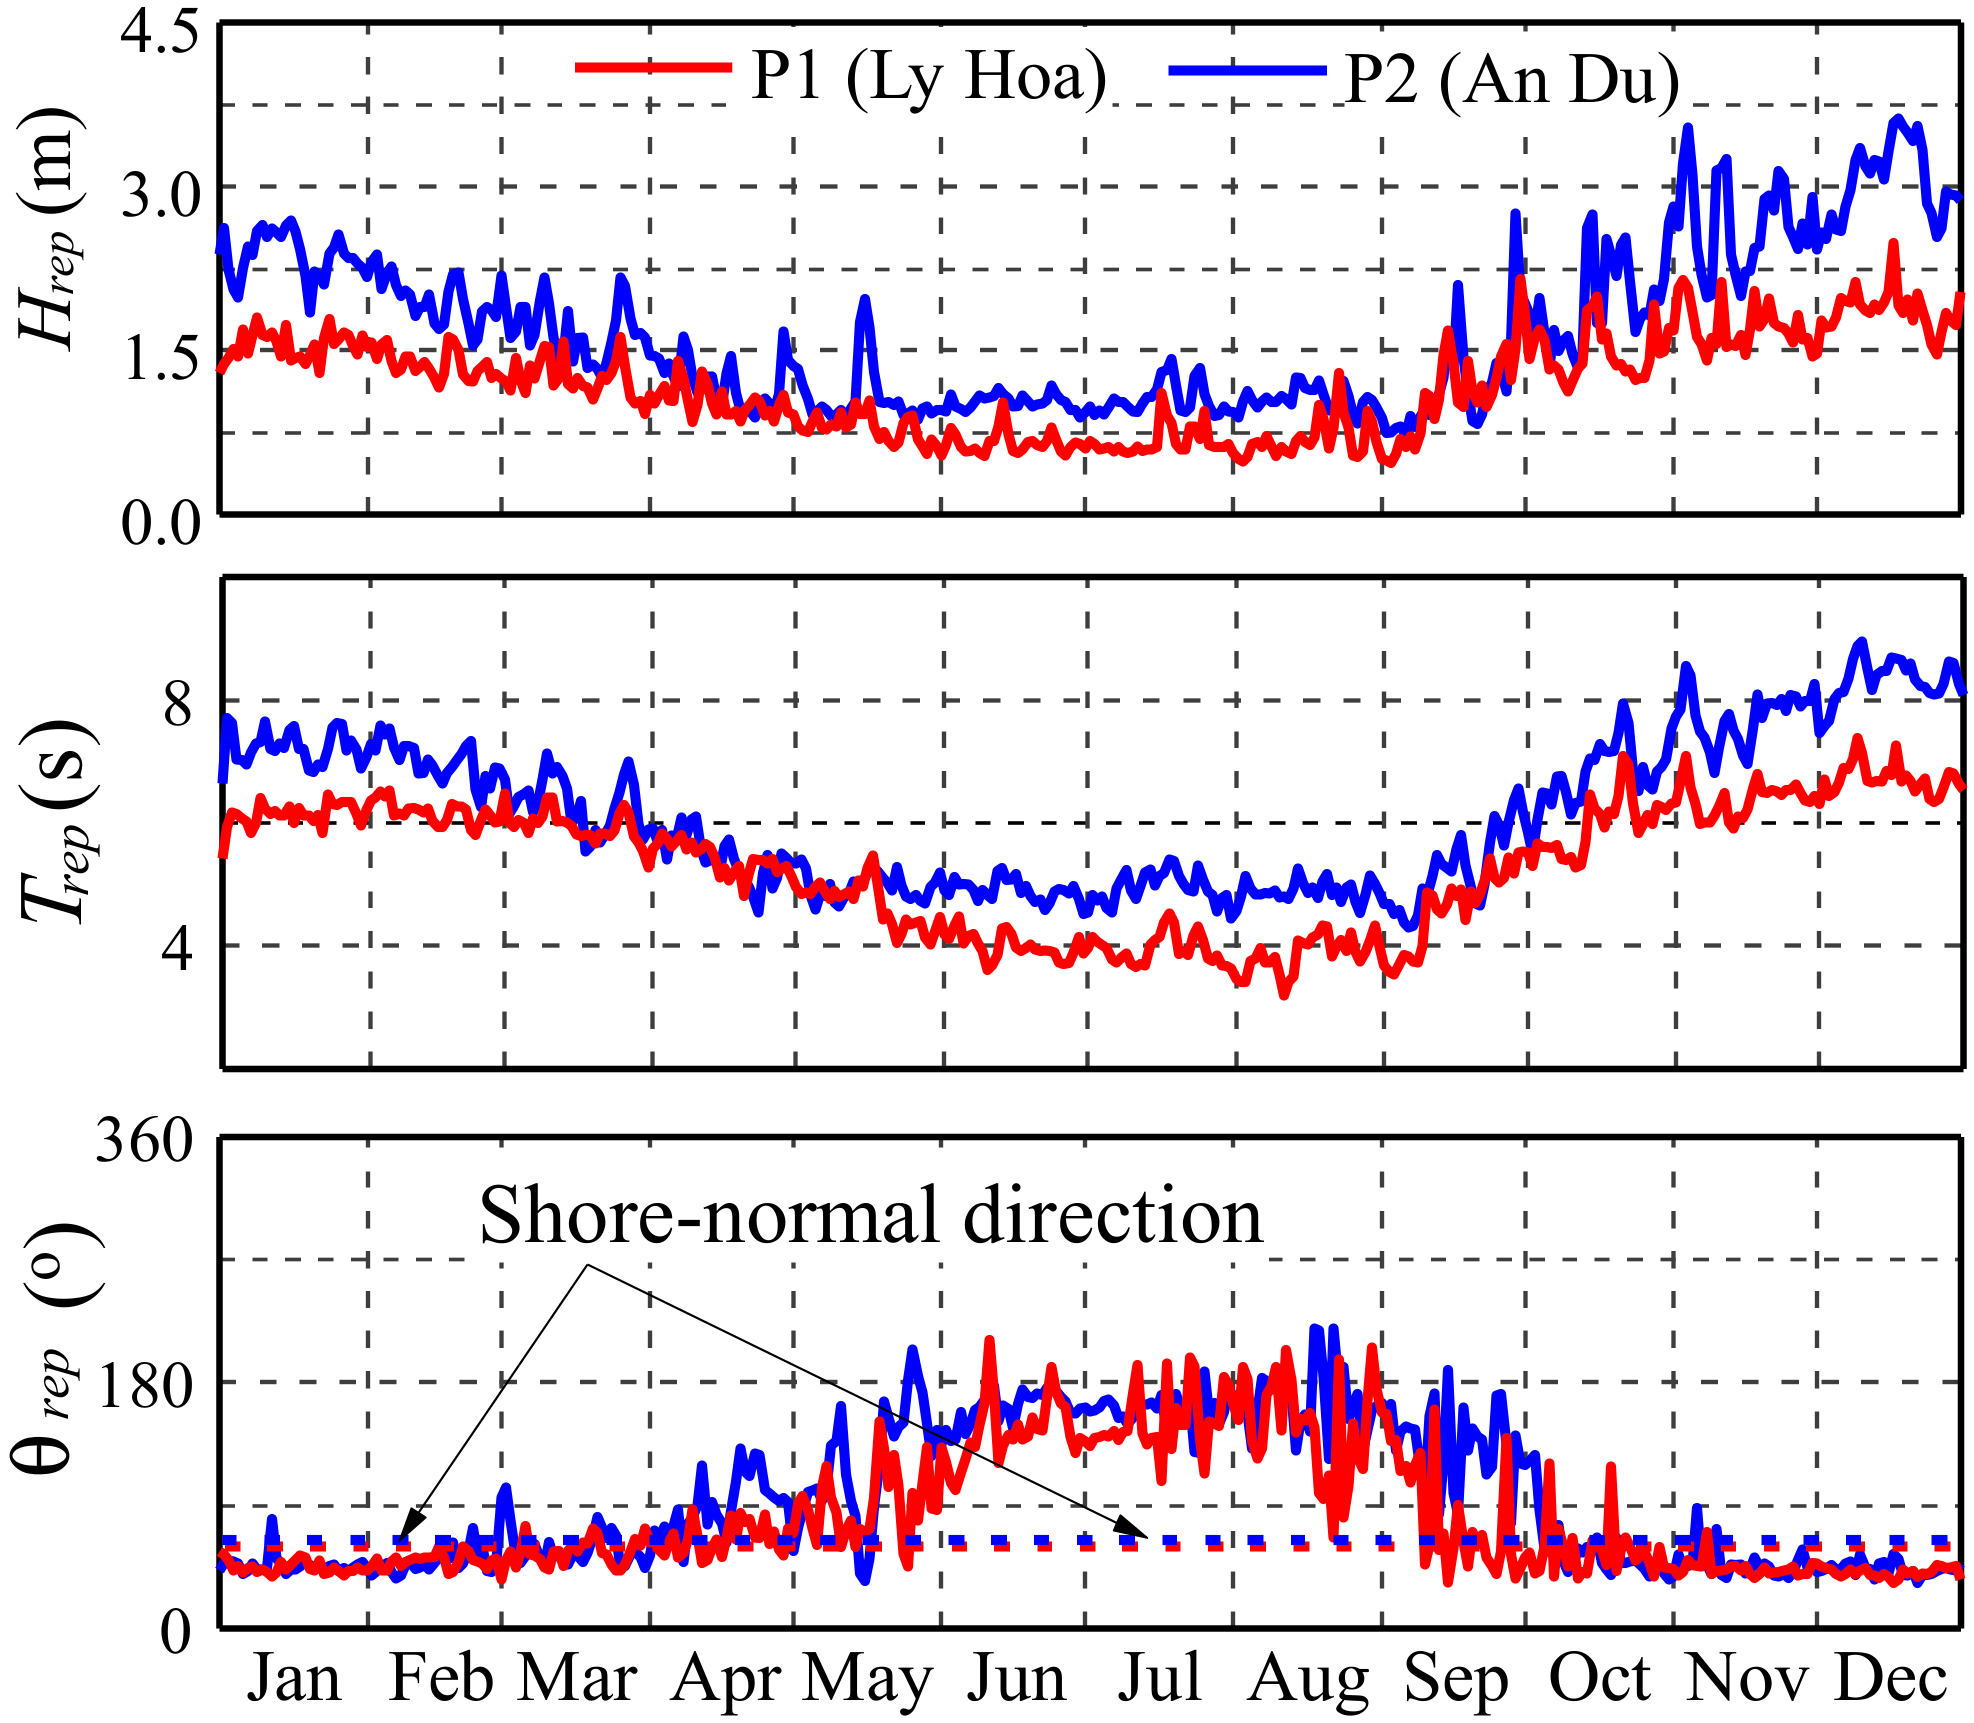
| Boundary conditions | Hrep, Trep, rep calculated from the P1 location (Figure 5) | Hrep, Trep, rep calculated from the P2 location (Figure 5) | |
| Flow model | Model domain | 75 × 90 nodes | 86 × 197 nodes |
| Total simulation duration | 1 year | 1 year | |
| Tidal boundary | Used harmonic constants obtained from the global tidal model TPXO 7.0 | Used harmonic constants obtained from the global tidal model TPXO 7.0 | |
| Model time step | 1 min | 1 min | |
| Horizontal eddy viscosity | 1 m/s2 | 1 m/s2 | |
| Horizontal eddy diffusivity | 1 m/s2 | 1 m/s2 | |
| Chezy bottom friction coefficient | 65 m1/2s | 65 m1/2s | |
| Dynamic diagram | Cycle | Cycle | |
| Sediment transport model | Grain size, d50 | 0.15 mm | 0.25 mm |
| Dry bed density | 1600 kg/m3 | 1600 kg/m3 | |
| Specific density | 2650 kg/m3 | 2650 kg/m3 | |
| Thickness of bottom layer | 15 m | 15 m | |
| Settling velocity | 0.25 mm/s | 0.25 mm/s | |
| Acreation morphological factor | 1 | 1 | |
| Calculation formula | Van Rijn’s Formula | Van Rijn’s Formula |
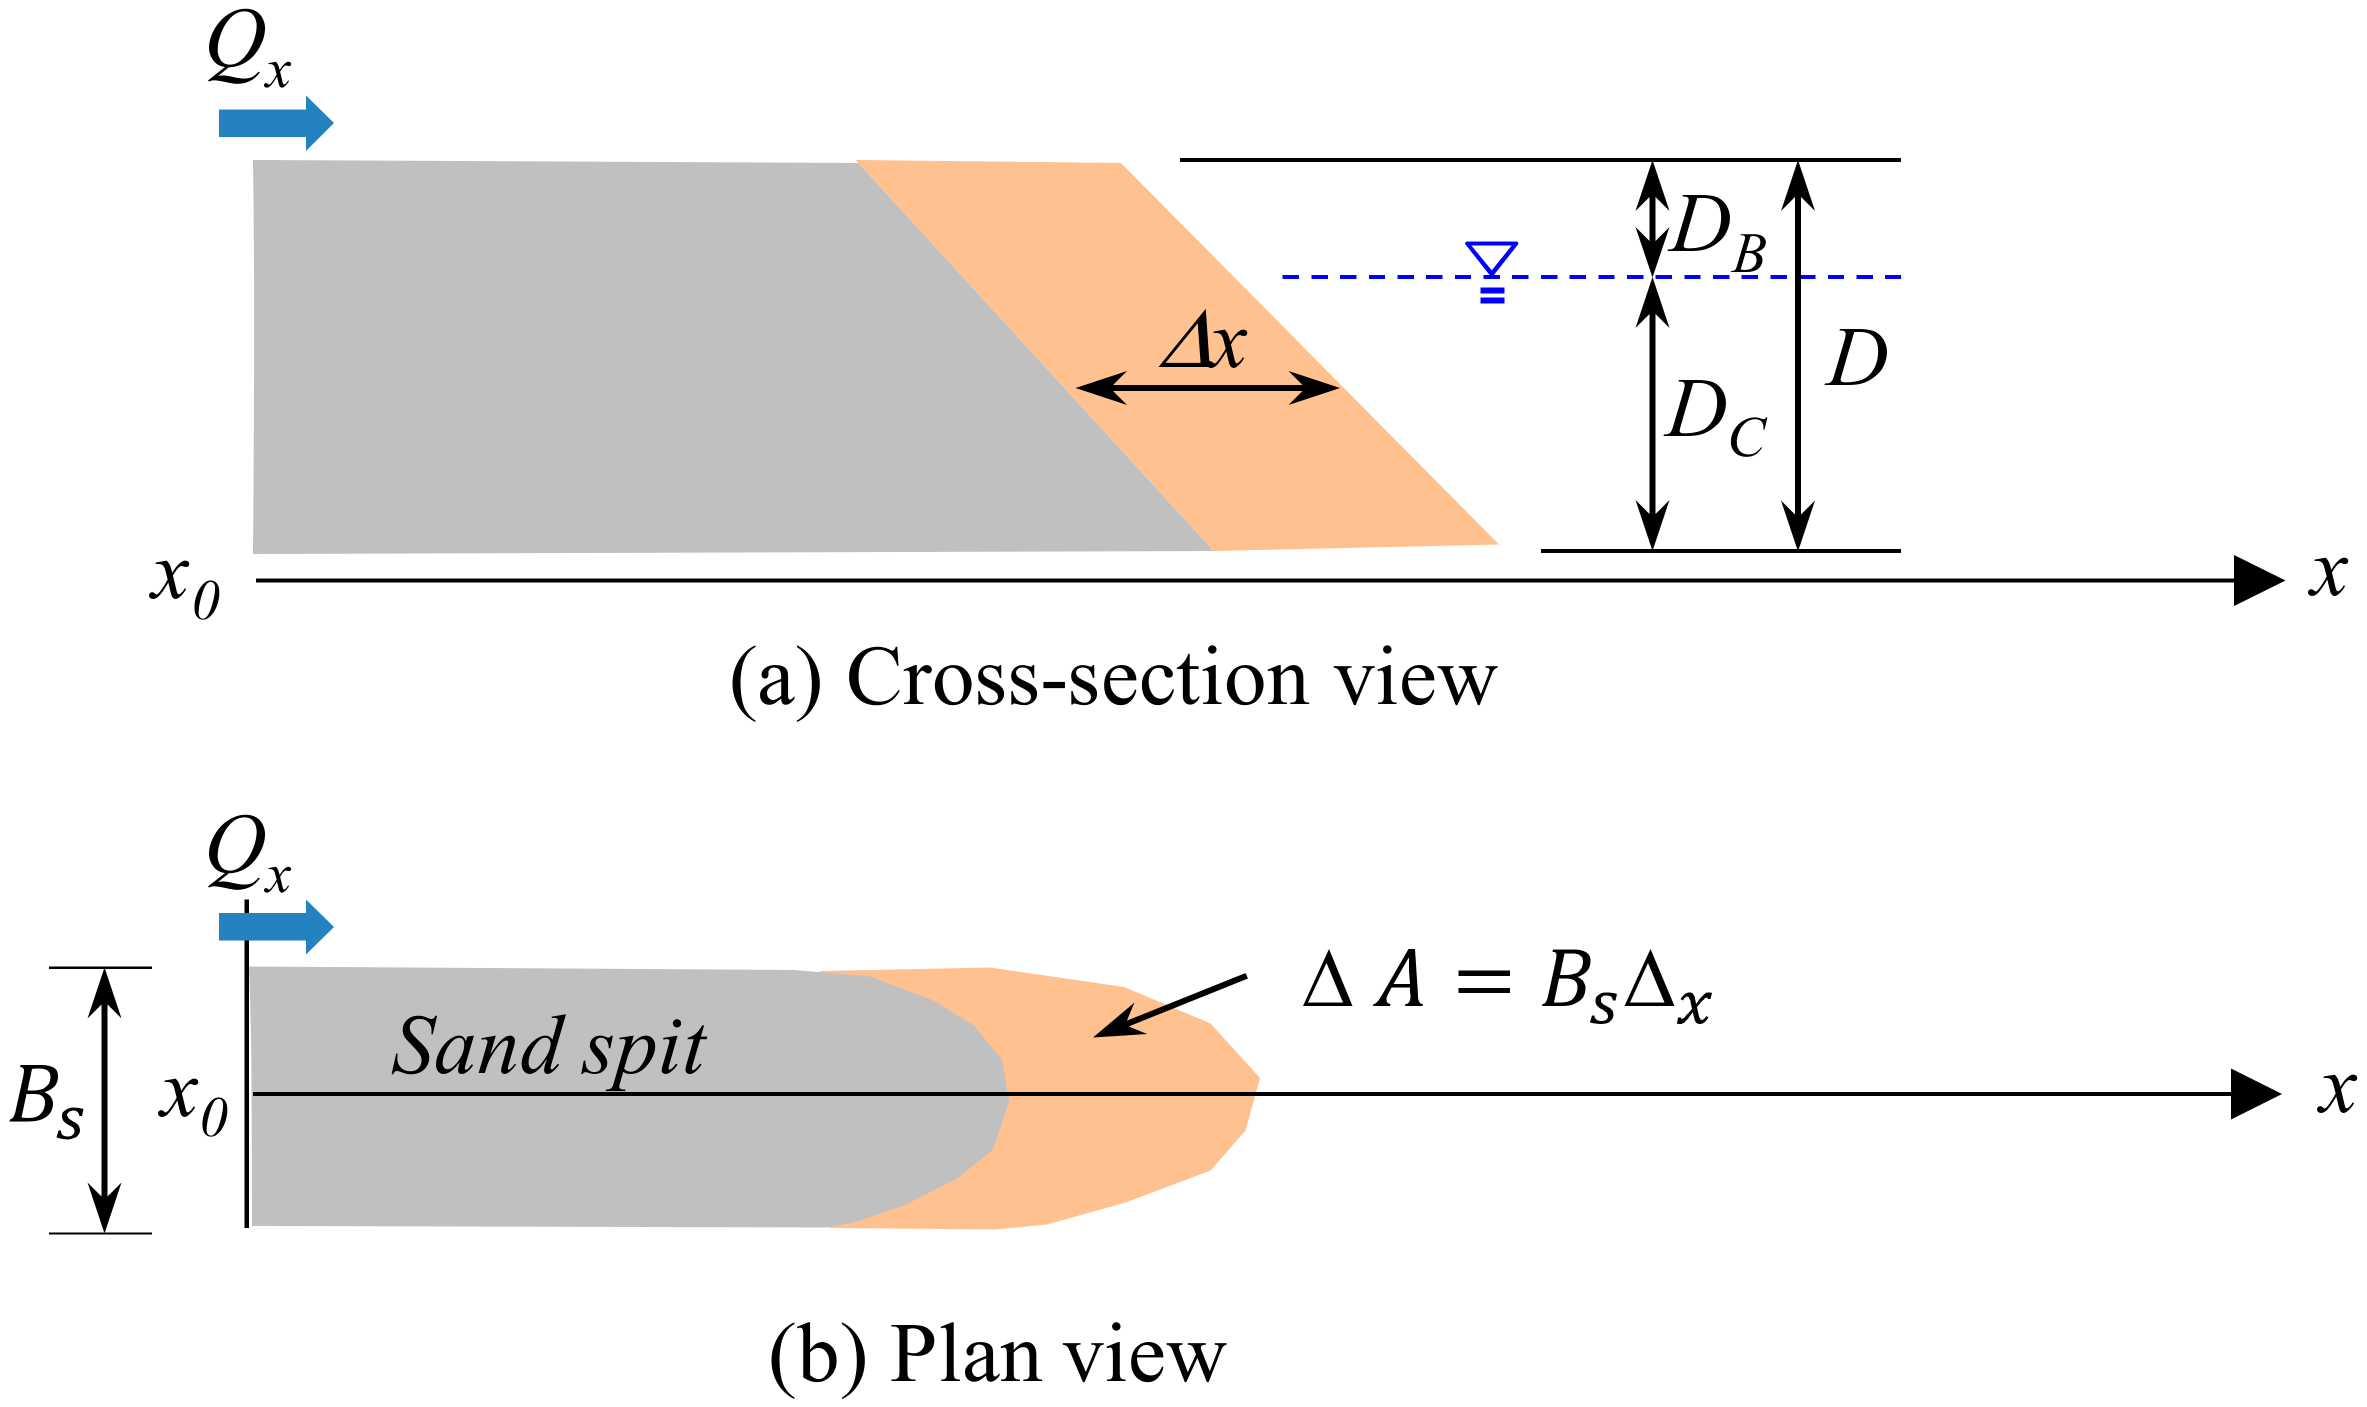
| No. | Inlet | River Length | Basin Area | Mean Spring Tide (htide) | Mean Inlet Depth (d) | DC + DB | Spit Width (Bs) | Spit Growth rate (Rs) | LST by Satellite Image (QSat.) * | LST by Delft3D (QDelft) * |
|---|---|---|---|---|---|---|---|---|---|---|
| (km) | (km2) | (m) | (m) | (m) | (m) | (m/y) | (m3/y) | (m3/y) | ||
| 1 | Ken Inlet [16] | 15 | 120 | 1.0 | 1.63 | 8 + 2 | 180 | 55 | 1.33 × 10⁵ | 0.58 × 10⁵ |
| 2 | Ly Hoa Inlet (Present study) | 25 | 177 | 0.6 | 0.88 | 10 + 3 | 130 | 90 | 1.65 ~ 3.23 × 10⁵ | 0.68 × 10⁵ |
| 3 | Cua Lo Inlet [20] | 70 | 436 | 0.75 | 2.53 | 6 + 2 | 280 | 50 | 1.6 × 10⁵ | 0.84 × 10⁵ |
| 4 | An Du Inlet (Present study) | 85 | 1466 | 0.47 | 1.78 | 10 + 3 | 70 | 140 | 1.07 ~ 2.27 × 10⁵ | 1.95 × 10⁵ |
| 5 | Phan Inlet [16] | 40 | 218 | 0.75 | 1.37 | 6 + 2 | 60 | 183 | 1.18 ~ 1.7 × 10⁵ | 1.62 × 10⁵ |
| 6 | Loc An Inlet [17] | 90 | 1200 | 1.2 | 1.31 | 6 + 2 | 150 | 85 | 2.0 × 10⁵ | 1.42 × 10⁵ |
| No. | Inlet | DC + DB | Spit Width (Bs) | Spit Growth Rate (Rs) | LST (Q) | |
|---|---|---|---|---|---|---|
| (m) | (m) | (m/y) | (m3/y) | (m2/y) | ||
| 1 | Sangomar spit [42] | 11 * + 2 | 300 | 124 | 4.65 × 10⁵ | 3.58 × 10⁴ |
| 2 | Badreveln spit [43] | 4 + 1 | 70 | 28 | 1.0 × 10⁴ | 2.0 × 10³ |
| 3 | Fire Island spit [43] | 8 + 2 | 500 | 43 | 2.20 × 10⁵ | 2.2 × 10⁴ |
© 2020 by the authors. Licensee MDPI, Basel, Switzerland. This article is an open access article distributed under the terms and conditions of the Creative Commons Attribution (CC BY) license (http://creativecommons.org/licenses/by/4.0/).
Share and Cite
Duc Anh, N.Q.; Tanaka, H.; Tam, H.S.; Tinh, N.X.; Tung, T.T.; Viet, N.T. Comprehensive Study of the Sand Spit Evolution at Tidal Inlets in the Central Coast of Vietnam. J. Mar. Sci. Eng. 2020, 8, 722. https://doi.org/10.3390/jmse8090722
Duc Anh NQ, Tanaka H, Tam HS, Tinh NX, Tung TT, Viet NT. Comprehensive Study of the Sand Spit Evolution at Tidal Inlets in the Central Coast of Vietnam. Journal of Marine Science and Engineering. 2020; 8(9):722. https://doi.org/10.3390/jmse8090722
Chicago/Turabian StyleDuc Anh, Nguyen Quang, Hitoshi Tanaka, Ho Sy Tam, Nguyen Xuan Tinh, Tran Thanh Tung, and Nguyen Trung Viet. 2020. "Comprehensive Study of the Sand Spit Evolution at Tidal Inlets in the Central Coast of Vietnam" Journal of Marine Science and Engineering 8, no. 9: 722. https://doi.org/10.3390/jmse8090722