Article

Use of LNG Cold Potential in the Cogeneration Cycle of Ship Power Plants

1
Merchant Marine College, Shanghai Maritime University, Shanghai 201306, China
2
Faculty of Marine Technology and Natural Sciences, Marine Engineering Department, Klaipeda University, H. Manto 84, 92294 Klaipeda, Lithuania
3
Marine Research Institute, Waterborne Transport and Air Pollution Laboratory, Klaipeda University, H. Manto 84, 92294 Klaipeda, Lithuania
*
Author to whom correspondence should be addressed.
J. Mar. Sci. Eng. 2020, 8(9), 720; https://doi.org/10.3390/jmse8090720
Submission received: 31 August 2020 / Revised: 15 September 2020 / Accepted: 16 September 2020 / Published: 18 September 2020
(This article belongs to the Special Issue Marine Alternative Fuels and Environmental Protection)

Abstract

:
This paper presents the results of a numerical study on the parameters that affect the efficiency of the cogeneration cycle of a ship’s power plant. The efficiency was assessed based on the excess power (Ngen.) of a free turbine, operated with the inflow of gaseous nitrogen, which was used to generate electricity. A mathematical model and simulation of the regenerative cycle were created and adjusted to operate with a dual-fuel (diesel-liquid natural gas (LNG)) six-cylinder four-stroke engine, where the energy of the exhaust gas was converted into mechanical work of the regenerative cycle turbine. The most significant factors for Ngen. were identified by parametrical analysis of the cogeneration cycle: in the presence of an ‘external’ unlimited cold potential of the LNG, Ngen. determines an exhaust gas temperature Teg of power plant; the pressure of the turbo unit and nitrogen flow are directly proportional to Ngen. When selecting the technological units for cycle realization, it is rational to use high flow and average π T pressure (~3.0–3.5 units) turbo unit with a high adiabatic efficiency turbine. The effect of the selected heat exchangers with an efficiency of 0.9–1.0 on Ngen. did not exceed 10%. With LNG for ‘internal’ use in a ship as a fuel, the lowest possible temperature of N2 is necessary, because each 10 K increment in N2 entering the compressor decreases Ngen. by 5–8 kW, i.e., 5–6%.

1. Introduction

1.1. Ship Propulsion Plant Environmental Regulations

In 2015, 193 countries adopted the 2030 Agenda for Sustainable Development and its 17 Sustainable Development Goals (SDGs) because greenhouse gas emissions are attaining their highest levels in history [1]. Global emissions have more than doubled from the early seventies and increased by approximately 40% since 2000 [2].
The transport sector is one of the largest consumers of energy from burning petroleum products and is one of the largest polluters of the environment with exhaust gas. Virtually all (95%) of the world’s transportation energy comes from petroleum-based fuels, largely gasoline and diesel [3].
In 2016, global transport accounted for a quarter of total emissions at approximately 8 GT of CO2, which was 71% higher than in 1990 [2]. In 2016, the transport sector contributed 27% of total EU-28 greenhouse gas emissions and was considered the primary cause of air pollution in cities. Transport emissions increased by approximately 3% compared with the value in 2015 [4].
Therefore, for the short-term (until 2030) and long-term (until 2050) perspective, the development of new fuels for the transport sector to reduce CO2 emissions by 40–50% [3] is one of the key directions for the development of transport technologies, in parallel with the development of new transport methods, problem-solving in logistics, and increasing of infrastructural efficiency.
Despite maritime transport becoming increasingly energy-efficient, shipping is still responsible for approximately 2.5% of global greenhouse gas (GHG) emissions or approximately 940 million tonnes of CO2 annually [5]. In the future, the environmental impact from ships will increase due to increase in global fleet and the associated consumption of fossil fuels [6].
Total (international shipping, domestic shipping, and fishing) shipping emissions varied from 3.5% or 1100 million tonnes in 2007 to 2.6% or 932 million tonnes in 2015 [7]. Shipping emissions represented approximately 13% of the overall EU GHG emissions from the transport sector in 2015 [8]; therefore, further decrease in shipping emissions is obligatory in green-minded Europe.
After CO2, black carbon (BC) contributes the highest to the climate impact of shipping. Two other major pollutants from ships are nitrogen oxides (NOX) and sulfur oxides (SOX), which harm the ozone layer, resulting in the greenhouse effect and global warming [9].
Between 2013 and 2015, NOX had the highest increase (3.5%), while SOX had the least (1%) [7].
To reduce the environmental impact of shipping, the International Maritime Organization (IMO), in the widely known MARPOL Annex VI ‘Regulations for the Prevention of Air Pollution from Ships’, has limited NOX and SOX emissions from ship exhausts. Moreover, the world’s most congested shipping waters were declared as emission control areas (ECA). From 2015, sulfur emissions within ECAs have been limited to 0.1% for marine fuels. Furthermore, IMO set a limit of 0.50% for sulfur in fuel oils used onboard ships outside ECAs from 1 January 2020 [10].
Currently, because of low price, seagoing ships use heavy fuels and petroleum distillates [11] with a sulfur content not exceeding 3.5% [12,13]. As seagoing ships consume approximately 300 million tonnes of high-sulfur fuel a year, switching to low-sulfur fuel creates up to approximately USD 69 billion in extra fuel costs [14]. This will compel ships to install secondary technologies for the exhaust gas treatment of SOX, which also involves a significant capital investment and increased operating costs [15,16].
In the MARPOL Annex VI, Regulation 13, the limits on NOX emission apply to each marine diesel engine installed on a ship with a power output higher than 130 kW. The strictest Tier III requirements for NOX emissions from diesel engines are set depending on the engine maximum operating speed: from 3.4 g/kWh if n < 130 rpm to 1.96 g/kWh if n ≥ 2000 rpm [17]. Since 2016, the Tier III standards apply only in NOX ECAs. From 1 January, 2021, it will be mandatory for the Baltic and North Seas [17]. NOX emissions must be cut by about 75% to go from the NOX Tier II to Tier III limits [11,18].
The most significant reduction of sulfur from the current global limit of 3.5% can be accomplished by using compliant fuel or investment in installing scrubbers; however, achieving compliance with NOX Tier III by tuning engines will not be sufficient.
Several indicative and inexpensive primary technologies such as exhaust gas recirculation (EGR), optimization of adjustable and structural parameters, the Miller method, etc., guarantee attaining NOX Tier II limits. NOX Tier III limits can be satisfied with rare exceptions and if all measures were applied in an integrated manner [13,19]. Secondary technology such as selective catalytic reduction (SCR) guarantees matching NOX Tier III limits, i.e., reducing NOX in exhaust gases by 95–97% [20].
In the last decades, the IMO and other institutions developed a series of methodologies and technical operational measures for reducing CO2 by improving energy efficiency [19,20,21]. In July 2011, the Marine Environment Protection Committee (MEPC) adopted amendments to MARPOL Annex VI (Resolution MEPC.203(62)), in which the Energy Efficiency Design Index (EEDI) was mandated for new ships and the Ship Energy Efficiency Management Plan (SEEMP) for all ships after 2013 [22]. The EEDI requires a minimum energy efficiency level per capacity mile (e.g., tonne mile) for different types of ship and size segments.
In summary, these measures have the common goal of reducing CO2 emissions and other pollutants from ships, but they do not specify concrete methods of achieving this. Such methods are also not reflected in the EEDI accounting reports. The increasing amount of ecological and energy efficiency requirements for marine engines and the rigidity of standards causes shipbuilders and engine manufacturers to seek cost-effective methods to satisfy them [19,20,21].
MEPC plans to adjust the minimum energy efficiency level every five years. This can cause technological difficulties for ship design companies and engine manufacturers in the future or it can become a technically unsolvable problem for ships powered by conventional fuels [16].

1.2. Ship Propulsion Decarbonization Technologies

Currently, seagoing ships use relatively cheap heavy fuel with a sulfur content not exceeding 3.5% or petroleum distillates [22,23]. Switching to more expensive low-sulfur fuel or installing scrubbers to treat the exhaust gas of an internal combustion engine involves significant operating costs [24,25].
The most effective method to solve the compliance and cost dilemma is to use gaseous and alternative fuels [26,27]. Among the most prospective fuels are natural gas, hydrogen, methane-based biogas, and liquefied propane and butane gases.
For seagoing ships, which often have power plants of several tens of megawatts, require reduction of emissions by several times, and require bunkering volumes associated with the supply of alternative fuels, the most rational marine fuel would be liquefied natural gas (LNG) [28,29,30].
Many literature sources indicate that modifying ship power plants to operate with LNG decreases NOX emissions by 85–90%, CO2 by 10–20%, and particulate matter (PM) and SOX practically completely [31,32,33,34,35].
In a deeper examination of studies, research results on the single-cylinder marine engine Wärtsilä 20DF were observed as particularly significant [36] to implementing Tier III requirements in shipping. The authors of the paper presented principles on rationally organizing the indication process of the internal combustion engine to achieve acceptable ecological standards without using secondary technologies for waste gas cleaning.
The determining value of the spatiotemporal distribution of a highly reactive pilot portion of injected liquid fuel in the volume of the combustion chamber is justified by the comprehensive experimental studies and calculation methods of mathematical modeling, as a method to control and regulate the dual-fuel fuel combustion process [36]. As a result, a decrease in NOX concentration in exhaust gas from 3000 to 500 mg/Nm3 was achieved, which was even lower than Tier III normative within a significantly wide operational engine range (Pmc = 2.1–1.3 MPa).
Wärtsilä, as a global leader of 4-stroke medium-speed marine engine solutions for the marine and energy markets, maximizes the environmental and economic performance of vessels running on a wide range of liquid and gaseous fuels. Wärtsilä engines can operate on heavy fuel oil (HFO), marine diesel oil (MDO), low viscosity or low-sulfur fuels, LNG, ethane gas (LEG), or petroleum gas (LPG) [37,38]. Moreover, the Wärtsilä 31 engine was awarded a Guinness World Records title for the most efficient 4-stroke diesel engine [39]: the engine consumes, on average, 8–10 g/kWh less fuel compared with the closest competitor across its entire load range, maintenance costs are reduced by approximately 20%, remote access to operational data reduces unscheduled maintenance visits on board, etc. Wärtsilä supplies dual-fuel engines such as the 31DF, 34DF, 46DF, and 50DF that satisfy MARPOL Tier III requirements in the dual-fuel mode and generate power in the range of 1110–17,550 kW.
The widely recognized MAN Diesel & Turbo SE company is a global leader of 2-stroke low-speed marine engines that supplies a variety of engines in terms of power and speed. Their dual-fuel engines also satisfy MARPOL 73/78 Annex VI Tier III ecological requirements. The 2-stroke high power series ME modified engines S70-ME-C8-GI (16,350–26,160 kW), S65-ME-C8-GI (14,350–22,960 kW), and S60-ME-C8-GI (11,900–19,040 kW) can operate on liquid and gaseous fuels and spirits such as methanol, ethanol, and dimethyl ether [40].
In parallel to the dynamically developing segment of highly efficient dual-fuel engines, the number of LNG-powered ships and LNG carriers has been constantly increasing. At the beginning of 2019, the LNG-powered fleet increased globally from 118 LNG-powered vessels in operation in 2017 to 143 LNG-powered vessels in operation—with a further 135 on order and 135 LNG-ready ships either in operation or on order. By March 2019, 18 cruise vessels under construction were LNG-powered [41].
At the end of 2018, 495 LNG carriers above a capacity of 100,000 m3 (excluding floating storage regasification unit (FSRU), floating storage unit (FSU), and floating liquefied natural gas (FLNG) vessels) were in service, with 55 units having been delivered during the year [42].
Additionally, the increase in orders for LNG powered ships is based on the intensive development of on-shore and floating LNG terminals, LNG storage facilities, specialized infrastructure for supply, storage, and delivery to vessels [42,43].
These facts indicate that adopting LNG as the fuel of choice for ships is a dynamically improving and prospective field.
The use of LNG aids in reducing CO2 emissions represented by calculating the EEDI and the Energy Efficiency Operational Indicator (EEOI). The result of the EEDI calculation partly depends on the main engine power, auxiliary engine power, implemented innovative energy-saving technologies for electricity generation on shipboards such as for the main engine exhaust gas cogeneration technology, and innovative energy-saving technologies for propulsion improvement such as wind power (Magnus effect, for instance) or solar power.
Cogeneration is a procedure that uses primary energy introduced in a process to produce electric power and thermal energy from secondary energy sources, i.e., exhaust gas and cooling circuits, in the same technological system [44]. Compared with other possibilities of improving the EEDI, secondary utilization of the main engine energy is crucial to increasing energy efficiency [45,46,47].
With an effective efficiency of 50% or more [39,40,48], implemented in modern engines, the reserve for increasing the total efficiency of a ship power plant is 40–35% of fuel energy. Meanwhile, the use of the diesel engine as the main engine of a ship power plant is the best solution for cogeneration systems in terms of energy efficiency. The authors [45] compared various cogeneration ship systems that generate 25 MW of electrical energy: with steam generators and steam turbines (with backpressure and condensation), with a gas turbine, with a diesel engine, and combined systems. They concluded that, for most types of ships with the ratio of the mechanical energy of propulsion to thermal energy as ψ = 2:10, the best typical values of the energy conversion coefficient and efficiency of the ship’s power plant are realized in the system with a diesel engine. The exception is oil tankers, where for low ψ caused by the requirement to heat fuel tanks, cogeneration systems based on steam and gas turbines are more rational.

1.3. Use of Secondary Propulsion Plant Heat Sources

The structure of cogeneration systems used on ships is determined by the level of technical excellence of the main engine, requirement for electric propulsion, capability to recover energy in a power turbine, types of fuel used, etc.
Thus, the authors [47], evaluating the prospects of increasing the overall efficiency of a power plant in the 90s of the last century, classified ship cogeneration systems in the following categories:
  • Deep recovery (utilization) system for exhaust gases in a steam turbine for the production of electrical energy and a charge air cooling system for auxiliary requirements of a main power plant (heating of heavy fuel, coolant, lubricating oils);
  • Heat recovery system for exhaust gases of 4-stroke powerful engines (power higher than 15,000 kW) with a shaft generator, providing electric movement operation mode;
  • A ‘simplified’ heat recovery system for exhaust gases of highly efficient 2-stroke diesel engines (characterized by a low temperature of exhaust gases of ≤275 °C) with a shaft generator and exhaust gas power recovery turbine.
Progress in further improving the fuel economy of modern main marine engines [46,49,50] has contributed to the further development of efficient heat recovery systems. In particular, owing to the low temperature of the exhaust gases, which is insufficient to generate steam to the turbogenerator, the Rankine system with low boiling liquids (R141b, R123, R245f, etc.) [49,50], and heat pumps [51,52] have received further development.
In a review [53], a comparative analysis, discussion on features and further prospects of the shipboard application of the following modern heat recovery systems for the main engine, to achieve a lower EEDI, was conducted: thermoelectric generator (TEG), organic Rankine cycle (OCR), closed Brayton cycle and their combinations, turbo compound systems.
The thermoelectric power generator converts thermal energy into electrical energy. The TEG generates a current as heat is applied to a circuit at the junction of two different conductors (Seebeck effect). Advantages of the TEG include maintenance-free, silent operation, and high reliability with no moving and complex mechanical parts [54]. Currently, the TEG is more often used for automotive waste heat recovery owing to relatively low generated energy values (up to 600 W) and a high-temperature (>1000 °C) waste heat demand [55,56]. According to experts, TEGs operating on lower-temperature waste heat from marine engines are to be developed in the future. Another of the most popular solutions of the Rankine cycle is the replacement of water steam by OCRs with low boiling temperatures, 30–50 °C of the heat carrier [49,50], in combination with TEGs to increase the recuperation efficiency of heat exchangers [57].
The marine industry’s solution provider Wärtsilä with Turboden of Italy jointly developed the Wärtsilä marine engine combined cycle (ECC) based on ORC technology. Adopted in a cogeneration power plant of a ship, this solution saves 17.1% of the total energy [58].
Another solution by Wärtsilä for high-efficiency waste heat recovery associated with Wärtsilä RT-flex common-rail low-speed marine engines enables up to 12% of the main engine shaft power to be recovered as electrical power for use as additional ship-propulsion power or for shipboard services of container carriers [59]. Exhaust energy is applied in both a steam turbine and an exhaust-gas power turbine to generate electrical power. The generated electrical power can be used either in a shaft motor to aid propulsion or in supplying shipboard services. Additionally, Wärtsilä’s waste heat recovery system is one of the most promising methods to improve EEDI. Electric turbo compounding (ETC), turbo compounding—mechanical, and turbo-generator systems regenerate exhaust gas energy in power turbines connected with electric energy generators. In transient engine operating processes, typical for land transport, the power turbine and generator operating as an electric motor provide the necessary acceleration characteristics for the compressor of the main engine [59,60].
In recuperation systems, including those applied in water transport, a closed gas turbine Brayton cycle is used, where the heat released in the combustion chamber and release of energy into the environment as the exhaust gas are replaced by heat exchangers to supply or extract heat. The energy generated by the cycle is determined by the difference between the work produced during expansion in the turbine and compression in the compressor. Therefore, the improvement of the recovery system is more promising if the working fluids have low specific volumes, moreover, if the system works efficiently using exhaust gas low-potential heat of the modern ship engines.
One of the intensely refined solutions is the supercritical CO2 (S-CO2) Brayton cycle, which offers high plant efficiencies and beneficial economics for a variety of heat sources [61]. For example, using the S-CO2 cycle on a US navy vessel exhibited an increase in the key engine power indicators by 20–24% [62].
The Brayton cycle, because of its small size and mass and relatively easy integration into transport systems, is increasingly being used as a versatile tool to improve energy efficiency and eco-efficiency and to practically reduce the CO2 emissions of internal combustion engines of all purposes [63,64,65,66,67]. The thermal performance of the waste heat recovery systems of offshore oil production facilities, including the components of diesel engines, thermal boilers, and waste heat boilers, were analyzed in Reference [63]. The research provided guidelines on improving the waste heat recovery at offshore oil production facilities by applying a waste heat recovery boiler.
An integrated system based on the closed recuperative Brayton cycle (CRBC) for power generation and engine cooling was presented in Reference [64]. In CRBC applied to hypersonic vehicles—next-generation aircraft and spacecraft with broad applications—the combustion heat dissipation is transferred by liquid metal Na and partly converted into electric power.
In automotive transport, the Brayton cycle is used for either traditional oil-based fuel-driven transport means (ICEs) [67] or electric transport [66]. Because of multi-variability, the parametric optimization of the cycle is performed using mathematical modeling methods. A prerequisite is that the engine generating secondary heat must be included in the system’s simulation [65,68,69].
For natural gas (NG)-powered transport, even more opportunities to increase the energy efficiency of recovery systems exist. This is primarily applicable to maritime transport because of large engine rooms, which have sufficient space to install the systems of Rankine and Brayton cycles [65,66,67,68].
For NG-fuelled vehicles, gas chemical energy increases by adding the physical energy of liquefaction condition of the NG, which is equal to the difference between the mechanical energy of different pressures in the fuel tank of LNG and compressed gaseous fuel in the engine supply system.
For LNG-powered vehicles, the LNG cold potential, which consists of the amount of heat energy required to vaporize the LNG and heat the NG from storage temperature to engine-supply temperature, is added. In the cogeneration systems used, the physical NG energy is not utilized, i.e., the mechanical energy generated by throttling compressed natural gas (CNG) and the cold potential released by heating the gas to the supply temperature [46].
Known solutions have been developed to harness the potential of the LNG cold potential. For example, the phase production of dry ice or solid CO2 based on CO2 re-sublimation, which results in significant reductions of greenhouse gas [70].
The solution to exploit the LNG cold potential and thus extend the temperature range in Brayton closed-loop recuperation systems designed to utilize the secondary heat generated by modern marine engines is seemingly more rational because the exhaust gas temperature of these engines, as well as for duel-fuel engines, is low. For this purpose, the References [71,72,73] reviewed the structural features of marine propulsion NG fuel supply systems; the structural solutions of the engines of the gas carriers MAN Diesel 2 Turbo and Wärtsilä were reviewed [39,40].
Unlike the classic steam turbine propulsion complex of operating LNG carriers, 85% of newly built fleets of LNG carriers will be equipped with a propulsion system with gas diesel engines. This is based on minimizing cargo vapor losses (boil-off gas (BOG)) and reducing air emissions from ships. About 30% of the LNG carrier fleet is already equipped with the two-stroke dual-fuel engines MAN B&W ME-GI [71]. The efficiency of gaseous fuel supply to the engine system depends on engine load regime, freight conditions, BOG intensiveness, gaseous fuel composition, etc. [71]. Therefore, a constant supply of gaseous fuel to the engine can be ensured by using combined fuel supply systems, which consist of the LNG tank BOG high-pressure (150–300 bar) compressor circuit and the LNG compression to a 300-bar circuit, followed by regasification and heating to 45 °C [74].
For BOG compression, a 5-stage and 6-cylinder reciprocating machine, LABY®-GI, with the intercooler and bypass, manufactured by Burckhardt Compression, is widely used. The compressor is equipped with a sophisticated automatic control system to provide the necessary gas pressure in different floating modes, with the additional gas liquefaction circuit developed by Hamworthy Gas Systems [74].
If the entire BOG is not consumed as a fuel, the remainder, after two steps of compression (stage 1–2), is directed to a heat exchanger where it is liquefied with nitrogen and returned to the LNG tanks after separation.
If the ship’s power plant is powered by liquid fuel only, the entire BOG is liquefied. A similar system with BOG re-liquefaction has been developed by Wärtsilä Oil & Gas Systems and is installed on gas tankers [72].
Thus, dual-fuel vessels can be equipped with recuperative engine systems consisting of cryogenic heat exchangers (BOG liquefaction and LNG regasification), enabling the cold potential of LNG to be exploited in secondary heat energy recuperation systems.
The analysis of various research results proved that the Brayton closed gas turbine is the most promising secondary main engine heat recovery system. Its relatively lightweight and overall size make it easy to integrate into a ship’s power plant. By analogy with modern gas fuel supply systems, the rational working agent to use in this system is liquid nitrogen.
The partners of the Shanghai 2017 ‘Science and Technology Innovation Action Plan’ Intergovernmental International Science and Technology Cooperation Project ‘The Study of Small LNG Ship and Cascade Use of Cold Energy’ developed an efficient gas-to-gas heat exchanger to achieve a nitrogen closed-cycle of cold energy exchange.
In the system presented in this paper, the exhaust gas heat recovery of the main engine is realized in a closed Brayton cycle. Gaseous nitrogen circulating in the loop is heated using acetyl glycol, which in turn is heated by the exhaust gas of the engine. Two regenerator heat exchangers are provided in the cycle to increase energy efficiency. The N2-LNG heat exchanger serves to decrease the temperature of N2 entering the compressor; in the N2-N2 heat exchanger, the compressed nitrogen is heated by the leaving the turbine nitrogen heat and conveyed to the engine’s heat exchanger. The electricity in the generator is generated by the difference in power output between the turbine and compressor.
The goals of this study were focused on two main aspects of this technology research:
  • To create a mathematical model to study the cogeneration cycle technology of an LNG ship power plant and to conduct their adaptation in various calculations.
  • From the mathematical model, to create an electronic simulator and perform parametric analysis of the regeneration cycle to increase the energy efficiency indicators by rationally selecting the components of the cogeneration system (turbine, compressor, and heat exchangers).

2. Methodological Aspects

The boundary conditions for the analytical decisions comprised the following key basic regulations:
  • Energy transformation processes in the system’s equipment are reversible (aerodynamic pressure losses are zero).
  • Turbine and compressor analytical connection of parameters η C . a d = f ( G , π C ) and π C = f ( G , n T C ) are not desirable: the parameters T i C = T i T are independent of   η C . a d and   η T . a d .
  • The LNG cold potential is external and unlimited (the LNG flow exceeds the demand of supply energy for the engine).
Additionally, two alternative scenarios are discussed: heat transfer in heat exchangers is determined by the thermal efficiency   η H E , or LNG flow exclusively used as a fuel for the engine. The analytical description of the system’s function consists of three equations (1, 2, and 3) of axial machines and the theory of heat machine equipment [75,76]:
{ π C = { 1 + G d G d × C p G p × T 3 T 1 η C . a d η T β [ 1 ( P 4 P 3 ( K d 1 ) K d ) ] G d G d 1 ( 1 ) G d   =   α ×   F T e k v ×   ψ T × ρ 3 2 R T 3   ; ( 2 ) ψ T = ( K d K d 1 ) [ ( P 4 P 3 ) 2 K d   ( P 4 P 3 ) ( K d + 1 ) K d ] ( 3 )
where G d and G d are the gas flow rates through the turbine and compressor, respectively, C p and C p are the isobaric specific heats of gas flow through the turbine and compressor, respectively, and K d is the gas adiabatic indicator; the pressure P i and temperature T i marking and location are based on the scheme (Figure 1). The algorithm of the analytical solutions is shown in Figure 2.
The thermal energy, generated by the exhaust gases of the marine engine (DE), is transferred to the cogeneration cycle through a heat exchanger (HE3). After the heat exchanger HE3, nitrogen circulating in the circuit with a high temperature T 3   enters the turbine T, where part of its internal energy during expansion is transformed into mechanical energy of the turbine.
After passing through the HE1 heat exchanger, the nitrogen is cooled by LNG in the HE2 heat exchanger and enters the compressor inlet (C) at a low temperature ( T 1 ), where its temperature rises to T 2 as a result of compression. In the cogeneration heat exchanger HE1, nitrogen is additionally heated by the flow of nitrogen leaving the turbine, and at temperature T 5 enters the heat exchanger of the engine exhaust gases HE3. The cogeneration heat exchanger improves the efficiency of the cycle by expanding its operating temperature range ( T 3 T 1 ).
The algorithm is primarily linear; however, one of the key aspects that affect the efficiency is solved using the iteration method:
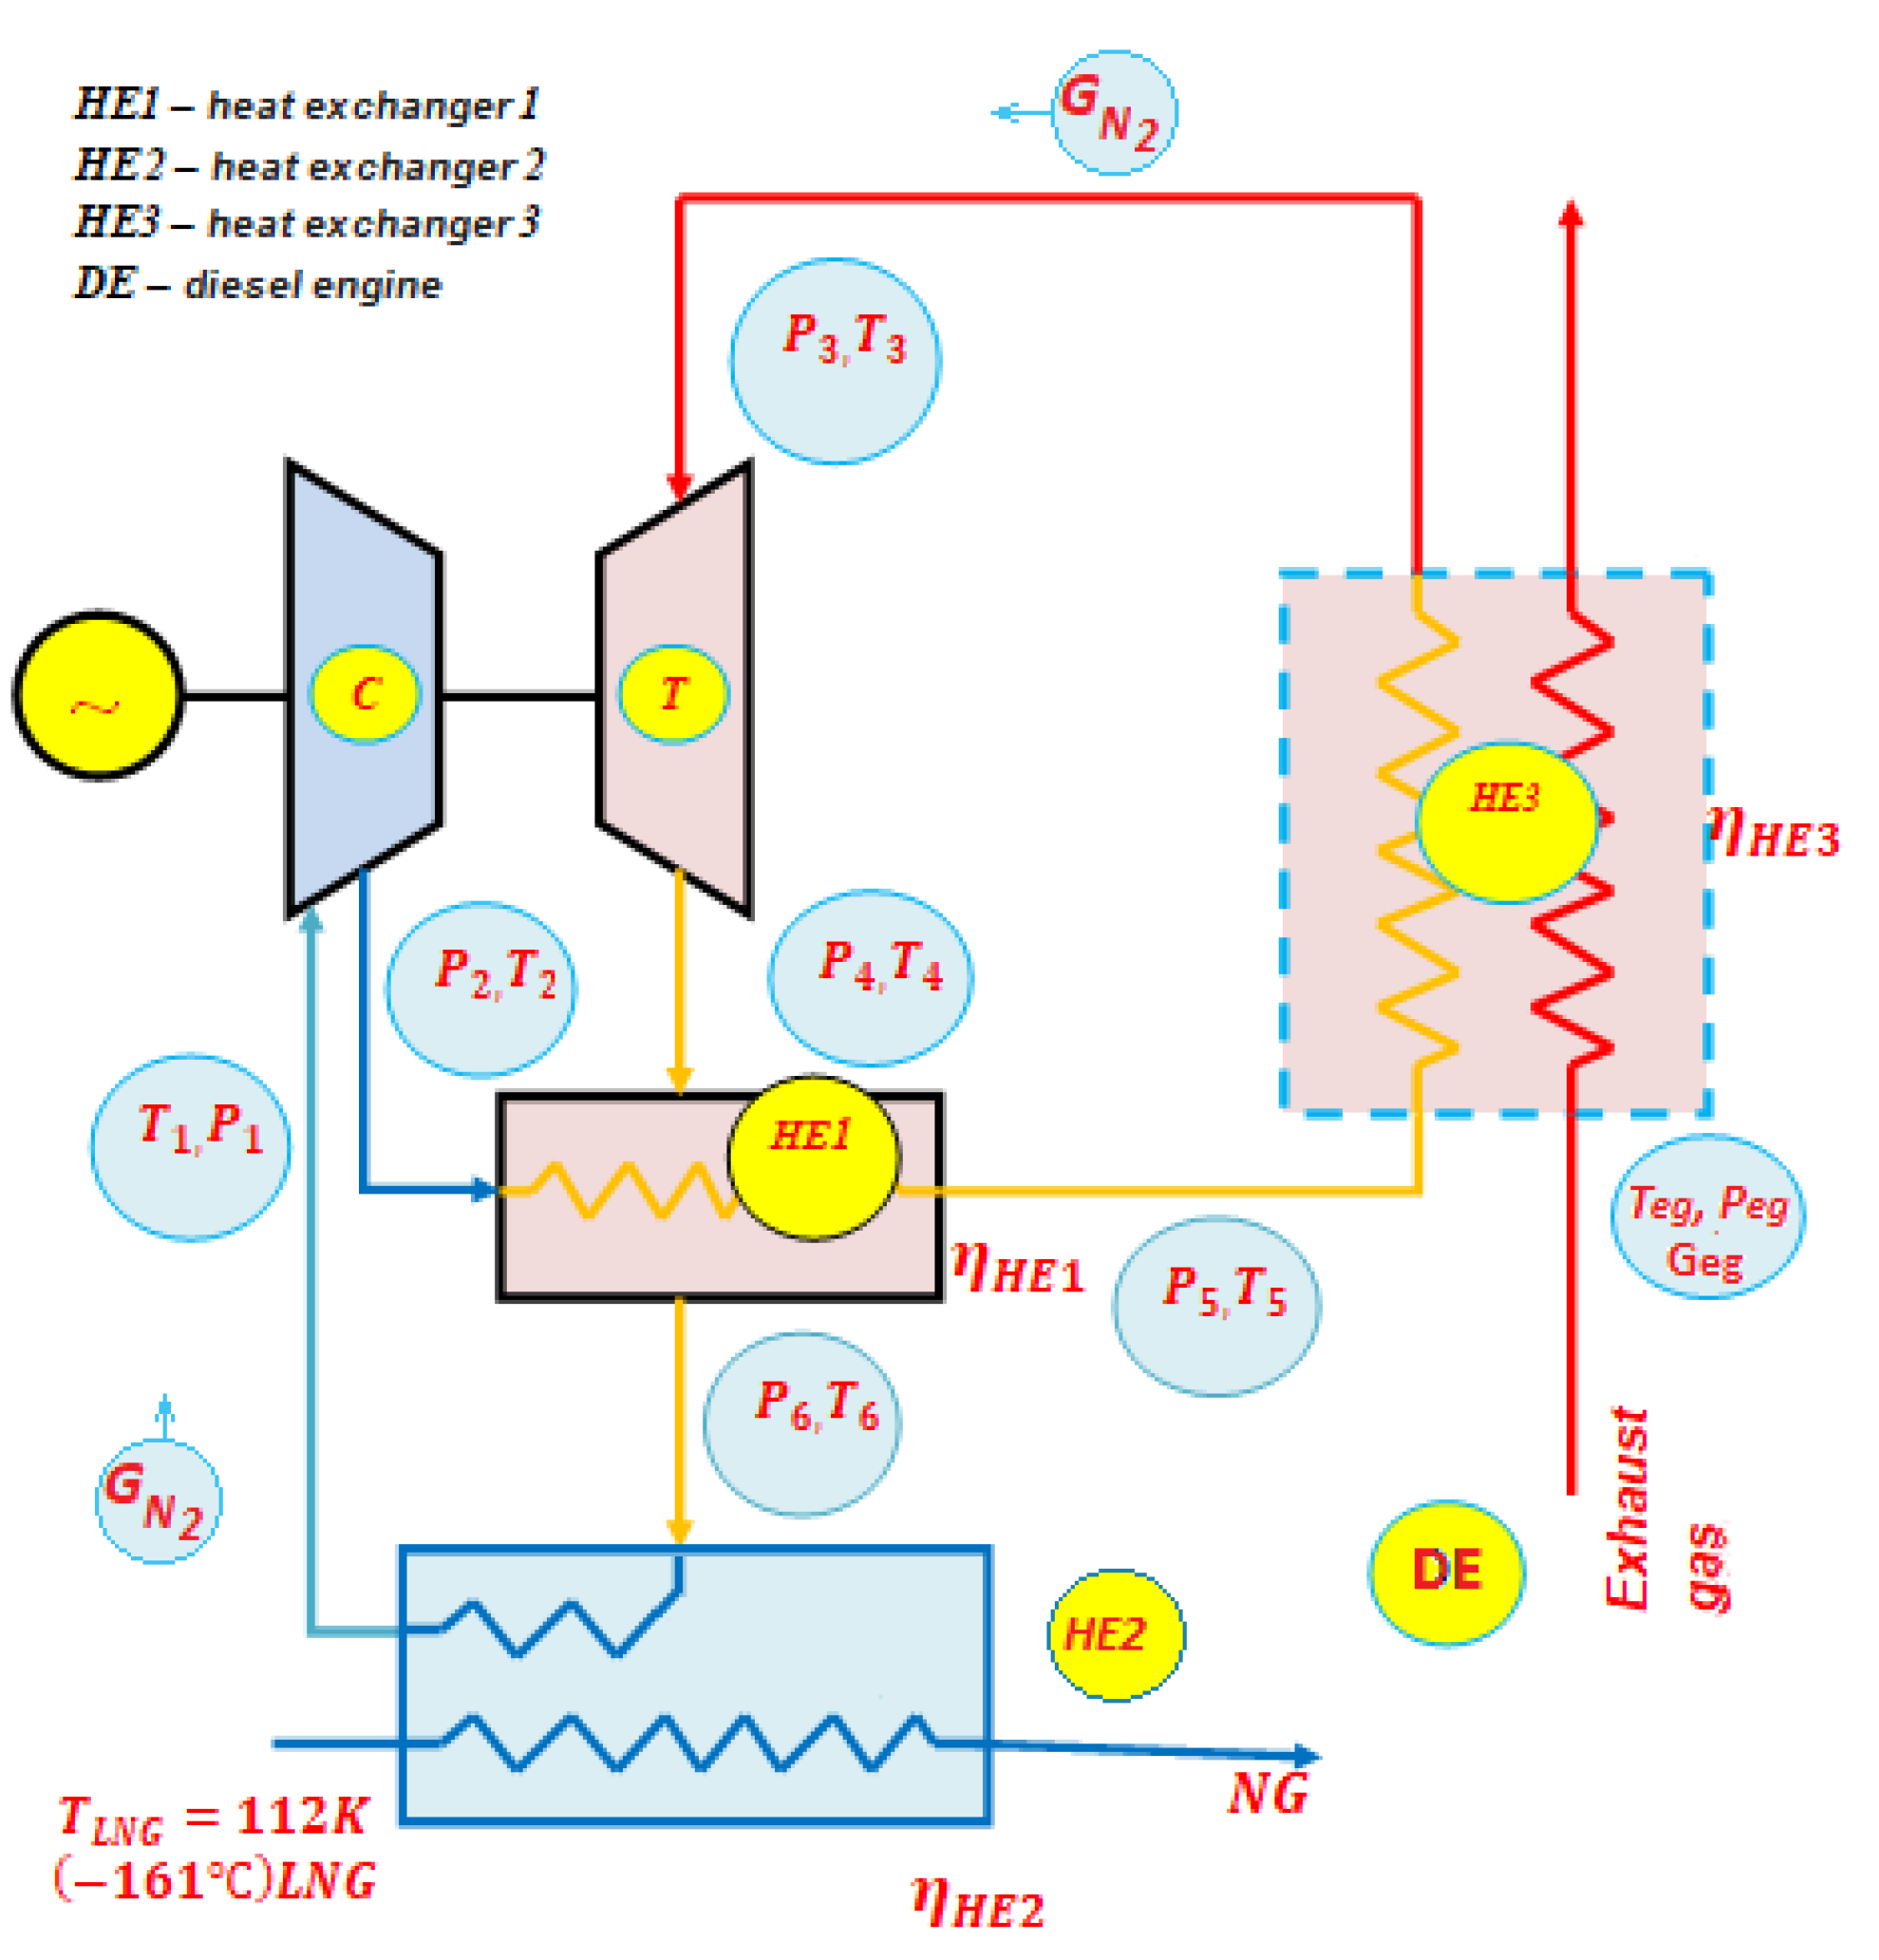
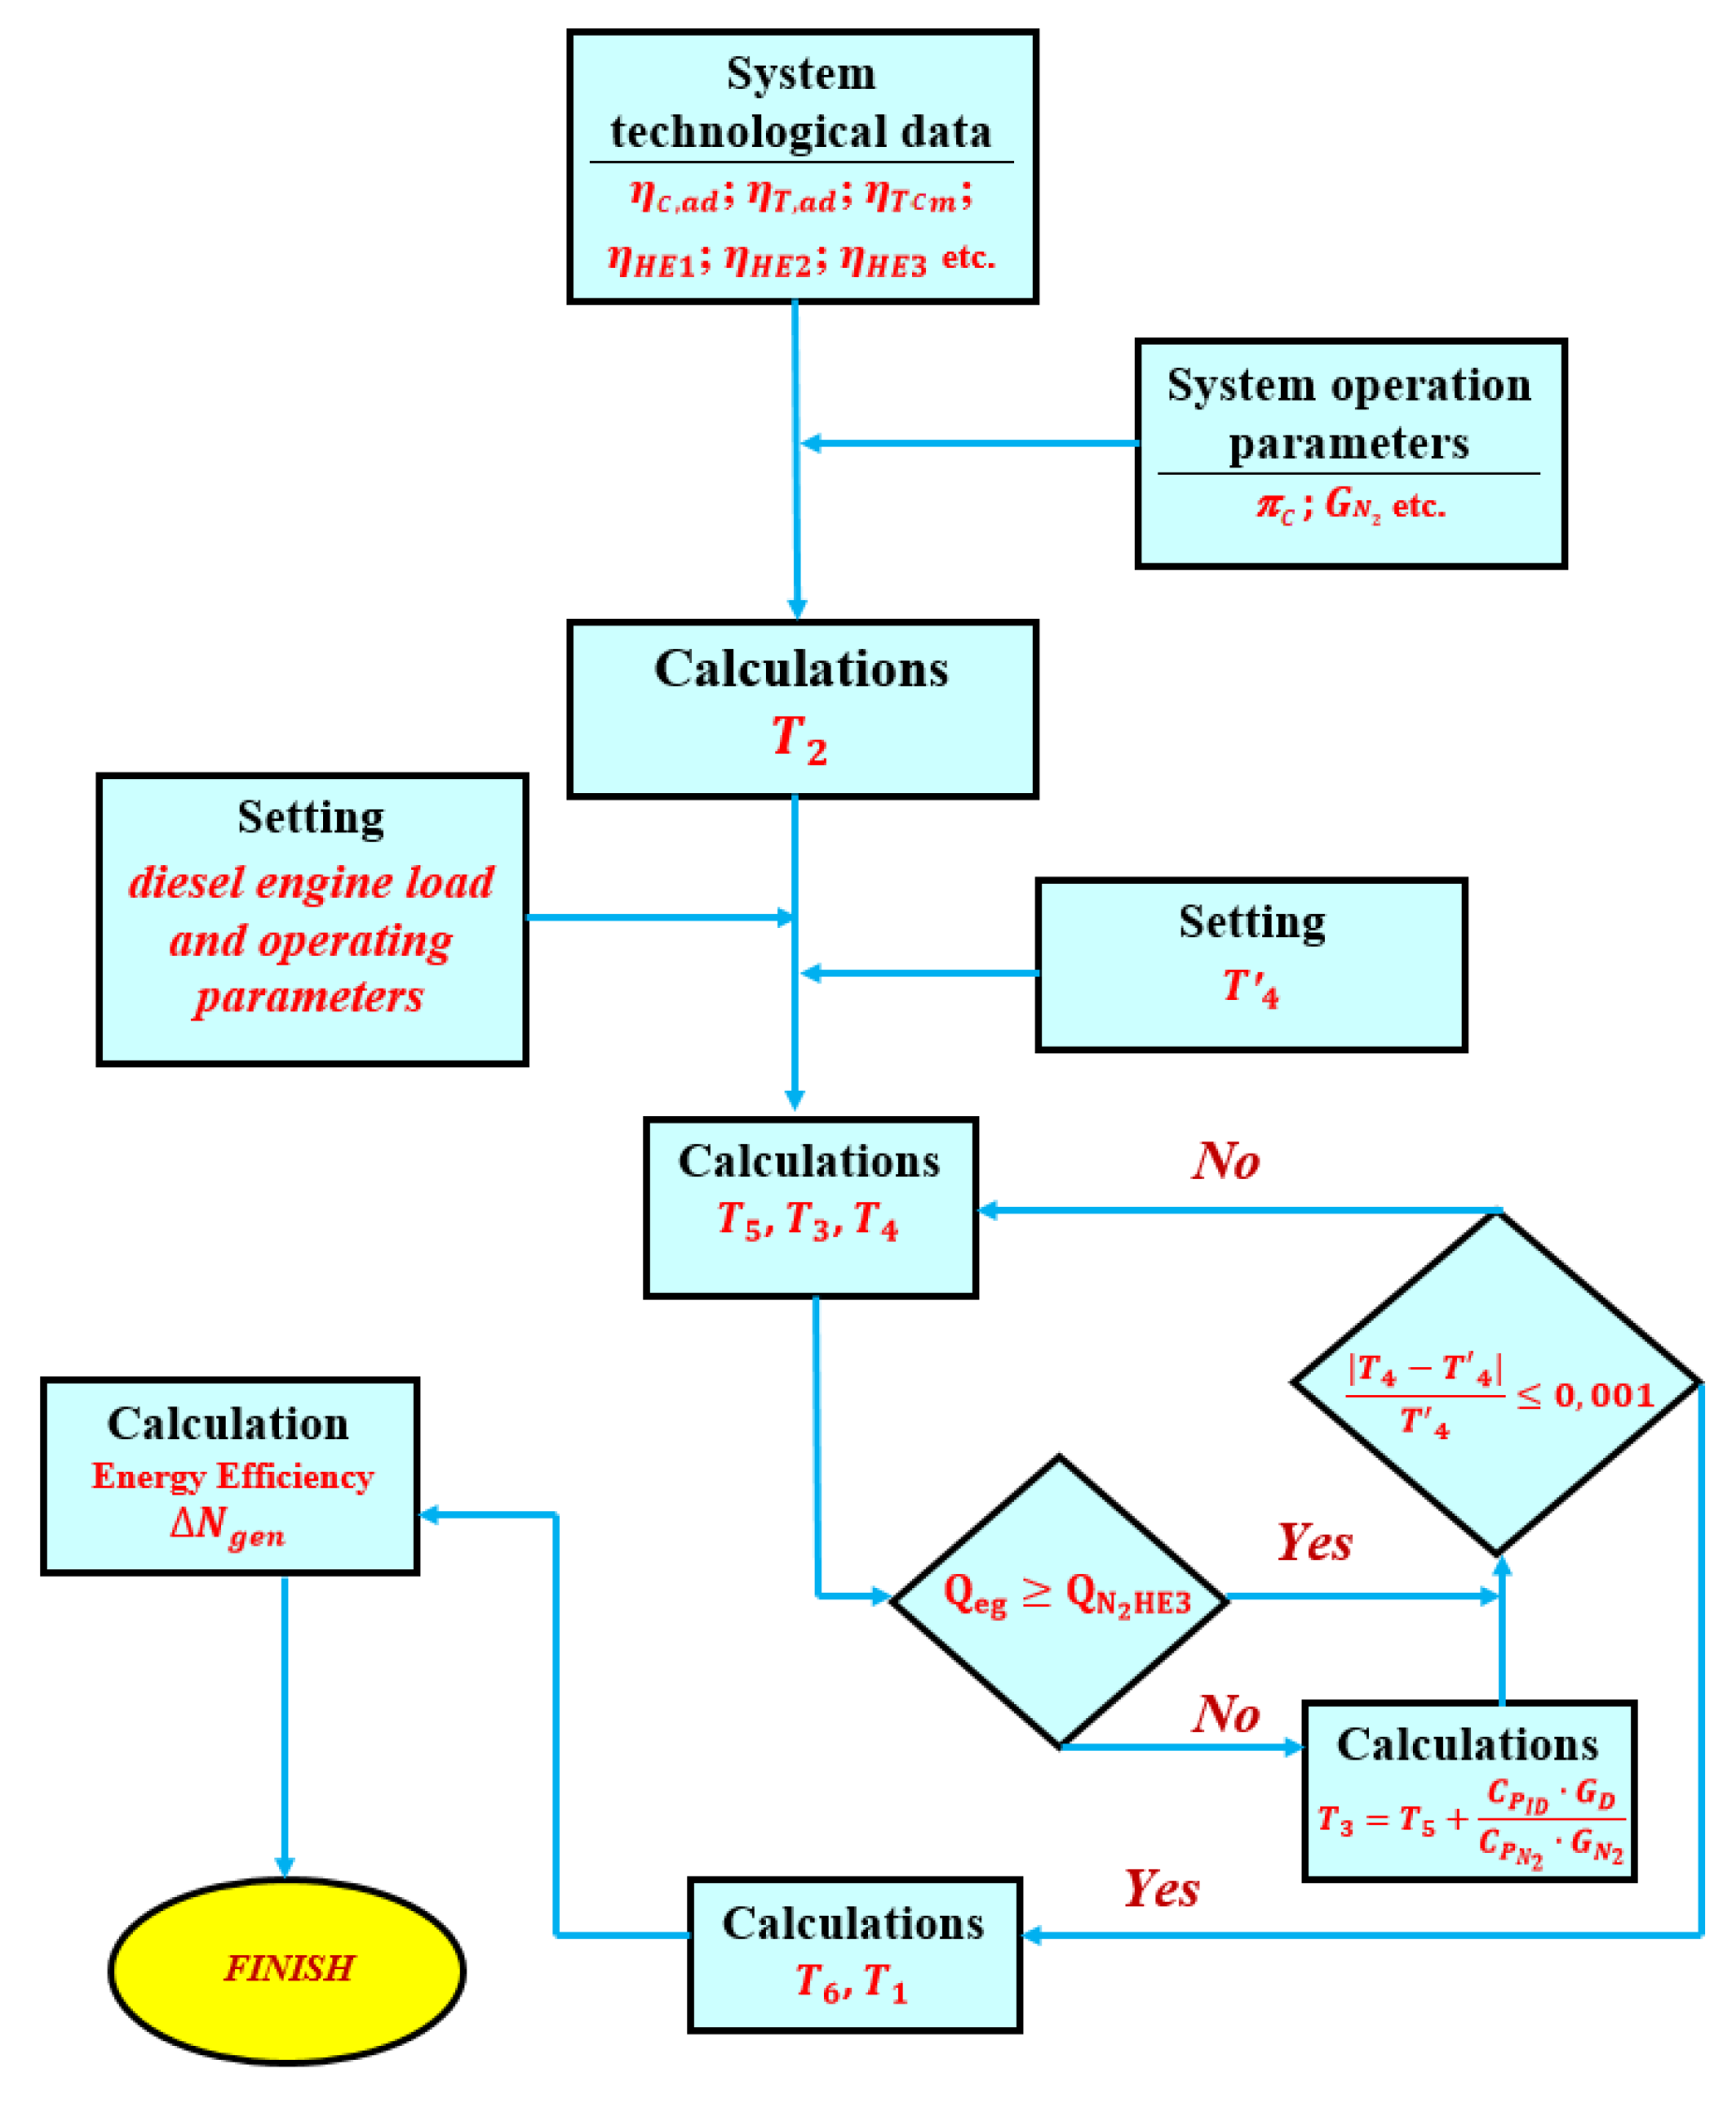
  • After entering the technical and operational parameters ( π C , G N 2 , etc.), the nitrogen temperatures are calculated at the characteristic angles of the co-generation cycle ( T 1 ; T 2 ; T 3 ; T 4 ; T 5 ). It is assumed that there are no hydrodynamic losses of nitrogen flow in the cycle heat exchangers channels. As a result, P 1 = P 4 = P 6 and P 2 = P 3 = P 5 . Thus, the algorithm realizes the equality of the degree of pressure increase in the compressor and the degree of pressure decrease in the turbine π C = π T .
  • The outgoing temperature T 4 from the turbine, including thermal efficiency η H E 1 of the heat exchanger, directly affect T 5 , which in turn affects the temperatures T 3 and T 4 after increase in heat exchanger HE3.
  • The nitrogen preheat in heat exchanger HE3 is limited by the engine’s exhaust gas heat transfer potential to nitrogen. Depending on the parameters used in the system, the nitrogen temperature T 3 is adjusted according to condition Q e g Q N 2 H E 3 .
  • The temperature T 1 for an alternative supply for diesel engine use was determined based on the potential of the difference between saturated and overheated LNG steam phases.
The effect of the cogeneration cycle, converting excess energy to electric energy, is calculated using the analytical equation
Δ N T C = G N 2 [ l T l C ] = G N 2 [ T 3 c P N 2 ( 1 1 π T 1 , 4 1 1 , 4 ) η T . a d · η T C M × β T 1 C P N 2 ( π C 1 , 4 1 1 , 4   1 ) η C . a d ]    
For further flexible development, the algorithm of the cogeneration cycle was realized in the form of an electronic simulator using the software LabView (National Instruments) (Figure 3). A medium-speed six-cylinder four-stroke diesel engine (bore/stroke 30/50) was used to check and adapt the algorithm and its simulator to real maritime conditions. Table 1 represents the indicators of engine operating in propulsion characteristics.
Remark: Pe is the effective power, PC is the charge air pressure, Teg is the exhaust gas temperature, Geg is the exhaust gas flow rate, and λ is the excess air ratio.
The engine work mode was set using simulator tools that imitated the engine control system (Figure 3). The parameters T e g ,   G e g , were the characteristics of this mode and used in cogeneration cycle calculations. A wide range of tasks, related to cogeneration cycle efficiency and parameter values harmonization, were solved using the simulator:
  • Selection of the parameters for the turbo unit TC, assessing their effect on the energy effect Δ N T C = Δ N g e n power for the generation of electrical energy;
  • Evaluation of efficiency rates (EC) that represent the structural improvements of heat exchangers and affect the cogeneration cycle efficiency.
  • Evaluation of the relationship between boundary cycle temperature values ( T 1   a n d   T 3 ) and flow rate of nitrogen circulating in a closed-loop cycle; etc.
A part of this research is represented in Section 3 below.

3. Research Results and Discussion

In the first step of this research, a task was set and accomplished: based on the cycle calculations (see Section 2), to create a nomogram to determine the energy parameters of the cogeneration cycle. Graphical evaluations are convenient for creating technological parameters for actual cycles. The foundation of calculations was the first equation of the turbo unit that consisted of the turbine and compressor [75]:
G N 2 [ T 3 c p N 2 ( 1 1 π T k 1 k ) η T . a d · η T C M · β T 1 c p N 2 ( π C k 1 k 1 ) η C . a d ] = Δ N T C
The calculation conducted with the relative form of the parameter Δ N T K , i.e., one unit (1.0) is the enthalpy ( G N 2 · c p N 2 ) n of the circulating nitrogen:
Δ N T C G N 2 · c p N 2 = [ T 3 ( 1 1 π T k 1 k ) η T . a d · η T C M · β T 1 ( π C k 1 k 1 ) η C . a d ]
where for simplicity, c p N 2 = 1.06   k J / k g · K was used for the range of c p N 2 = 1.04 ÷ 1.08   k J / k g · K , which is characteristic of the temperature range of 200–700 °C the energy pulse factor β = 1 because the system was isobaric.
As a result, a graphical form (Figure 4) implementing the determination of the parameter Δ N T C G N 2 · c p N 2 well revealed the structure of analytical expression; this was the second part of Equation (6): N T G N 2 · c p N 2 and N C G N 2 · c p N 2 . A format of the nomogram to determine Δ N T C G N 2 · c p N 2 values is shown in Figure 4. The use of nomograms does not require an analytical evaluation of the effect of different impacting factors on the relative parameter Δ N T K because, with the help of a nomogram, it is realized for every evaluated variant.
Note that at this research stage, all key factors were independent, except for the equality π C = π T that determined the structure of the closed circulating nitrogen cycle. In this nomogram, technological ( η C . a d ,   η T . a d ,   η H E ) and energy ( T e g ,   G N 2 ) parameters of an operation were set and regarded as independent. In practice, most of them are interrelated:
T 3 depends on exhaust gas temperature T e g , exhaust gas flow G d , circulating N 2 flow, π k ,   π T , and efficiency factors of a heat exchanger ( η H E ) ;
T 1 depends on the heat transfer balance in the heat exchanger H E 2 (which are the parameters G C H 4 ,   G N 2 ,   and   T 6 )
Therefore, in solving the practical tasks of the nomogram, it was rational to describe the limitations of the existing relations between the parameters.
The solutions for the gas engine that used natural gas G C H 4 are presented below.

3.1. Limitations of T 3 Compared with T e g

The parameter T e g was independent of the N 2 cycle and determined by the load regime of a particular engine. The condition T 3 = T e g was for an ideal scenario: η H E 3 = 1.0 , and maintaining the following conditions: the heat is removed from the exhaust gas up to the ‘dew point’ ~132 °C (normal conditions), which is sufficient to warm up the nitrogen G N 2 up to temperature T e g . Heat balance equation is expressed as:
G N 2 · c p N 2 · Δ T G e g · c p . e g ( T e g 405 )
or   G N 2 · c p N 2 · Δ T G e g · c p . e g ( T e g 405 )
where c p . e g is the specific heat of exhaust gases.
If the inequality is true, the parameter Δ T is an increase in N 2   temperature from T 5 due to heat exchange with engine exhaust gas up to T e g . In the opposite scenario, T 3 will be lower than T g by the value Δ T f .
Engine technical documentation consists of fuel consumption data G f [kg/h]; at certain load mode, a coefficient of excess air α and T e g are known. Subsequently, G e g = ( α L 0 + 1 ) G f and Equation (7) is represented by the following equation:
G N 2 · c p N 2 · Δ T ( α L 0 + 1 ) G f · c p . e g ( T e g 405 )
At different α and temperatures, c p N 2 and c p . e g are determined by interpolation from standard references. Table 2 represents c p . e g values for approximate evaluation when the engine operates on diesel fuel and natural gas ( C H 4 ).
For a preliminary evaluation (modes comparable to nominal power, because α intensively increasing at low load modes)   λ = 2.0 value is accepted; in a result G e g = 35 G f . If the G N 2 value is lower than G e g ( c p . e g ( T e g 405 ) Δ T · c p N 2 ) , temperature T 3 will attain T e g . In an opposite scenario, reduce temperature T 3 in comparison to T g :
[ Δ T Δ T f ] · c p N 2 · G N 2 = 35 G f · c p . e g ( T e g 405 )
where Δ T f = Δ T · c p N 2 · G N 2 35 G f · c p . e g ( T e g 405 ) c p N 2 · G N 2 ;
For the calculation of temperatures Δ T f or T 3 values, the concretization of Δ T is necessary using ( T e g T 4 ). For T 3 to be equal to T e g   (at η H E 3 = 1 , 0 ) , the inequality must be:
G N 2 · c p N 2   ( T e g T 5 ) G e g c p . e g ( T e g 405 )
However, according to an accepted condition η H E 3 = 1 , 0 , T 5 = T 4 (i.e., N 2 attains the temperature after expansion in a turbine).
The temperature T 4 = T e g ( 1 ( 1 1 π T k 1 k ) η T a d )
Finally, for the condition execution:
G N 2 · c p N 2   ( T e g T e g ( 1 ( 1 1 π T k 1 k ) η T . a d ) ) ) = G e g c p . e g ( T e g 405 )
Equality of T 3 = T g is ensured if a left side of Equation (12) is higher than or equal to the right side. Equation (12) enables the evaluation of the G N 2 boundary values for different π T values (or π C based on the condition π C =   π T ) for certain operation modes of specific engines:
G N 2 · c p N 2   · T e g ( 1 1 π T k 1 k ) · η T . a d = G g c p . e g ( T g 405 )
G N 2 = G g c p . e g   ( T e g 405 ) c p N 2 T e g   ( 1 1 π T k 1 k ) · η T . a d

Example of Analytical Calculation Application for Medium-Speed Six-Cylinder Four-Stroke Engine

The evaluation of a six-cylinder four-stroke engine (bore/stroke 30/50) was conducted in nominal and part load modes of propulsion characteristics. Nominal mode: P e = 3500 kW; G e g = 23,950 kg/h = 6.65 kg/s; T e g = 775 K; c p . e g   ~ 1.15 kJ/kg K; c p N 2   ~ 1.06 kJ/kg K;   η T . a d = 0.8 . Part load mode: P e = 400 kW; G e g = 7500 kg/h = 2.08 kg/s; T e g =   575 °K; η T . a d = 0.8 . The results of boundary nitrogen flow boundary G N 2 bound are shown in Table 3.
Entering the received data into the cogeneration cycle nomogram enables a rational field for combinations of parameters for the selected engine to be described.

3.2. Determination of Temperature T 1

If a simulated engine uses natural gas ( C H 4 ) from a supply line, a cold potential of C H 4 assessed as unlimited, i.e., T 1 extends to −161 °C (LNG liquid phase temperature). A scenario is represented below where C H 4 flow is used only as a fuel to feed an engine, i.e., all flow G N 2 is used for engine feed.
The warming of N 2 from T 6 to T 1 (exiting the heat exchanger HE2) is revealed by Equation (15):
( T 6 T 1 ) c p N 2 · G N 2 = G f · c p C H 4 ( 293 112   K ) + G f · c e v
(at P = 0.5 0.6   MPa ), where c e v is the evaporation heat of liquid C H 4 , (293 − 112) K − C H 4 vapor warming up to +20 °C for delivery to an engine.
For a more accurate calculation:
( T 6 T 1 ) c p N 2 · G N 2 = G f ( i i i 2 )
where i i is the enthalpy of C H 4 superheated steam at P = 0.5 0.6   Mpa , and i 2 is the enthalpy of liquid C H 4 . According to Reference [77] ( i i i 2 )   ≈ 750–800 kJ/kg. If ( T 6 T 1 ) c p N 2 · G N 2 < G f ( i i i 2 ) , nitrogen will be chilled in heat exchanger HE2 up to 112 K.
On the assumption that the efficiency of the heat exchanger HE1 is η H E 1 = 1.0 , a flow of nitrogen will be cooled from temperature T 4 (after expansion in the turbine) up to the nitrogen temperature T2 (exiting from compressor). That means that the N2 flow in heat exchanger HE2 is cooled from T 2 to T 1 .
As a result, Equation (16) is transformed into Equation (17):
( T 2 T 1 ) c p N 2 · G N 2 = G f ( i i i 2 ) = G f · 750
For a boundary condition to attain T 1 = 112   K   ( C H 4 liquid phase temperature), Equation (18) is used:
( T 2 T 1 ) = G f · 750   c p N 2 · G N 2     ,
or   T 1 ( 1 + π C k 1 k 1 η C . a d ) T 1 = G f · 750   c p N 2 · G N 2 ,
T 1 ( 1 + π C k 1 k 1 η C . a d 1 ) = G f · 750   c p N 2 · G N 2     ,
Finally ,   T 1     = G f · 750   c p N 2 · G N 2 ( ( π C k 1 k 1 ) C . a d ) = 112   K .
As an example in the nomogram (Figure 4), a nitrogen temperature T 1 = 112   K is ensured by drawing a limiting curve for a six-cylinder four-stroke diesel engine (bore/stroke 30/50) according G f / G N 2 ) and π C parameters. A specific π C exists (assumption η C . a d = idem) for each G f / G N ratio when T 1 = 112   K is ensured. An increase in temperature T 1 from –112 K by Δ T 1 is determined according to Equation (14):
{ ( 112 + Δ T 1 ) ( π C 2 k 1 k 1 η C . a d ) = ( G f G N 2 ) 2 · 750 c p N 2 , 112 ( π C 1 k 1 k 1 η C . a d ) = ( G f G N 2 ) 1 · 750 c p N 2 ,
where indexes ‘1’ and ‘2’ are assigned to the ‘limit’ variant to ensure T 1 = 112   K and T 1 increases above 112 K, respectively. After the solution of the equation system:
( 112 + Δ T 1 112 ) = ( G f G N 2 ) 2 ( G f G N 2 ) 1 × ( π C 1 k 1 k 1 η C . a d ) ( π C 2 k 1 k 1 η C . a d )
Finally ,   Δ T 1 = 112 [ ( G f G N 2 ) 2 ( G f G N 2 ) 1 × ( π C 1 k 1 k 1 η C . a d ) ( π C 2 k 1 k 1 η C . a d ) 1 ]
Δ T 1 changes from limit value 112 K if any of impacting factors G f , G N 2 , π C , and possibly η C . a d are changed. Based on Equation (10), boundary values of G N 2 and G N 2 b o u n d . parameters are determined (Table 4) for a six-cylinder four-stroke diesel engine (bore/stroke 30/50) operating in the nominal load ( P e = 3500 kW) and part load ( P e = 400 kW) modes.
The obtained results (Figure 4) justify the significant effect of this aspect on the functioning of the cogeneration cycle to ensure high energy consumption rates. Analytical evaluations and nomograms conducted for technology operating in an ideal condition when the efficiency of all heat exchangers is EC = 1.0. The effect of deviations from the ideal scenarios of heat exchangers useful performance factor on electricity generation assumed by decreasing H E from 1.0 to 0.9. The results of Δ N i C change are shown in Figure 4. The evaluation was performed with two limit options of T e g = 200 and 500 °C, and π C = π T changed in range of 2–5 units.
Figure 4 shows the effect of an increase in the turbo compressor and turbine efficiency on the final effect of the system’s Δ N C T functioning (for a base version accepted condition η C . a d = η T . a d = 0.8 ). Furthermore, the cogeneration cycle nomogram aids in determining the interconnection of parameters ensuring the efficiency of a turbine and compressor operation to produce electricity.
Thus, point 1, corresponding to selected π T (e.g., 3), in the first quadrant of the nomogram is determined for a selected temperature T 1 (e.g., 273 °C). The projection of this point on the axis N C forms the corresponding point 1. The specific compressor output N C c P N 2 · G N 2 (point 1, corresponding to 110 K) is determined for a selected compressor efficiency η C . a d value (e.g., 0.9). At a boundary condition N C = N T , a corresponding result on the N T axis must be obtained from projections of the T e g π T relationship. Subsequently, the relationship between the parameters T e g and π C is defined as the intersection point 2 in the second quadrant using the corresponding values of the projections (e.g., selecting η T . a d =0.9; point 2).

3.3. Combinations of Optimization

To ensure an effective operation of the system during electricity production (i.e.,   N T > N C ), the values of parameters T e g and π T are necessary from the second quadrant field (at Teg and π T values higher than at point 2). Changing π T , η C . a d , and η T . a d   , preliminary conceptual decisions (equipment functioning and construction parameters) of the system are concretized with the aid of the nomogram (Figure 5) for aggregate assembly.
The task could be solved in a more general context. The 2nd quadrant of the nomogram defines the field of positive values of Δ N T C , where the power of a turbine N T is higher than the compressor power N C for any ratio π T   T e g   G N 2 .
In the 1st quadrant, 4–5 dots are fixed on the selected line T 1 at different values of π C from the predetermined range. The projections determined from selected π C to the selected value of   C . a d line and further to N C / ( c P N · G N 2 ) and axes. The points obtained from the axis N T / ( c P N 2 · G N 2 ) designed on the selected 3rd quadrant line η T . a d and further into the 2nd quadrant, where the values cross the corresponding π C values. The obtained intersection points are joined by a line, which separates the field N T N C in the 2nd quadrant.

3.4. Factors Defining the Energy Efficiency of the System

The factors with the highest effect on the energy efficiency of the cogeneration system were identified by performing various simulations, the results of which are shown in Figure 5 and Figure 6.

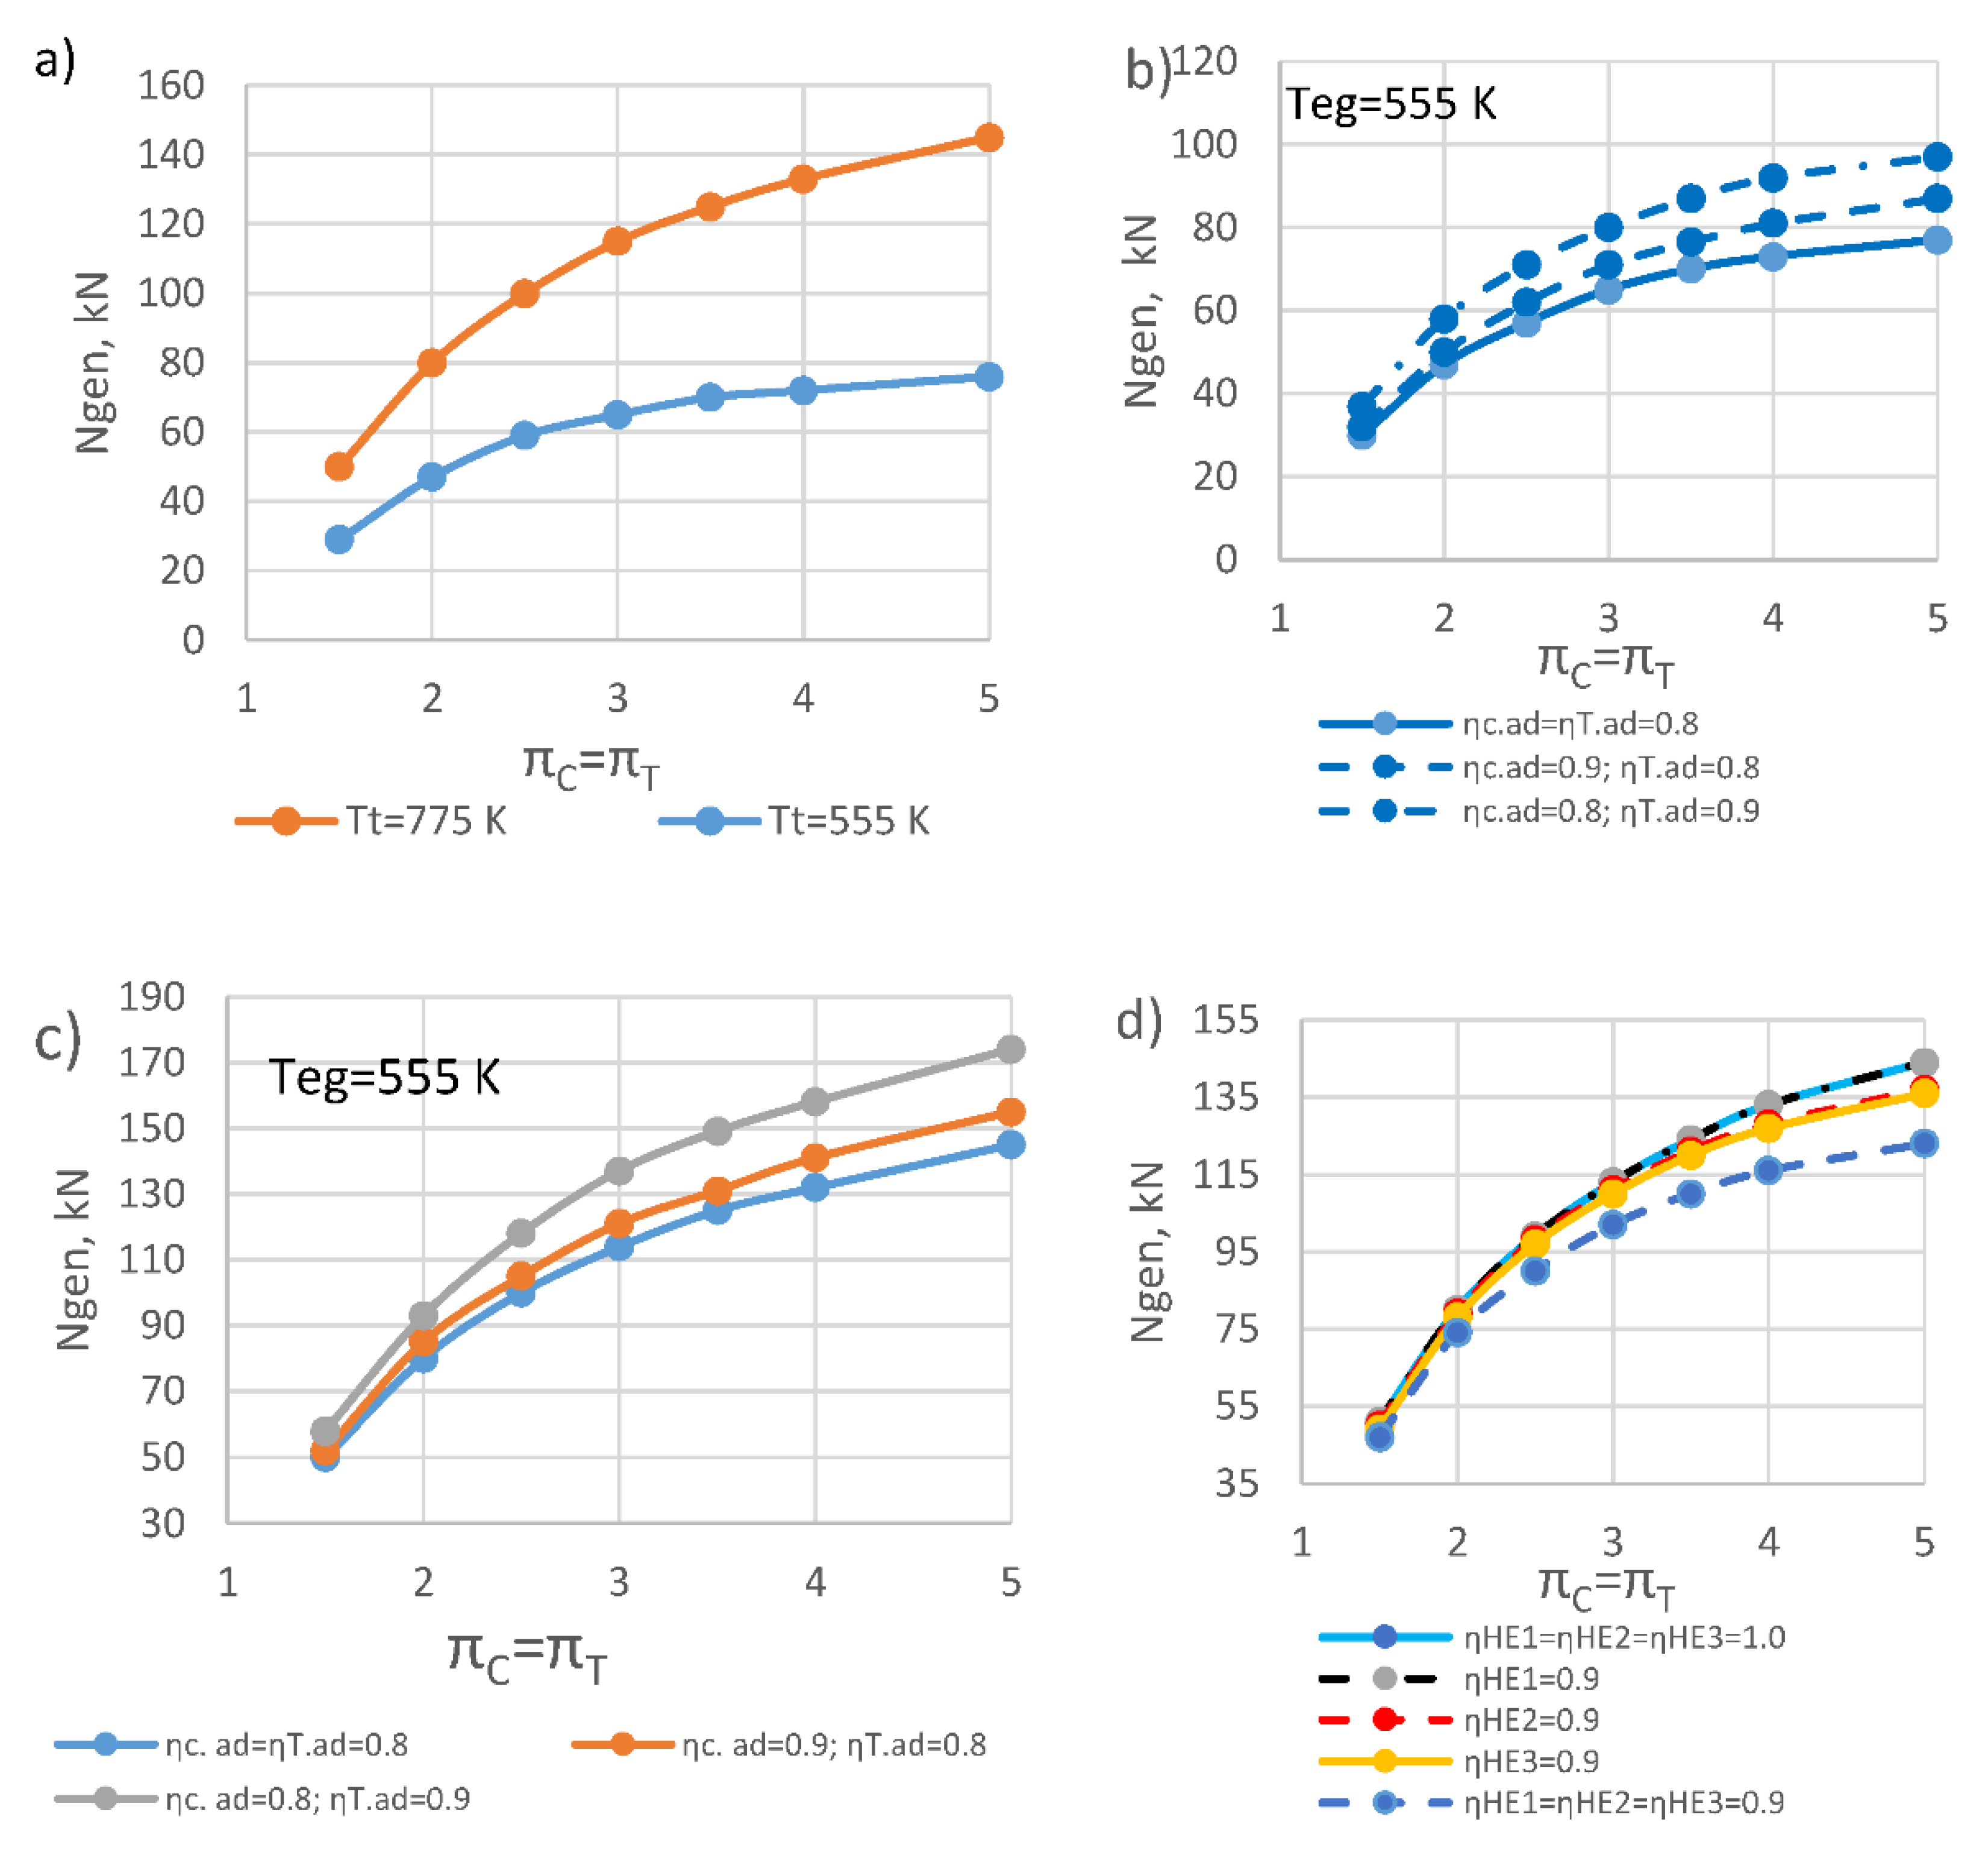
3.4.1. Effect of Exhaust Gas Teg

Figure 5a shows the data of the engine exhaust temperature Teg for a generated electricity (Ngen) at different π C   = π T values. Increasing Teg by 220 K approximately doubled the energy efficiency of the system operation: beginning from π C   > 2.0, the parameter Ngen increased by 70–85% or 3.2–3.9% for 10 K of Teg. The approximation dependencies N g e n = f ( π C   ,   T e g v a r ) exhibited a non-linear nature: the increase in pressure of a turbocharger unit above π C   ( π T ) > 3.0 decreased the effect on Ngen. For example, an increase of π C   ( π T ) for every 0.5 units up to 3.0 determined an increase in Ngen by 7–10 kW and only by 4–5 kW in range π C   ( π T ) = 3.0–5.0 units. In contrast, the value of Ngen was directly proportional to the flow of N 2 circulating in the closed loop (GN2 = 1.0 kg/s in the variation calculation). Thus, the realization of a cogenerating cycle is rational when π C   ( π T ) ≤ 3.0 at a maximal realized GN2. Furthermore, a realization of a high pressure in a TK is known to be related to the difficulty in ensuring high efficiency in a wide range of TK operating modes [78,79].

3.4.2. Effect of Turbo Unit Efficiency

Figure 5b shows the impact evaluation results of adiabatic efficiency of the compressor η C . a d and turbine η T . a d . The effect of η C . a d increasing from 0.8 to 0.9 on Ngen did not exceed 6 kW (regardless of Teg). The effect of a turbine’s η T . a d in the same range was significantly higher: an increase of Ngen was from 9 kW at Teg = 555 K and up to 15 kW at Teg = 775 K or ~13% (Figure 5c). Thus, the primary accents of the TC model selection should be given to select the following combination of parameters: high productivity Teg and medium pressure π C   ( π T ) ~3.0 units at a maximal efficiency η T . a d of the turbine.

3.4.3. Effect of the Efficiency of Heat Exchangers

Figure 5d shows the results of the effect of the efficiency of heat exchangers ( η H E ) on the evaluation. The results ranged from an ideal scenario ( η H E =1.0) for thermal efficiency of heat exchangers up to an actual scenario. In practice, the value of ~0.9 does not have a significant effect on Ngen in the range of π C   ( π T ) 3.0 . A decrease in the energy efficiency of the system one by one in η H E system results only in 2–3 kW.
A decrease from 1.0 to 0.9 of the general η H E in existing heat exchange system results in a decrease in system efficiency by 12 kW at π C   ( π T ) = 3.0, which is ~11%, and limiting values of π C   ( π T ) = 5.0 efficiency results in a decrease of 21 kW or ~15%. Generally, the effect on Ngen is related to an efficiency change of LNG heat exchanger N2 (Figure 5d). When the η H E of LNG- N 2 heat exchanger decreases, the temperature T1 of entering nitrogen increases by 14–17 K from entry-level 112 K.
The increase in temperature Teg is determined by the change in the efficiency of the LNG- N 2 heat exchanger. Earlier variation calculations are based on an ‘external’ unlimited LNG cold potential which in itself ensures the value Teg ≈ 112 K η H E = 1.0 of exiting flow from the exchanger. System operation variants are related to an LNG ‘internal’ use, i.e., with direct use only in an engine, and when LNG’s cold potential is lacking; this results in an intensive increase in temperature T1, particularly at high N 2 flow rates.

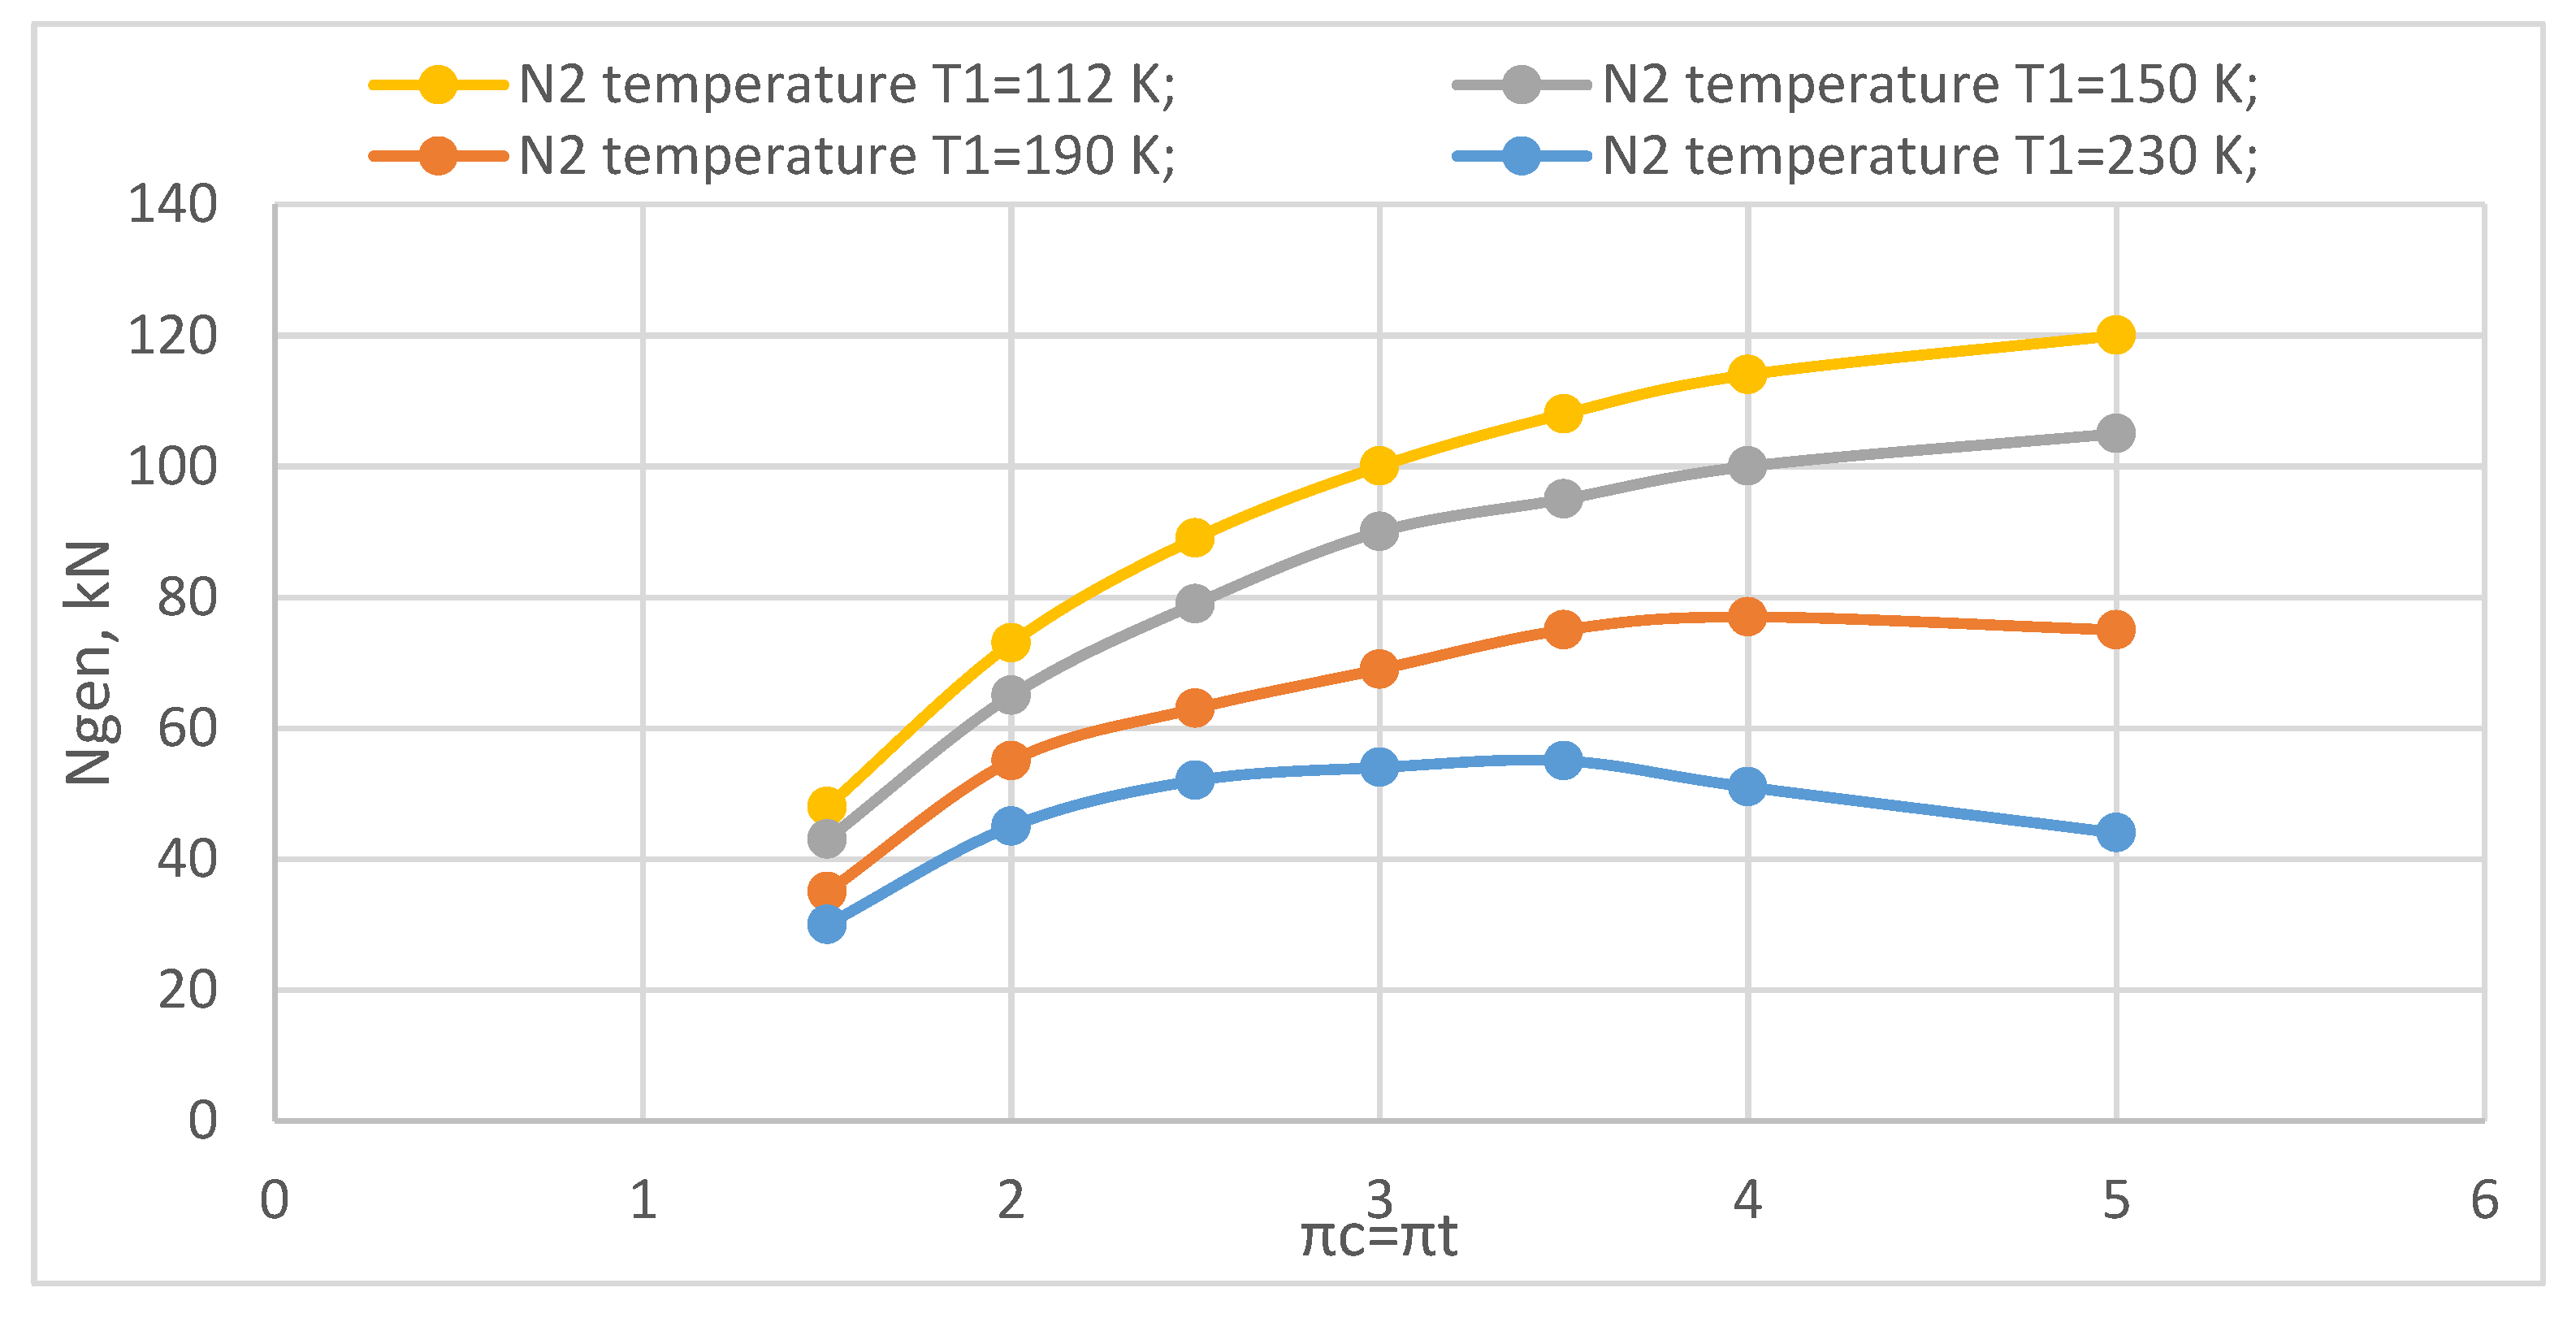
3.4.4. Effect of Nitrogen Temperature

Figure 6 shows the results of the evaluation of the effect of temperature T1 from the LNG- N 2 heat exchanges on Ngen. The evaluation was conducted for a T1 range of 125–230 K at actual values of H E = 0.9 and maximal temperature Teg = 775 K. The effect of change in T1 on Ngen was comparable to linear dependency. Each increment of T1 by 10 K resulted in a lower value of Ngen by ~5 kW at π C   ( π T ) = 3.0. At higher TK pressure π C   ( π T ) = 5.0, the effect of change in T1 increased up to 8 kW. Hence, when T1 increased, the effect of pressure change decreased. When T1 attained a range of 220–230 K, Ngen became independent from π C   ( π T ) . Thus, an effective application of the cogeneration system in a ship can be ensured by making an alignment between G N 2 flow rate and parameters of the LNG engine’s fuel consumption and energy efficiency of the exhaust gas.

4. Conclusions

Based on the theoretical foundations of turbo machines and heat exchangers, a mathematical model of the closed-loop nitrogen cogeneration cycle and its electronic simulation (using LabView [National Instruments]) for a ship power plant were created.
For higher efficiency, for a practical selection of rational parameters of a power plant cogeneration cycle, a nomogram of an interconnection of cogeneration cycle parameters was created and experimental data were adapted. With the aid of the nomogram, in the function of selected cycle technological parameters (turbo unit pressure and efficiency rate, exhaust gas temperature, flow rate of circulating nitrogen, and efficiency rate of heat exchangers), the amount Ngen of electricity produced in the cogeneration cycle was determined.
1. Using a variable simulation the key parameters determining the energy efficiency was investigated for a six-cylinder four-stroke engine fueled by LNG, and technological principles of energy efficiency (Ngen) improvement were formulated:
  • In the judgment of the authors, the main advantage for the practical use of the completed development, in contrast to a number of similar ones, is an open algorithm that provides for the expansion of the model in accordance with the technological features of the heat recovery systems under study, as well as operating mainly with thermodynamic parameters without concrete definition of the constructive nodes. The latter, including on the basis of the created electric simulator, expands the possibilities of a variant search and justification of rational ways to increase the indicators of the energy efficiency of cogeneration systems.
  • With an unlimited ‘external’ cold potential of LNG (for example, an LNG carrier power plant), the energy efficiency of a cogeneration cycle determined by the exhaust gas temperature Teg of the power plant, turbo unit pressure π C   ( π T )   (for practical implementation in a rational range up to 3.0–3.5 units), and flow rate G N 2 of circulating nitrogen is directly proportional to the implemented Ngen. A turbo unit with high output and average pressure π C   ( π T )   ~ 3.0–3.5 with a high adiabatic efficiency turbine is a more rational selection for a cogeneration cycle assembling by technological units. The effect of selected thermal efficiency rates of the heat exchangers (in range of change 1–0.9) on Ngen does not exceed ~10%.
  • With a limited potential of LNG cold flow and LNG ‘internal’ use only as fuel for ship engines, a harmonization between the flow rate of the circulating nitrogen and engine load modes is necessary. The temperature T1 of the exiting nitrogen from an LNG- N 2 heat exchanger has a significant effect on the energy efficiency Ngen. For each temperature increase of 10 K, the average decrease of Ngen value is 5–8 kW or 5–6%.
2. The created mathematical model of an electronic simulator, using accepted assumptions, addressed the alternative search of rational and constructive solutions for the cogeneration cycle. A further aspect of mathematical model improvement provided for optimization of operation parameters:
  • To implement a simulation of the TK compressor and turbine parameters based on the real characteristics of aggregates G N 2 = (πC, ηC.ad, nTC); G N 2 = (πT, T3, nTC).
  • To apply a mathematical model to determine the operating process parameters of an LNG engine and to ensure its operation together with the cogeneration cycle model.

Author Contributions

Conceptualization, Z.W., S.L., P.R., and R.M.; methodology, S.L. and J.Z.; software P.R. and X.L.; validation, Z.W. and S.L.; formal analysis, Z.W., S.L., P.R., and V.D.; investigation, P.R., J.Z., Z.W., and X.L.; resources, X.L. and V.D.; data curation, S.L., Z.W., and P.R.; writing—original draft preparation, Z.W. and R.M.; writing—review and editing, S.L., Z.W., J.Z., and V.D.; visualization, P.R. and X.L.; supervision, S.L.; project administration, R.M.; funding acquisition, Z.W. and R.M. All authors have read and agreed to the published version of the manuscript.

Funding

This research was funded by the Shanghai Government Science and Technology Commission, grant number 17170712100.

Conflicts of Interest

The authors declare no conflict of interest.

Nomenclature

HEHeat exchanger
CCompressor
TTurbine
TCTurbo compressor (turbo unite)
DEDiesel engine
E C Efficiency coefficient
η H E Efficiency coefficient of the heat exchanger
η C . a d Adiabatic efficiency coefficient of compressor
η T . a d Adiabatic efficiency coefficient of turbine
η T C M Mechanical efficiency coefficient of TC
Q e g Heat of exhaust gases
Q N 2 H E 3 Heat transfer in heat exchanger number 3
T e g Exhaust gases temperature
C P N 2 Nitrogen specific isobaric heat
C P e g Exhaust gases specific isobaric heat
β Energy pulse factor
G N 2 Nitrogen flow
G e g Exhaust gas flow
G f Fuel consumption
π C Degree of pressure increase of the compressor
π T Degree of pressure decrease of the compressor
k Adiabatic coefficient
G N 2   b o u n d Boundary nitrogen flow
N C Compressor power
N T Turbine power
nEngine maximum operating speed
ACoefficient of nitrogen flow impulses effect
λexcess air ratio
lTturbine operation
lCcompressor operation
nTCcompressor speed
ψoutflow leakage function

References

  1. The Sustainable Development Agenda. Available online: https://www.un.org/sustainabledevelopment/development-agenda/ (accessed on 15 April 2020).
  2. Greenhouse Gas Emissions from Transport in Europe. Available online: https://www.eea.europa.eu/data-and-maps/indicators/transport-emissions-of-greenhouse-gases/transport-emissions-of-greenhouse-gases (accessed on 15 April 2020).
  3. IPCC. Climate Change 2014: Mitigation of Climate Change; Cambridge University Press: Cambridge, UK; New York, NY, USA, 2014. [Google Scholar]
  4. CO2 Emissions Statistics. Available online: https://www.iea.org/statistics/co2emissions/ (accessed on 15 April 2020).
  5. Anink, D.; Krikke, M. The IMO Energy Efficiency Design Index—A Netherlands Trend Study. Cent. Marit. Technol. Innov. 7 January 2009. [Google Scholar]
  6. Energy Efficiency Related Rules and Regulations—EEDI and Ship Design. EEDI and other EEE Rules and Regulations Mia Elg.—2014—55 c. Available online: http://laradi.fi/images/files/syyspaivat_2014/Deltamarin_Elg_EE_Rules_and_Regulations_-_EEDI.pdf (accessed on 10 November 2014).
  7. Fournier, A. Controlling Air Emission from Marine Vessels: Problems and Opportunities A. Fournier.—University of California Santa Barbara.—2006—91 c. Available online: http://www.ourair.org/itg/past-activities (accessed on 12 October 2012).
  8. European Environmental Bureau (EEB). Available online: http://eeb.org/ (accessed on 15 April 2020).
  9. Black Carbon Emissions and Fuel Use in Global Shipping, 2015. International Council on Clean Transportation. Available online: https://theicct.org/sites/default/files/publications/Global-Marine-BC-Inventory-2015_ICCT-Report_15122017_vF.pdf (accessed on 16 April 2020).
  10. IMO–Draft Union Submission to be Submitted to the Intersessional Meeting of the IMO on the Consistent implementation of Regulation 14.1.3 of MARPOL Annex VI in London 9–13 July 2018–Port State Control Guidelines. Available online: http://data.consilium.europa.eu/doc/document/ST-8759-2018-INIT/en/pdf (accessed on 16 April 2020).
  11. IMO Marine Engine Regulations. Available online: https://www.dieselnet.com/standards/inter/imo.php (accessed on 16 April 2020).
  12. Assessment of Fuel Oil Availability. Final Report. Available online: http://www.imo.org/en/OurWork/Documents/MEPC%2070-INF.6%20-%20Assessment%20of%20fuel%20oil%20availability.pdf (accessed on 16 April 2020).
  13. Demidova, N.P.; Marchenko, A.A.; Onishchenko, O.A. Basic indexes of ship fuel and their basic operating properties. Bull. Kamchatka State Tech. Univ. 2015, 6–11. [Google Scholar] [CrossRef]
  14. Keith, W. Older Vessels to Be Phased out within Two to Three Years of IMO Sulphur Cap. Available online: https://safetyatsea.net/news/2018/older-vessels-to-be-phased-out-within-two-to-three-years-of-imo-sulphur-cap (accessed on 20 April 2020).
  15. Panasiuk, I.; Lebedevas, S.; Čerka, J. The assessment algorithm of technological feasibility of SOX scrubber installation. Transport 2018, 33, 197–207, ISBN: 1648-4142, eISSN: 1648-3480. [Google Scholar] [CrossRef] [Green Version]
  16. Panasiuk, I.; Turkina, L. The evaluation of investments efficiency of SOX scrubber installation. Transp. Res. Part D Transp. Environ. 2015, 40, 87–96. [Google Scholar] [CrossRef]
  17. Olmer, N.; Comer, B.; Roy, B.; Mao, X.; Rutherford, D. Greenhouse Gas Emissions from Global Shipping, 2013–2015. Available online: https://theicct.org/sites/default/files/publications/Global-shipping-GHG-emissions-2013-2015_ICCT-Report_17102017_vF.pdf (accessed on 20 April 2020).
  18. EMEP/EEA Air Pollutant Emission Inventory Guidebook 2016. Available online: https://www.eea.europa.eu/themes/air/emep-eea-air-pollutant-emission-inventory-guidebook (accessed on 22 April 2020).
  19. Naohiro, H. Technologies Update for IMO NOX Tier III Regulations. Available online: https://www.mhi-mme.com/news/4_Technologies_update_for_IMO_NOX_Tier3_regulations.pdf (accessed on 23 April 2020).
  20. Winnes, H.; Fridell, E.; Yaramenka, K.; Nelissen, D.; Faber, J.; Ahdour, S. NOX controls for shipping in EU Seas. Available online: https://www.transportenvironment.org/sites/te/files/publications/2016_Consultant_report_shipping_NOX_abatement.pdf (accessed on 23 April 2020).
  21. Lindstad, H.E.; Eskeland, G.S. Environmental regulations in shipping: Policies leaning towards globalization of scrubbers deserve scrutiny. Transp. Res. Part D Transp. Environ. 2016, 47, 67–76. [Google Scholar] [CrossRef] [Green Version]
  22. Dnv, G.L. IMO NOX Tier III Requirements to Take Effect on 1 January 2016. Available online: https://goo.gl/ZKAoTw (accessed on 1 November 2017).
  23. Joint Industry Guidance The Supply and Use of 0.50%-Sulphur Marine Fuel. Available online: https://www.ocimf.org/media/137137/Marine-fuels-guidance-Final-draft-19-August-2019-V3.pdf (accessed on 23 April 2020).
  24. ABS Advisory on Exhaust Gas Scrubber Systems, July 2018. Available online: https://ww2.eagle.org/content/dam/eagle/advisories-and-debriefs/exhaust-gas-scrubber-systems-advisory.pdf (accessed on 23 April 2020).
  25. Exhaust Scrubbers. What You Need to Know. Bureau Veritas-Marine and Offshore Division. Available online: https://marine-offshore.bureauveritas.com/sites/g/files/zypfnx136/files/media/document/Scrubbers_04-2015.pdf (accessed on 23 April 2020).
  26. MEPC, Resolution. 2013 Guidelines for Calculation of Reference Lines for Use with the Energy Efficiency Design Index (EEDI). Annex 14 2013, 231, 12. Available online: http://www.imo.org/en/OurWork/Environment/PollutionPrevention/AirPollution/Documents/231%2865%29.pdf (accessed on 26 April 2020).
  27. MEPC, Resolution. 2014 Guidelines on the Method of Calculation of the attained energy efficiency design index (EEDI) for new ships. 66/21/Add 1 Annex 5 2015, 245, 30. Available online: www.schonescheepvaart.nl/downloads/regelgeving/doc_1400076573.pdf (accessed on 26 April 2020).
  28. Bezyukov, O.K.; Zhukov, B.A.; Yashchenko, O.I. Dual-Fuel engines on water transport. Bull. Admiral Makarov State Univ. Marit. Inland Shipp. 2014, 6, 31–39. [Google Scholar] [CrossRef]
  29. European Commission. Alternative Fuels Expert Group Report. Available online: https://ec.europa.eu/transparency/regexpert/index.cfm?do=groupDetail.groupDetailDoc&id=34592&no=1 (accessed on 28 April 2020).
  30. Gerd Michael Würsig. Alternative Fuels: The Options. Available online: https://www.dnvgl.com/expert-story/maritime-impact/alternative-fuels.html (accessed on 28 April 2020).
  31. IMO. Studies on the Feasibility and Use of LNG as a fuel for shipping. Available online: http://www.imo.org/en/OurWork/Environment/PollutionPrevention/AirPollution/Documents/LNG%20Study.pdf (accessed on 30 April 2020).
  32. Anderson, M.; Salo, K.; Fridell, E. Particle-and Gaseous Emissions from an LNG Powered Ship. Environ. Sci. Technol. 2015, 49, 12568–12575. [Google Scholar] [CrossRef]
  33. Thomson, H.; Corbett, J.J.; Winebrake, J.J. Natural gas as a marine fuel. Energy Policy 2015, 87, 153–167. [Google Scholar] [CrossRef] [Green Version]
  34. Le Fevre, C.N. A Review of Demand Prospects for LNG as a Marine Transport Fuel; Oxford Institute for Energy Studies: Oxford, UK, 2018. [Google Scholar] [CrossRef]
  35. Great Britain, Parliament, House of Commons, Transport Committee. Sulphur Emissions by Ships: Sixteenth Report of Session 2010-12, 1, Report, Together with Formal Minutes, Oral and Written Evidence; Parliament: House of Commons: Transport Committee: Great Britain, UK, 2012; p. 78. Available online: https://publications.parliament.uk/pa/cm201012/cmselect/cmtran/1561/1561vw.pdf (accessed on 17 September 2020).
  36. Valladolid, P.G.; Tunestål, P.; Monsalve-Serrano, J.; García, A.; Hyvönen, J. Impact of diesel pilot distribution on the ignition process of a dual fuel medium speed marine engine. Energy Convers. Manag. 2017, 149, 192–205. [Google Scholar] [CrossRef] [Green Version]
  37. Wartsila. Wärtsilä Low-Speed engines NOX-Emission-Tier lll Solutions. INTERTANKO Annual Event Technical Workshop-Air Emissions NOX Tier lll Athens. 2015. Available online: http://www.intertanko.com/Global/presentations/2015/Intertanko_W%C3%A4rtsil%C3%A4_low-speed_engine_Tier3.pdf (accessed on 4 May 2020).
  38. Wärtsilä 20DF Product Guide. Available online: https://www.wartsila.com/docs/default-source/product-files/engines/df-engine/product-guide-o-e-w20df.pdf?utm_source=engines&utm_medium=dfengines&utm_term=w20df&utm_content=productguide&utm_campaign=msleadscoring (accessed on 4 May 2020).
  39. Wärtsilä 31 Product Guide. Available online: https://www.wartsila.com/docs/default-source/product-files/engines/ms-engine/product-guide-o-e-w31.pdf?utm_source=engines&utm_medium=dieselengines&utm_term=w31&utm_content=productguide&utm_campaign=msleadscoring (accessed on 4 May 2020).
  40. MAN Diesel and Turbo SE products. Available online: https://www.man-es.com/marine/products/four-stroke-engines (accessed on 4 May 2020).
  41. Peter, K. 2019 Will be the Year of Acceleration for LNG as Marine Fuel. Available online: https://www.maritime-executive.com/editorials/2019-will-be-the-year-of-acceleration-for-lng-as-marine-fuel (accessed on 11 May 2020).
  42. DNV GL. LNG Regulatory Update. Available online: http://www.golng.eu/files/Main/20180417/2.%20Ole%20Vidar%20Nilsen%20-%20DNV%20GL.pdf (accessed on 12 April 2020).
  43. DNV GL AFI Platform: Tank Capacity Shows LNG a Growing Force in Large Vessel Orders. Available online: https://www.dnvgl.com/news/dnv-gl-afi-platform-tank-capacity-shows-lng-a-growing-force-in-large-vessel-orders-149176 (accessed on 20 May 2020).
  44. Direktiva–Kogeneracija. 2016. Available online: https://eur-lex.europa.eu/legal-content/HR/TXT/?uri=CELEX%3A32004L0008 (accessed on 16 May 2020).
  45. Brozičević, M.; Martinović, D.; Kralj, P. Techno-economic analysis of the cogeneration process on board ships. J. Sustain. Dev. Transp. Logist. 2017, 2, 6–15. [Google Scholar] [CrossRef] [Green Version]
  46. Erofeyev, V.L.; Zhukov, A.V.; Melnik, O.V. On the possibilities of using secondary energy resources in marine engine. Bull. Admiral Makarov State Univ. Marit. Inland Shipp. 2017, 570–580. [Google Scholar] [CrossRef] [Green Version]
  47. Kamkin, S.V.; Lemeshchenko, A.S.; Punda, A.S. Improving the efficiency of marine diesel engines. SPB Shipbuild. 1992, 176, ill, ISBN 5-7355-0162-3. [Google Scholar]
  48. Ma, Z.; Yang, D.; Guo, Q. Conceptual Design and Performance Analysis of an Exhaust Gas Waste Heat Recovery System for a 10000TEU Container Ship. Pol. Marit. Res. 2012, 19, 31–38. [Google Scholar] [CrossRef] [Green Version]
  49. Miller, E.W.; Hendricks, T.J.; Peterson, R.B. Modeling energy recovery using thermoelectric conversion integrated with an organic Rankine bottoming cycle. Electron. Mater. 2009, 38, 1206–1213. [Google Scholar] [CrossRef]
  50. Tian, H.; Shu, G.; Wei, H.; Liang, X.; Liu, L. Fluids and parameters optimization for the organic Rankine cycles (ORCs) used in exhaust heat recovery of Internal Combustion Engine (ICE). Energy 2012, 47, 125–136. [Google Scholar] [CrossRef]
  51. Kalinichenko, I.V.; Andreev, A.A.; Andreeva, N.B. Receiving steam on a ship by a heat pump. Water Transp. 2015, 2, 48–57. [Google Scholar]
  52. Volyntsev, A.B.; Sobolenko, A.H. Utilization of thermal resources of the main ship engine through the use of a heat pump unit. Bull. Admiral Makarov State Univ. Marit. Inland Shipp. 2016, 5, 144–150. [Google Scholar]
  53. Noora, A.M.; Putehc, R.C.; Martinez-Botasd, R.; Rajooa, S.; Romagnolie, A.; Basheera, U.M.; Sallehb, S.H.S.; Saha, M.H.M. Technologies for Waste Heat Energy Recovery from Internal Combustion Engine: A Review. In Proceedings of the International Conference on “New Trends in Multidisciplinary Research & Practice”, Istanbul, Turkey, 4–5 November 2015. [Google Scholar] [CrossRef]
  54. Saidur, R.; Rezaei, M.; Muzammil, M.K.; Hassan, M.H.; Paria, S.; Hasanuzzaman, M. Technologies to Recover Exhaust Heat from Internal Combustion Engines. Renew. Sustain. Energy Rev. 2012, 16, 5649–5659. [Google Scholar] [CrossRef]
  55. Yang, J.; Stabler, F.R. Automotive applications of thermoelectric materials. J. Electron. Mater. 2009, 38, 1245–1251. [Google Scholar] [CrossRef]
  56. Mazar, B. State of The Art Prototype Vehicle with a Thermoelectric Generator. In TE Application Workshop; BMW Group: Baltimore, MA, USA, 2012. [Google Scholar]
  57. Guillen, D.; Klockow, H.; Lehar, M.; Freund, S.; Jackson, J. Development of a Direct Evaporator for the Organic Rankine Cycle. Available online: https://inldigitallibrary.inl.gov/sites/sti/sti/4783048.pdf (accessed on 11 June 2020).
  58. Durmusoglu, Y.; Satir, T.; Deniz, C.; Kilic, A. A Novel Energy Saving and Power Production System Performance Analysis in Marine Power Plant Using Waste Heat. In Proceedings of the Paper presented at the International Conference on Machine Learning and Applications, Miami Beach, FL, USA, 13–15 December 2009. [Google Scholar]
  59. Bumby, J.; Crossland, S.; Carter, J. Electrically Assisted Turbochargers: Their Potential for Energy Recovery. In Proceedings of the Hybrid Vehicle Conference, Coventry, UK, 12–13 December 2006. [Google Scholar]
  60. Hountalas, D.T.; Katsanos, C.O.; Kouremenos, D.A.; Rogdakis, E.D. Study of Available Exhaust Gas Heat Recovery Technologies for HD Diesel Engine Applications. Int. J. Altern. Propuls. 2007, 1, 228–249. [Google Scholar] [CrossRef]
  61. Fuller, R.; Preuss, J.; Noall, J. Turbomachinery for Supercritical CO2 Power Cycles. In Proceedings of the ASME Turbo Expo 2012, Copenhagen, Denmark, 17–20 July 2012. [Google Scholar]
  62. Di, B.; Francis, A. Gas Turbine Engine Exhaust Waste Heat Recovery Navy Shipboard Module Development. In Proceedings of the Supercritical CO2 Power Cycle Symposium, Boulder, Colorado, 24–25 May 2011. [Google Scholar]
  63. Liu, X.; Gong, G.; Li, Y.H. Thermal performance analysis of Brayton cycle with waste heat recovery boiler for diesel engines of offshore oil production facilities. Appl. Therm. Eng. 2016, 107, 320–328. [Google Scholar] [CrossRef]
  64. Cheng, K.; Qin, J.; Sun, H.; Dang, C.; Zhang, S.; Liu, X.; Bao, W. Performance assessment of a closed-recuperative-Brayton-cycle based integrated system for power generation and engine cooling of hypersonic vehicle. Aerosp. Sci. Technol. 2019, 87, 278–288. [Google Scholar] [CrossRef]
  65. Deng, B.; Tang, Q.; Li, M. Study on the steam-assisted Brayton air cycle for exhaust heat recovery of internal combustion engine. Appl. Therm. Eng. 2017, 125, 714–726. [Google Scholar] [CrossRef]
  66. BouNader, W.; Mansour, C.; Nemer, C.D.M. Brayton cycles as waste heat recovery systems on series hybrid electric vehicles. Energy Convers. Manag. 2018, 168, 200–214. [Google Scholar] [CrossRef]
  67. Galindo, J.; Guardiola, C.; Dolz, V.; Kleut, P. Further analysis of a compression-expansion machine for a Brayton Waste Heat Recovery cycle on an IC engine. Appl. Therm. Eng. 2018, 128, 345–356. [Google Scholar] [CrossRef]
  68. Naserian, M.M.; Farahat, S.; Sarhaddi, F. New exergy analysis of a regenerative closed Brayton cycle. Energy Convers. Manag. 2017, 134, 116–124. [Google Scholar] [CrossRef]
  69. Abbas, S.; Mohammad, S.; Ahmadib, H.; Ahmadic, M.A. Thermodynamic and thermo-economic analysis and optimization of an irreversible regenerative closed Brayton cycle. Energy Convers. Manag. 2015, 94, 124–129. [Google Scholar] [CrossRef]
  70. Erofeev, V.L. The use of promising fuels in ship installations. L Shipbuild. 1989, 80. [Google Scholar]
  71. Chepalis, I.V. Analiz system podachi prirodnovo gaza v dvuhtaktnye gazodizeli na sudah-metanovozah. Ind. Gases T. 2016, 16, 65–70. [Google Scholar] [CrossRef]
  72. Wärtsilä, O. Gas Systems AS. Available online: https://cdn.wartsila.com/docs/default-source/local-files/russia/products/brochure---lng-fuel-gas-systems_rus.pdf?sfvrsn=be696f44_2 (accessed on 12 May 2020).
  73. Wärtsilä LNGPacTM. Product Leaflet. Available online: https://cdn.wartsila.com/docs/default-source/product-files/ogi/fuel-gas-handling/brochure-o-ogi-lngpac.pdf (accessed on 12 May 2020).
  74. MAN Diesel & Turbo, 2014. ME-GI Dual Fuel MAN B&W Engines. A Technical, Operational and Cost-effective Solution for Ships Fuelled by Gas. Available online: https://marine.mandieselturbo.com/docs/librariesprovider6/technical-papers/me-gi-dual-fuel-man-b-amp-w-engines433833f0bf5969569b45ff0400499204.pdf?sfvrsn=18 (accessed on 25 May 2020).
  75. Ivanchenko, N.N.; Krasovskiy, O.G.; Sokolov, S.S. High boost diesel engines. Leningrad. Mech. Eng. 1983, 198. [Google Scholar]
  76. Zinner, K. Aufladung von Verbrennunfis-motoren. In Grundlagen–Berechnungev–Ausführungen; Spzinger: Berlin/Heidelberg, Germany; Vernag, India: New York, NY, USA, 1975. [Google Scholar]
  77. ABB Turbo Systems Ltd. Turbocharging–For Our Customers; Activity Report 2015; ABB Turbo Systems Ltd.: Baden, Germany, 2016. [Google Scholar]
  78. Gautam, A.; Agarwal, A.K. Comparative Evaluation of Turbochargers for High Horsepower Diesel-Electric Locomotives; SAE International: Detroit, MI, USA, 2013. [Google Scholar]
  79. Reid, R.C.; Prausnitz, J.M.; Poling, B.E. The Properties of Gases and Liquids; McGraw-Hill Education: New York, NY, USA, 2000. [Google Scholar]
Figure 1. Principal scheme of liquefied natural gas (LNG) ship’s power plant cogeneration cycle (T: turbine; C: compressor; E: engine; HEi: heat exchanger).
Jmse 08 00720 g001
Figure 2. Algorithm for the simulation of the LNG ship’s power plant cogeneration cycle.
Jmse 08 00720 g002
Figure 3. Fragment of an LNG ship power plant cogeneration cycle simulator.
Jmse 08 00720 g003
Figure 4. Nomogram of the effect of the cogeneration cycle parameters on energy efficiency.
Jmse 08 00720 g004
Figure 5. Effect of technological system parameter πC = πT on N g e n . (a) for internal combustion engine exhaust gas temperature: 1: Tg = 775 K, 2: Tg = 555 K. (b) For turbo unit efficiency: 1: ηk.ad = ηT.ad = 0.8; 2: ηk.ad = 0.9, ηT.ad = 0.8; 3: ηk.ad = 0.8, ηT.ad = 0.9. (c) For turbo unit efficiency: 1: ηk.ad = ηT.ad = 0.8; 2: ηk.ad= 0.9, ηT.ad = 0.8; 3: ηT.ad= 0.9, ηk.ad = 0.8. (d) For heat exchanger efficiency: 1: ηHE 1 = η HE 2 = η HE 3 = 1.0; 2: η HE 1 = 0.9; 3: η HE 2 = 0.9; 4: η HE 3 = 0.9; 5: η HE 1 = η HE 2= η HE 3 = 0.9.
Jmse 08 00720 g005
Figure 6. Effect of technological system parameter πC = πT on N g e n . .
Jmse 08 00720 g006
Table 1. Performance indicators of a six-cylinder four-stroke engine (bore/stroke 30/50).
n (min−1)Pe (kW)PC (bar)Teg (K)Geg (kg/h)λ
50035002.677523,9502.3
40017902.067514,7402.5
3007551.760594003.2
2002251.555555304.3
Table 2. c p . i š values for approximate evaluation.
Excess Air Coefficient.Diesel Fuel C H 4
λ = 1.0 c 200   ° C p . e g = 1.055   kJ / kg · K
c 700   ° C p . e g = 1.15   kJ / kg · K
c 200   ° C p . e g = 1.16   kJ / kg · K
c 700   ° C p . e g = 1.255   kJ / kg · K
λ = 4.0 c 200   ° C p . e g = 1.035   kJ / kg · K
c 700   ° C p . e g = 1.09   kJ / kg · K
c 200   ° C p . e g = 1.101   kJ / kg · K
c 700   ° C p . e g = 1.164   kJ / kg · K
Table 3. The results of boundary nitrogen flow boundary G N 2 bound.
ModeNominalPart Load
π T 23452345
G N 2 b o u n d . , kg/s23.815.913.011.64.63.12.52.25
Table 4. Boundary values G N 2 b o u n d . for a 6-cylinder 4-stroke diesel engine.
ModeNominalPart Load
π T 23452345
G N 2 b o u n d . , kg/s3.82.281.731.440.510.3050.230.19

