1. Introduction
Shipping largely depends on global economic trends and the growth of world trade. At the same time, it is highly regulated at national and supranational levels as a response to global economic activities and the economic crisis which has intermittently caused shipping to see its earnings shrink. For example, the latest recession, at the end of 2008, forced the industry to shrink by almost 16% over the first six months of 2009.
In the aftermath of the last global economic crisis, in 2008, the shipping industry had been expected to reduce its emission intensity. Therefore, the dilemma faced is not just compliance with regulations, but also the fact that shipping strives for unlimited, cheap and clean energy. However, we are yet to find a type of fuel satisfying all three demands and are unlikely to reach this energy breakthrough in the near future. In other word, the shipping industry is in a very determinative time of decision to find the reliable source of energy. This inevitably, needs to be substituted the new attributes to its critical decision in a time of paradigm shift with wide range of volatile assumptions. It also crucial that this awareness to be echoed to the maritime industry to direct the new investment towards resources that effectively keep the maritime economy growing and can also help build a sustainable future.
The work by [
1] is one of the first studies that shows energy gains compared to energy costs. The Energy Return on Investment (EROI) pattern here is a general model to anticipate LNG price and approachability, whilst the growth of shipping highly depends on rates of fuel consumption and availability of the fuel. From the energy economics perspective, this study analyses and shows the large impact of the decline in EROI of oil and main fuels [
1]. An interesting study by [
2], demonstrate that the EROI and price of energy are fundamentally inversely related; such that decreasing EROI, due to reduction of fossil fuel production, associates with corresponding energy prices remarkably. Therefore, as the EROI of LNG and other fossil fuels continue to decline; further analysis could notify that economic profitability may consequently slow down due to EROI drop to the fragile and unreliable portions (1:1). For instance, a quantitative analysis conducted by Cobb uses energy and financial data for the oil and gas production sector, which demonstrates that the EROI for exploring and drilling of oil and gas had decreased exponentially from 1200:1 in 1919 to 5:1 in 2007. Furthermore, the study shows that the EROI in the period of 1919 to 1972, for production in the oil and gas industry, was approximately 20:1, which declined to about 8:1 in 1982, when peak drilling occurred, then improved to about 17:1 from 1986–2002, before being significantly reduced to 11:1 in the late 2000s [
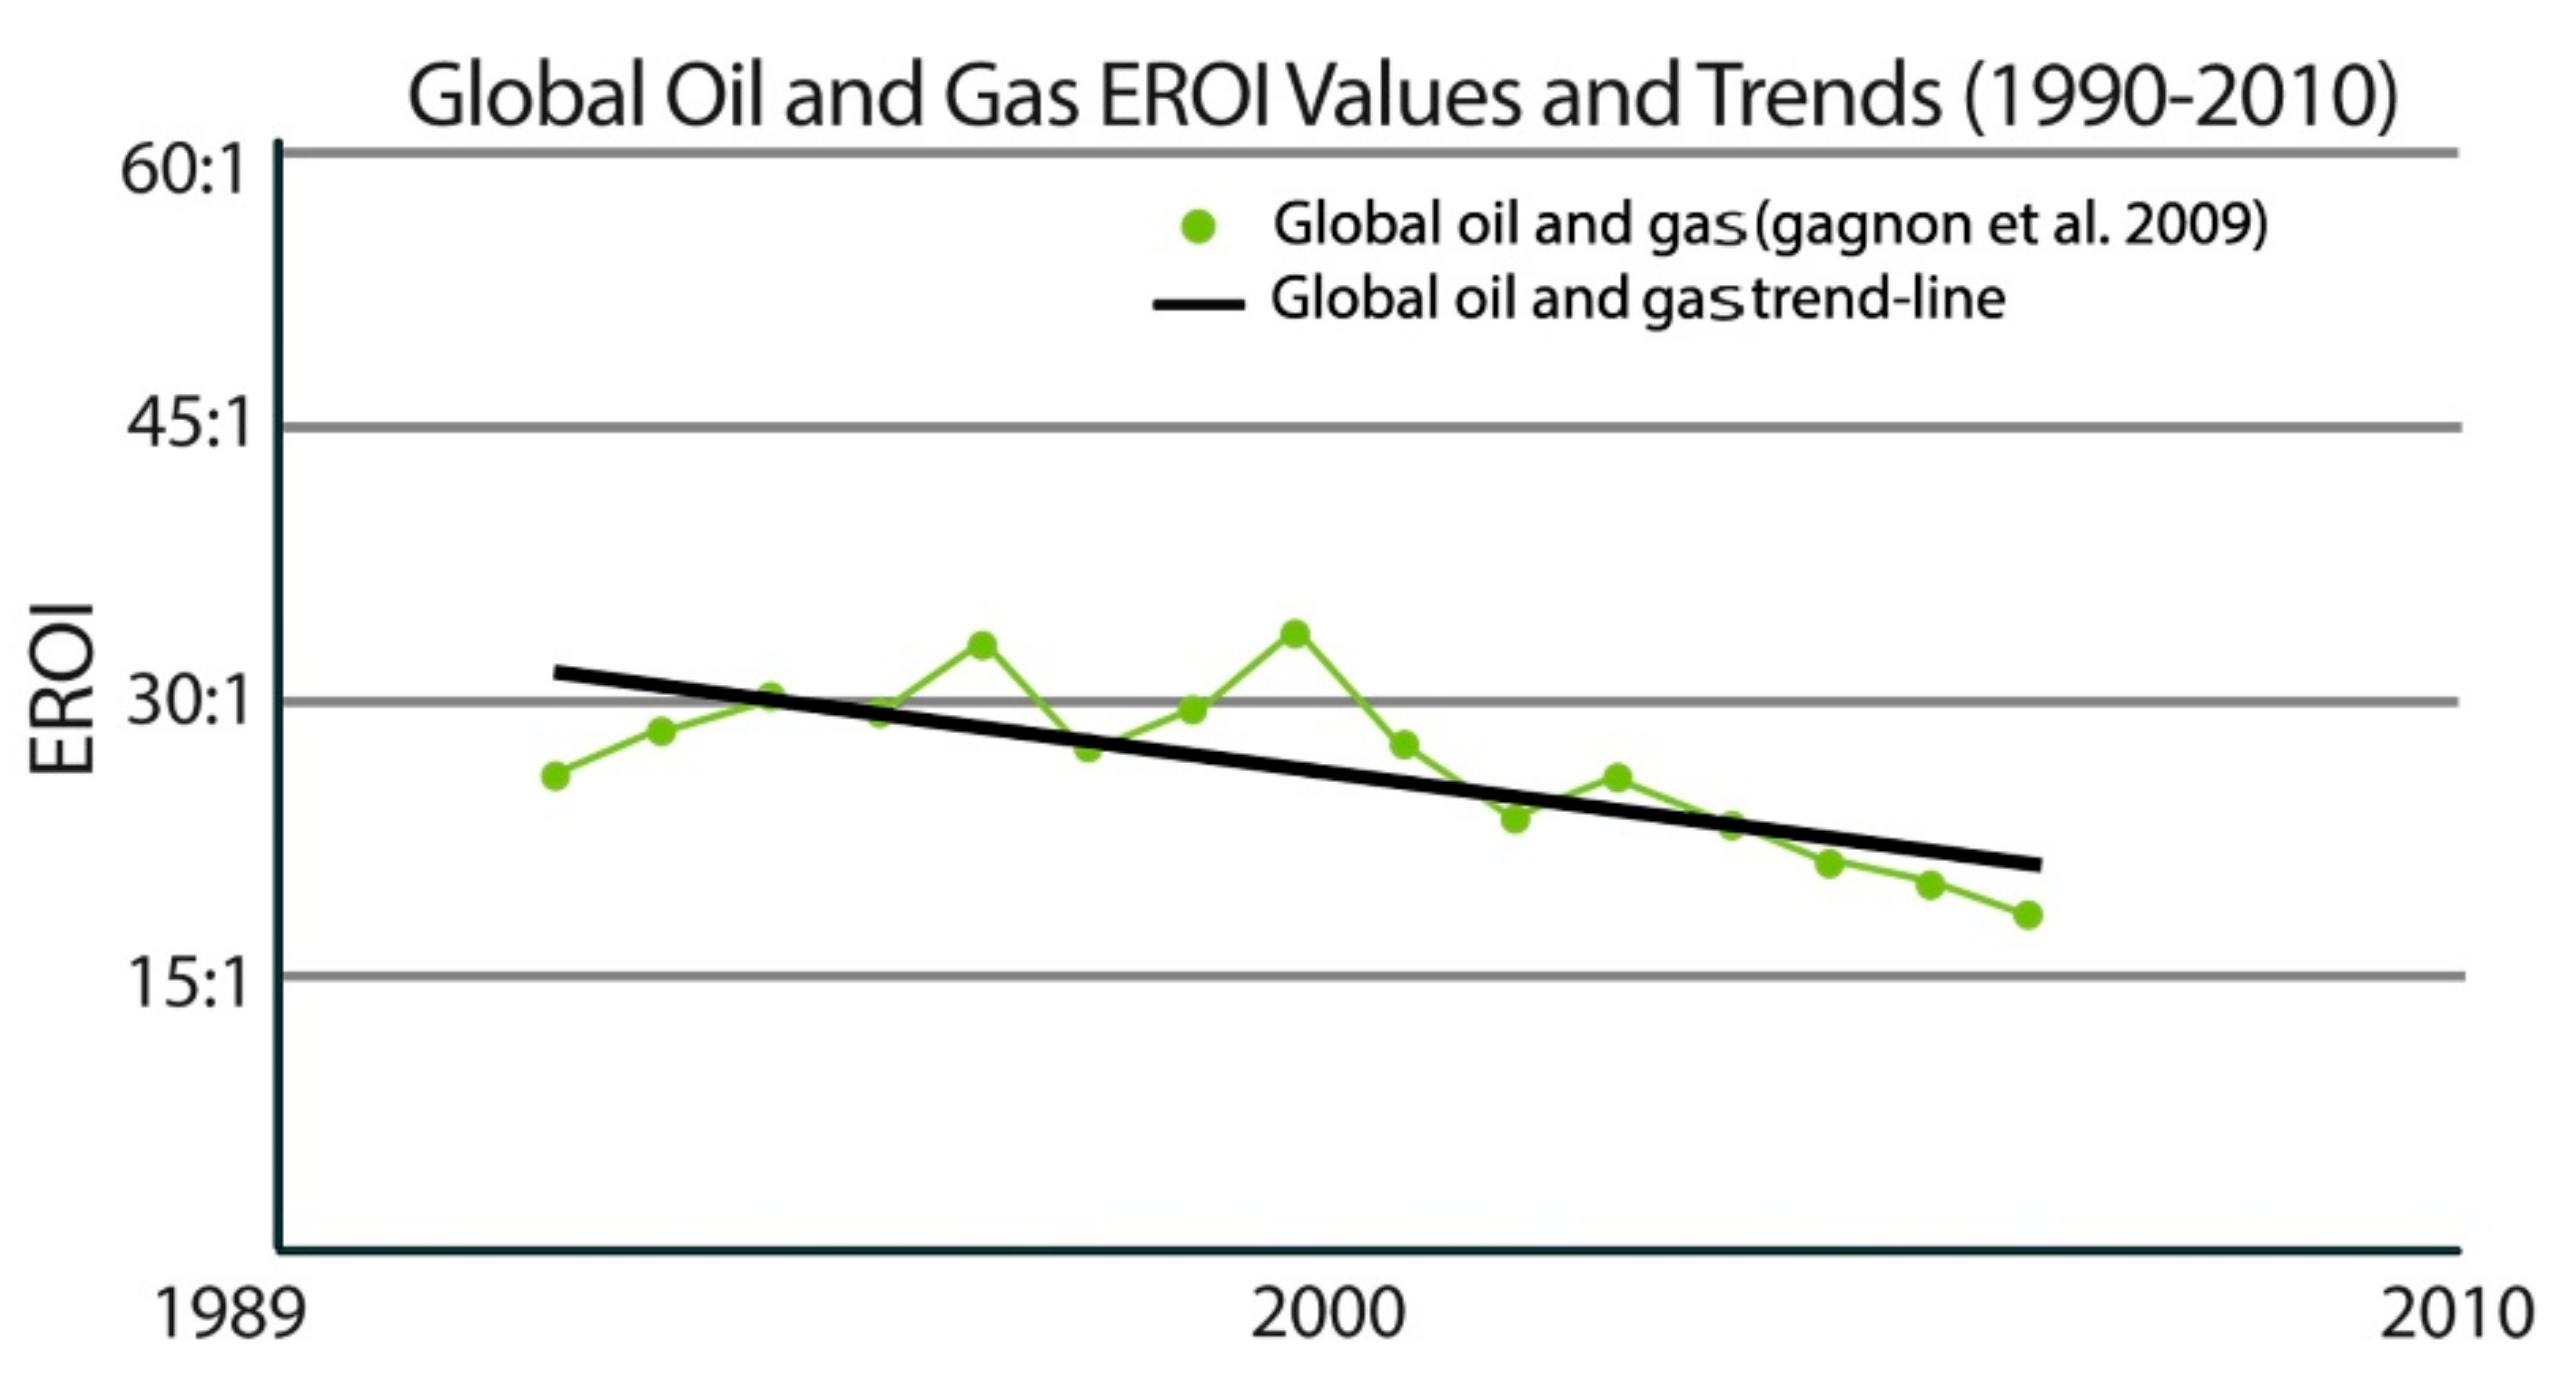
3]. Based on this, we used the EROI as the method to discuss to what extent LNG, as a marine fuel source, can be reliable and suitable to power shipping industry in the future. It is critical here to realize the EROI values when making difficult decisions on new energy sources for shipping, because, if the EROI declines, the energy from the source is difficult and expensive to acquire (
Figure 1) [
4].
Gagnon et al. (2009) The graph shows that EROI had declined approximately by 50% in the last decade and a half. Moreover, utilizing new technology and production methods (deep water and horizontal drilling) has not been sufficient in countering the decline in EROI of conventional oil and gas.
The research reveals a decline in the EROI of oil and gas, which will cause a reduction in the intensity of investment for further extraction, drilling deeper and, of course, disseminating the entire supply chain in the number of oil and gas projects, such as in the volatility in oil prices [
3]. To a certain extent, this phenomenon causes the uncertainties generated by a steep decline in the EROI ratios of natural gas, while decreasing oil prices have forced decision makers to conduct a strategic reconsideration of the economic value of the project, probably suspending or even withdrawing all abatements respective of LNG projects.
This fact has led the market to greater sensitivity and competition for the available net energy and a general rise in fossil fuel prices since 2000. It has caused volatility in oil prices and its fluctuations, such as the recession of 2008 and 2009 slowing down of the world economy, which led to steep declines in oil prices. Lower EROI for oil may be masked by natural gas extracted from the same field and, hence, gas will be used to increase the capacity and efficiency of the field as well. In other words, the EROI of gas shows higher values than EROI of oil, as it needs less drilling investment, while the growth in net energy availability has slowed, and the EROI of oil continues to fall [
5,
6]. A part of this decline is due to a slowdown in global economy. Therefore, gas evidently assume a more available, reliable and attractive alternative source of energy than oil, particularly as a maritime fuel.
From a financial perspective, the lack of finance has deprived many shipping companies during the slowdown in global economy from presuming upon buying and selling opportunities, which is a commonplace activity that occurs at the collapsed stage of the shipping cycle. In the economic environment, with the on-going economic volatilities, many shipping banks have refrained from lending as several concerns have been raised, while companies are unable to pay back their loans.
Achieving finance for an investment for a new-building is a very difficult task in a volatile market. Nevertheless, one caution is that, because financiers like to take safer options, however, it may continue to finance LNG projects with the occurrence of transparent by knowing the effects of difference in price between Oil and LNG on the LNG ship projects.
After the entry into the force of the new International Maritime Organization (IMO) regulations in Sulphur Emission Control Area (SECA) areas at the beginning of 2015 and 2018, growing fuel costs have also increased sea freight charges, consequently. In this regard, a research illustrates that the price difference between Heavy Fuel Oil (HFO) 380 and Marine Gas Oil (MGO) (0.1% sulphur) has fluctuated strongly in time (30% to 250% price difference), with a long-term average of 93% (period 1990–2008). Meanwhile, the price difference between Low Sulphur Fuel Oil (LSFO) 380 and Marine Diesel Oil (MDO) has fluctuated between 40 and 190%, with a long-term average of 87% [
7]. The study figures out that the MGO demand could increase by 2.1 bpd from 2010 to 2020, which will be a level of new demand in the marine sector, where meeting the compliant fuels demand from the shipping sector will trigger a paradigm shift for refineries. In other words, refineries will be challenged to increase global refining rates to an unprecedented level of their run records. The most recent study by Wood Mackenzie (2019) estimates that annual bunker costs could jump by as much as
$60 billion in 2020 [
8].
A series of studies conducted by Notteboom et al., up to June 2015, identified where a shift from 1.5% to 0.5% sulphur content represents an estimated cost increase of 20% to 30% bunker cost. Based on this anticipation, the price effects, when sulphur content reduces from 0.5% to 0.1%, the bunker cost will be elevated from 50% to 60%. The combined effect of these price enhancements corresponds with increasing bunker cost from 70% to 90% of LS 380 grades 1.5% [
7].
The most recent study by Fitzgibbon and Shankar in 2018 demonstrates that, at this step, installing scrubbers also enables ships to continue burning HFO. However, up to date, the the suitability of technology is still unproven due to the concerns for installation on many types of vessels such as stability issues, dry-dock availability and space, and engine adaptability and technological uncertainties. Furthermore, the study describes that access and supply will shrink as demand for HFO disappears, with a concomitant price increase [
9].
The market analysis by Wood Mackenzie reports that installation costs can range from
$1.5 million to
$8 million, depending on type and engine size; plus, there’s lost trading and dry dock time, some create waste water that must be disposed of, and scrubbers that also have to make sense, given the age of the vessel [
10]. Some others have reported that order slots for scrubber installations to be done before 1st January 2020, as the majority are almost full [
11].
Still, the slow-speed diesel engines are economical relatively when there is a remarkable differential between the relative prices of oil and LNG. However, some expert state that the recent declining oil prices in 2015 has led to some doubt about the viability of dual-fuel gas-injection technology in the market [
12]. Contradictory to the previous estimations, the prices of marine fuels have seen an enormous fall, and is always the source of doubt in development of LNG projects. Meanwhile, the difference of HFO has reached from 500 United State Dollar (USD) per ton (pt) at the port of Rotterdam in 2012, up to 210 USD pt. by end of February 2015.
1.1. The Regulatory Map
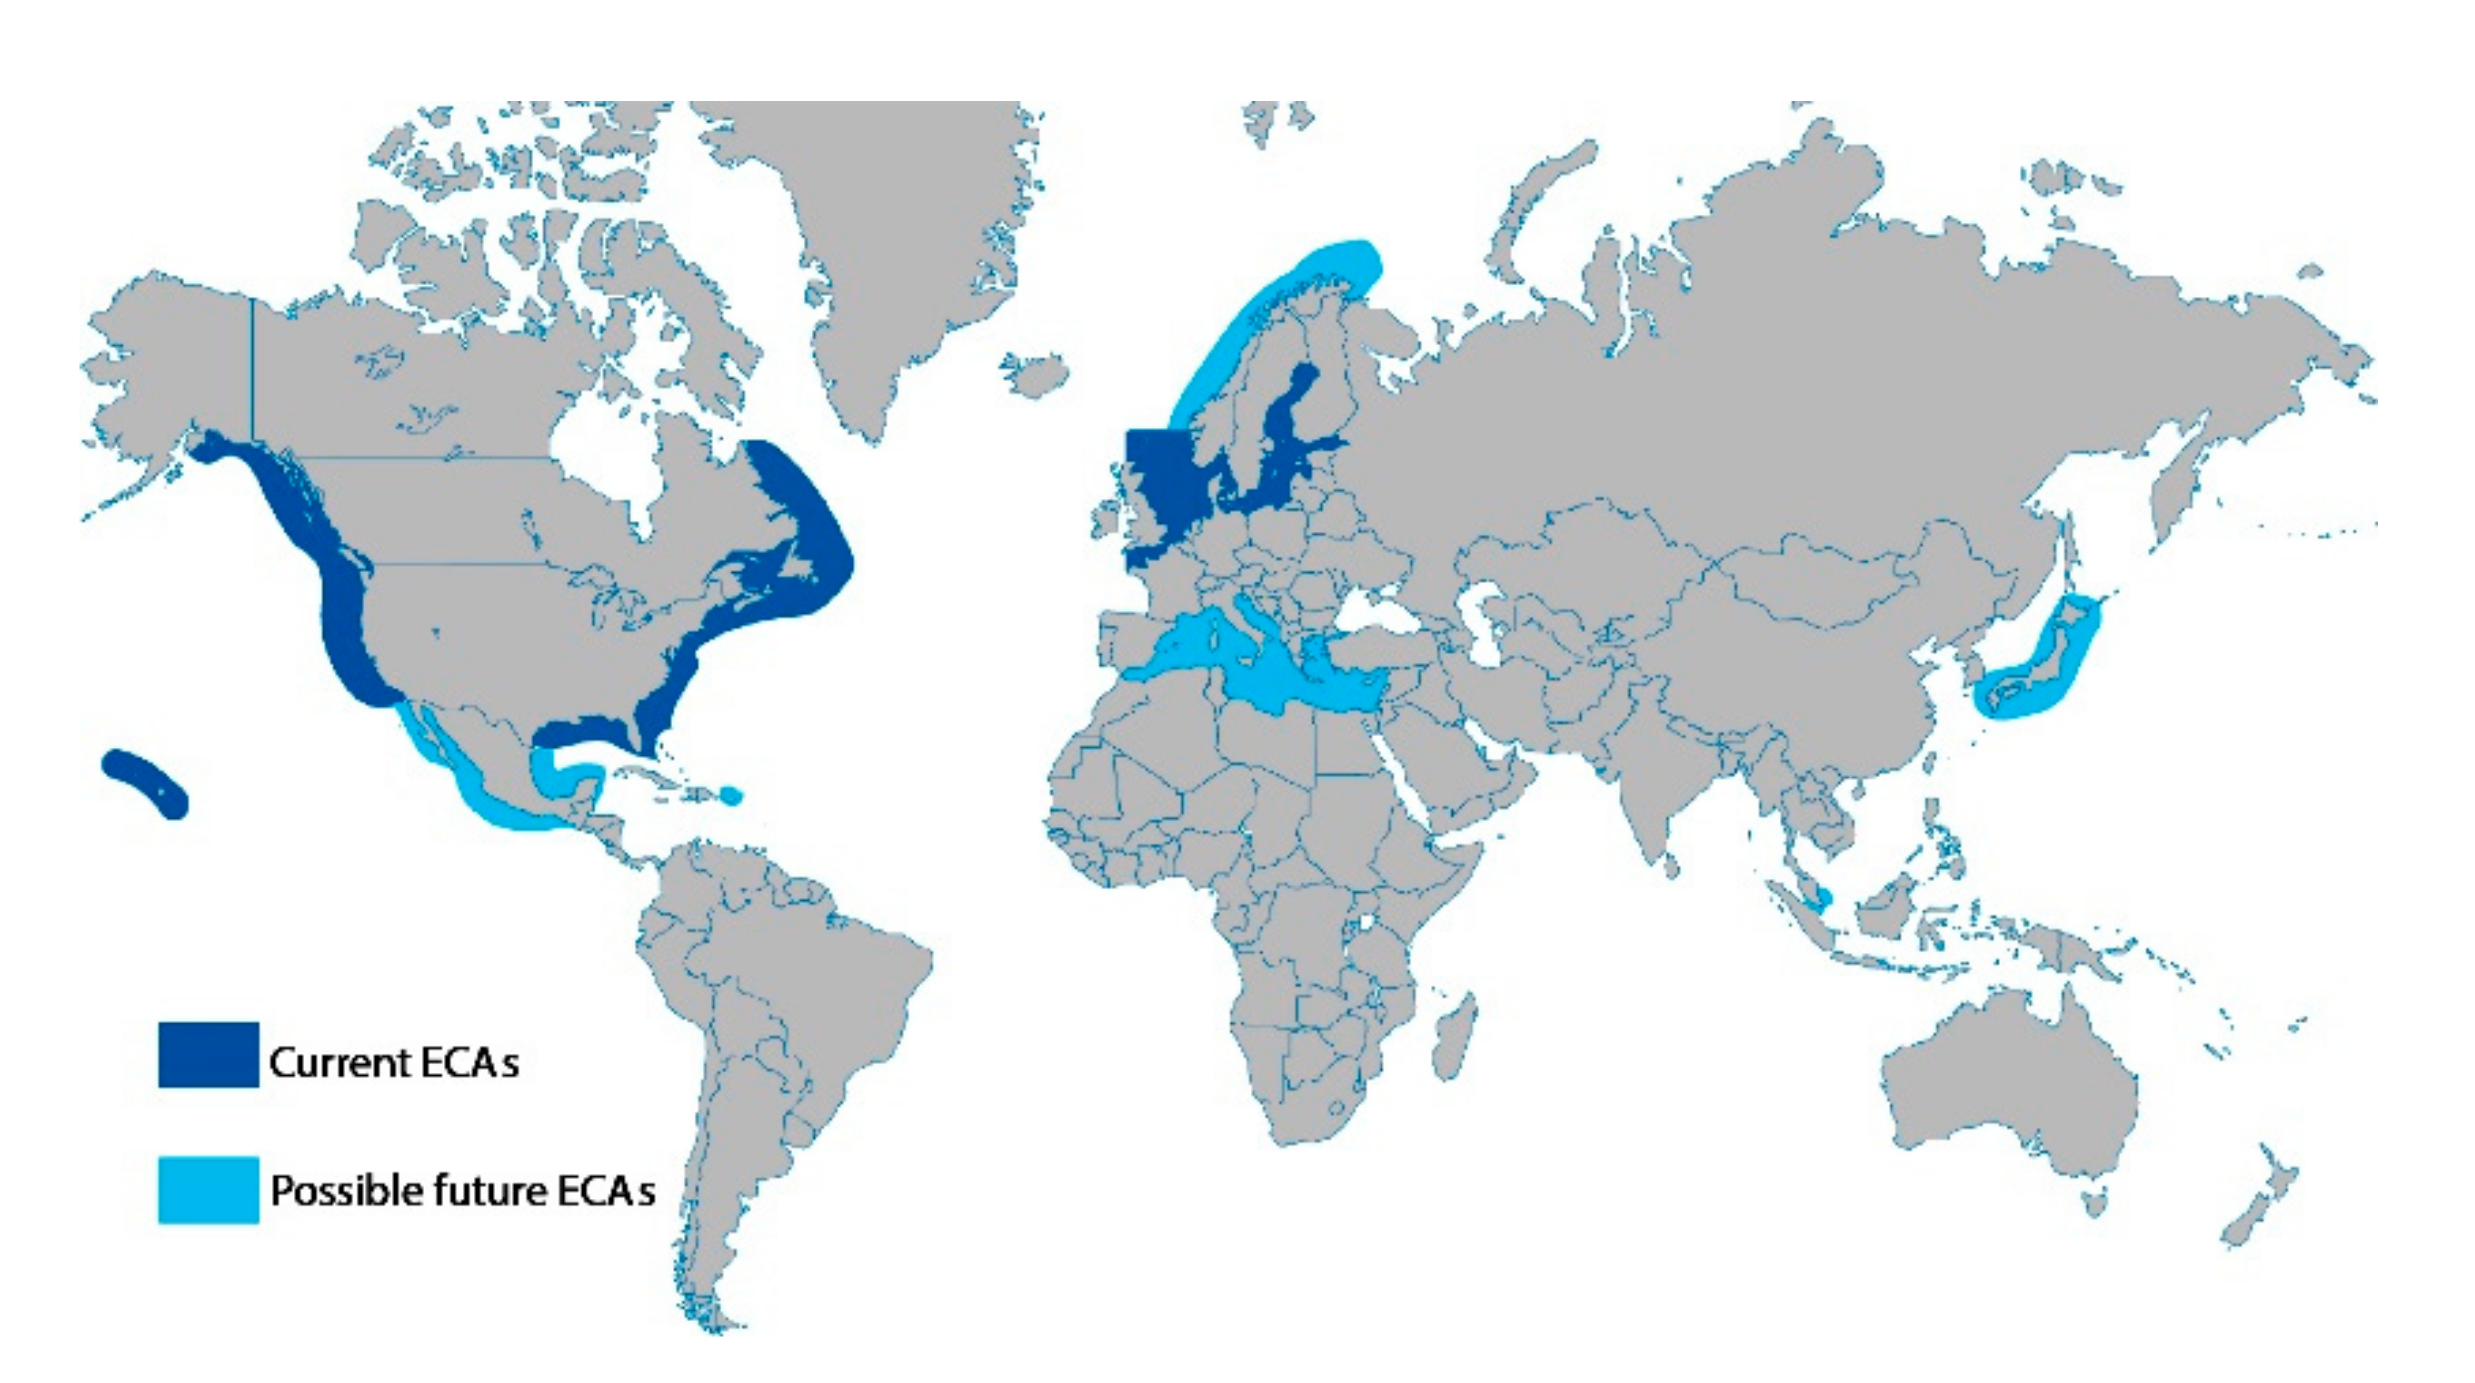
The strategy of EU 2020 is the EU’s growth strategy to enhance the ECA for the coming decade. The IMO regulations article also introduces the possibility for countries to enact more restrictive laws in SECA. The maximum sulphur content in ECA areas was limited to 1% from 1 July 2010 to 1 January 2015, at which date the cap was dropped to 0.1%. As of today, the North Sea, Baltic Sea and part of the Channel are declared as SECA areas; along with a 200-mile stretch of the North American coast (
Figure 2). There is also potential for new areas to become part of ECAs, and the areas are considered for a merger [
13,
14].
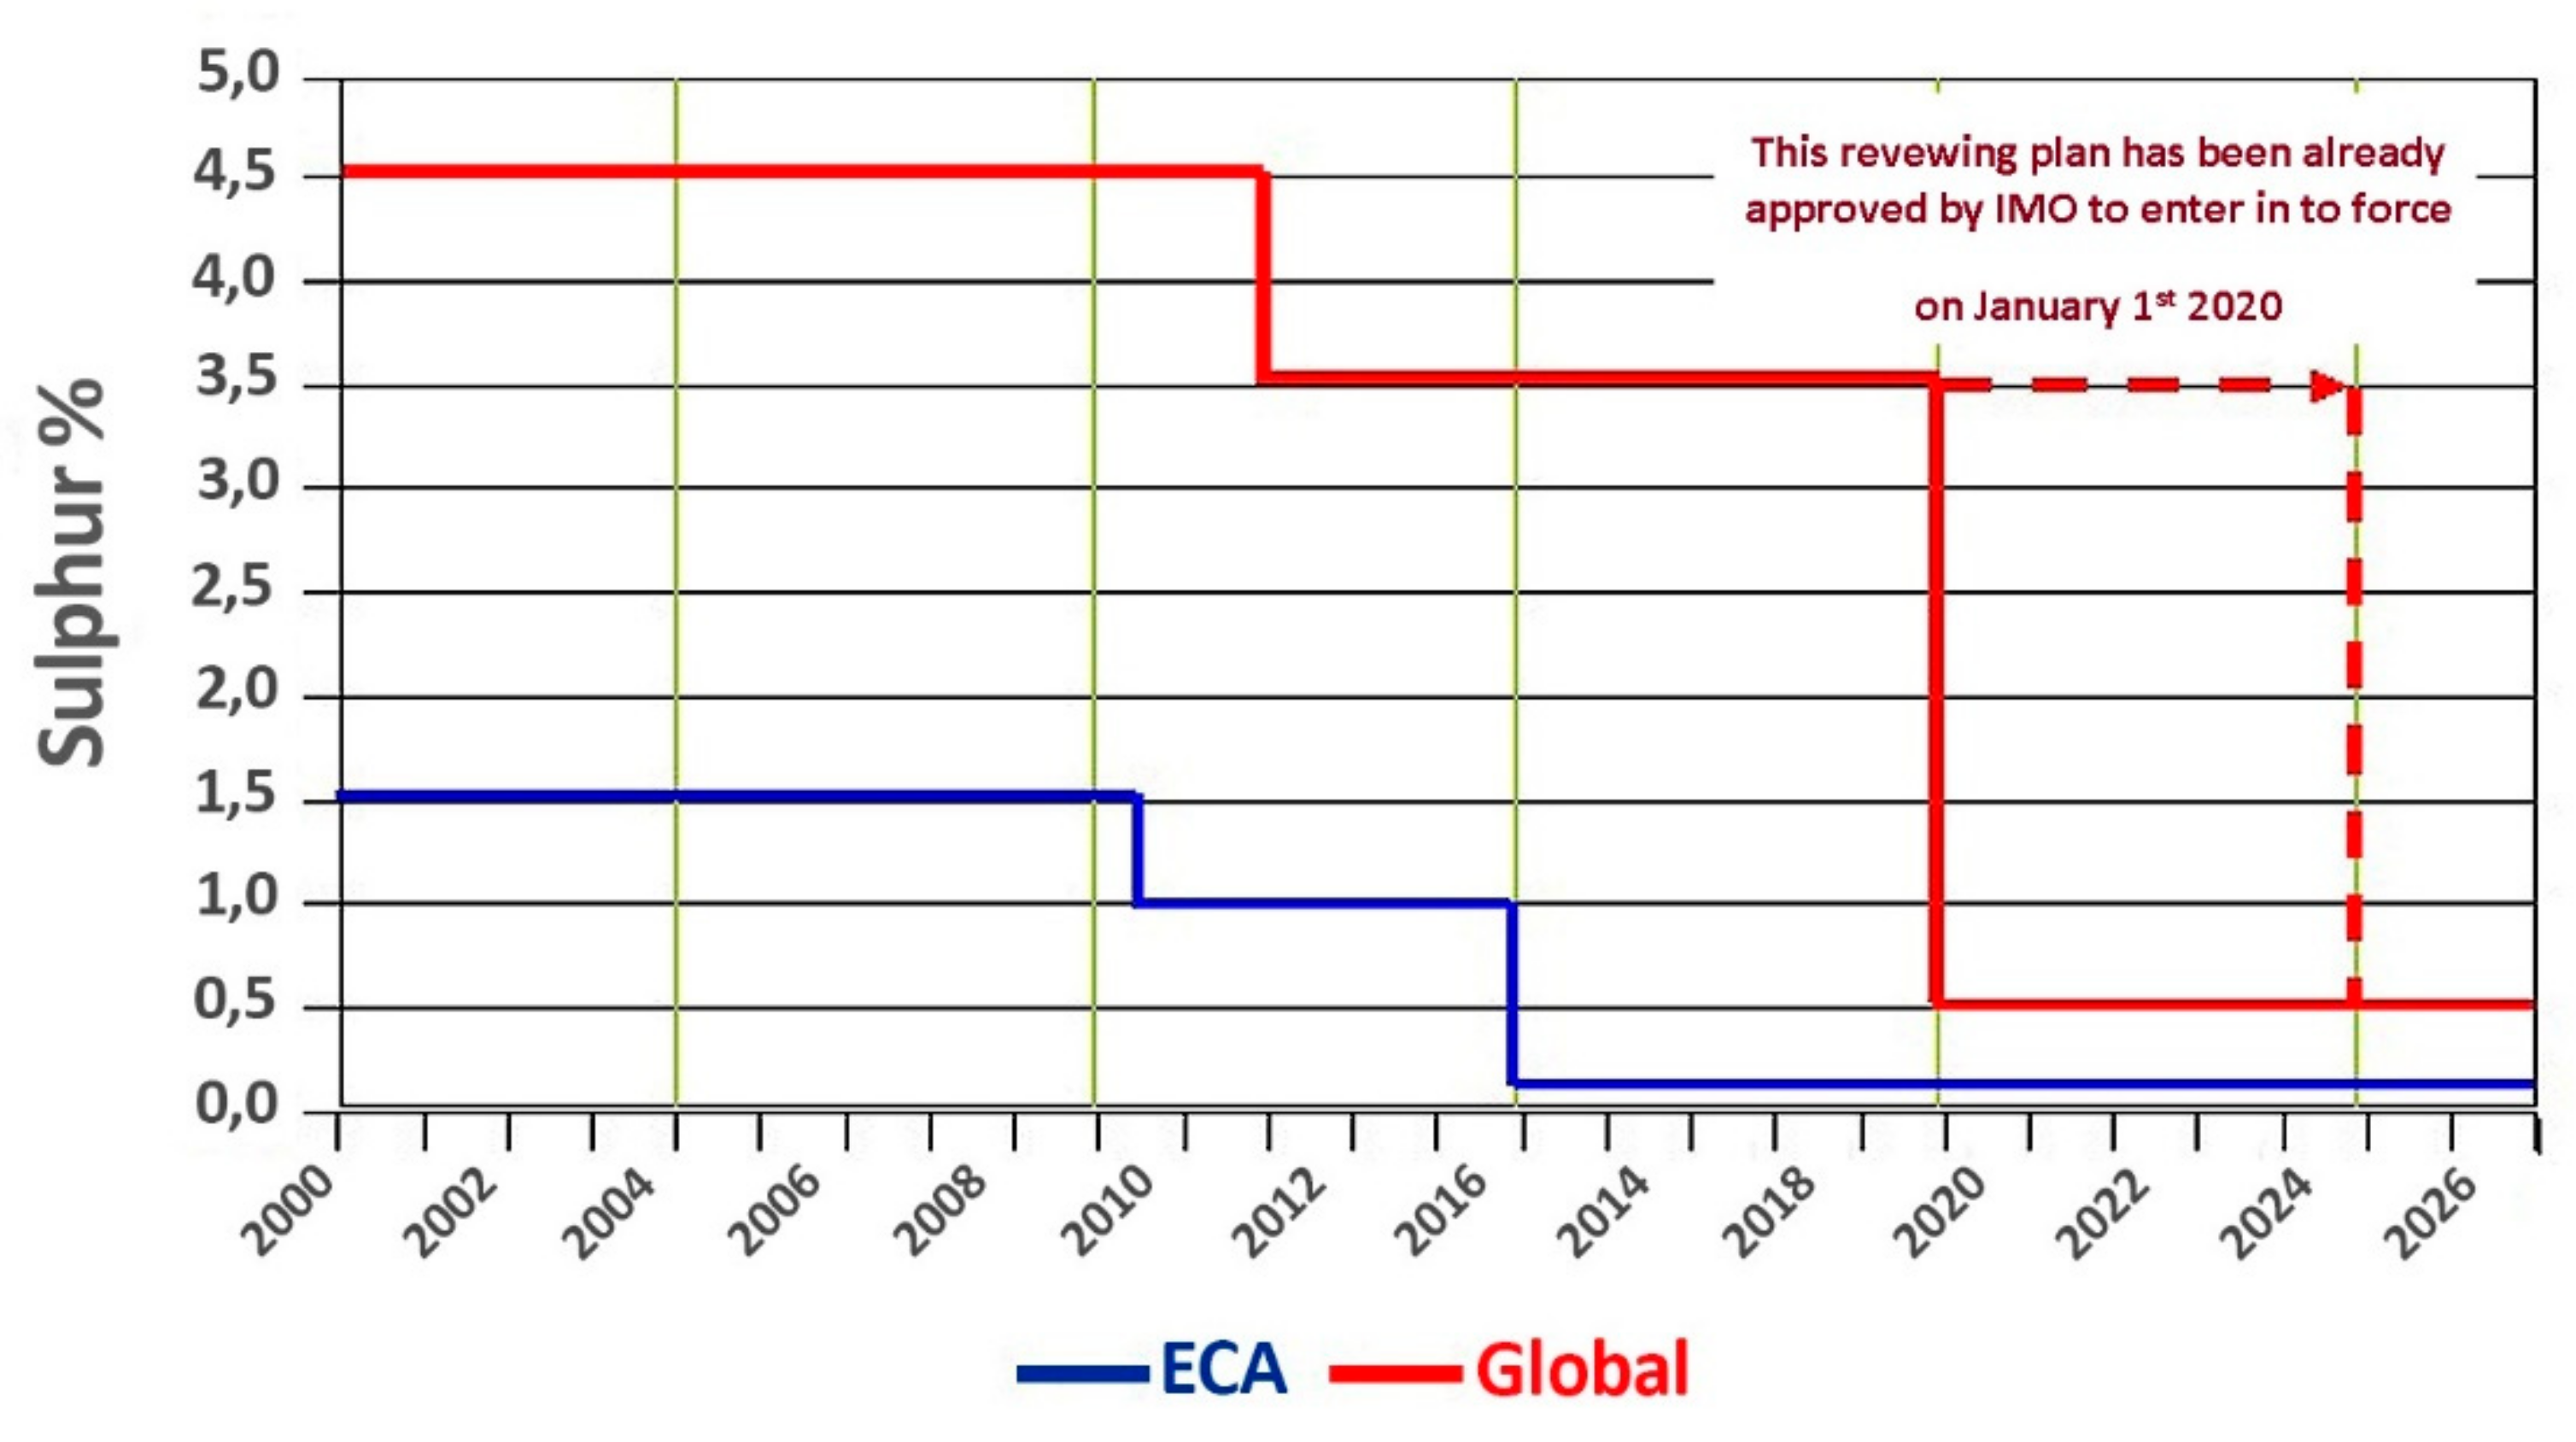
IMO has set limits on emissions for years of 2010, 2015, 2016, 2018 and 2020 on sulphur and Nitrogen oxides in the Baltic Sea, the North Sea and the English Channel, called ECA North Europa. Accordingly, it was obvious that LNG showed great potential as a solution to marine fuel requirements, with new IMO mandates from this viewpoint, the ships, which have trade in this area that ought to comply with the European integrated regulations, which seem most feasible to use gas as fuel but still needs to be evaluated and measured in different situations (
Figure 3) [
15].
Among the necessity for the reduction of sulphur, nitrogen and fuel combustion product particles, the use of LNG as a fuel compared to HFO, MDO/MGO, is more environmentally-friendly with lower costs [
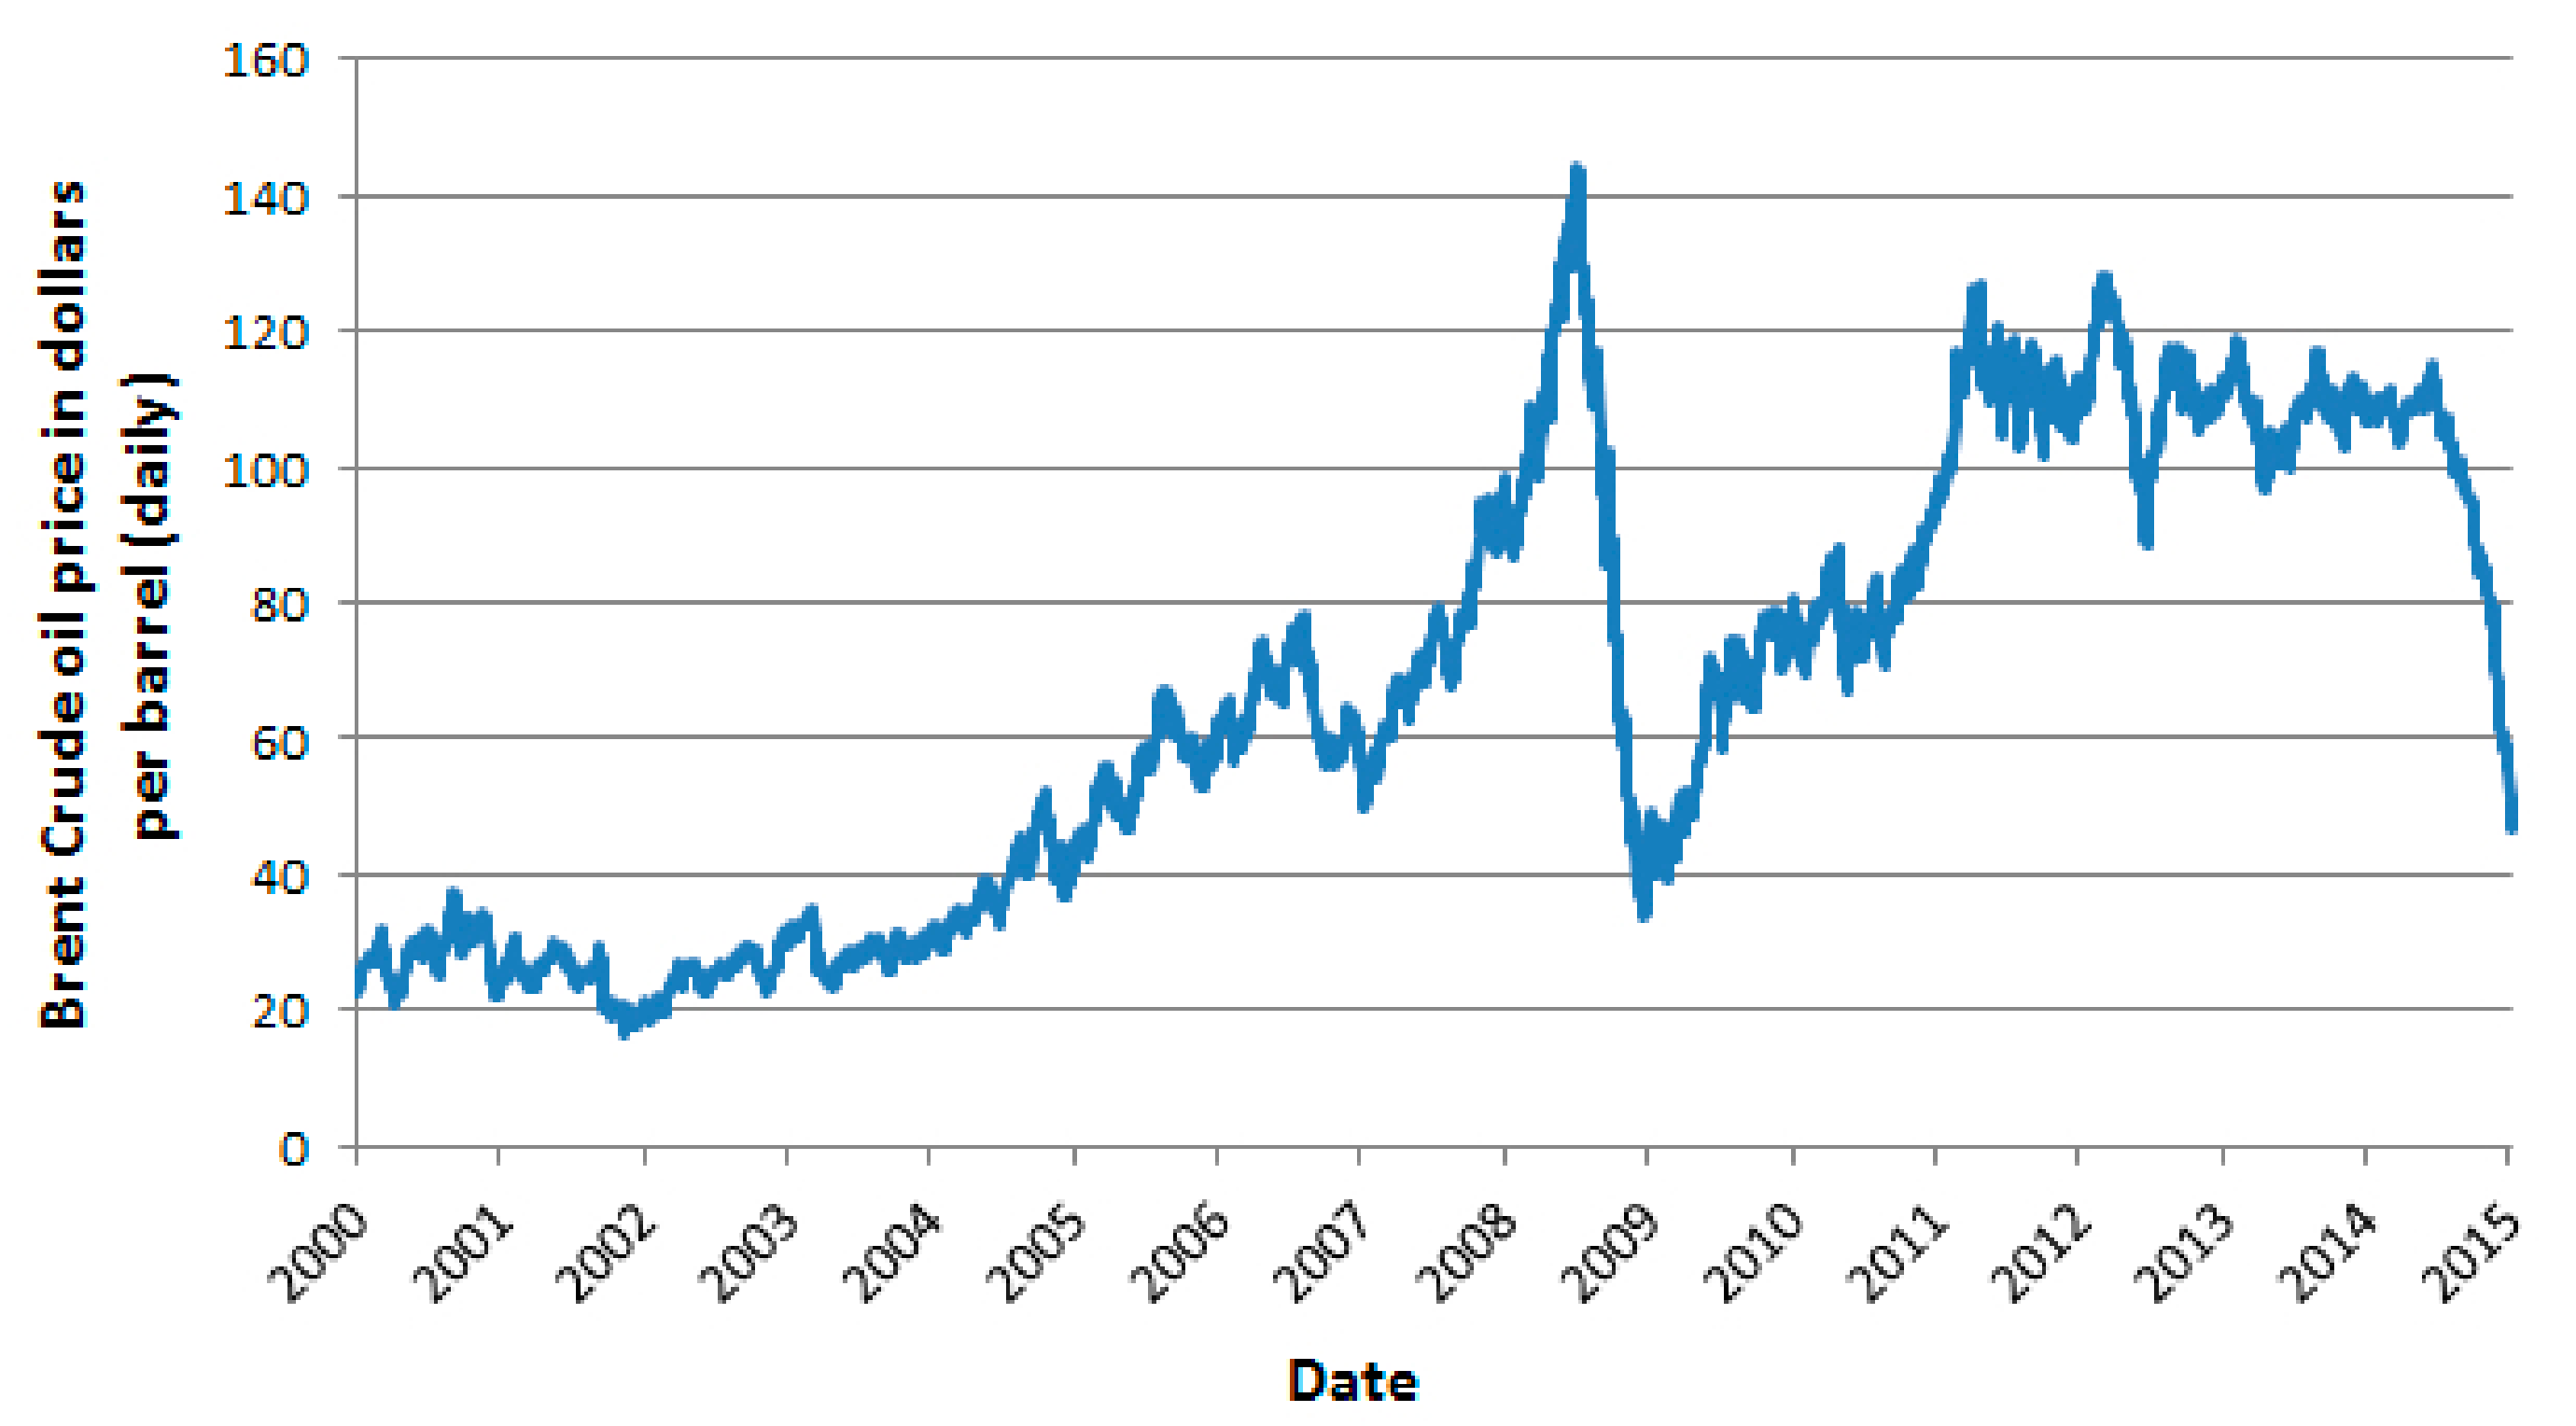
15]. Historically, however, oil prices have always increased, but, since June 2015, we have seen a steep decrease.
Figure 4 shows the most significant economic shock in the global economy so far, in 2014, has been a drop of more than 25 per cent in spot oil prices since the end of June, which could affect the feasibility of using LNG as a marine fuel [
17].
Although a number of studies have shown that the engine technology for all fuels is constantly being developed in order to reduce emissions, including after treatment systems, it has not been used intensively in the ECAs. However, in the last decade, LNG has been used by Norwegian domestic shipping, including off-shore, ferries, and supply ships. Hence, the relevant class rules have been developed accordingly.
In this study, the following alternatives are considered to have met the ECA requirements:
1.2. Limitations of Research
Cost analysis is accomplished based on oil and LNG prices. During the period of data collection, there was a remarkable volatility in oil prices where, in fact, the steep decline in oil prices has generated serious uncertainty which may affect results. Hence, the required data was collected up to 20 February 2016.
In the step of data collection process, the study reveals a lack of data due to the company’s strategy on the confidentiality and sensitivity of data. In this regards, authors compensated this deficiency by using reliable international sources.
1.3. Research Methodology
The study comprises two parts; first, comprehensive technical design [
18], including optimizing performance parameters for each engine, according to shipping market assumptions. The technical assumption here is based on engine manufacturer recommendations, market situations, and de-rating engines via the application of Computerised Engine Application System (CEAS) and its upgraded software [
19,
20] in order to obtain the optimal specific fuel oil consumption values while also fulfilling IMO emission limitations. The primary information used in this study has been obtained through a number of interviews, the purpose of the qualitative interviews was to collect representative data, obtaining first-hand descriptions, nuances and different opinions on the research topic.
Secondly, an economic assessment was applied in order to investigate the impact of EROI on using LNG as a marine fuel, analysing the present status of the proposed container ships and their performance measurement. The theoretical framework of the analysis is based on NPV analysis, in order to assess the impact of sensitivity and volatility of conventional fuel oil on moving towards utilizing LNG as a marine fuel as one of the influential effects of declining EROI of fossil fuels.
Finally, Synthetic data was generated to represent the authentic data; exogenous data from market strategy, primary information, and developing various scenario in order to assess the economic uncertainties, along with indigenous data from technical design and parameters. This synthetic data assists authors in evaluating the initial results in order to show how the technical and economic data react in certain situations.
1.4. Barriers
Any anticipation on the use of LNG as a future fuel for shipping can only be done after sufficiently comprehending the multiple players in the maritime sector and their relevant interests.
2. Barriers: Investment Costs
2.1. Investment Costs for Bunkers Suppliers
The infrastructure for the liquefaction, storage and re-gasification of LNG has been significant over the past few years, as demand for Natural Gas had increased by around 800 billion cubic meters (bcm) up to 2013, or 2.7% per year, with many completed, under-development or proposed projects, in order to accommodate the increasing production capacity and increasing demand for LNG. Global energy demand here is expected to rise by 35 percent by 2035, while natural gas demand is expected to rise by 50 percent over the same period [
21].
Since 2012, many things have changed. LNG Bunkers, confined only to provide fuel for small ferries and offshore supply vessels in northern Europe, are now are being developed to the southern parts, east and west. The introduction of the North American Emissions Control Area (ECA) in August 2012 here was a watershed. Asia, too, is now weighing emissions control over commercial expediency [
22].
However, it is difficult to predict a significant time for booming LNG bunkering infrastructure, as it depends on a clear estimation to predict the time of commencing investment and the effective payback time variables [
23].
2.2. Investment Cost for Ship-Owners
The costs of vessels can reach up to 20%, which is the cost of a vessel using a conventional Oil engine. This price covers the engine, its control and monitoring system, the gas valve unit, and the gas tanks. Therefore, the dual-fueled engine is approximately 20% more expensive than the conventional engine [
24].
The window of plan here assumes that three shipping segments will use LNG as fuel, respectively, from 2015 to 2025, which is considered to be divided in to three phases.
2.3. Barriers: Infrastructure and Bunkering
The new international regulations will put shipping under pressure to shift on new fuel, although missing a part in the supply chain of LNG bunkering will hamper the transition to LNG. On this basis, the vital aspect of the development of LNG as a fuel shortage of bunkering infrastructure and a lack of improvement in the supply chain network for delivering LNG as a marine fuel [
25]. This infrastructure must be active and physically seen with fixed and/or mobile stations, as well as sufficient regulations, industry standards and operational in order to provide expanding situations.
2.4. Barriers: LNG Price
In some markets, LNG prices are still contractually follows up oil prices: this will cause switching effects that make the users switch between oil and gas while confronting pricing dynamics. Many factors affect LNG prices including: lack of sources with competitive prices to other energy sources, shortages in pipeline networks to provide distributing the gas to domestic and commercial customers, and uncertainties over raising funds for the required liquefaction and multibillion dollar transport system projects This traps investors into an inflexible commitment for the long-term, so future pricing has been weighing on investors’ minds and often leading to delay to take further steps. LNG is a niche player and price sensitive markets. Therefore, the market will be inelastic if the supply cannot meet demand as one of the principal and most challenging elements in the market are the LNG pricing [
26].
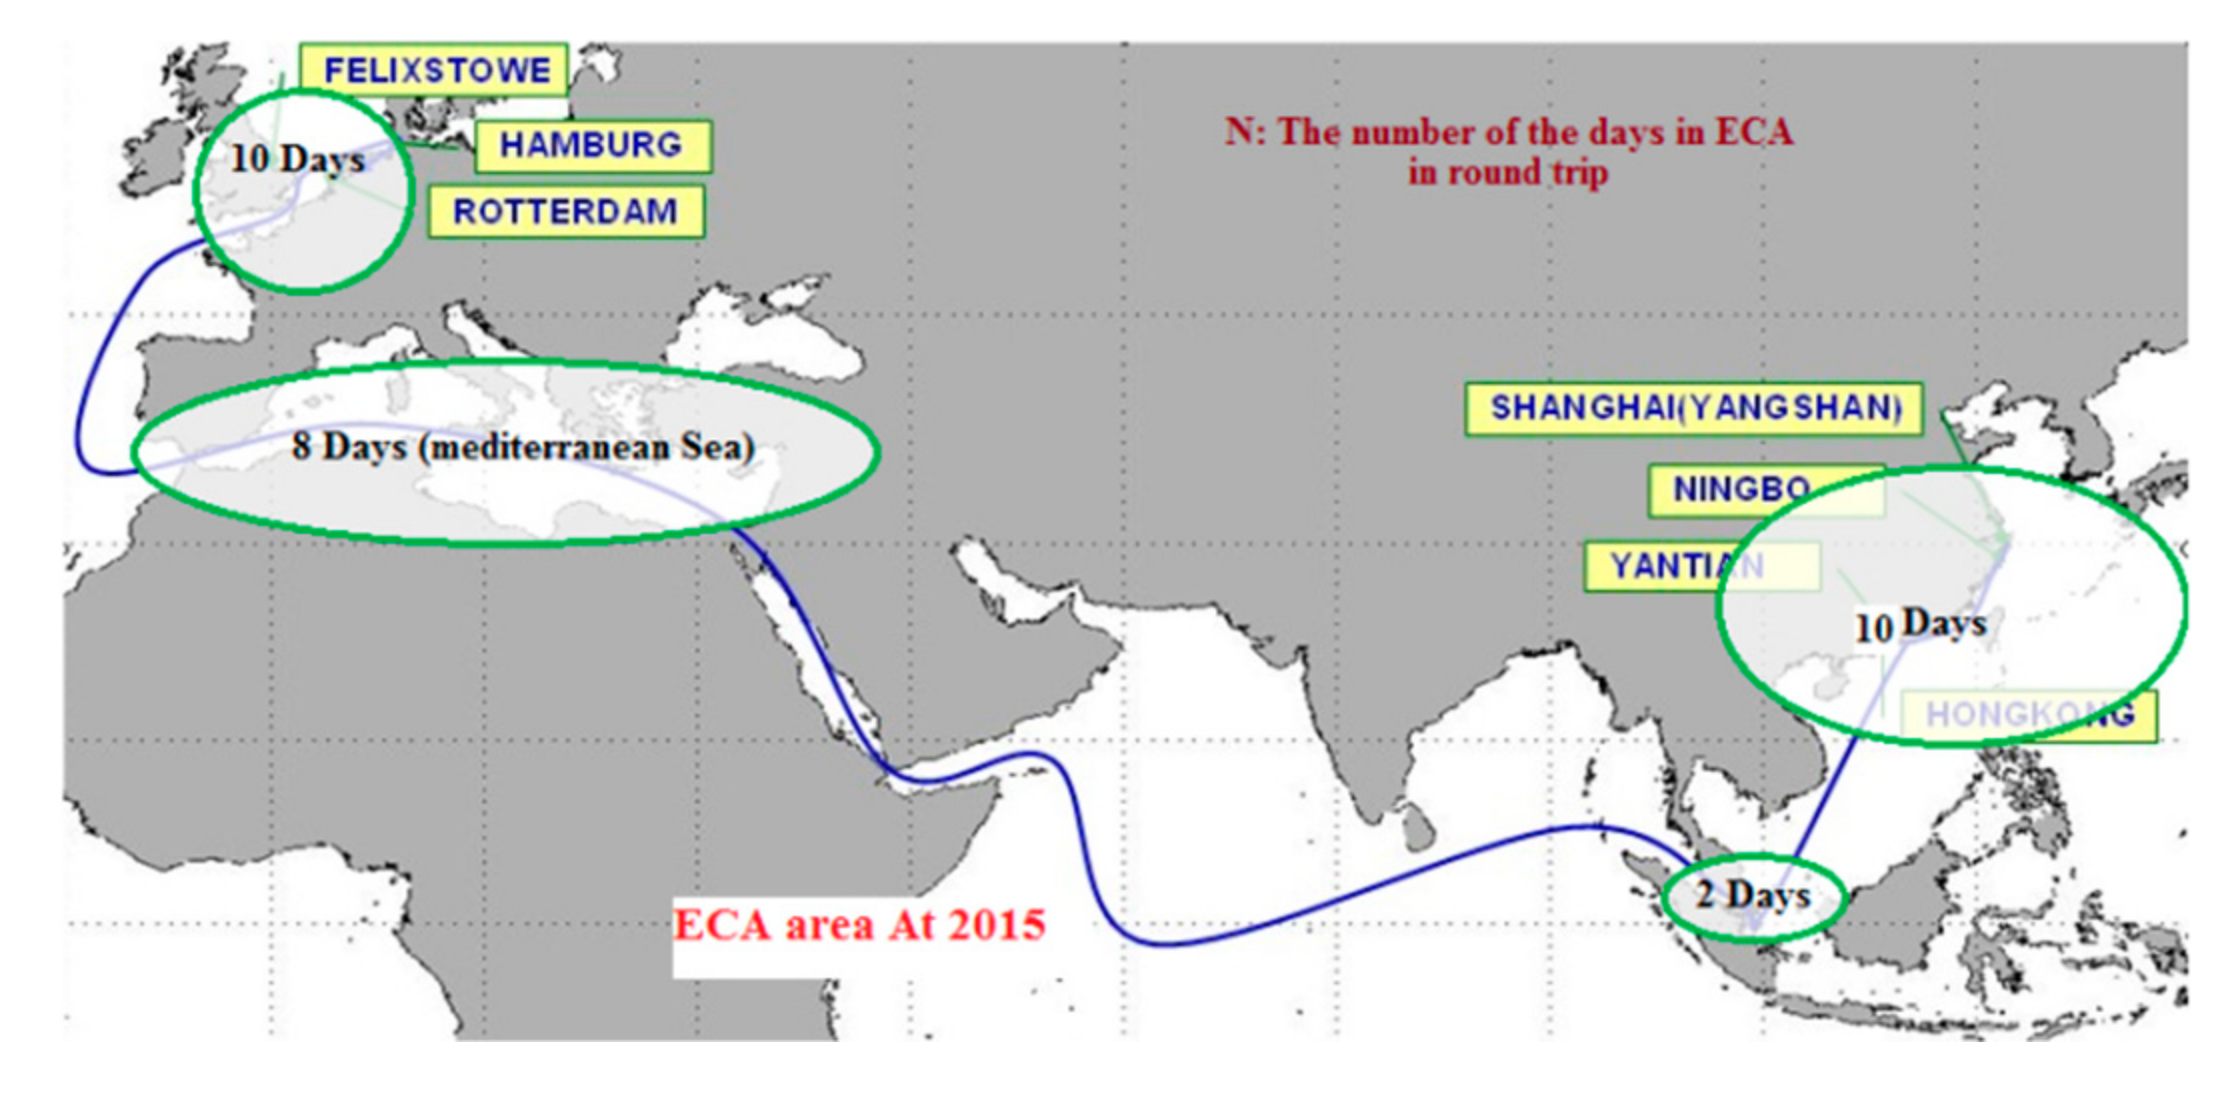
2.5. Trade Route Assumption
The fleet runs in the Asia-Europe shipping route with a total of ~24,000 nm lengths. The fleet here passes through the area with different ECA exposure levels, where the selected length of the route is the half-round-trip, which equals 11,999 nm without harbour and manoeuvring distance. The duration in ECA exposure here is 19 days in a half round trip, which is 44% of the total distance, consisting of the North Sea, Mediterranean Sea, Malacca Street and China Sea as the ECA (
Figure 5).
As an assumption, the vessels will spend more time in between European and Chinese ports, including northern port in the Mediterranean Sea. This route is known as a rollercoaster for ship-owners, whilst west-bound has declined drastically and will not be over until the end of recession.
2.6. Operational Data and Main Engine Modelling Assumptions
Based on the assumption that the fleet runs at slow steaming due to low market, we assume the run with ~60% Pe (Effective power). However, the study computes the Specific Fuel Oil Consumption (SFOC), Maximum Continuous Rating (MCR) and Normal Service Rating (NSR) (The continuous service rating is the power at which the engine is normally assumed to operate) based on 70% Pe, with different rate of sulphur content except 6500 the Twenty-foot Equivalent Unit (TEU), whose initial calculation shows that the engine cannot be economic to be run over 56%:
3300 TEU: Main engine type: 8S70 MC.C (B&W)
6500 TEU: Main Engine type: 10k98MC.C7 (B&W)
14,000 TEU: Main Engine type: 12K98MC7/ME (B&W)
Following these dual fuel engines are newer and more efficient engines suitable for 3300 TEU and 6500 TEU reference vessels: 8S70ME-C8.2-GI-TII with 1× MAN TCA88-26, 10G95ME-C9.2-GI-TII with 3× MAN TCA88-24 during the time of conducting this study.
2.7. Technical Alternatives and Cost Modelling
The first step in determining the annual costs/benefits of each alternative is to evaluate its profit/loss and cash flow benefits in comparison to using HFO/MGO. In this session, the study attempts to estimate the differences of each alternative with consideration of fuel price sensitivity. Meanwhile, we will define essential investment and operating costs over 10 years, from 2015 to 2025, to cover dual-fuel, scrubber equipment or running cost per annum.
In order to obtain essential data for engine performance and fuel consumption, we use the Computerised Engine Application System (CEAS) 19, 20 in order to choose a specific engine and configure it with the requested specific power, speed and fuel optimising system.
We define and compute the capital expenditure (CAPEX) and the relevant operating expenses (OPEX) whether it is retrofitting or new installing options. To find the amount of OPEX, it has been assumed that the added operational costs for each alternative actually associate proportionally with a shifting to MGO, as required by the IMO regulations. This basic driver is considered in order to calculate the effect on the net present value (NPV) over 10 years, and a payback period opting for the scrubber or LNG solution instead of the MGO, as the base case in the following chapters (MAN-Diesel & Turbo-ceas-Software) [
27].
2.7.1. Base Case, Shift to Low-Sulphur Fuel (MGO)
The base case is defined as the reference container vessels with the original specifications as-built condition; in case of operation in ECA, the vessel will change over from HFO to low-sulphur fuel in order to comply with the emission requirements in ECAs. Meanwhile, the required modifications in order to run on low-sulphur fuel may have to be carried out on certain parts of the fuel system, including installing a cooler unit and increasing the amount of cylinder oil. The total adaptation cost here is considered negligible and is not taken into account in the financial analyses when compared with the option of fitting a scrubber or using LNG as a fuel [
28].
For the reference engines, we have assumed a sea margin of 15%, an engine margin of 10% and, a service rating of 90% SMCR, including a 15% sea margin. The engines run on MGO for a lengthy period, so it will be necessary to apply an appropriate type of system or cylinder oil for the main engine and auxiliary engines [
29].
At slow steaming operation conditions, the daily consumption will be reduced further due to the low load. Adopting slow steaming requires the “de-rating” of the main engine to the new speed and a new power level (around 70%), which can reduce the fuel consumption over 30%, while it involves the timing of fuel injection, adjusting exhaust valves, and exchanging other mechanical components in the engine [
30].
2.7.2. Fuel Price Assumption
Fuel oil prices have fallen by more than 40% since June 2014 [
28]. Based on technical surveys and literature review, this has come after nearly five years of stability. Therefore, we assume that the fuel prices gradually increase and come close to the level of June 2014 [
31]. Starting the year for the fuel price at 330 usd/Mt for HFO scenario is 2015 and 770 usd/Mt and 930 usd/Mt for Marine Gas Oil (MGO) are set. LNG is set at 10, 11, 12
$/MMBtu (430,535,585 usd/Mt) respectively for 2014, 2020, 2025 includes small-scale distribution cost 4
$/MMBtu (190 usd/Mt) [
32,
33]. It is assumed that these distribution costs do not increase over the proposed period (1 Mt = 48.7 MMBtu) [
34].
The base case scenario is considered for shifting from HFO to MGO in ECA, which is shown as
Table 1:
2.7.3. Fuel Cost Prediction
According to
Table 1,
Table 2 and
Table 3 we determine specific fuel oil consumption (SFOC) at a different load of each of engines with 3.5% sulphur content. Engines here run at 70% engine load, based on International System for Standardization (ISO) condition, among other factors. Normal continues ratio (NCR) and specific gas consumption (SFOC)can be obtained from
Table 1 and
Table 2 and 3 for each type of engine. In order to compute fuel oil consumption, we use specific fuel oil consumption of each engine and fuel oil price for a period of 10 years.
Table 3 shows fuel cost per annum based on each engine specification. For cost modelling, it is assumed that whatever the selected fuel price levels are for different fuels, they remain constant throughout the period 2015–2020 and 2020–2025 but change in 2020, as in the first scenario. Based on the above assumption here, and according to the fuel price scenario,
Table 3 is designed to calculate the total fuel cost for three periods 2015–2020 and 2020–2025. The engine uses a combination of 90% LNG and 10% HFO, and the amount of ECA exposure associates with the calculation and the results.
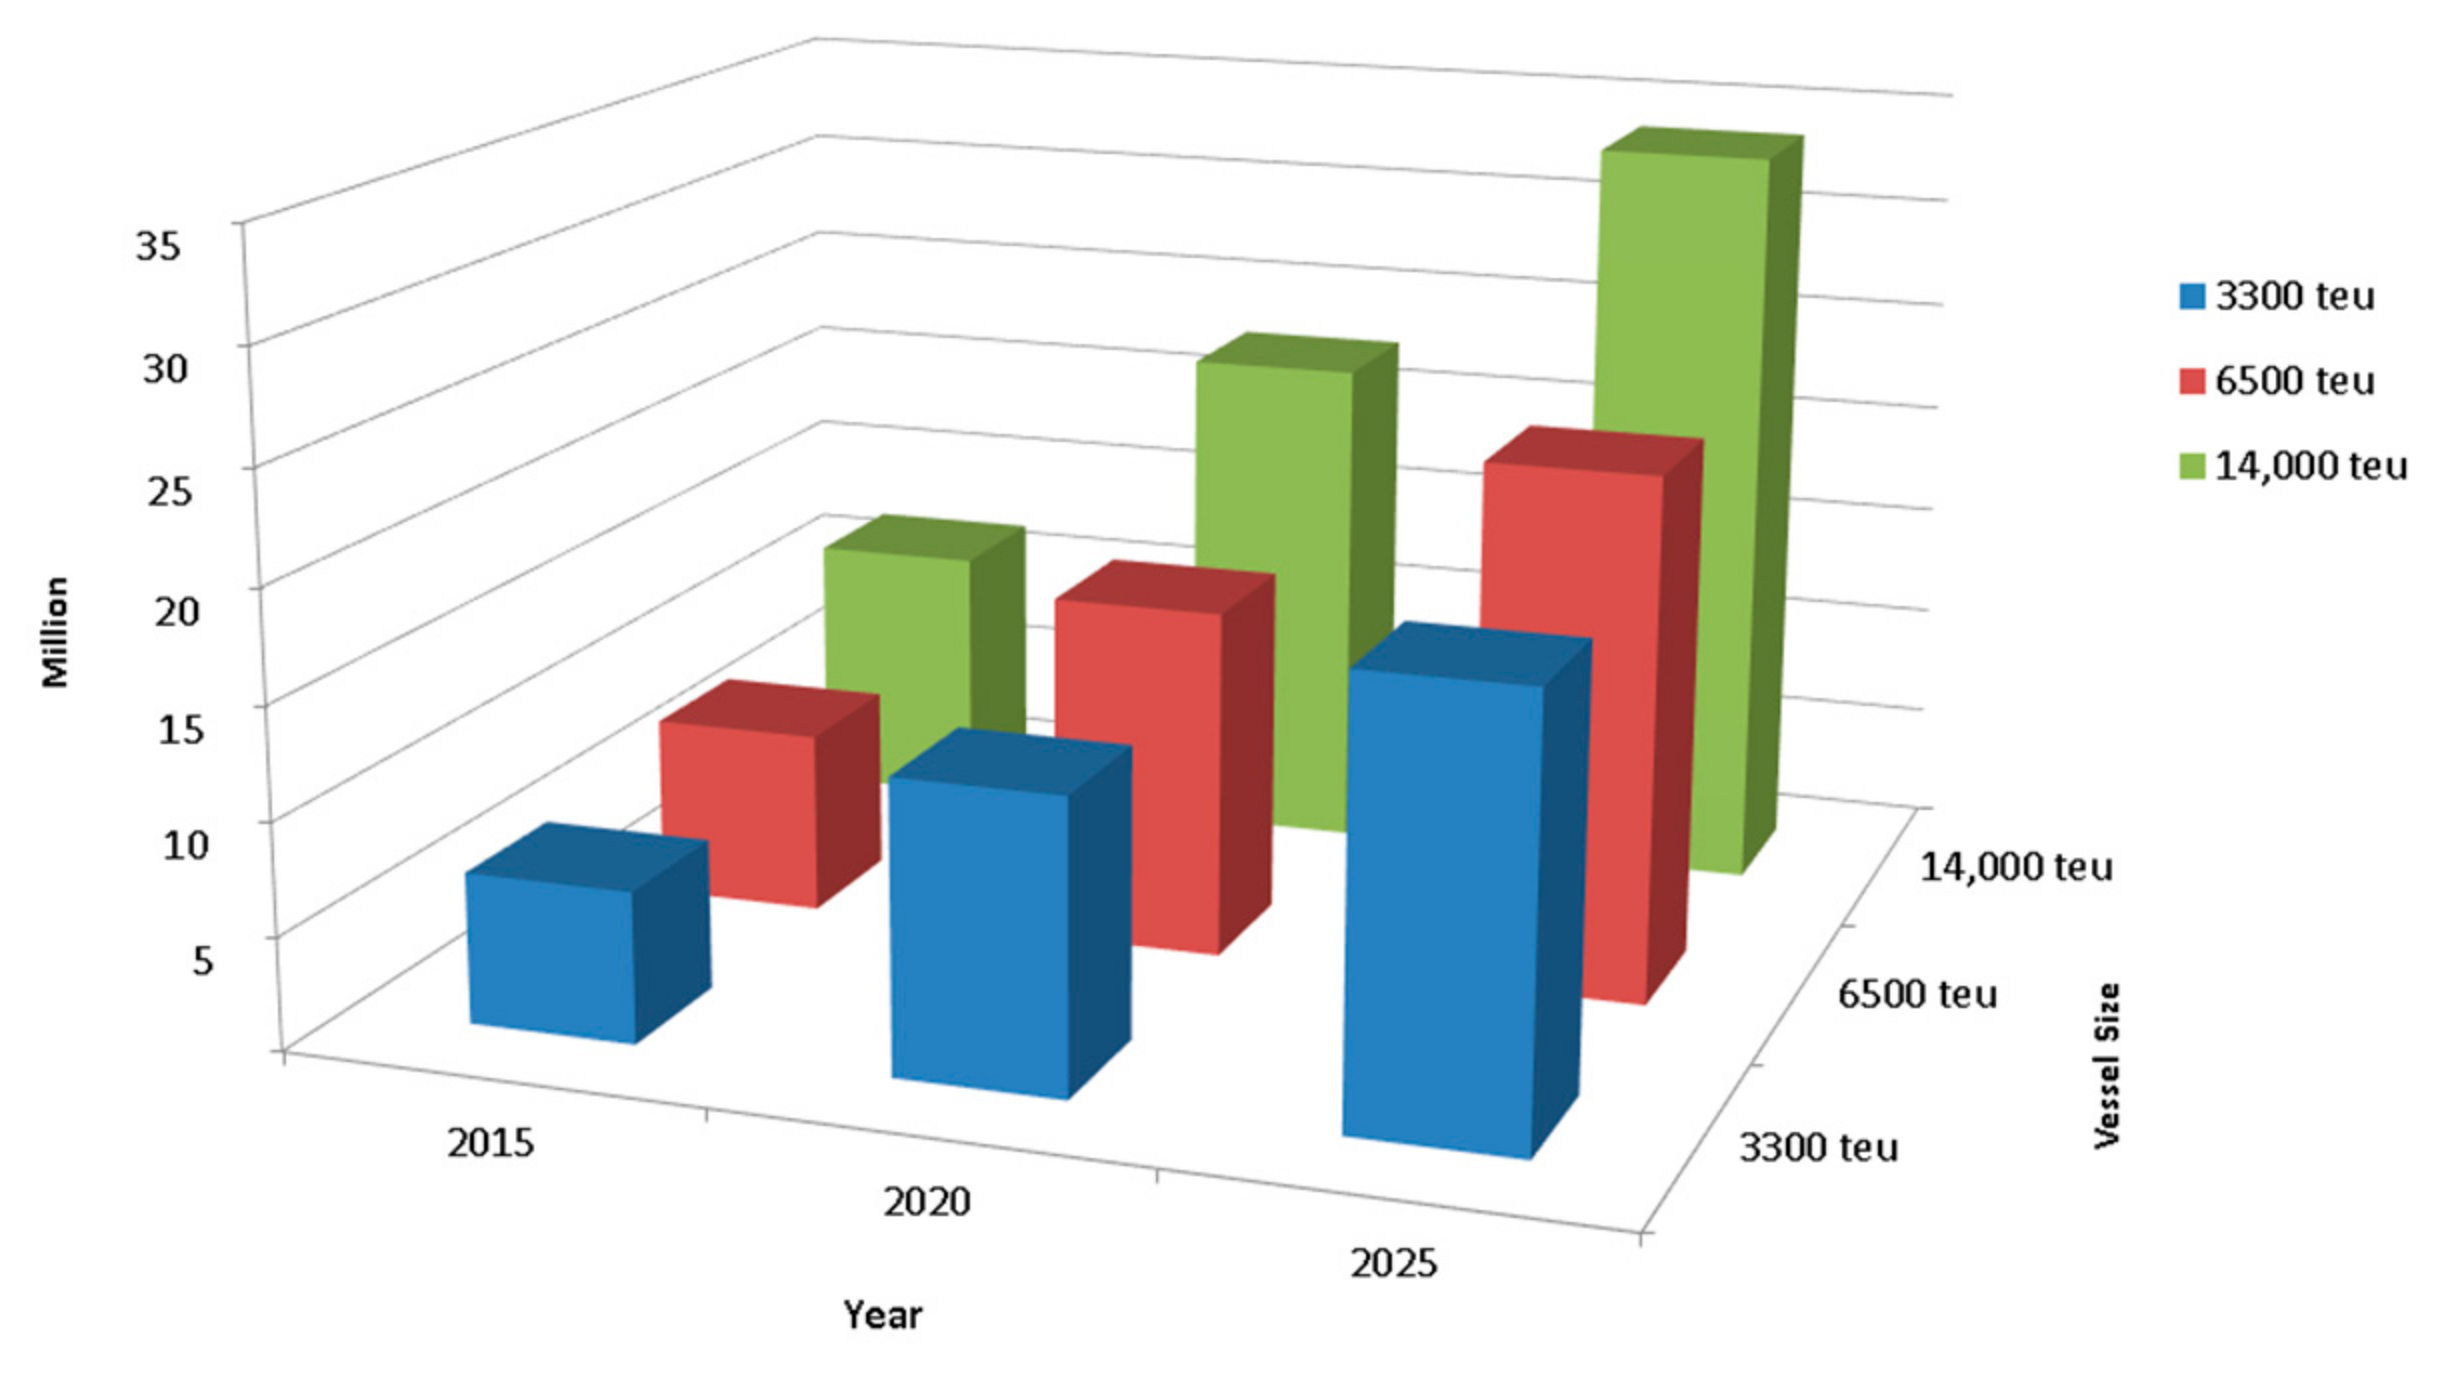
Figure 6 illustrates the significantly positive trend of using LNG versus distillate fuel over a period of 10 years (2015 to 2025). As the figure shows, the trend rises sharply from 2015 to 2025. From a financial point of view, the trend is highly sensitive and proves that using LNG is more beneficial for larger sizes of container vessels.
2.8. Scrubber Profiles.
A hybrid scrubber system retrofitting includes a costly conversion with the removal and installation of compartments and machinery on board of the ship, where the operating costs depend on operation time and engine loads. Based on the collected data for the technical interviews here, the study assumes +0.5 gr/kwh on an SFOC penalty for each reference engines, while the multiplier coefficients 0.6 and 2.1 are considered on power consumed for open loop and closed-loop, respectively.
Lost cargo space here depends on the space required for the scrubber installation, where up to 0.3% of the total available TEU slots are presupposed to be lost. This should be applied all over every second of a voyage, where other operating costs such as crew, spare parts and maintenance are assumed to be 20% higher than the reference vessels [
35]. There is the possibility here of applying a closed-loop wet scrubber system using freshwater and caustic-soda, if the ship is sailing in an area where it is not allowed to discharge the wash-water into the sea.
Although the required scrubber efficiency depends on the area and the fuel used, the data is based on an efficiency of 97.1%, which is sufficient to clean 3.5% Sulphur fuel and meet the requirements. We assumed a constant operation without stoppage between both ends so the best choice was hybrid system. Control of PH by inserting Sodium Hydroxide or Caustic Soda (NaoH)enables the wash-water circulation rate [
28]. However, based on the initial assumption (route and emission criteria), the total fuel consumption will depend on the sailing profile (engine load and sailing time) therefore power consumption reduces to about half that of open-loop systems at approximately 20 m
3/MWh and between 0.5–1% of the power of the engine is used. Additionally, based on estimates provided by HHI shipyards, the cost of retrofitting the scrubber system would be approximately 300, 275 and 250
$ per kw, respectively, for 3300 TEU, 6500 TEU and 14,000 TEU ships. In this respect, it is expected that the system can run for a long time here between overhauls.
The scrubber and relevant machineries here, such as electrical motors and pumps, are considered as power consumers. In this regard, the use of a Sulphur Oxides (SOx) scrubber increases the backpressure in the exhaust gas system and, therefore, a specific tuning of the engine is required, which is a phenomenon that slightly influences the engine performance, so the SFOC will increase accordingly. Based on the technical surveys here, the study assumes 0.5 gr/kwh as an SFOC penalty for scrubber retrofitting. Meanwhile, in order to predict the engine power, the multiplicative factor for open and close systems are 6.1% and 2.6%, respectively [
36].
Based on the above assumption and, according to the fuel price scenario,
Table 4 shows the results of calculation of the total fuel cost for three types of vessels during the periods of 2015, 2020 and 2025. In this respect, the amount of ECA exposure corresponds with the calculations and the results.
Table 5 shows the amount of benefits from scrubber installment in comparison to using MGO.
2.8.1. Feasibility of the Technical Alternatives
Despite the lower costs of LNG, it is still a big issue to determine the payback time. An initial comparative investigation shows that investment in dual-fuel engines appears to be more significant than in other alternatives but, even with this, the large price difference between gas and heavy fuel oil means payback periods for investment costs can be shorter. In this regard, once the initial investment has been recouped, on-going savings on energy costs from lower priced natural gas will be the business’ profit. Thus, the NPV, Internal Rate of Return (IRR) and payback results should be provided according to the base case. In general, if the NPV and payback here are positive for a chosen alternative, then that solution could be financially more feasible and attractive than in using distillate fuel as the base case under the selected circumstances.
2.8.2. Synthesizing Data and Results
Either using LNG or a scrubber, lost the space of cargo depends on the space required for retrofitting the scrubber or LNG, where up to 0.3% of the total TEU slots for scrubber installing, and 3% for LNG, are presupposed to be lost [
36]. Other operating costs, such as crew, spare parts and maintenance are assumed to be 10% higher than for the reference vessels for LNG. Concerning the scrubber high acidic products, exhaust particles and contaminants, which should be stored and delivered to port facilities, the higher level maintenance, survey and labour costs should be considered; 20% as the extra Opex and running costs.
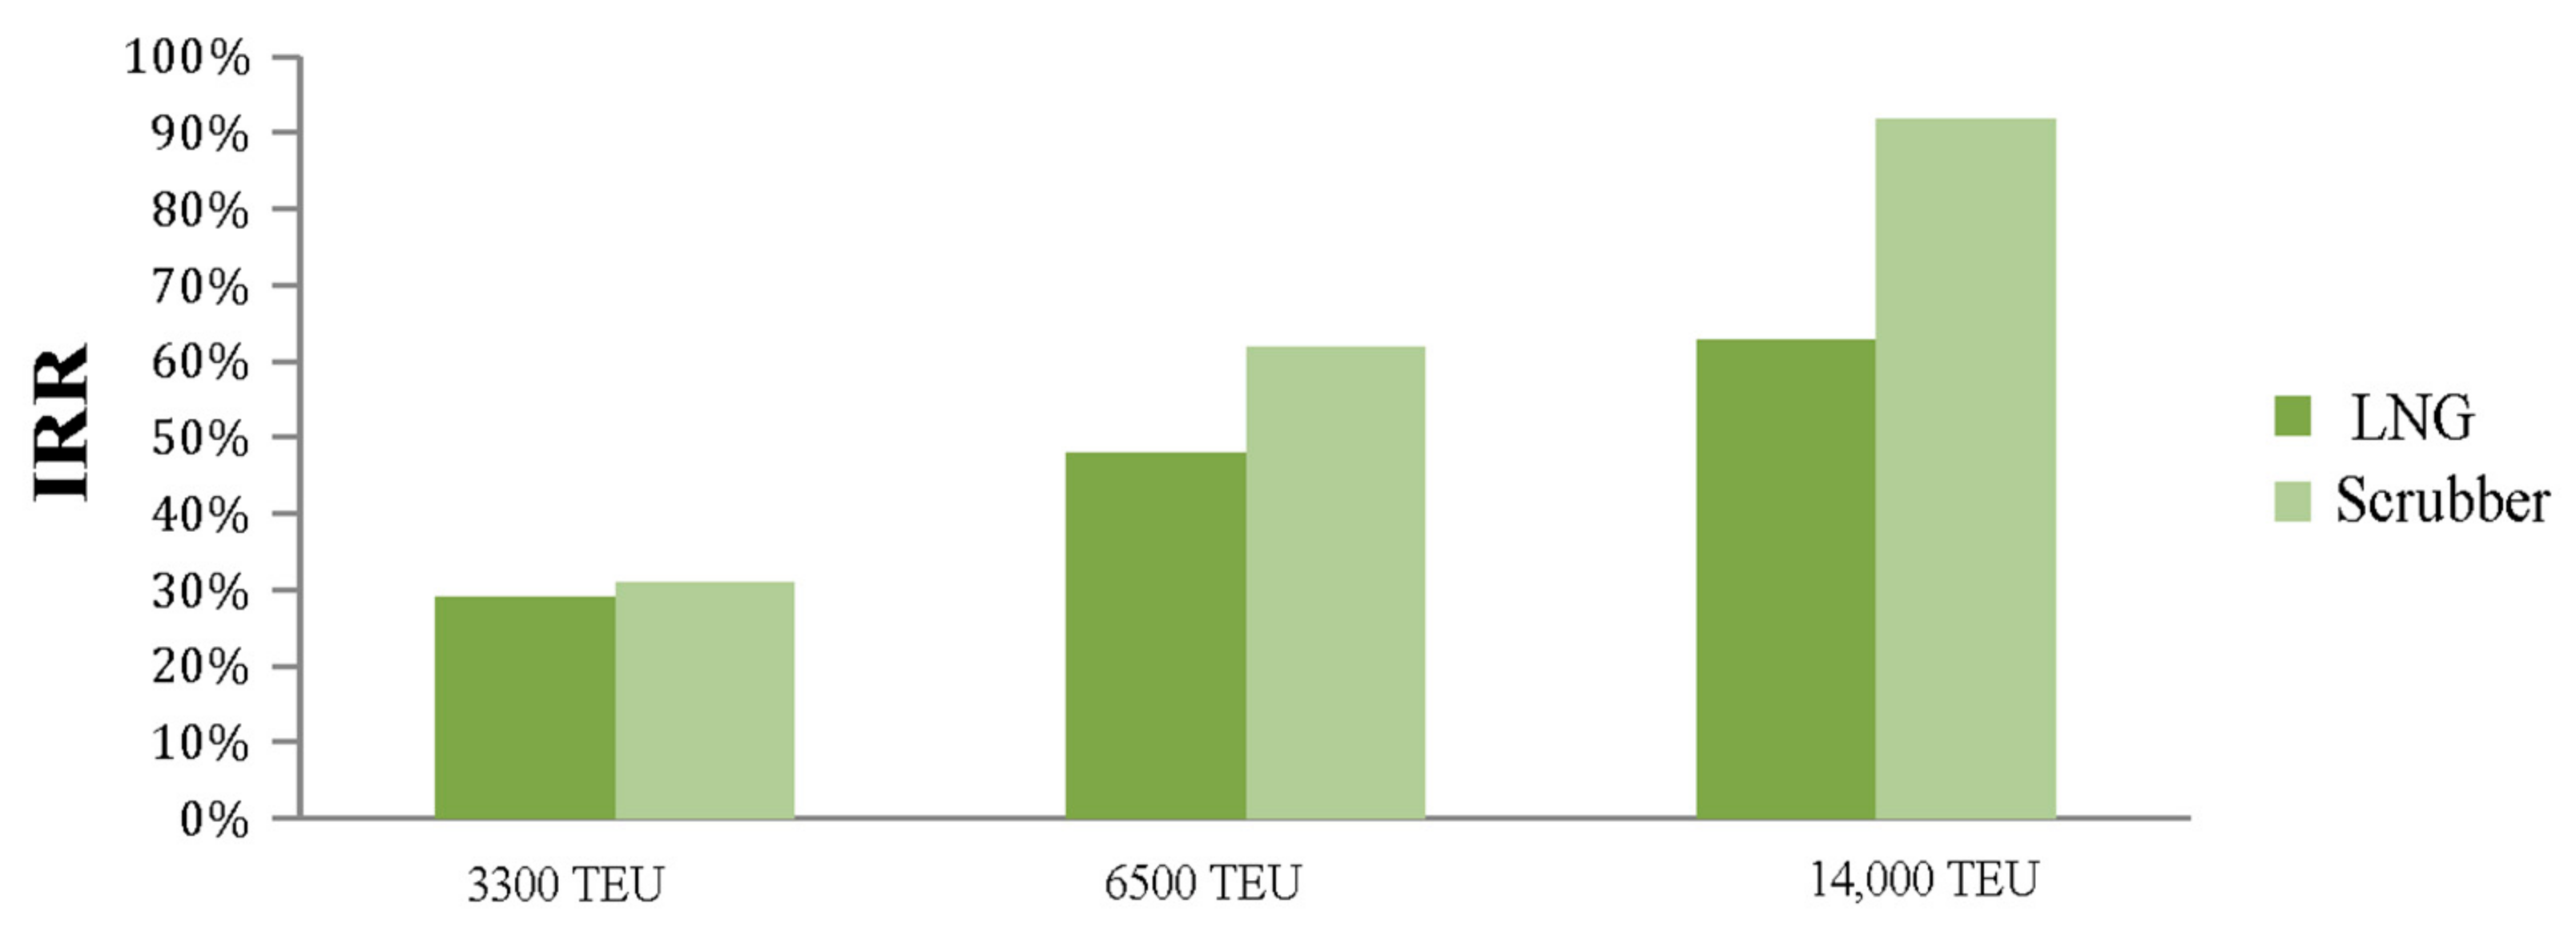
To illustrate the proportional figure of whether or not to install a scrubber system or LNG plant, the following bar graphs give a perspective of benefit from each system.
Figure 7 and
Figure 8 here provide a clear argument on using dual-fuel or scrubber system.
2.8.3. Capital Budgeting and Feasibility of Investment
To calculate the NPV and payback time, general assumptions are considered where a discount rate of 11% and inflation rate of 4% is assumed, and where the savings period is 10 years (2016–2025) [
37]. The first hand data for calculating Opex and Capex for existing vessels were obtained from the shipping lines and HHS shipyard, while the container freight prices were collected from the World Container Index. Further general assumptions are considered to comply with the final scenario. Thus, in this study authors assume that the beginning of market recovery phase on the shipping cycle where still the fleet run on slow steaming mode. In order to observe the effect of declining of EROI on the technical alternatives authors assume different scenarios on availability of low sulphur fuel. This effects on the rise in the oil price and consequently the increasing of the freight rate. In this study, authors investigated, via using NPV results, the sensitivity of the strategy on the impact of declining EROI on shipping in the various simulated scenarios. Accordingly, the effect of the shifting phases can be seen in the final graphs as the payback time and the NPV and rate of return in the different proposed scenario as well as market behavior with the fluctuations in the forces of uncertainties Meanwhile, sufficient space in the funnel area and poop deck to place the main scrubber components, and consequently it causes a reduction in the volume of cargo capacity (0.3% of the total volume).
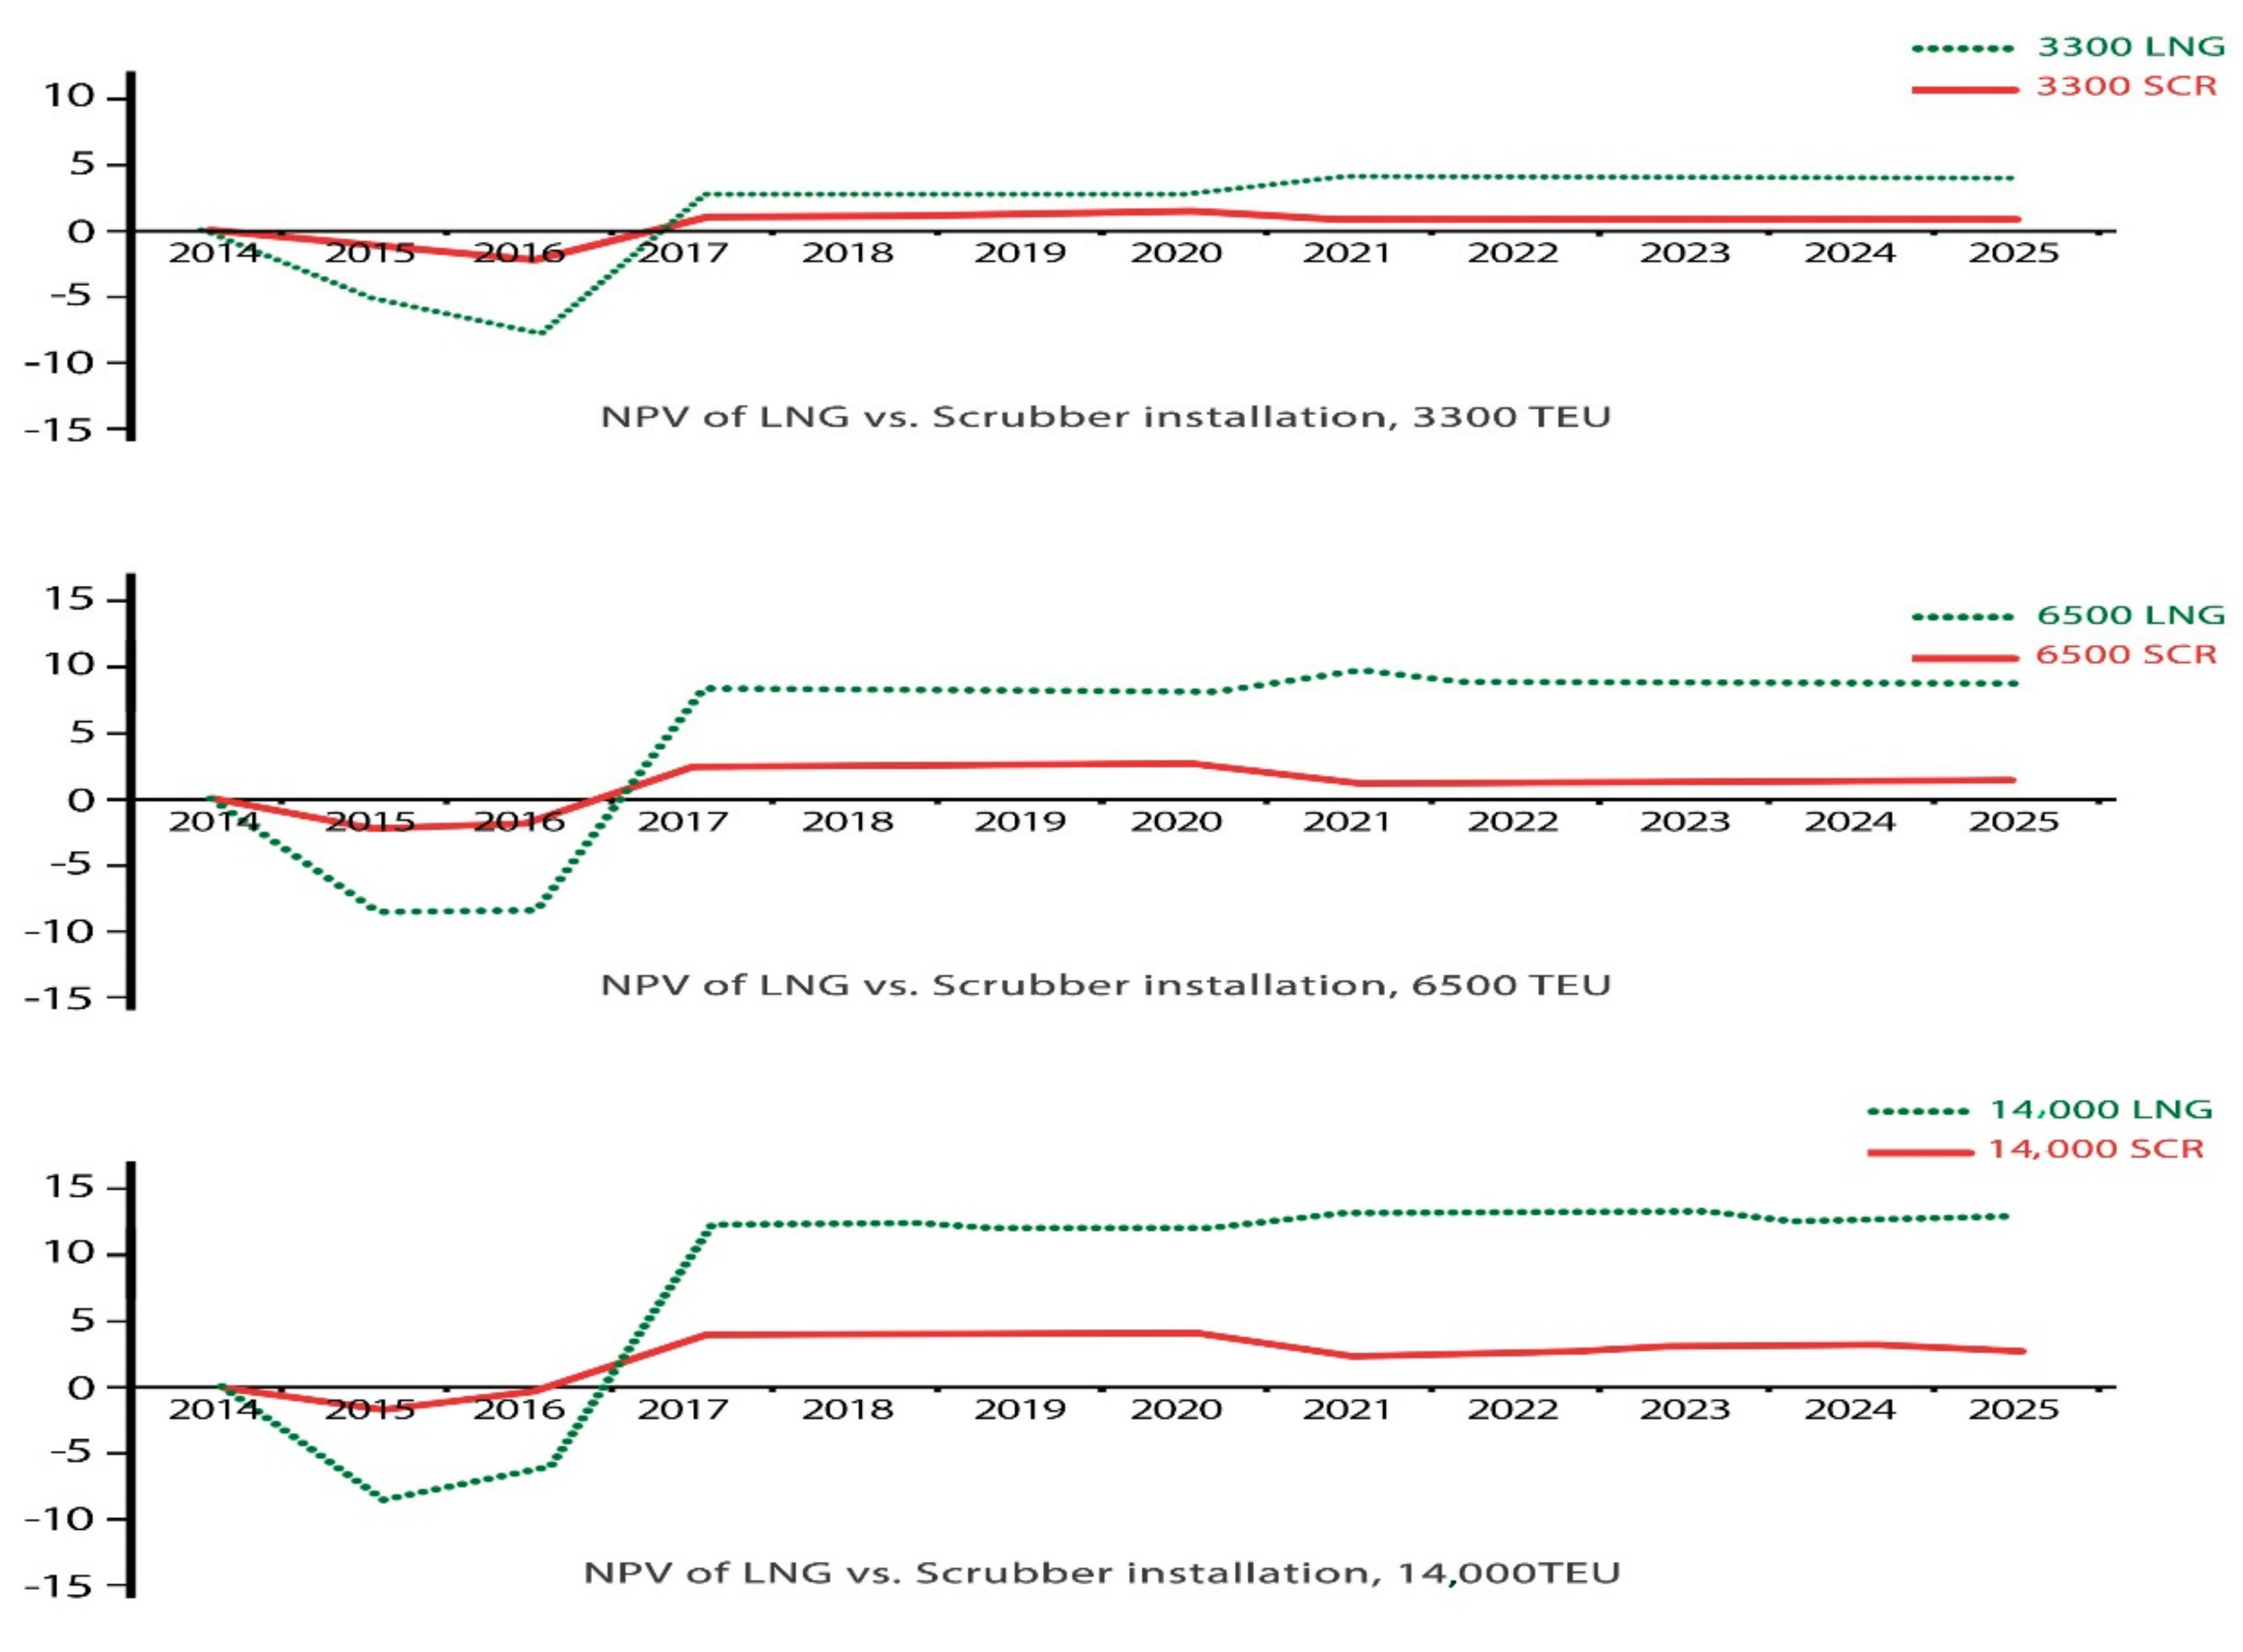
The first part of the investment was 30% is undertaken in 2014 and completed in the next year, 2015, while the remaining 70% was done when the ship delivery procedure had been completed. Concerning the alternative of installing a scrubber system, it looks beneficial and feasible (
Figure 9,
Figure 10 and
Figure 11) from both technical and financial perspectives.
2.8.4. Net Present Value (NPV) & Internal Rate of Return (IRR)
Authors apply the Net Present Value technique to compare each of technical alternatives, where the annual cash flow of each project is discounted to the present (using a discount ratio of 11% and inflation 4%) and summed, giving the net present value of each of the options. The payback rule, also called the payback period, is the length of time required to recover the cost of the project, which is the point on the graph where the cash flow curves cross the x-axis, according to (Sidney J and et al., 1999);
where:
ί—the time of the cash flow
T—the total time of the project
r—the discount rate
Cί—the net cash flow (the amount of cash) at that point in time.
C0—the capital outlay at the beginning of the investment time (ί = 0)
2.9. Sensitivity Simulation
The proposed analytical model to predict costs and benefits for the LNG dual fuel engine and scrubber systems onboard container vessels offers extensive possibilities of studying additional variants. Options here include different vessel sizes and route profiles, including ECA exposure and other LNG investment rates. In this regard, the attractiveness of LNG as a ship fuel has been compared to scrubber systems and found dominated by three parameters affecting feasibility:
A five-year postponement of the global sulphur cap
A price difference between LNG and HFO
Investment costs for conversion to dual fuel engine
Based on the results in the previous chapter, the respective payback period and the fluctuation of the NPV trend strongly depends on the differential prices of LNG, along with oil prices (
Figure 8). For a cost spread of 620 usd/Mt of the average price of MGO and HFO, and for a cost of 480 usd/Mt for LNG and all reference vessels, the payback time is of the same order as for the scrubber system, but shows a higher rate of NPV for dual-fuel performance.
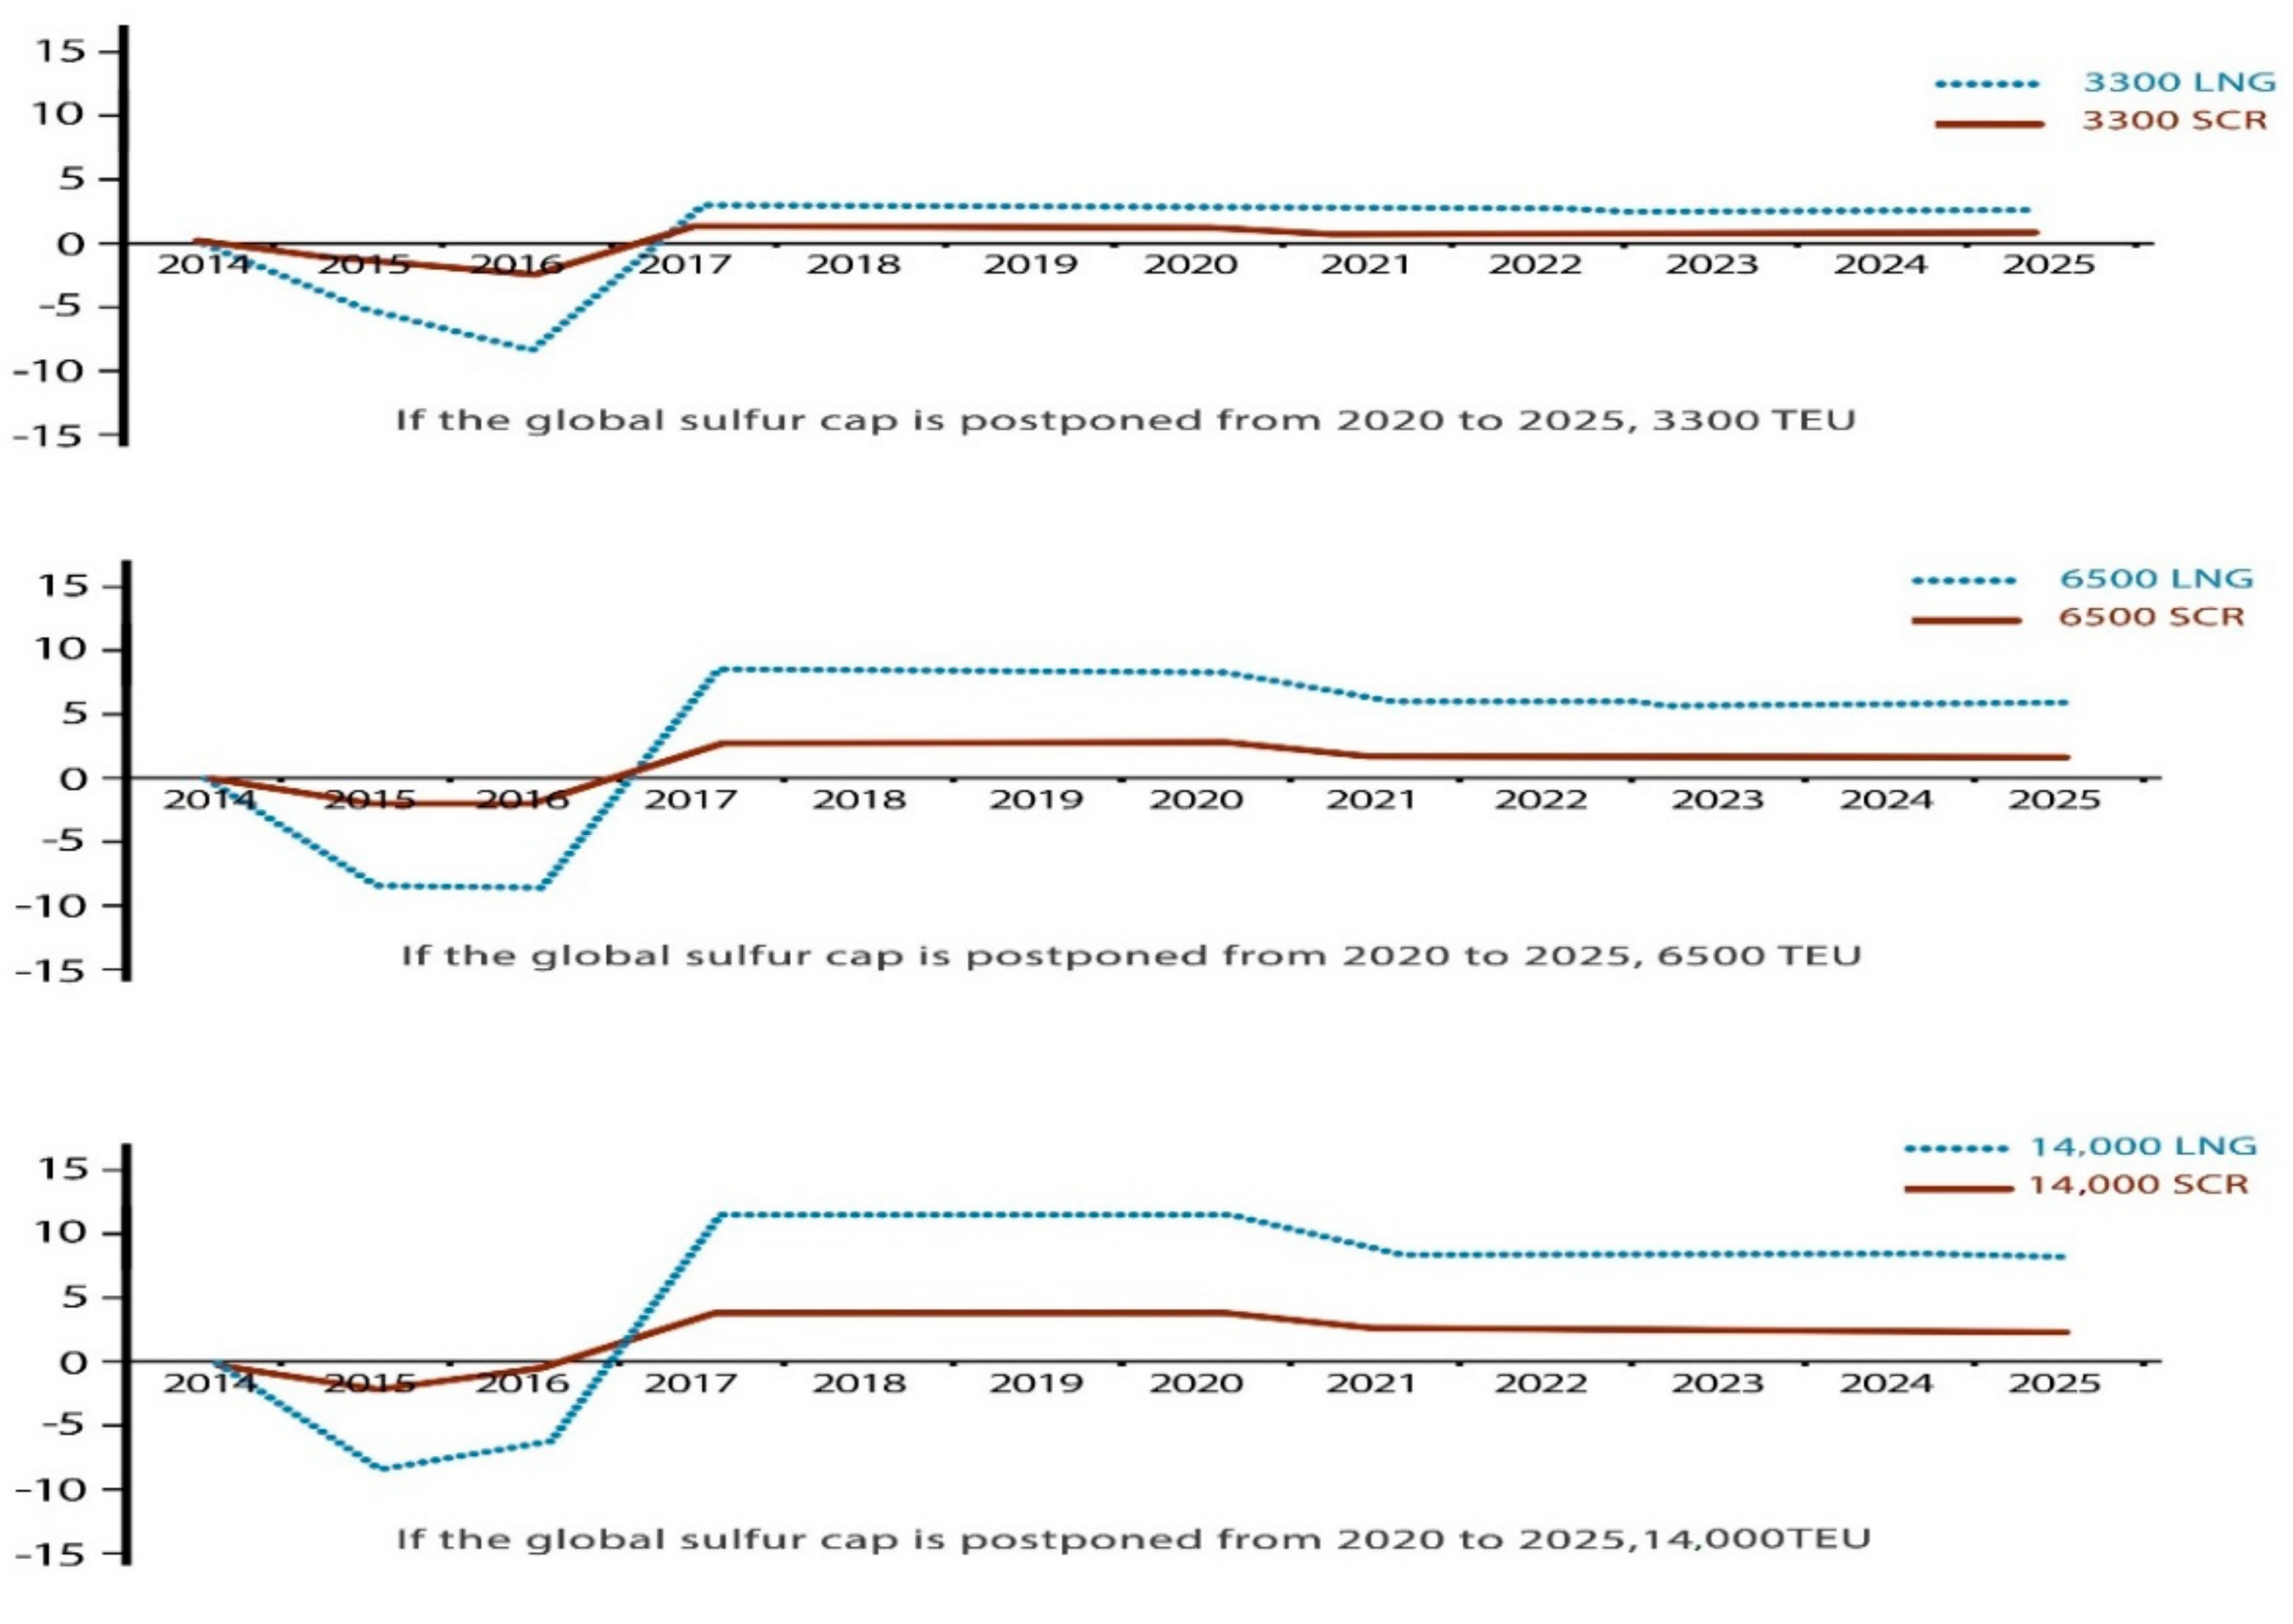
Figure 9 shows that, for two existing vessels (3300 TEU and 6500 TEU) nominated for conversion, the payback time is 2.5 years, and is 26 months for new order 14,000 TEU. It should be taken into consideration here that the conversion costs for existing vessels is assumed to be 15% higher than for the new order vessels. In this respect, the NPV of dual fuel or scrubber reaches higher values when the differences LNG to HFO/MGO price increase. Therefore, if the global cap is to enter into force later than 2020, the NPV rate will be diminished, as the HFO can continue to be burnt throughout the entire period 2015–2025 outside ECAs, with a higher rate of sulphur content (
Figure 9).
Presently, the oil prices are highly volatile and have plummeted with little hope of a swift returning to the previous levels. However, if oil and LNG prices return to the level of prices in June 2014 (Based on the general assumption and a cost spread for 350, 480 and 380 us /Mt for HFO, MGO and LNG) for all reference vessels, respectively, payback time is of the same order as for the use of scrubber,
Figure 10 shows the payback time is less than 30 months making use of scrubber a suitable option, although the significantly higher rate of NPV, as well as the smaller financial risk for dual-fuel engines performance, are clear evident.
It shows that, if the global sulphur cap is postponed for 5 years, neither system will be very sensitive. Compared to the base case, we can see in the following graphs at 2020 whether the vessels still are allowed to run on HFO with 3.5% sulphur, which has a smaller price than MGO, with 0.5% sulphur content. However, the scrubber option is not very sensitive to changes in absolute HFO prices, as it has less ECAs exposure.
With regard to the installed engines, the LNG price is an important and crucial factor for conversion to LNG. Moreover, from a psychological market perspective, with increasing LNG demand, and if the supply cannot meet demand, then the market will be inelastic. In this condition, it’s foreseeable that at a price parity of HFO and LNG, payback time can be imposed by immediate changes in market behaviour. Referring to
Figure 11, the respective IRR values are in a feasible area at a higher rate than the introduced project yield, but the payback time increases for more than three years at a price parity of HFO and LNG. To illustrate the sensitivity of the dual-fuel alternative to the purchasing cost of LNG,
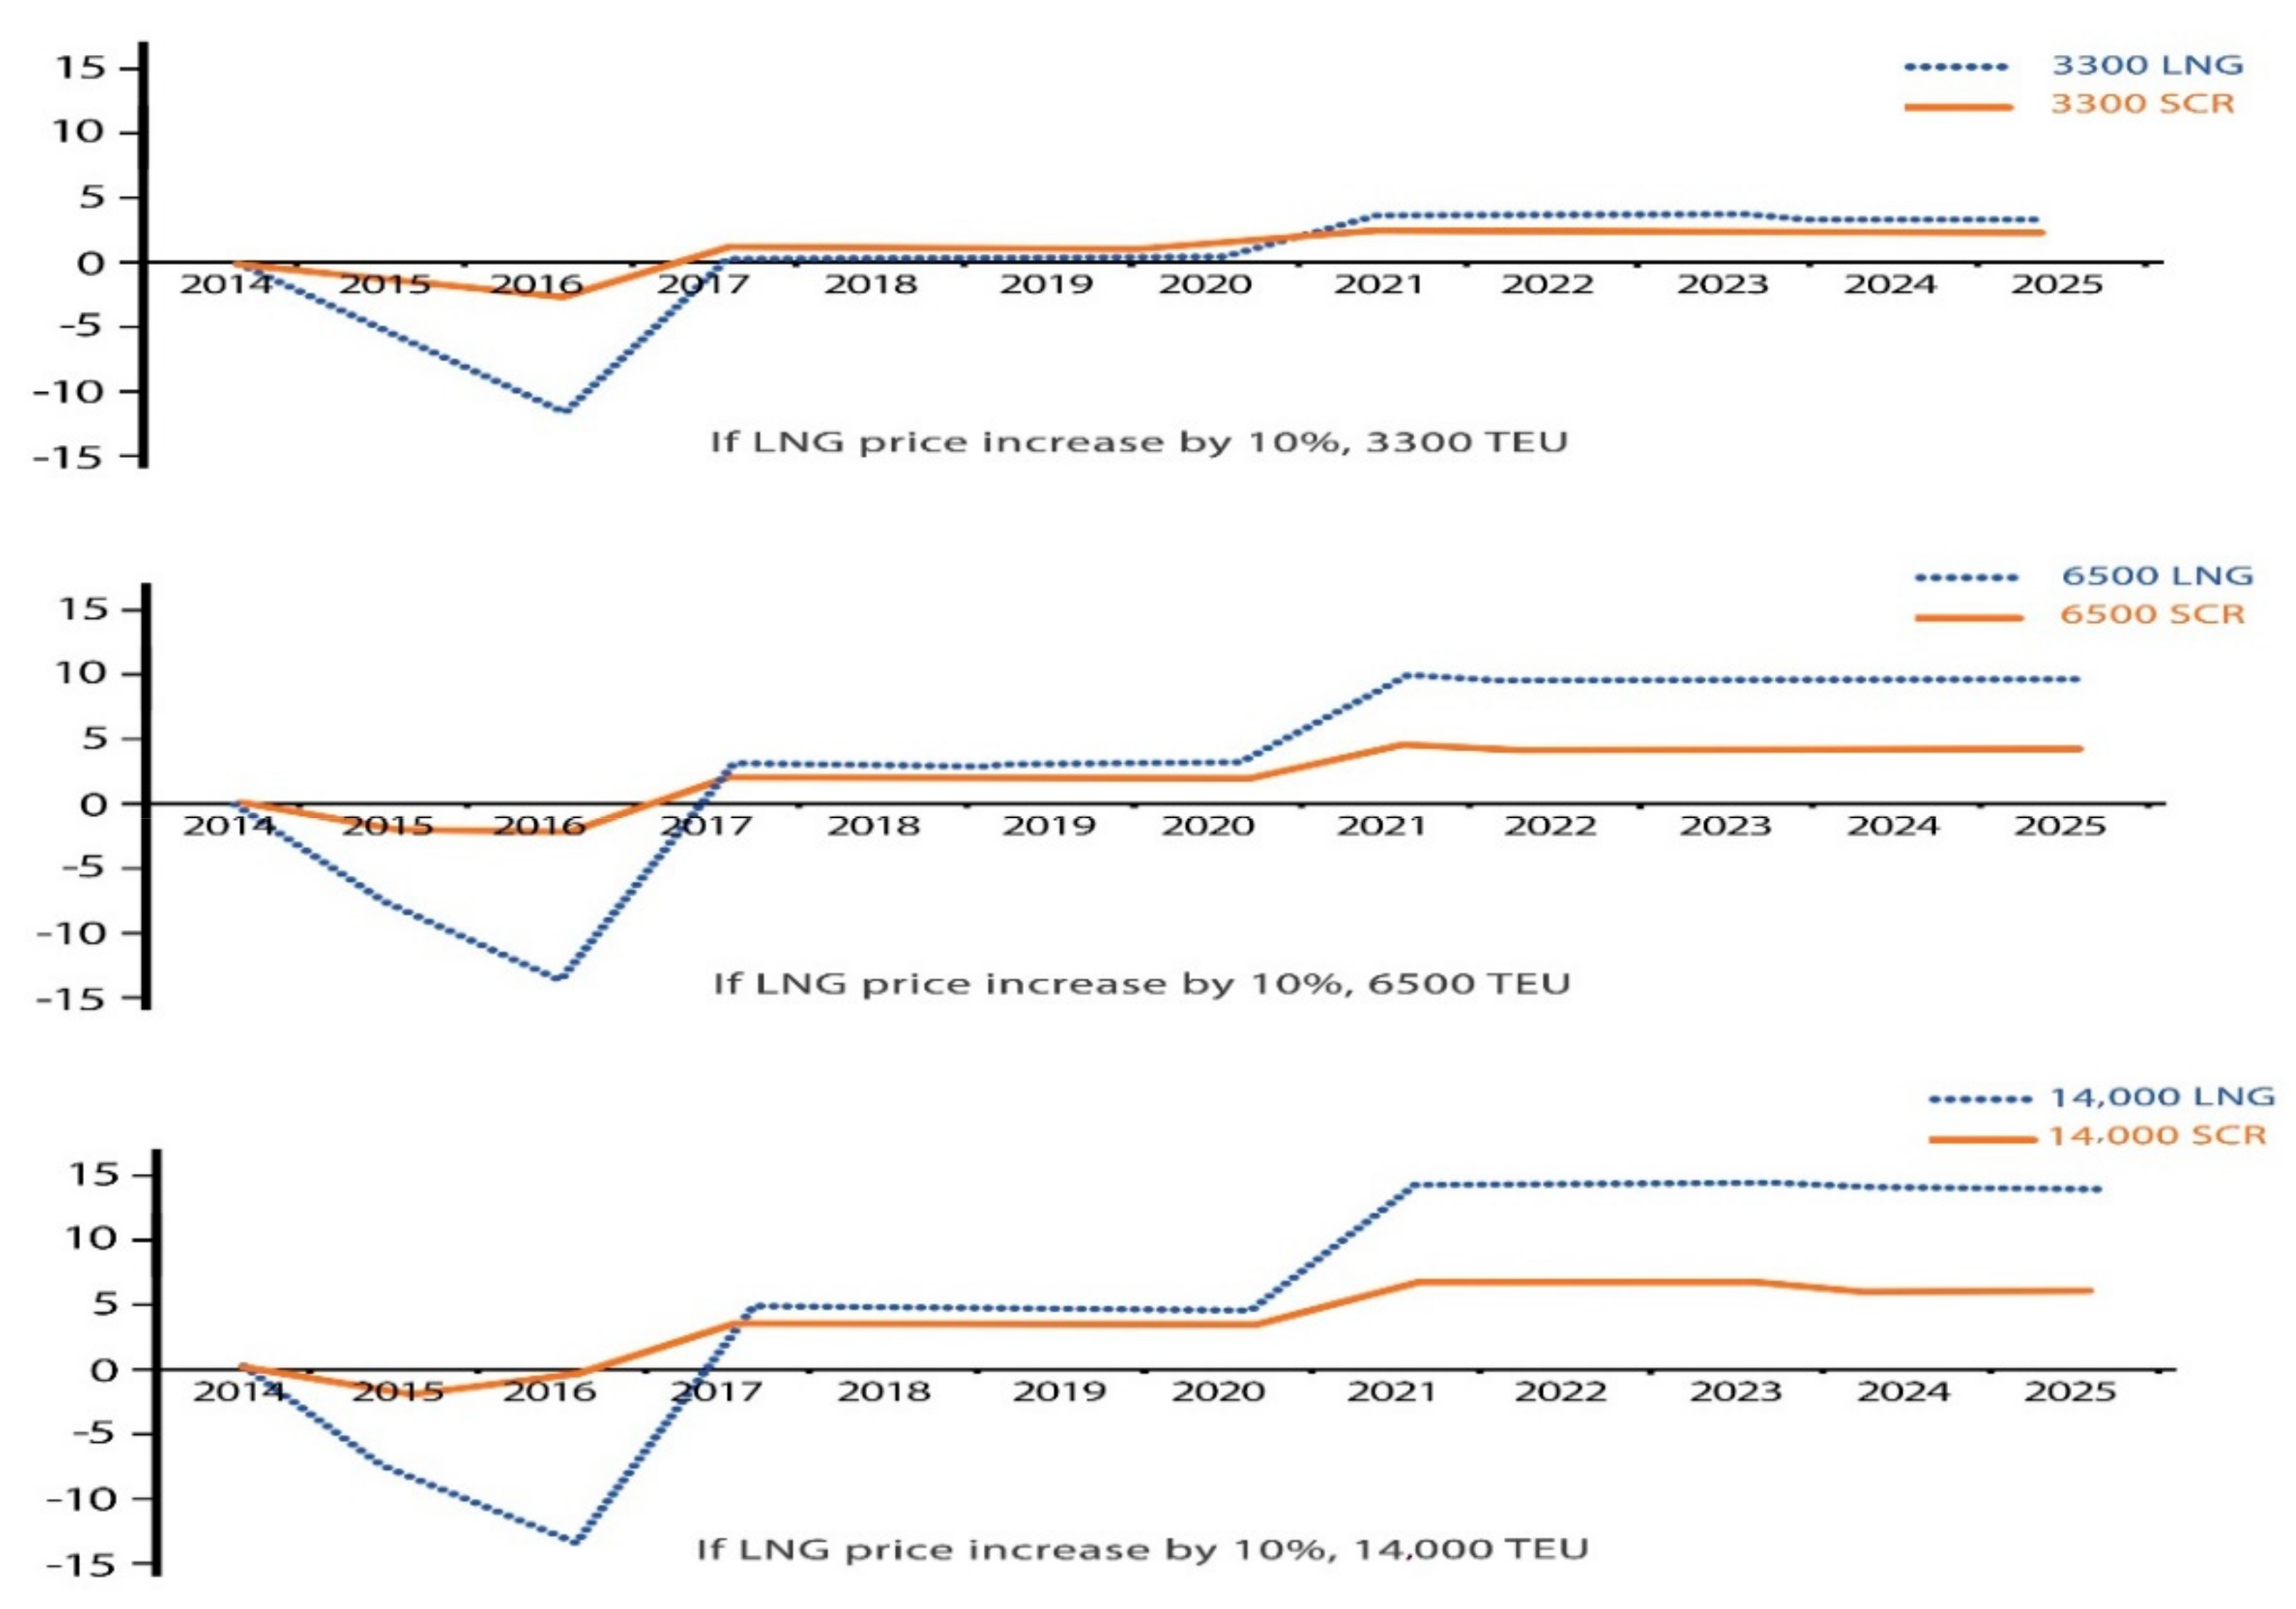
Figure 11 shows the function of LNG costs vary from 420 to 480 usd/Mt for the selected operational percentage inside ECAs. In this respect, on the basis of the dynamic NPV matrixes, if LNG price increase by more than 140 usd/Mt, then the payback time will increase by more than five years, which will not cope with company strategy.
One of the most fundamental and challenging factors is the LNG price, especially if the supply cannot meet demand, when the market will be inelastic. We assume here that the LNG price is set at a price parity of the average price of HFO and MGO in 2015, and increases by 10% (~50 usd/Mt), which shows the breakeven point is highly sensitive to the LNG price, particularly for smaller vessels.
The NPV of dual fuel or scrubber reaches higher values when the HFO/MGO prices increase. Therefore, if the global cap is to enter into force later, in 2020, the NPV will be reduced, as HFO can continue to be burned throughout the whole period of 2015–2025 outside ECA, with a higher rate of sulphur content.
If we consider one of the most crucial factors to be the percentage of ECA exposure, then the LNG cost is comparable to an average of HFO and MGO at ~780 usd/Mt
The LNG alternative here is certainly an attractive option for an ECA operation of at least 44% ECA exposure of the defined route. In this respect, it is important that, if LNG is more expensive than HFO, the LNG option is highly dependent on solely running for a higher duration in ECAs.
Furthermore, the financial benefit of the LNG alternative will depend on the cost spread between HFO and MGO, as illustrated (
Table 4). Comparing the LNG and scrubber system’s payback for the three types of vessels shows that, even at high specific LNG tank costs, the payback time is shorter for the LNG system (when the standard fuel price scenario is used) than for the scrubber. Considering LNG supply infrastructure is still not widely available for deep sea vessels, changes in LNG distribution costs are considered to affect payback for LNG systems.
The capex of conversion to gaseous dual-fuel here can influence the net present value and payback time. In this regard, in order to find sensitivity limitations, the study assumes that investment increases by 10 million for each type of vessel (Ref. to
Figure 10). In this case, the payback time for the larger vessels shows a stronger dependency on the investment than for the smaller vessels (who also depend on the underlying ECA exposure levels). Comparing LNG and the scrubber system’s payback for the 3300, 6500 and 14,000 TEU vessel shows that, even at a higher rate of cash out, the payback time is shorter for the LNG system (when the standard fuel price scenario is used) than for the scrubber.
3. Conclusions
Using LNG promises less emission and fewer fuel costs. As a ship fuel, it is attractive for the fleet, compared to scrubber systems, in the trade route from the Far East to Northern Europe.
A decrease in the EROI trend of Natural Gas can increase the sensitivity of the financial model, which are crucial factors in order for the shipping industry to opt for LNG as a marine fuel. However, it has showed that lower EROI for oil masked by natural gas extracted in oil production. In other words, for the higher values of the EROI of gas, while the growth in net energy availability slows and EROI of oil continues to fall, the LNG may be viewed as a more available, reliable and attractive alternative marine fuel than oil.
With 44% ECA exposure, an LNG system payback time of less than three years is predicted for 3300 TEU and 6500 TEU, and 2.5 years for 14,000 TEU (New order). For all the vessel sizes, a comparison of NPV and payback period for both of the alternatives shows that the LNG system is more attractive than scrubber and MGO, as long as the differences in LNG price (delivered on board) to HFO is not less than 140 usd/Mt.
The price of LNG delivered to the ship is difficult to predict as it depends on the area concerned. For larger vessels (especially new order) operating at ECA shares higher than 44%, the study expects to associate with the shortest payback period (if the increasing fuel price scenario is considered and global sulphur cap comes into force in 2020), and the use of a scrubber system reduces the payback time and is more attractive than MGO, especially after 2020, and particularly if ECA exposure on the route profile increases.
LNG prices of up to 550 usd/Mt could provide a competitive advantage for dual-fuel engine against scrubbers, in terms of payback time. The ECAs operation share here is one of the most crucial factors, while the capex also plays an important role in payback time and profitability.
A dual-fuel engine vessel has lower fuel costs and maintenance costs, and better chartering potential, which may lead to a higher capex but a longer period of economic depreciation. It makes economic sense for banks here to confront with less risk by financing on dual fuel engine vessels, particularly given the higher investment horizon.
For less than 100 usd/Mt differences between LNG prices and average of price parity of HFO and MGO, using a scrubber is more feasible and attractive. Furthermore, it supposes that steady increases in demand for natural gas drives the price to the sensitive rate that is expected to cause high natural gas prices, and then may lead to switching from using natural gas to using scrubber HFO.
And finally, based on the limitations of this study, we propose undertaking systematic assessments of the experience in utilizing newly ordered dual-fueled engine vessels in order to assess the economic impact of the improvement of newly-designed engine performance to reach higher transparency in the future market.


