Article

Allelopathic Inhibition by the Bacteria Bacillus cereus BE23 on Growth and Photosynthesis of the Macroalga Ulva prolifera

1
Ocean College, Zhejiang University, Zhoushan 316021, China
2
College of Marine Life Sciences, Ocean University of China, Qingdao 266003, China
3
Key Laboratory of Marine Ecosystem Dynamics, Second Institute of Oceanography, Ministry of Natural Resources, Hangzhou 310012, China
4
University of Maryland Center for Environmental Science, Horn Point Laboratory, Cambridge, MD 21613, USA
5
School of Oceanography, Shanghai Jiao Tong University, 1954 Huashan Rd., Shanghai 200204, China
*
Author to whom correspondence should be addressed.
J. Mar. Sci. Eng. 2020, 8(9), 718; https://doi.org/10.3390/jmse8090718
Submission received: 27 August 2020 / Revised: 13 September 2020 / Accepted: 13 September 2020 / Published: 16 September 2020
(This article belongs to the Special Issue Taxonomy and Ecology of Marine Algae)

Abstract

:
Bacteria-derived allelopathic effects on microalgae blooms have been studied with an aim to develop algicidal products that may have field applications. However, few such studies have been conducted on macroalgae. Therefore, a series of experiments was conducted to investigate the impacts of different concentrations of cell-free filtrate of the bacteria Bacillus cereus BE23 on Ulva prolifera. Excessive reactive oxygen species (ROS) were produced when these cells were exposed to high concentrations of filtrate relative to f/2 medium. In such conditions, the antioxidative defense system of the macroalga was activated as shown by activities of the enzymes superoxide dismutase (SOD) and catalase (CAT) and upregulation of the associated genes upMnSOD and upCAT. High concentrations of filtrate also inhibited growth of U. prolifera, and reduced chlorophyll a and b, the photosynthetic efficiency (Fv/Fm), and the electron transport rate (rETR). Non-photochemical quenching (NPQ) was also inhibited, as evidenced by the downregulation of the photoprotective genes PsbS and LhcSR. Collectively, this evidence indicates that the alteration of energy dissipation caused excess cellular ROS accumulation that further induced oxidative damage on the photosynthesis apparatus of the D1 protein. The potential allelochemicals were further isolated by five steps of extraction and insolation (solid phase–liquid phase–open column–UPLC–preHPLC) and identified as N-phenethylacetamide, cyclo (L-Pro-L-Val), and cyclo (L-Pro-L-Pro) by HR-ESI-MS and NMR spectra. The diketopiperazines derivative, cyclo (L-Pro-L-Pro), exhibited the highest inhibition on U. prolifera and may be a good candidate as an algicidal product for green algae bloom control.

Graphical Abstract

1. Introduction

Allelopathic interactions are considered to be important factors that affect the growth or survival of organisms within the same ecological habit. Allelochemicals are secondary metabolites from plants, algae, or bacteria [1]. They may have positive benefits (positive allelopathy) or may be detrimental (negative allelopathy) [2]. Allelopathy has been considered to be one potential control mechanism for harmful algae blooms (HABs) [3]. The inhibition effects of allelopathic compounds on algae include destroying the cell structure [4,5], altering production of the reactive oxygen species (ROS) [6], impacting intracellular enzymatic activities [7], or altering the photosynthesis system [8] and related gene expression [9]. External stress can induce the production of ROS, i.e., hydrogen peroxide (H2O2) and superoxide radical (O2•−), and can induce the regulation of the antioxidative defense or the photoprotection system [10,11].
A number of bacteria-derived algicidal compounds have drawn wide attention as a control for HABs [12,13,14] and the algicidal compounds belonging to the Cytophaga-Flavobacterium-Bacteroides (CFB) phylum have been identified [15]. Among this phylogenetic profile, the genus of Bacillus shows promise in controlling HABs, as negative effects have been demonstrated on the diatom Skeletonema costatum, the raphidophyte Heterosigma akashiwo, the dinoflagellate Prorocentrum donghaiense [16], the prymnesiophyte Phaeocystis globosa [16,17], and the cyanobacterium Microcystis aeruginosa [18]. The potential allelochemicals that have been isolated and identified from Bacillus sp. include terpene, steroids, and alkaloids [19,20]. The active compounds and mechanisms remain to be identified due to the species-specific response to algicidal bacteria [21].
The green tides caused by blooms of Ulva prolifera have occurred in the Yellow Sea of China since 2007 [22,23,24,25,26]. These massive blooms negatively impact the local communities, aquaculture operations, and tourism, causing great damage to the local ecosystem service and enormous economic loss [27]. The rapid growth of U. prolifera, on the other hand, makes it the strongest competitor for nutrients and light [28,29] in the bloom area, thereby driving the great impact on the marine biodiversity and structure of the community [30,31,32]. There are currently no effective measures to control these blooms.
The Bacillus sp.-derived control of HABs is promising, but limited exploration has been undertaken in mitigating the green tides. As a complicating factor, the life stage of thalli has been reported to be an important factor in green tide development [27]. Therefore, a series of experiments were performed to understand the extent to which bacterial allelopathy may be effective in controlling the thalli of U. prolifera. Specifically, the following questions were addressed: (1) does the cell-free filtrate of Bacillus sp. inhibit the growth of U. prolifera and if so, what is the effective dose? (2) What is the mechanism by which negative allelopathy occurs, particularly with respect to the antioxidative defense system and the photosynthetic system II (PSII) response? (3) What are the potential allelochemicals in the filtrate of Bacillus sp. that cause negative effects on U. prolifera?

2. Materials and Methods

2.1. Algal Culture and Identification

Asexual isolates of Ulva prolifera were provided by Zhejiang Xiangshan Xuwen Algal Exploitation Company, China, in October 2018. Specimens were subsequently transferred to the laboratory on ice, sterilized with 0.7% potassium iodide (KI) for 5 min, and then rinsed with autoclaved seawater. The pre-sterilized thalli were maintained in sterilized f/2 medium [33], with salinity of 30, temperature of 20 °C, and light of 60 μmol·m2·s−1 (12/12 h of light/dark cycle). The media were replaced every 5 days.
To minimize the interference of carry-over epiphytic bacteria in U. prolifera, cultures were pretreated before each exposure experiment by antibiotic mixtures of penicillin (100 mg/L), polymixin (0.75 mg/L), and neomycin (0.9 mg/L) for 48 h [34].
The macroalga was identified using the method described in Li et al. [35]. Total DNA was extracted with a commercial Plant DNA Mini Kit (TaKaRa, China). ITS and 5S sequences were amplified by the corresponding PCR primers (Table 1) and the conducted BLAST analyses in the NCBI database.

2.2. Experiment 1: Bacteria-Derived Allelopathic Inhibition on U. prolifera

2.2.1. Preparation of Cell-Free Filtrate from Bacillus cereus

The bacterium strain Bacillus cereus BE23 was previously isolated from the mangrove area in Hainan province, China, and maintained in Luria Bertani (LB) broth (peptone 10.0 g/L, yeast extract 5.0 g/L, sea salt 32 g/L, dissolved in dH2O) at 28 °C with shaking at 180 rpm/min. The strain was identified by the 16S rDNA gene and 1439 bp sequence that was acquired by PCR amplification. The bacteria were transferred from stock culture, with the initial concentration of 1010/mL, in 500 mL of LB medium. In 5 days, cell density of Bacillus cereus BE23 reached approximately 1 × 10¹²/mL, then cell-free filtrates were prepared by centrifuging 450 mL of the culture and filtering the supernatant through a Millipore™ (Burlington, MA, USA) Membrane Filter, 0.22 µm pore size.

2.2.2. Preparation of the Exposure Treatment

Triplicate intact macroalga thalli (approximately 1.25 g/L) were cultured in bacterial-free conditions with different ratios of Bacillus cereus BE23 filtrate to total media (filtrate + seawater, in volumes of 0:1, 1:100, 1:80, 1:60, 1:40, 1:20, and 1:10, hereafter identified as Control, T1:100, T1:80, T1:60, T1:40, T1:20, and T1:10, respectively) to a total of 400 mL each in 500 mL flasks. Then, stock f/2 medium was added to each flask. All final media were at f/2 levels, assuming that no or low nutrients were carried over by the filtrate. The concentration of bacteria cells in each treatment was 2.5 × 10⁹, 1.25 × 10¹⁰, 1.65 × 10¹⁰, 2.5 × 10¹⁰, 5 × 10¹⁰, and 1 × 10¹¹, respectively. The control treatment of U. prolifera was cultured in f/2 medium only, without a bacterial filtrate. All experiments were conducted in the same culture environment under a light intensity of 60 μmol·m2·s−1, and with a light/dark cycle of 12/12 h, salinity of 30, and temperature of 20 °C. The experiments were conducted in 500 mL flasks containing 400 mL of culture medium. Nutrients (equivalent to the nitrogen and phosphate level in f/2 media) were added every 48 h to exclude any effects of nutrient limitation, and pH values were monitored simultaneously. The culture flasks were randomly changed in terms of incubator position every day to balance the effect of illumination. Sterile conditions were used throughout.
Specimens of macroalga were harvested after 192 h (8 days) of exposure for biomass, photosynthesis, and antioxidant analysis.

2.2.3. Growth

The wet weight biomass of the macroalga was determined (±0.0001 g) at 0 and 192 h, respectively. Samples were treated by blotting with 3 layers of filter paper and conditioning for 10 min at room temperature. The relative growth rates (G) were calculated as
Gx = (Wx − Wc)/Wc
where Wc is the initial wet weight (g) of thalli and Wx is the fresh thalli wet weight (g) after treatment X.
The inhibition rate (IR) by the bacterium filtrates was calculated as
IR = (Gc − Gx)/Gc
where Gx is the relative growth rate (%) of U. prolifera after treatment X, and Gc is the relative growth rate (%) after 192 h in control.

2.2.4. The Antioxidant Defense System

Macroalgal samples (0.2~0.3 g wet weight) were homogenized in a bath of liquid nitrogen and extracted with commercial potassium phosphate buffer (pH = 7.2~7.4, Solarbio, China). Then, the extract was centrifuged at 10,000 rpm/min for 10 min yielding material for further analysis of total soluble protein (TSP), H2O2, and the enzymes superoxide dismutase (SOD) and catalase (CAT). Genes associated antioxidant activity, manganese superoxide dismutase (upMnSOD) and catalase (upCAT), were also quantified.
The TSP content was measured using the Coomassie blue dye binding assay [36]. Fifty microliters of extracts was homogenized with the Coomassie blue dye for 10 min and absorbance was measured at 595 nm. The results of TSP were expressed as g protein per liter (prot·g/L). One hundred microliters was mixed with the reaction reagents and detected at 405 nm. The concentration of ROS was measured as hydrogen peroxide (H2O2) and measured with a commercial assay kit (Jiancheng, Nanjing, China) following the manufacturer’s protocols. Concentrations of H2O2 were determined based on the decomposition of H2O2 by peroxidase and the results were expressed as mmol H2O2 per g of TSP (mmol/g prot). The activity of SOD was measured according to the method of Sun et al. [37]. Samples (20 μL) and reaction reagents were mixed in the microliter 96-well flat-bottom plates and put into the plate reader (Tecan, Switzerland) for incubation at 37 °C. After 20 min incubation, the mixtures were detected at 450 nm. One unit of SOD was defined as the amount of enzyme required to generate 50% inhibition of reduction of WST-1 [2-(4-lodophenyl)-3-(4-nitrophenyl)-5-(2,4-disulfophenyl)-2H-tetrazolium, monosodium salt]. The activity of CAT was assayed with the method described by Dhindsa et al. [38]. Briefly, a reaction mixture was composed of 50 μL extracts, 15 mM hydrogen peroxide, and 50 mM phosphate buffer. After addition of the enzyme extract, absorbance at 240 nm was recorded for 1 min. One unit of CAT activity is the amount of enzyme necessary to degrade 1 μmol H2O2 per mg of protein per sec.
The antioxidant enzyme coding genes (upMnSOD and upCAT) were amplified with gene-specific primer pairs (Table 2). RNA extraction and real-time PCR were performed the same as the photosynthetic genes.

2.2.5. Photosynthesis System

Concentrations of chlorophyll a (Chl a) and b (Chl b) were determined according to Zhao et al. [39]. Macroalgae (0.2 g) were grounded in liquid nitrogen and extracted in 90% v/v) acetone buffer (5 mL) for 12 h. Then, the mixture was centrifuged at 4 °C, 10,000 rpm/min for 10 min. The supernatant was collected for chlorophyll analyses, and optical densities were measured with an ultraviolet–visible spectrophotometer (HITACHI, U2900, Japan) at 663 and 645 nm wavelength. Concentrations of Chl a and b were then calculated as follows, and reported as units of mg/g fresh weight (mg/g FW):
Chl a = 12.7 OD663 − 2.69 OD645
Chl b = 22.9 OD645 − 4.68 OD663
Parameters associated the photosynthesis system II (PSII) were measured using an Imaging-PAM (Walz, Germany). These parameters included the effective quantum yield (Y(II)), non-photochemical quenching (NPQ), relative electron transport rate (rETR), and photochemical quenching (qP). The actinic light was set to be similar to the cultivation light (56 μmol·m−2·s−1). Subsamples of U. prolifera were dark-acclimated for 20 min prior to all measurements. All parameters were calculated according to the relationships in Table 3.
Four genes were selected for characterization: PsbS, LhcSR, PsbA, and PsbD. PsbS and LhcSR are associated with photoprotection and non-photochemical quenching (NPQ). PsbA and PsbD are indicators of the D1 and D2 protein of the PSII apparatus, respectively. The tubulin gene was deployed as a housekeeping gene to standardize the expression variations of target genes [39].
These genes were amplified with gene-specific primer pairs (Table 2). Samples of U. prolifera were quickly frozen in liquid nitrogen and stored at −80 °C until RNA extraction. Total RNA was extracted by a commercial MiniBEST Plant Total RNA Extraction Kit (TaKaRa, Dalian, China) and the reverse transcripts cDNA were analyzed using a Prime Script™ II 1st stand cDNA Synthesis kit (TaKaRa, Dalian, China). Real-time PCR was performed using the “TB GreenTM Fast qPCR Mix” kit (TaKaRa, Dalian, China). The amplification program of real-time PCR was set at 94 °C for 30 s, following 40 cycles of 94 °C for 5 s and 60 °C for 10 s in Light Cycler® 480 System (Roche, Germany). Dissociation curve analysis of the amplification products was carried out to verify the single PCR production at the end of each thermal program.

2.3. Experiment 2: Isolation and Identification the Potential Allelopathic Compounds from Cell-Free Filtrate of Bacillus cereus BE23

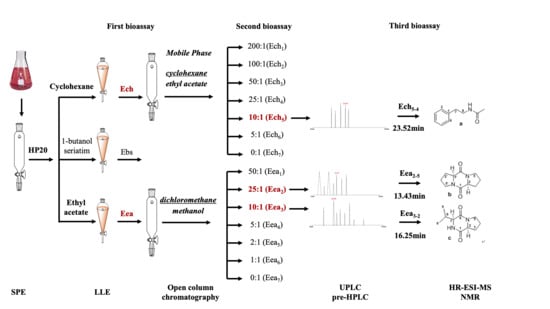
2.3.1. Step 1: Solid Phase and Liquid Phase Extraction of Potential Allelopathic Compounds

Cell-free filtrate (10 L; approximately 1 × 10¹⁶ bacteria cells) of the Bacillus cereus BE23 culture was collected after 5 days of growth by centrifuging at 10,000 rpm/min for 10 min and filtering with a 0.22 μm membrane. The filtrate was eluted by solid phase extraction (SPE) with the resin Diaion® HP20 (particle size of 20–60 mesh) and the remaining residuals were rinsed off by methanol. After resuspending the residuals in Milli-Q water, they were used for liquid phase extraction (LPE). Three extracting agents, cyclohexane, ethyl acetate, and 1-butanol, were considered as selection agents for different polarity fragments. Sub-residuals of LPE were extracted from each agent 3 times and concentrated in a rotary evaporator (IKA, RV8V, Germany) in a 30~40 °C water bath (Figure 1). The sub-residuals were identified as cyclohexane (Ech), ethyl acetate (Eea), and 1-butanol seriatim (Ebs). These sub-residuals, Ech, Eea, and Ebs, were weighted with an electron balance (±0.0001 g), dissolved in 20 mL dimethyl sulfoxide (DMSO), and stored at 4 °C for further bioassay experimentation.
The first U. prolifera bioassay experiment was performed in 6-well plates by filling them with macroalgae (approximately 0.05 g) and crude extraction (5 mg/L) or DMSO (control) in 10 mL f/2 medium. Each treatment was conducted in triplicate for 192 h under the same environmental conditions as the primary U. prolifera culture. Growth and inhibition rates were used to determine the potential allelopathic activities in each treatment (Supplementary Figure S2). Of the three extracting agents, extractions in cyclohexane (Ech) and in ethyl acetate (Eea) had an inhibition effect (Supplementary Figure S2), therefore, these extractions were used for further investigation.

2.3.2. Step 2: Open Column Chromatography to Select the Potential Allelopathic Compounds

To further purify the potential allelopathic compounds, Ech and Eea were eluted through an open silica gel column chromatography (170 × 30 mm in dimension and with a silica particle size of 200–300 mesh), respectively, and the eluents from each mobile phase were collected. As for extractions in cyclohexane (Ech), the mobile phase was cyclohexane and ethyl acetate with ratios of 200:1, 100:1, 50:1, 25:1, 10:1, 5:1, and 0:1 (hereafter named as Ech1, Ech2, etc.). For extraction in ethyl acetate (Eea), the mobile phase was dichloromethane and methanol with ratios of 50:1(Eea1), 25:1(Eea2), 10:1(Eea3), 5:1(Eea4), 2:1(Eea5), 1:1(Eea6), and 0:1(Eea7), respectively.
Then, a second bioassay was performed in 6-well plates by adding 0.05 g of U. prolifera (wet weight) and the corresponding extracted compounds (5 mg/L) in 10 mL of f/2 medium. Each treatment was conducted in triplicate for 192 h under the same environmental conditions as the primary U. prolifera culture. The extractions with significant inhibition, Ech5, Eea2, and Eea3 (Supplementary Figure S3), were collected for further detection.

2.3.3. Step 3: Ultra- and High-Performance Liquid Chromatography to Select the Potential Allelopathic Compounds

The bioactive fractions were collected separately and analyzed by analytical ultra-performance liquid chromatography (UPLC, ultimate 3000, Thermo Fisher Scientific, USA) with a C18 column (250 × 4.6 mm, 5 μm, Agilent, China) at a flow rate of 1 mL/min and the UV detection at 210 nm. The mobile phase was methanol or acetonitrile/water (10/90, v/v) −100% methanol with an elution time of 35 min. The dominant components (highest peaks), including 5 components from Ech5, 7 components from Eea2, and 8 components from Eea3, were chosen and the optimal UPLC conditions were retrieved for a further preparative step.
The fractions were then purified and collected by preparative high-performance liquid chromatography (HPLC, Shimadzu, AP20, Japan) with a C18 column (250 × 21.2 mm, 5 μm, NanoMicro, China) at a flow rate of 10 mL/min for different times up to 35 min for Ech5, Eea2, and Eea3, separately, using the recorded optimized mobile phase (Figure 1).
The third bioassay was conducted with the 20 components. Three compounds, Ech5-4, Eea2-5, and Eea3-2, were collected at 23.52, 13.43, and 16.25 min in each extraction run (Supplementary Figure S4).

2.3.4. Structure Identification

The three potential allelochemicals, Ech5-4, Eea2-5, and Eea3-2, were preliminarily analyzed by an Agilent 6230 time-of-flight liquid chromatography–mass spectrometer (TOF LC-MS) (Agilent, CA, USA) to determine the molecular weight. Then, structures were identified by a pulse Fourier transform nuclear magnetic resonance spectroscope (NMR, 600 MHz, JNM-ECZR, JEOL, Japan). Deutero methanol or deutero dimethyl sulfoxide solutions containing trimethylsilyl were used as reference substances and acted as solvents to record 1H and 13C NMR spectra. All chemical shifts were exhibited as relative values.

2.4. Statistical Analysis

All data were presented as mean ± standard error and were analyzed by one-way ANOVA with a significant level of 0.05 (Sigma plot 12.5, Systat Software Inc., London, UK). A phylogenetic tree was constructed using the neighbor-joining algorithm with the MEGA 7.0 program. Relative gene expression levels were analyzed following the 2−ΔΔCt method.

3. Results

3.1. Identification of Macroalga and Bacteria

The 5S sequence of the macroalga, 418 bp, was 100% identical to Ulva prolifera (GenBankID:HM584772.1) and the ITS sequence, 614 bp, was 99% identical to U. prolifera (GenBankID:KF130870.1). Thus, the macroalga deployed in the present study was identified as U. prolifera.
The 16S rDNA sequence of the bacterial strain BE23 (GenBank accession number: MN814015) was 100% identical, with few genetic distance differences, to that of Bacillus cereus strain ATCC14597 (Supplementary Figure S1). Thus, bacterial strain BE23 was identified as Bacillus cereus.

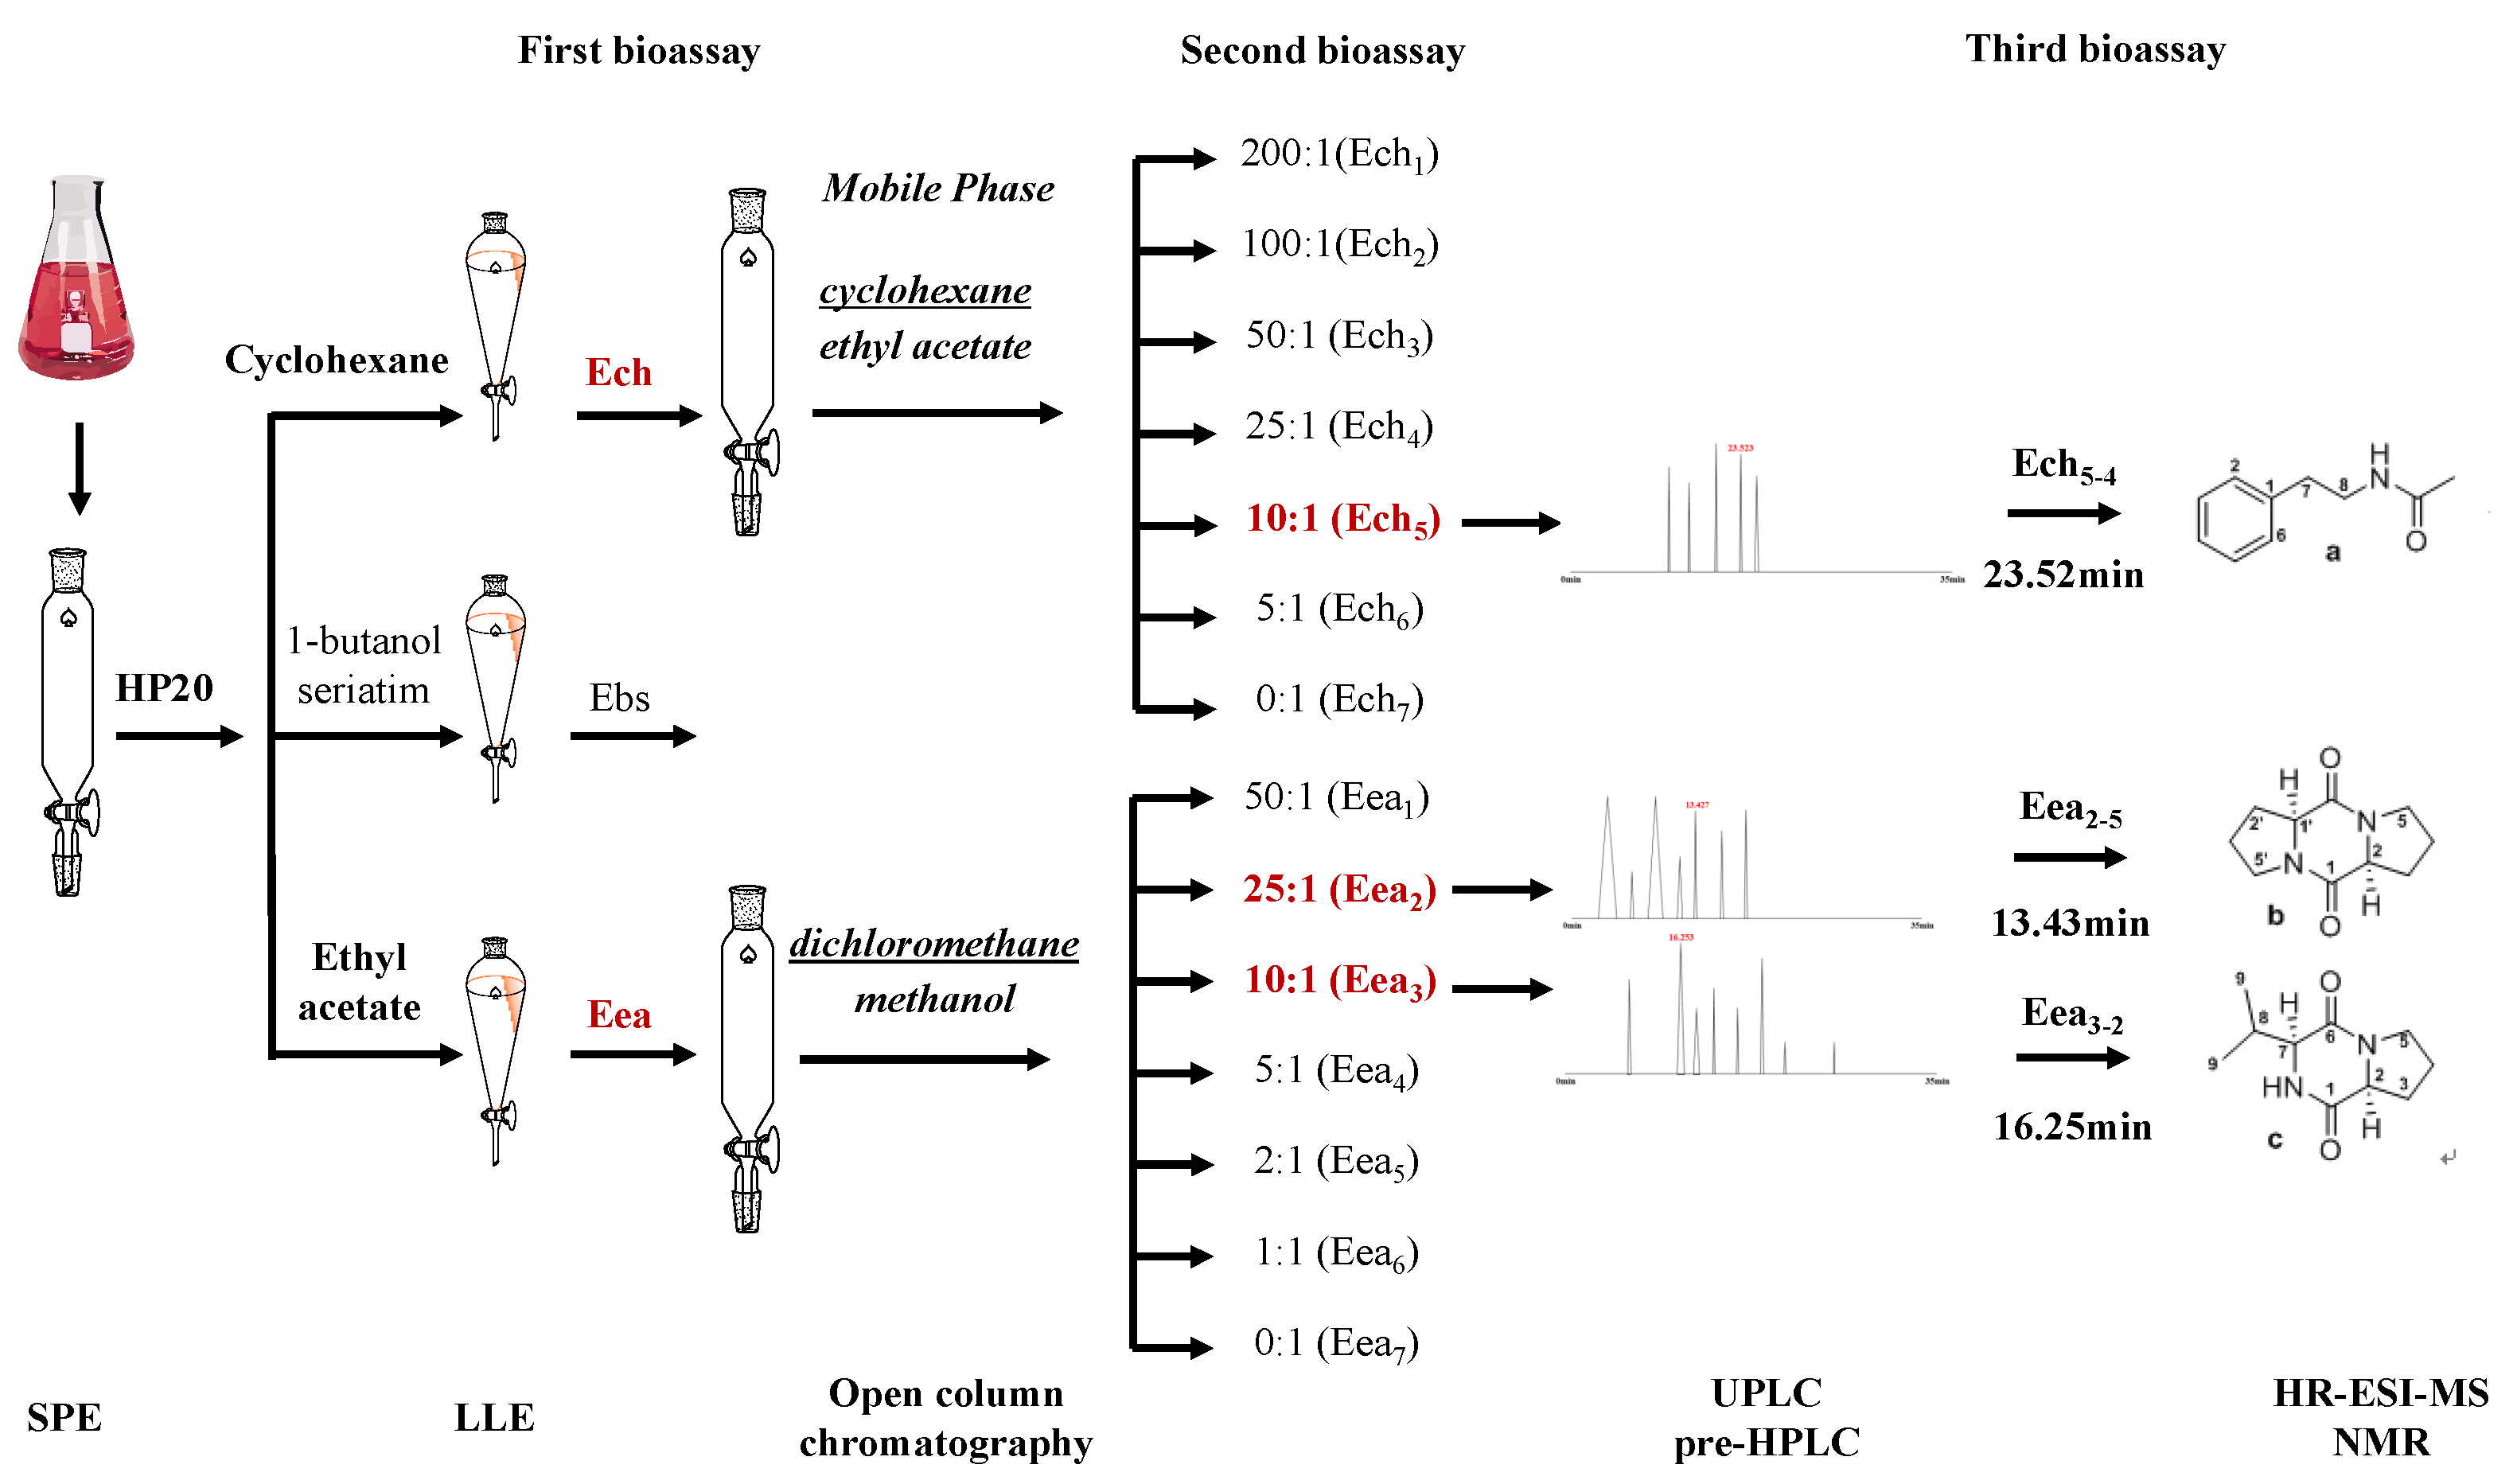
3.2. Inhibition on the Growth of U. prolifera

To simplify the treatment and response analysis of U. prolifera, two major treatment groups of B. cereus filtrates were classified. They are herein separated as high-concentration (HC), i.e., the T1:10 and T1:20 treatments, and low-concentration (LC), i.e., the T1:40, T1:60, T1:80, and T1:100 treatments.
Cell-free filtrates of Bacillus cereus BE23 were used as the source of the allelopathic compounds tested on U. prolifera. These cell-free filtrates induced growth of U. prolifera at LC, i.e., T1:100~T1:40 (ANOVA, p < 0.05), with growth rates of 105% ± 11% on average (n = 12), but inhibited growth at HC treatments (T1:20 and T1:10), with inhibition rates of 67% and 75%, respectively (Figure 2). Values of pH were monitored during the exposure in all treatments (Supplementary Table S1) and variation of the pH value was within the optimal range for U. prolifera growth [40].

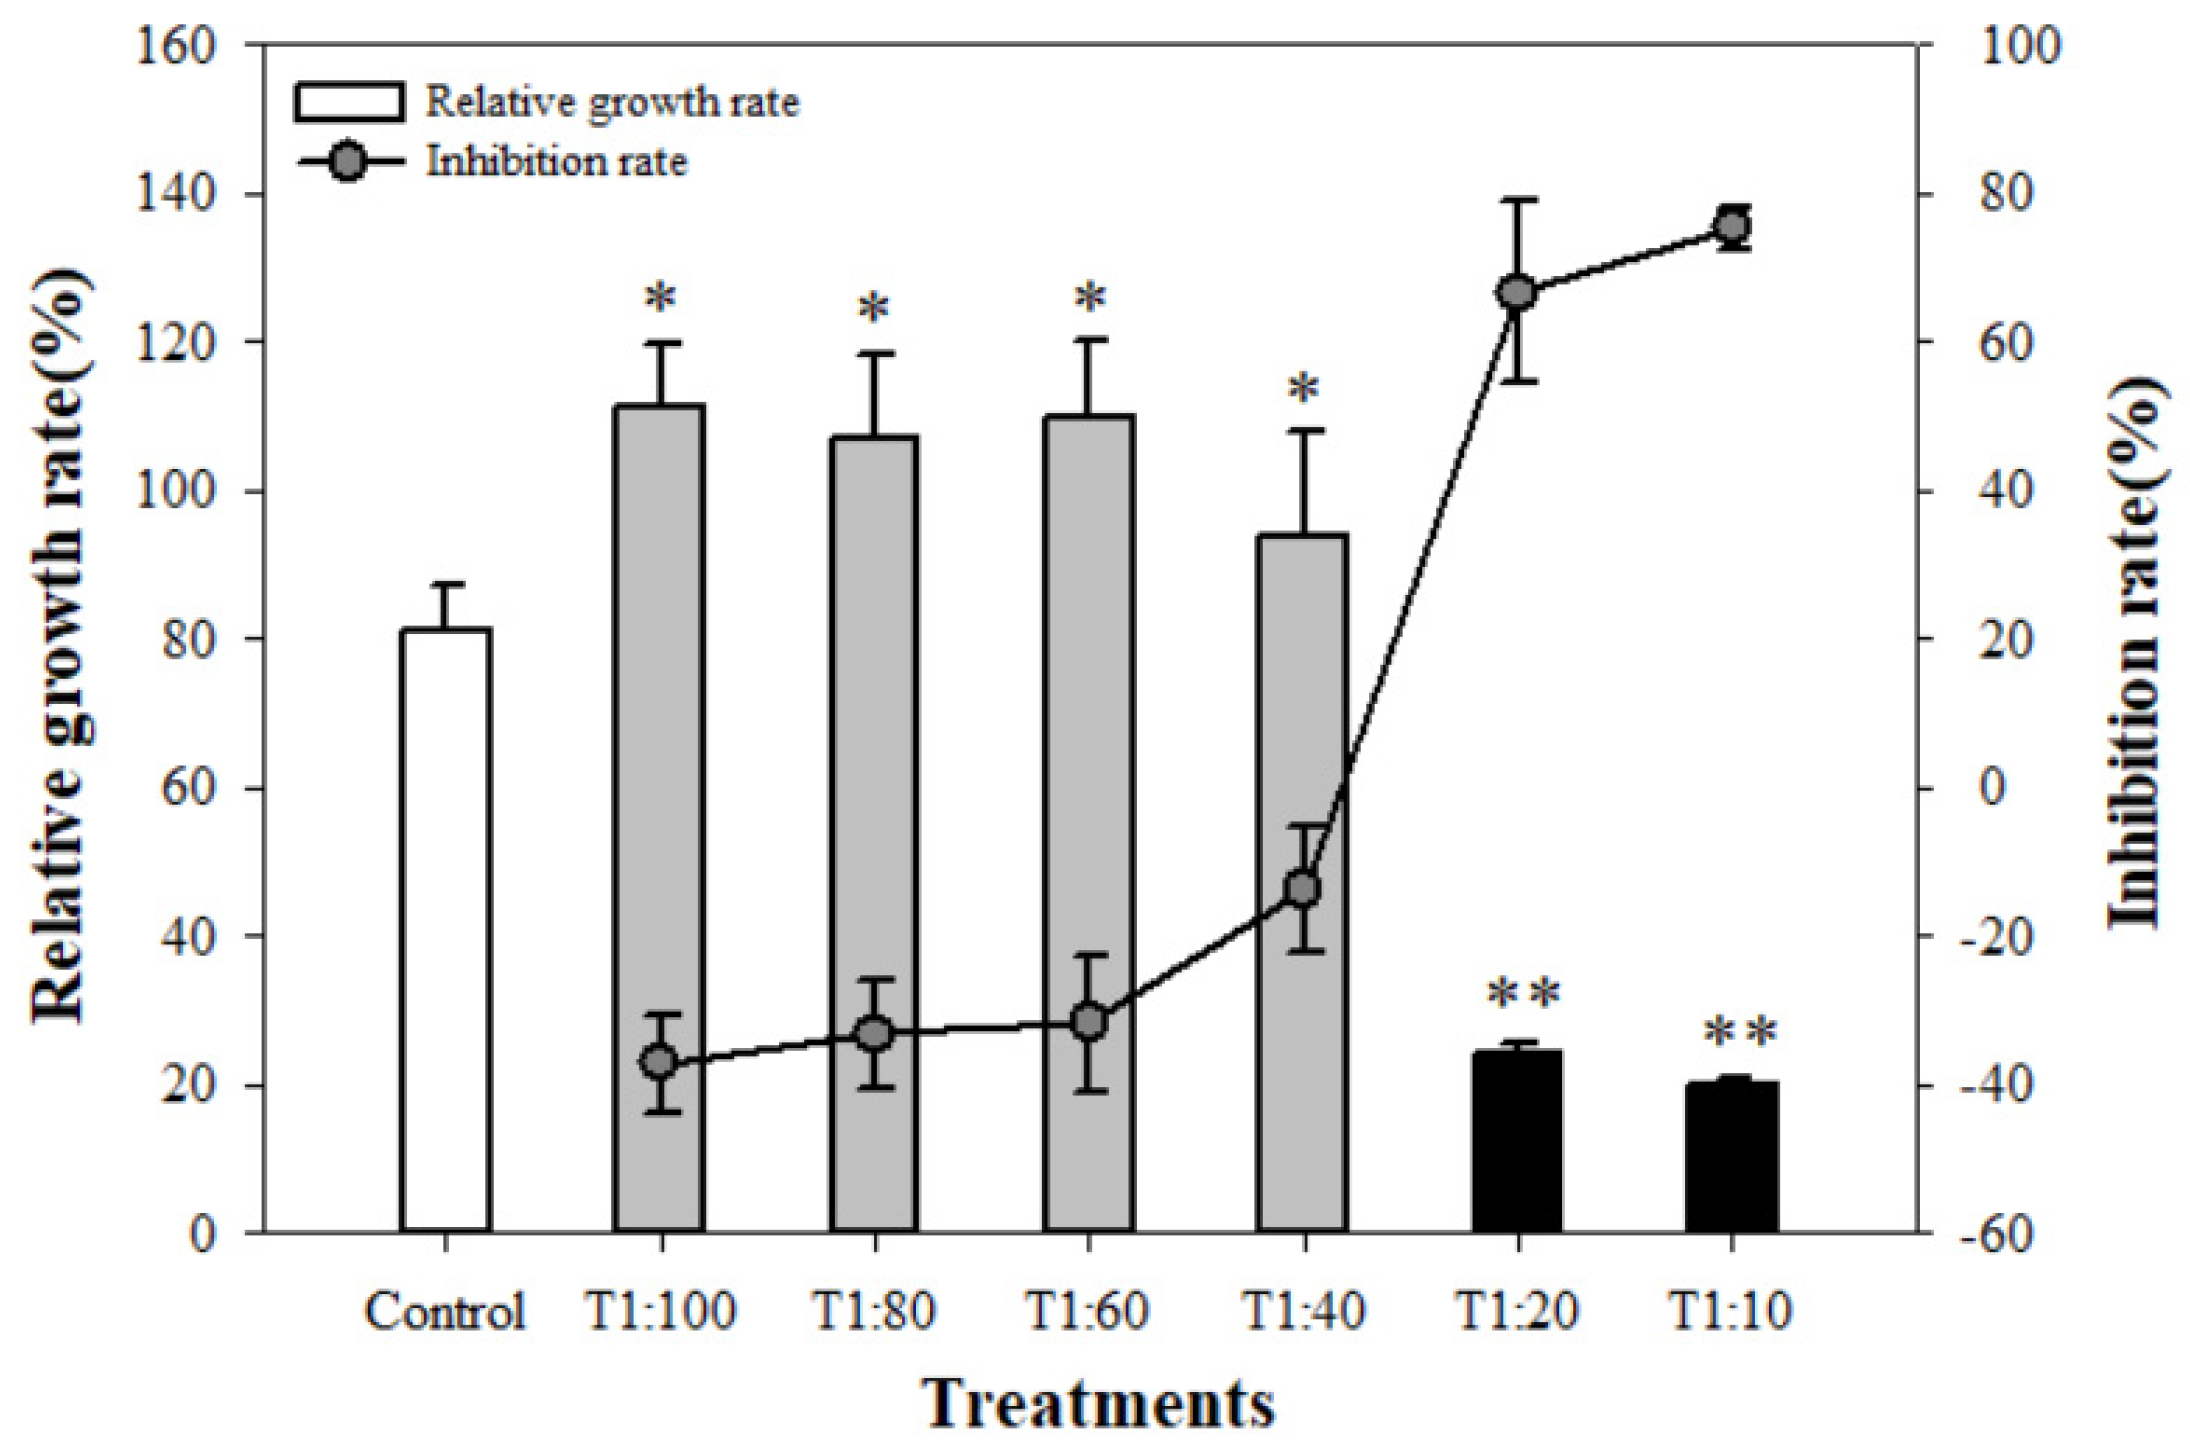
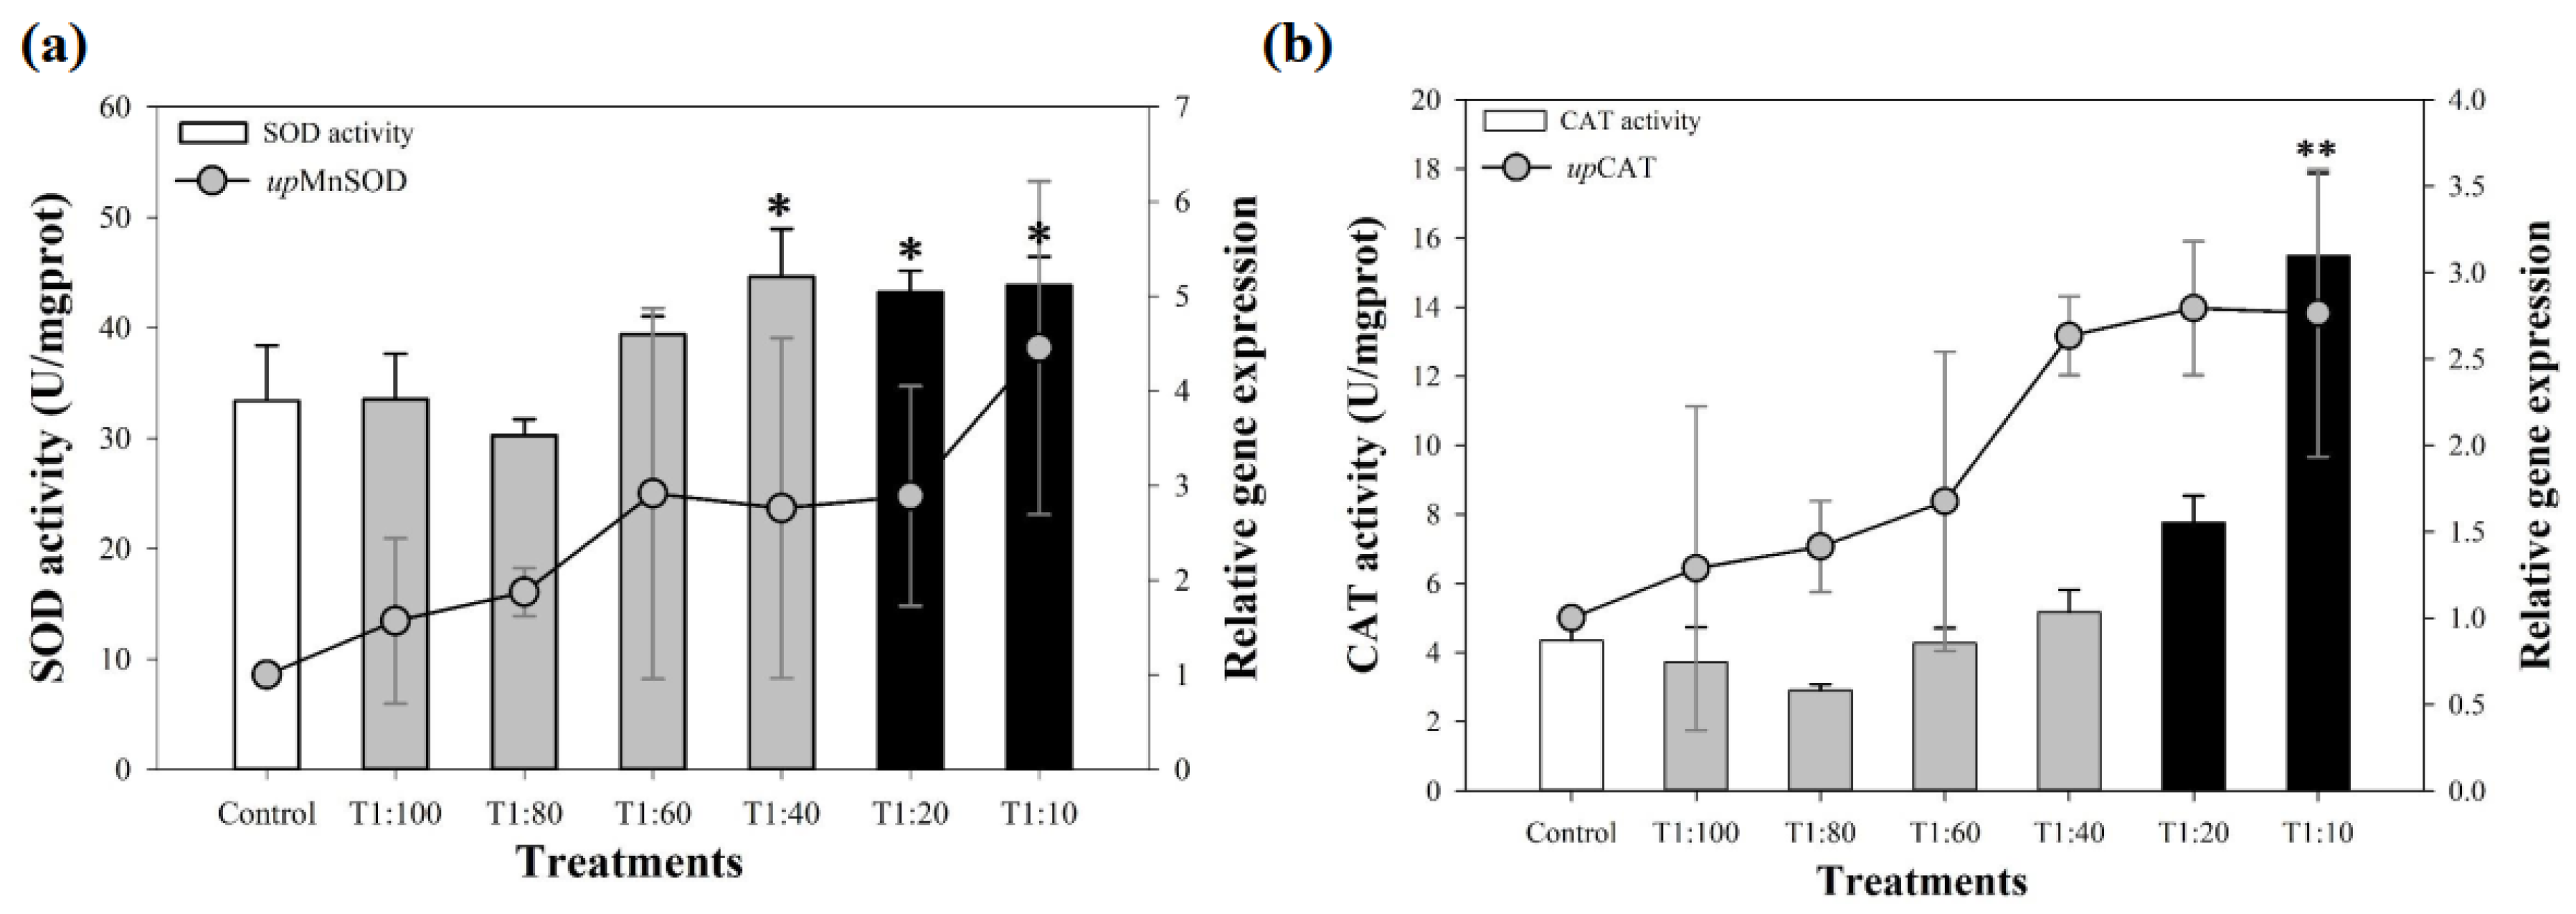
3.3. Response of Antioxidant System of U. prolifera

A significant amount of H2O2 (ANOVA, p < 0.001) was produced in the HC treatments, ranging from 38.21 to 50.33 mmol/gprot (Figure 3) after 192 h of exposure. The production of ROS was associated with changes in activities of SOD (ANOVA, p < 0.05) and CAT (ANOVA, p < 0.001), with concentrations of T1:40 eliciting a response in SOD activity (Figure 4a) but only the highest dosage, T1:10, elicited a response in CAT (Figure 4b). The antioxidant enzyme genes, upCAT and upMnSOD, were upregulated gradually in response to the increased dosage of cell-free extracts (Figure 4a,b), indicating the initiation of the antioxidant defense system under the stress of the filtrate of Bacillus cereus BE23.

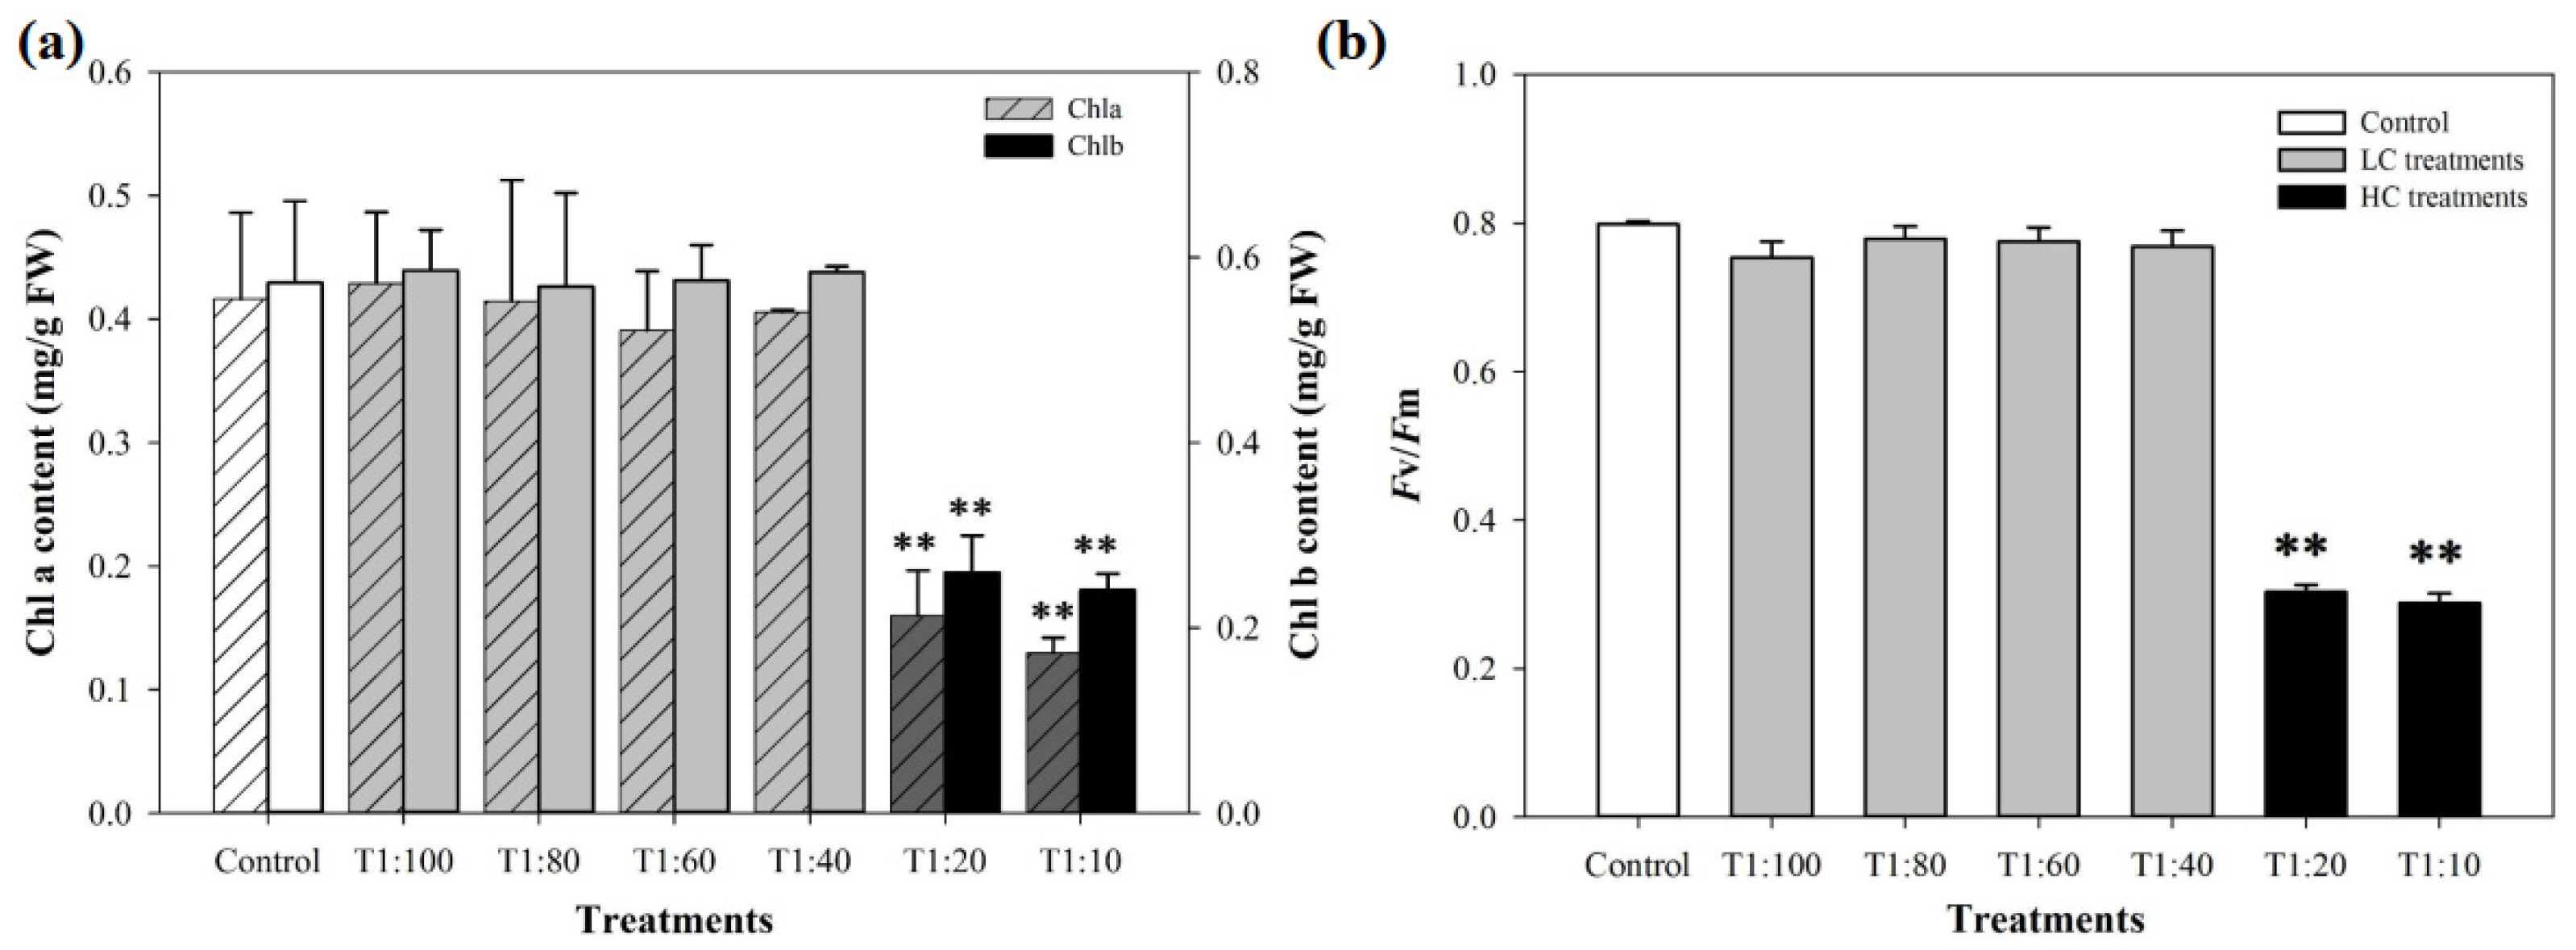
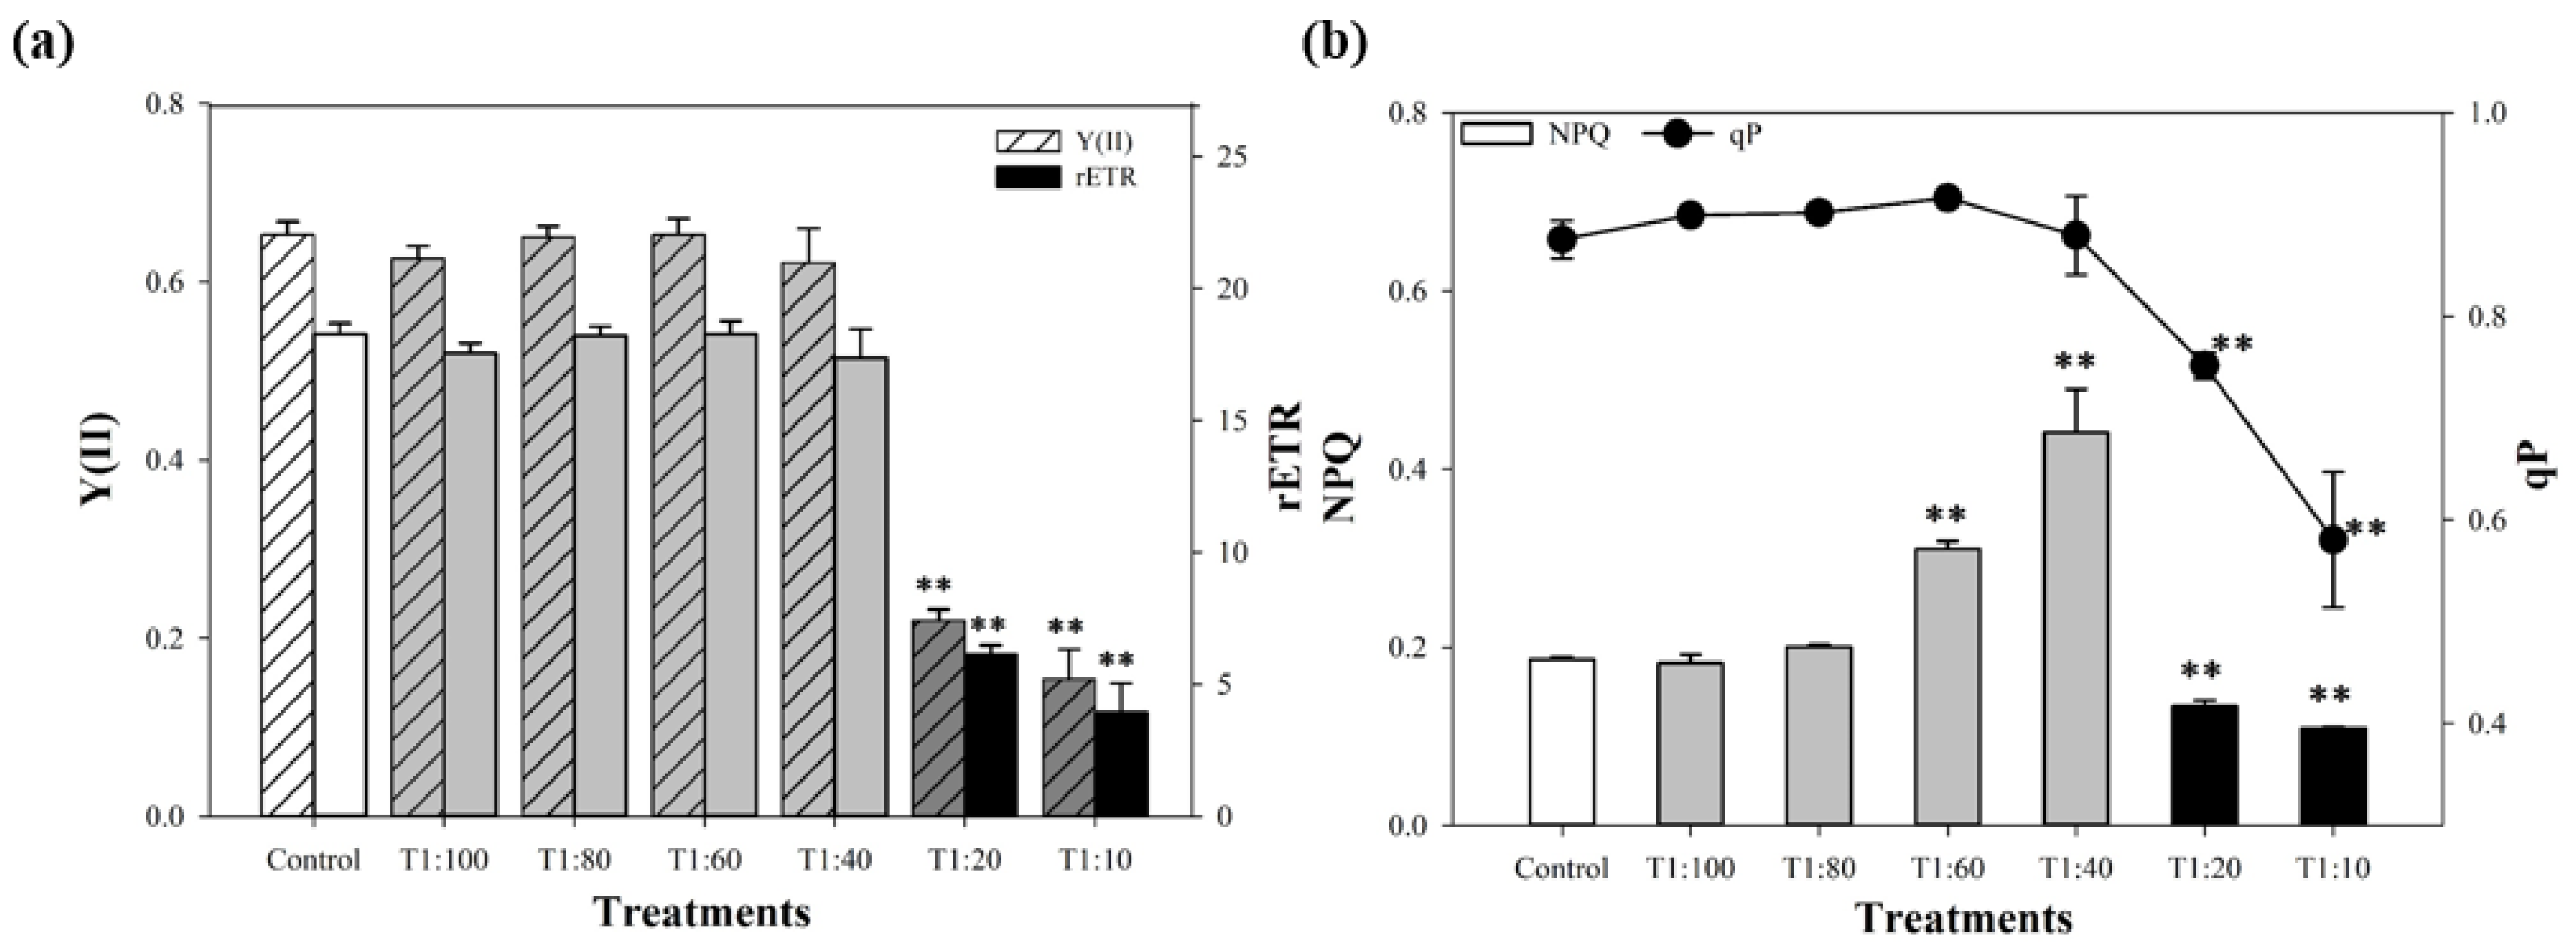
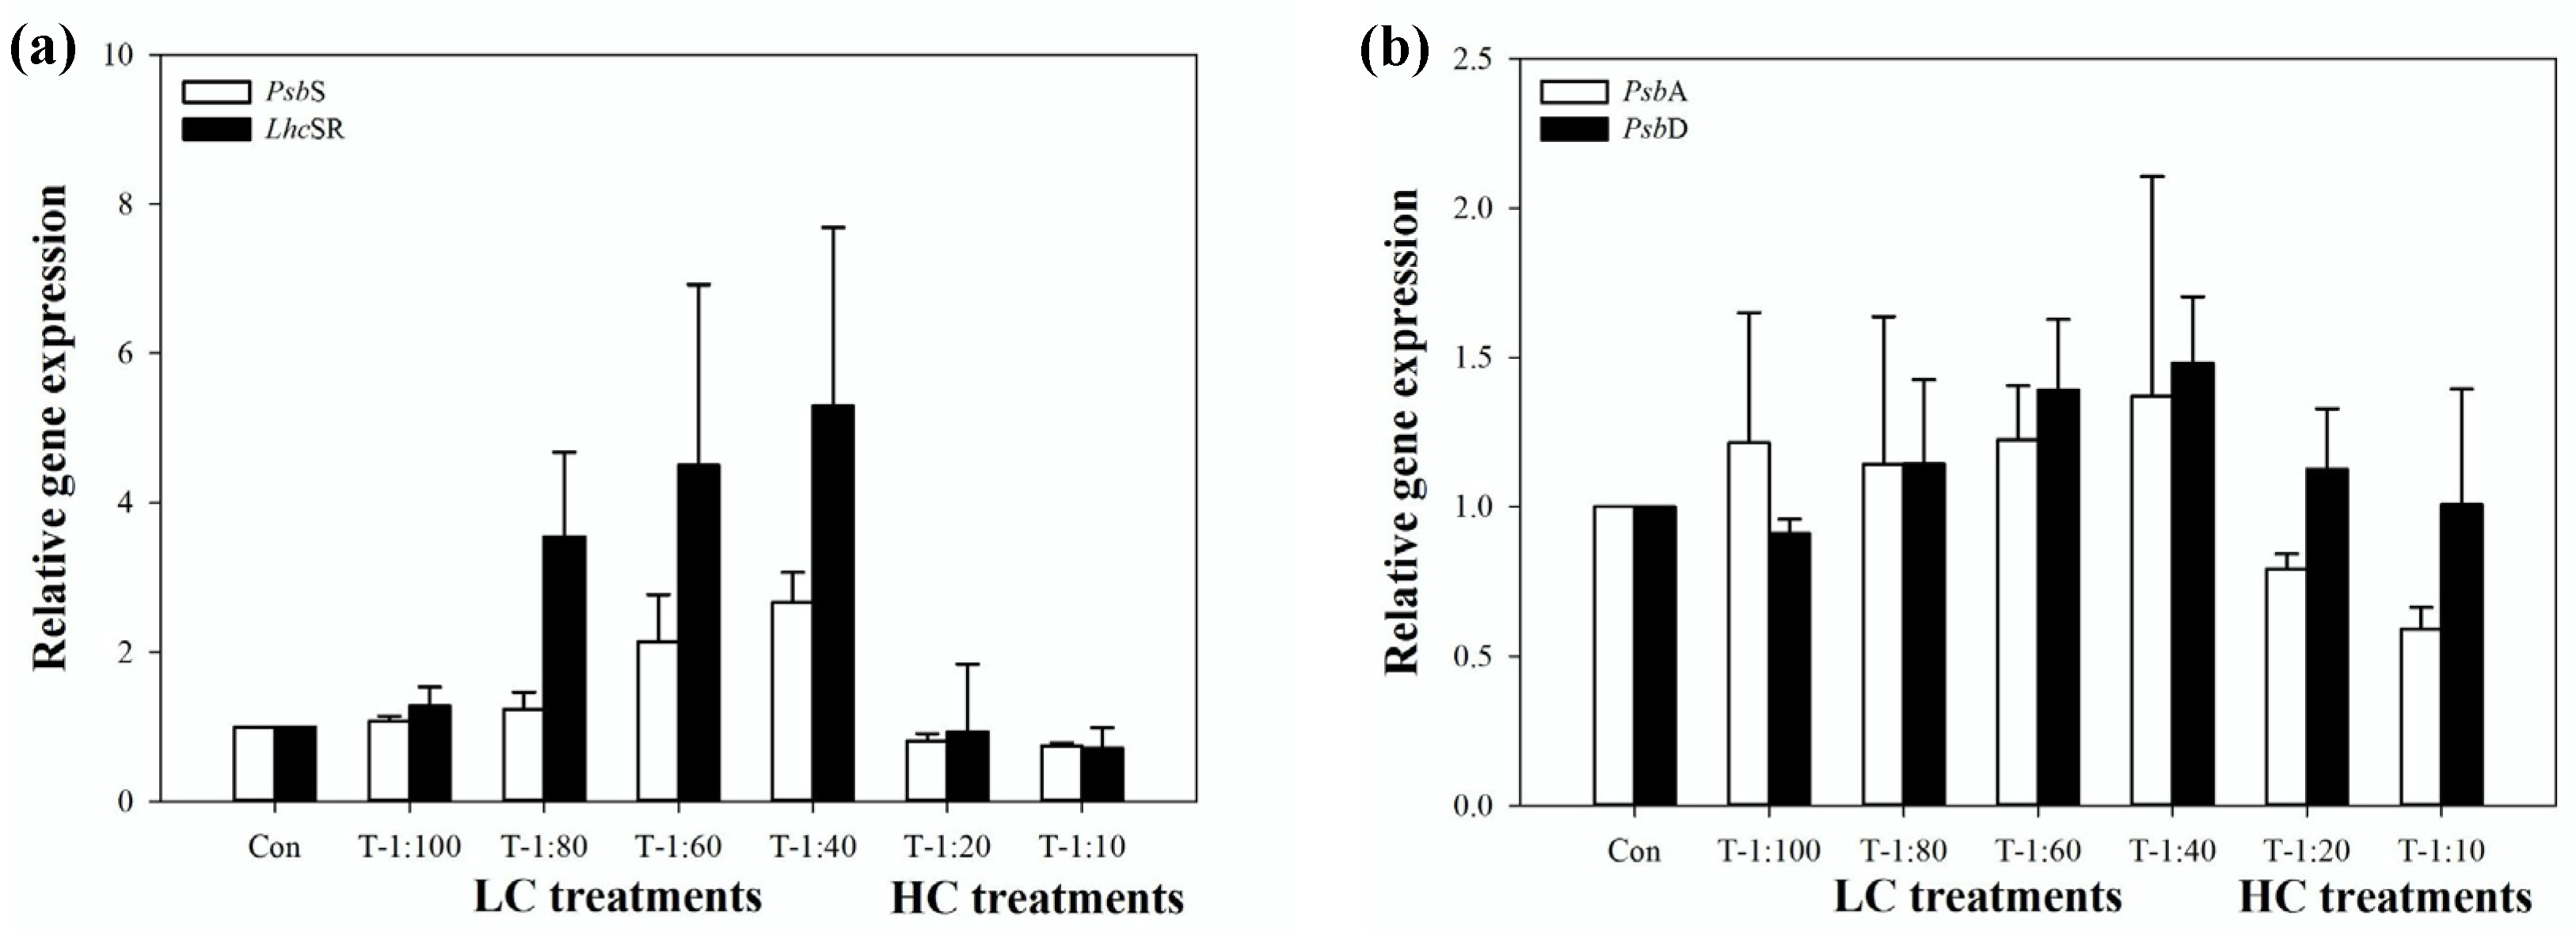
3.4. Response of PSII System of U. prolifera

To investigate the effects of the Bacillus cereus BE23 filtrate on the photosynthetic pigments of the macroalga, Chl a and b contents were quantified (Figure 5a). No significant changes of either Chl a or b were observed in the LC treatments, but significant decreases were observed (ANOVA, p < 0.001) in the HC exposures, from 0.41 to ~0.13 mg/g FW for Chl a, and from 0.57 to ~0.24 mg/g FW for Chl b (Figure 5a).
The photosynthetic response of U. prolifera under the stress of cell-free filtrate of B. cereus BE23 was significant (Figure 5b, Figure 6, Figure 7). The maximum photochemical quantum yields of PSII (Fv/Fm) were reduced in the HC treatments, from 0.80 to ~0.29 (n = 6, Figure 5b). Accordingly, values of Y(II), the effective quantum yield of PSII, were significantly downregulated (ANOVA, p < 0.001), from 0.22 to 0.15 in the HC treatments (Figure 6a). Similar responses were found in the relative electron transport rates (rETR), coincident with a sharp reduction in photochemical quenching (qP) (Figure 6b). A significant enhancement of NPQ activity (Figure 6b) (ANOVA, p < 0.001) was recorded in the LC treatments, from 0.18 to 0.44. However, high doses of the filtrate of Bacillus cereus BE23 induced a downregulation of NPQ (ANOVA, p < 0.001), indicating photoinhibition damage.
The expression of the two assayed photoprotection-related genes, PsbS and LhcSR, varied in response to cell-free filtrate exposure (Figure 7a). The relative expressions of both genes increased with the bacterial filtrate dosage from 1:100 (T1:100) to 1:40 (T1:40) but were significantly downregulated in the HC treatments (T1:20 and T1:10). The highest PsbS and LhcSR were in treatments of T1:40, reaching 2.66 and 5.29 times that of the control, and the lowest value was in the T1:10 treatment, at 0.75 and 0.72 of the control (Figure 7a). The response of PsbA and PsbD was not as clear, but a substantial degradation of PsbA was observed in the HC treatment, with a value of 0.59 of the control in T1:10 (Figure 7b).

3.5. Identification of Allelochemicals from Bacillus cereus BE23 Filtrate

To isolate the bioactive compounds, five steps of extraction and insolation (solid phase–liquid phase–open column–UPLC–preHPLC) were conducted. After each isolation, the separated groups were tested for bioactivity (Figures S2–S4). Three bioactive compounds in the cell-free filtrates of Bacillus cereus BE23 were identified by high-resolution mass spectrometric data and NMR spectroscopic analysis. The molecular formula C10H13NO of compound Ech5-4 was deduced from its ion at m/z 164.1072 [M+H]+ (Supplementary Figure S5a, calculated for C10H14NO, 164.1075) and its 13C data. The 13C-NMR spectrum (600 MHz, DMSO-d6) of Ech5-4 displayed signals at δC 169.5 (C=O), 140.0 (C, C-1), 129.1 (CH, C-3, C-5), 128.8 (CH, C-2, C-6), 126.5 (CH, C-4), 40.7 (CH2, C-7), 35.7 (CH2, C-8), and 23.09 (CH3) (Supplementary Figure S5b,c). The 1H-NMR signals were observed at δH 7.92 (1H, brs, NH), 7.27–7.30 (2H, t, J = 8.0 Hz, Ar-H), 7.18–7.20 (3H, m, Ar-H), 3.22–3.26 (2H, m, H-7), 2.69 (2H, t, J = 7.5 Hz, H-8), and 1.78 (3H, s, -CH3). Based on these data and the comparison with the reported data [41], compound Ech5-4 was identified as N-phenethylacetamide (Figure 8a).
The molecular formula of C10H14N2O2 for compound Eea2-5 was determined based on its m/z 217.0953 [M+Na]+ (Supplementary Figure S6a, calculated for C10H14N2NaO2, 217.0953). The 13C and 1H NMR spectra of Eea2-5 showed signals for the functional groups of carbonyl (δC 168.1), methine (δC 61.2; δH 4.34, 1H, t, J = 9.0 Hz), and methelene (δC 45.7, 28.2, 23.7; δH 3.45–3.53, 2H, m, 2.25–2.30, 1H, m, 1.99–2.09, 2H, m, 1.91–1.97, 1H, m,) (Supplementary Figure S6b,c). These data and comparison with the reference data [42] indicated that compound Eea2-5 was cyclo (L-Pro-L-Pro) (Figure 8b).
The compound Eea3-2 has the molecular formula of C10H10N2O2 deduced from its m/z 219.1103 [M+Na] (Supplementary Figure S7a, calculated for C10H10N2NaO2, 219.1109). The 13C-NMR spectrum (600 MHz, Methanol-d4) of Eea3-2 exhibited 10 carbon signals, resonating at δC172.8 (C, C-1), 167.8 (C, C-6), 61.8 (CH, C-7), 60.3 (CH, C-2), 46.4 (CH2, C-5), 30.1 (CH, C-8), 29.8 (CH2, C-3), 23.5 (CH2, C-4), 19.1a (CH3, C-10), and 16.9 (CH3, C-9). The 1H NMR spectrum displayed signals at δH 4.20 (1H, t, J = 8.6 Hz, H-2), 4.05 (1H, br t, H-7), 3.56 (1H, m, H-5a), 3.48 (1H, m, H-5b), 2.48 (1H, m, H-3a), 2.31 (1H, m, H-8), 2.02 (1H, m, H-3b), 1.91–1.96 (2H, m, H-4), 1.08b (3H, d, J = 7.3 Hz, H-9), and 0.95b (3H, d, J = 7.3 Hz, H-10). Thus, the compound Eea3-2 was identified as cyclo (L-Pro-L-Val) (Figure 8c) [43].

4. Discussion

Bacteria-derived interactions play important roles in species distribution and abundance [44], succession of algal blooms [45], and biomass control of microorganisms [46] and macroalgae [47]. Such allelopathic interactions consist of two pathways, direct (bacterial and algal cell contact) and indirect (release of natural products) [12,32]. The present study demonstrated the potential mechanisms of allelopathic stress on U. prolifera by products of B. cereus BE23 in indirect ways.
The low dosage (i.e., T1:100~T1:40) of B. cereus BE23 filtrate promoted the growth of U. prolifera, whereas the high dosage (T1:20 and T1:10) inhibited biomass production (Figure 2). The response of the macroalgae in the LC treatments may have resulted from a hormesis effect [48] and adaption to the low concentrations of allelochemicals [49]. The upregulation of physiological activity of U. prolifera (Figure 4, Figure 5 and Figure 6) in the LC treatments contributed to the growth-promotive effect. Meanwhile, the nutrients, including the inorganic nutrient from f/2 + artificial seawater and the nutrient carrying over by the B. cereus BE23 filtrate (4~40 mL), contributed to the growth of macroalga. Inorganic nitrogen, i.e., nitrate or ammonium, has been reported to be rapidly taken up by Ulva [28], and within 192 h, the addition of inorganic nutrient of f/2 medium was calculated to be sufficient to the thalli of U. prolifera [50,51]. The carried-over inorganic nutrient was low (less than 10%), therefore, the effects of nutrients in B. cereus BE23 filtrate were minimal to the growth of Ulva in the present study.
A general stress response in algae is the production of ROS [52,53] and it can be produced in response to abiotic and allelopathic stresses [54,55,56]. Here, ROS was produced in response to BE23 cell-free filtrates (Figure 3). The source of ROS may include two main pathways: the intrinsic oxidization by allelochemicals, and inactivation of the electron transport in the PSII systems. The production of ROS is also a signal of the pressure from the excitation energy collected by the PSII light-harvesting complex [57,58]. To regulate the extra ROS, algae have a series of antioxidant defense mechanisms, including the ability to vary antioxidant enzymes or genes. Variations in activities of the enzymes SOD and CAT are important in alleviating oxidative damage [59,60]. In general, SOD scavenges the cellular ROS first, catalyzing O2•− to H2O2. Then, the CAT enzyme decomposes H2O2 to O2 and H2O [61]. MnSOD, one of the total SODs, was selected as the representative enzyme; it is mostly detected in the cytosol and thylakoid membrane [62].
Here, a small amount of ROS (H2O2) was produced in the LC treatments, i.e., T1:60 and T1:40, but no significant variation was observed in the quantum efficiency of photosynthesis (Fv/Fm), indicating U. prolifera may activate photoprotection to defend against such allelopathic stress. However, a significant increase in ROS concentration (ANOVA, p < 0.001) was recorded in the HC treatments, accompanied by the decline in rETR, indicating normal electron transport in PSII was disturbed and excess energy likely contributed to the ROS generation in HC treatments. High production of ROS induced oxidative stress in the algae and finally inhibited the photosynthesis systems. To moderate the oxidative damage, U. prolifera upregulated the activity of SOD and CAT, supported herein by the gene expression level of upMnSOD and upCAT in the LC treatments (Figure 5). Similar responses have been noted in Cylindrospermopsis raciborskii under hyper-salinity or light-stress conditions [63,64], and linoleic acid stress [65]. The upregulation of the transcript levels of FeSOD and CAT genes in U. prolifera have also been reported in response to salicylic acid and hyper-temperature [66]. In the present study, however, the enhanced CAT activities were not sufficient to scavenge the sudden increased H2O2 and this likely caused extensive oxidative stress in this macroalga.
External stresses, including allelopathic stressors, can alter the algal energy flux of PSII by reducing the photosynthetic efficiency [67,68,69], and by enhancing non-photochemical quenching (NPQ) [65]. The maximum quantum yield (Fv/Fm) is an effective indicator of the efficiency of photochemical stress. In Ulva sp., changes in Fv/Fm have been observed when the algae are exposed to internal or external stresses [70] such as light [71], desiccation [72], salinity [73], and allelopathy [50].
Significant declines in Fv/Fm (Figure 5b), growth rate (Figure 2), and Chl a and b (Figure 5a) were shown after 192 h exposure to high concentrations of B. cereus BE23 filtrate, suggesting disruption of the PSII reaction centers’ (RCs) complexes [67] including the electron transport chain [74]. Reduced rETR and Y(II) indicate a reduction in the electron transport rate and CO2 assimilative capacity [75]. Therefore, one mechanism by which U. prolifera responds to allelopathic stress is a lowering of the photosynthetic performance, which directly impacts carbon fixation and therefore the growth rate [76]. The significant decreases in the Chl a and b concentrations in the HC treatments may also be considered as an adaptive strategy which decreases the absorption of photons, thereby leading to less ROS production [67].
The NPQ pathways are photoprotective mechanisms for phototrophs [77]. In the present study, no significant variation in Fv/Fm (Figure 5b) or rETR (Figure 5a) was observed in the LC treatments; however, a significant increase in NPQ was recorded as the concentrations of the LC treatments increased, namely T1:40 and T1:60. Under the HC treatments, a substantial decrease in NPQ was observed, indicating that allelopathic stress may hinder the operation of photoprotective mechanisms, and thus the macroalgae dissipated excess energy through non-regulated pathways [78]. At high levels of bacterial filtrate, U. prolifera was unable to self-protect against photodamage [39]. The significant decrease in qP in the treatments with high concentrations of filtrate indicated a high level of energy dissipation and potential damage to the PSII reaction centers. Thus, the decrease in the efficiency of PSII was associated with a simultaneous decrease in the photochemical and non-photochemical pathways in the HC treatments, reflecting a complete disruption of normal energy pathways.
Previous studies have suggested that Ulva sp. can modulate NPQ levels by adjusting the copy number of LhcSR or PsbS and regulation of the xanthophyll cycle [79,80]. It thus appears that low levels of exposure to B. cereus BE23 filtrate induced an upregulation of LhcSR and PsbS in U. prolifera and activated the photoprotection mechanism that enables the self-regulation of external allelopathic stress without loss of electron transfer efficiency of photosynthesis and growth. An upregulated transcript level of both selected genes and a triggering of LhcSR-dependent NPQ was also previously reported in Ulva sp. [80]. High amounts of filtrate, in contrast, inhibited the photosynthetic efficiency and the capability of self-regulation of U. prolifera, as evidenced by the downregulation of Fv/Fm, qP, and NPQ activity, and finally the inhibition of growth. Therefore, the low value of NPQ was a result of the loss of the photoprotection of U. prolifera and a failure of self-regulation under allelopathic stress [81].
Allelopathic damage to the PSII systems is also suggested by the responses of the genes located in the D1-D2 protein [54,82]. PsbA and PsbD, encoding the D1 and D2 subunits of the PSII complex, constitute the heterodimeric photochemical reaction center [80]. Here, no clear variation in PsbA and PsbD gene expression was observed after 192 h exposure in the LC treatments (Figure 7b), suggesting the excess absorbed electrons (Figure 4a) were dissipated by the upregulated NPQ, together with the upregulation of LhcSR and PsbS transcript levels (Figure 7a). In contrast, clear downregulation of PsbA expression levels was recorded in the HC treatments, suggesting that the B. cereus BE23 filtrate suppressed PsbA expression and may have blocked the elector transport on the PSII receptor side from QA to QB [81].
In summary, the inhibition effect on the PSII of Ulva due to bacteria-derived stress may go through two main steps: (1) the inhibition of the electron transport chain, and (2) the deleterious effects on PSII RCs’ complexes [83,84]. In the present study, the upregulated expression of PsbS and LhcSR under LC levels of cell-free filtrate might indicate the successful regulation of stress via regulated NPQ [85,86], but failure in the HC treatments. The depletion of the transcript pools of LhcSR and PsbS contributed directly to the decrease in NPQ activity and likely inactivated the PSII RCs’ complexes. Downregulation of Chl a and b corresponded to the downregulation of PsbA expression levels, suggesting the BE23 filtrate degraded the absorption of light energy and blocked the electron transport on the PSII receptor side [65,80]. Surplus electrons exceeded the electron transport chain capacity of U. prolifera and induced additional ROS production (Figure 3) that, in turn, damaged the PSII systems [16]. Together, these data clearly document the photooxidative stress in U. prolifera upon allelopahtic stress in HC treatments.
Using ESI and NMR, three potential allelopathic chemicals were isolated and identified from the cell-free filtrate of B. cereus BE23. The chemical cyclo (L-Pro-L-Pro) (Figure 8b), extracted from Eea2, displayed the largest inhibitory effect on U. prolifera (Supplementary Figure S6), and has previously been shown to yield a strong algicidal effect on Microcystis aeruginosa [55] and Phaeocystis globosa [54] by inhibiting the operation of the photosynthesis and antioxidant systems of target algae. In the present study, the diketopiperazine derivatives decreased the gene expression of PsbA [54,87], directly impacting the PSII electron acceptor sides, resulting in the failure of the photosynthetic process. Given that cyclo (L-Pro-L-Pro) is easily biodegradable [88], it may be a good candidate as an environmentally friendly algicide for green algae bloom control.

5. Conclusions

The high concentration of the cell-free filtrate of B. cereus BE23 (approximately 1 × 10¹¹/mL) yielded significant inhibition of growth of U. prolifera via degradation of the photosynthetic system as shown by changes in biomass accumulation, photosynthetic responses, gene regulation, and enzyme activities. The potential allelopathic compounds inhibited growth by means of reduction of Fv/Fm, rETR, and NPQ, resulting in U. prolifera’s failure to dissipate the excess energy through regulated NPQ pathways. This alteration of energy dissipation caused excess cellular ROS accumulation and the antioxidative defense system was generated. This ROS production also inhibited the PSII reaction center apparatus. The potential allelochemicals were further isolated and identified as N-phenethylacetamide, cyclo (L-Pro-L-Val), and cyclo (L-Pro-L-Pro). The diketopiperazines derivative, cyclo (L-Pro-L-Pro), exhibited the highest inhibition effect on U. prolifera and further study on its potential as an algicidal product for green algae bloom control is warranted.

Supplementary Materials

The following are available online at https://www.mdpi.com/2077-1312/8/9/718/s1, Figure S1. Phylogenetic tree of Bacillus cereus BE23. Figure S2. Relative growth rates and inhibition rates of Ulva prolifera of the first bioassay test. Figure S3. Relative growth rates and inhibition rates of Ulva prolifera in the second bioassay test. Figure S4. Relative growth rates and inhibition rates of Ulva prolifera in the third bioassay test. Figure S5. High-resolution electrospray ionization mass spectrometry (HRESIMS) spectrum (a), 13C NMR spectrum (b), and 1H NMR spectrum (c) of compound Ech5-4. Figure S6. High-resolution electrospray ionization mass spectrometry (HRESIMS) spectrum (a), 13C NMR spectrum (b), and 1H NMR spectrum (c) of compound Eea2-5. Figure S7. High-resolution electrospray ionization mass spectrometry (HRESIMS) spectrum (a), 13C NMR spectrum (b), and 1H NMR spectrum (c) of compound Eea3-2. Table S1. Changes of pH values with culture time in exposed experiments.

Author Contributions

Conceptualization, N.L. and M.T.; methodology, X.Z. and N.L.; software, N.L.; validation, N.L., J.Z., X.Z., P.W., P.M.G. and M.T.; formal analysis, M.T. and P.M.G.; investigation, N.L., J.Z. and X.Z.; resources, M.T.; data curation, N.L. and J.Z.; writing—original draft preparation, N.L.; writing—review and editing, M.T., P.M.G. and P.W.; visualization, M.T.; supervision, M.T.; project administration, M.T.; funding acquisition, M.T. All authors have read and agreed to the published version of the manuscript.

Funding

This research was supported by a National Key R&D Program of China NO. 2016YFC1402104, Key Laboratory of Integrated Marine Monitoring and Applied Technologies for Harmful Algal Blooms, Ministry of Natural Resources of the People’s Republic of China (MNR), MATHAB201803 and Funding for Tang Scholar to M.T.

Acknowledgments

The authors are grateful to Zhizhen Zhang of Zhejiang University for helping identify the natural products, and Min Wu for providing the bacteria Bacillus cereus BE23 strain.

Conflicts of Interest

The authors declare that they have no conflict of interest.

References

  1. Wang, R.; Wang, J.T.; Xue, Q.N.; Tan, L.J.; Cai, J.; Wang, H.Y. Preliminary analysis of allelochemicals produced by the diatom Phaeodactylum tricornutum. Chemosphere 2016, 165, 298–303. [Google Scholar] [CrossRef] [PubMed]
  2. Gross, E.M.; Hilt, S.; Lombardo, P.; Mulderij, G. Searching for allelopathic effects of submerged macrophytes on phytoplankton—State of the art and open questions. Hydrobiologia 2007, 584, 77–88. [Google Scholar] [CrossRef] [Green Version]
  3. Zhang, Y.W.; Wang, J.T.; Tan, L.J. Characterization of allelochemicals of the diatom Chaetoceros curvisetus and the effects on the growth of Skeletonema costatum. Sci. Total Environ. 2019, 660, 269–276. [Google Scholar] [CrossRef] [PubMed]
  4. Zhang, H.; Peng, Y.; Zhang, S.; Cai, G.; Li, Y.; Yang, X.; Yang, K.; Chen, Z.; Zhang, J.; Wang, H.; et al. Algicidal effects of prodigiosin on the harmful algae Phaeocystis globosa. Front. Microbiol. 2016, 7, 602. [Google Scholar] [CrossRef] [PubMed]
  5. Zhou, S.; Yin, H.; Tang, S.Y.; Peng, H.; Yin, D.G.; Yang, Y.X.; Liu, Z.H.; Ding, Z. Physiological responses of Microcystis aeruginosa against the algicidal bacterium Pseudomonas aeruginosa. Ecotoxicol. Environ. Saf. 2016, 127, 214–221. [Google Scholar] [CrossRef]
  6. Zhang, F.X.; Ye, Q.; Chen, Q.L.; Yang, K.; Zhang, D.Y.; Chen, Z.R.; Lu, S.S.; Shao, X.P.; Fan, X.Y.; Yao, L.M.; et al. Algicidal Activity of novel marine bacterium Paracoccus sp. Strain Y42 against a harmful algal-bloom-causing dinoflagellate, Prorocentrum donghaiense. Appl. Environ Microbiol. 2018, 84. [Google Scholar] [CrossRef] [Green Version]
  7. Qian, H.F.; Xu, J.H.; Lu, T.; Zhang, Q.; Qu, Q.; Yang, Z.P.; Pan, X.L. Responses of unicellular alga Chlorella pyrenoidosa to allelochemical linoleic acid. Sci. Total Environ. 2018, 625, 1415–1422. [Google Scholar] [CrossRef]
  8. Zhao, W.; Zheng, Z.; Zhang, J.L.; Roger, S.F.; Luo, X.Z. Allelopathically inhibitory effects of eucalyptus extracts on the growth of Microcystis aeruginosa. Chemosphere 2019, 225, 424–433. [Google Scholar] [CrossRef]
  9. Yu, Y.; Zeng, Y.D.; Li, J.; Yang, C.Y.; Zhang, X.H.; Luo, F.; Dai, X.Z. An algicidal Streptomyces amritsarensis strain against Microcystis aeruginosa strongly inhibits microcystin synthesis simultaneously. Sci. Total Environ. 2019, 650, 34–43. [Google Scholar] [CrossRef]
  10. Arora, A.; Sairam, R.K.; Srivastava, G.C. Oxidative stress and antioxidative system in plants. Curr. Sci. 2002, 82, 1227–1239. [Google Scholar]
  11. Apel, K.; Hirt, H. Reactive oxygen species: Metabolism, oxidative stress, and signal transduction. Annu. Rev. Plant Biol. 2004, 55, 373–399. [Google Scholar] [CrossRef] [PubMed] [Green Version]
  12. Mayali, X.; Azam, F. Algicidal bacteria in the sea and their impact on algal blooms. J. Eukaryot. Microbiol. 2004, 51, 139–144. [Google Scholar] [CrossRef] [PubMed]
  13. Zheng, N.N.; Ding, N.; Gao, P.K.; Han, M.X.; Liu, X.X.; Wang, J.G.; Li, S.; Fu, B.Y.; Wang, R.J.; Zhou, J. Diverse algicidal bacteria associated with harmful bloom-forming Karenia mikimotoi in estuarine soil and seawater. Sci. Total Environ. 2018, 631, 1415–1420. [Google Scholar] [CrossRef]
  14. Sun, R.; Sun, P.; Zhang, J.; Esquivel-Elizondo, S.; Wu, Y. Microorganisms-based methods for harmful algal blooms control: A review. Bioresour. Technol. 2018, 248, 12–20. [Google Scholar] [CrossRef] [PubMed]
  15. Lu, X.H.; Zhou, B.; Xu, L.; Liu, L.L.; Wang, G.Y.; Liu, X.D.; Tang, X.X. A marine algicidal Thalassospira and its active substance against the harmful algal bloom species Karenia mikimotoi. Appl. Microbiol. Biotechnol. 2016, 100, 5131–5139. [Google Scholar] [CrossRef]
  16. Hou, S.L.; Shu, W.J.; Tan, S.; Zhao, L.; Yin, P.H. Exploration of the antioxidant system and photosynthetic system of a marine algicidal Bacillus and its effect on four harmful algal bloom species. Can. J. Microbiol. 2016, 62, 49–59. [Google Scholar] [CrossRef]
  17. Hu, X.L.; Yin, P.H.; Zhao, L.; Yu, Q.M. Characterization of cell viability in Phaeocystis globosa cultures exposed to marine algicidal bacteria. Biotechnol. Bioprocess Eng. 2015, 20, 58–66. [Google Scholar] [CrossRef]
  18. Shao, J.H.; He, Y.X.; Chen, A.W.; Peng, L.; Luo, S.; Wu, G.Y.; Zou, H.L.; Li, R.H. Interactive effects of algicidal efficiency of Bacillus sp. B50 and bacterial community on susceptibility of Microcystis aeruginosa with different growth rates. Int. Biodeterior. Biodegrad. 2015, 97, 1–6. [Google Scholar] [CrossRef]
  19. Jeong, S.Y.; Ishida, K.; Ito, Y.; Okada, S.; Murakami, M. Bacillamide, a novel algicide from the marine bacterium, Bacillus sp. SY-1, against the harmful dinoflagellate, Cochlodinium polykrikoides. Tetrahedron Lett. 2003, 44, 8005–8007. [Google Scholar] [CrossRef]
  20. Wu, L.M.; Wu, H.J.; Chen, L.N.; Xie, S.S.; Zang, H.Y.; Borriss, R.; Gao, X.W. Bacilysin from Bacillus amyloliquefaciens FZB42 has specific bactericidal activity against harmful algal bloom species. Appl. Environ. Microbiol. 2014, 80, 7512–7520. [Google Scholar] [CrossRef] [Green Version]
  21. Skerratt, J.H.; Bowman, J.P.; Hallegraeff, G.; James, S.; Nichols, P.D. Algicidal bacteria associated with blooms of a toxic dinoflagellate in a temperate Australian estuary. Mar. Ecol. Prog. Ser. 2002, 244, 1–15. [Google Scholar] [CrossRef] [Green Version]
  22. Liu, D.Y.; Keesing, J.K.; Xing, Q.G.; Shi, P. World’s largest macroalgal bloom caused by expansion of seaweed aquaculture in China. Mar. Pollut. Bull. 2009, 58, 888–895. [Google Scholar] [CrossRef] [PubMed]
  23. Wang, Z.L.; Xiao, J.; Fan, S.L.; Li, Y.; Liu, X.Q.; Liu, D.Y. Who made the world’s largest green tide in China?—An integrated study on the initiation and early development of the green tide in Yellow Sea. Limnol. Oceanogr. 2015, 60, 1105–1117. [Google Scholar] [CrossRef]
  24. Ye, N.H.; Zhuang, Z.Z.; Jin, X.; Wang, Q.; Zhang, X.; Li, D.M.; Wang, H.X.; Mao, Y.Z.; Jiang, Z.J.; Li, B.; et al. China is on the track tackling Enteromorpha spp forming green tide. Nat. Preced. 2008. [Google Scholar] [CrossRef]
  25. Ye, N.H.; Zhang, X.W.; Mao, Y.Z.; Liang, C.W.; Xu, D.; Zou, J.; Zhuang, Z.Z.; Wang, Q.Y. ‘Green tides’ are overwhelming the coastline of our blue planet: Taking the world’s largest example. Ecol. Res. 2011, 26, 477–485. [Google Scholar] [CrossRef]
  26. Huo, Y.Z.; Han, H.B.; Shi, H.H.; Wu, H.L.; Zhang, J.H.; Yu, K.F.; Xu, R.; Liu, C.C.; Zhang, Z.L.; Liu, K.F.; et al. Changes to the biomass and species composition of Ulva sp. on Porphyra aquaculture rafts, along the coastal radial sandbank of the Southern Yellow Sea. Mar. Pollut. Bull. 2015, 93, 210–216. [Google Scholar] [CrossRef]
  27. Zhang, J.H.; Huo, Y.Z.; Wu, H.; Yu, K.; Kim, J.K.; Yarish, C.; Qin, Y.T.; Liu, C.C.; Xu, R.; He, P.M. The origin of the Ulva macroalgal blooms in the Yellow Sea in 2013. Mar. Pollut. Bull. 2014, 89, 276–283. [Google Scholar] [CrossRef]
  28. Li, H.M.; Zhang, Y.Y.; Chen, J.; Zheng, X.; Liu, F.; Jiao, N.Z. Nitrogen uptake and assimilation preferences of the main green tide alga Ulva prolifera in the Yellow Sea, China. J. Appl. Phycol. 2018, 31, 625–635. [Google Scholar] [CrossRef]
  29. Xiao, J.; Zhang, X.H.; Gao, C.L.; Jiang, M.J.; Li, R.X.; Wang, Z.L.; Li, Y.; Fan, S.L.; Zhang, X.L. Effect of temperature, salinity and irradiance on growth and photosynthesis of Ulva prolifera. Acta Oceanol. Sin. 2016, 35, 114–121. [Google Scholar] [CrossRef]
  30. Liu, Q.; Yan, T.; Yu, R.C.; Zhang, Q.C.; Zhou, M.J. Interactions between selected microalgae and microscopic propagules of Ulva prolifera. J. Mar. Biol. Assoc. UK 2017, 98, 1571–1580. [Google Scholar] [CrossRef]
  31. Fan, X.; Xu, D.; Wang, Y.T.; Zhang, X.W.; Cao, S.N.; Mou, S.L.; Ye, N.H. The effect of nutrient concentrations, nutrient ratios and temperature on photosynthesis and nutrient uptake by Ulva prolifera: Implications for the explosion in green tides. J. Appl. Phycol. 2014, 26, 537–544. [Google Scholar] [CrossRef]
  32. Sun, X.; Wu, M.Q.; Xing, Q.G.; Song, X.D.; Zhao, D.H.; Han, Q.Q.; Zhang, G.Z. Spatio-temporal patterns of Ulva prolifera blooms and the corresponding influence on chlorophyll-a concentration in the Southern Yellow Sea, China. Sci. Total Environ. 2018, 640, 807–820. [Google Scholar] [CrossRef] [PubMed]
  33. Guillard, R.R.L. Culture of Phytoplankton for Feeding Marine Invertebrates. In Culture of Marine Invertebrate Animals; Springer: Boston, MA, USA, 1975. [Google Scholar]
  34. Jin, Q.; Dong, S.L.; Wang, C.Y. Allelopathic growth inhibition of Prorocentrum micans (Dinophyta) by Ulva pertusa and Ulva linza (Chlorophyta) in laboratory cultures. Eur. J. Phycol. 2005, 40, 31–37. [Google Scholar] [CrossRef] [Green Version]
  35. Li, H.; Huang, H.J.; Li, H.Y.; Liu, J.S.; Yang, W.D. Genetic diversity of Ulva prolifera population in Qingdao coastal water during the green algal blooms revealed by: Microsatellite. Mar. Pollut. Bull. 2016, 111, 237–246. [Google Scholar] [CrossRef] [PubMed]
  36. Bradford, M.M. A rapid method for the quantitation of microgram quantities of protein utilizing the principle of protein-dye binding. Anal. Biochem. 1976, 72, 248–254. [Google Scholar] [CrossRef]
  37. Sun, X.; Lu, Z.; Liu, B.; Zhou, Q.; Zhang, Y.; Wu, Z. Allelopathic effects of pyrogallic acid secreted by submerged macrophytes on Microcystis aeruginosa: Role of ROS generation. Allelopath. J. 2014, 33, 121–130. [Google Scholar]
  38. Dhindsa, R.S.; Plumb-Dhindsa, P.; Thorpe, T.A. Leaf senescence: Correlated with increased levels of membrane permeability and lipid peroxidation, and decreased levels of superoxide dismutase and catalase. J. Exp. Bot. 1981, 32, 93–101. [Google Scholar] [CrossRef]
  39. Zhao, X.Y.; Tang, X.X.; Zhang, H.; Qu, T.F.; Wang, Y. Photosynthetic adaptation strategy of Ulva prolifera floating on the sea surface to environmental changes. Plant Physiol. Biochem. 2016, 107, 116–125. [Google Scholar] [CrossRef]
  40. Wang, J.W.; Yan, B.L.; Lin, A.P.; Hu, J.P.; Shen, S.D. Ecological factor research on the growth and induction of spores release in Enteromorpha Prolifera (Chlorophyta). Mar. Sci. Bull. 2007, 26, 60–66. [Google Scholar]
  41. Zhao, P.J.; Wang, H.X.; Li, G.H.; Li, H.D.; Liu, J.; Shen, Y.M. Secondary metabolites from endophytic Streptomyces sp. Lz531. Chem. Biodivers. 2007, 4, 899–904. [Google Scholar] [CrossRef]
  42. Li, T.; Wang, G.C.; Huang, X.J.; Ye, W.C. ChemInform Abstract: Whitmanoside A (I), a New α-Pyrone Glycoside from the Leech Whitmania pigra. J. Cheminform. 2013, 44. [Google Scholar] [CrossRef]
  43. Furtado, N.A.J.C.; Pupo, M.T.; Carvalho, I.; Campo, V.L.; Duarte, M.C.T.; Bastos, J.K. Diketopiperazines produced by an Aspergillus fumigatus Brazilian strain. J. Braz. Chem. Soc. 2005, 16, 1448–1453. [Google Scholar] [CrossRef]
  44. Tilney, C.L.; Pokrzywinski, K.L.; Coyne, K.J.; Warner, M.E. Effects of a bacterial algicide, IRI-160AA, on dinoflagellates and the microbial community in microcosm experiments. Harmful Algae 2014, 39, 210–222. [Google Scholar] [CrossRef]
  45. Meyer, N.; Bigalke, A.; Kaulfuss, A.; Pohnert, G. Strategies and ecological roles of algicidal bacteria. FEMS Microbiol. Rev. 2017, 41, 880–899. [Google Scholar] [CrossRef] [Green Version]
  46. Hare, C.E.; Demir, E.; Coyne, K.J.; Craig Cary, S.; Kirchman, D.L.; Hutchins, D.A. A bacterium that inhibits the growth of Pfiesteria piscicida and other dinoflagellates. Harmful Algae 2005, 4, 221–234. [Google Scholar] [CrossRef]
  47. Zozaya-Valdes, E.; Egan, S.; Thomas, T. A comprehensive analysis of the microbial communities of healthy and diseased marine macroalgae and the detection of known and potential bacterial pathogens. Front. Microbiol. 2015, 6, 9–18. [Google Scholar] [CrossRef] [Green Version]
  48. Perveen, S.; Mushtaq, M.N.; Yousaf, M.; Sarwar, N. Allelopathic hormesis and potent allelochemicals from multipurpose tree Moringa oleifera leaf extract. Plant Biosyst. 2020, 18, 1–6. [Google Scholar] [CrossRef]
  49. Wang, C.X.; Zhu, M.X.; Chen, X.H.; Qu, B. Review on allelopathy of exotic invasive plants. Procedia Eng. 2011, 18, 240–246. [Google Scholar]
  50. Li, N.C.; Tong, M.M.; Glibert, P.M. Effect of allelochemicals on photosynthetic and antioxidant defense system of Ulva prolifera. Aquat. Toxicol. 2020, 224, 105513. [Google Scholar] [CrossRef]
  51. Xu, D.; Gao, Z.Q.; Zhang, X.W.; Fan, X.; Wang, Y.T.; Li, D.M.; Wang, W.; Zhuang, Z.; Ye, N. Allelopathic interactions between the opportunistic species Ulva prolifera and the native macroalga Gracilaria lichvoides. PLoS ONE 2012, 7, e33648. [Google Scholar] [CrossRef]
  52. Zhou, Q.X.; Hu, X.G. Systemic stress and recovery patterns of rice roots in response to graphene oxide nanosheets. Environ. Sci. Technol. 2017, 51, 2022–2030. [Google Scholar] [CrossRef] [PubMed]
  53. Wang, Y.; Zhao, X.Y.; Tang, X.X. Antioxidant system responses in two co-occurring green-tide algae under stress conditions. J. Ocean Univ. 2016, 34, 102–108. [Google Scholar] [CrossRef]
  54. Tan, S.; Hu, X.L.; Yin, P.H.; Zhao, L. Photosynthetic inhibition and oxidative stress to the toxic Phaeocystis globosa caused by a diketopiperazine isolated from products of algicidal bacterium metabolism. J. Microbiol. 2016, 54, 364–375. [Google Scholar] [CrossRef] [PubMed]
  55. Guo, X.L.; Liu, X.L.; Pan, J.L.; Yang, H. Synergistic algicidal effect and mechanism of two diketopiperazines produced by Chryseobacterium sp. strain GLY-1106 on the harmful bloom-forming Microcystis aeruginosa. Sci. Rep. 2015, 5, 14720. [Google Scholar] [CrossRef] [PubMed] [Green Version]
  56. Zhou, Q.X.; Xu, J.R.; Cheng, Y. Quantitative analyses of relationships between ecotoxicological effects and combined pollution. Plant Soil 2004, 261, 155–162. [Google Scholar] [CrossRef]
  57. Hess, F.D. Light-dependent herbicides: An overview. Weed Sci. 2000, 48, 160–170. [Google Scholar] [CrossRef]
  58. Ni, L.T.; Rong, S.Y.; Gu, G.X.; Hu, L.L.; Wang, P.F.; Li, D.Y.; Yue, F.F.; Wang, N.; Wu, H.Q.; Li, S.Y. Inhibitory effect and mechanism of linoleic acid sustained-release microspheres on Microcystis aeruginosa at different growth phases. Chemosphere 2018, 212, 654–661. [Google Scholar] [CrossRef]
  59. Wang, G.X.; Zhang, Q.; Li, J.L.; Chen, X.Y.; Lang, Q.L.; Kuang, S.P. Combined effects of erythromycin and enrofloxacin on antioxidant enzymes and photosynthesis-related gene transcription in Chlorella vulgaris. Aquat. Toxicol. 2019, 212, 138–145. [Google Scholar] [CrossRef]
  60. Zhou, Q.X.; Yue, Z.K.; Li, Q.Z.; Zhou, R.R.; Liu, L. Exposure to PbSe nanoparticles and male reproductive damage in a rat model. Environ. Sci. Technol. 2019, 53, 13408–13416. [Google Scholar] [CrossRef] [Green Version]
  61. Kurama, E.E.; Fenille, R.C.; Rosa, V.E., Jr.; Rosa, D.D.; Ulian, E.C. Mining the enzymes involved in the detoxification of reactive oxygen species (ROS) in sugarcane. Mol. Plant Pathol. 2010, 3, 251–259. [Google Scholar] [CrossRef]
  62. Fan, M.H.; Sun, X.; Xu, N.J.; Liao, Z.; Wang, R.X. cDNA cloning, characterization and expression analysis of manganese superoxide dismutase in Ulva prolifera. J. Appl. Phycol. 2015, 28, 1391–1401. [Google Scholar] [CrossRef]
  63. Cruces, E.; Rautenberger, R.; Cubillos, V.M.; Ramirez-Kushel, E.; Rojas-Lillo, Y.; Lara, C.; Montory, J.A.; Gomez, I. Interaction of photoprotective and acclimation mechanisms in Ulva rigida (Chlorophyta) in response to diurnal changes in solar radiation in Southern Chile. J. Phycol. 2019, 55, 1011–1027. [Google Scholar] [CrossRef]
  64. Sung, M.S.; Hsu, Y.T.; Wu, T.M.; Lee, T.M. Hypersalinity and hydrogen peroxide upregulation of gene expression of antioxidant enzymes in Ulva fasciata against oxidative stress. Mar. Biotechnol. 2009, 11, 199–209. [Google Scholar] [CrossRef]
  65. Xu, S.; Yang, S.Q.; Yang, Y.J.; Xu, J.Z.; Shi, J.Q.; Wu, Z.X. Influence of linoleic acid on growth, oxidative stress and photosynthesis of the cyanobacterium Cylindrospermopsis raciborskii. N. Z. J. Mar. Freshw. Res. 2017, 51, 223–236. [Google Scholar] [CrossRef]
  66. Fan, M.H.; Sun, X.; Liao, Z.; Wang, J.X.; Cui, D.L.; Xu, N.J. Full-length cDNA cloning, characterization of catalase from Ulva prolifera and antioxidant response to diphenyliodonium. J. Appl. Phycol. 2018, 30, 3361–3372. [Google Scholar] [CrossRef]
  67. Long, M.; Tallec, K.; Soudant, P.; Le Grand, F.; Donval, A.; Lambert, C.; Sarthou, G.; Jolley, D.F.; Hégaret, H. Allelochemicals from Alexandrium minutum induce rapid inhibition of metabolism and modify the membranes from Chaetoceros muelleri. Algal Res. 2018, 35, 508–518. [Google Scholar] [CrossRef] [Green Version]
  68. Wang, X.; Szeto, Y.T.; Jiang, C.; Wang, X.; Tao, Y.; Tu, J.; Chen, J. Effects of Dracontomelon duperreanum leaf litter on the growth and photosynthesis of Microcystis aeruginosa. Bull. Environ. Contam. Toxicol. 2018, 100, 690–694. [Google Scholar] [CrossRef]
  69. Yu, S.M.; Li, C.; Xu, C.C.; Effiong, K.; Xiao, X. Understanding the inhibitory mechanism of antialgal allelochemical flavonoids from genetic variations: Photosynthesis, toxin synthesis and nutrient utility. Ecotox. Environ. Saf. 2019, 177, 18–24. [Google Scholar] [CrossRef]
  70. Maxwell, K.; Johnson, G.N. Chlorophyll fluorescence—A practical guide. J. Exp. Bot. 2000, 51, 659–668. [Google Scholar] [CrossRef]
  71. Zheng, Z.Z.; Gao, S.; Wang, G.C. Far red light induces the expression of LHCSR to trigger nonphotochemical quenching in the intertidal green macroalgae Ulva prolifera. Algal Res. 2019, 40, 101512. [Google Scholar] [CrossRef]
  72. Gao, S.; Shen, S.D.; Wang, G.C.; Niu, J.F.; Lin, A.P.; Pan, G.H. PSI-driven cyclic electron flow allows intertidal macro-algae Ulva sp. (Chlorophyta) to survive in desiccated conditions. Plant Cell Physiol. 2011, 52, 885–893. [Google Scholar] [CrossRef] [PubMed] [Green Version]
  73. Gao, S.; Chi, Z.; Chen, H.L.; Zheng, Z.B.; Weng, Y.X.; Wang, G.C. A Supercomplex, of approximately 720 kDa and composed of both photosystem reaction centers, dissipates excess energy by PSI in green macroalgae under salt stress. Plant Cell Physiol. 2019, 60, 166–175. [Google Scholar] [CrossRef] [PubMed]
  74. Lelong, A.; Haberkorn, H.; Le Goïc, N.; Hégaret, H.; Soudant, P. A new insight into allelopathic effects of Alexandrium minutum on photosynthesis and respiration of the diatom Chaetoceros neogracile revealed by photosynthetic-performance analysis and flow cytometry. Microb. Ecol. 2011, 62, 919–930. [Google Scholar] [CrossRef] [PubMed]
  75. Genty, B.; Briantais, J.M.; Baker, N.R. The relationship between the quantum yield of photosynthetic electron transport and quenching of chlorophyll fluorescence. Biochim. Biophys. Acta Gen. Subj. 1989, 990, 87–92. [Google Scholar] [CrossRef]
  76. Mhatre, A.; Patil, S.; Agarwal, A.; Pandit, R.; Lali, A.M. Influence of nitrogen source on photochemistry and antenna size of the photosystems in marine green macroalgae, Ulva lactuca. Photosynth. Res. 2019, 139, 539–551. [Google Scholar] [CrossRef]
  77. Peers, G.; Truong, T.B.; Ostendorf, E.; Busch, A.; Elrad, D.; Grossman, A.R.; Hippler, M.; Niyogi, K.K. An ancient light-harvesting protein is critical for the regulation of algal photosynthesis. Nature 2009, 462, 518–521. [Google Scholar] [CrossRef]
  78. Figueroa, F.L.; Celis-Plá, P.S.M.; Martínez, B.; Korbee, N.; Trilla, A.; Arenas, F. Yield losses and electron transport rate as indicators of thermal stress in Fucus serratus (Ochrophyta). Algal Res. 2019, 41, 101560. [Google Scholar] [CrossRef]
  79. Dong, M.T.; Zhang, X.W.; Zhuang, Z.Z.; Zou, J.; Ye, N.H.; Xu, D.; Mou, S.L.; Liang, C.W.; Wang, W.Q. Characterization of the LhcSR gene under light and temperature stress in the green alga Ulva linza. Plant Mol. Biol. Rep. 2011, 30, 10–16. [Google Scholar] [CrossRef]
  80. Mou, S.L.; Zhang, X.W.; Dong, M.; Fan, X.; Xu, J.; Cao, S.; Xu, D.; Wang, W.; Ye, N.H. Photoprotection in the green tidal alga Ulva prolifera: Role of LhcSR and PsbS proteins in response to high light stress. Plant Biol. 2013, 15, 1033–1039. [Google Scholar] [CrossRef]
  81. Kommalapati, M.; Hwang, H.J.; Wang, H.L.; Burnap, R.L. Engineered ectopic expression of the psbA gene encoding the photosystem II D1 protein in Synechocystis sp. PCC6803. Photosynth. Res. 2007, 92, 315–325. [Google Scholar] [CrossRef]
  82. Barati, B.; Lim, P.E.; Gan, S.Y.; Poong, S.W.; Phang, S.M. Gene expression profile of marine Chlorella strains from different latitudes: Stress and recovery under elevated temperatures. J. Appl. Phycol. 2018, 30, 3121–3130. [Google Scholar] [CrossRef]
  83. Ohnishi, N.; Allakhverdiev, S.I.; Takahashi, S.; Higashi, S.; Watanabe, M.; Nishiyama, Y.; Norio, M. Two-step mechanism of photodamage to photosystem II: Step 1 occurs at the oxygen-evolving complex and step 2 occurs at the photochemical reaction center. Biochemistry 2005, 44, 8494–8499. [Google Scholar] [CrossRef] [PubMed]
  84. Hakala, M.; Tuominen, I.; Keränen, M.; Tyystjärvi, T.; Tyystjärvi, E. Evidence for the role of the oxygen-evolving manganese complex in photoinhibition of Photosystem II. Biochim. Biophys. Acta Bioenergy 2005, 1706, 68–80. [Google Scholar] [CrossRef] [PubMed] [Green Version]
  85. Correa-Galvis, V.; Redekop, P.; Guan, K.; Griess, A.; Truong, T.B.; Wakao, S.; Niyogi, K.K.; Jahns, P. Photosystem II Subunit PsbS is involved in the induction of LHCSR protein-dependent energy dissipation in Chlamydomonas reinhardtii. J. Biol. Chem. 2016, 291, 17478–17487. [Google Scholar] [CrossRef] [Green Version]
  86. Pinnola, A.; Cazzaniga, S.; Alboresi, A.; Nevo, R.; Levin-Zaidman, S.; Reich, Z.; Bassi, R. Light-Harvesting Complex stress-eelated proteins catalyze excess energy dissipation in both photosystems of physcomitrella patens. Plant Cell 2015, 27, 3213–3227. [Google Scholar] [CrossRef] [PubMed] [Green Version]
  87. Li, Y.; Zhu, H.; Lei, X.; Zhang, H.; Cai, G.; Chen, Z.; Fu, L.; Xu, H.; Zheng, T.L. The death mechanism of the harmful algal bloom species Alexandrium tamarense induced by algicidal bacterium deinococcus sp. Y35. Front. Microbiol. 2015, 6, 992–997. [Google Scholar] [CrossRef] [Green Version]
  88. Perzborn, M.; Syldatk, C.; Rudat, J. Enzymatical and microbial degradation of cyclic dipeptides (diketopiperazines). AMB Express 2013, 3, 51. [Google Scholar] [CrossRef] [PubMed] [Green Version]
Figure 1. Isolation and bioassay program for potential allelopathic compounds from crude extraction of cell-free filtrate of Bacillus cereus BE23.
Jmse 08 00718 g001
Figure 2. Relative growth rates and inhibition rates of Ulva prolifera under the exposure of different amounts of cell-free filtrate of Bacillus cereus BE23. T1:100, and T1:80~T1:10 indicate the treatments of volume ratio of cell-free filtrate of Bacillus cereus BE23 to f/2 medium. Values are means ± SD (n = 3). * indicates a significant difference (p < 0.05) and ** indicates a significant difference (p < 0.001) compared to control.
Jmse 08 00718 g002
Figure 3. H2O2 content of Ulva prolifera under the exposure of different amounts of cell-free filtrate of Bacillus cereus BE23. T1:100, and T1:80~T1:10 indicate the treatments of volume ratio of cell-free filtrate of Bacillus cereus BE23 relative to f/2 medium. Values are means ± SD (n = 3). * indicates a significant difference (p < 0.05) and ** indicates a significant difference (p < 0.001) compared to control.
Jmse 08 00718 g003
Figure 4. (a) Superoxide dismutase (SOD) activity and relative gene expression of manganese superoxide dismutase (upMnSOD), and (b) catalase (CAT) activity and catalase gene expression (upCAT) of Ulva prolifera under the exposure of different amounts of cell-free filtrate of Bacillus cereus BE23. T1:100, and T1:80~T1:10 indicate the treatments of volume ratio of cell-free filtrate of Bacillus cereus BE23 relative to f/2 medium. Values are means ± SD (n = 3). * indicates a significant difference (p < 0.05) and ** indicates a significant difference (p < 0.001) compared to control.
Jmse 08 00718 g004
Figure 5. (a) The chlorophyll a and b content, and (b) the maximum quantum yields of PSII (Fv/Fm) of Ulva prolifera under the exposure of different amounts of cell-free filtrate of Bacillus cereus BE23. Values are means ± SD (n = 3). ** indicates a significant difference (p < 0.001) compared to control.
Jmse 08 00718 g005
Figure 6. Photosynthetic system II parameters of Ulva prolifera under the exposure of different amounts of cell-free filtrate of Bacillus cereus BE23: (a) quantum yield (Y(II)) and relative electron transport rate (rETR), and (b) non-photochemical quenching (NPQ) and photochemical (qP). T1:100, and T1:80~T1:10 indicate the volume ratio of cell-free filtrate of Bacillus cereus BE23 relative to f/2 medium in the different treatments. Values are means ± SD (n = 3). ** indicates a significant difference (p < 0.001) compared to control.
Jmse 08 00718 g006
Figure 7. Relative expression of the genes (a) PsbS and LhcSR, and (b) PsbA and PsbD of Ulva prolifera under the exposure of different amounts of cell-free filtrate of Bacillus cereus BE23. T1:100, and T1:80~T1:10 indicate the treatments of volume ratio of cell-free filtrate of Bacillus cereus BE23 relative to f/2 medium. Values are means ± SD (n = 3).
Jmse 08 00718 g007
Figure 8. Structures of the compounds Ech5-4 (a), Eea2-5 (b), and Eea3-2 (c) isolated from the crude extract of Bacillus cereus BE23 filtrate.
Jmse 08 00718 g008
Table 1. Sequences of primer pairs for Ulva prolifera analysis.
PrimerSequence (5′–3′)
5SF: 5′-GGTTGGGCAGGATTAGTA-3′
R: 5′-AGGCTTAAGTTGCGAGTT-3′
ITSF: 5′-TCGTAACAAGGTTTCCGTAGG-3′
R: 5′-GCTGCGTTCTTCATCGWTG-3′
Table 2. Sequences of primer pairs in Ulva prolifera for real-time PCR.
PrimerSequence (5′-3′)Product Length
TubulinF: 5′-CAAGGATGTCAATGCTGCTGT-3′112
R: 5′-GACCGTAGGTGGCTGGTAGTT-3′
PsbSF: 5′-AACAGGTTCATCCATCACGG-3′121
R: 5′-TTGCCTCAAACTCATCCTCTG-3′
LhcSRF: 5′-CTATGCGAAGACTCTCAACG-3′83
R: 5′-CCTCGCGGTAGCGCTTAACT-3′
PsbAF: 5′- CTTTATGGGCTCGCTTTTGT-3′103
R: 5′- TGGAACTACAGCACCAGAAA-3′
PsbDF: 5′- CAGGAAGTGTTCAACCAGTA-3′167
R: 5′- AGCAGCGATGTGATGAGACG-3′
upMnSODF: 5′-ATCACCAGGCGTATGTCACC-3′94
R: 5′-TTCAAGTGCCCTCCACCGTT-3′
upCATF: 5′-CTCTCAAGCCCAATCCTCGT-3′95
R: 5′-AGTTCAGTGGGATGCCAACA-3′
Table 3. Fluorescence parameters calculated from PAM in Ulva prolifera after exposure.
ParameterDefinitionEquation
Fv/Fmmaximum quantum yield of PSII(Fm − F0)/Fm
Y(II)effective quantum yield of PSII(F’m − Ft)/F’m
NPQnon-photochemical quenching(Fm − F’m)/F’m
rETRrelative electron transport rate0.5 × Y(II) × PAR × IA
qPphotochemical quenching (F’m − Ft)/(F’m − F’0)

