Article

Validation of RANS Modelling for Wave Interactions with Sea Dikes on Shallow Foreshores Using a Large-Scale Experimental Dataset

1
Department of Civil Engineering, Ghent University, 9000 Ghent, Belgium
2
Maritime Engineering Laboratory, Department of Civil and Environmental Engineering, Universitat Politecnica de Catalunya—BarcelonaTech (UPC), 08034 Barcelona, Spain
3
Flanders Hydraulics Research, 2140 Antwerp, Belgium
4
Faculty of Civil Engineering and Geosciences, Delft University of Technology, 2628 CN Delft, The Netherlands
5
Department of Civil and Environmental Engineering, University of Florence, 50139 Florence, Italy
*
Author to whom correspondence should be addressed.
J. Mar. Sci. Eng. 2020, 8(9), 650; https://doi.org/10.3390/jmse8090650
Submission received: 17 July 2020 / Revised: 17 August 2020 / Accepted: 18 August 2020 / Published: 24 August 2020
(This article belongs to the Special Issue Wave Interactions with Coastal Structures)

Abstract

:
In this paper, a Reynolds-averaged Navier–Stokes (RANS) equations solver, interFoam of OpenFOAM®, is validated for wave interactions with a dike, including a promenade and vertical wall, on a shallow foreshore. Such a coastal defence system is comprised of both an impermeable dike and a beach in front of it, forming the shallow foreshore depth at the dike toe. This case necessitates the simulation of several processes simultaneously: wave propagation, wave breaking over the beach slope, and wave interactions with the sea dike, consisting of wave overtopping, bore interactions on the promenade, and bore impacts on the dike-mounted vertical wall at the end of the promenade (storm wall or building). The validation is done using rare large-scale experimental data. Model performance and pattern statistics are employed to quantify the ability of the numerical model to reproduce the experimental data. In the evaluation method, a repeated test is used to estimate the experimental uncertainty. The solver interFoam is shown to generally have a very good model performance rating. A detailed analysis of the complex processes preceding the impacts on the vertical wall proves that a correct reproduction of the horizontal impact force and pressures is highly dependent on the accuracy of reproducing the bore interactions.

1. Introduction

Low-elevation coastal zones often have mildly to steeply-sloping sandy beaches as part of their coastal defence system. For countries in north-western Europe, coastal urban areas typically have high-rise buildings close to the coastline. These buildings are usually fronted by a low-crested, steep-sloped, and impermeable sea dike with a relatively short promenade, where the long (nourished) beach in front of the dike acts as a mildly sloping shallow foreshore. This type of coastal defence system therefore combines hard and soft coastal protection against flooding. Such hybrid approaches are regarded by the Intergovernmental Panel on Climate Change (IPCC) with high agreement as a promising way forward in terms of response to sea level rise [1]. Along the cross-section of this hybrid beach-dike coastal defence system, storm waves undergo many transformation processes before they finally hit the buildings on top of the dike. Along the shallow waters of the mildly sloping foreshore in front of the dike, sea/swell or short waves (hereafter SW, O(101 s)) shoal and eventually break, transferring energy to both their super- and subharmonics (or long waves: hereafter LW, O(102 s)) by nonlinear wave-wave interactions. Further pre-overtopping hydrodynamic processes along the mildly sloping foreshore include wave dissipation by breaking (turbulent bore formation) and bottom friction, reflection against the foreshore and dike, and wave run-up on the dike slope. Finally, waves overtop the dike crest, and post-overtopping processes include bore propagation on the promenade, bore impact on a wall or building, and reflection back towards the sea interacting with incoming bores on the promenade.
For the (structural) design of storm walls or buildings on such coastal dikes, the wave impact force expected for specific design conditions needs to be estimated. Semi-empirical formulas, mostly based on physical model tests, are commonly used in practice to assess wave forces and pressures on coastal defences, at least in a preliminary design phase. However, semi-empirical formulas are usually restricted within very specific ranges of application, currently limiting force prediction to dikes with deep foreshore depths [2,3]. Such formulas do exist for dikes with very/extremely shallow foreshore depths as well [4,5], but their application is also strictly limited. For the final design, therefore, often detailed experimental campaigns are required [6]. Alternatively, during the last decade, numerical modelling of these combined processes has become feasible [3,7,8,9,10,11]. Numerical modelling is also able to provide a detailed and accurate assessment of a specific case. Moreover, numerical models can provide information on physical quantities that are difficult to measure in a scaled model or in prototype (e.g., detailed velocity fields, pressure distributions, etc.).
To study fully two-dimensional vertical (2DV) complex fluid flows, computational fluid dynamics (CFD) techniques are typically applied. Relatively new mesh-free Lagrangian numerical methods, such as Smoothed Particle Hydrodynamics (SPH) [12] and the particle finite element method [13], have been recently validated and applied to several coastal engineering problems [9,14,15,16,17], showing much promise. However, different from Eulerian grid-based methods, multi-phase air-fluid SPH models are still quite scarce and have a high computational cost [18]. The more traditional Eulerian numerical methods are already more consolidated. For example, volume-of-fluid methods (VOF) based on the Reynolds-averaged Navier–Stokes equations (RANS) have been widely employed during the last decades. Using RANS models, processes such as wave transformation [8,19,20], wave overtopping [7,21,22], and wave impact on coastal structures [3,23,24,25,26] have been modelled and validated, but never before at the same time (to the knowledge of the authors). They are computationally very expensive to apply, but have shown their value particularly for wave-structure interaction phenomena involving complex geometries. In addition, two-phase water-air RANS models allow taking the effects of air entrapment on the wave impact processes into account [27,28].
Validation of numerical models is crucial before they can be reliably applied. Even though plenty of works have been published on numerical modelling and validation of individual processes previously listed, there is still a lack of literature about RANS model validation for wave impacts on sea dikes and dike-mounted walls in presence of a very shallow foreshore. The main goal of this paper is to validate a two-phase (water-air) RANS model for this specific case. Such a modelling approach is deemed necessary to fully resolve the 2DV complex fluid flows of overtopped waves and bore interactions on top of the promenade. The RANS solver (interFoam) for two incompressible fluids within the open source CFD toolbox OpenFOAM® is chosen because of its increasing popularity for application to wave-structure interactions. Validation of this numerical model is done by reproducing large-scale experiments of overtopped wave impacts on coastal dikes with a very shallow foreshore from the WAve LOads on WAlls (WALOWA) project [29]. The large-scale nature of these experiments reduces the scale effects significantly compared to small-scale experiments, which can be particularly important to the wave impacts on the dike-mounted vertical wall, especially in case of plunging breaking bore patterns and impulsive impacts [30].
The paper is structured as follows. First, the methods used in the paper are explained in Section 2, starting with the experimental model setup and a description of the tests used for the validation. This is followed by a description of the applied RANS model and the numerical model setup. Finally, the statistical model performance methods applied in this study are discussed. Next, in Section 3 the results of the qualitative and quantitative numerical model validation are provided, including a comparison of model snapshots at key time instants during impacts on the vertical wall. This is finally followed by Section 4 with a discussion on these results and the conclusions in Section 5.

2. Methods

2.1. Large-Scale Laboratory Experiments

The laboratory experiments (Froude length scale 1/4.3) were done during the research project WALOWA in the Deltares Delta Flume, which is 291 m long, 9.5 m deep, and 5 m wide. This wave flume is equipped with a piston-type wave maker capable of up to second-order wave generation (in the frequency range 0.02 Hz–1.50 Hz) and includes active reflection compensation (ARC), which is an active wave absorption (AWA) system to minimise reflections against the wave paddle. For a detailed description of the model setup, reference is made to Streicher et al. [29]. The WALOWA dataset is open access and is described by Kortenhaus et al. [31].
The model geometry consisted of a moveable sandy foreshore with a transition slope of 1:10 and a slope of 1:35 up to the toe of the dike (Figure 1). The smooth impermeable concrete dike had a front slope of 1:2, a promenade width of 2.35 m with an inclination of 1:100 in order to help drain the water in case of wave overtopping, and finally a 1.60 m high wall. The wall height was designed to be high enough to prevent wave overtopping during testing, but small amounts of overtopped water could still be returned via a recirculation drainage pipe behind the wall.
The WALOWA dataset includes both bichromatic and irregular wave tests. For validation of the numerical model, the bichromatic wave test Bi_02_6 (EXP) and its repetition Bi_02_6_R (REXP) were selected (Table 1). The bichromatic wave tests have the advantage to be relatively short in time, while still considering the effects of wave dispersion and bound LWs, and are therefore more representative of irregular waves than monochromatic waves. In this way, even numerical models with a high computational demand are able to simulate the tests in a reasonable amount of computational time. This specific bichromatic wave test was chosen because it is the only test that was conducted shortly after a foreshore profile measurement and at the same time immediately followed by its repetition and another foreshore profile measurement [32,33]. Since these bichromatic wave tests are relatively short in duration and only limited changes (O(10−2 m)) were noted between the profile measurements before and after [32], a fixed bed is a reasonable assumption for the numerical modelling. In addition, the repeated test makes validation of the numerical model possible relative to the experimental uncertainty.
During these tests, three bichromatic wave groups were generated with first order wave control over 125 s, including 10 s of tapering at the beginning and end of the wave generation. Plunging breakers occurred on the 1:10 transition slope (i.e., deep water Iribarren number ξ0 = tan α/(H/L0)1/2 with α the foreshore slope angle, H the wave height, and L0 the deep water wave length [34]: 0.5 < ξ0 ≈ 0.7 < 3.3) and spilling breakers on the 1:35 foreshore slope (ξ0 ≈ 0.2 < 0.5). Considering this was a test of a dike with a very shallow foreshore depth (Table 1: 0.3 < ht/Hm0,o < 1.0 [35]), the wave energy at the toe of the dike was dominated by LW energy.
The measurement setup consisted of instruments to measure the water surface elevation along the flume and on the promenade, the velocity of the overtopped flow on the promenade, and the impact pressure and force on the vertical wall (Figure 2). All measurements were sampled at 1000 Hz frequency and were synchronized in time.
The water surface elevation η (with the vertical origin at z = ho) was measured with resistance-type wave gauges (WG) deployed at seven different locations along the Delta Flume side wall (Figure 1 and Figure 2a). WG02–WG04 were installed over the flat bottom part of the flume close to the wave paddle. These wave gauges were positioned to allow a reflection analysis following the method of Mansard and Funke [36]. WG07 was installed along the transition slope; WG11 and WG13 along the foreshore slope. WG14 was installed close (~0.35 m) to the dike toe. The data of WG11 are not considered further in the present analysis because of faulty data. Furthermore, to remove unwanted noise in the η signals measured by the other WG’s from the wave paddle up to the dike toe, a low-pass 3rd order Butterworth filter with a cut-off frequency of 1.50 Hz was applied. This frequency is well above the frequencies of the super-harmonics of the primary waves and frequency components due to triad interactions between the primary components and the difference frequency, which gain energy in the shoaling and surf zone [37].
Flow layer level measurements η on the promenade were obtained by four resistance-type water level distance meters (WLDM01–WLDM04, Figure 2d). Flow velocity measurements on the promenade were obtained by four paddle wheels (PW01–PW04, Figure 2b), measuring the horizontal flow velocity Ux in one direction (i.e., towards the wall) 0.026 m above the promenade. Additionally, a bidirectional electromagnetic current meter (ECM, Figure 2c) was installed at the same cross-shore location as WLDM02 and PW02 to obtain directional information of the incoming or reflected flow. The ECM disc was positioned 0.03 m above the promenade and sampled the horizontal velocity at 16 Hz. Further detailed information on the sensor setup on the promenade and the post-processing of the η and Ux data measured on top of the promenade was provided by Cappietti et al. [38]. During return flow, positive Ux values were possibly incorrectly measured by the PWs, indicated by the ECM that measured negative Ux values during return flow (compared to the measurements of the co-located PW02). This will be further discussed in the comparison with the numerical model result (Section 3.1). However, no such co-located measurements are available for other paddle wheels than PW02, so no correction of the PW measurements during return flows was attempted.
The overtopped wave impacts on the wall were measured by horizontal force Fx and pressure p measurement systems integrated into the wall. The horizontal impact force was measured by two compression-type load cells (LC) connecting the same hollow steel profile to the very stiff supporting structure (Figure 2e). Impact pressures were measured by 15 pressure sensors (PS). The first 13 PSs were spaced vertically over a metal plate flush mounted in the middle section of the steel wall, with PS14 and PS15 placed horizontally next to PS05 or the fifth PS from the bottom (Figure 2f). The initial post-processing of the Fx and p signals, including baseline correction and filtering, is discussed by Streicher [39]. Additional filtering was applied to remove the high frequency oscillations caused by stochastic processes during dynamic or impulsive impacts, so that the signal can be reproduced by a deterministic numerical model [40]. To achieve this, an additional 3rd order Butterworth low-pass filter with a cut-off frequency of 6.22 Hz was necessary. This corresponds to a cut-off frequency of 3.0 Hz at a prototype scale, which is still well above the natural frequency of about 1.0 Hz for typical buildings found along, e.g., the Belgian coast [41]. Furthermore, local spatial variability over the width of the flume of the resultant Fx (i.e., derived from the LCs and pressure integrated) and p (i.e., PS05, PS14, and PS15) time series was found to be low (not shown). This spatial variability over the width of the experimental flume was therefore further neglected in the quantitative numerical model validation: for Fx, the LC-derived signal was used and for p, the PS05 signal was used.

2.2. Numerical Model

2.2.1. Model Description

In this work, OpenFOAM v6 [42] was applied and validated, or more specifically interFoam, a solver of the RANS equations, where the advection and sharpness of the water–air interface are handled by an algebraic VOF method [43] based on the multidimensional universal limiter with explicit solution (MULES) [44,45,46]. InterFoam with MULES has already been successfully applied for wave propagation [45], wave breaking [20,47,48,49,50], wave run-up [20,50], wave overtopping [51,52], and bore impact on a vertical wall [26].
Several open source contributions of boundary conditions for wave generation and absorption exist for interFoam, of which the main developments are IHFOAM [53], olaFlow [54], and waves2Foam [55]. In the present study, olaFlow was chosen, which was found to be the most computational efficient [53,56,57] and feature complete package at the time of the simulations presented in this paper.
The turbulence is modelled by the k-ω SST turbulence closure model [58], which has been shown to be one of the most proficient in modelling wave breaking [47]. Two-equation turbulence closure models are known to cause over-predicted turbulence levels beneath computed surface waves, leading to unphysical wave decay for wave propagation over constant water depth and long distance [49,59,60]. Turbulence modelling was therefore stabilized in nearly potential flow regions by Larsen and Fuhrman [49], with their default parameter values [61]. Hereafter, the OpenFOAM numerical model as presented here is simply referred to as OF.

2.2.2. Computational Domain and Mesh

Wave breaking is an inherently three-dimensional (3D) process due to the formation of 3D vortices extending obliquely downward in the inner surf zone [62]. Even so, many examples exist where the wave kinematics during wave breaking could be approximated well by vertical two-dimensional (2DV) RANS modelling [8,19,47,48,49,50,63,64]. To reduce the computational time as much as possible, OF is therefore applied in a 2DV configuration (i.e., cross-shore section of the wave flume).
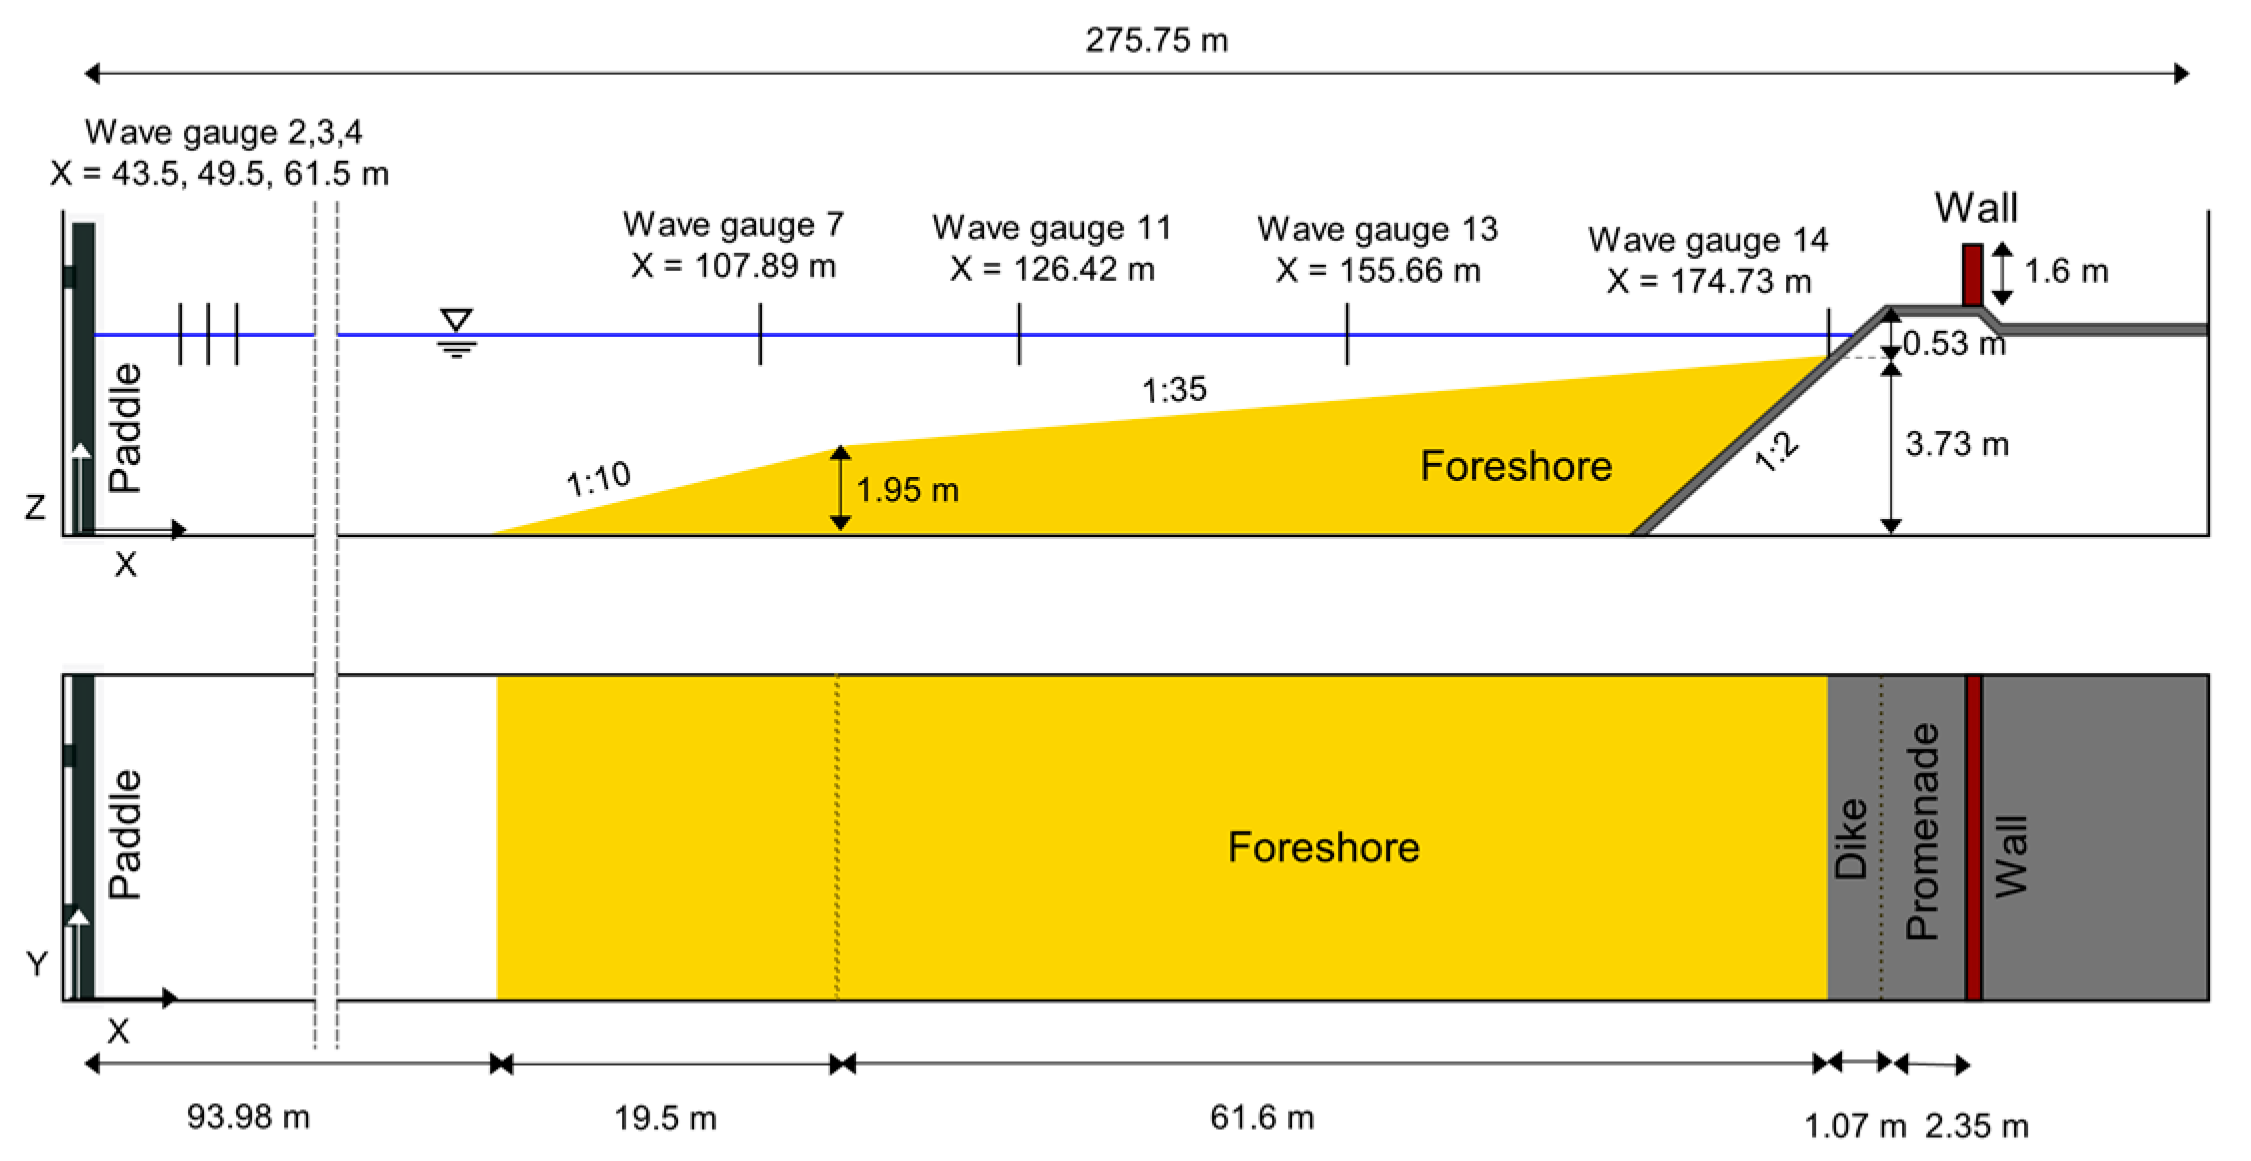
The OF model domain (Figure 3) starts at the wave paddle zero position (x = 0.00 m) and ends on top of the vertical wall (x = 178.80 m). The bottom boundary is at its lowest point (z = 0.00 m) along the flume bottom between the wave paddle and the foreshore toe, and extends up to z = 7.20 m, well above the maximum measured surface elevations along the flume. The bottom is further defined by the measured foreshore and dike geometry as described in Section 2.1. The vertical wall is included up to its height of 1.60 m including the top which was given a slight inclination towards the model boundary to allow overtopped water (limited to mainly spray in this case) to exit the model domain.
The computational domain is discretised into a structured grid. To optimise the computational time, a variable grid resolution is applied, where a higher resolution is defined only where it is necessary. This is mostly the areas of the model domain where the water-air interface is expected to pass [46,56]. The expected location of the free surface along the flume during the entire test was estimated first by a fast preliminary one-layer depth-averaged SWASH calculation (not shown: see [65] for the SWASH model setup description). The minimum and maximum η along the flume and over the complete test duration were obtained from the SWASH model result to define areas in which mesh refinement should be done. These locations are delineated by the dotted lines in Figure 3, defining several areas around the still water level (SWL). In front of the wave paddle, the refinement area is slightly higher to accommodate the stabilisation of the newly generated waves, after which the refinement zone can decrease in height when the waves have fully developed. Then, the refinement area is increased in height again to allow room for wave shoaling and incipient wave breaking on the foreshore. The upper limit can subsequently be lowered again due to wave breaking, but the lower limit is extended to include the bottom boundary. This is done to properly resolve the entrained air pockets that have been shown to travel towards the bottom during the breaking process in the inner surf zone [66]. The height of the refinement zone on the dike was defined based on the maximum measured water level in the experiment by the WLDM’s on the promenade and extended to the upper model boundary along the vertical wall to resolve the run-up and splashing against the vertical wall.
In terms of the grid cell size in these refinement zones, about 20 cells are typically recommended over the wave height H of a regular wave (i.e., Hz = 20, with Δz being the vertical cell size) [46,57]. Applied to the wave heights of the primary wave components of the bichromatic wave in Table 1, a minimal vertical cell size of Δz = 0.045 m to 0.043 m is obtained. Smaller wave heights in the bichromatic wave group are less resolved with this choice, but this is deemed acceptable because of their relatively low steepness. A value of Δz = 0.045 m was chosen, because the water depth at the wave paddle ho is divisible by it (i.e., hoz = 4.14/0.045 = 92), meaning that the SWL can lie perfectly along cell boundaries, or in other words, α-values between 0 and 1 are thereby minimised at the start of the simulation, which simplifies the initialisation of the SWL and is beneficial for an effectively still SWL at the start of the simulation.
The mesh maintains an aspect ratio Δxz of 1 (with Δx being the horizontal cell size) throughout the entire computational domain, which has been shown necessary for accuracy [46,55,66] and numerical stability in this study. One exception is a higher aspect ratio along the bottom and wall, where layers were locally added to the mesh to resolve the boundary layer. Six layers were added over the vertical cell size along those boundaries, with a growth rate of 1.2, leading to a maximum aspect ratio of 18.
Outside the refinement zones, in the air and water phases, the mesh can be coarser [46,57]. The structured mesh was given a base grid resolution of 0.18 m. This base resolution is multiplied by a refinement ratio r, here defined as:
r   =   1 2 β
in which β signifies the refinement level. Each refinement level effectively refines every cell into four new cells. The applied refinement levels are provided for each mesh subdomain in Figure 3. For the air in the model domain, the base resolution was assumed (β = 0), except for a small area over the dike (β = 1). In the water phase, refinement level 1 was assumed (Δx = Δz = 0.09 m) and was further refined in the zone of the surface elevation up to the dike toe (level 2 or Δx = Δz = 0.045 m). Close to the inlet boundary, however, a lower refinement level was necessary for numerical stability (β = 1) over a very short distance (0 m < x < 0.50 m) where locally high water velocities (i.e., low Courant numbers and low time steps) at the interface can occur due to the wave generation. On the dike up to the wall, the mesh was refined even more (level 3 or Δx = Δz = 0.0225 m) to resolve thin layer flows, the complex flows of bore interactions, and impacts on the vertical wall. In addition, a refinement level 3 was necessary to resolve the experimental pressure sensor locations along the vertical wall.
The mesh was generated by applying the cartesian2DMesh algorithm of cfMesh [67], which resulted in a mesh with 318,381 cells, for the refinement levels indicated in Figure 3.
The adaptive time stepping is controlled by a predefined maximum Courant number maxCo (Co = ∆t |U|/∆X, where ∆t is the time step, |U| is the magnitude of the velocity through that cell, and ∆X is the cell size in the direction of the velocity [68]) and a maximum Courant number in the interface cells maxAlphaCo. Generally maxCo = maxAlphaCo is chosen, as well as in this paper. Larsen et al. [45] have shown that a relatively low maxCo (~0.05) is necessary to obtain a stable wave profile over more than five wave periods’ propagation duration. Here, however, a maxCo of 0.25 is used to balance the accuracy and computational costs. Since the primary waves of the bichromatic wave group only propagate over about three wave lengths up to the mean breaking point location (xb = ~120 m), this is considered an acceptable assumption. Both the refinement level in the refinement zones around the surface elevation zones (βsez) and the maxCo were verified in a convergence analysis (Appendix A).

2.2.3. Boundary Conditions

Since the model domain represents a 2DV simulation, no solution is necessary in the y-direction, and the lateral boundaries of numerical wave flume were assigned an “empty” boundary condition. Non-empty boundary conditions were defined for the remaining boundaries in the xz-plane (Figure 3).
The bichromatic waves from Table 1 were generated at the inlet by applying a Dirichlet-type boundary condition: the experimental wave paddle velocity was imposed. The paddle displacement time series is used by olaFlow to calculate the wave paddle velocity by a first-order forward derivative [69]. Since the reflection in the numerical wave flume is expected to behave close to, but not exactly the same as in the experiment, the theoretical paddle displacement without ARC was selected and the AWA by olaFlow was activated instead. In addition to the paddle displacement, the surface elevation at the wave paddle is provided, which allows olaFlow to trigger the AWA with fewer assumptions [69]. The AWA implementation in olaFlow is most effective for shallow water waves. The primary components of the bichromatic wave group are intermediate waves for the water depth at the wave paddle, but their reflection is expected to be low, since most of their wave energy dissipates over the foreshore in the surf zone. However, reflected free long (infragravity) waves are expected to be non-negligible (Section 3.2). They are shallow water waves and are by definition absorbed well by the AWA system in olaFlow, preventing their re-reflection and therefore replicating the behaviour of the ARC in the experiment.
Both the bottom and wall boundaries are fixed boundaries, including the sandy foreshore (Section 2.1), along which the velocity vector field U has a Dirichlet-type boundary condition (U = (0, 0, 0) m/s), while the pressure p and α are given a Neumann boundary condition. Along the foreshore, dike and wall, no-slip boundary conditions are assumed and a continuous scalable wall function based on Spalding’s law [70] is implemented. The six boundary layers that were previously added in the mesh along these no-slip fixed boundaries make sure that the scalable wall function criterion for the dimensionless wall distance z+ (i.e., 1 < z+ < 300) is complied with. For the remaining boundary conditions, initial conditions, and solver settings, the same settings were chosen as those reported by Devolder et al. [48].
The OF simulations were run in parallel on a 24-core Intel Xeon E5-2680 @ 2500 MHz computer with 128 GB of RAM. The scotch decomposition algorithm was used to divide the mesh into equal amounts of cells for each processor, while minimising the number of processor boundaries [42]. The cells along the inlet patch were forced onto the same processor, which benefits the computational efficiency. In this setup, the simulation required a CPU time of about 85 h.

2.2.4. Data Sampling and Processing

The same data were sampled in OF at the same cross-shore locations as in the experiment (Section 2.1). Applying the same sampling frequency of 1000 Hz in OF, however, would increase the calculation time to unpractical levels because it affects the time stepping. Instead, a sampling frequency of 80 Hz was maintained throughout, which is a compromise between the temporal resolution of the output data and the calculation time.
To obtain η in OF, α was recorded at a fixed interval over a vertical line at each wave gauge location. In post-processing, η was then obtained by vertical integration of α, thereby excluding air inclusions produced in the surf zone, but taking into account all water volumes (i.e., even air-borne water, e.g., in case of plunging waves, spray). This corresponds best to how η in the experiment was measured: resistive wave gauges give a response proportional to the wire wet length [71], thereby similarly excluding air pockets. However, it is acknowledged that some uncertainty remains regarding how resistive type wave gauges measure the free surface in the presence of air–water mixtures along the gauge. This could lead to discrepancies in the numerical–experimental model comparisons in the surf zone and on top of the promenade [72].
The resulting numerical time series were filtered in the same way as the experimental data (Section 2.1) and were synchronised to the experimental time reference. The synchronisation was done based on the η time series at the three most offshore located wave gauges (i.e., WG02–03–04) by means of a cross-correlation. The obtained numerical–experimental time lags for each of these WG locations were subsequently averaged and rounded to the nearest multiple of the time series time step. This time lag was then used to synchronise all numerical time series to the experimental time reference. This makes sure that numerical errors (such as phase lag), which are important for model validation, were retained.
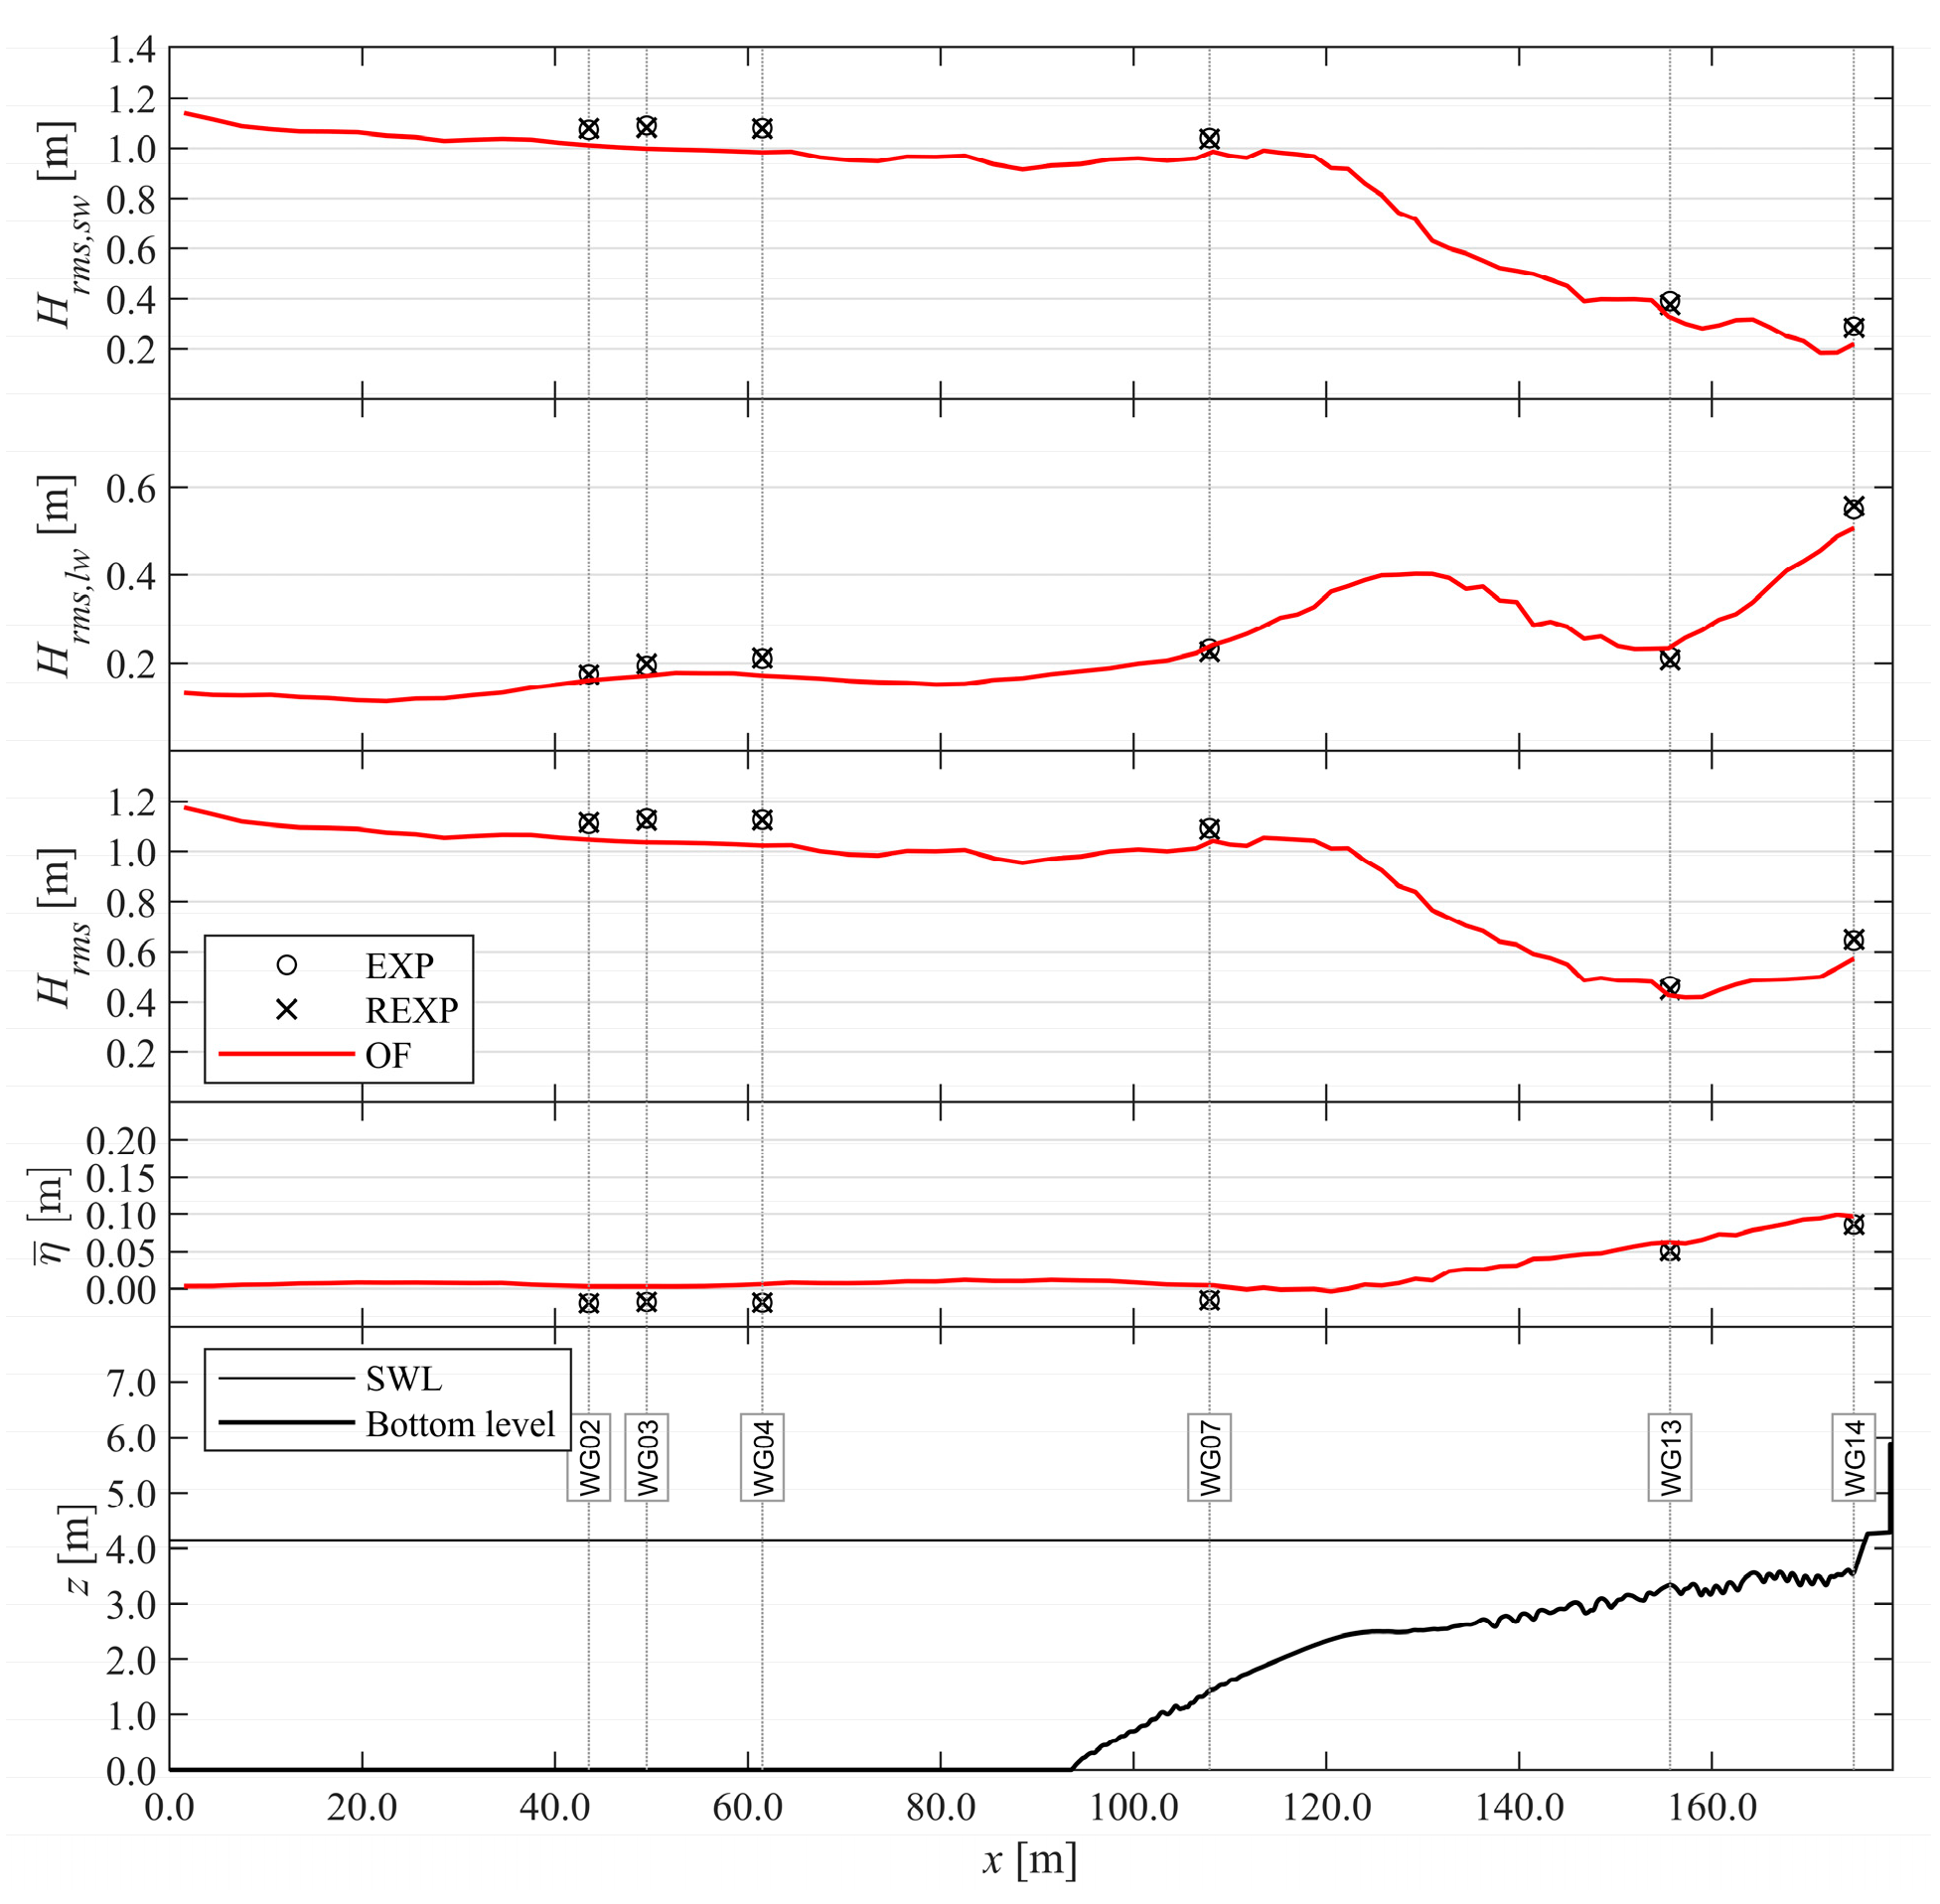
Furthermore, to investigate the model performance for the SW and LW components separately, the η time series were separated into ηSW and ηLW by applying a 3rd-order Butterworth high- and low-pass filter, respectively. A separation frequency of 0.09 Hz was employed, which is in between the bound long wave frequency (f1–f2 = 0.035 Hz) and the lowest frequency of the primary wave components (f2 = 0.155 Hz).

2.3. Validation Method

The validation of the numerical model OF to the large-scale experiment EXP is done both qualitatively and quantitatively. The qualitative validation entails a comparison of the time series of the main measured parameters. However, it is recommended to apply model performance statistics as well for a more quantified and objective validation [73]. Therefore, general numerical model performance will be evaluated by applying a skill score or dimensionless measure of average error, such as Willmott’s refined index of agreement dr [74]:
d r   =   { 1     M A E c M A D ,   M A E     c M A D c M A D M A E     1 ,   M A E   >   c M A D
where c is a scaling factor and is taken equal to 2 to obtain a balance between the number of deviations evaluated within the numerator and within the denominator of the fractional part of dr; MAE is the mean absolute error defined by:
M A E   =   1 N i = 1 N | P i     O i |
with N the number of samples in the time series, and P the predicted time series together with the pair-wise-matched observed time series O (for i = 1,2,…,N), and MAD is the mean-absolute deviation:
M A D   =   1 N i = 1 N | O i     O ¯ |
where the overbar represents the mean of the time series. This model performance index dr is bounded by [−1.0, 1.0] and, in general, more rationally related to model accuracy than other existing model performance indices or skill scores. For the purposes of this paper, dr is used as a general measure of the model performance, and a dr value of 0.5 is already considered to be a poor model performance. Since it is a single measure of model performance, it can be more easily used to evaluate, for example, the spatial model performance over the length of the wave flume.
Because a repetition of the selected experimental test is available (REXP), dr can be evaluated between REXP and EXP as well. This can serve as a limit above which a dr value of the numerical model signifies that the numerical model performance cannot be improved beyond the experimental model uncertainty due to model effects, etc. Therefore, similar to the relative errors as defined by van Rijn et al. [75], a relative refined index of agreement d′r is proposed here which provides the performance of the numerical model relative to the experimental model uncertainty:
d r   =   { 1     M A E n u m     M A E r e x p c M A D   =   1     ( d r , n u m     d r , r e x p ) , M A E n u m     M A E r e x p     c M A D c M A D M A E n u m     M A E r e x p     1   =   ( d r , n u m     d r , r e x p )     1 , M A E n u m     M A E r e x p   >   c M A D
where the subscripts num and rexp indicate that the statistic is evaluated for the respective numerical and repeated experimental data, and c is again taken equal to 2. When the numerator MAEnum–MAErexp is negative (i.e., <0), the numerical error compared to the experiment is smaller than the experimental uncertainty, which means that the numerical model performance cannot be improved. In that case MAEnum–MAErexp = 0 is forced, so that d′r = 1. A classification of model performance based on ranges of d′r values and corresponding rating terminology is proposed in Table 2.
To obtain more insight into where the error of the model originates from, pattern statistical parameters are considered as well. They are here explained in terms of what they represent for a time series of η. The first additional statistical parameter is the standard deviation σ, which is a measure of the wave energy or wave height of a η time series. The normalised standard deviation is given by:
σ   =   σ p σ o
where σp and σo are the standard deviations of the predicted and observed time series, respectively. Another important statistical parameter is the bias B, given by:
B   =   P ¯     O ¯
The bias indicates whether the model under- or over-predicts the observation, but provides no further assurances on the accuracy of the model result. The bias represents the difference in wave setup between two η time series. It is normalised by the standard deviation of the observed time series:
B   =   B σ o
The correlation coefficient R, is defined by:
R   =   1 N i = 1 N ( P i     P ¯ ) ( O i     O ¯ ) σ p σ o
which is a measure of the phase similarity between two time series and the wave periods in the case of η time series.
The length of the time series used for the analysis is based on the duration of the generated bichromatic waves including tapering (i.e., 125 s), beginning at the first time step when the baseline is first significantly exceeded (i.e., indicating arrival of the first wave). Since the experimental and numerical time series have different sampling frequencies, the time series with the highest sampling frequency was interpolated to the time steps of the time series with the lowest sampling frequency.
For some locations where wetting and drying occurs (i.e., on the dike, promenade, and vertical wall), the measurement regularly returned to the baseline or zero-line meaning that as a bore passed by, reflected against the wall and ran back down the dike slope, intervals were created in the time series of (near-) zero values. Including these “non-event” times in the statistical analyses would bias the statistics by:
  • unnecessarily penalising the numerical model performance for an experimental measurement error. For example, in the experimentally measured and processed time series of p and Fx, often some residual instrumental noise or oscillations persisted during such non-event (or “dry”) times;
  • unnecessarily rewarding the model performance towards (almost) perfect agreement. For example, during the time between impacts no water reaches the wall and model performance would be perfect during such times (disregarding measurement noise).
It was therefore decided to focus the analysis on the event instances when the values of the time series (either experimental or numerical, to penalise phase differences or impacts not modelled by the numerical model) are larger than a certain threshold above the baseline. The threshold for each such time series is chosen to be as low as possible, but higher than the residual noise in the experiment.

3. Results

3.1. Time Series

The numerical model results are first compared qualitatively in the time domain to the experimental measurements of test EXP. The surface elevations η are compared in Figure 4, the horizontal velocity Ux on the promenade in Figure 5, and the total horizontal force Fx and pressures p on the vertical wall in Figure 6 and Figure 7, respectively.
The η time series compare very well between OF and EXP (Figure 4), especially at the beginning of the simulation, but more discrepancies start to show over time and further along the flume. Overall, frequency dispersion, the non-linear wave transformation processes (i.e., SW shoaling (Figure 4d), breaking (Figure 4e,f), energy transfer to the subharmonic bound LW (Figure 4d–f)), overtopping (Figure 4g), bore interactions, and reflection processes (Figure 4g–j) seem to be well-represented by OF.
The simulated Ux on top of the promenade appears to significantly underestimate the experimental measurements (Figure 5). This underestimation mostly disappears when using the OF depth-averaged velocity U ¯ x instead, which is done for the remainder of the validation. In addition, OF shows much better correspondence to the ECM than the PWs during return flow of a reflected bore (Ux < 0). This confirms that the PWs did not measure correct velocities during those instances (e.g., 57 s ≤ t ≤ 63 s in Figure 5b–c).
In terms of Fx and p on the vertical wall, OF generally reproduces the timing of the impact events, including the evolution over time (Figure 6 and Figure 7). However, the EXP time series peak values appear to be underestimated by OF for both Fx and p, and for a few impacts, the first dynamic impact peak is not entirely captured either (e.g., t = 82 s and 140 s). In the experiment, the lowest PSs were loaded more often than the PSs positioned higher up the vertical wall, because of different bore impact run-up heights. The lowest PSs also registered the highest values, indicating a mostly hydrostatic pressure distribution along the vertical wall [76]. Both these observations were reproduced by OF. Validation of the pressure distribution along the vertical wall is further investigated in Section 3.4.

3.2. Wave Characteristics

Based on the η time series the root mean square wave height Hrms is calculated in the time domain and represents a characteristic wave height and measure of the wave energy. The evolution of Hrms, the short- and long-wave components (i.e., Hrms,sw and Hrms,lw), and the mean surface elevation η ¯ or wave setup over the wave flume up to the toe of the dike are displayed in Figure 8. The experimental repeatability of Hrms appears to be near-perfect, since the EXP and REXP data points are almost indistinguishable. The OF results for these wave characteristics are available along the complete distance from the wave paddle until the toe of the dike location. The numerical results seem to follow the experiments very well, although some discrepancies can be seen. The total and SW wave heights (Hrms and Hrms,sw, respectively, in Figure 8) decrease in the OF result from the wave paddle up to the toe of the foreshore and underestimate the EXP wave height along this distance. Over the foreshore, the SWs start to shoal until their steepness becomes too high and, according to OF, start to break about 11 m from WG07 towards the dike. The location of incipient wave breaking (or decrease in Hrms), xb, cannot be validated with the experiment, because of insufficient wave gauges in the wave breaking zone. In any case, the EXP wave height increase due to shoaling (WG07) and decrease due to breaking (WG13–14) are reproduced well by OF. However, over the foreshore, OF slightly underestimates the wave amplitude. The experimental LW wave height (Hrms,lw in Figure 8) is slightly underestimated by OF in front of the wave paddle (WG02–WG04), and at the dike toe (WG14).
In terms of the wave setup η ¯ , the wave set-down observed in the experiment offshore from the foreshore toe is not reproduced by OF ( η ¯ OF remains close to zero). Further along the flume in the surf zone, however, η ¯ is better predicted by OF, showing a smaller overestimation.

3.3. Model Performance and Pattern Statistics

In this section, the model performance and pattern statics introduced in Section 2.3 are applied to obtain a quantitative numerical model performance evaluation. Table 3 and Table 4 provide the pattern and model performance statistics for all sensor locations along the flume up to the vertical wall. The evolution of dr and R at the WG locations along the wave flume up to the toe of the dike is visualised for ηSW (dr,sw and Rsw), ηLW (dr,lw and Rlw), and η (dr,tot and R) in Figure 9 and Figure 10 respectively, and of dr for η and Ux on the promenade in Figure 11.
The evolution of dr,tot along the flume is very similar for both REXP and OF (Figure 9 and Table 3): it remains constant until the shoaling zone (WG02–WG07), decreases over the surf zone (WG07–13), and increases back up to the dike toe (WG13–14). This indicates that the decreased experimental model repeatability of the surface elevation in the surf zone is at least part of the cause of the decreased numerical model performance. The relative model performance d′r for η is consequently fairly constant, corresponding to a model performance rating of Very Good, which remains consistently so up to the last sensor location in front of the vertical wall. Considering ηSW and ηLW separately reveals that dr,sw mostly follows the same trend as dr,tot, and that dr,lw,OF clearly has a different behaviour: dr,lw,OF is not as high as dr,sw,OF in front of the wave paddle (i.e., dr,lw,OF = ~0.70 and dr,sw,OF = ~0.85 at WG02–WG04), but steadily increases towards the dike toe, while dr,lw,rexp remains relatively constant, causing d′r to slightly increase as well.
The pattern statistics B* and σ* represent the accuracy of the respective wave setup and wave height from offshore until the dike toe and confirm the qualitative observations made in Section 3.2. However, spatial information about the accuracy of the numerical wave phase modelling was not included previously, and is shown separately here in Figure 10. The SW phase accuracy of OF decreases significantly over the surf zone (R = ~0.90 to ~0.60), while it increases for the LWs (R = ~0.85 to ~0.97). The total wave phase prediction accuracy of OF decreases at WG13 because it is located at a node of the standing long waves in front of the dike (Figure 8), thus Rsw has a higher weight in R there. Conversely, the dike toe (WG14) is located at an antinode, and therefore Rlw has higher weight in R than Rsw, leading to an increase of R again at the dike toe.
Along the promenade, the dr for η and Ux is shown in Figure 11 and at first sight seems to indicate that the OF model performance for Ux is much worse than that for η, primarily for comparisons with the PW measurements, but also for the ECM measurement. Taking into account the experimental uncertainty, however, the model performance rating for Ux of ECM is actually Very Good (d′r,ECM in Table 4), which is the same as the OF model performance rating for η on the promenade (d′r,WLDM01-04 in Table 3). For the PW measurements, the OF rating for Ux is still worse (Reasonable/Fair to Bad), but was explained before by the fact that the PW’s had faulty positive Ux measurements during return flow (Section 3.1).
Although the wave setup at the dike toe is overestimated by OF ( B W G 14 > 0), η on the promenade is on average underestimated ( B W L D M 01 04 < 0) as is Ux (B* < 0). Conversely, the bore wave height is well-represented on the promenade ( σ W L D M 01 04 = ~1.00), while the wave height is underestimated at the dike toe ( σ W G 14 = 0.89). The surface elevation phase difference between OF and EXP observed at the dike toe (RWG14 = 0.91) is carried over on the promenade (RWLDM01–04 = ~0.90), but higher phase differences are detected for Ux (RECM = 0.73).
Finally, the model performance in terms of p and Fx is evaluated at the vertical wall (Figure 12 and Table 5). Both REXP and OF show the highest model performance at the lowest pressure sensor location and a more or less linear decreasing model performance at PS locations higher along the vertical wall. The relative difference between the dr of REXP and OF increases more along the vertical wall, leading to a numerical model performance rating from Very Good for PS01–PS06, to Good for PS05–PS11, and finally to Reasonable/Fair at the highest PS locations (PS12–PS13) (Table 5). Considering that the bottom PSs registered the highest p values and are therefore the most determinative in the calculation of Fx, it follows that the numerical model performance for Fx is rated Very Good as well. The pattern statistics in Table 5 reveal the remaining numerical errors to be that p and Fx are generally underestimated by OF (i.e., B* < 0.00 and σ* <1.00) and that the impact events still slightly mismatch in time between OF and EXP (R < 1.00).

3.4. Bore Interactions and Impact

To explain some of the numerical successes and failures encountered in the reproduction of the experimental bore impacts on the vertical wall, a detailed analysis is done of a selection of individual impact events and the bore interactions leading up to them. The analysis is based on an investigation of snapshots at important time instants during the first two largest impact events in the modelled time series (Figure 7). The first (t = ~56 s) and second (t = ~82 s) main impact events are chosen because they are good examples of a respective successful and less successful numerical reproduction of the experimental impacts.
Numerical snapshots of the flow on the dike, including the velocity distribution along the vertical cross-section at the ECM location or the pressure distribution along the vertical wall, are compared in Figure 13 and Figure 14 to the equivalent experimental data and snapshots based on side and top view video images. Key time instants of overtopped bore behaviour are selected during these two main impacts and are listed chronologically in Table 6. Some of the key time instants occur at slightly different times in each model (due to slight wave phase differences). In those cases, the key time instants were selected from each model result based on identifiable features in the bore interaction images, the Ux time series or the Fx time series (e.g., peaks, troughs, …), making sure a relevant comparison is made of the bore interaction and the velocity or pressure profile.
The first series of impacts mainly occurred while the LWs overtopped and reflected on the dike-wall structure for the first time. A good indication of this time period is when η at the dike toe (Figure 4f) was larger than the freeboard (i.e., 47 s ≤ t ≤ 70 s). During the LW overtopping/reflection, several SWs propagated on top of the LW crest, overtopped the dike, and impacted the vertical wall along with the LWs; after a very small first overtopped bore (t = ~48 s in Figure 6), a second larger bore impacted and reflected on the vertical wall (t = ~52.5 s). While the reflected second bore returned seawards, a third small wave overtopped and headed towards the vertical wall (Figure 13a, termed “sequential overtopping bore pattern” by Streicher et al. [75]). This small wave then reflected against the vertical wall, while a very large turbulent bore overtopped the dike crest (Figure 13b). At that moment the small wave and large bores were propagating in opposite directions on the promenade. Eventually they collided, and the larger incident turbulent bore was forced to overturn (Figure 13c). This collision also caused spray to be ejected at a high velocity from the overturning wave tongue (see (x, z) = (178.3 m, 4.9 m) in Figure 13c). This airborne water volume hit the vertical wall first and separately from the main overturning wave tongue (see (x, z) = (178.5 m, 4.95 m) in Figure 13d), causing a local pressure peak at the location of PS10 (see the p-profile in Figure 13d). Subsequently, the main overturning wave hit the wall, causing a dynamic force peak Fx,1 (Figure 13e), and ran vertically up the wall temporarily reducing Fx during maximum run-up (not shown). The following run-down and reflection from the wall correspond to a second force peak Fx,2, this time of quasi-static nature (Figure 13f). This type of bore interaction was called a “plunging breaking bore pattern” by Streicher et al. [75], which (in this case) caused a quasi-static impact (Fx,1/Fx,2 < 1.20, according to Streicher et al. [75]). This is valid for both the experiment and the numerical model result, indicating that OF was able to reproduce these processes leading to a very similar shape of the pressure distribution along the vertical wall (see pressure profiles in Figure 13d–f) and time evolution of Fx (see time series graph insets in Figure 13d–f). Comparing Ux,ECM from EXP with the velocity profile from OF at the ECM location (see velocity profiles in Figure 13a–c) reveals that OF locally, but consistently underestimated Ux at the vertical measurement position of the ECM, which was also observed in Figure 5b.
The second series of impacts occurred during the second LW overtopping and reflection event (Figure 4f–j: 74 s ≤ t ≤ 100 s). Again, SWs propagated on top of the LW crest, bringing bore interactions to the promenade. This time, however, the bore interaction pattern modelled by OF that caused the main impact was different from the pattern observed in EXP. First, a very small bore overtopped the dike crest and was immediately followed by a much larger bore. In EXP, the smaller bore was overtaken by the larger bore (Figure 14b–c, termed “catch-up bore pattern” by Streicher et al. [75]), leading to a quasi-static impact. In the result from OF, however, the very small wave overtopped sooner (Figure 14a), so that it had time to reflect against the wall (Figure 14b) before colliding with the incoming larger bore (not shown). OF therefore modelled a collision bore pattern instead of a catch-up bore pattern, greatly reducing the first impact force peak of the main impact (by ~65% compared to EXP, Figure 14c). This also clearly affected the pressure profiles along the vertical wall: during the first Fx peak, p is severely underestimated, but the distribution is still similar, with a local peak at PS04. The p-profiles differentiate more at the Fx peak of the OF result (Figure 14d) and at the quasi-static Fx peak in the EXP result (Figure 14e). In the experiment, a quasi-hydrostatic pressure profile was measured, at both those time instants. In the OF result, however, a pressure peak is found at PS06, caused by a vortex formed at the foot of the vertical wall upon which a strong flow impinged on the wall at that location. After reflection of the bore, both models correspond again, showing a hydrostatic pressure profile along the wall (Figure 14f).

4. Discussion

4.1. Wave Transformation Processes Until the Dike Toe

In Section 3.1 and Section 3.2 it was already established that OF is capable of reproducing the wave shoaling and breaking processes in terms of evolutions in η and Hrms. This section discusses the processes related to the LW transformations over the foreshore as modelled by OF and their correspondence to observations in EXP.
The modulation factor βm of the SWs is high for the considered bichromatic wave conditions (Table 1), indicating that the incident-bound LW amplitude was relatively high as well. Furthermore, the normalised bed slope parameter βb can be calculated [37]:
β b = h x ω g h b
where hx is the foreshore slope (= 1:35), ω is the radial frequency of the bound LW (= 2π(f1f2)), g the gravitational acceleration, and hb a characteristic breaking depth (= 2.12 m at xb = 115 m). A value of 0.28 is obtained, which means that the bound LW shoaling had a mild slope regime (βb < 0.3), so that the growth rate of the incoming LWs was much higher than that given by Green’s Law (conservative shoaling), indicating significant energy transfer from the primary SWs to the bound LW [77]. Additionally, in a mild-slope regime, LW shoreline dissipation and shoreline reflection are high and low, respectively [37]. However, the beach considered here is not a beach by itself, but acts as a foreshore to a steep-sloped dike. Consequently, no such expected decrease in LW energy towards the shoreline is observed (i.e., Hrms,lw in Figure 8). Indeed, the dike was positioned in the shoaling zone of the long waves, thereby preventing the LWs from breaking. Instead, LWs reflected against the dike, indicated by the oscillations of Hrms,lw towards the dike in the OF result, which implies the presence of a (partial) standing wave system. Wave gauges WG13 in the inner surf zone and WG14 at the dike toe were positioned at a node and anti-node of this standing wave system. This is also clearly visible in the η time series plot, where ηLW is much closer to zero at WG13 (Figure 4e) than at WG14 (Figure 4f). In the surf zone the LW previously bound to the wave group became a free wave, traveling at its own wave celerity. Due to first-order wave generation at the boundary, other spurious free LWs were generated as well at the wavemaker and propagated as free waves towards the dike [78]. During a standing LW crest at the dike toe, the LWs themselves overtopped the dike (i.e., when η > freeboard Rc = 0.117 m, Figure 4f) thereby temporarily aiding several breaking SWs to overtop the crest of the dike (the wave length of the free LWs was more than five times longer than the primary SW components in the inner surf zone). These results have illustrated OF’s ability to reproduce the wave energy transfer to the subharmonics and LW transformations over the foreshore until the dike toe. All these observations also confirm that the contribution of LWs to the processes on the dike, including the wave impact loading on the vertical wall, is very important in the case that is considered here.

4.2. Importance of Differences in Wave Generation Methods

Although the overall OF model performance was rated to be Very Good, a few differences between the OF and EXP results remain to be explained. One of the largest OF inaccuracies was an underestimation of the wave height, primarily observed at the offshore WG locations (WG02–WG04, see Figure 8 and Table 3), suggesting an underestimation of the incident wave energy and/or numerical diffusion. The underestimation was likely caused by differences between the numerical wave generation method with static boundary in OF and the physically moving wave paddle in the EXP [69]. The wave boundary condition by olaFlow allows for a tuning factor to be applied to Ux and η at the boundary, to overcome a possible underestimation of the incident wave height. Such a calibration of the OF model (with a tuning factor of 1.13) was found to solve the underestimation of the wave height (not shown), but introduced or exacerbated other errors, finally leading to lower values of dr and decreased model performance ratings for Ux,ECM and Fx.
Another remaining discrepancy between OF and EXP is found in η ¯ , which was primarily overestimated by OF in the offshore region (Figure 8). Also, after calibration of the incident wave height to EXP, Hrms (and consequently η ¯ ) increased in the surf zone, exacerbating the η ¯ overestimation there (not shown). The root cause of this difference is likewise related to the different wave generation methods applied in EXP and OF. In the experimental wave flume, the finite body of water and conservation of mass caused water mass to be redistributed from offshore to the surf zone during build-up of the wave setup, thereby causing a lowering of the mean water level in the offshore region. This process developed differently in OF because of the static boundary condition including AWA. The AWA assures a constant mean water level at the boundary [8,53], meaning that a net water mass is added to the computational domain until a quasi-steady state is achieved when wave setup is fully developed [55]. In this case, OF’s method is closer to the field condition, where generally a large enough body of water is available to supply water mass for the wave setup to develop without noticeably lowering the offshore mean water level. Nevertheless, in the context of the validation, this difference in η ¯ is the cause of many of the remaining inaccuracies in the OF result compared to EXP, because the waves propagated in slightly different mean water depths, which affected the non-linear wave-wave interactions and wave phases in the surf zone. Consequently, it is believed to be the root cause of the strong decrease of Rsw observed in the surf zone (i.e., locations WG13–14 in Figure 10).
These two remaining inaccuracies in the OF results compared to EXP (i.e., underestimation of Hrms and overestimation of η ¯ ) are both attributable to the differences in wave generation methods applied. Although an overall Very Good model performance rating was achieved by OF, it is expected that even better results can be obtained by applying a closed dynamic wave boundary condition in OF, which mimics the EXP wave paddle movement. However, application of the dynamic boundary condition of olaFlow proved to be highly unstable for the present case, and no result was achieved to confirm this hypothesis.

4.3. OF Model Performance for Impacts on a Dike-Mounted Vertical Wall

The accuracy of a numerical wave model to reproduce wave overtopping over a dike with a very shallow foreshore depends on the quality of the incident waves at the dike toe location [10]. The same should therefore hold true for impacts on a dike-mounted vertical wall by such overtopped waves.
The overall Very Good model performance of OF in terms of p and Fx at the vertical wall can be explained by a generally correct reproduction of bore interactions over the promenade of the dike. Conversely, discrepancies (even small ones) in bore interactions between OF and EXP can lead to significant differences in the impact type on the vertical wall, and consequently in p and Fx (Section 3.4). In addition, the much lower values of B O F and ROF compared to B R E X P and RREXP for Ux,ECM (i.e., B R E X P = −0.02 and RREXP = 0.87, B O F = −0.25 and ROF = 0.73 in Table 4) indicate an important contribution of the underestimation of Ux and of phase differences in Ux between OF and EXP to the remaining errors in the impact prediction by OF. The bore interactions on their part depend on the wave conditions at the dike toe location. This is illustrated by the calibrated OF model results, which were found to improve the wave height reproduction at the dike toe compared to the OF model (Section 4.2), while errors increased for the wave setup and wave phases at the dike toe location, leading to a lower model performance for the processes on the dike (not shown).
Even when the incident wave conditions at the dike toe would be perfectly reproduced, other model limitations would still contribute to residual errors in the numerical results for the wave impacts on the vertical wall:
  • 3D effects in EXP (i.e., irregular and oblique wave fronts, wave breaking-induced 3D vortex formation), which are unreproducible by a 2DV RANS model;
  • Water-air mixing in bores and air pressure fluctuations in entrained air pockets by overturning wave impacts on the wall, which are both processes not resolved by a multiphase numerical model of two incompressible and immiscible fluids.
  • The applied VOF method, which is known to smear the water-air interface over several grid cells and to cause high spurious velocities in the air phase [45]. These limitations may be (partially) overcome by applying the following recent developments:
    o
    An alternative geometric VOF method, isoAdvector, has been developed to obtain a sharper interface [79,80], specifically with applications for marine science and engineering in mind [46]. However, the sharper interface may lead to a larger error in the velocity near the water surface [45] and the method is currently mainly tested and validated for wave propagation, but not yet for wave breaking, overtopping, and wave impact, all processes essential for this study.
    o
    Spurious velocities may be avoided by implementing, e.g., the ghost fluid method [81], although such an implementation is currently not available in any of the open source OpenFOAM versions.
  • The turbulence model, which has been carefully chosen as the state-of-the-art (Section 2.2.1), but is still limited by its inherent assumptions.
  • Douglas and Nistor [82] have shown that (compared to a dry-bed condition) a bore propagating over a thin layer of water on the bed (i.e., wet-bed condition) can substantially increase the steepness and depth of the bore-front and consequently affect the impact of the bore on the wall. The near-bed resolution of the OF grid along the promenade might not have been able to correctly reproduce wet-bed bore propagation in cases of a very thin layer of water, possibly even modelling a dry-bed bore propagation instead.
  • Differences between OF and EXP in the treatment of friction on the bed of the promenade. The no-slip boundary condition and applied wall function in OF modelled a boundary layer, which lowered Ux close to the bed more than was measured in EXP. On average, Ux was underestimated by OF at the measurement locations of the PWs and ECM close to the promenade bed (Figure 5, B* in Table 4 and Figure 13a–c).
Errors in the reproduction of the impact type and the first two model limitations listed above are also apparent in the numerical reproduction of the pressure distribution along the vertical wall: higher up the wall a decreasing OF model performance rating of p was observed (Figure 12, Table 5). The highest PS locations are the most sensitive to errors in the impact and run-up patterns along the vertical wall and to overly simplified water-air mixture modelling.

5. Conclusions

A RANS multiphase solver for two incompressible and immiscible fluids (water and air), interFoam of OpenFOAM® with olaFlow wave boundary conditions (OF), was applied in 2DV for bichromatic wave transformations over a cross-section of a hybrid beach-dike coastal defence system, consisting of a steep-sloped dike with a mildly-sloped and very shallow foreshore, and finally wave impact on a vertical wall. OF was not validated before in this context, where (prior to impact) waves undergo many nonlinear transformations and interact with a dike slope and promenade. A large-scale experiment of bichromatic waves and its repetition were selected for this validation. The repeated test allowed us to assess the accuracy of the measurements, uncertainty due to model effects, and variability due to stochastic processes in the experiment.
The validation consisted of both qualitative and quantitative comparisons. Pattern and model performance statistics were employed for the quantitative validation. Based on Willmott’s refined index of agreement dr, calculated for OF and the repeated test REXP with reference to the first test EXP, a relative refined index of agreement dr was proposed, which takes the experimental uncertainty, derived from REXP, into account in the numerical model performance evaluation. Based on value ranges of dr, a classification into model performance ratings was proposed as well.
After a convergence analysis of the most important numerical parameters (i.e., grid resolution and CFL number), and without calibration of the numerical model, a model performance rating of Very Good was achieved by OF compared to the experiment for all relevant design parameters (i.e., η, Ux, p, and Fx), which demonstrates OF’s applicability for the design of such hybrid coastal defence systems. Remaining discrepancies were found to be mainly caused by the different wave generation methods applied in OF (static boundary) and EXP (moving wave paddle), which caused an underestimation of the incident wave energy and an overestimation of the wave setup in OF compared to EXP. Consequently, when applying OF for a design of a hybrid coastal defence system, the incident wave energy is recommended to be calibrated, while the wave setup development for a static boundary condition with AWA in OF is actually closer to the field condition compared to EXP (finite water mass).
A detailed comparison of snapshots at key time instants of bore interactions leading up to two selected bore impacts on the vertical wall revealed that slight errors in wave phases can lead to very different bore interaction patterns on the promenade and finally to different bore impact types on the wall.
Future work includes a detailed inter-model comparison between the OF model presented here, a weakly compressible SPH model (DualSPHysics), and a non-hydrostatic wave model (SWASH) for the same case [65].

Author Contributions

Conceptualization, V.G., C.A., T.S. and P.T.; methodology, V.G.; validation, V.G. and M.S.; formal analysis, V.G.; investigation, V.G., C.A., T.S., M.S. and L.C.; resources, P.T.; data curation, V.G., M.S. and L.C.; writing—original draft preparation, V.G.; writing—review and editing, V.G., C.A., T.S., M.S., L.C., A.K. and P.T.; visualization, V.G. and M.S.; supervision, P.T. and A.K.; project administration, P.T.; funding acquisition, P.T. and A.K. All authors have read and agreed to the published version of the manuscript.

Funding

This research was part of the CREST (Climate REsilient CoaST) project (http://www.crestproject.be/en), funded by the Flemish Agency for Innovation by Science and Technology, grant number 150028. The work described in this section was supported by the European Community’s Horizon 2020 Research and Innovation Programme through the grant to HYDRALABPLUS, Contract no. 654110. C.A. acknowledges funding from the European Union’s Horizon 2020 research and innovation programme under the Marie Sklodowska-Curie, grant number 792370.

Conflicts of Interest

The authors declare no conflict of interest. The funders had no role in the design of the study; in the collection, analyses, or interpretation of data; in the writing of the manuscript, or in the decision to publish the results.

Appendix A. Numerical Convergence Analysis

The OF result is influenced by many of its settings, of which the spatial discretisation of the model domain and time stepping are the most important [45]. Their convergence analysis is presented here. The numerical model convergence analysis is based on η at the experimental wave gauge locations over the wave flume up to the dike toe, since it is the most important driver of model performance of the subsequent processes on the dike. The wave force at the vertical wall is not suitable as reference for the grid convergence analysis, because relatively small differences in wave phase can cause very different types of bore interactions on the promenade and therefore very different resulting bore impacts (Section 3.4).

Appendix A1. Model Convergence Statistics

For the convergence analysis, four customised statistical error indicators are considered, among which the first three are defined to reflect several aspects of the η time series considered (i.e., wave setup, wave height and wave phase):
• Freeboard normalised bias, NB:
N B = B R c
in which Rc is the freeboard, and B is the bias defined by (7). The bias or difference in the wave setup is normalised with the freeboard which is one of the governing parameters for waves overtopping a dike [83].
• Residual error of the normalised standard deviation, RNSD:
R N S D =   1 σ
in which σ* is given by (6) and in which the observed time series is the reference time series and the predicted time series is the considered time series. A positive RNSD signifies a higher wave height and a negative RNSD signifies a lower wave height compared to the reference.
• Residual error of the correlation coefficient, RCC:
R C C = 1 R
in which R is the correlation coefficient, given by (9), between the reference time series and time series of interest. Lower RCC values indicate better phase correspondence of the considered time series to the reference.
• Normalised mean absolute error, NMAE, given by:
N M A E = M A E O m a x O m i n × 100 %
in which MAE is the mean absolute error, given by (3), and Omax and Omin are the respective maximum and minimum values of the reference time series.
The closer these statistics are to zero, the lower the difference between the considered and reference time series.

Appendix A2. Convergence Analyses

The grid convergence analysis varies the refinement level in the surface elevation zone βsez up to the dike toe (i.e., βsez = 0, 1, 2, 3; Figure 3) and uses the mesh with the highest level (i.e., βsez = 3 or Δx = Δz = 0.0225 m) as the reference to which the other (coarser) resolution simulations are compared to. Convergence is achieved when no other significant changes are observed compared to a finer grid resolution model. The time stepping convergence analysis uses the run with the lowest maxCo number (i.e., maxCo = 0.15) as the reference to which other temporally coarser simulations (i.e., maxCo = 0.45, 0.25) are compared to. The statistical error indicators from Section A1 are provided in Figure A1 and Figure A2. All errors are close to or less than 5% at the toe of the dike for βsez = 2 (i.e., Δx = Δz = 0.045 m) and maxCo = 0.25. Even though maxCo = 0.45 does not show much higher errors than a value of 0.25, maxCo = 0.25 was preferred, because higher maxCo simulations were found to be prone to numerical instabilities. In any case, as long as the maxCo number cannot be defined separately for the air and water phases, the time step is mostly determined by the high spurious velocities that occur at the water-air interface. Because these spurious velocities are much higher (2–3 times) than the velocities in the water phase, much lower Courant numbers are actually obtained in the water phase [46]. This also explains why only limited differences between the tested maxCo values are observed here.
Moreover, the NMAE shows in both cases a similar value at the toe of the dike (WG14) to that of the ~3% obtained between EXP and REXP. The remaining numerical error is therefore assumed acceptable, and the mesh resolution and time stepping can be considered sufficiently converged for those settings (βsez = 2; maxCo = 0.25).
Figure A1. OF model grid resolution convergence analysis of the η time series at the WG locations along the flume up to the dike toe (WG14) based on (a) the normalised bias, (b) the residual normalised standard deviation, (c) the residual correlation coefficient, and (d) the normalised mean-absolute-error. The reference is the finest mesh with a refinement level in the surface elevation zones βsez of 3.
Jmse 08 00650 g0a1aJmse 08 00650 g0a1b
Figure A2. OF model time step convergence analysis based on maxCo for the mesh with βsez = 2. The reference is the lowest maximum Courant number applied (maxCo = 0.15). See caption of Figure A1 for the description of (a–d).
Jmse 08 00650 g0a2

References

  1. IPCC. The Ocean. and Cryosphere in a Changing Climate. In IPCC Special Report on the Ocean and Cryosphere in a Changing Climate; IPCC: Geneva, Switzerland, 2019. [Google Scholar]
  2. Van Doorslaer, K.; Romano, A.; De Rouck, J.; Kortenhaus, A. Impacts on a storm wall caused by non-breaking waves overtopping a smooth dike slope. Coast. Eng. 2017, 120, 93–111. [Google Scholar] [CrossRef]
  3. De Finis, S.; Romano, A.; Bellotti, G. Numerical and laboratory analysis of post-overtopping wave impacts on a storm wall for a dike-promenade structure. Coast. Eng. 2020, 155, 103598. [Google Scholar] [CrossRef]
  4. Chen, X.; Hofland, B.; Uijttewaal, W. Maximum overtopping forces on a dike-mounted wall with a shallow foreshore. Coast. Eng. 2016, 116, 89–102. [Google Scholar] [CrossRef]
  5. Streicher, M.; Kortenhaus, A.; Gruwez, V.; Hofland, B.; Chen, X.; Hughes, S.; Hirt, M. Prediction of Dynamic and Quasi-static Impacts on Vertical Sea Walls Caused by an Overtopped Bore. Coast. Eng. 2018. [Google Scholar] [CrossRef] [Green Version]
  6. Gruwez, V.; Vandebeek, I.; Kisacik, D.; Streicher, M.; Verwaest, T.; Kortenhaus, A.; Troch, P. 2D overtopping and impact experiments in shallow foreshore conditions. In Proceedings of the 36th Conference on Coastal Engineering, Baltimore, MD, USA, 30 July–3 August 2018; pp. 1–13. [Google Scholar]
  7. Xiao, H.; Huang, W.; Tao, J. Numerical modeling of wave overtopping a levee during Hurricane Katrina. Comput. Fluids 2009, 38, 991–996. [Google Scholar] [CrossRef]
  8. Torres-Freyermuth, A.; Lara, J.L.; Losada, I.J. Numerical modelling of short- and long-wave transformation on a barred beach. Coast. Eng. 2010, 57, 317–330. [Google Scholar] [CrossRef]
  9. Altomare, C.; Crespo, A.J.C.; Domínguez, J.M.; Gómez-Gesteira, M.; Suzuki, T.; Verwaest, T. Applicability of Smoothed Particle Hydrodynamics for estimation of sea wave impact on coastal structures. Coast. Eng. 2015, 96, 1–12. [Google Scholar] [CrossRef]
  10. Suzuki, T.; Altomare, C.; Veale, W.; Verwaest, T.; Trouw, K.; Troch, P.; Zijlema, M. Efficient and robust wave overtopping estimation for impermeable coastal structures in shallow foreshores using SWASH. Coast. Eng. 2017, 122, 108–123. [Google Scholar] [CrossRef]
  11. Altomare, C.; Tagliafierro, B.; Dominguez, J.M.; Suzuki, T.; Viccione, G. Improved relaxation zone method in SPH-based model for coastal engineering applications. Appl. Ocean. Res. 2018, 81, 15–33. [Google Scholar] [CrossRef]
  12. Violeau, D. Fluid Mechanics and the SPH Method: Theory and Applications; Oxford University Press: New York, NY, USA, 2012; ISBN 978-0-19-965552-6. [Google Scholar]
  13. Oñate, E.; Celigueta, M.A.; Idelsohn, S.R.; Salazar, F.; Suárez, B. Possibilities of the particle finite element method for fluid–soil–structure interaction problems. Comput. Mech. 2011, 48, 307. [Google Scholar] [CrossRef]
  14. Didier, E.; Neves, D.R.C.B.; Martins, R.; Neves, M.G. Wave interaction with a vertical wall: SPH numerical and experimental modeling. Ocean. Eng. 2014, 88, 330–341. [Google Scholar] [CrossRef]
  15. St-Germain, P.; Nistor, I.; Townsend, R.; Shibayama, T. Smoothed-Particle Hydrodynamics Numerical Modeling of Structures Impacted by Tsunami Bores. J. Waterw. Port. Coast. Ocean Eng. 2014, 140, 66–81. [Google Scholar] [CrossRef]
  16. Domínguez, J.M.; Altomare, C.; Gonzalez-Cao, J.; Lomonaco, P. Towards a more complete tool for coastal engineering: Solitary wave generation, propagation and breaking in an SPH-based model. Coast. Eng. J. 2019, 61, 15–40. [Google Scholar] [CrossRef]
  17. Subramaniam, S.P.; Scheres, B.; Schilling, M.; Liebisch, S.; Kerpen, N.B.; Schlurmann, T.; Altomare, C.; Schüttrumpf, H. Influence of Convex and Concave Curvatures in a Coastal Dike Line on Wave Run-up. Water 2019, 11, 1333. [Google Scholar] [CrossRef] [Green Version]
  18. Mokos, A.; Rogers, B.D.; Stansby, P.K. A multi-phase particle shifting algorithm for SPH simulations of violent hydrodynamics with a large number of particles. J. Hydraul. Res. 2017, 55, 143–162. [Google Scholar] [CrossRef] [Green Version]
  19. Torres-Freyermuth, A.; Losada, I.J.; Lara, J.L. Modeling of surf zone processes on a natural beach using Reynolds-Averaged Navier-Stokes equations. J. Geophys. Res. 2007, 112, C09014. [Google Scholar] [CrossRef]
  20. Higuera, P.; Lara, J.L.; Losada, I.J. Simulating coastal engineering processes with OpenFOAM®. Coast. Eng. 2013, 71, 119–134. [Google Scholar] [CrossRef]
  21. Ingram, D.M.; Gao, F.; Causon, D.M.; Mingham, C.G.; Troch, P. Numerical investigations of wave overtopping at coastal structures. Coast. Eng. 2009, 56, 190–202. [Google Scholar] [CrossRef]
  22. An, M.H.; Jiang, Q.; Zhang, C.K. Simulation of wave propagation on sloping seadike. In Proceedings of the Proceedings 2013 International Conference on Mechatronic Sciences, Electric Engineering and Computer (MEC), Shengyang, China, 20–22 December 2013; pp. 2505–2509. [Google Scholar]
  23. Kleefsman, K.M.T.; Fekken, G.; Veldman, A.E.P.; Iwanowski, B.; Buchner, B. A Volume-of-Fluid based simulation method for wave impact problems. J. Comput. Phys. 2005, 206, 363–393. [Google Scholar] [CrossRef] [Green Version]
  24. Wenneker, I.; Wellens, P.; Gervelas, R. Volume-of-fluid model comflow simulations of wave impacts on a dike. Coast. Eng. Proc. 2011, 1, 17. [Google Scholar] [CrossRef]
  25. Vanneste, D.F.A.; Altomare, C.; Suzuki, T.; Troch, P.; Verwaest, T. Comparison of numerical models for wave overtopping and impact on a sea wall. Coast. Eng. Proc. 2014, 1, 5. [Google Scholar] [CrossRef] [Green Version]
  26. Xie, P.; Chu, V.H. The forces of tsunami waves on a vertical wall and on a structure of finite width. Coast. Eng. 2019, 149, 65–80. [Google Scholar] [CrossRef]
  27. Wemmenhove, R.; Luppes, R.; Veldman, A.E.P.; Bunnik, T. Numerical simulation of hydrodynamic wave loading by a compressible two-phase flow method. Comput. Fluids 2015, 114, 218–231. [Google Scholar] [CrossRef] [Green Version]
  28. Liu, S.; Gatin, I.; Obhrai, C.; Ong, M.C.; Jasak, H. CFD simulations of violent breaking wave impacts on a vertical wall using a two-phase compressible solver. Coast. Eng. 2019, 154, 103564. [Google Scholar] [CrossRef]
  29. Streicher, M.; Kortenhaus, A.; Altomare, C.; Gruwez, V.; Hofland, B.; Chen, X.; Marinov, K.; Scheres, B.; Schüttrumpf, H.; Hirt, M.; et al. WALOWA (WAve LOads on WAlls): Large-Scale Experiments in the Delta Flume. In Proceedings of the International Short Course and Conference on Applied Coastal Research (SCACR), Santander, Spain, 3–6 October 2017; pp. 69–80. [Google Scholar]
  30. Streicher, M.; Kortenhaus, A.; Hughes, S.; Hofland, B.; Suzuki, T.; Altomare, C.; Marinov, K.; Chen, X.; Cappietti, L. Non-Repeatability, Scale- and Model Effects in Laboratory Measurement of Impact Loads Induced by an Overtopped Bore on a Dike Mounted Wall. In Proceedings of the ASME 2019 38th International Conference on Ocean, Offshore and Arctic Engineering, Glasgow, Scotland, UK, 9–14 June 2019; p. 10. [Google Scholar]
  31. Kortenhaus, A.; Streicher, M.; Gruwez, V.; Altomare, C.; Hofland, B.; Chen, X.; Marinov, K.; Vanneste, D.; Willems, M.; Suzuki, T.; et al. WALOWA (WAve LOads on WAlls)—Large-scale Experiments in the Delta Flume on Overtopping Wave Loads on Vertical Walls [Dataset]. Zenodo. 2019. Available online: http://doi.org/10.5281/zenodo.2843140 (accessed on 24 May 2019).
  32. Saponieri, A.; Risio, M.D.; Pasquali, D.; Valentini, N.; Aristodemo, F.; Tripepi, G.; Celli, D.; Streicher, M.; Damiani, L. Beach profile evolution in front of storm seawalls: A physical and numerical study. Coast. Eng. 2018, 70. [Google Scholar] [CrossRef]
  33. Streicher, M.; Kortenhaus, A.; Gruwez, V.; Suzuki, T.; Altomare, C.; Saponieri, A.; Pasquali, D.; Valentini, N.; Tripepi, G.; Celli, D.; et al. Overtopped wave loads on walls (WALOWA)—Numerical and physical modelling of large-scale experiments in the delta flume. In Proceedings of the Hydralab+ Joint User Meeting, Bucharest, Romania, 22–23 May 2019; pp. 57–67. [Google Scholar]
  34. Battjes, J.A. Surf similarity. Coast. Eng. Proc. 1974, 1, 26. [Google Scholar] [CrossRef]
  35. Hofland, B.; Chen, X.; Altomare, C.; Oosterlo, P. Prediction formula for the spectral wave period Tm-1,0 on mildly sloping shallow foreshores. Coast. Eng. 2017, 123, 21–28. [Google Scholar] [CrossRef] [Green Version]
  36. Mansard, E.P.; Funke, E.R. The measurement of incident and reflected spectra using a least squares method. Coast. Eng. Proc. 1980, 1. [Google Scholar] [CrossRef] [Green Version]
  37. van Dongeren, A.R.; Battjes, J.; Janssen, T.; van Noorloos, J.; Steenhauer, K.; Steenbergen, G.; Reniers, A. Shoaling and shoreline dissipation of low-frequency waves. J. Geophys. Res. 2007, 112, C02011. [Google Scholar] [CrossRef] [Green Version]
  38. Cappietti, L.; Simonetti, I.; Esposito, A.; Streicher, M.; Kortenhaus, A.; Scheres, B.; Schuettrumpf, H.; Hirt, M.; Hofland, B.; Chen, X. Large-Scale Experiments of Wave-Overtopping Loads on Walls: Layer Thicknesses and Velocities. In Proceedings of the ASME 2018 37th International Conference on Ocean, Offshore and Arctic Engineering, Madrid, Spain, 17–22 June 2018; p. V07AT06A028. [Google Scholar]
  39. Streicher, M. Loads Induced by Overtopping Bores on Vertical Walls at the end of Sea Facing Promenades: A Laboratory Study. Ph.D. Thesis, Ghent University, Gent, Belgium, 2019. [Google Scholar]
  40. Jacobsen, N.G.; van Gent, M.R.A.; Capel, A.; Borsboom, M. Numerical prediction of integrated wave loads on crest walls on top of rubble mound structures. Coast. Eng. 2018, 142, 110–124. [Google Scholar] [CrossRef]
  41. De Rouck, J.; Trouw, K. Masterplan Kustveiligheid—Evaluatie Toelaatbaar Overtoppingsdebiet; MDK—Afdeling Kust & Flanders Hydraulics Research: Antwerpen, Belgium, 2019. [Google Scholar]
  42. OpenFOAM Foundation. OpenFOAM: The OpenFOAM Foundation. Available online: https://openfoam.org/ (accessed on 6 August 2019).
  43. Berberović, E.; van Hinsberg, N.P.; Jakirlić, S.; Roisman, I.V.; Tropea, C. Drop impact onto a liquid layer of finite thickness: Dynamics of the cavity evolution. Phys. Rev. E 2009, 79, 036306. [Google Scholar] [CrossRef] [PubMed]
  44. Deshpande, S.S.; Anumolu, L.; Trujillo, M.F. Evaluating the performance of the two-phase flow solver interFoam. Comput. Sci. Disc. 2012, 5, 014016. [Google Scholar] [CrossRef]
  45. Larsen, B.E.; Fuhrman, D.R.; Roenby, J. Performance of interFoam on the simulation of progressive waves. Coast. Eng. J. 2019, 0, 1–21. [Google Scholar] [CrossRef] [Green Version]
  46. Roenby, J.; Larsen, B.E.; Bredmose, H.; Jasak, H. A new volume-of-fluid method in OpenFOAM. In Proceedings of the VII International Conference on Computational Methods in Marine Engineering, Nantes, France, 15–17 May 2017. [Google Scholar]
  47. Brown, S.A.; Greaves, D.M.; Magar, V.; Conley, D.C. Evaluation of turbulence closure models under spilling and plunging breakers in the surf zone. Coast. Eng. 2016, 114, 177–193. [Google Scholar] [CrossRef] [Green Version]
  48. Devolder, B.; Troch, P.; Rauwoens, P. Performance of a buoyancy-modified k-ω and k-ω SST turbulence model for simulating wave breaking under regular waves using OpenFOAM®. Coast. Eng. 2018, 138, 49–65. [Google Scholar] [CrossRef] [Green Version]
  49. Larsen, B.E.; Fuhrman, D.R. On the over-production of turbulence beneath surface waves in Reynolds-averaged Navier–Stokes models. J. Fluid Mech. 2018, 853, 419–460. [Google Scholar] [CrossRef] [Green Version]
  50. Martins, K.; Blenkinsopp, C.E.; Almar, R.; Zang, J. The influence of swash-based reflection on surf zone hydrodynamics: A wave-by-wave approach. Coast. Eng. 2017, 122, 27–43. [Google Scholar] [CrossRef] [Green Version]
  51. Karagiannis, N.; Karambas, T.; Koutatis, C. Wave overtopping numerical simulation using OpenFoam. In Proceedings of the E-Proceedings of the 36th IAHR World Congress, The Hague, The Netherlands, 28 June–3 July 2015. [Google Scholar]
  52. Raby, A.; Jayaratne, R.; Bredmose, H.; Bullock, G. Individual violent wave-overtopping events: Behaviour and estimation. J. Hydraul. Res. 2019, 1–13. [Google Scholar] [CrossRef]
  53. Higuera, P.; Lara, J.L.; Losada, I.J. Realistic wave generation and active wave absorption for Navier–Stokes models: Application to OpenFOAM®. Coast. Eng. 2013, 71, 102–118. [Google Scholar] [CrossRef]
  54. Higuera, P. phicau/olaFlow: CFD for waves. Zenodo 2018. [Google Scholar] [CrossRef]
  55. Jacobsen, N.G.; Fuhrman, D.R.; Fredsøe, J. A wave generation toolbox for the open-source CFD library: OpenFoam®. Int. J. Numer. Meth. Fluids 2012, 70, 1073–1088. [Google Scholar] [CrossRef]
  56. Vyzikas, T.; Stagonas, D.; Buldakov, E.; Greaves, D. The evolution of free and bound waves during dispersive focusing in a numerical and physical flume. Coast. Eng. 2018, 132, 95–109. [Google Scholar] [CrossRef]
  57. Windt, C.; Davidson, J.; Schmitt, P.; Ringwood, J.V. On the Assessment of Numerical Wave Makers in CFD Simulations. J. Mar. Sci. Eng. 2019, 7, 47. [Google Scholar] [CrossRef] [Green Version]
  58. Menter, F.R.; Kuntz, M.; Langtry, R. Ten Years of Industrial Experience with the SST Turbulence Model. In Turbulence, Heat and Mass Transfer 4; Begell House: Otterfing, Germany, 2003. [Google Scholar]
  59. Mayer, S.; Madsen, P.A. Simulation of Breaking Waves in the Surf Zone using a Navier-Stokes Solver. In Coast. Eng.2000; American Society of Civil Engineers: Reston, VA, USA, 2001; pp. 928–941. [Google Scholar]
  60. Devolder, B.; Rauwoens, P.; Troch, P. Application of a buoyancy-modified k-ω SST turbulence model to simulate wave run-up around a monopile subjected to regular waves using OpenFOAM®. Coast. Eng. 2017, 125, 81–94. [Google Scholar] [CrossRef] [Green Version]
  61. Larsen, B.E. stabRAS_OF50. 2018. Available online: https://github.com/BjarkeEltardLarsen/StabRAS_OF50 (accessed on 18 September 2018).
  62. Ting, F.C.K.; Kirby, J.T. Observation of undertow and turbulence in a laboratory surf zone. Coast. Eng. 1994, 24, 51–80. [Google Scholar] [CrossRef]
  63. Lin, P.; Liu, P.L.-F. A numerical study of breaking waves in the surf zone. J. Fluid Mech. 1998, 359, 239–264. [Google Scholar] [CrossRef]
  64. Xie, Z. Two-phase flow modelling of spilling and plunging breaking waves. Appl. Math. Model. 2013, 37, 3698–3713. [Google Scholar] [CrossRef]
  65. Gruwez, V.; Altomare, C.; Suzuki, T.; Streicher, M.; Cappietti, L.; Kortenhaus, A.; Troch, P. A CFD inter-model comparison for wave interactions with sea dikes on shallow foreshores. (in press)
  66. Jacobsen, N.G.; Fredsoe, J.; Jensen, J.H. Formation and development of a breaker bar under regular waves. Part 1: Model description and hydrodynamics. Coast. Eng. 2014, 88, 182–193. [Google Scholar] [CrossRef]
  67. Juretić, F. cfMesh v1.1.2; Creative Fields Holding Ltd., 2016; Available online: https://sourceforge.net/projects/cfmesh/files/v1.1.2/ (accessed on 24 January 2017).
  68. OpenCFD OpenFOAM®—Official home of The Open Source Computational Fluid Dynamics (CFD) Toolbox. Available online: http://www.openfoam.com (accessed on 7 August 2019).
  69. Higuera, P. olaFOAM—Reference Manual. 2016, p. 61. Available online: https://github.com/phicau/olaFlow (accessed on 2 May 2016).
  70. Spalding, D.B. A Single Formula for the “Law of the Wall”. J. Appl. Mech. 1961, 28, 455–458. [Google Scholar] [CrossRef]
  71. Kimmoun, O.; Branger, H. A particle image velocimetry investigation on laboratory surf-zone breaking waves over a sloping beach. J. Fluid Mech. 2007, 588, 353–397. [Google Scholar] [CrossRef]
  72. Lowe, R.J.; Buckley, M.L.; Altomare, C.; Rijnsdorp, D.P.; Yao, Y.; Suzuki, T.; Bricker, J.D. Numerical simulations of surf zone wave dynamics using Smoothed Particle Hydrodynamics. Ocean Model. 2019, 144, 101481. [Google Scholar] [CrossRef] [Green Version]
  73. Sutherland, J.; Walstra, D.J.R.; Chesher, T.J.; van Rijn, L.C.; Southgate, H.N. Evaluation of coastal area modelling systems at an estuary mouth. Coast. Eng. 2004, 51, 119–142. [Google Scholar] [CrossRef] [Green Version]
  74. Willmott, C.J.; Robeson, S.M.; Matsuura, K. A refined index of model performance. Int. J. Climatol. 2012, 32, 2088–2094. [Google Scholar] [CrossRef]
  75. van Rijn, L.C.; Walstra, D.J.R.; Grasmeijer, B.; Sutherland, J.; Pan, S.; Sierra, J.P. The predictability of cross-shore bed evolution of sandy beaches at the time scale of storms and seasons using process-based Profile models. Coast. Eng. 2003, 47, 295–327. [Google Scholar] [CrossRef]
  76. Streicher, M.; Kortenhaus, A.; Marinov, K.; Hirt, M.; Hughes, S.; Hofland, B.; Scheres, B.; Schüttrumpf, H. Classification of bore patterns induced by storm waves overtopping a dike crest and their impact types on dike mounted vertical walls—A large-scale model study. Coast. Eng. J. 2019, 1–19. [Google Scholar] [CrossRef] [Green Version]
  77. Battjes, J.A.; Bakkenes, H.J.; Janssen, T.T.; van Dongeren, A.R. Shoaling of subharmonic gravity waves. J. Geophys. Res. 2004, 109, C02009. [Google Scholar] [CrossRef] [Green Version]
  78. Barthel, V.; Mansard, E.P.D.; Sand, S.E.; Vis, F.C. Group bounded long waves in physical models. Ocean Eng. 1983, 10, 261–294. [Google Scholar] [CrossRef]
  79. Roenby, J.; Bredmose, H.; Jasak, H. A computational method for sharp interface advection. R. Soc. Open Sci. 2016, 3, 160405. [Google Scholar] [CrossRef] [Green Version]
  80. Roenby, J.; Jasak, H.; Bredmose, H.; Vukčević, V.; Heather, A.; Scheufler, H. isoAdvector. 2019. Available online: https://github.com/isoAdvector/isoAdvector (accessed on 14 October 2019).
  81. Vukčević, V.; Jasak, H.; Gatin, I. Implementation of the Ghost Fluid Method for free surface flows in polyhedral Finite Volume framework. Comput. Fluids 2017, 153, 1–19. [Google Scholar] [CrossRef]
  82. Douglas, S.; Nistor, I. On the effect of bed condition on the development of tsunami-induced loading on structures using OpenFOAM. Nat. Hazards 2015, 76, 1335–1356. [Google Scholar] [CrossRef]
  83. Van der Meer, J.W.; Allsop, N.W.H.; Bruce, T.; De Rouck, J.; Kortenhaus, A.; Pullen, T.; Schüttrumpf, H.; Troch, P.; Zanuttigh, B. Eurotop, Manual on Wave Overtopping of Sea Defences and Related Structures. An Overtopping Manual Largely Based on European Research, but for Worldwide Application, 2nd ed. 2018. Available online: www.overtopping-manual.com (accessed on 26 April 2019).
Figure 1. Overview of the geometrical parameters of the wave flume and WALOWA model set-up, with indicated wave gauge locations. Reprinted with permission from [29].
Jmse 08 00650 g001
Figure 2. (a) WGs deployed along the flume side wall to measure η; (b) PWs; (c) ECM to measure Ux; (d) WLDMs installed on the promenade to measure η; (e) Hollow steel profile attached to two LCs and (f) aluminium plate equipped with pressure sensors (PS) to measure Fx and p.
Jmse 08 00650 g002
Figure 3. Definition of the OF 2DV computational domain, with coloured indication of the model boundary types. The still water level (SWL) is indicated in blue (z = 4.14 m). The number in each of the mesh subdomains of the model domain (demarcated by black dotted lines) is the refinement level β applied in each subdomain (for β = 0, 1, 2, and 3: Δx = Δz = 0.18 m, 0.09 m, 0.045 m, and 0.0225 m). Note: the axes are in a distorted scale.
Jmse 08 00650 g003
Figure 4. Comparison of the η time series at all sensor locations (aj), including ηLW in (af) (bold lines). The zero-reference is the SWL for (af) and the promenade bottom for (gj).
Jmse 08 00650 g004
Figure 5. Comparison of Ux time series at all sensor locations (for the PWs in (a,ce); for the ECM in (b)). The zero-reference is the promenade bottom at the sensor locations. For OF, both Ux at the measured height above the promenade and the depth-averaged U ¯ x time series are shown.
Jmse 08 00650 g005
Figure 6. Comparison of Fx time series for the vertical wall. The experiment is the LC force measurement.
Jmse 08 00650 g006
Figure 7. Comparison of p time series for all vertical pressure sensor locations (for PS01–13 in (am)), PS01 being the bottom PS and PS13 the top-most PS.
Jmse 08 00650 g007
Figure 8. Comparison of Hrms between OF and (R)EXP up to the dike toe. From top to bottom: Hrms,sw for the SW components, Hrms,lw for the LW components, Hrms for the total η, the wave setup η ¯ , and finally an overview of the sensor locations, SWL, and bottom profile.
Jmse 08 00650 g008
Figure 9. Index dr of REXP and OF with EXP up to the dike toe. From top to bottom: dr,sw for ηSW, dr,lw for ηLW, dr,tot for η, and finally an overview of the sensor locations, SWL, and bottom profile.
Jmse 08 00650 g009
Figure 10. Comparison of R for η of REXP and OF with EXP up to the dike toe. From top to bottom: Rsw for ηSW, Rlw for ηLW, R for η, and finally an overview of the sensor locations, SWL, and bottom profile.
Jmse 08 00650 g010
Figure 11. Index dr of REXP and OF with EXP from the dike toe up to the vertical wall. From top to bottom: dr for η and Ux, and finally an overview of the sensor locations, SWL, and bottom profile.
Jmse 08 00650 g011
Figure 12. Index dr of REXP and OF with EXP, for p at the vertical wall (horizontal axis).
Jmse 08 00650 g012
Figure 13. Snapshots of selected key time instants chronologically over the first main impact (af). The OF snapshot (left) is compared to the equivalent EXP snapshot from the side view (centre) and top view (right) cameras. In the OF snapshots, the colours of the water flow indicate the velocity magnitude |U| according to the colour scale shown at the top. The red arrows are the velocity vectors, which are scaled for a clear visualisation. Each OF snapshot has two inset graphs: at the top is a time series plot of Ux (for EXP and U x ¯ for OF) (ac) or Fx (df), in which a circle marker (o) and a plus marker (+) indicate the time instant of the numerical and experimental snapshot, respectively. Along the vertical wall, Ux (ac) or p (df) is plotted at the respective ECM sensor location or each PS location (the vertical axis is z [m]). Along the promenade, four vertical grey dashed lines indicate the sensor locations on the promenade, of which the WLDM gauges are also visible in the experimental snapshots (topped by blue plastic bags). The location of the ECM is at the second vertical grey dashed line from the left. The time instant of the numerical snapshot is provided by tOF.
Jmse 08 00650 g013
Figure 14. Snapshots of selected key time instants chronologically over the second main impact (af). See the caption of Figure 13 for further descriptions.
Jmse 08 00650 g014
Table 1. Hydraulic parameters for the WALOWA bichromatic wave test (EXP) and its repetition (REXP): ho is the offshore water depth, ht the water depth at the dike toe, Hm0,o the incident offshore significant wave height, Rc the dike crest freeboard, fi the SW component frequency, ai the SW component amplitude, and βm (= a2/a1) the modulation factor.
TestID [-]Duration [s]ho [m]ht [m]ht/Hm0,o [-]Rc [m]f1 [Hz]a1 [m]f2 [Hz]a2 [m]βm [-]
Bi_02_6 (EXP) & Bi_02_6_R (REXP)2094.140.430.330.1170.190.450.1550.4280.951
Table 2. Proposed classification of the relative refined index of agreement d′r and corresponding rating.
d′r Classification [-]Rating
0.90–1.00Excellent
0.80–0.90Very Good
0.70–0.80Good
0.50–0.70Reasonable/Fair
0.30–0.50Poor
(−1.00)–0.30Bad
Table 3. Pattern and model performance statistics for all η measurement locations.
LocationREXPOF
B* [-]σ* [-]R [-]dr [-]B* [-]σ* [-]R [-]dr [-]d′r [-]Rating [-]
WG02−0.011.011.000.970.060.940.960.850.88Very Good
WG03−0.010.991.000.970.050.920.950.850.87Very Good
WG04−0.011.001.000.970.060.910.950.840.87Very Good
WG070.011.001.000.970.060.940.940.840.87Very Good
WG130.000.970.940.830.040.950.730.660.83Very Good
WG140.001.000.980.920.050.890.910.820.90Very Good
WLDM01−0.020.990.990.92−0.081.000.890.800.88Very Good
WLDM02−0.021.010.990.92−0.051.010.910.820.89Very Good
WLDM030.000.980.990.92−0.030.980.900.820.90Very Good
WLDM040.010.970.980.92−0.001.000.870.790.87Very Good
Table 4. Pattern and model performance statistics for all Ux measurement locations on the promenade.
LocationREXPOF
B* [-]σ* [-]R [-]dr [-]B* [-]σ* [-]R [-]dr [-]d′r [-]Rating [-]
PW010.020.960.910.80−1.241.550.58−0.100.10Bad
ECM−0.021.050.870.81−0.250.940.730.630.82Very Good
PW02−0.050.990.880.82−0.661.220.650.290.48Poor
PW03−0.021.000.920.86−0.571.060.680.400.54Reasonable/Fair
PW04−0.031.020.880.77−0.420.880.580.370.61Reasonable/Fair
Table 5. Pattern and model performance statistics for all p (PS) and Fx (LC) measurement locations.
LocationREXPOF
B* [-]σ* [-]R [-]dr [-]B* [-]σ* [-]R [-]dr [-]d′r [-]Rating [-]
PS010.001.000.980.92−0.140.840.840.800.88Very Good
PS02−0.010.990.970.92−0.100.820.770.770.84Very Good
PS030.001.000.960.91−0.130.750.710.750.83Very Good
PS040.020.990.940.87−0.130.740.660.720.85Very Good
PS050.011.000.960.91−0.110.750.610.690.78Good
PS06−0.010.970.960.90−0.130.780.610.720.82Very Good
PS07−0.010.930.950.89−0.170.760.530.670.78Good
PS08−0.050.860.940.86−0.200.740.460.650.78Good
PS09−0.070.880.930.85−0.250.780.390.610.76Good
PS10−0.040.930.940.90−0.240.770.480.670.77Good
PS11−0.040.910.940.88−0.330.570.370.630.75Good
PS12−0.200.790.890.78−0.550.53−0.050.420.65Reasonable/Fair
PS13−0.150.570.920.77−0.590.330.120.400.63Reasonable/Fair
LC0.000.970.900.90−0.120.740.730.760.85Very Good
Table 6. Description of the snapshots shown in Figure 13 (main impact 1) and Figure 14 (main impact 2).
FigureDescription
Main Impact 1Figure 13aPre-impact of small overtopped wave.
Figure 13bPre-collision of large overtopped bore and small wave reflected from vertical wall.
Figure 13cCollision of large overtopped bore and reflected small wave.
Figure 13dImpact on vertical wall of high velocity spray from overturned bore.
Figure 13eDynamic impact of overturned bore on vertical wall.
Figure 13fQuasi-static impact of overturned bore on vertical wall.
Main Impact 2Figure 14aVery small overtopped bore.
Figure 14bImpact of small overtopped bore on vertical wall.
Figure 14cImpact of large overtopped bore on vertical wall.
Figure 14dImpact of large overtopped bore on vertical wall, continued.
Figure 14eImpact of large overtopped bore on vertical wall, continued.
Figure 14fReturn flow of large bore reflected from vertical wall.

