Characterization of Overtopping Waves on Sea Dikes with Gentle and Shallow Foreshores


Abstract
:1. Introduction
2. Methods
2.1. SWASH
2.2. Model Settings
2.3. Test Matrix
2.4. Bathymetry
2.5. Post-Processing
2.6. Physical Model
3. Results
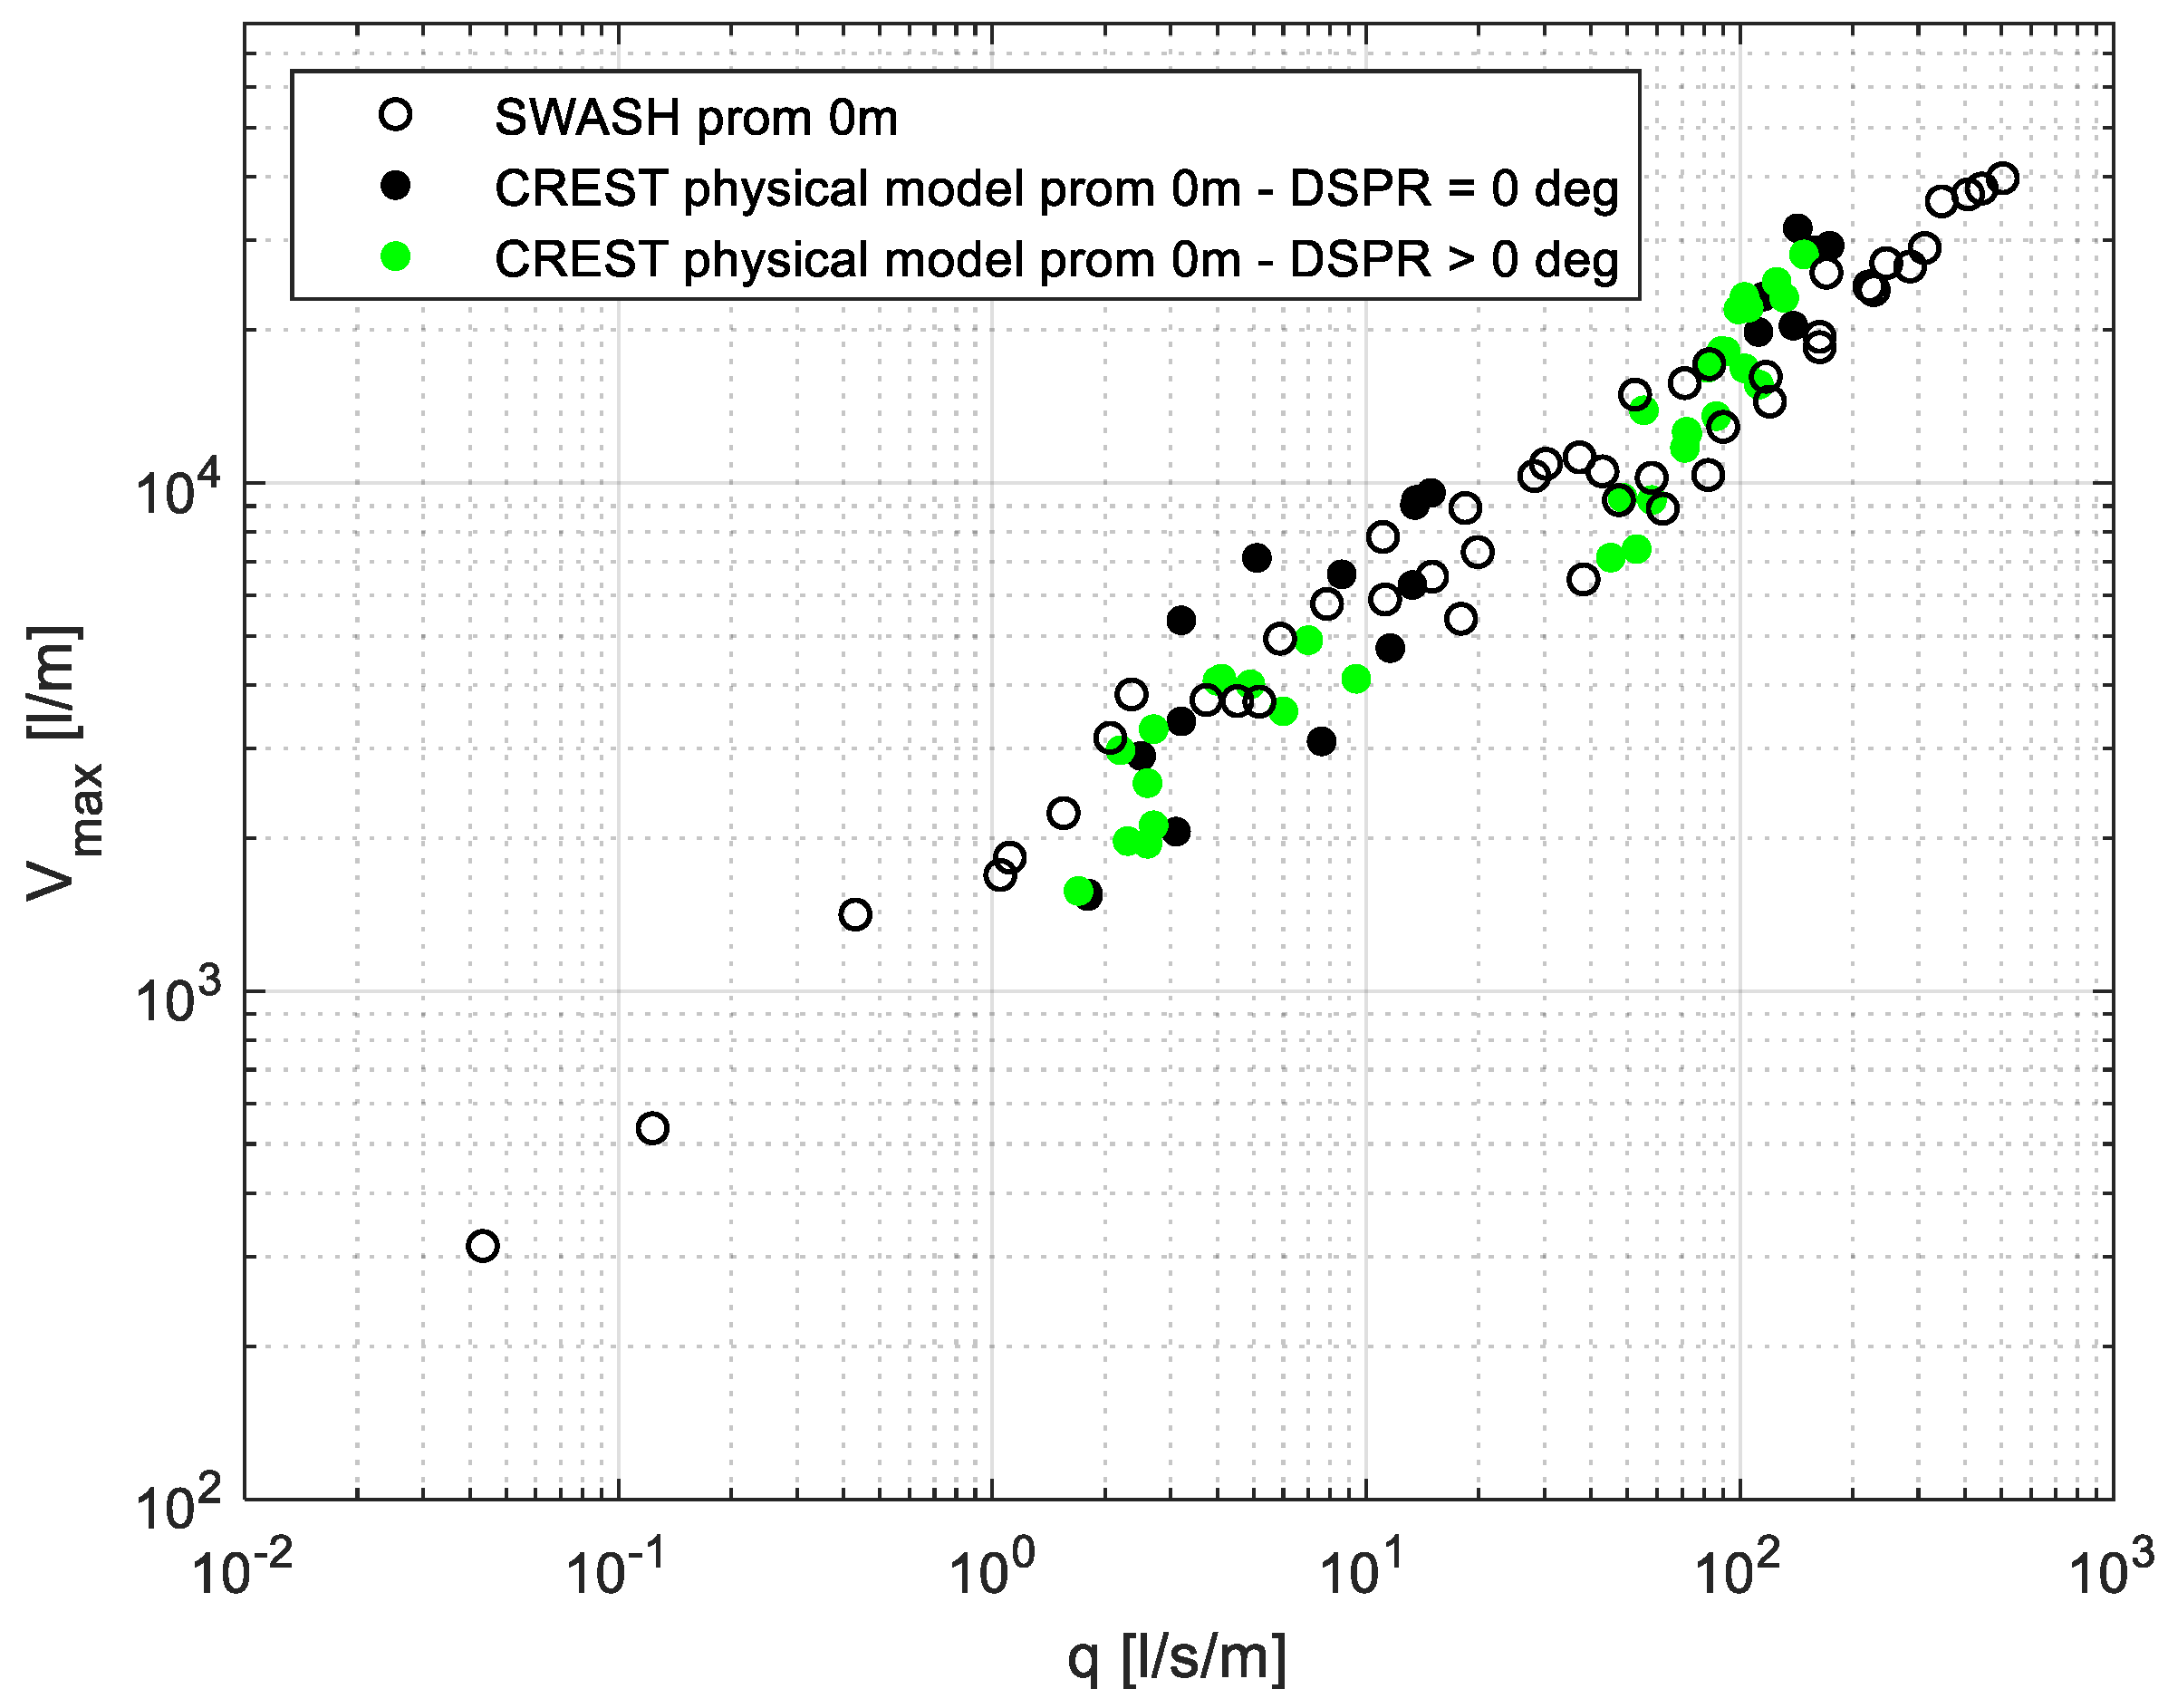
3.1. Validation
3.2. Overtopping Flow Characteristics on a Promenade (without a Vertical Wall)
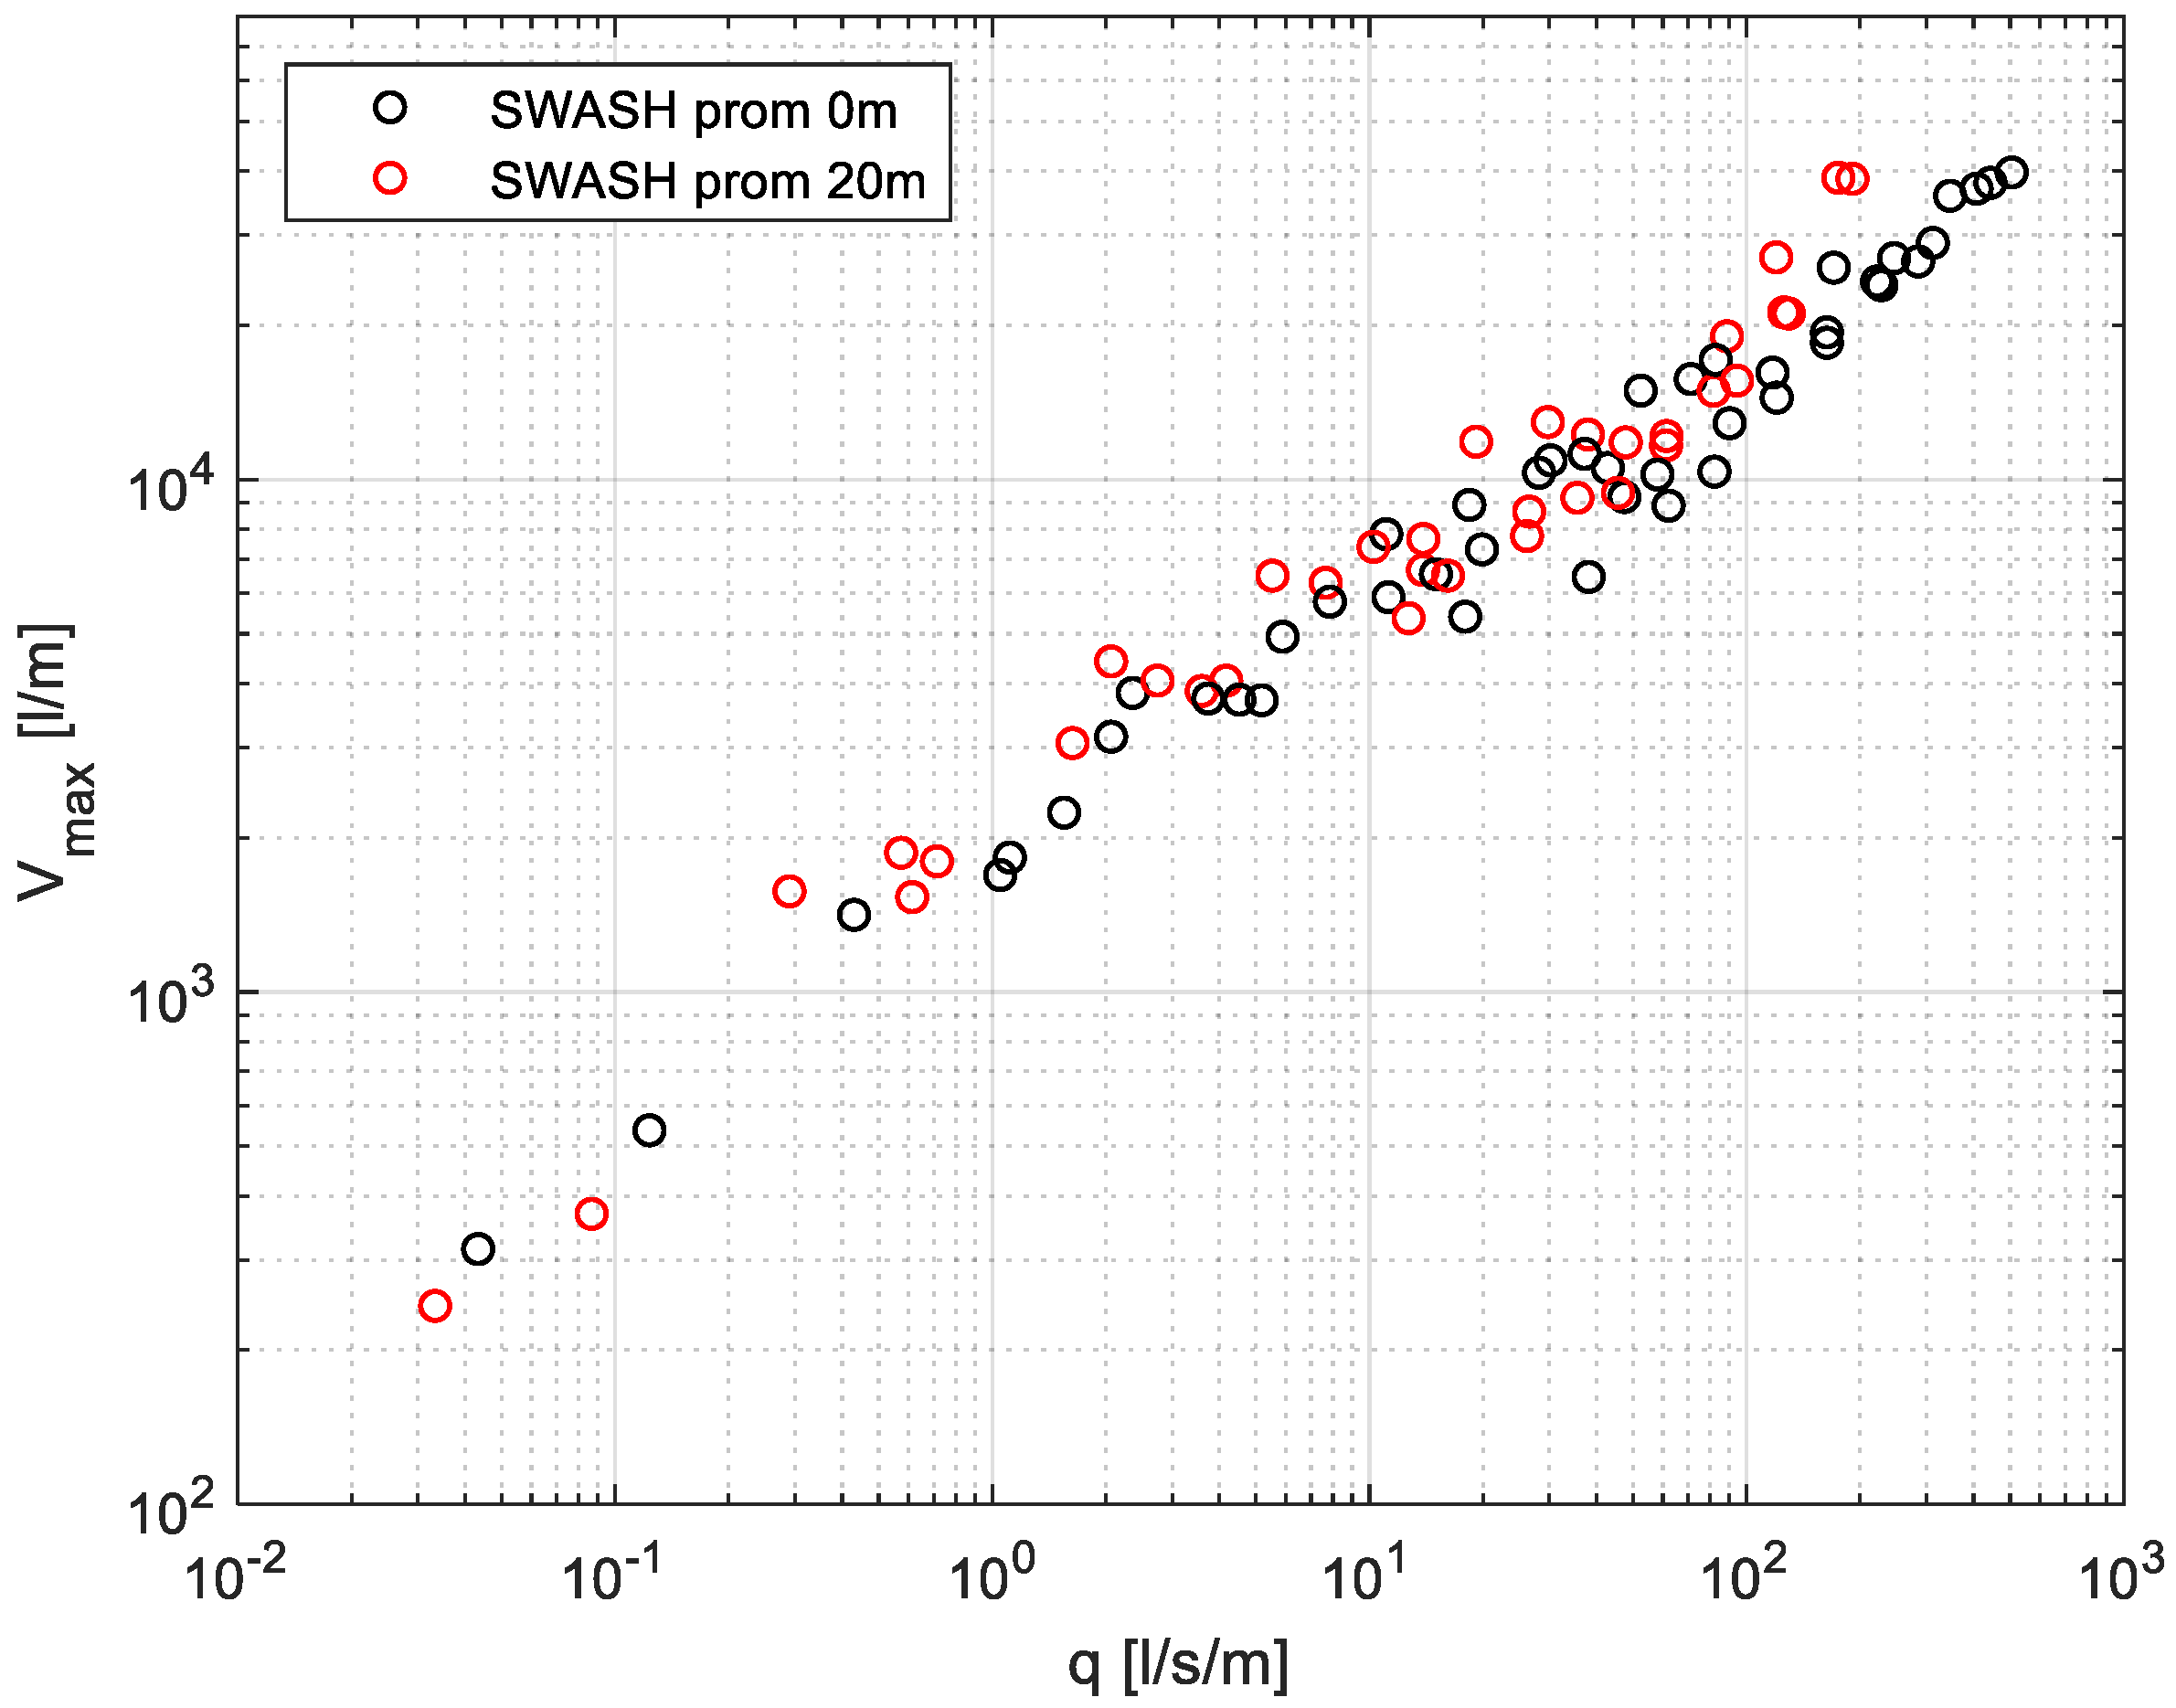
3.2.1. q-Vmax Relationship
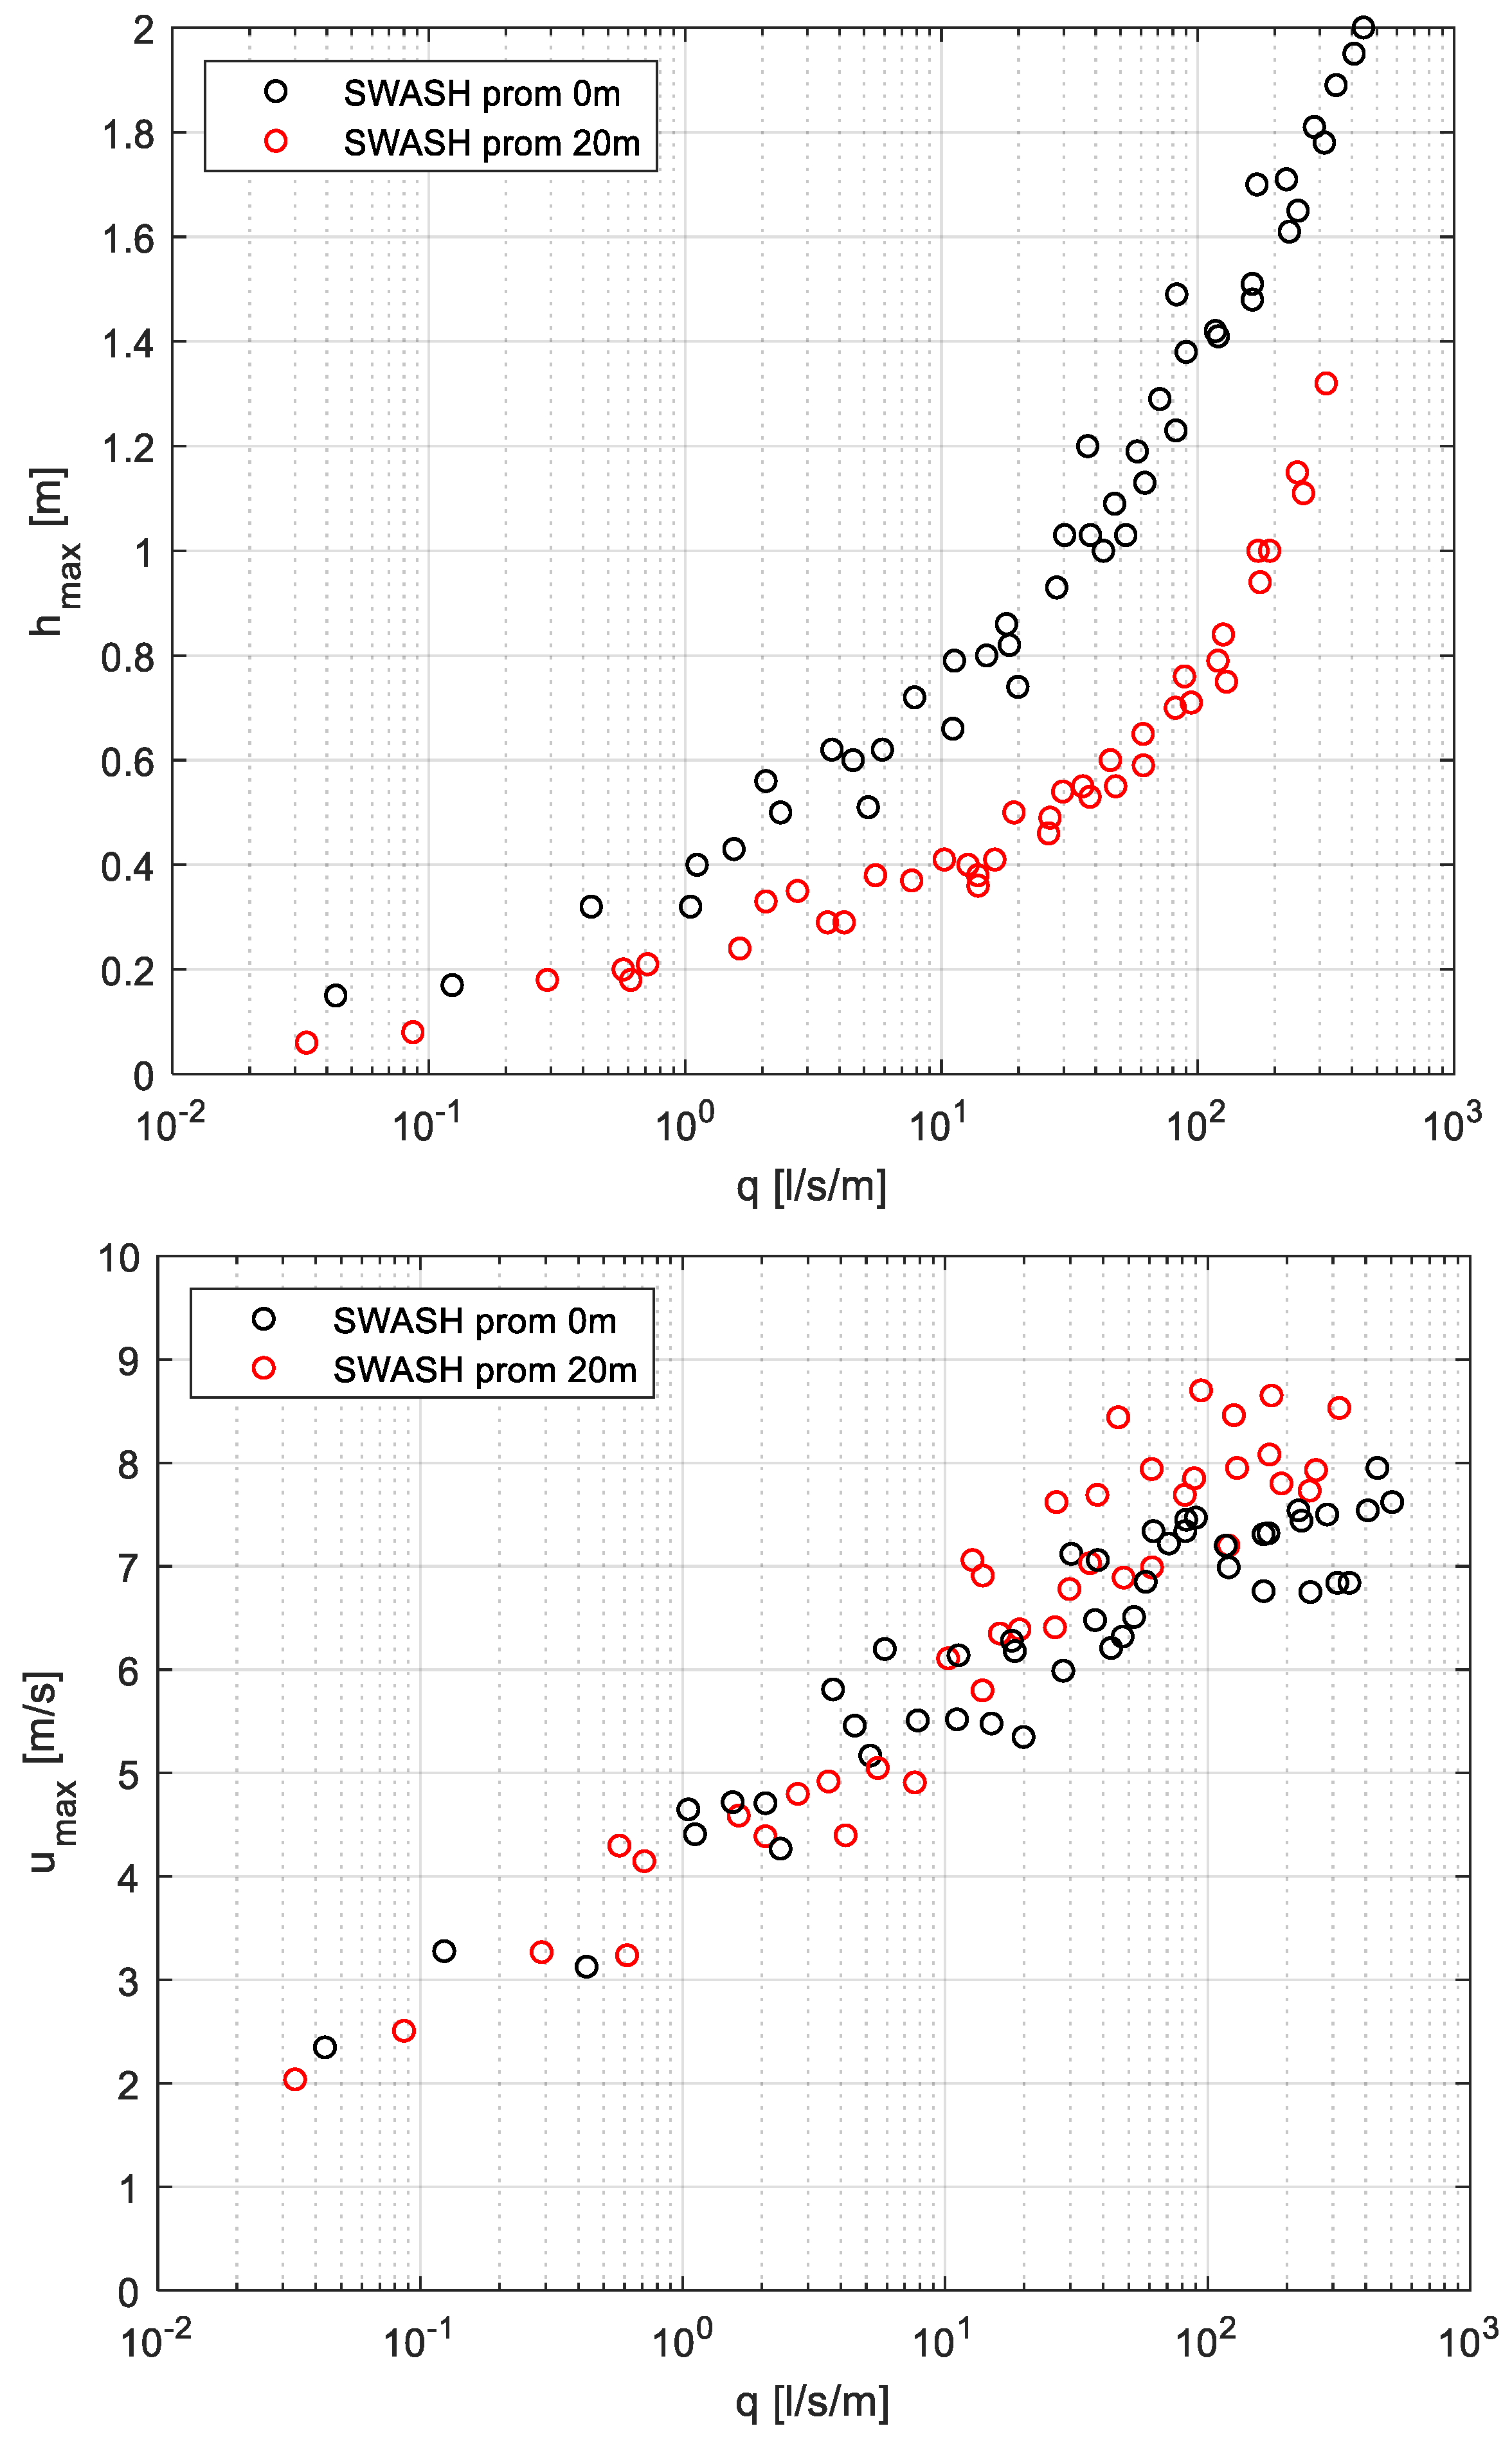
3.2.2. q-hmax and q-umax Relationships
3.2.3. Time Evolution of Overtopping Flow Characteristics
3.2.4. Overtopping Flow Characteristics and Stability
3.3. Overtopping Flow Properties in Front of a Vertical Wall
4. Discussion
4.1. On Accuracy of the Model
4.2. On the Overtopping Parameters
4.3. On the Risk
5. Conclusions
Author Contributions
Funding
Conflicts of Interest
References
- Weisse, R.; von Storch, H.; Niemeyer, H.D.; Knaack, H. Changing North Sea storm surge climate: An increasing hazard? Ocean Coast. Manag. 2012, 68, 58–68. [Google Scholar] [CrossRef]
- Neumann, B.; Vafeidis, A.T.; Zimmermann, J.; Nicholls, R.J. Future coastal population growth and exposure to sea-level rise and coastal flooding—A global assessment. PLoS ONE 2015, 10. [Google Scholar] [CrossRef] [PubMed]
- Endoh, K.; Takahashi, S. Numerically Modeling Personnel Danger on a Promenade Breakwater Due to Overtopping Waves. In Proceedings of the 24th International Conference on Coastal Engineering, Kobe, Japan, 23–28 October 1994; pp. 1016–1029. [Google Scholar]
- Sandoval, C.; Bruce, T. Wave overtopping hazard to pedestrians: Video evidence from real accidents. In Coasts, Marine Structures and Breakwaters 2017; Thomas Telford Ltd.: Liverpool, UK, 2018; pp. 501–512. [Google Scholar]
- Allsop, N.W.H.; Bruce, T.; Pullen, T.; van der Meer, J. Direct Hazards from Wave Overtopping—The Forgotten Aspect of Coastal Flood Risk Assessment? In Proceedings of the 43rd Defra Flood and Coastal Management Conference, Manchester, UK, 1–3 July 2008; pp. 1–11. [Google Scholar]
- Altomare, C.; Gironella, X.; Suzuki, T.; Viccione, G.; Saponieri, A. Overtopping metrics and coastal safety: A case of study from the catalan coast. J. Mar. Sci. Eng. 2020, 8, 556. [Google Scholar] [CrossRef]
- Arrighi, C.; Oumeraci, H.; Castelli, F. Hydrodynamics of pedestrians’ instability in floodwaters. Hydrol. Earth Syst. Sci. 2017, 21, 515–531. [Google Scholar] [CrossRef] [Green Version]
- Arrighi, C.; Pregnolato, M.; Dawson, R.J.; Castelli, F. Preparedness against mobility disruption by floods. Sci. Total Environ. 2019, 654, 1010–1022. [Google Scholar] [CrossRef]
- Schüttrumpf, H.; Oumeraci, H. Scale and Model Effects in Crest Level Design. In Proceedings of the 2nd Coastal Symposium, Höfn, Iceland, 5–8 June 2005; pp. 1–12. [Google Scholar]
- Nørgaard, J.Q.H.; Lykke Andersen, T.; Burcharth, H.F.; Steendam, G.J. Analysis of overtopping flow on sea dikes in oblique and short-crested waves. Coast. Eng. 2013, 76, 43–54. [Google Scholar] [CrossRef]
- Mares-Nasarre, P.; Argente, G.; Gómez-Martín, M.E.; Medina, J.R. Overtopping layer thickness and overtopping flow velocity on mound breakwaters. Coast. Eng. 2019, 154. [Google Scholar] [CrossRef]
- van Bergeijk, V.M.; Warmink, J.J.; van Gent, M.R.; Hulscher, S.J. An analytical model of wave overtopping flow velocities on dike crests and landward slopes. Coast. Eng. 2019, 149, 28–38. [Google Scholar] [CrossRef] [Green Version]
- Chen, X.; Jonkman, S.N.; Pasterkamp, S.; Suzuki, T.; Altomare, C. Vulnerability of buildings on coastal dikes due to wave overtopping. Water (Switz.) 2017, 9, 394. [Google Scholar] [CrossRef] [Green Version]
- Van der Meer, J.W.; Allsop, N.W.; Bruce, T.; De Rouck, J.; Kortenhaus, A.; Pullen, T.; Schüttrumpf, H.; Troch, P.; Zanuttigh, B. Manual on Wave Overtopping of Sea Defences and Related Structures. An Overtopping Manual Largely Based on European Research, but for Worldwide Application, 2nd ed.; EurOtop: London, UK, 2018. [Google Scholar]
- Altomare, C.; Suzuki, T.; Chen, X.; Verwaest, T.; Kortenhaus, A. Wave overtopping of sea dikes with very shallow foreshores. Coast. Eng. 2016, 116, 236–257. [Google Scholar] [CrossRef]
- Suzuki, T.; Altomare, C.; Veale, W.; Verwaest, T.; Trouw, K.; Troch, P.; Zijlema, M. Efficient and robust wave overtopping estimation for impermeable coastal structures in shallow foreshores using SWASH. Coast. Eng. 2017, 122. [Google Scholar] [CrossRef]
- Lashley, C.H.; Bricker, J.D.; Bricker, J.D.; Van Der Meer, J.; Van Der Meer, J.; Altomare, C.; Altomare, C.; Suzuki, T.; Suzuki, T. Relative Magnitude of Infragravity Waves at Coastal Dikes with Shallow Foreshores: A Prediction Tool. J. Waterw. Port Coast. Ocean Eng. 2020, 146, 1–17. [Google Scholar] [CrossRef]
- Zijlema, M.; Stelling, G.; Smit, P. SWASH: An operational public domain code for simulating wave fi elds and rapidly varied flows in coastal waters. Coast. Eng. 2011, 58, 992–1012. [Google Scholar] [CrossRef]
- Smit, P.; Zijlema, M.; Stelling, G. Depth-induced wave breaking in a non-hydrostatic, near-shore wave model. Coast. Eng. 2013, 76, 1–16. [Google Scholar] [CrossRef]
- Suzuki, T.; De Roo, S.; Altomare, C.; Zhao, G.; Kolokythas, G.K.; Willems, M.; Verwaest, T.; Mostaert, F. Toetsing Kustveiligheid 2015–Methodologie: Toetsingsmethodologie Voor Dijken en Duinen; WL Rapporten; 10.0; Waterbouwkundig Laboratorium: Antwerpen, Belgium, 2016. [Google Scholar]
- Rijnsdorp, D.P.; Smit, P.B.; Zijlema, M. Non-hydrostatic modelling of infragravity waves under laboratory conditions. Coast. Eng. 2014, 85, 30–42. [Google Scholar] [CrossRef]
- Vasarmidis, P.; Stratigaki, V.; Suzuki, T.; Zijlema, M.; Troch, P. Internal wave generation in a non-hydrostatic wave model. Water (Switz.) 2019, 11, 986. [Google Scholar] [CrossRef] [Green Version]
- Altomare, C.; Suzuki, T.; Verwaest, T. Influence of directional spreading on wave overtopping of sea dikes with gentle and shallow foreshores. Coast. Eng. 2020, 157, 103654. [Google Scholar] [CrossRef] [Green Version]
- Tortora, S. Statistical characterisation of overtopping volumes for sea dikes in very shallow foreshore condition under short- and long-crested waves action. Master Thesis, University of L’Aquila, Rome, Italy, 2018. [Google Scholar]
- Suzuki, T.; Altomare, C.; De Roo, S.; Vanneste, D.; Mostaert, F. Manning’s Roughness Coefficient in SWASH: Application to Overtopping Calculation; FHR reports; Version 2; Flanders Hydraulics Research: Antwerp, Belgium, 2018. [Google Scholar]
- Oppenheimer, M.; Glavovic, B.; Hinkel, J.; van de Wal, R.; Magnan, A.K.; Abd-Elgawad, A.; Cai, R.; Cifuentes-Jara, M.; Deconto, R.M.; Ghosh, T.; et al. Sea Level Rise and Implications for Low-Lying Islands, Coasts and Communities. In IPCC Special Report on the Ocean and Cryosphere in a Changing Climate; Pörtner, H.-O., Roberts, D.C., Masson-Delmotte, V., Zhai, P., Tignor, M., Poloczanska, E., Mintenbeck, K., Alegría, A., Nicolai, M., Okem, A., et al., Eds.; In press.
- Chen, X.; Hofland, B.; Altomare, C.; Suzuki, T.; Uijttewaal, W. Forces on a vertical wall on a dike crest due to overtopping flow. Coast. Eng. 2015, 95, 94–104. [Google Scholar] [CrossRef]
- Streicher, M.; Kortenhaus, A.; Marinov, K.; Hirt, M.; Hughes, S.; Hofland, B.; Scheres, B.; Schüttrumpf, H. Classification of bore patterns induced by storm waves overtopping a dike crest and their impact types on dike mounted vertical walls—A large-scale model study. Coast. Eng. J. 2019, 61, 321–339. [Google Scholar] [CrossRef] [Green Version]
- Gruwez, V.; Altomare, C.; Suzuki, T.; Streicher, M.; Cappietti, L.; Kortenhaus, A.; Troch, P. Validation of RANS Modelling for Wave Interactions with Sea Dikes on Shallow Foreshores Using a Large-Scale Experimental Dataset. J. Mar. Sci. Eng. 2020, 8, 650. [Google Scholar] [CrossRef]
- Altomare, C.; Crespo, A.J.C.; Domínguez, J.M.; Gómez-Gesteira, M.; Suzuki, T.; Verwaest, T. Applicability of Smoothed Particle Hydrodynamics for estimation of sea wave impact on coastal structures. Coast. Eng. 2015, 96, 1–12. [Google Scholar] [CrossRef]
- Suzuki, T.; Hu, Z.; Kumada, K.; Phan, L.K.; Zijlema, M. Non-hydrostatic modeling of drag, inertia and porous effects in wave propagation over dense vegetation fields. Coast. Eng. 2019, 149, 49–64. [Google Scholar] [CrossRef]


| Name [-] | Bathymetry [-] | Water Level [m] | Hm0 [m] | Tp [m] | Toe Level [m] | Dike Crest Level [m] | Promenade Width [m] |
|---|---|---|---|---|---|---|---|
| RSK | Q | 22 (7) 1 | 3 | 12 | 21.5 (6.5) 1 | 23.5 (8.5) 1 | 0 |
| W | 23 (8) 1 | 4 | 21.9 (6.9) 1 | 24.0 (9.0) 1 | 20 | ||
| 5 | 24.5 (9.5) 1 | ||||||
| 25.0 (10.0) 1 |
| Case [-] | Promenade Width [m] | V [l/m] |
|---|---|---|
| RSK_7_5_12_69_00_00 | 0 | 1043 |
| RSK_7_5_12_65_95_20 | 20 | 1109 |
© 2020 by the authors. Licensee MDPI, Basel, Switzerland. This article is an open access article distributed under the terms and conditions of the Creative Commons Attribution (CC BY) license (http://creativecommons.org/licenses/by/4.0/).
Share and Cite
Suzuki, T.; Altomare, C.; Yasuda, T.; Verwaest, T. Characterization of Overtopping Waves on Sea Dikes with Gentle and Shallow Foreshores. J. Mar. Sci. Eng. 2020, 8, 752. https://doi.org/10.3390/jmse8100752
Suzuki T, Altomare C, Yasuda T, Verwaest T. Characterization of Overtopping Waves on Sea Dikes with Gentle and Shallow Foreshores. Journal of Marine Science and Engineering. 2020; 8(10):752. https://doi.org/10.3390/jmse8100752
Chicago/Turabian StyleSuzuki, Tomohiro, Corrado Altomare, Tomohiro Yasuda, and Toon Verwaest. 2020. "Characterization of Overtopping Waves on Sea Dikes with Gentle and Shallow Foreshores" Journal of Marine Science and Engineering 8, no. 10: 752. https://doi.org/10.3390/jmse8100752