Micro Sand Engine Beach Stabilization Strategy at Puerto Morelos, Mexico


Abstract
:1. Introduction
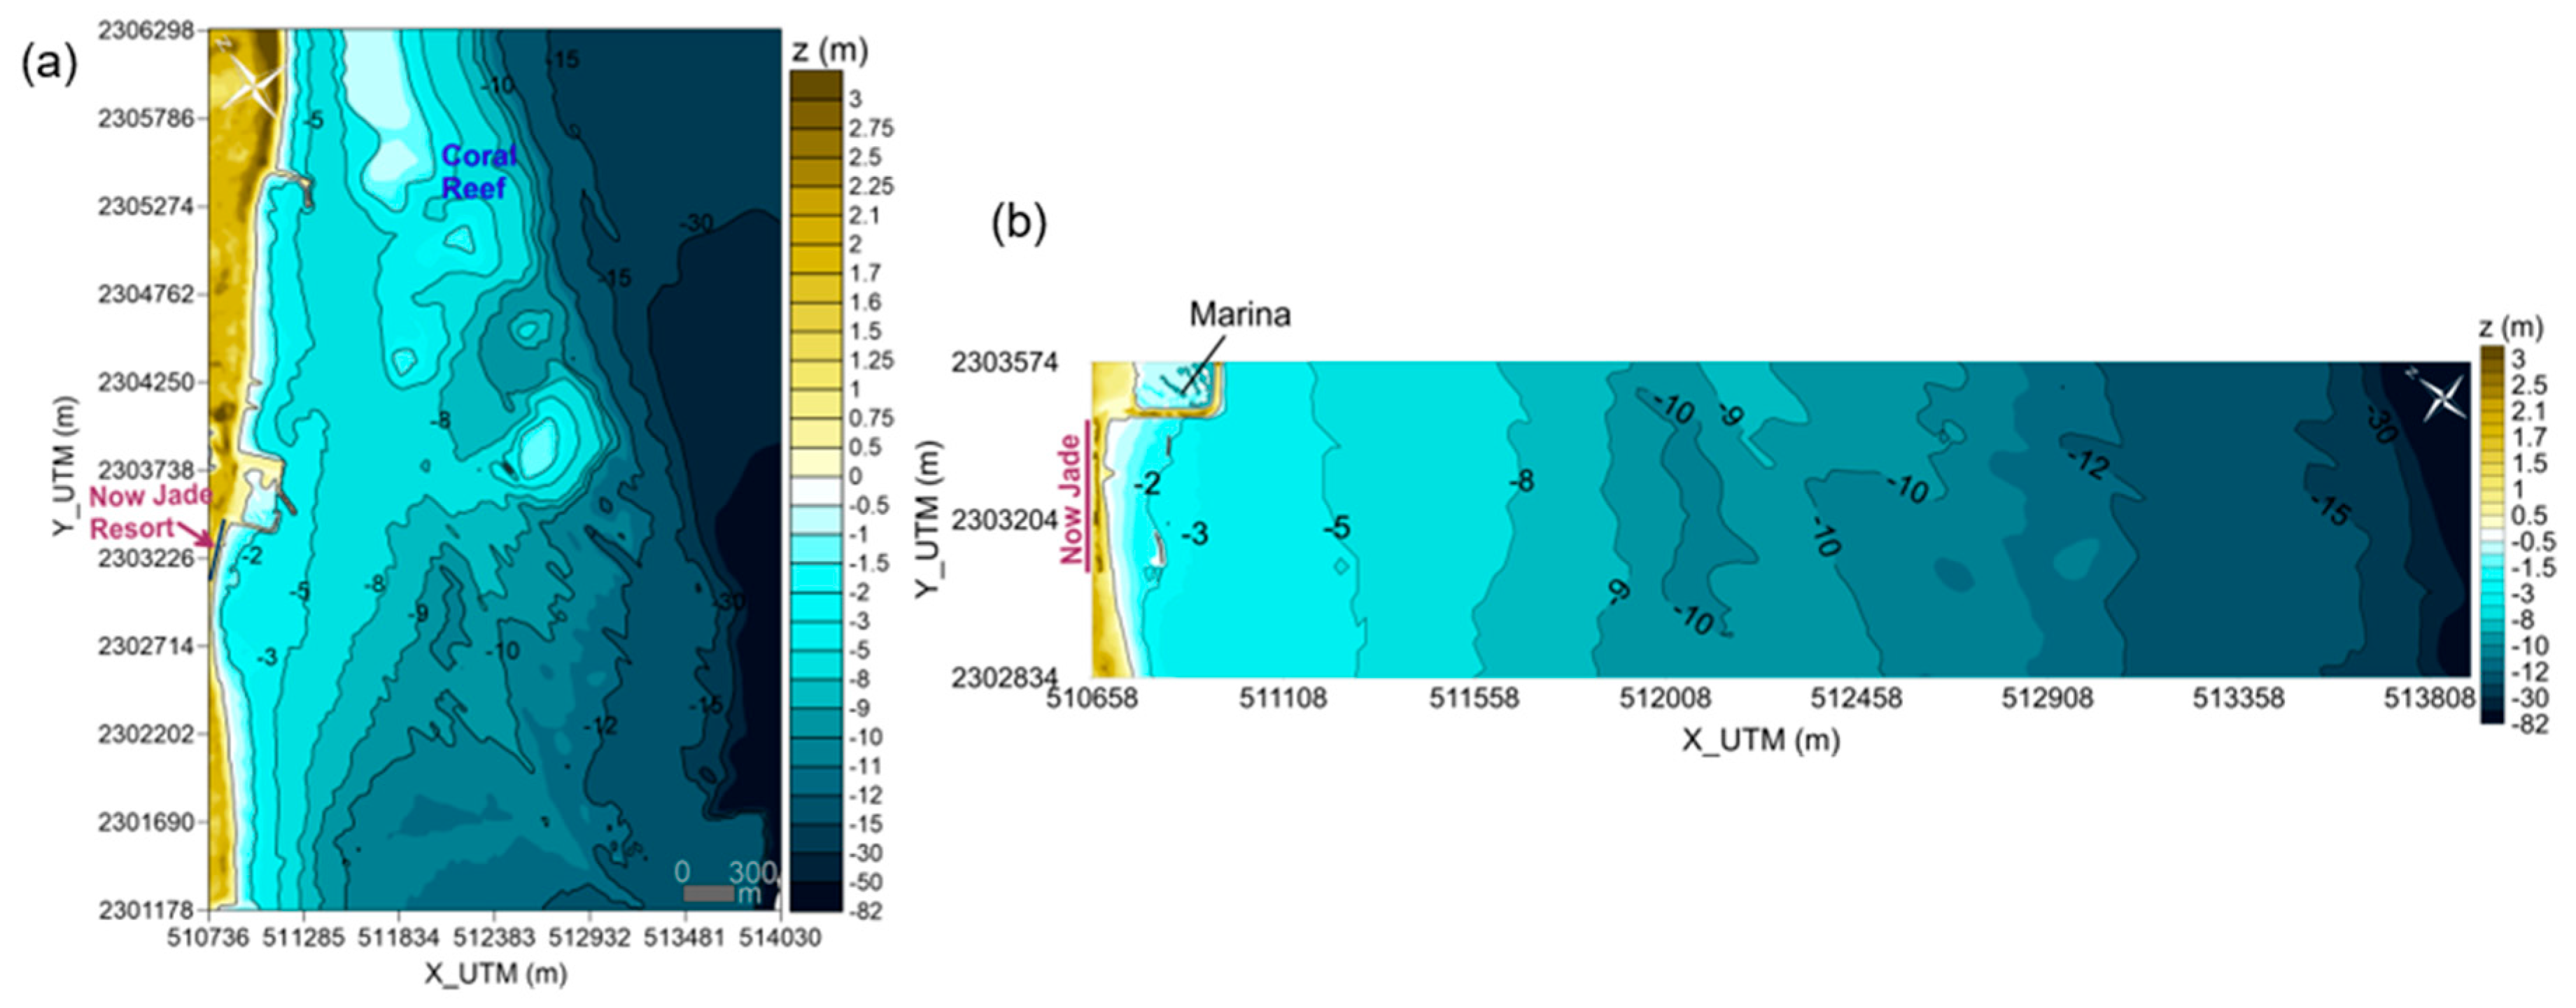
2. Study Area
3. Data and Methods
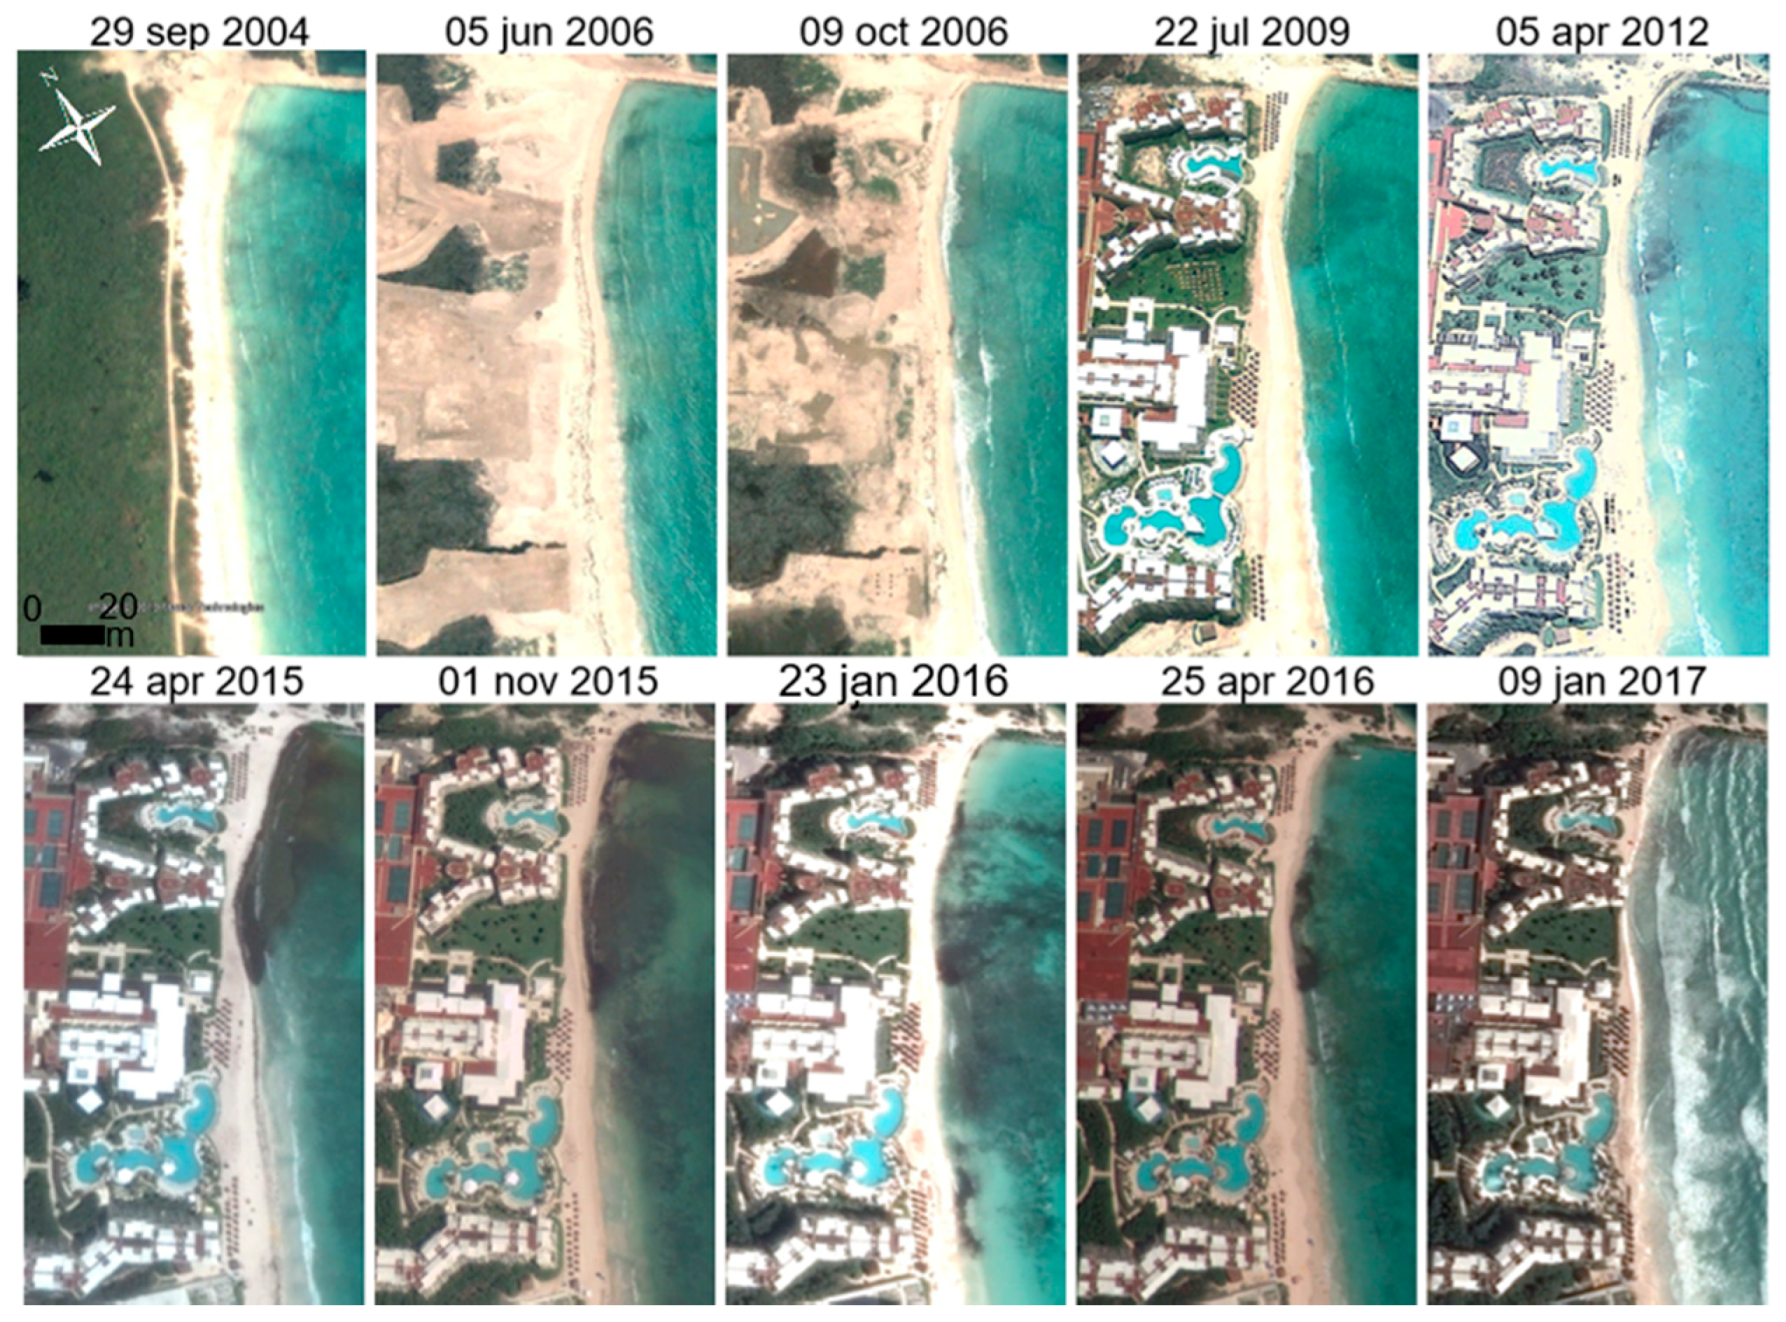
3.1. Beach Evolution from Satellite Images and Fied Data
3.2. Offshore Wave Data and Numerical Model Description
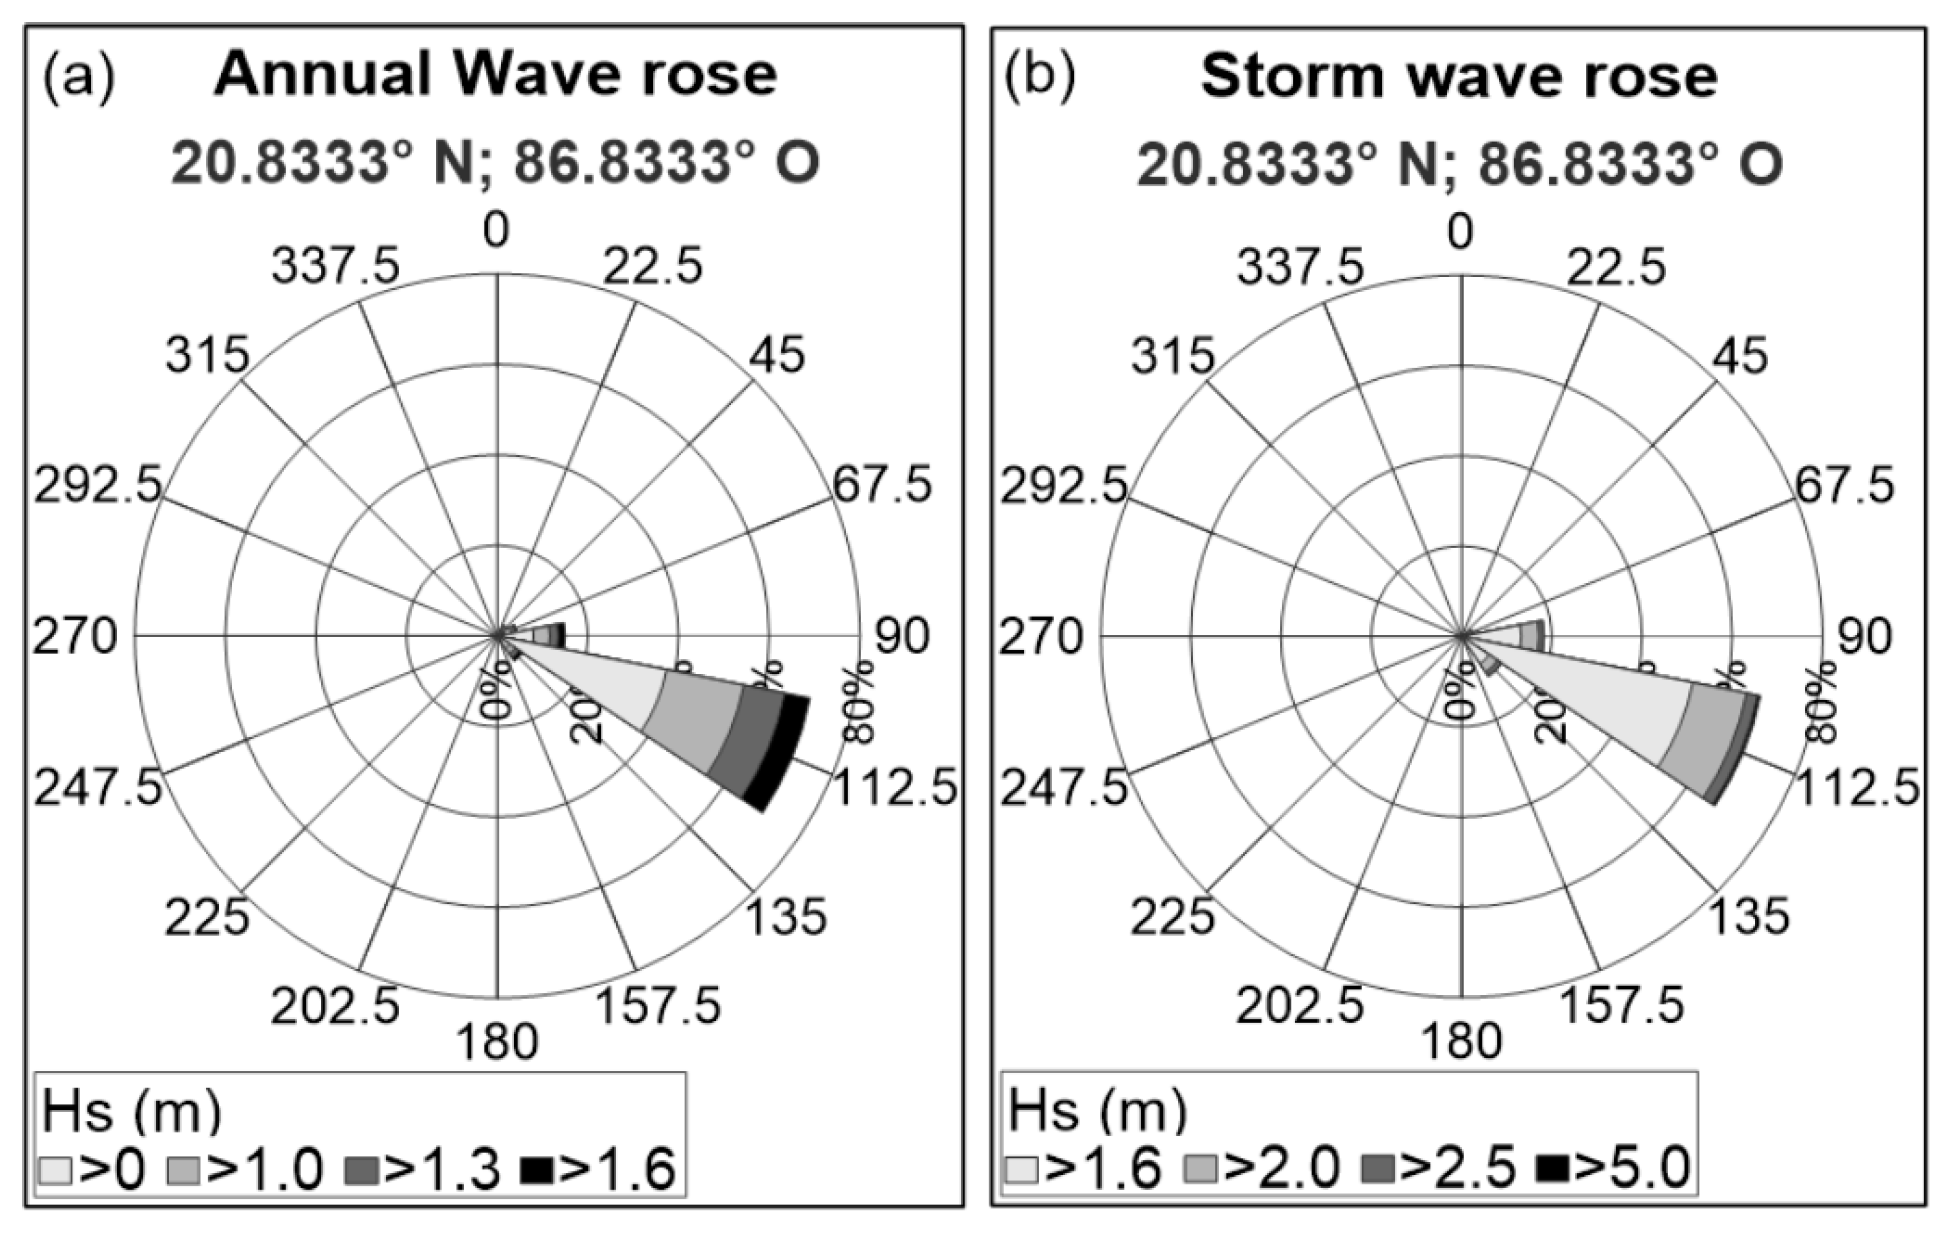
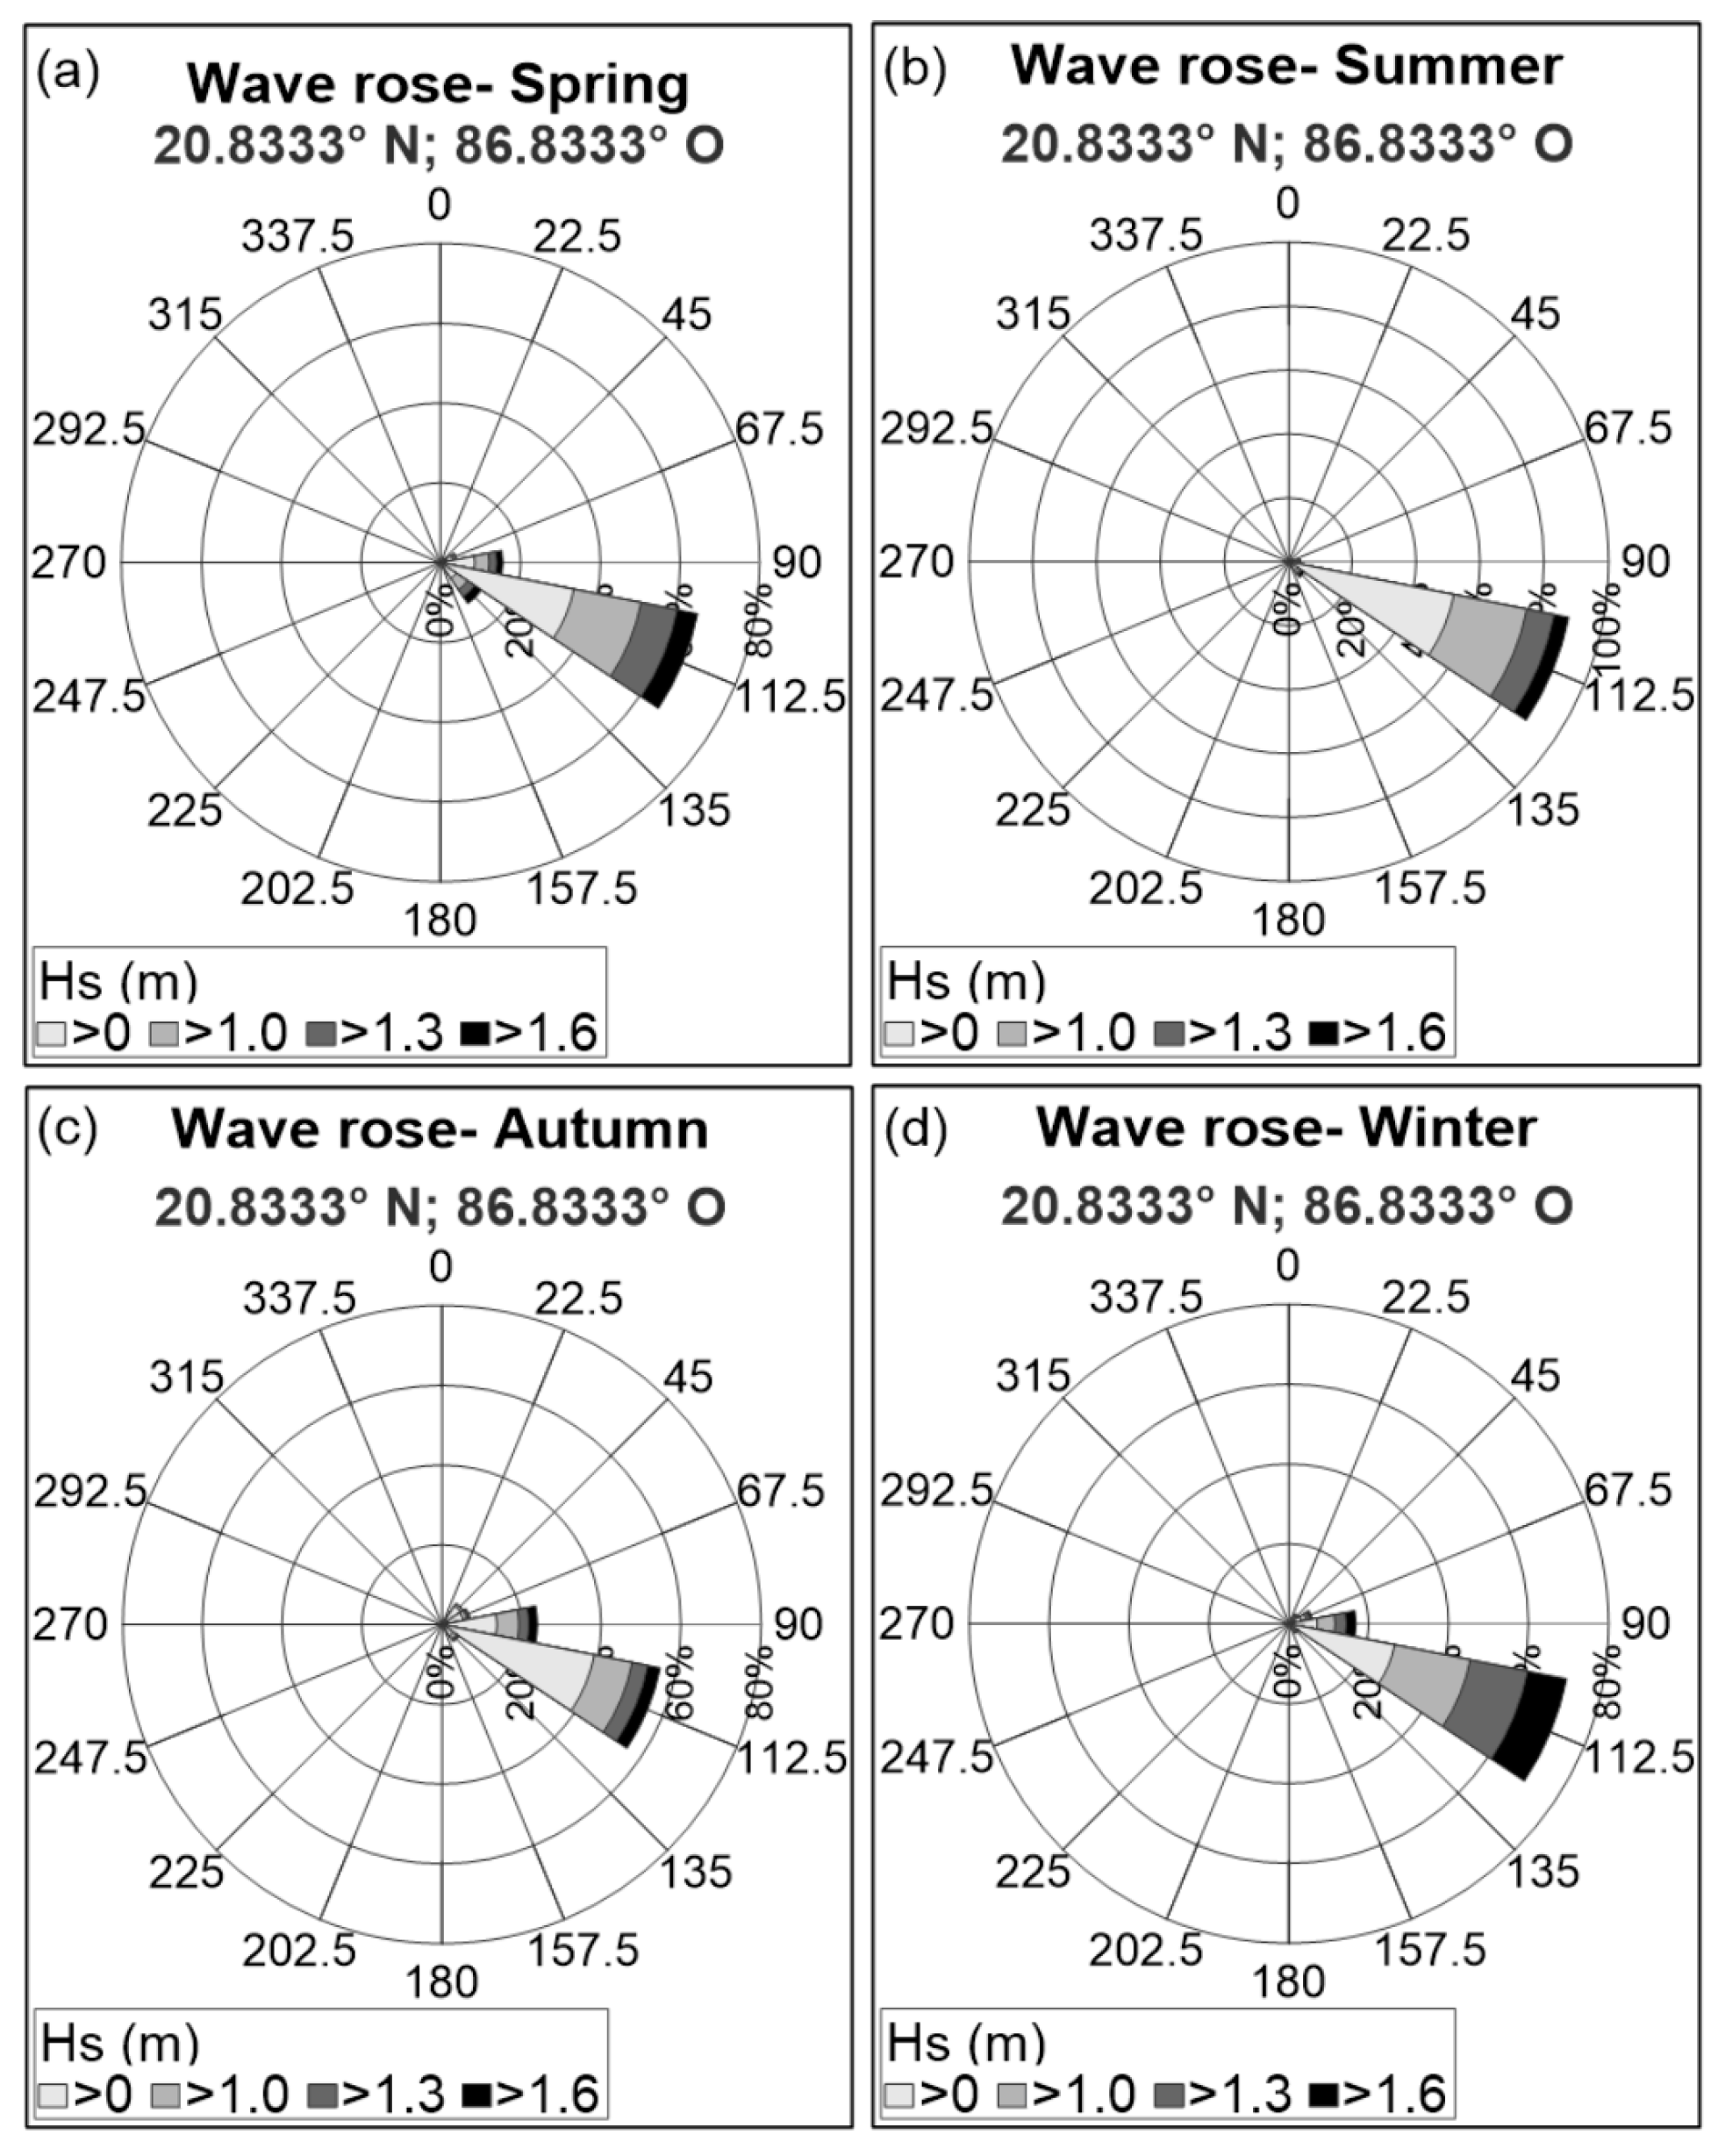
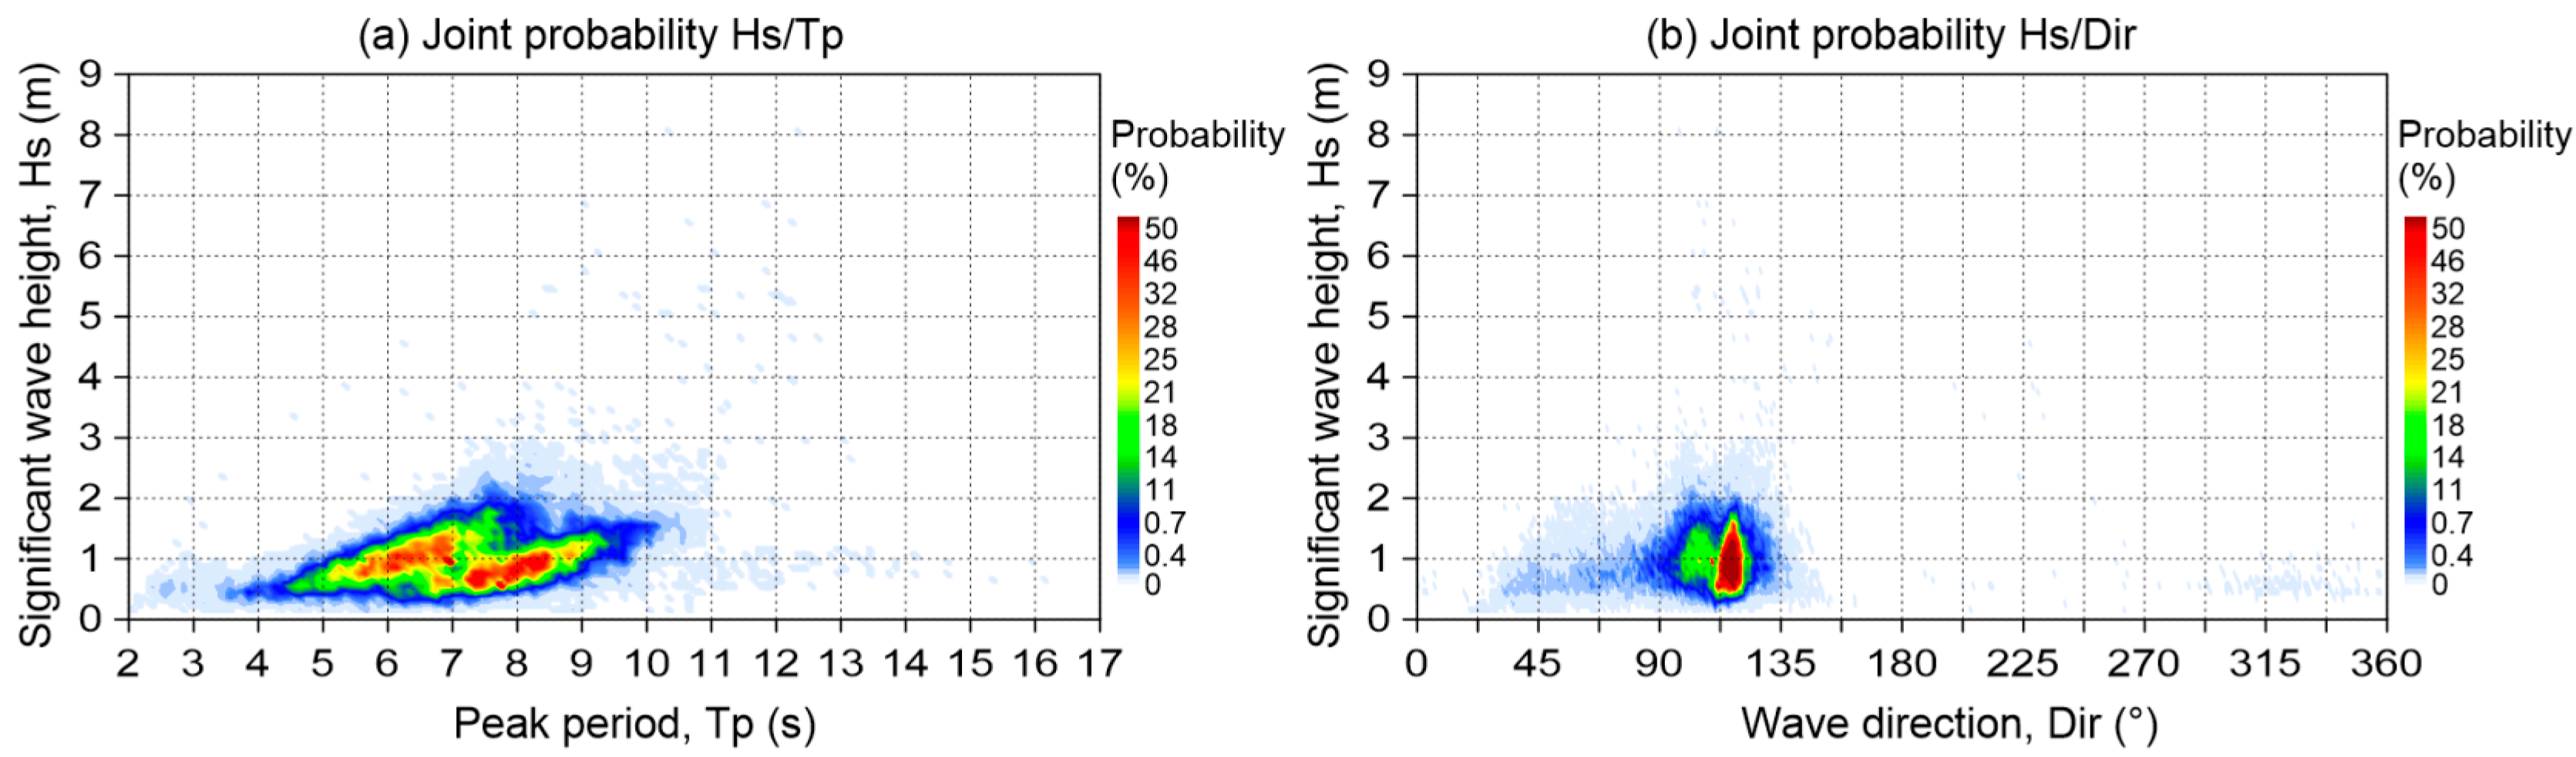
3.2.1. Offshore Wave Data
3.2.2. Numerical Model Description
4. Results
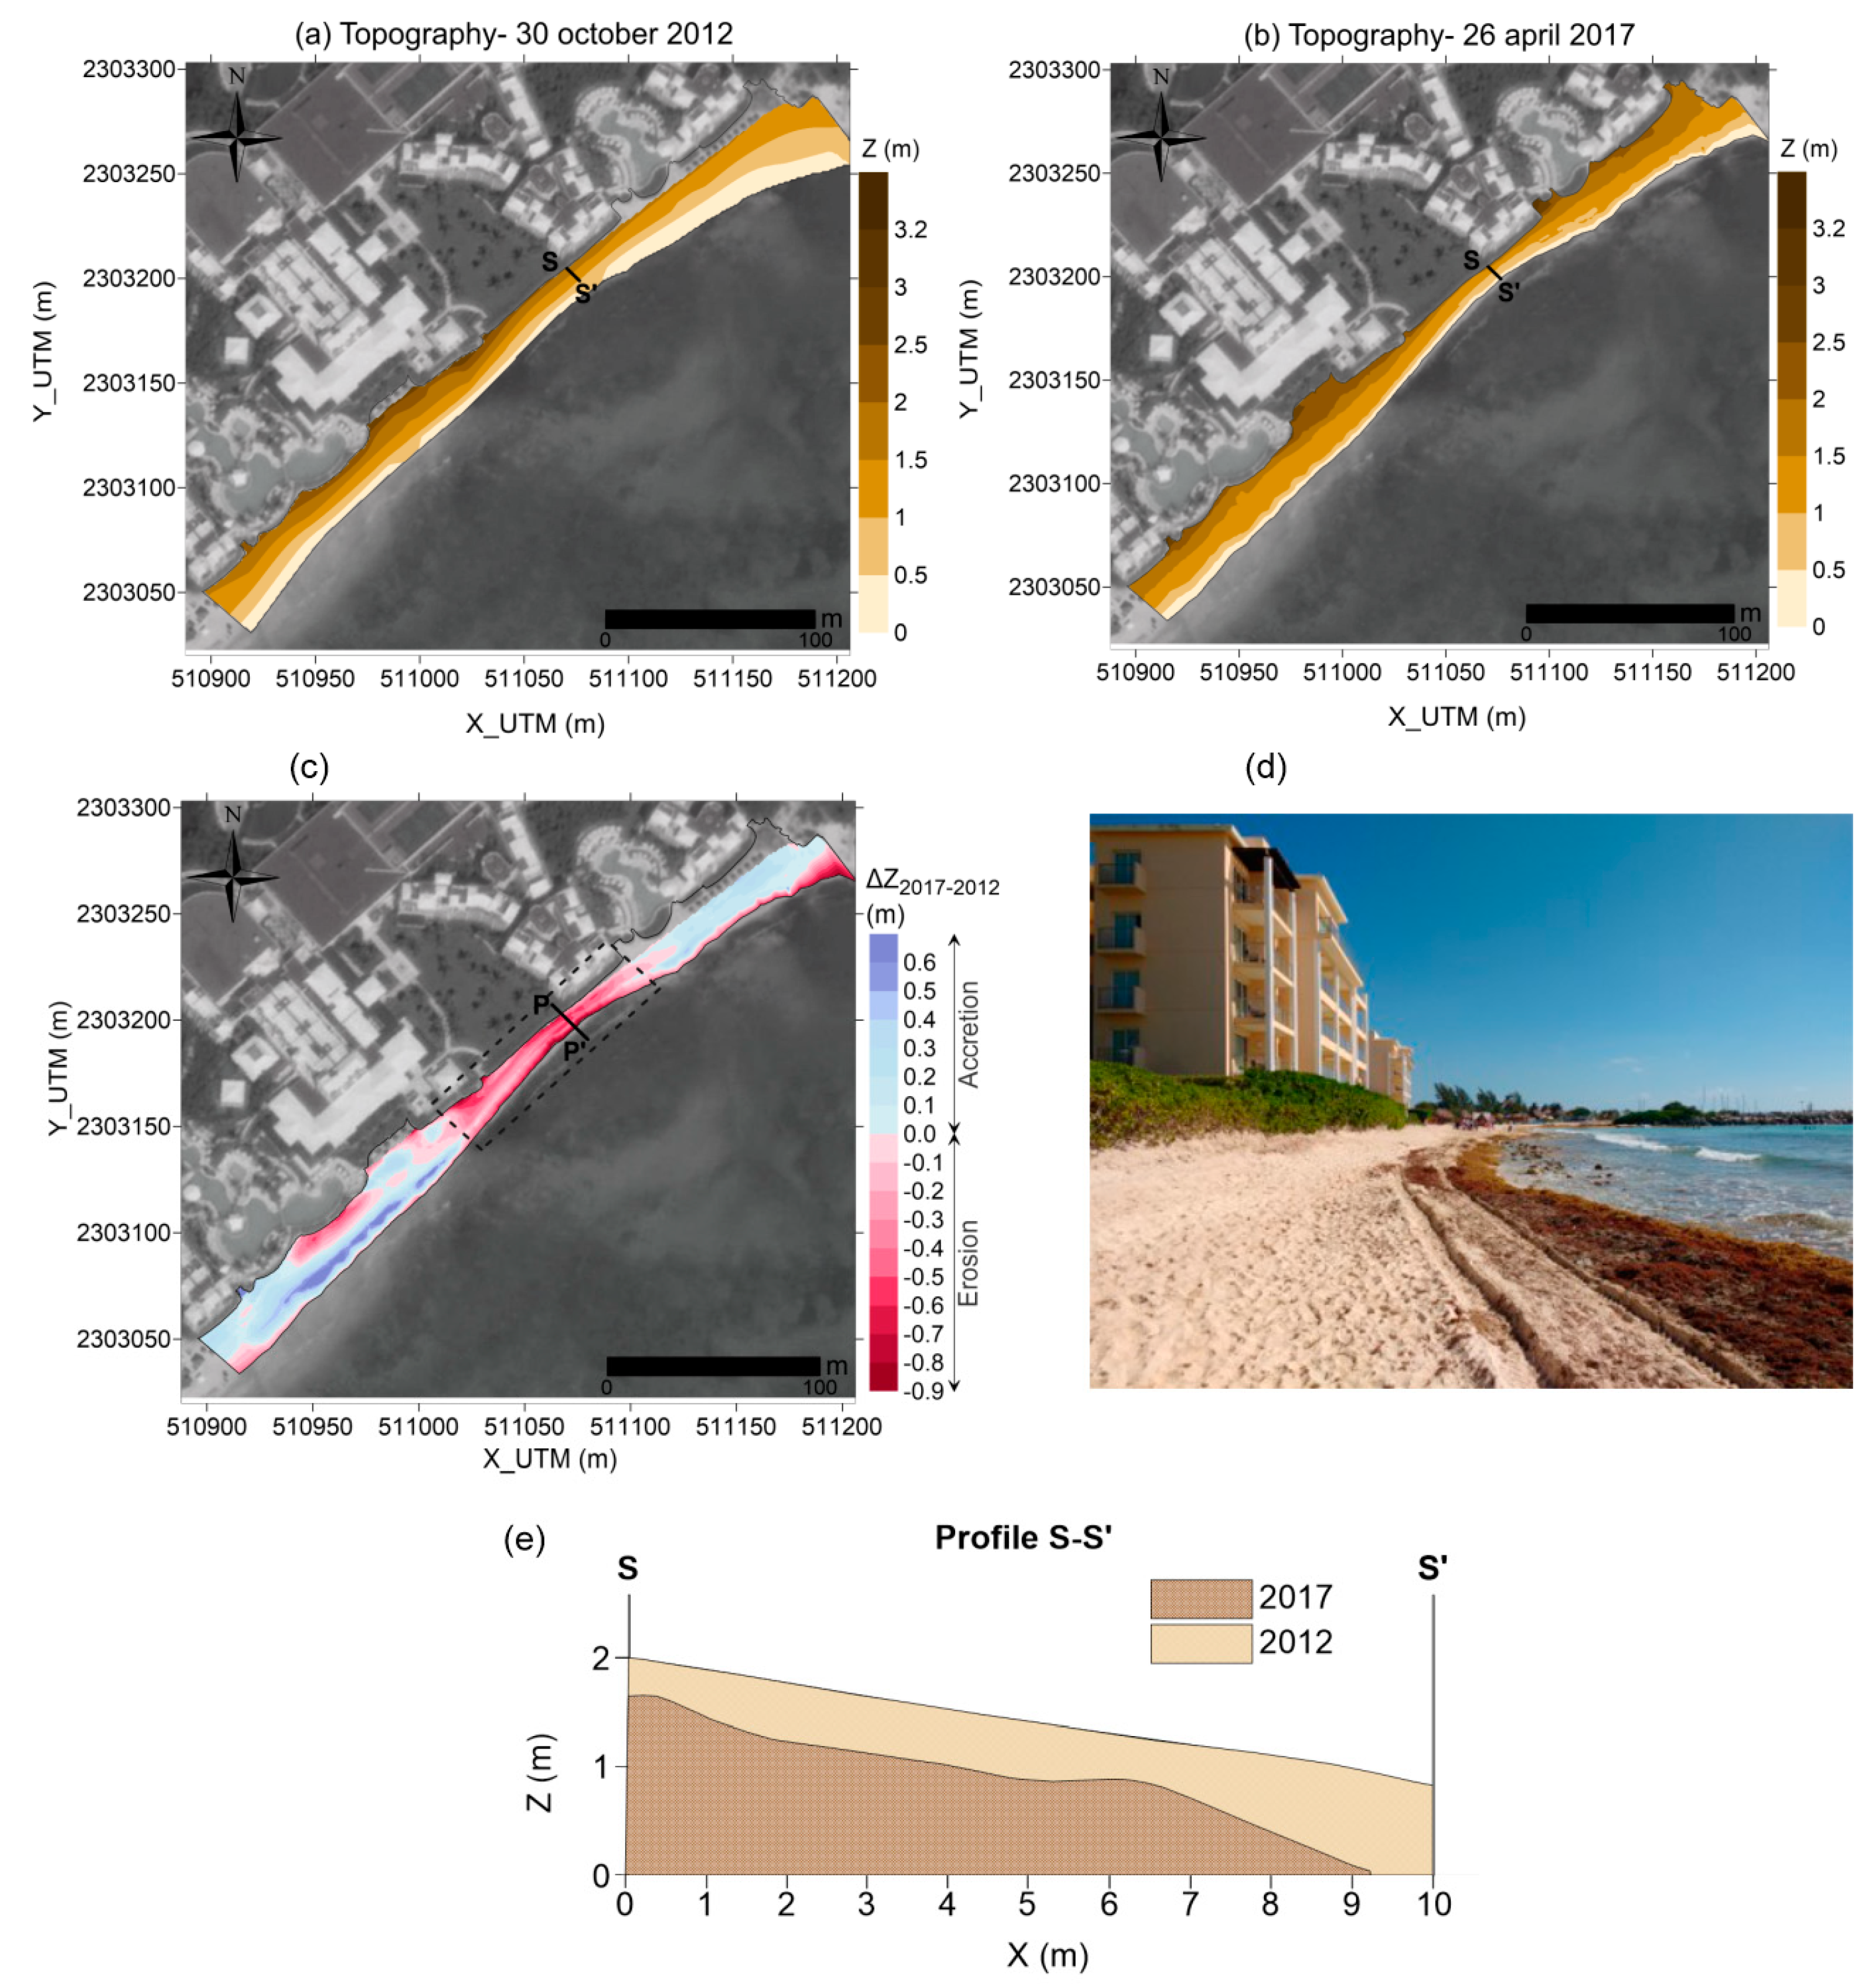
4.1. Beach Evolution & Diagnosis
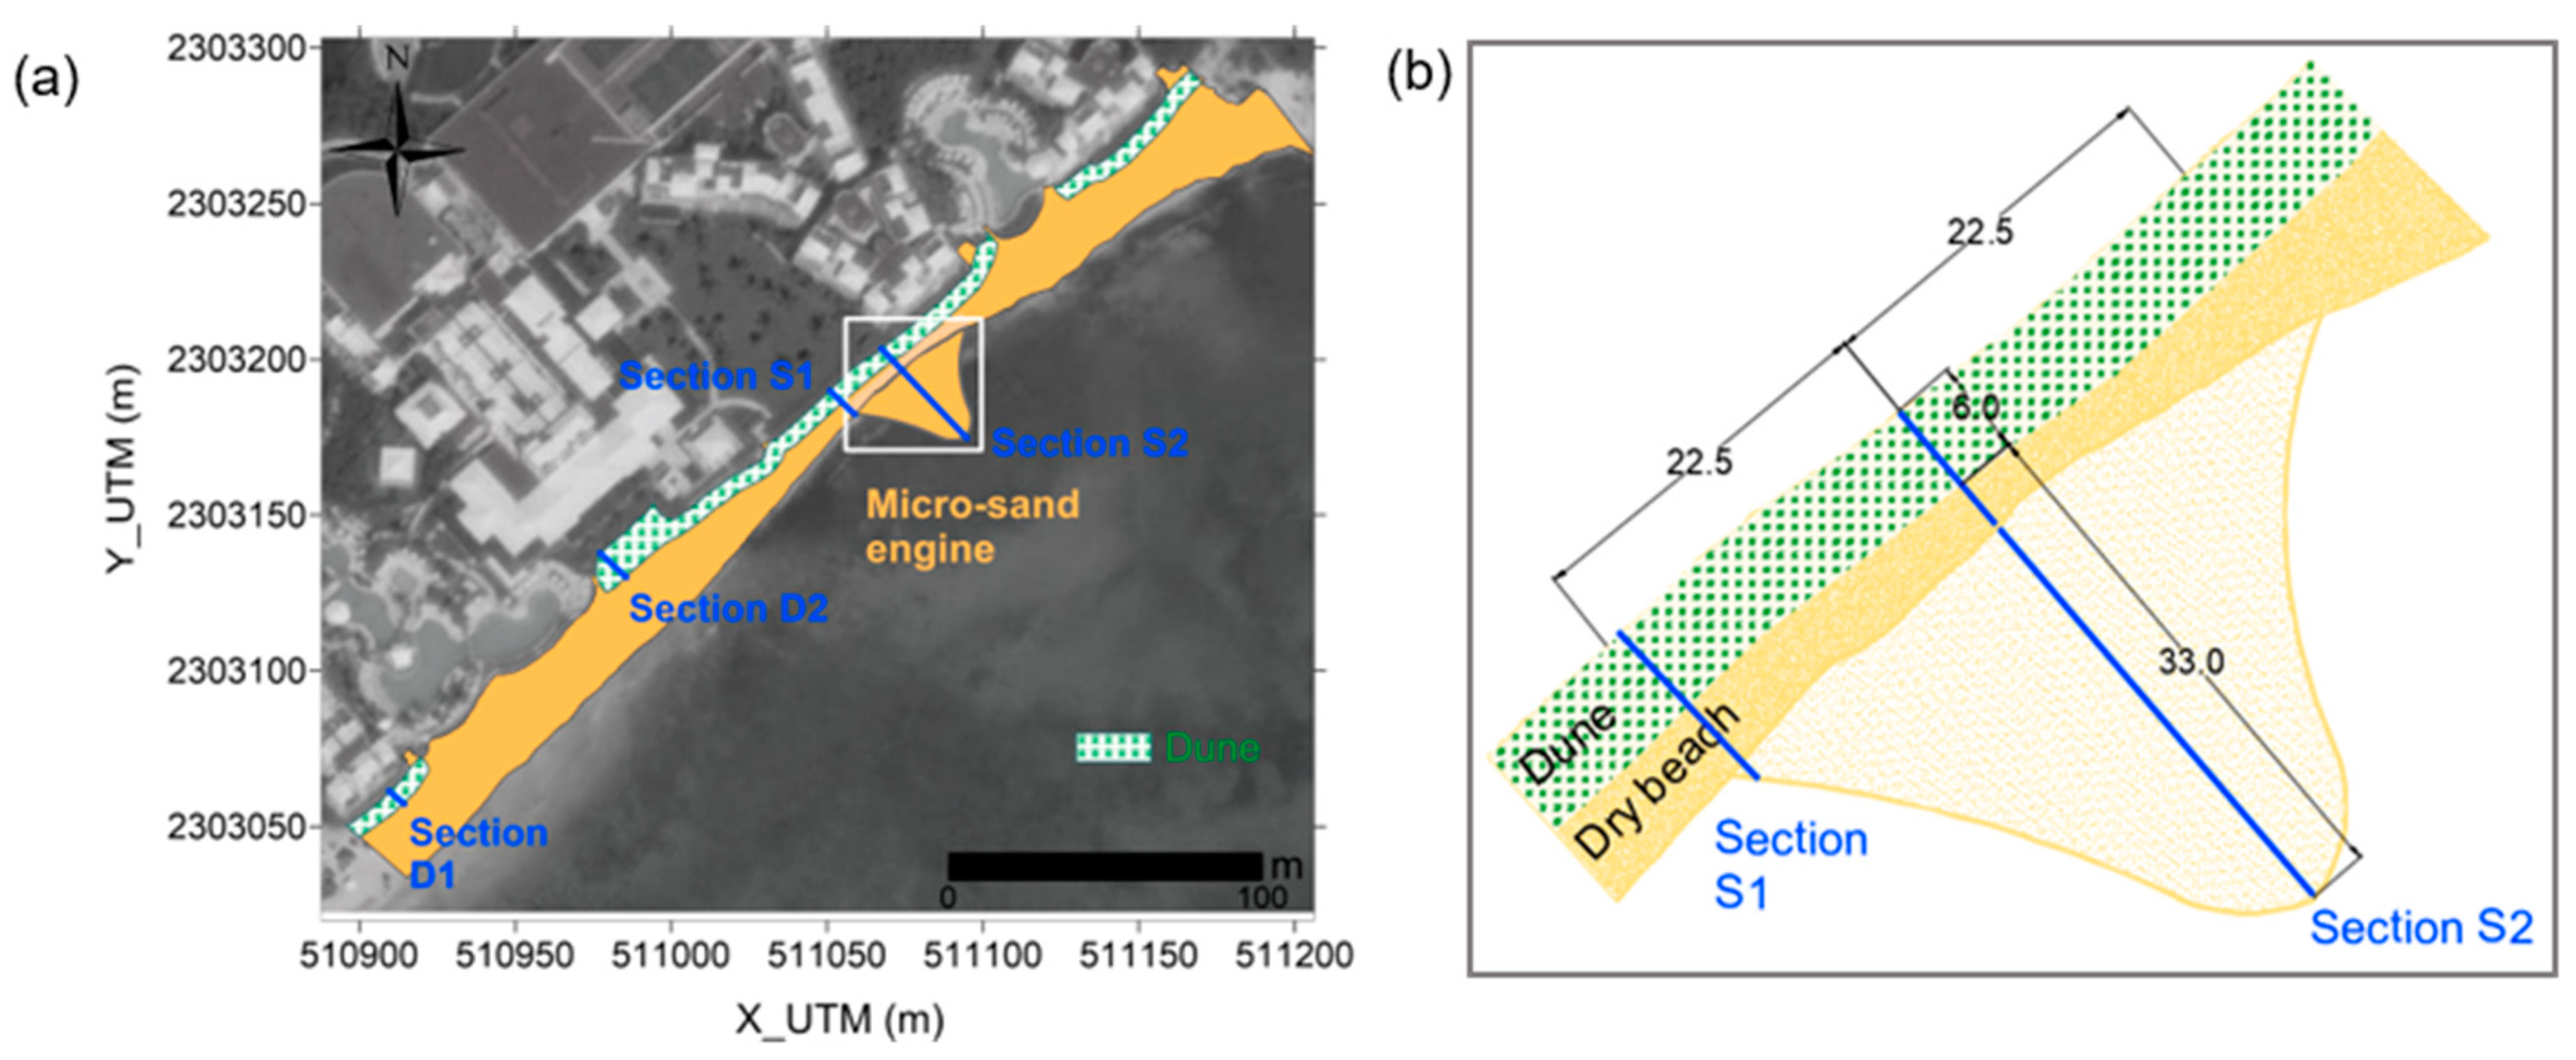
4.2. The Micro Sand Engine Project
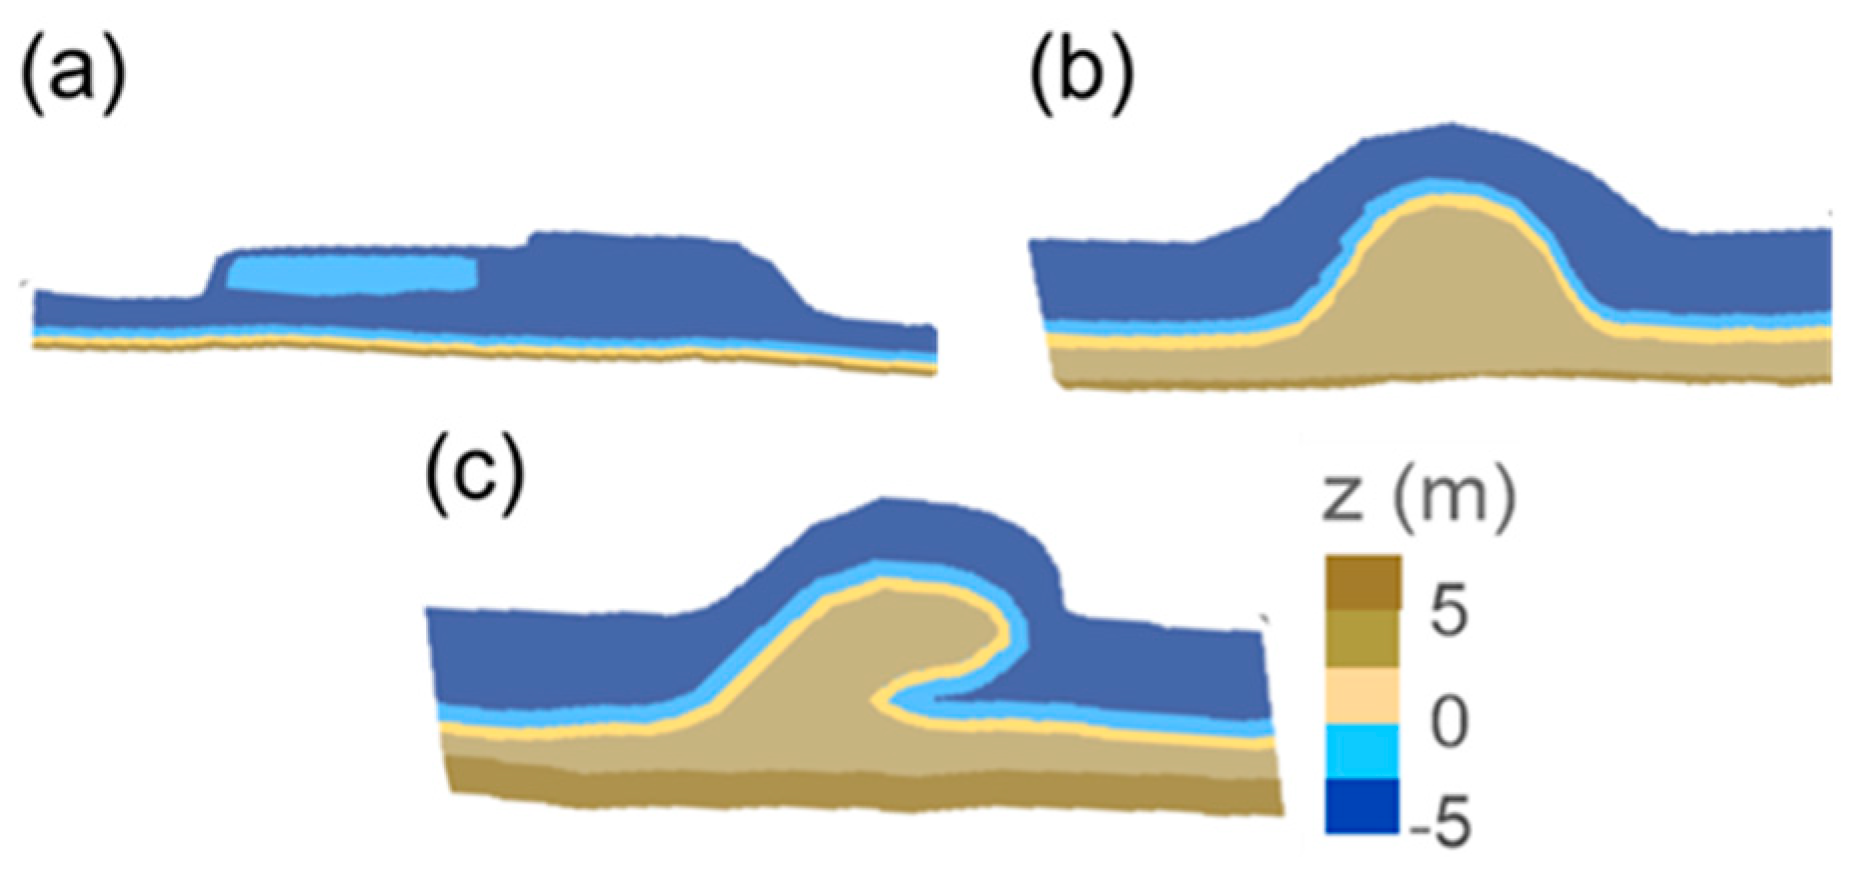
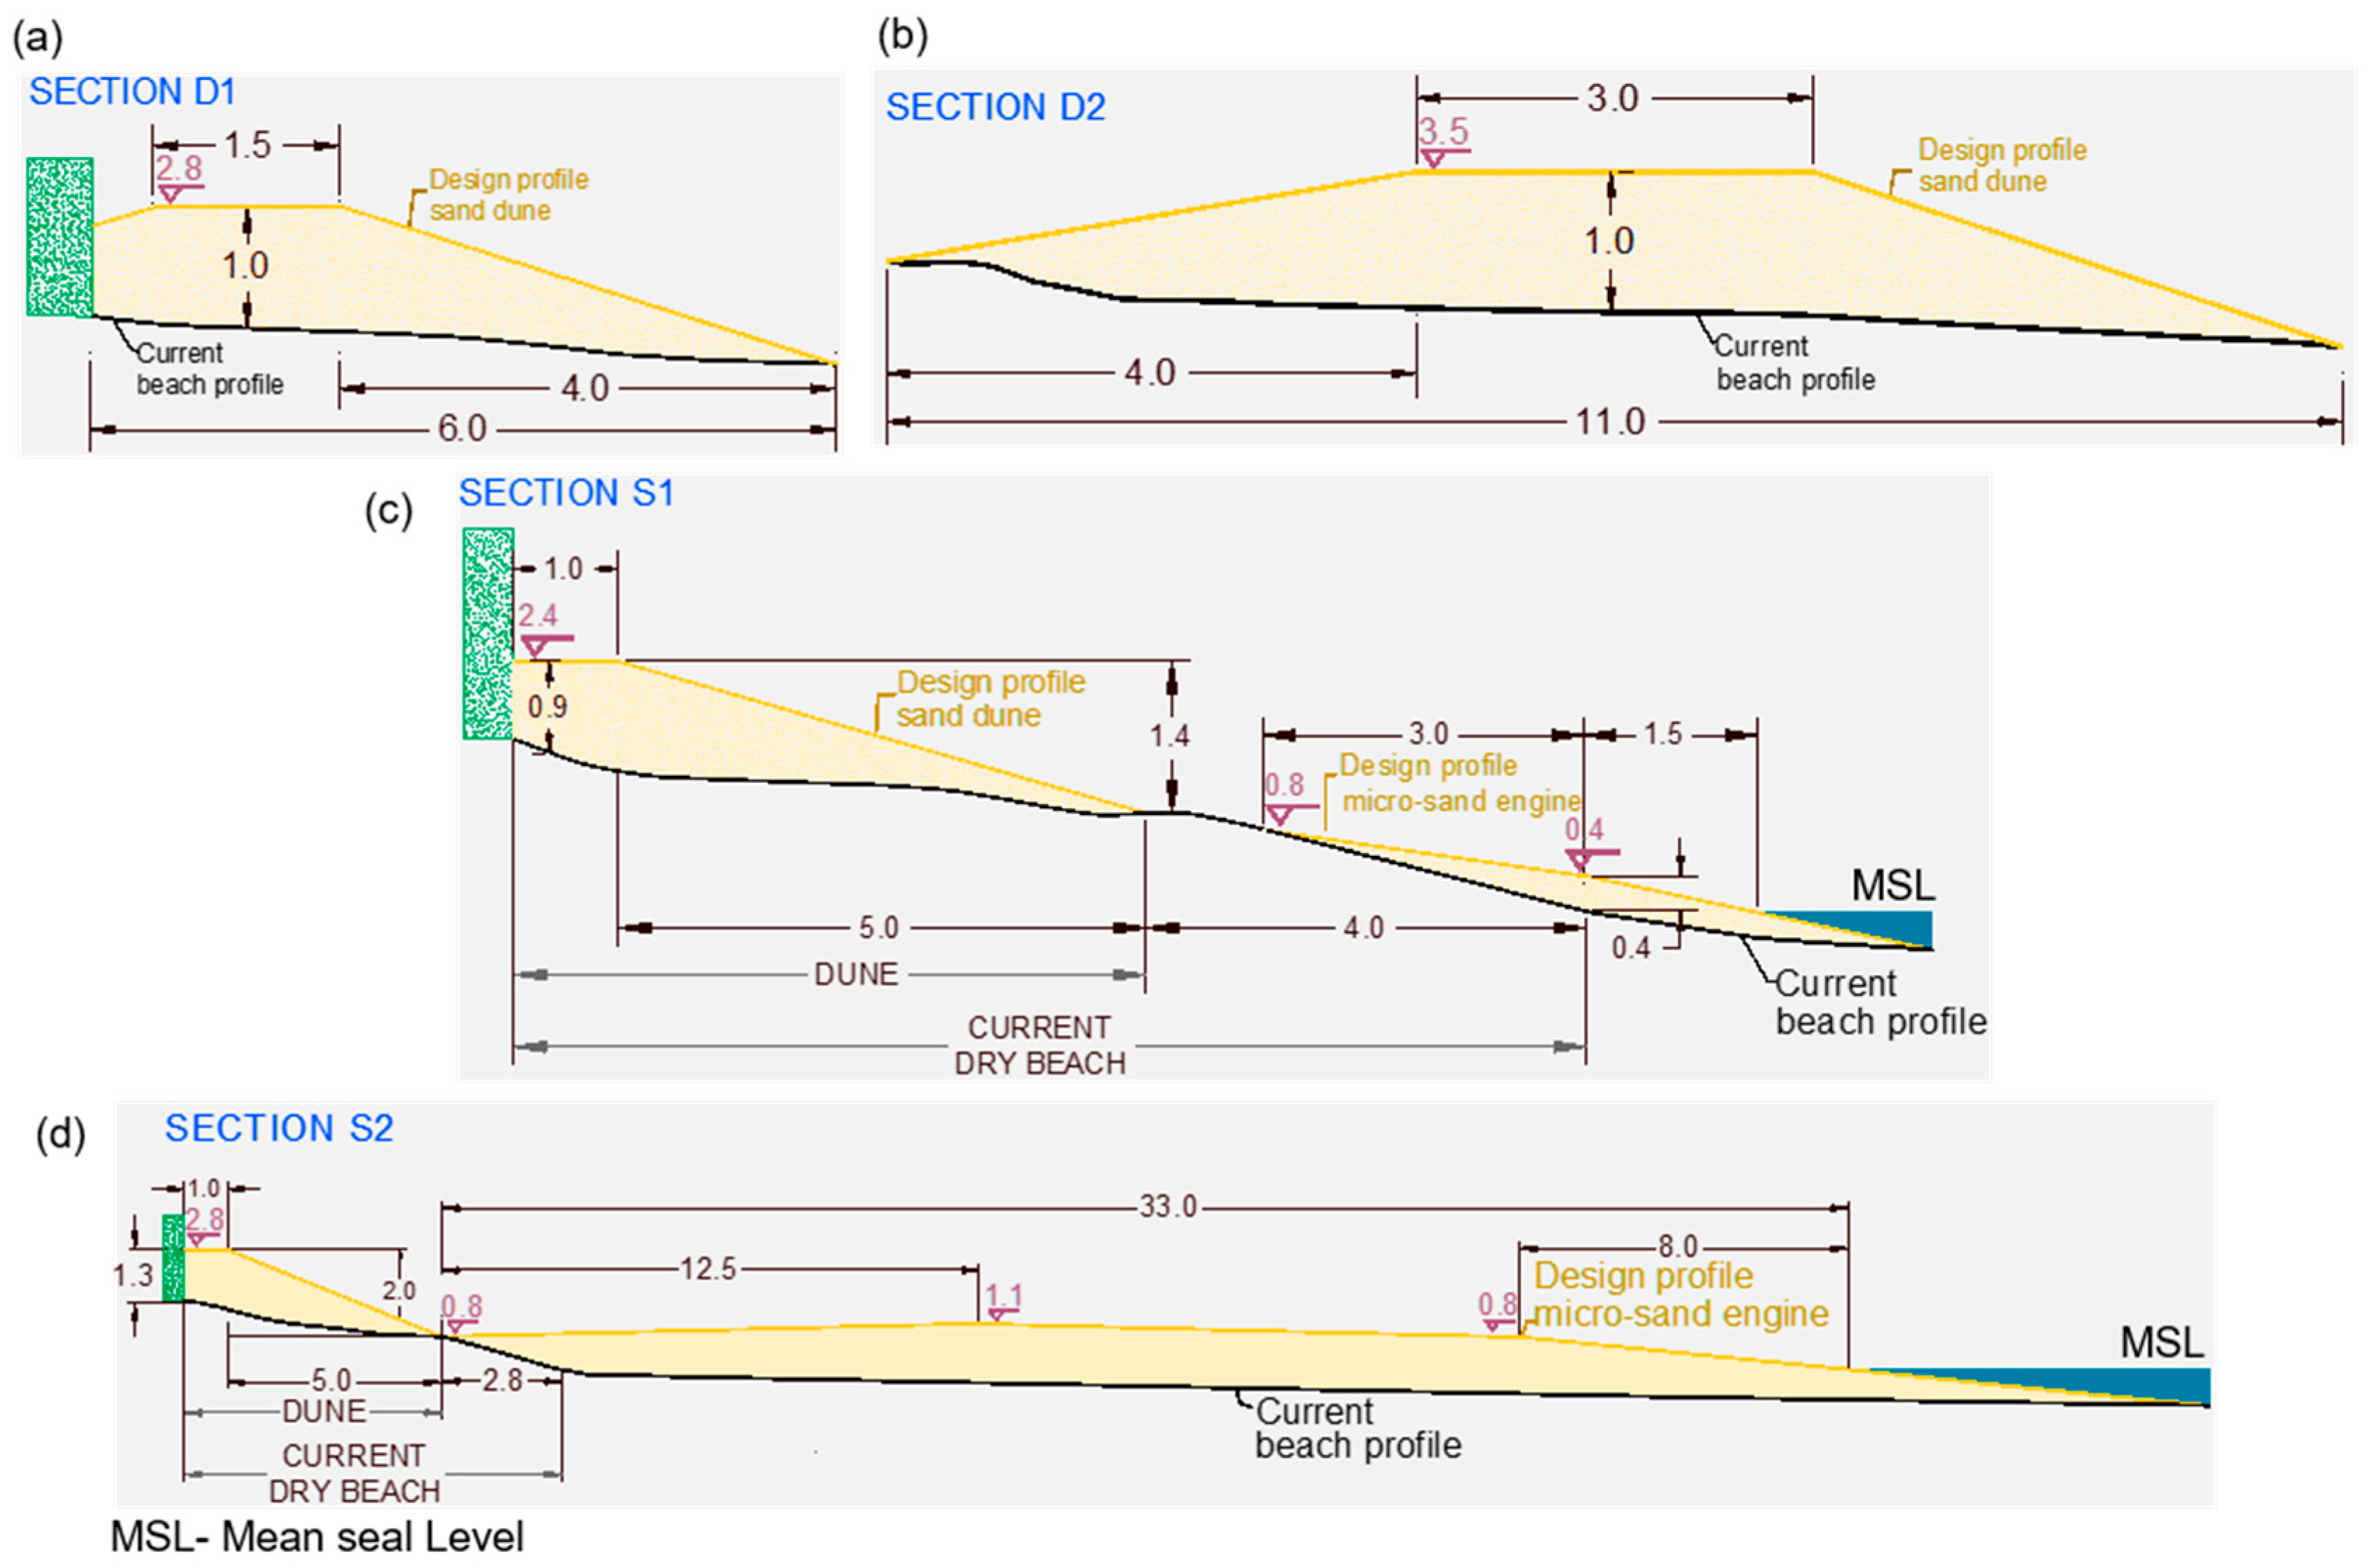
Design of the Micro Sand Engine and Sand Dune
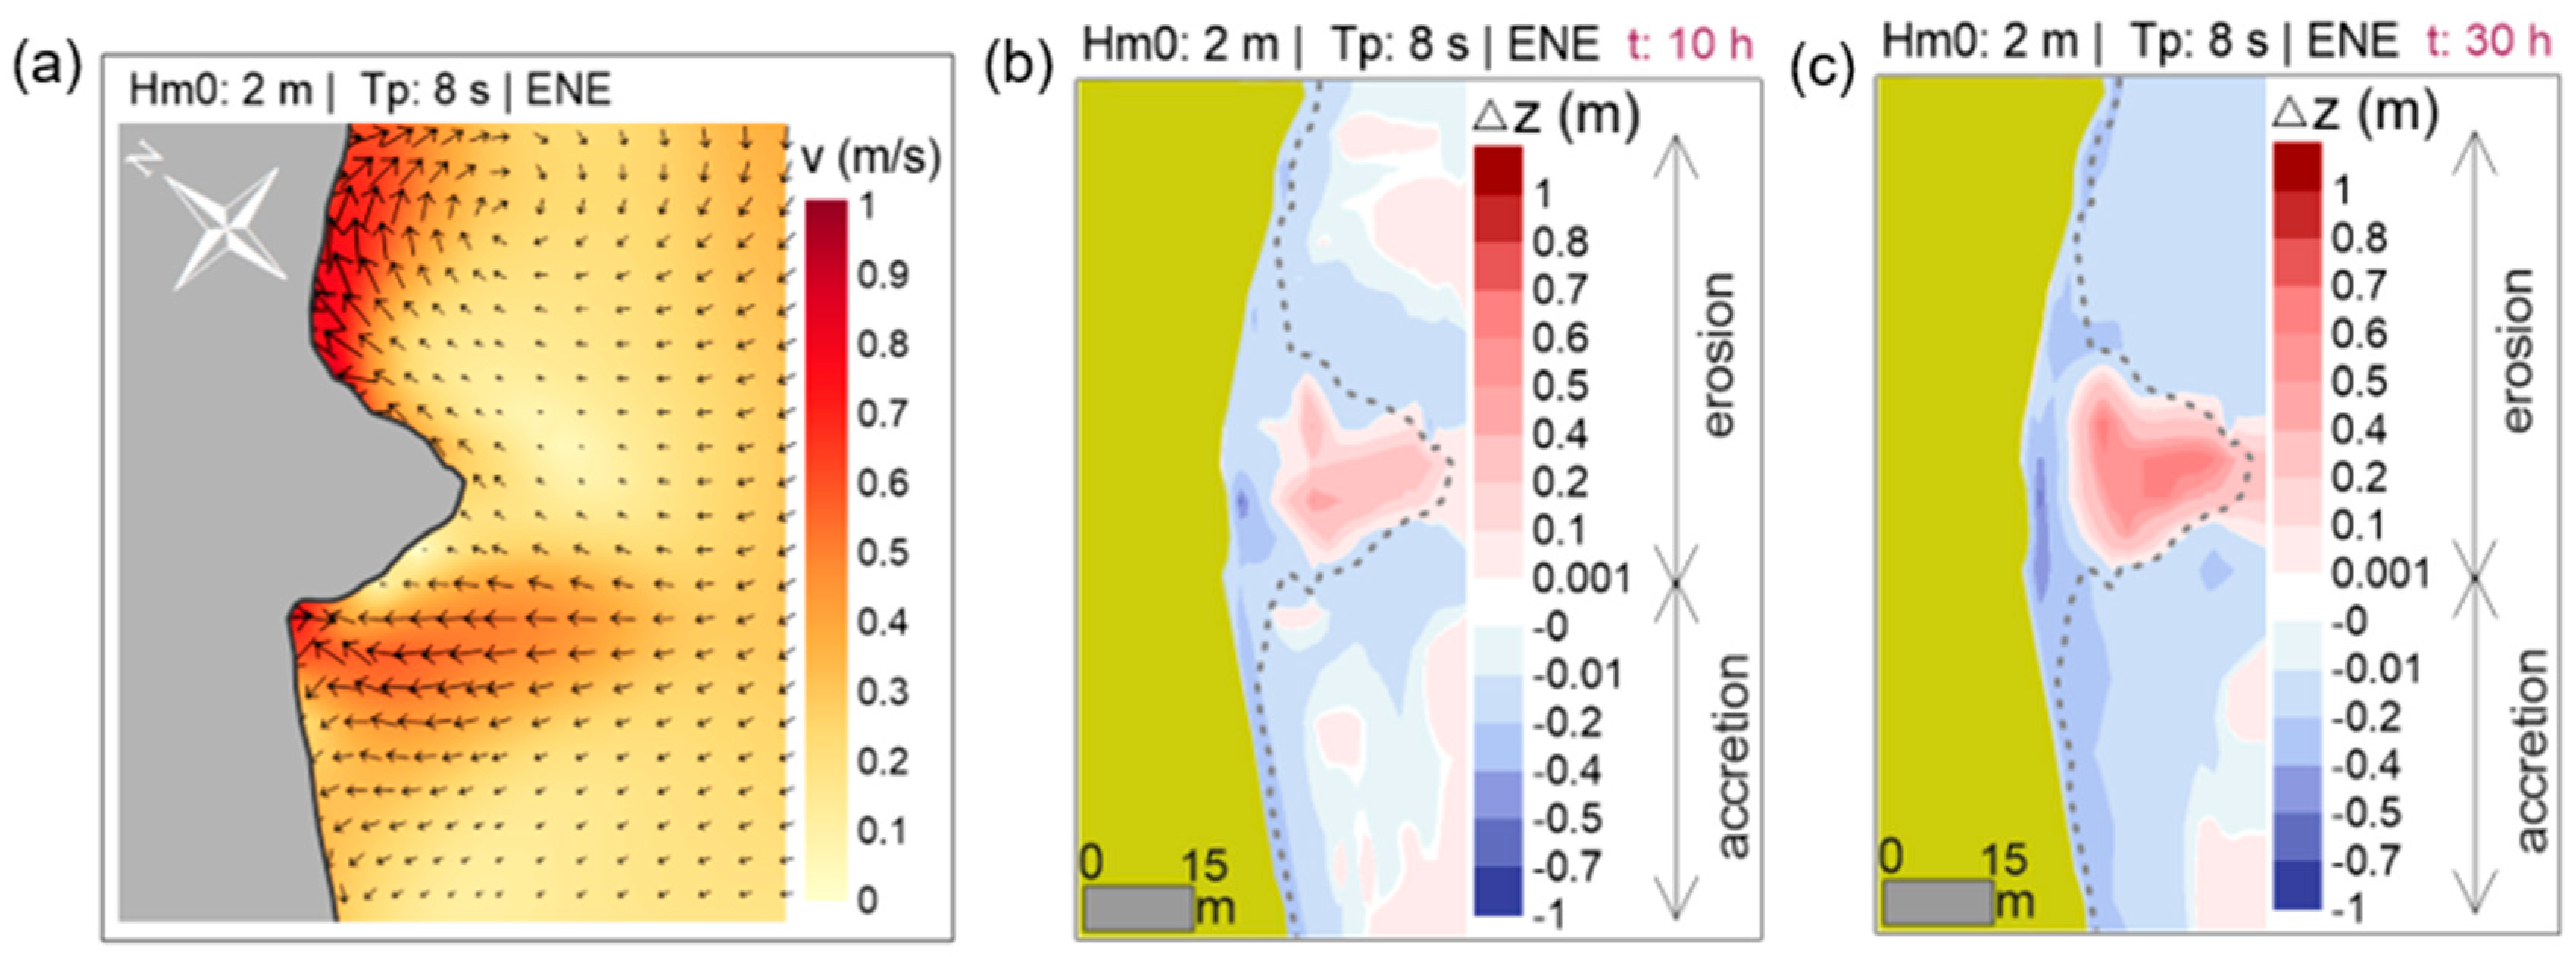
4.3. Modeling the Morphological Response of the Micro Sand Engine
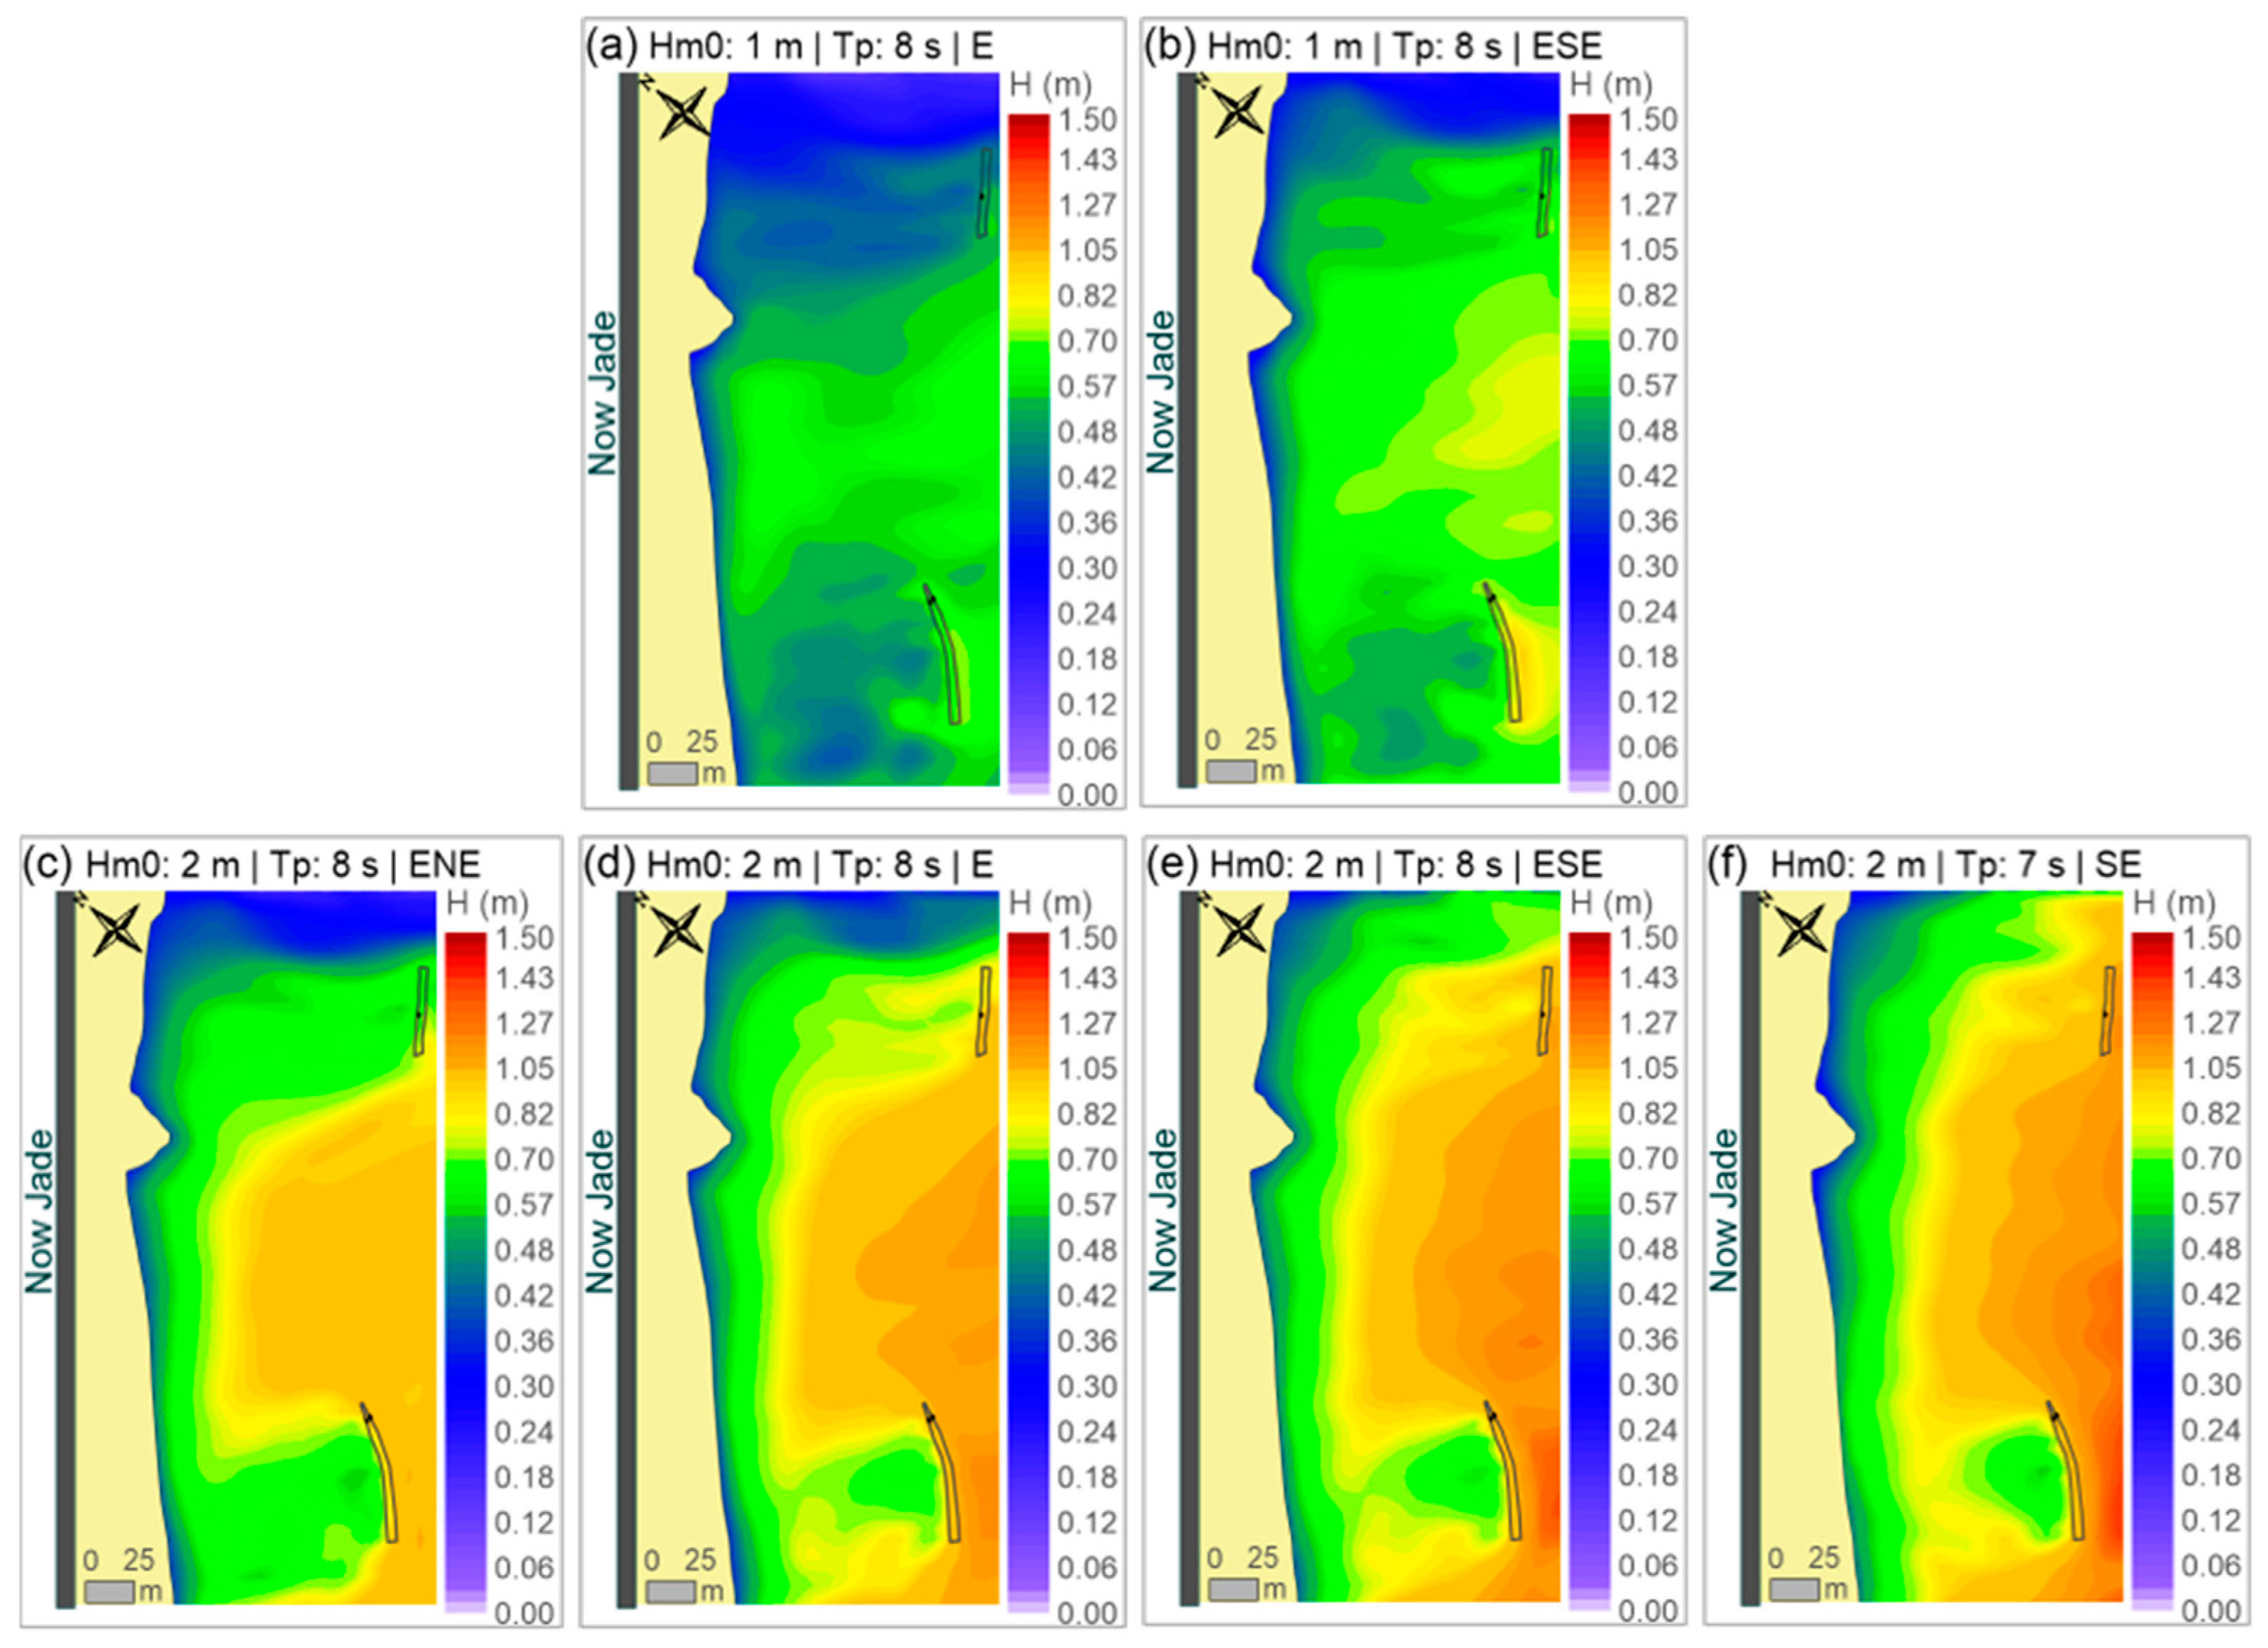
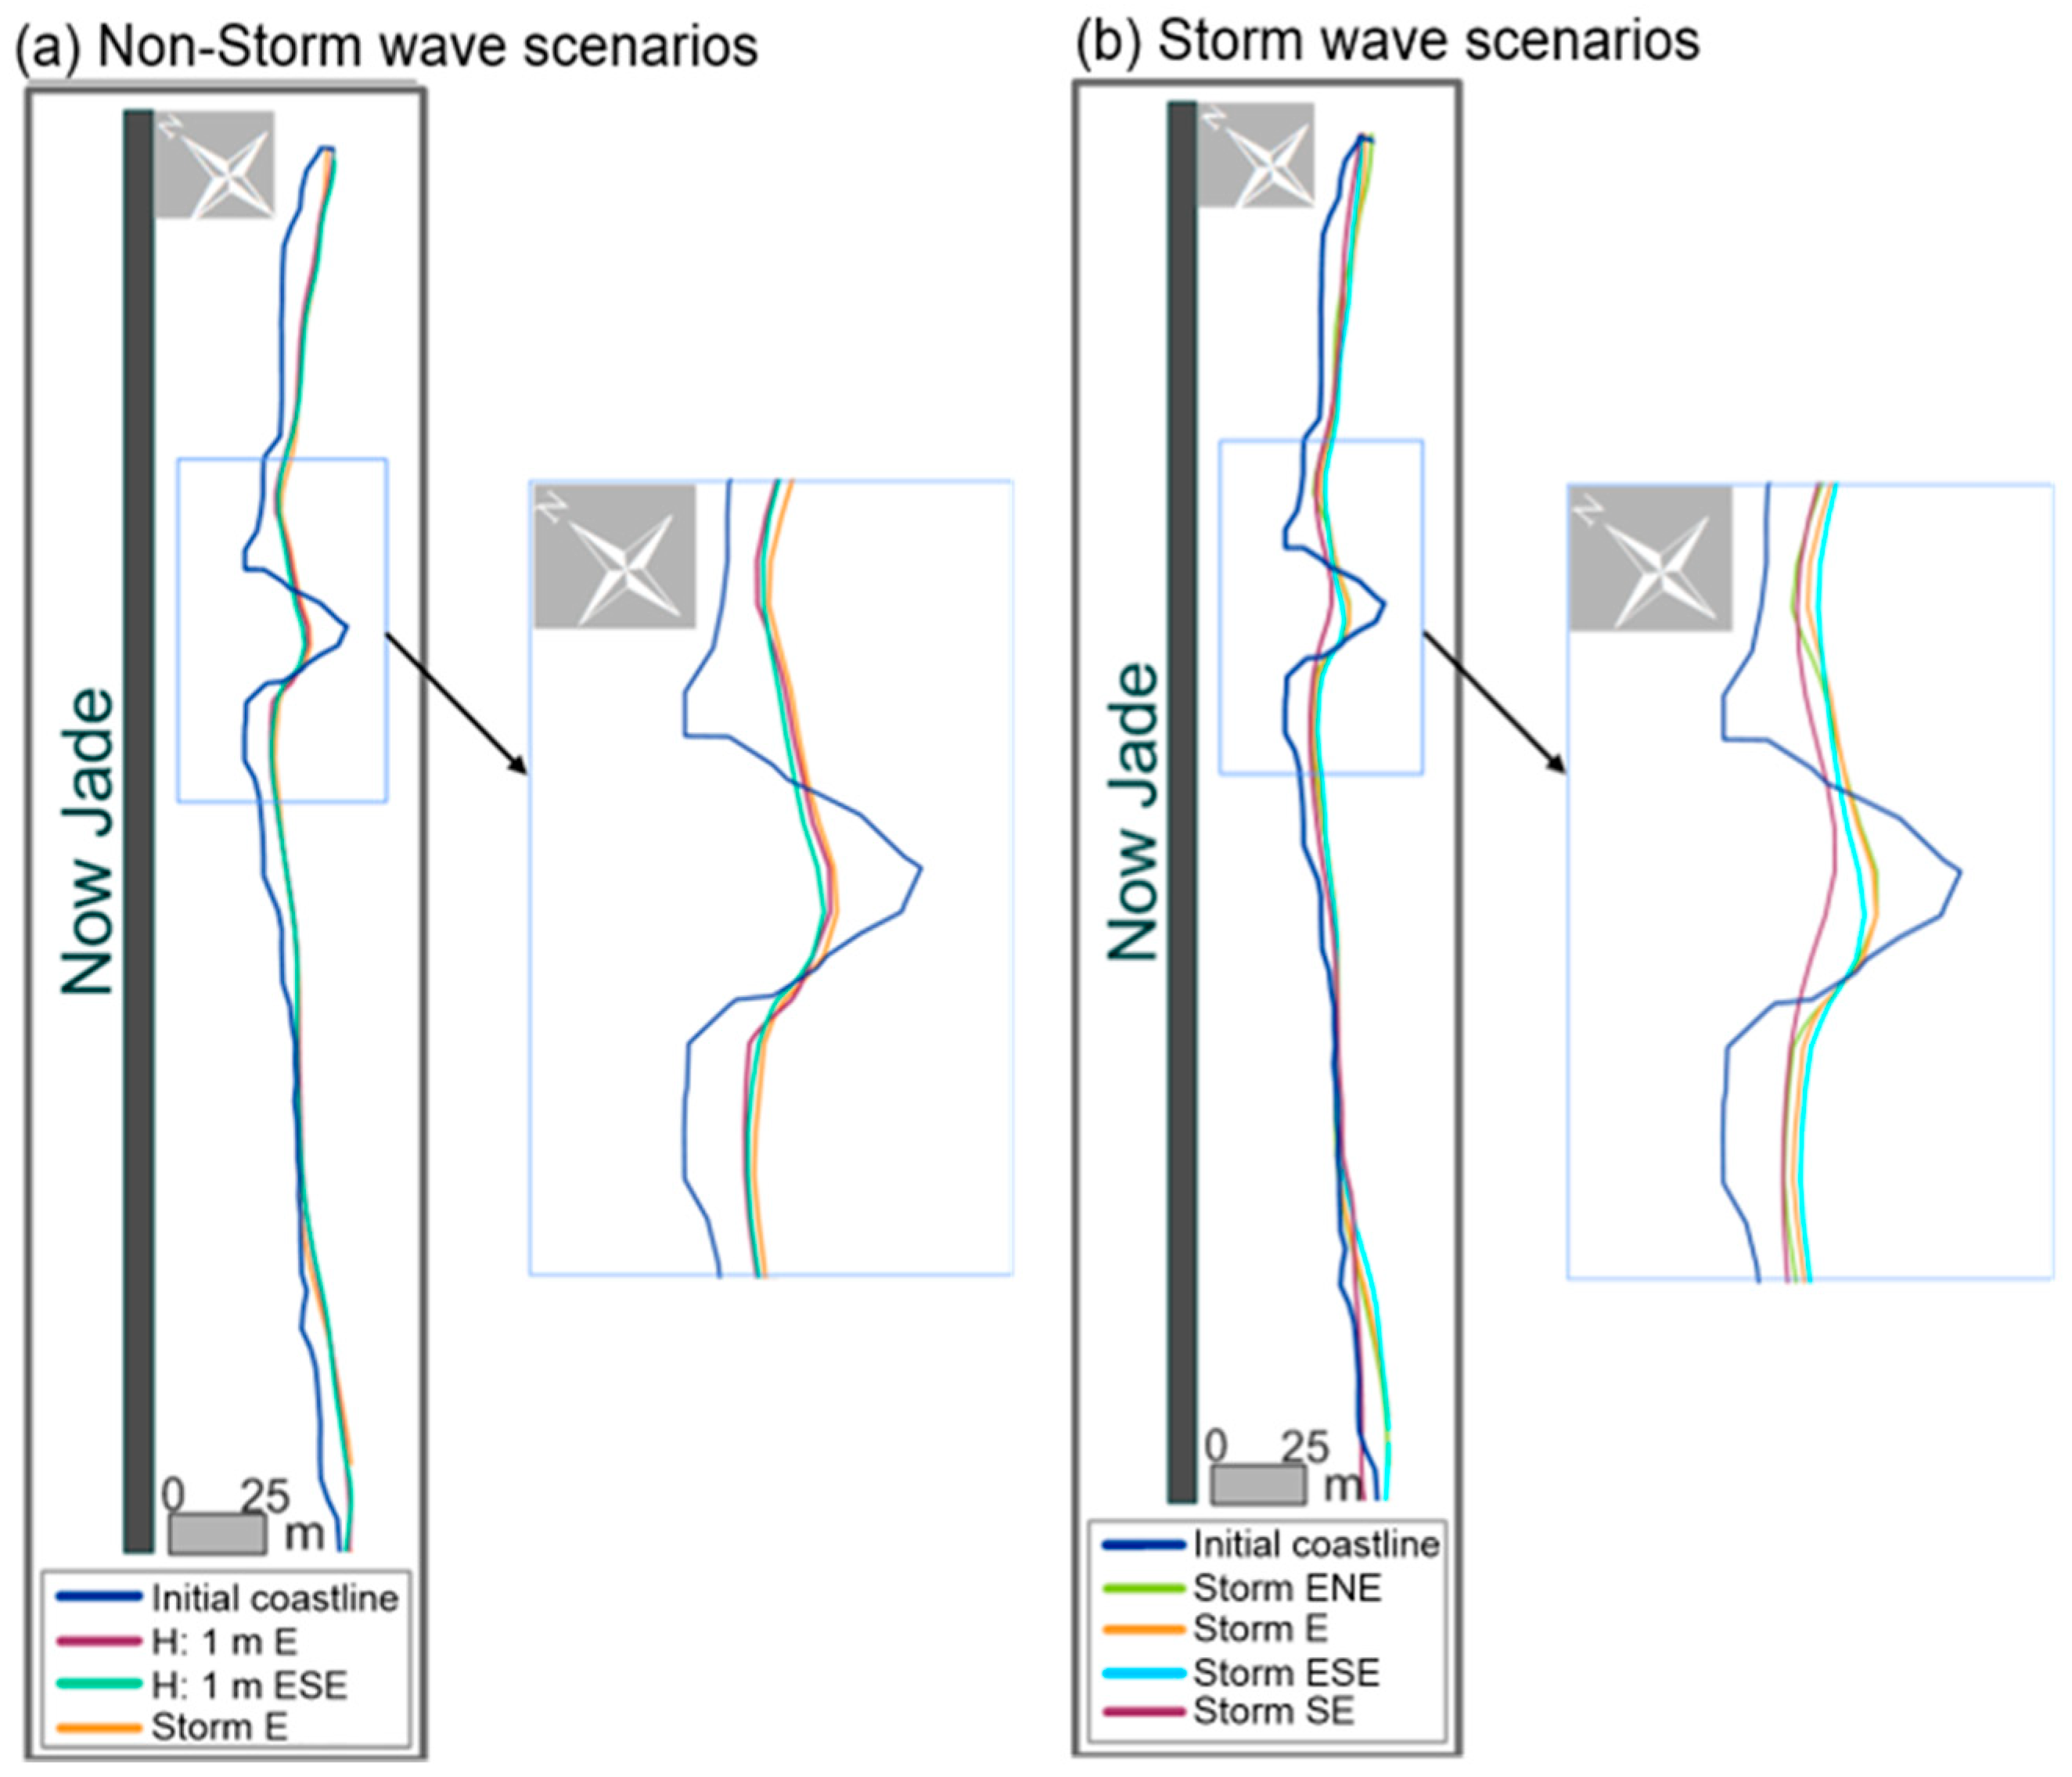
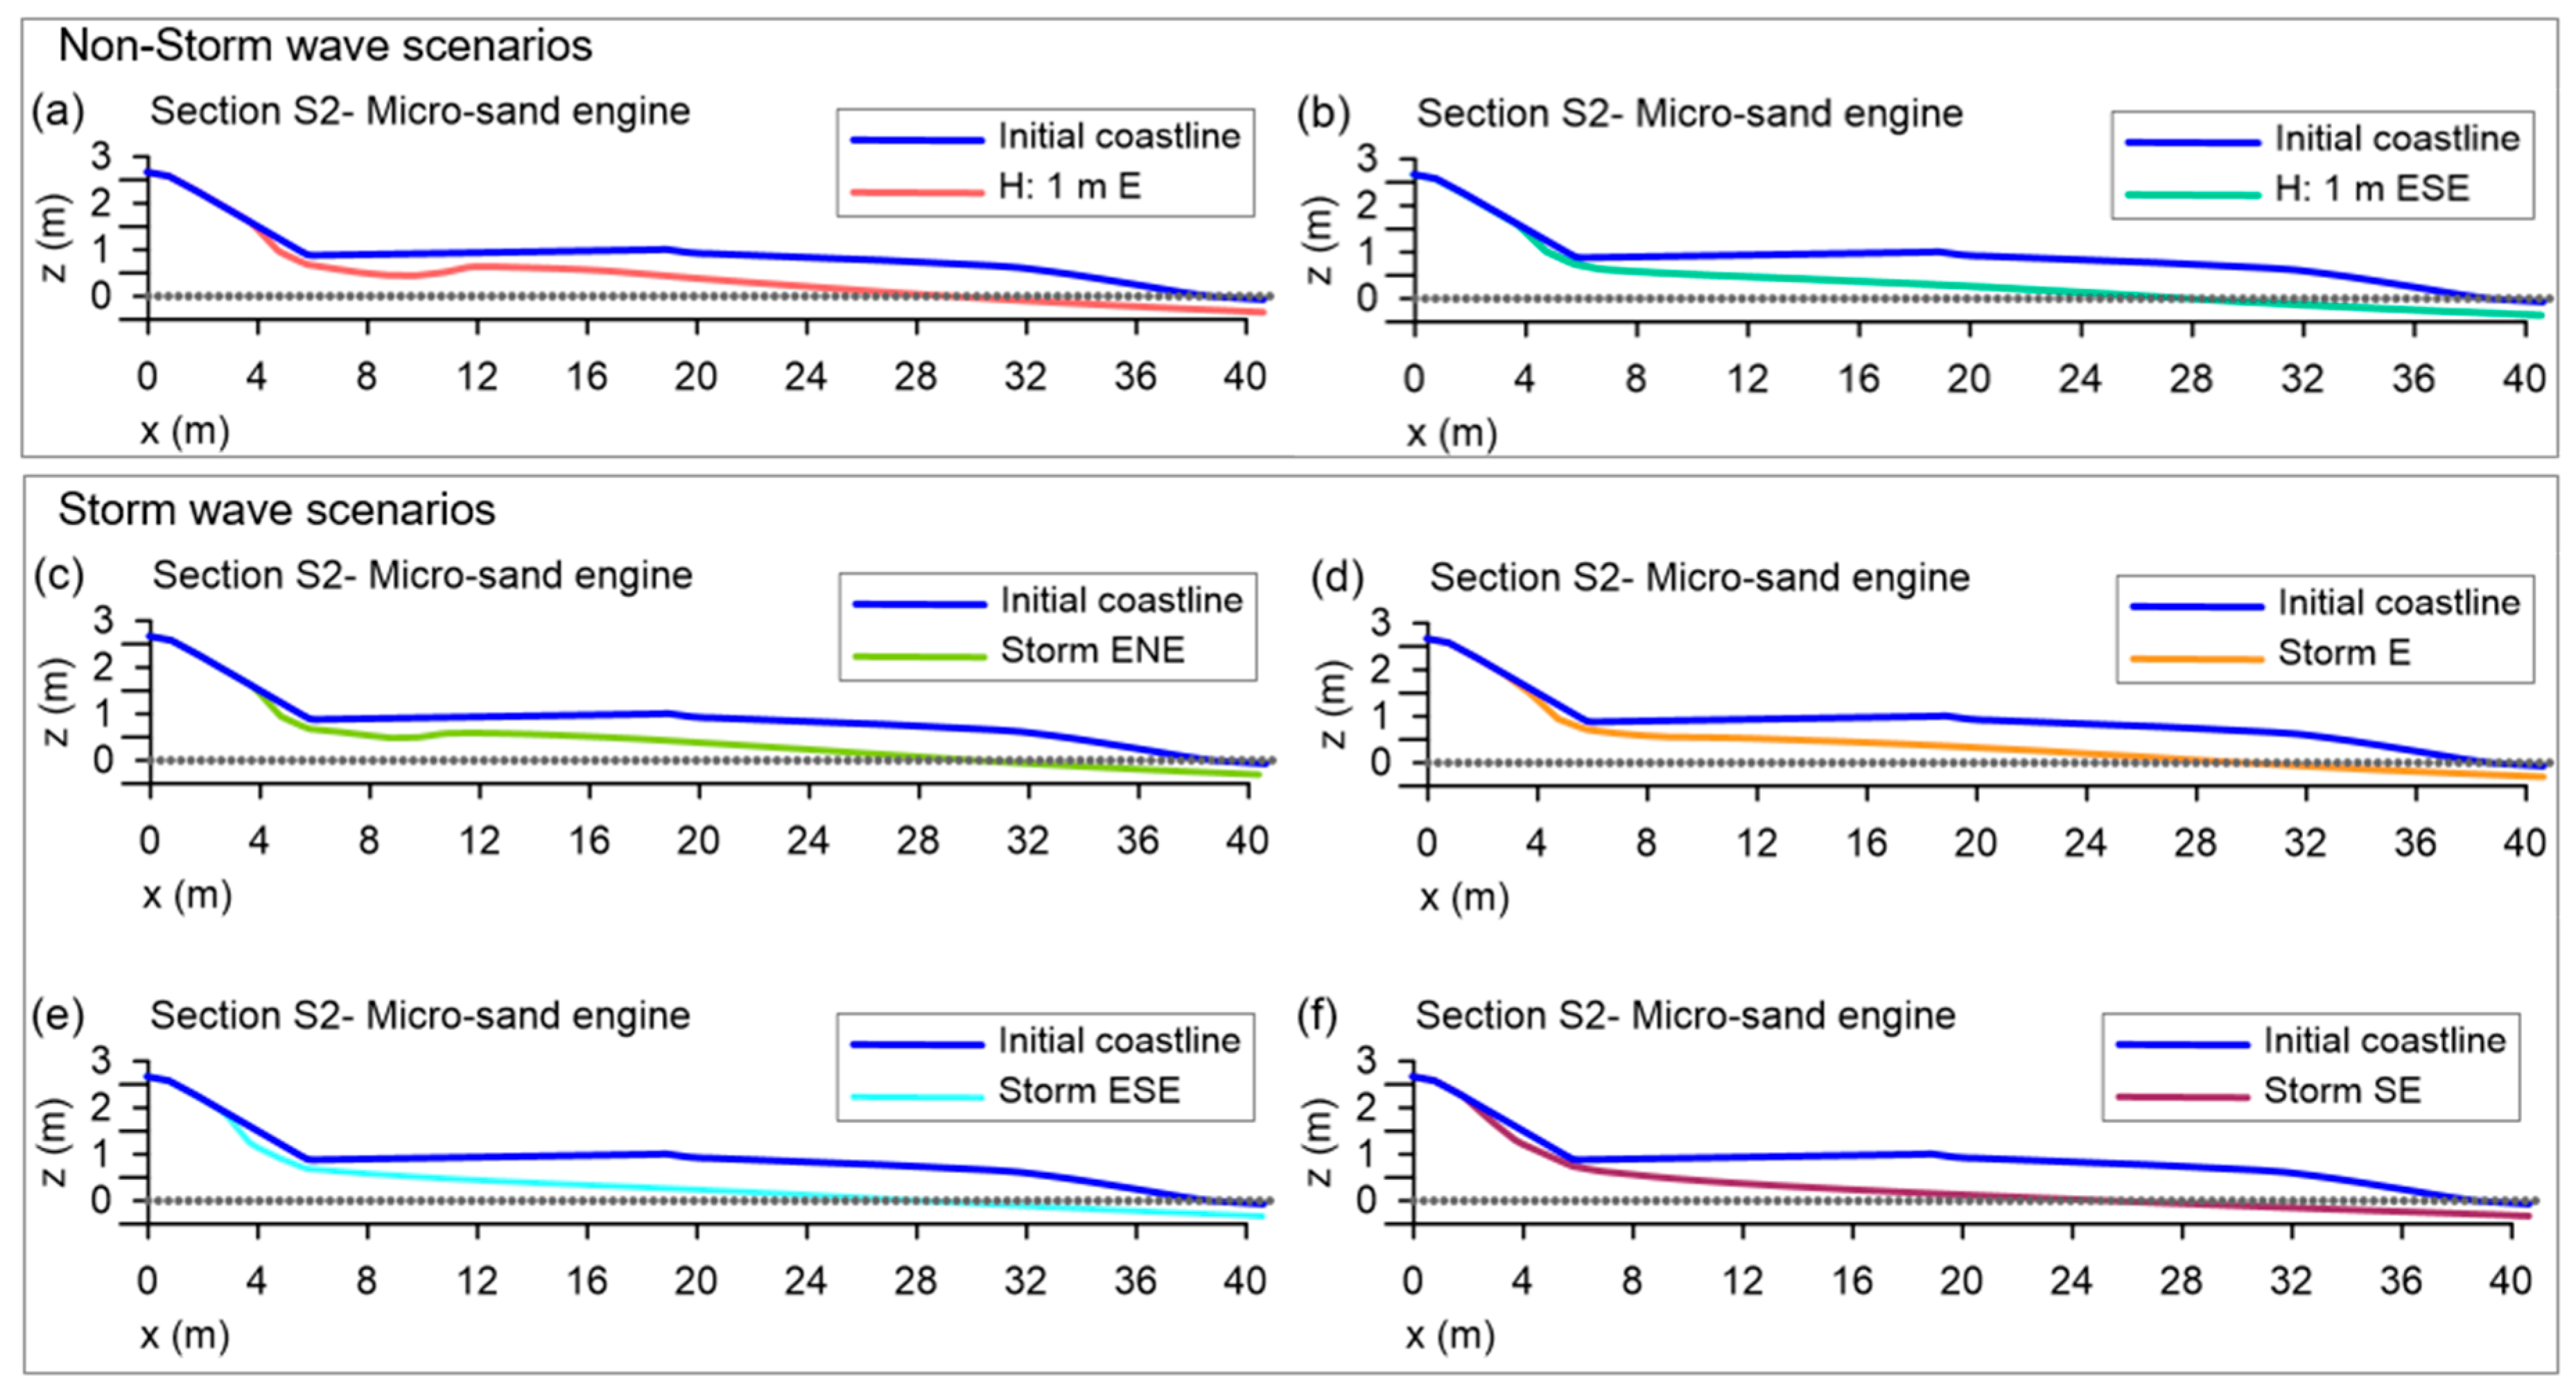
4.3.1. Modeled Wave Scenarios
4.3.2. Model Results
5. Discussion and Conclusions
Author Contributions
Funding
Acknowledgments
Conflicts of Interest
References
- McKenna, J.; MacLeod, M.; Power, J.; Cooper, A. Rural Beach Management: A Good Practice Guide; Donegal County Council, Lifford, Co.: Donegal, Ireland, 2000. [Google Scholar]
- Buisson, P.; Rousset, A.; ANCORIM; Massey, J. ANCORIM—Overview of Soft Coastal Protection Solutions; BRGM/ONF: Bordeaux, France, 2012; 56p. [Google Scholar]
- Willems, G.; Abecasis, M.; Catena, M.M. Inland & Maritime Waterways & Ports. Proceedings of the Technical Sessions; Elsevier: Amsterdam, The Netherlands, 2013. [Google Scholar]
- Gianou, K. Soft Shoreline Stabilization: Shoreline Master Program Planning and Implementation Guidance; Shorelands and Environmental Assistance Program, Washington Department of Ecology: Olympia, WA, USA, 2014; Publication No. 14-06-009. [Google Scholar]
- Nguyen, V.T.; Vu, M.T.; Nguyen, T.V. Evaluation of Beach Nourishment Performance in Ba Lang Beach Using Numerical Modelling. In Proceedings of the International Conference on Asian and Pacific Coasts, Singapore, 25–28 September 2019; pp. 609–616. [Google Scholar]
- Dean, R.G.; Yoo, C.H. Beach-nourishment performance predictions. J. Waterw. Port. C-ASCE 1992, 118, 567–586. [Google Scholar] [CrossRef]
- Kuang, C.; Pan, Y.; Zhang, Y.; Liu, S.; Yang, Y.; Zhang, J.; Dong, P. Performance evaluation of a beach nourishment project at West Beach in Beidaihe, China. J. Coast. Res. 2011, 27, 769–783. [Google Scholar]
- Walton, T.L., Jr.; Cheng, J.; Wang, R.; Manausa, M. Modeling of three beach fill projects. Ocean Eng. 2005, 32, 557–569. [Google Scholar] [CrossRef]
- Karambas, T.V.; Samaras, A.G. Soft shore protection methods: The use of advanced numerical models in the evaluation of beach nourishment. Ocean Eng. 2014, 92, 129–136. [Google Scholar] [CrossRef]
- Fricke, B.; Weilbeer, H. Numerical Modeling of Shoreface Nourishments in the Schleswig-Holstein Wadden Sea. Coast. Struct. 2019, 2019, 773–780. [Google Scholar]
- Huisman, B.J.; Walstra, D.J.R.; Radermacher, M.; de Schipper, M.A.; Ruessink, B.G. Observations and modelling of shoreface nourishment behaviour. J. Mar. Sci. Eng. 2019, 7, 59. [Google Scholar] [CrossRef] [Green Version]
- Wang, P.; Roberts, T.M.; Elko, N.A.; Beck, T.M. Factors controlling the first year performance of eight adjacent beach nourishment projects, west-central Florida, USA. In Proceedings of the ICCE 2008: 31st International Conference on Coastal Engineering, Hamburg, Germany, 31 August–5 September 2008; pp. 2532–2544. [Google Scholar]
- Roberts, T.M.; Wang, P. Four-year performance and associated controlling factors of several beach nourishment projects along three adjacent barrier islands, west-central Florida, USA. Coast. Eng. 2012, 70, 21–39. [Google Scholar] [CrossRef]
- Rivero, O.; Astrup, S.K. Project Building with Nature (EU-InterReg); Ministry of Environment and Food of Denmark: Copenhagen, Denmark, 2018. [Google Scholar]
- Waterman, R.E. Integrated Coastal Policy Via Building with Nature. Ph.D. Thesis, TU Delft, Delft, The Netherlands, December 2010. [Google Scholar]
- De Vriend, H.J.; van Koningsveld, M.; Aarninkhof, S.G.; de Vries, M.B.; Baptist, M.J. Sustainable hydraulic engineering through building with nature. J. Hydro Environ. Res. 2015, 9, 159–171. [Google Scholar] [CrossRef]
- Mulder, J.P.; Tonnon, P.K. Sand Engine: Background and design of a mega-nourishment pilot in the Netherlands. In Proceedings of the ICCE 2010: 32nd Conference on Coastal Engineering, Shanghai, China, 30 June–5 July 2010; Volume 30, pp. 3805–3814. [Google Scholar]
- Mulder, J.P.M.; Stive, M.J. Zandmotor (Sand Motor): Building with nature. In Proceedings of the 25th ICID European Regional Conference, Integrated Water Management for Multiple Land Use in Flat Coastal Areas, Groningen, The Netherlands, 16–20 May 2011. Paper III-21. ICID. [Google Scholar]
- Stive, M.J.F.; De Schipper, M.A.; Luijendijk, A.P.; Ranasinghe, R.W.M.R.J.B.; Van Thiel De Vries, J.S.M.; Aarninkhof, S.; Marx, S. The Sand Engine: A solution for vulnerable deltas in the 21st century? In Proceedings of the Coastal Dynamics 2013: 7th International Conference on Coastal Dynamics, Arcachon, France, 24–28 June 2013. [Google Scholar]
- Van Slobbe, E.; de Vriend, H.J.; Aarninkhof, S.; Lulofs, K.; de Vries, M.; Dircke, P. Building with Nature: In search of resilient storm surge protection strategies. Nat. Hazards. 2013, 66, 1461–1480. [Google Scholar] [CrossRef]
- Luijendijk, A.P.; van Oudenhoven, A. The Sand Motor: A Nature-Based Response to Climate Change. Findings and Reflections of the Interdisciplinary Research Program Naturecoast; TU Delft Publishers: Delft, The Netherlands, 2019. [Google Scholar]
- Kaji, A.O. Assessment of the Variables Influencing Sediment Transport at the Sand Motor. Master’s Thesis, Delft University of Technology, Delft, The Netherlands, 2013. [Google Scholar]
- De Schipper, M.A.; de Vries, S.; Ruessink, G.; de Zeeuw, R.C.; Rutten, J.; van Gelder-Maas, C.; Stive, M.J. Initial spreading of a mega feeder nourishment: Observations of the Sand Engine pilot project. Coast. Eng. 2016, 111, 23–38. [Google Scholar] [CrossRef] [Green Version]
- Luijendijk, A.P.; Ranasinghe, R.; de Schipper, M.A.; Huisman, B.A.; Swinkels, C.M.; Walstra, D.J.; Stive, M.J. The initial morphological response of the Sand Engine: A process-based modelling study. Coast. Eng. 2017, 119, 1–14. [Google Scholar] [CrossRef] [Green Version]
- Luijendijk, A.P.; Huisman, B.J.A.; De Schipper, M.A. Impact of a storm on the first-year evolution of the Sand Engine. In Proceedings of the Coastal Sediments, San Diego, CA, USA, 11–15 May 2015. [Google Scholar]
- Kaji, A.O.; Luijendijk, A.P.; Van Thiel de Vries, J.S.M.; De Schipper, M.A.; Stive, M.J.F. Effect of different forcing processes on the longshore sediment transport at the Sand Motor, the Netherlands. In Proceedings of the ICCE 2014: 34th International Conference on Coastal Engineering, Seoul, Korea, 15–20 June 2014. [Google Scholar]
- De Schipper, M.A.; De Vries, S.; De Zeeuw, R.C.; Rutten, J.; Ruessink, B.G.; Aarninkhof, S.G.J.; Gelder-Maas, V. Morphological development of a mega-nourishment; first observations at the Sand Engine. In Proceedings of the ICCE 2014: 34th International Conference on Coastal Engineering, Seoul, Korea, 15–20 June 2014; Volume 34, pp. 1–6. [Google Scholar]
- Kaergaard, K.; Droenen, N. A Hybrid Shoreline Model for the Sand Engine: Comparison with Observations and Long Term Predictions. In Proceedings of the The Proceedings of the Coastal Sediments, San Diego, CA, USA, 11–15 May 2015. [Google Scholar]
- Wengrove, M.E.; Henriquez, M.; De Schipper, M.A.; Holman, R.; Stive, M.J.F. Monitoring morphology of the Sand Engine leeside using Argus’ cBathy. In Proceedings of the Coastal Dynamics 2013: 7th International Conference on Coastal Dynamics, Arcachon, France, 24–28 June 2013. [Google Scholar]
- De Vries, S.; Radermacher, M.; De Schipper, M.A.; Stive, M.J.F. Tidal dynamics in the Sand Motor lagoon. In Proceedings of the E-proceedings of the 36th IAHR World Congress, Hague, The Netherlands, 28 June–3 July 2015. [Google Scholar]
- Hoonhout, B.; de Vries, S. Field measurements on spatial variations in aeolian sediment availability at the Sand Motor mega nourishment. Aeolian Res. 2017, 24, 93–104. [Google Scholar] [CrossRef] [Green Version]
- Hagenaars, G.; de Vries, S.; Luijendijk, A.P.; de Boer, W.P.; Reniers, A.J. On the accuracy of automated shoreline detection derived from satellite imagery: A case study of the Sand Motor mega-scale nourishment. Coast. Eng. 2018, 133, 113–125. [Google Scholar] [CrossRef]
- Coronado, C.; Candela, J.; Iglesias-Prieto, R.; Sheinbaum, J.; López, M.; Ocampo-Torres, F.J. On the circulation in the Puerto Morelos fringing reef lagoon. Coral Reefs 2007, 26, 149–163. [Google Scholar] [CrossRef]
- Mariño-Tapia, I.; Enriquez, C.; Silva-Casarín, R.; Mendoza-Baldwin, E.; Mancera, E.E.; Ruiz-Rentaría, F. Comparative morphodynamics between exposed and reef protected beaches under hurrricane conditions. In Proceedings of the ICCE 2014: 34th International Conference on Coastal Engineering, Seoul, Korea, 15–20 June 2014. [Google Scholar]
- Silva, R.; Ruíz, G.; Posada, G.; Pérez, D.; Rivillas, G.; Espinal, J.; Mendoza, E. Atlas de Clima Marítimo de la Vertiente Atlántica Mexicana; Universidad Nacional Autónoma de México: Mexico City, Mexico, 2008. (In Spanish) [Google Scholar]
- Roelvink, D.; van Dongeren, A.; McCall, R.; Hoonhout, B.; van Rooijen, A.; van Geer, P. XBeach Manual. Model Description and Reference Guide to Functionalities; UNESCO-IHE Institute of Water Education and Delft University of Technology: Delft, The Netherlands, 2015. [Google Scholar]
- Silva, R.; Mendoza, E.; Mariño-Tapia, I.; Martínez, M.L.; Escalante, E. An artificial reef improves coastal protection and provides a base for coral recovery. J. Coast. Res. 2016, 75, 467–471. [Google Scholar] [CrossRef]
- Dean, R.G. Additional Sediment Input to the Nearshore Region. Shore Beach 1997, 55, 76–81. [Google Scholar]
- Brown, J.M.; Phelps, J.J.C.; Barkwith, A.; Hurst, M.D.; Ellis, M.A.; Plater, A.J. The effectiveness of beach mega-nourishment, assessed over three management epochs. J. Environ. 2016, 184, 400–408. [Google Scholar] [CrossRef] [Green Version]
- Klein, Y.L.; Osleeb, J. Determinants of coastal tourism: A case study of Florida beach counties. J. Coast. Res. 2010, 26, 1149–1156. [Google Scholar] [CrossRef]
- Williams, J.J.; Esteves, L.S.; Rochford, L.A. Modelling storm responses on a high-energy coastline with XBeach. Model. Earth Syst. Environ. 2015, 1, 14. [Google Scholar] [CrossRef] [Green Version]
- Ruffini, G.; Briganti, R.; Alsina, J.M.; Brocchini, M.; Dodd, N.; McCall, R. Numerical Modeling of Flow and Bed Evolution of Bichromatic Wave Groups on an Intermediate Beach Using Nonhydrostatic XBeach. J. Waterw Port C-ASCE 2020, 146, 04019034. [Google Scholar] [CrossRef]
- Elsayed, S.M.; Oumeraci, H. Effect of beach slope and grain-stabilization on coastal sediment transport: An attempt to overcome the erosion overestimation by XBeach. Coast. Eng. 2017, 121, 179–196. [Google Scholar] [CrossRef] [Green Version]
- Work, P.A.; Dean, R.G. Assessment and prediction of beach-nourishment evolution. J. Waterw Port. C-ASCE 1995, 121, 182–189. [Google Scholar] [CrossRef]
- Benedet, L.; Finkl, C.W.; Campbell, T.; Klein, A. Predicting the effect of beach nourishment and cross-shore sediment variation on beach morphodynamic assessment. Coast. Eng. 2004, 51, 839–861. [Google Scholar] [CrossRef]


| Scenario | Significant Wave Height Hm0 (m) | Peak Period Tp (s) | Wave Direction |
|---|---|---|---|
| Calm or non-storm conditions | 1 | 8 | E |
| ESE | |||
| Storm conditions | 2 | 8 | ENE |
| E | |||
| ESE | |||
| 7 | SE |
© 2020 by the authors. Licensee MDPI, Basel, Switzerland. This article is an open access article distributed under the terms and conditions of the Creative Commons Attribution (CC BY) license (http://creativecommons.org/licenses/by/4.0/).
Share and Cite
Escudero, M.; Mendoza, E.; Silva, R. Micro Sand Engine Beach Stabilization Strategy at Puerto Morelos, Mexico. J. Mar. Sci. Eng. 2020, 8, 247. https://doi.org/10.3390/jmse8040247
Escudero M, Mendoza E, Silva R. Micro Sand Engine Beach Stabilization Strategy at Puerto Morelos, Mexico. Journal of Marine Science and Engineering. 2020; 8(4):247. https://doi.org/10.3390/jmse8040247
Chicago/Turabian StyleEscudero, Mireille, Edgar Mendoza, and Rodolfo Silva. 2020. "Micro Sand Engine Beach Stabilization Strategy at Puerto Morelos, Mexico" Journal of Marine Science and Engineering 8, no. 4: 247. https://doi.org/10.3390/jmse8040247