Article

A Comparison of Beach Nourishment Methodology and Performance at Two Fringing Reef Beaches in Waikiki (Hawaii, USA) and Cadiz (SW Spain)

by
Juan J. Muñoz-Perez
1,*,†,
Shari L. Gallop
2,† and
Luis J. Moreno
3,†
1
Applied Physic Department, University of Cadiz, 11510 Puerto Real, Spain
2
School of Science and Environmental Research Institute, University of Waikato, 3110 Tauranga, New Zealand
3
Department of Civil Engineering: Hydraulics, Energy and Environment, Technical University of Madrid, 28040 Madrid, Spain
*
Author to whom correspondence should be addressed.
All authors contributed equally.
J. Mar. Sci. Eng. 2020, 8(4), 266; https://doi.org/10.3390/jmse8040266
Submission received: 14 March 2020 / Revised: 30 March 2020 / Accepted: 4 April 2020 / Published: 9 April 2020
(This article belongs to the Special Issue Beach Nourishment: A 21st Century Review)

Abstract

:
Fringing reefs have significant impacts on beach dynamics, yet there is little research on how they should be considered in beach nourishment design, monitoring, and conservation works. Thus, the behavior and characteristics of nourishment projects at two reef protected beaches, Royal Hawaiian Beach (RHB) in Hawaii, USA, and Victoria Beach (VB) in Cadiz, Spain, are compared to provide transferable information for future nourishment projects and monitoring in fringing reef environments. The nourishment cost at RHB was nine times higher than VB. This is partly due to lower total volume and a more complex placement and spreading method at RHB, despite the much closer borrow site at RHB. There was a significant difference in post-nourishment monitoring frequency and assessment of accuracy. RHB elevation was monitored quarterly for 2.7 years at 30 m-spaced profiles, compared to 5 years of biannual surveys of 50 m-spacing at VB. An additional problem related to the presence of reefs at both RHB and VB was estimating the beach volume increase after nourishment, due to variable definitions of the ‘beach’ area and high alongshore variability in reef topography. At sites where non-native sediment is used, it is imperative to understand how wave and current energy changes due to reefs will influence nourishment longevity. Thus, differences in erosion and accretion mechanisms at both beaches have been detected, though are still little understood. Moreover, discrepancies in sediment porosity between the two sites (which should be surveyed in future nourishments) have been found, probably due to differences in the nourishment sand transportation and distribution methods. In summary, more dialogue is needed to explicitly consider the influence of fringing reefs on coastal processes and beach nourishment projects.

1. Introduction

Beach nourishment is a key ‘soft engineering’ approach used worldwide to remediate coastal erosion, in contrast to ‘hard coastal engineering’ which involves construction of defenses such as breakwaters. Beach nourishment is used on beaches with a variety of sedimentary characteristics, from sand to gravel [1]. Such beach fills are generally designed using simplified mathematical models that assume the geologic setting has no influence on the beach morphology [2]. One such commonly used model is the equilibrium beach profile, which is meant to reflect the beach profile that would occur if the forces (dominantly waves and water levels) were held constant for a sufficiently long time [2,3]. However, there is increasing research showing that the geologic setting plays a dominant role in contemporary beach morphodynamics [4,5,6,7]. In fact, some studies have taken into account the former geologic setting to design multifunctional artificial reefs that serve several purposes [8].
One common type of geologically-controlled beach is situated landward of areas of hard bottom, such as rock or coral reefs. Reefs have large impacts on coastal hydrodynamics, sediment transport, and morphology, such as by influencing water level fluctuations [9], wave set-up and cross-reef currents [10], wave breaking, wave-induced flows, and wave attenuation over reef platforms [11,12,13,14,15], which affect the beach morphodynamics tidal range at multiple scales [16,17,18,19], even under hurricane conditions [20,21].
Despite clear evidence that beaches with reefs behave differently to their non-reef counterparts, there has been scant attention given to how reefs should be considered in beach nourishment projects. A recent study by Habel et al. [22] focused on the methodology of a beach nourishment at Royal Hawaiian Beach (RHB), Waikiki, which is fronted by a fringing coral reef. They also analyzed the subsequent monitoring. We share their interest in beaches that are fronted by reefs and find this a welcome opportunity to start a discussion of how reefs should be considered in beach nourishment projects. Therefore, the goal of this paper is to compare the method and performance of beach nourishments in fringing reef environments, performed at RHB and Victoria Beach (VB) in SW Spain, in order to provide transferable information for future projects with similar fringing reef environments. We compare nourishment costs and methods for nourishment performing, total nourishment volume, fine sediment fraction, and post-nourishment monitoring techniques between the two beaches.

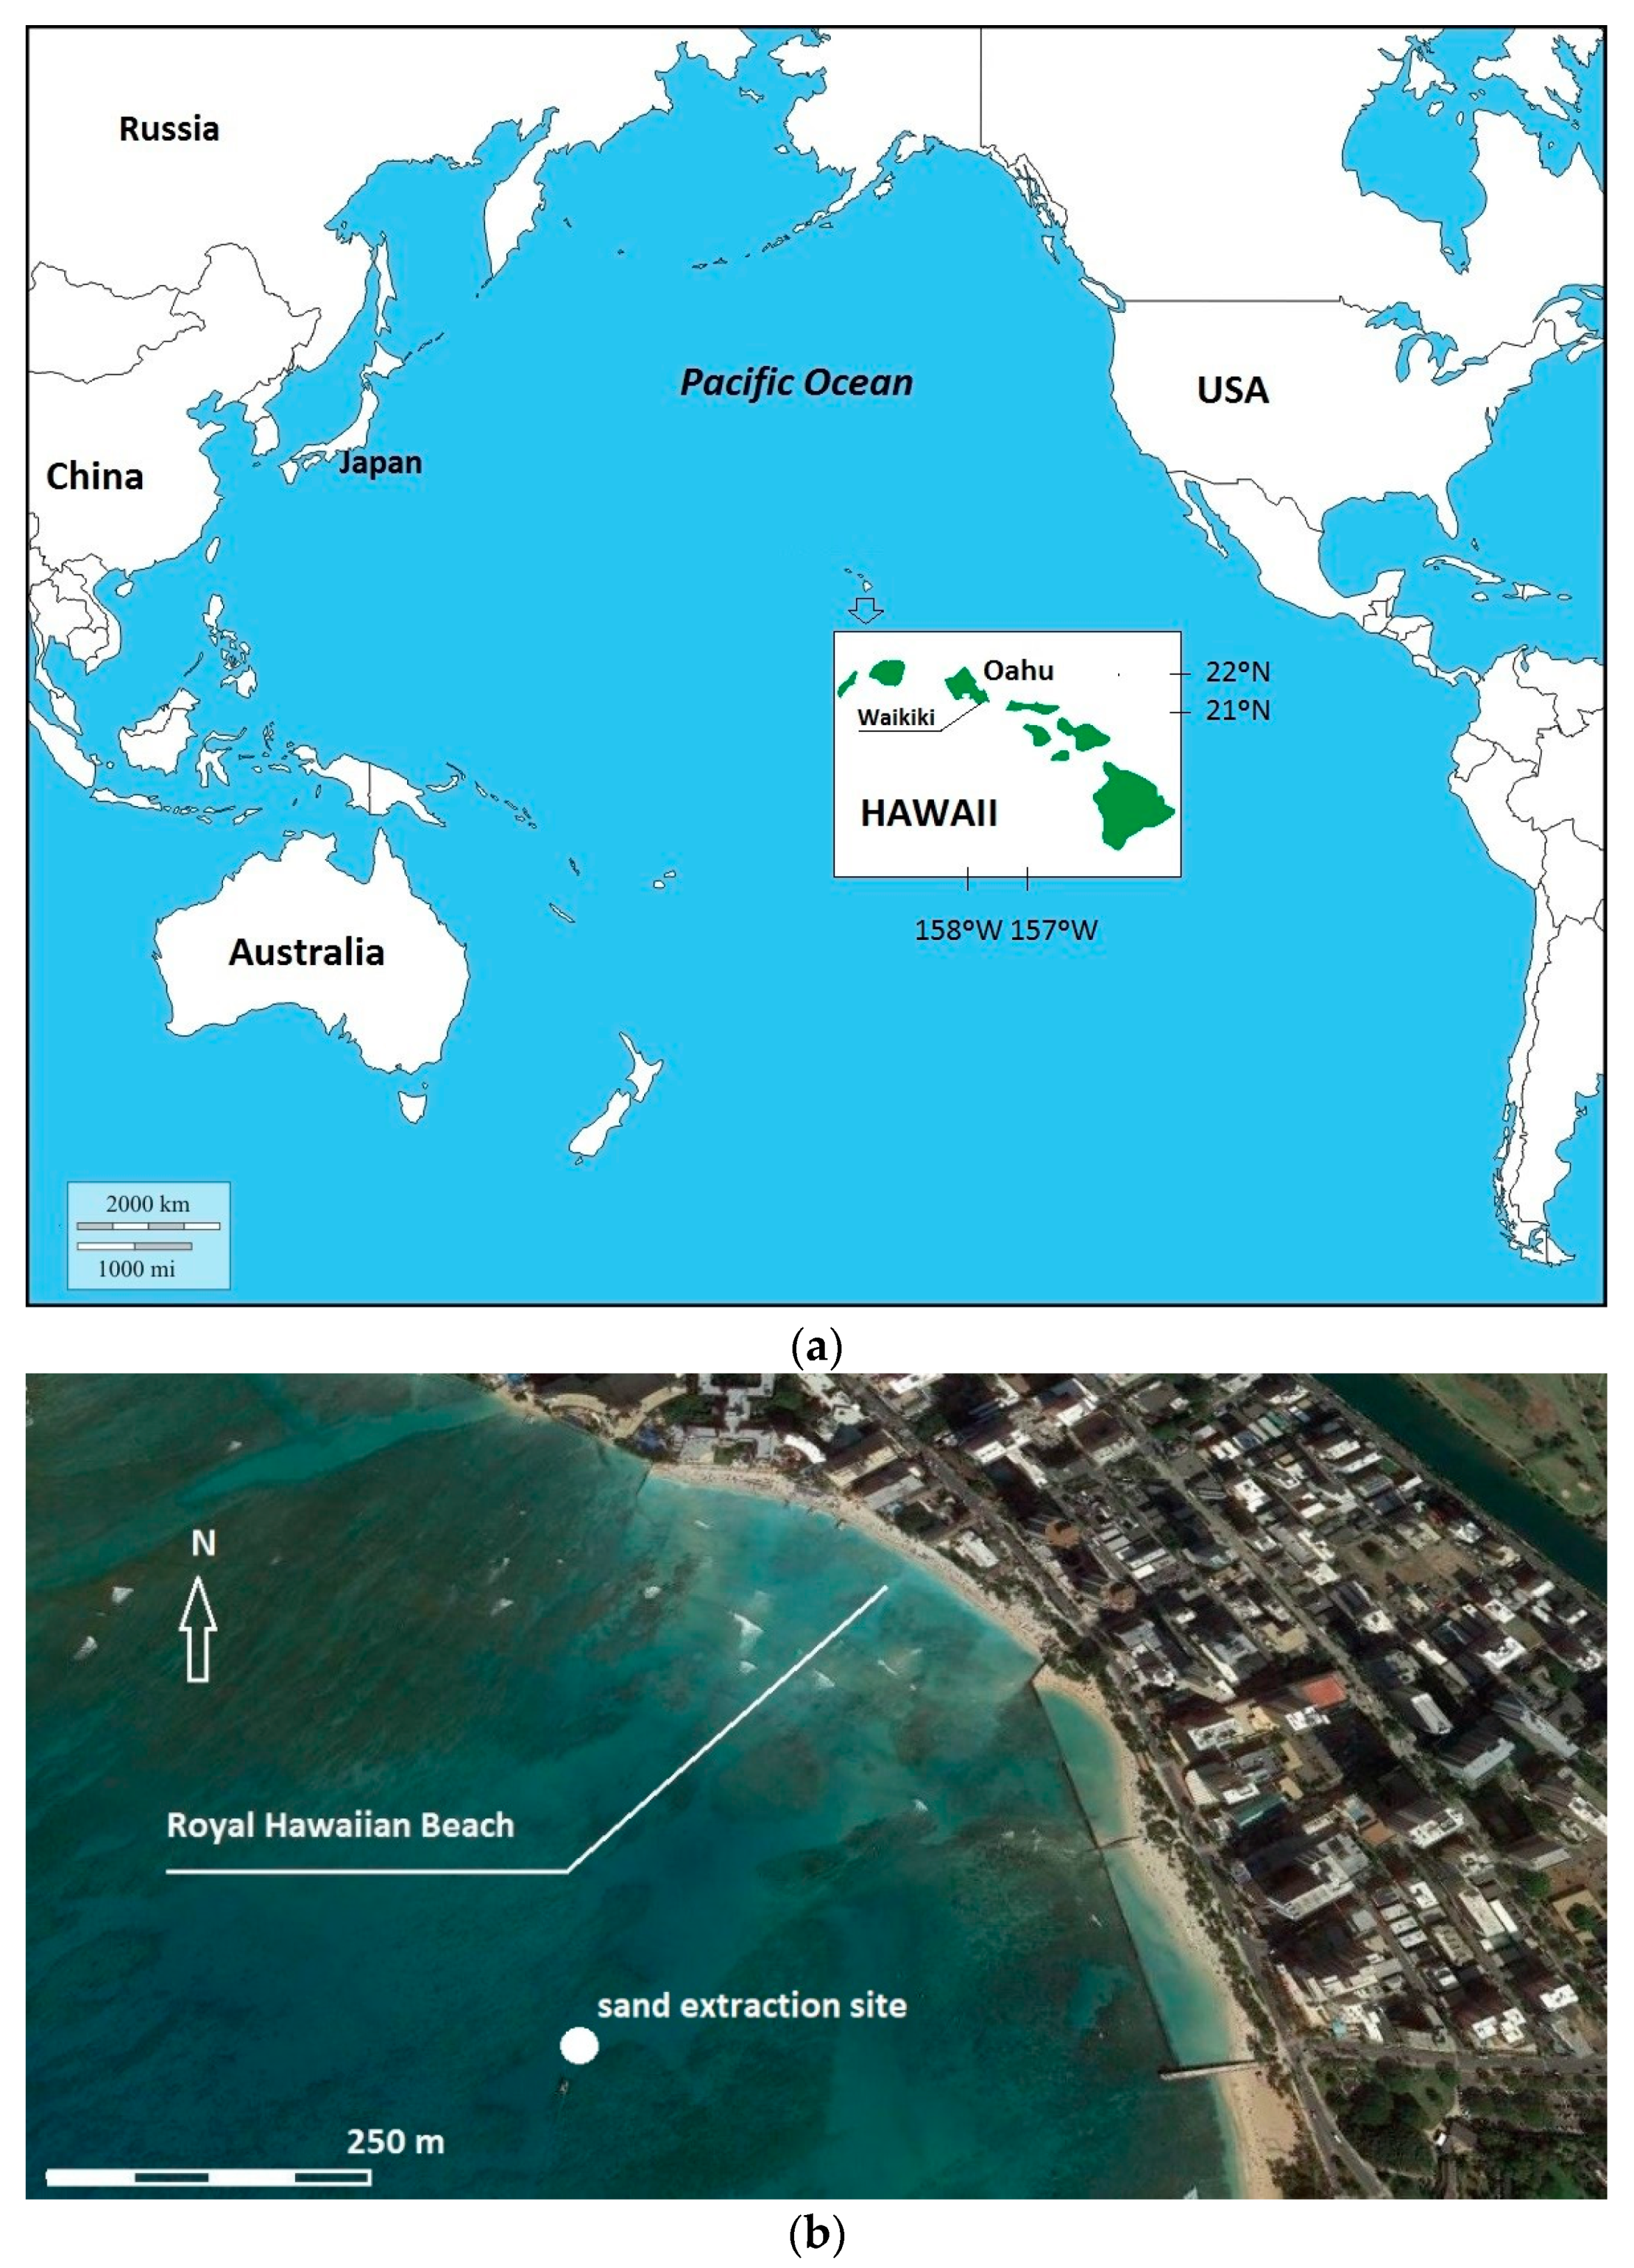
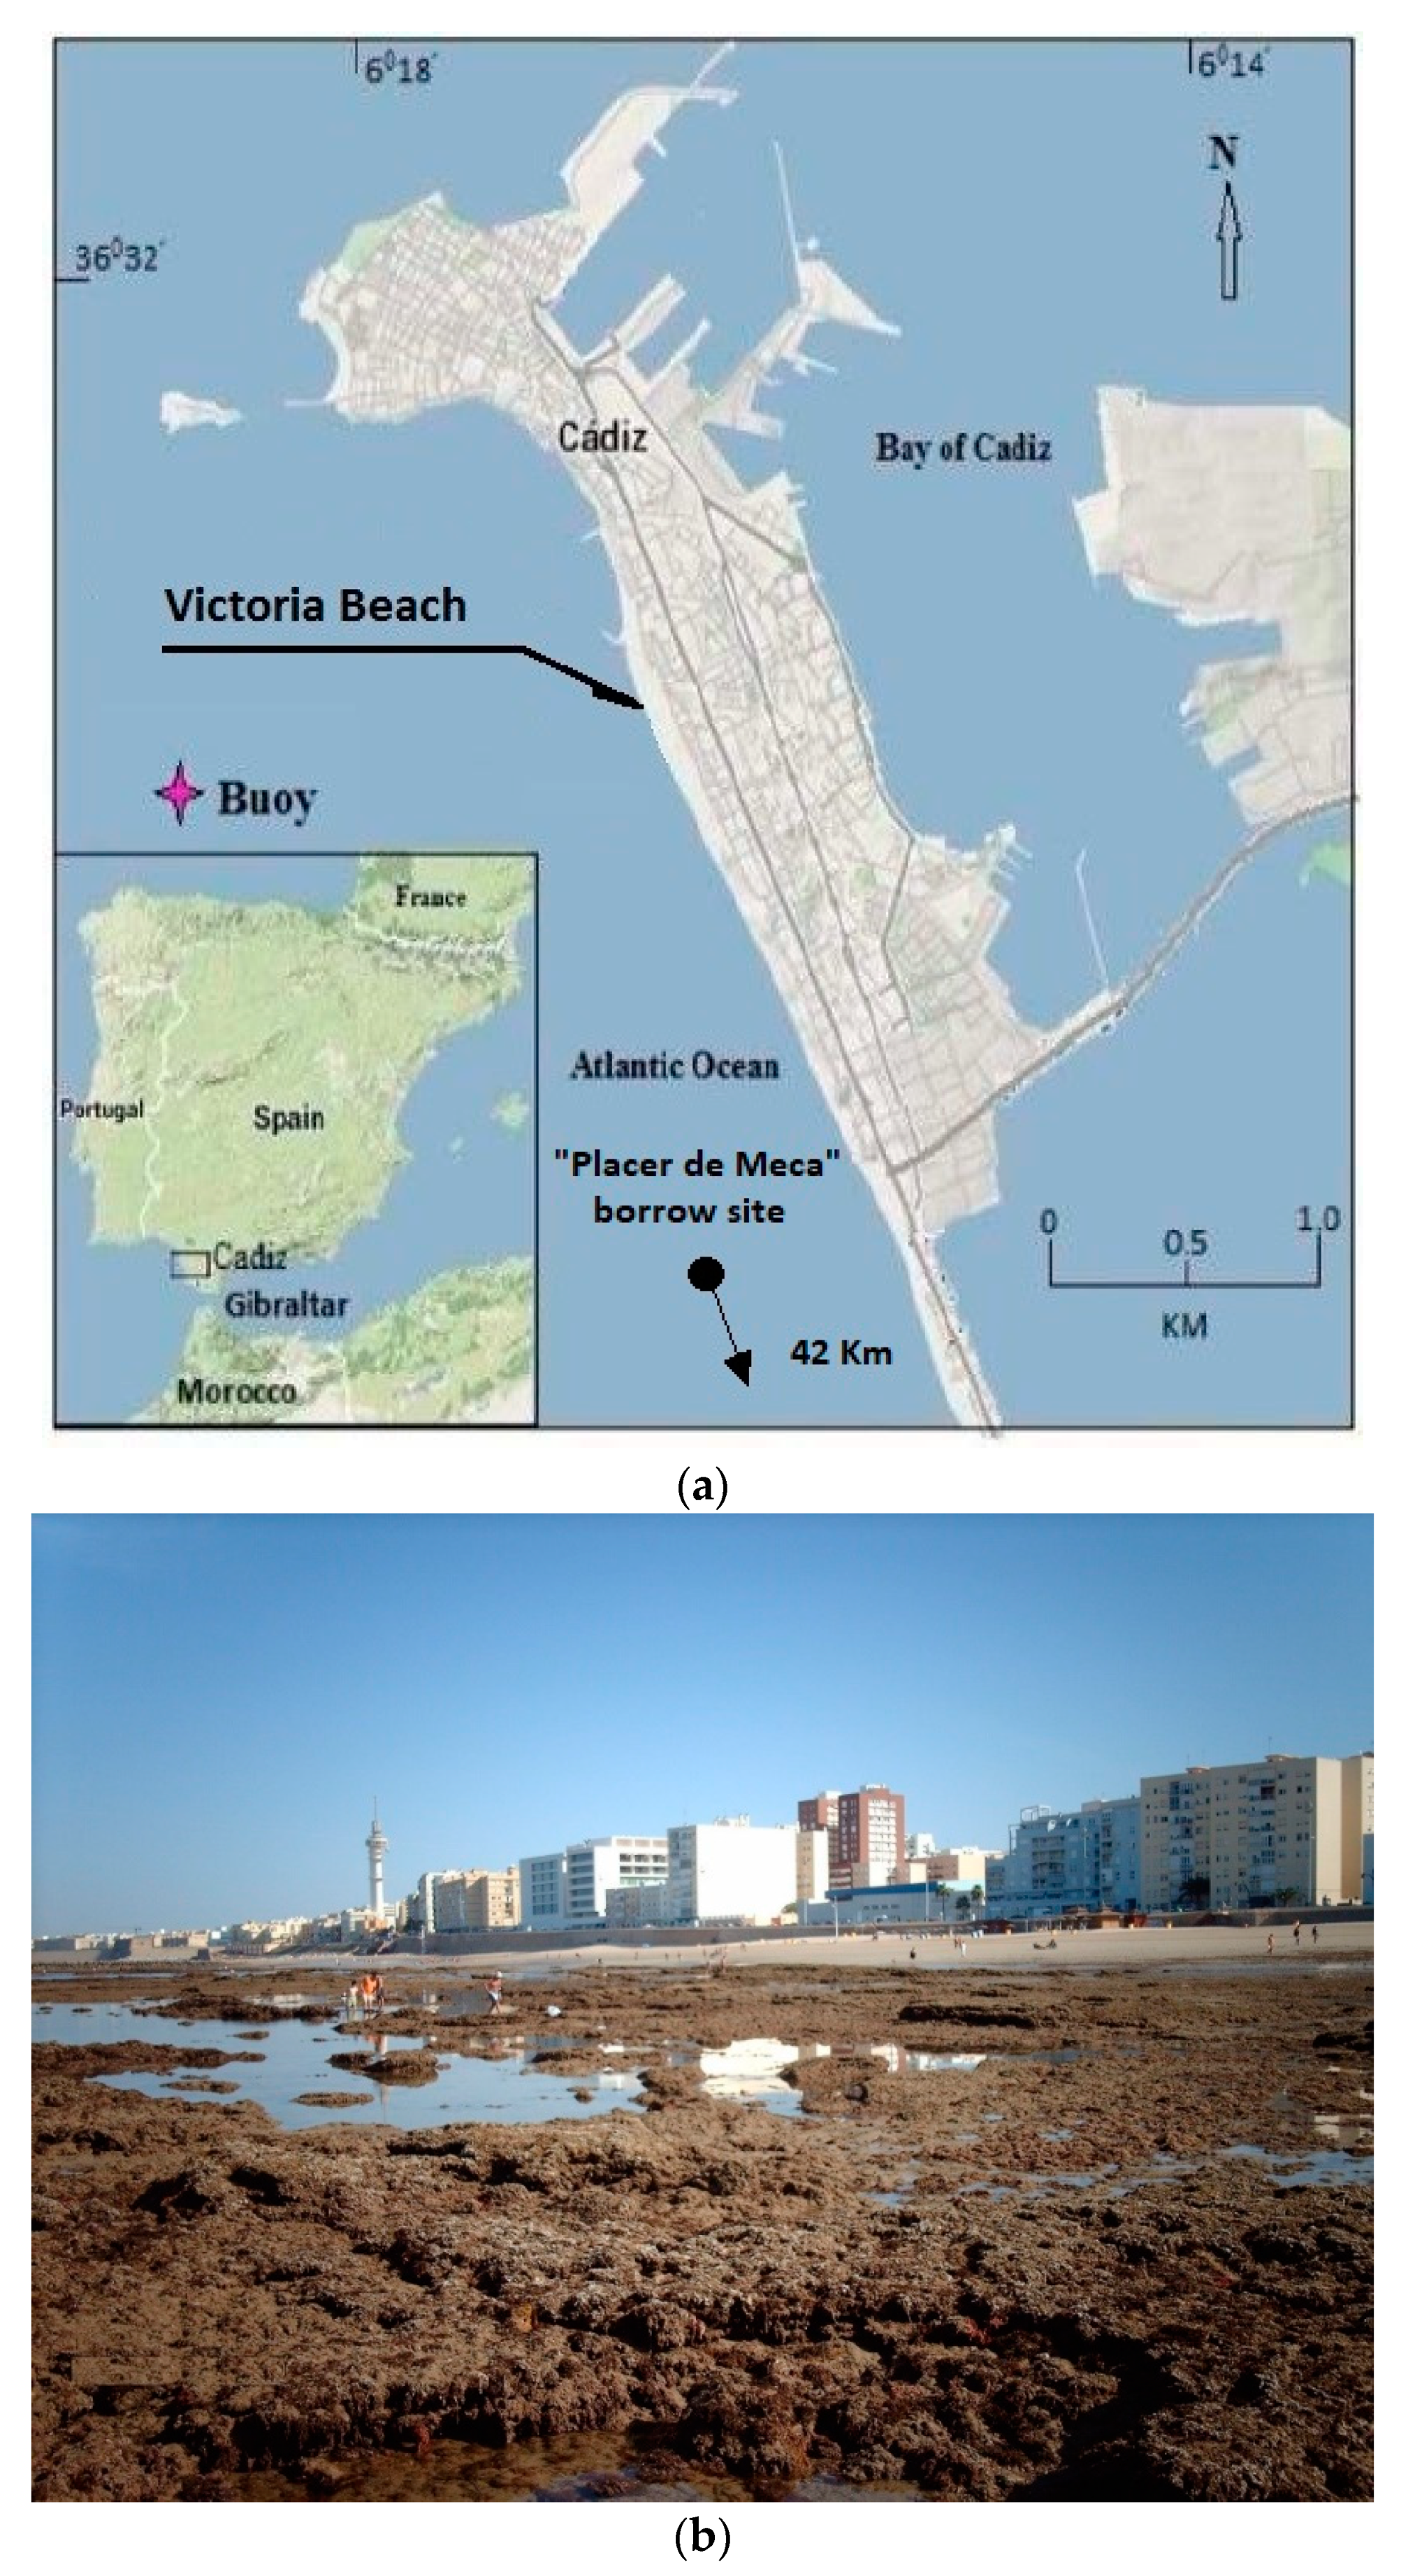
2. Location Descriptions

RHB in Hawaii and VB in Cadiz, SW Spain, are both supported by calcareous reef platforms (Figure 1 and Figure 2, respectively). Beaches on both of these coasts have experienced significant long-term erosion, which is problematic for the nationally important tourism industries that they support. Erosional trends are expected to accelerate with sea level rise [23], which is currently about 6 mm/year in Hawaii [24], and 2–3 mm/year in Cadiz. The costs of adaptation strategies (including beach nourishment) are already being considered [25].
RHB extends 520 m alongshore in a crescent shape between the Royal Hawaiian groin at the western end of the beach and the Kuhio Beach Ewa groin at the eastern end. This beach has been losing volume at a rate of 760 ± 450 m3/year, consistent with the design rate of 1,070 m3/year, that is, the value used for the nourishment project [22]. Victoria Beach is 3 km long and is divided into two zones due to the existence of a transversal fault to the shoreline. The northern zone (~1.2 km long) has a quasi-horizontal rocky platform, the surface of which aligns with spring low tide level. The dominant swell comes from the west, which generates dominant littoral drift towards the southeast, with an average loss value (i.e., the sand volume lost every year) of approximately 30,000 m3/year [26].
Southerly swell at RHB generates, over the summer months, an average significant wave height and period of 0.8 m and 13.1 s, respectively. Erosion is usually experienced under shorter period winter waves at this beach [22]. On the other side, the western swell in VB generates a significant wave height of about 0.7 m (similar to HRB wave), but the average period is less, approximately 7 s [27]).
A summary of noteworthy morphological and sedimentological characteristics for the two beaches is shown in Table 1, and a visualization of these morphological concepts is shown in Figure 3. RHB is microtidal, whereas VB is mesotidal, with spring tidal ranges of up to 0.9 and 3.8 m, respectively. All elevations are relative to the lowest low-water level (LLWL) (+ 0.00 m). Elevation of the reef flat coincides approximately with this datum, and therefore the reef platform is emerged at the low tide level for VB and almost emerged for RHB. Another difference is related to the nature of sediment, which is calcareous in RHB, and almost completely silicic in VB (where the sand is 90–95% quartz and 5–10% bioclastic material). Both beaches have fine/medium sand, although the median grain size (D50) is slightly larger, at 0.34 mm for RHB, and 0.25 mm at VB.
A final key difference is that while both beaches have their toes supported by a reef platform, VB also has a fault scarp along its entire front and lacks the offshore channel which characterizes RHB. At RHB, this offshore channel is thought to be an important conduit for cross-shore sediment transport [22], a topic also mentioned by other researchers [28].

3. Nourishment Methodology and Monitoring

Here, we compare and contrast the nourishment techniques and post-nourishment monitoring at RHB and VB.

3.1. Nourishment Method

There was a big difference in the method of placing, conveying and spreading the sand between RHB and VB. At RHB, 18,350 m3 of sand was extracted from a source located approximately 0.6 km offshore of the nourishment site (Figure 1), using a pump that was suspended from a crawler crane stationed on a barge [22]. Sand was first pumped to an onshore dewatering basin adjacent to the placement location, before being distributed onto the beach using the truck haul method. This intermediate step was likely an important driver of the higher nourishment cost at RHB, discussed further in the next section.
In contrast, sand was pumped directly onto the dry beach at VB (i.e., the zone from high tide level to the landward edge). A volume of 260,000 m3 was extracted from a borrow site called Placer de Meca, located 42 km (23 nm) from VB, close to the Cape of Trafalgar (Figure 2), using a trailing suction hopper dredger (TSHD). The dredger extracted the sand from a depth of ~20 m, and the complete process (mining, going to the beach, delivery, and returning to the borrow site) took about 8 h. Some pictures showing different aspects of the sediment pouring are shown in Figure 4.

3.2. Determination of Nourishment Volume

Methods used to quantify beach nourishment volumes to determine payment vary and can have significant implications for total nourishment costs. Although there was no specific indication in Habel et al. [22] of the measurement and payment guidelines used at RHB, they state that the initial post-nourishment survey, accomplished 10 days following the completion of sand placement, was used to determine the total nourished volume. During the first beach nourishments performed in Spain in the 1980s, payments to dredging companies were based on volume calculated by comparing pre- and post-nourishment beach profiles. A prominent dredging company at the time adduced that they were not to be held responsible for any possible erosion that may happen to nourished beaches caused by wave or tidal activity. The basis for this discrepancy was later discussed by Rullens et al. [29]. The final court decision was to their advantage, and since then payment has been made on hopper measurements taken before the sand sediment is pumped onto the beach. However, pre- and post-volume calculations are still undertaken, but only for monitoring purposes.
Concerns about the accuracy of the volumes measured aboard the ship are common. Readers interested in a detailed description of the methodology, and about an independent and portable meter system for dry weight control in hopper dredgers in order to distinguish between the dry sand weight and the sea water weight can consult [30].

3.3. Post-Nourishment Monitoring

Post-nourishment monitoring is important to confirm the design life of the project and to assist in future planning. At RHB, beach elevation data were collected quarterly along cross-shore profiles for 2.7 years after nourishment. At VB elevation campaigns were performed biannually for 5 years post-nourishment. According to US Army Corps of Engineers (USACE) recommendation [31], monitoring beach nourishment requires large numbers of topo-bathymetric surveys (quarterly during the year following nourishment works, and biannually for at least one additional post-nourishment year).
At RHB, the shore-normal profiles were established at ~30 m intervals along the 520 m-long site, and extended either beyond the seaward toe of the fringing reef, or where fringing reef was absent to depths of 2–3 m. Profiles were surveyed by tracking a swimmer moving a rod-mounted prism across the beach, into nearshore waters, and over the fringing reef. Surveying was carried out randomly with respect to wave state and tidal cycle. The main sources of elevation error were identified and analyzed, including survey measurement error (by using established control points) and surface interpolation error (by conducting a comparison between random real and interpolated elevations). This is particularly noteworthy because only a handful of investigations have described errors related to typical beach bathymetric data sets and their influence on quantitative and qualitative interpretations of nearshore processes [32]. Grosskopf and Kraus [33] recommend a mean error of less than 11.5 m3/m of beach volume to estimate sand volume with an accuracy comparable to the 10% to 20% contingencies associated with project designs. Following this line of reasoning, instrument error was not monitored at RHB, as the measurement device (Leica TC407 total station) had millimeter accuracy, although accuracy can diminish when this topographic procedure is applied to seaward zones, due to the inclination of the rod where the prism is mounted. A method to take into account and reduce this error was developed and described by [34].
On the other hand, at VB the sand was extended with a berm width of 100 m, and the berm elevation was about 1 m above the spring tidal level (+ 3.80 m over the datum). High resolution topographic levellings were carried out biannually during the following five years to account for sea-swell seasonality. Another important aspect of the post-monitoring survey method relates to the accuracy of the surveys. Surveying at RHB was undertaken regardless of the stage of the tidal cycle, due to the relatively low tidal range of 0.9 m (Table 1). H owever, at VB surveys were always performed at LLWL during spring tides. Surveys took two days, and thus the tidal range did not change appreciably during this monitoring. Cross-shore profiles were separated by 50 m alongshore and extended from the sea wall to the toe of the profile, even if submerged (the toe of the profile was always 1 m below LLWL). Bathymetries were considered unnecessary and would also likely have a large error due to the random roughness of the rock. Therefore, the maximum error detected for the levellings performed with a total station theodolite (according to the technique described in [35]) was <1 cm, and standard deviation was <0.5 cm.
In addition, VB is more gently sloping than RHB, at 4.5% compared to 13.3% (Table 1). This means that variations in the water level due to spring and neap tides could have a significant influence on volume measurements, as this can cause the sand level to vary by up to 0.67 m under negligible wave conditions at Cadiz [36].An additional difference in the post-nourishment monitoring was in the alongshore spacing of the cross-shore beach profiles. Some recommendations regarding beach profile spacing range from 300 m on long straight beaches with a 50% reduction close to structures or special points [31,37], to less than 150 m, according to the recommendation of the Coastal Engineering Manual [38]. Nevertheless, generally pre- and post-nourishment profile surveys are routinely collected at higher resolutions (with alongshore spacing of 60 m or less) to determine placement volumes accurately for payment purposes. Profiles at RHB were established at the relatively small spacing of 30 m, presumably to increase accuracy and decrease error associated with discretizing the domain. Although increasing the number of profiles measured decreases the error associated with discretizing the domain, it also increases the survey budget. Therefore, in order to find a compromise between a 5% allowable error of estimation and the available monitoring budget, the methodology developed in [35] was used to determine a 50 m profile spacing at VB [39,40]. Optimizing profile spacing is important for cost savings, however, while techniques exist for sandy beaches, it is not clear how reef variability influences the spacing required to capture key changes with sufficient alongshore variability.

4. Results and Discussion

4.1. Performance of Nourishment Works

The methods of nourishment material transport and distribution have significant implications for the resulting beach sediment characteristics. Habel et al. suggested that the truck haul method caused chemical compaction of nourished sands, which has important implications for slope stability [41] and ecological function [42]. In contrast, at VB sand porosity increased after the renourishments. This opposite behavior is probably due to the aforementioned differences in transport and distribution of nourishment material. While trucks transported dewatered sand at RHB, at VB there was a massive dumping of a mixture of sediment (20%) and water (80%) onto the backshore and foreshore from a trailing suction hopper dredge. According to Roman-Sierra [43] this procedure causes a significant increase in sand porosity, which subsequently decreases until it reaches its native value (about a year later), due to wave action driving spatial re-accommodation of the grains. Moreover, much of the volume loss after beach nourishment procedure can be due to a decrease in porosity. A detailed analysis of the impacts on porosity of the sand transport and nourishment method, as well as an accurate and novel application of in situ measurements of the porosity of beach sand using a high-quality nuclear densimeter gauge, are also described in [43]. We suggest that measuring sediment porosity in future nourishments is advisable to determine if the transportation and distribution method significantly affects porosity, and hence beach slope stability and sand volume. The RHB nourishment project plans to maintain beach width for 20 years, with the initial replenishment plus an additional second phase after 10 years. This compares to a design life of 25 years for VB, although a small replenishment (about 25% of the original nourishment volume) was undertaken after 12 years, due to high social demand.

4.2. Nourishment Volumes

In reference to the measurements of placed sand volume conducted daily by contractors in RHB, a total estimated volume of 17,551 m3 was established. However, using the meritorious interpolation error methodology presented by Habel et al. [22], a beach volume increase of 12,700 ± 3,700 m3 and a system volume increase of 13,700 ± 6,300 m3 were confirmed. Revisiting some explanations about “beach” and “system” concepts are noteworthy. According to the aforementioned authors, the beach area extends a nominal 20 m seaward of the initial post-nourishment beach toe, while the system area extends an additional 150 m seaward. Regrettably, despite the laudability of the method, estimation of error becomes 30% at the “beach” zone and rises to 46% when the “system” zone is considered.
The error in sand volume estimation was somewhat lower in VB, probably due to the larger volume poured; 260,000 m3 was measured into the hopper of the dredger vs. 283,000 m3 surveyed on the beach, due to the increase of the porosity [43]. Another source of error was probably the existence of a problem at VB similar to that of RHB: the great variability of the levellings over the fringing reef. Ultimately, it was decided to exclude the reef from the surveying zone due to the lack of credibility.
Related to the seasonal erosion/accretion cycle, an unexpected volume gain occurred at RHB following increases in incident wave energy flux above 10,000 kg m3/s3. As Habel et al. [22] stated, it would be interesting to obtain elevation data from regions further offshore of their present study area which could confirm the existence of a proximal sediment source/sink. That would permit finding the relationship between the pattern of erosion/accretion and cross-shore sediment transport. On the contrary, significant gaining was never detected at VB. An average erosion value of 10,000 m3/year, which resulted in an irreversible loss [26], was obtained. However, this erosion rate was much smaller than for non-reef protected profiles subjected to similar wave energy on the same beach (30,000 m3/year).

4.3. Nourishment Costs

There was a large difference in nourishment costs between the two beaches. At RHB, the cost was 2.9 million USD for recovery, dewatering, and emplacement of 18,350 m3 along a 520 m segment of coastline. This investment represents an overall average price of $158 USD/m3. It should be noted that the cost of removal of two dilapidated sandbag groin structures has not been subtracted, because is not available. In comparison, the cost of nourishment at VB, where sand was dredged locally from the seabed, ranged from 12 to 15 €/m3 (13–17 USD/m3 at the current rate of exchange) for the various nourishments, excluding taxes. Moreover, distance from the borrow site in Cadiz (close to the Cape of Trafalgar) was 37–46 km, compared to just 0.6 km at RHB. However, costs of mobilization and demobilization of equipment in Hawaii account for much of the project costs, due to how remote the islands are. It is also true that supplied volumes were far superior in VB, with over 200,000 m3 at all nourishment actions, thus allowing for a lower unit cost of sand. Further details about beach nourishments carried out from 1999 to 2010, storm climate, and sea level seasonal cycle in the Gulf of Cadiz, can be found in [44,45,46] respectively.

4.4. Fine Sediments

Consideration of the fine sediment fraction in nourishment material is important, not only because of its contribution to elevated turbidity, but also because fines almost immediately are transported offshore, leading to immediate loss of sediment volume on the beach [22]. At RHB, Habel et al. stated that no fines were present in the mined sand field prior to dredging and transport. Thus, the existence of a fine sediment plume observed during the nourishment procedure was probably due to carbonate dissolution [22]. This point is interesting, because the fine-sediment percentage was also negligible at the samples taken from Trafalgar (the borrow site used for VB), but nevertheless, there was always dredging-induced turbidity which decreased with time, reaching natural conditions approximately 9 min after the operations ceased [47]. Since Trafalgar sand is siliceous (and therefore the possibility of calcareous solution must be discarded), we should consider the plausibility of losses of the fine-sediment fraction when a Van Veen grab is used to sample the sediment, instead of another procedure which guarantees good fine material retention and undisturbed samples.

4.5. Considering Reefs in Nourishment Design

No specific methodology was applied to consider the reef in the design process of RHB fill. Habel et al. [22] used a similar sand, and beach slope was predicted to reach an equilibrium profile similar to the pre-nourished beach, which presumably was in equilibrium with the hydrodynamic conditions created by the reef. For a case where borrowed and native sands are not identical, wave energy dissipation over the reef (due to wave breaking or bottom friction) should be taken into account [48]. These fringing reef beaches are so usual that some numerical models (e.g., SBEACH or SMC) have been modified, trying to allow calculation of the profile [49,50]. Moreover, there are a lot of characteristics typical of this kind of beach. It is often assumed that perched beaches are more stable in time than non-perched beaches [51,52,53], through wave energy dissipation (e.g., [11,13]) and reducing rates of longshore sediment transport [54]. However, Gallop et al. [6] found that depending on the reef topography, reefs can generate current jets that can increase sediment transport on and off the beachface over hourly timescales. Moreover, over seasonal timescales, reefs can create highly dynamic seasonal changes in beach morphology [28].
Annual and interannual changes in beach morphology are also important on reef beaches [55]. The temporal and spatial variability of these oscillations can be large (e.g., [7,55]), but are difficult to measure, let alone incorporate into nourishment design. Leaving aside some easy-to-apply remedies, such as the modification on the A parameter of the Dean’s formula [56], there are few engineering tools developed to take into account the idiosyncrasy of reef fringing beaches in nourishment design. Understanding the influence of these fringing reefs on beach behavior is imperative for coastal management, not only from the scientific point of view, but also the economic.
Finally, although not the focus of this paper, the potential impacts of sea level rise due to climate change on nourishment projects in fringing reef environments should be highlighted as a future line of research. Some research has already been undertaken on this topic at study sites, such as simulation of groundwater inundation in Honolulu [57], assessing vulnerability of low-lying areas in Maui [58] or in Oahu [59], or criticizing elevation levels for flooding due to sea level rise in Hawaii [60]. Moreover, mapping inundation probability has already been performed in some zones of the Gulf of Cadiz, Spain [61]. Due to concerns about the long-term performance of beach nourishment with sea level rise, different types of adaptation measures are been considered, such as seawalls or breakwaters, accommodating sea level rise by raising buildings, and even managed retreat. However, plans for these two sites have not yet been decided.

5. Conclusions

Characteristics of two reef protected beaches, RHB in Hawaii, USA, and VB in Cádiz, Spain, were compared to provide transferable information for future projects in areas with similar fringing reef environments. Results show that the complexity of the spreading method is a key determinant of overall cost, as well as total nourishment volume, which impacts on the cost per unit volume. This comparison has shown that more research is needed for determining optimal profile spacing, because while techniques exist for sandy beaches, it is not clear how reef variability influences the spacing required to capture key changes. It is also unclear how to include variable reef topography when estimating total nourishment volumes to determine nourishment volumes, and hence costs. Moreover, erosion and accretion mechanisms, and their temporal and spatial variability on reef beaches, are little understood, and hence difficult to incorporate into nourishment design. Sediment porosity surveying would be advisable in future nourishments to determine how porosity (and hence beach slope stability and sand volume) is affected by the transportation and distribution method. Publishing of studies of nourishment projects on reef beaches is rare. More dialogue and sharing of experiences are key to improving coastal zone management, optimizing nourishment projects, and preserving our precious beaches.

Author Contributions

All authors contributed equally. All authors have read and agreed to the published version of the manuscript.

Funding

This research received no external funding.

Conflicts of Interest

The authors declare no conflict of interest.

References

  1. Hanson, H.; Brampton, A.; Capobianco, M.; Dette, H.H.; Hamm, L.; Laustrup, C.; Lechuga, A.; Spanhoff, R. Beach nourishment projects, practices and objectives—A European overview. Coast. Eng. 2002, 47, 81–111. [Google Scholar] [CrossRef]
  2. Dean, R.G. Equilibrium beach profiles: Characteristics and applications. J. Coast. Res. 1991, 7, 53–84. [Google Scholar]
  3. Pilkey, O.H.; Young, R.S.; Riggs, S.R.; Smith, A.W.S.; Wu, H.; Pilkey, W.D. The concept of shoreface profile of equilibrium: A critical review. J. Coast. Res. 1993, 9, 255–278. [Google Scholar]
  4. Thieler, R.E.; Brill, A.L.; Cleary, W.J.; Hobbs, C.H.; Gammisch, R.A. Geology of the Wrightsville Beach, North Carolina shoreface: Implications for the concept of shoreface profile of equilibrium. Mar. Geol. 1995, 126, 271–287. [Google Scholar] [CrossRef]
  5. Contreras de Villar, A.; Gómez-Pina, G.; Muñoz-Pérez, J.J.; Contreras, F.; López-García, P.; Ruiz-Ortiz, V. New design parameters for biparabolic beach profiles (SW Cadiz, Spain). Rev. Construcción 2019, 18, 432–444. [Google Scholar] [CrossRef] [Green Version]
  6. Gallop, S.L.; Bosserelle, C.; Pattiaratchi, C.; Eliot, I. Rock topography causes spatial variation in the wave, current and beach response to sea breeze activity. Mar. Geol. 2011, 290, 29–40. [Google Scholar] [CrossRef]
  7. Gallop, S.L.; Bosserelle, C.; Haigh, I.D.; Wadey, M.P.; Pattiaratchi, C.; Eliot, I. The impact of temperate reefs on 34 years of shoreline and vegetation line stability at Yanchep, southwestern Australia and implications for coastal setback. Mar. Geol. 2015, 369, 224–232. [Google Scholar] [CrossRef]
  8. Antunes, J.S.; Neves, G.; ten Voorde, M. Designing a multifunctional artificial reef: Studies on the influence of parameters with most influence in the vertical plane. J. Coast. Conserv. 2011, 15, 151–157. [Google Scholar] [CrossRef]
  9. Karunarathana, H.; Tanimoto, K. Numerical experiments on low-frequency fluctuations on a submerged coast reef. Coast. Eng. 1995, 26, 271–289. [Google Scholar] [CrossRef]
  10. Symonds, G.; Black, K.P.; Young, I.R. Wave-driven flow over shallow reefs. J. Geophys. Res. 1995, 100, 2639–2648. [Google Scholar] [CrossRef]
  11. Gourlay, M.R. Wave transformation on a coral reef. Coast. Eng. 1994, 23, 17–42. [Google Scholar] [CrossRef]
  12. Coronado, C.; Candela, J.; Iglesias-Prieto, R.; Sheinbaum, J.; Lopez, M.; Ocampo-Torres, F.J. On the circulation in the Puerto Morelos fringing reef lagoon. Coral Reefs 2007, 26, 149–163. [Google Scholar] [CrossRef]
  13. Lowe, R.J.; Hart, C.; Pattiaratchi, C.B. Morphological constraints to wave-driven circulation in coastal reef–lagoon systems: A numerical study. J. Geophys. Res. 2010, 115. [Google Scholar] [CrossRef] [Green Version]
  14. Hoeke, R.; Storlazzi, C.; Ridd, P. Hydrodynamics of a bathymetrically complex fringing coral reef embayment: Wave climate, in situ observations, and wave predictions. J. Geophys. Res. 2011, 116, 1–19. [Google Scholar] [CrossRef]
  15. Mendonça, A.; Fortes, C.; Capitão, R.; Neves, M.G.; Moura, T.; Antunes do Carmo, J.S. Wave hydrodynamics around a multi-functional artificial reef at Leirosa. J. Coast. Conserv. 2012, 16, 543–553. [Google Scholar] [CrossRef]
  16. Sheppard, C.; Dixon, D.J.; Gourlay, M.; Sheppard, A.; Payet, R. Coral mortality increases wave energy reaching shores protected by reef flats: Examples from the Seychelles. Estuar. Coast. Shelf Sci. 2005, 64, 223–234. [Google Scholar] [CrossRef]
  17. Gallop, S.L.; Bosserell, C.; Eliot, I.; Pattiaratchi, C.B. The influence of limestone reefs on storm erosion and recovery of a perched beach. Cont. Shelf Res. 2012, 47, 16–27. [Google Scholar] [CrossRef]
  18. Ruiz, A.; Mariño-Tapia, I.; Enriquez, C.; Silva, R.; González-Leija, M. The role of fringing coral reefs on beach morphodynamics. Geomorphology 2013, 198, 69–83. [Google Scholar]
  19. Rizzo, A.; Aucelli, P.; Gracia, F.J.; Anfuso, G. A novelty coastal susceptibility assessment method: Application to Valdelagrana area (SW Spain). J. Coast. Conserv. 2017, 5, 51. [Google Scholar] [CrossRef]
  20. Mariño, I.; Enriquez, C.; Silva, R.; Mendoza, E.; Escalante, E.; Ruiz, F. Comparative morphodynamics between exposed and reef protected beaches under hurricane conditions. Coast. Eng. Proc. 2014, 1, 55. [Google Scholar] [CrossRef]
  21. Martell, R.; Silva, R.; Mendoza, E.G.; Muñoz, J.J.; Cerdeira, S.; Laiz, I. Spectral bimodality of waves produced by hurricanes in the Caribbean coastal zone of Mexico. Cienc. Mar. 2018, 44, 33–48. [Google Scholar] [CrossRef] [Green Version]
  22. Habel, S.; Fletcher, C.H.; Barbee, M.; Anderson, T.R. The influence of seasonal patterns on a beach nourishment project in a complex reef environment. Coast. Eng. 2016, 116, 67–76. [Google Scholar] [CrossRef]
  23. Anderson, T.R.; Fletcher, C.H.; Barbee, M.M.; Frazer, L.N.; Romine, L.N. Doubling of coastal erosion under rising sea level by mid-century in Hawaii. Nat. Hazards 2015, 78, 75–103. [Google Scholar] [CrossRef]
  24. Hawaii’s Sea Level is Rising. Available online: sealevelrise.org/states/hawaii/ (accessed on 9 March 2020).
  25. Climate Change in Spain. Available online: www.climatechangepost.com/spain (accessed on 9 March 2020).
  26. Muñoz-Perez, J.J.; Medina, R. Comparison of long-, medium and short-term variations of beach profiles with and without submerged geological control. Coast. Eng. 2010, 57, 241–251. [Google Scholar] [CrossRef]
  27. Puertos del Estado (Spain). Available online: www.puertos.es (accessed on 9 March 2020).
  28. Gallop, S.L.; Bosserelle, C.; Eliot, I.; Pattiaratchi, C.B. The influence of coastal reefs on spatial variability in seasonal sand fluxes. Mar. Geol. 2013, 244, 132–143. [Google Scholar] [CrossRef] [Green Version]
  29. Rullens, R.C.; d’Angremond, K.; Ottevanger, G. Tonnes dry solids reviewed. In Dredging’94 Proceedings of the 2nd International Conference on Dredging and Dredged Material Placement; ASCE: New York, NY, USA, 1994; pp. 673–682. [Google Scholar]
  30. Muñoz-Perez, J.J.; Gutierrez, J.M.; Moreno, J.; Español, L.; Moreno, L.; Bernabeu, A. Portable meter system for dry weight control in dredging hoppers. J. Waterw. Port Coast. ASCE 2003, 129, 79–85. [Google Scholar] [CrossRef]
  31. Wise, R.A. Recommended base-level physical monitoring of beach fills. In CETN II-35. U.S. Army Corps of Engineers; Coastal Engineering Research Center: Vicksburg, MS, USA, 1995. [Google Scholar]
  32. Plant, N.G.; Holland, K.T.; Puleo, J.A. Analysis of the scale of errors in nearshore bathymetric data. Mar. Geol. 2002, 191, 71–86. [Google Scholar] [CrossRef]
  33. Grosskopf, W.G.; Kraus, N.C. Guidelines for surveying beach nourishment projects. In Technical Note; CETN II-31; U.S. Army Engineering Water Experiment Station: Vicksburg, MS, USA, 1993; p. 12. [Google Scholar]
  34. Serra, J.; Medina, J.R. Beach monitoring program of Valencia (Spain). In Proceedings of the 25th International Conference on Coastal Engineering Proceedings, Orlando, FL, USA, 2–6 September 1996; pp. 2871–2883. [Google Scholar]
  35. Muñoz-Perez, J.J.; Khan-Mozahedy, A.B.M.; Neves, M.G.; Tejedor, B.; Gomez-Pina, G.; Campo, J.M.; Negro, V. Sinking of concrete modules into a sandy seabed: A case study. Coast. Eng. 2015, 99, 26–37. [Google Scholar] [CrossRef] [Green Version]
  36. Muñoz-Perez, J.J.; Medina, R. Profile changes due to a fortnightly tidal cycle. In Proceedings of the 28th ICCE; ASCE: Sydney, Australia, 2002; pp. 3063–3075. [Google Scholar]
  37. Browder, A.E.; Dean, R.G. Monitoring and comparison to predictive models of the Perdido Key beach nourishment project, Fl., USA. Coast. Eng. 2000, 39, 173–191. [Google Scholar] [CrossRef]
  38. USACE (US Army Corps of Engineers). Coastal Engineering Manual; EM 1110-2-1100; USACE: Washington, DC, USA, 2002. [Google Scholar]
  39. Muñoz-Perez, J.J.; Payo, A.; Roman-Sierra, J.; Navarro, M.; Moreno, L. Optimization of beach profile spacing: An applicable tool for coastal monitoring. Sci. Mar. 2012, 76, 791–798. [Google Scholar] [CrossRef] [Green Version]
  40. Muñoz-Perez, J.J.; Navarro, M.; Roman, J.; Tejedor, B.; Gomez, G. Long-term evolution of a transgressive migrating dune using reconstruction of the EOF method. Geomorphology 2009, 112, 167–177. [Google Scholar] [CrossRef]
  41. Croize, D.; Bjørlykke, K.; Jahren, J.; Renard, F. Experimental mechanical and chemical compaction of carbonate sand. J. Geophys. Res. Solid Earth 2010, 115. [Google Scholar] [CrossRef] [Green Version]
  42. USACE (US Army Corps of Engineers). Beach erosion control projects for Palm Beach County, FL, USA. In General Design Memorandum with Environmental Impact Statement; USACE: Washington, DC, USA, 1987. [Google Scholar]
  43. Roman-Sierra, J.; Muñoz-Perez, J.J.; Navarro-Pons, M. Beach nourishment effects on sand porosity variability. Coast. Eng. 2014, 83, 221–232. [Google Scholar] [CrossRef] [Green Version]
  44. Muñoz-Perez, J.J.; Roman, J.; Navarro-Pons, M.; da Graça, M.; del Campo, J.M. Comments on Confirmation of beach accretion by grain-size trend analysis: Camposoto beach, SW Spain by Poizot, E., et al. Geo-Mar. Lett. 2014, 34, 75–78. [Google Scholar]
  45. Plomaritis, T.A.; Benavente, J.; Laiz, I.; del Río, L. Variability in storm climate along the Gulf of Cadiz: The role of large scale atmospheric forcing and implications to coastal hazards. Clim. Dyn. 2015, 45, 2499–2514. [Google Scholar] [CrossRef] [Green Version]
  46. Laiz, I.; Tejedor, B.; Gomez-Enri, J.; Aboitiz, A.; Villares, P. Contributions to the sea level seasonal cycle within the Gulf of Cadiz (Southwestern Iberian Peninsula). J. Mar. Syst. 2016, 159, 55–66. [Google Scholar] [CrossRef]
  47. Roman-Sierra, J.; Navarro, M.; Muñoz-Perez, J.J.; Gomez, G. Turbidity and other effects resulting from Trafalgar sandbank dredging and Palmar beach nourishment. J. Waterw. Port Coast. ASCE 2011, 137, 332–343. [Google Scholar] [CrossRef]
  48. Massel, S.R.; Gourlay, M.R. On the modelling of wave breaking and set-up on coral reefs. Coast. Eng. 2000, 39, 1–27. [Google Scholar] [CrossRef]
  49. Larson, M.; Kraus, N. Representation of non-erodible (hard) bottoms in beach profile change modeling. J. Coast. Res. 2000, 16, 1–14. [Google Scholar]
  50. Gonzalez, M.; Medina, R.; Gonzalez, J.; Osorio, A.; Mendez, F.J.; Garcia, E. An integrated coastal modeling system for analyzing beach processes and beach restoration projects, SMC. Comput. Geosci. 2007, 33, 916–931. [Google Scholar] [CrossRef]
  51. Bernabeu, A.M.; Muñoz-Perez, J.J.; Medina, R. Influence of a rocky platform in the profile morphology: Victoria Beach, Cádiz (Spain). Cienc. Mar. 2002, 28, 181–192. [Google Scholar] [CrossRef]
  52. Vousdoukas, M.I.; Velegrakis, A.F.; Plomaritis, T.A. Beachrock occurrence, characteristics, formation mechanisms and impact. Earth Sci. Rev. 2007, 85, 23–46. [Google Scholar] [CrossRef]
  53. Moreno, L.; Negro, V.; Garrote, L.; Muñoz-Perez, J.J.; Lopez, J.S.; Esteban, M.D. An Engineering Method for the Preliminary Functional Design of Perched Beaches. Theoretical Approach. J. Coast. Res. 2018, 85, 1261–1265. [Google Scholar] [CrossRef]
  54. Eversole, D.; Fletcher, C.H. Longshore sediment transport rates on a reef-fronted beach: Field data and empirical models Kaanapali Beach, Hawaii. J. Coast. Res. 2003, 19, 649–663. [Google Scholar]
  55. Norcross, Z.M.; Fletcher, C.H.; Merrifield, M. Annual and interannual changes on a reef-fringed pocket beach: Kailua Bay, Hawaii. Mar. Geol. 2002, 190, 553–580. [Google Scholar] [CrossRef]
  56. Muñoz-Perez, J.J.; Tejedor, L.; Medina, R. Equilibrium beach profile model for reef-protected beaches. J. Coast. Res. 1999, 15, 950–957. [Google Scholar]
  57. Habel, S.; Fletcher, C.H.; Rotzoll, K.; El-Kadi, A.I. Development of a model to simulate groundwater inundation induced by sea-level rise and high tides in Honolulu, Hawaii. Water Res. 2017, 114, 122–134. [Google Scholar] [CrossRef]
  58. Cooper, H.M.; Chen, Q.; Fletcher, C.H.; Barbee, M.M. Assessing vulnerability due to sea-level rise in Maui, Hawaii using LiDAR remote sensing and GIS. Clim. Chang. 2013, 116, 547–563. [Google Scholar] [CrossRef]
  59. Onat, Y.; Francis, O.P.; Kim, K. Vulnerability assessment and adaptation to sea level rise in high-wave environments: A case study on Oahu, Hawaii. Ocean Coast. Manag. 2018, 157, 147–159. [Google Scholar] [CrossRef]
  60. Kane, H.H.; Fletcher, C.H.; Frazer, L.N.; Barbee, M.M. Critical elevation levels for flooding due to sea-level rise in Hawaii. Reg. Environ. Chang. 2015, 15, 1679–1687. [Google Scholar] [CrossRef]
  61. Fraile-Jurado, P.; Álvarez-Francoso, J.I.; Guisado-Pintado, E.; Sánchez-Carnero, N.; Ojeda-Zújar, J.; Leatherman, S.P. Mapping inundation probability due to increasing sea level rise along El Puerto de Santa María (SW Spain). Nat. Hazards 2017, 87, 581–598. [Google Scholar] [CrossRef]
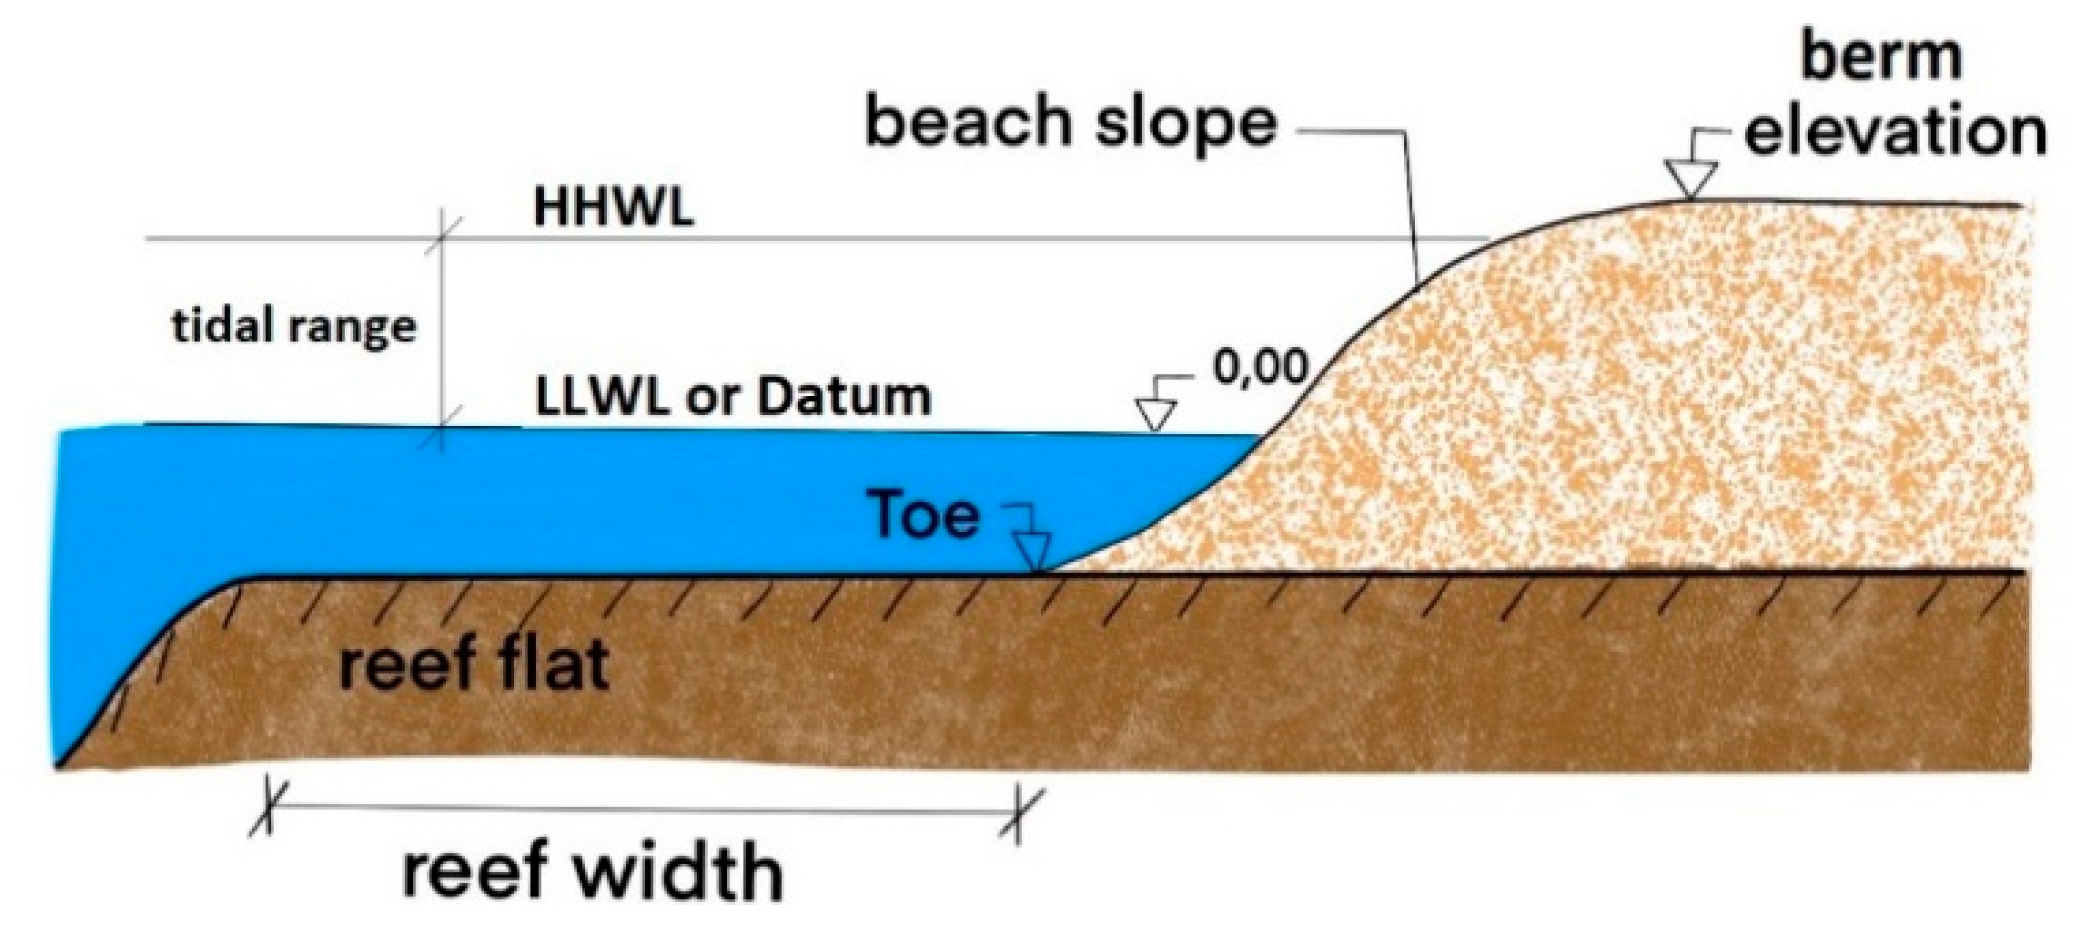
Figure 1. Location of Royal Hawaiian Beach (RHB) in Waikiki, Hawaii, USA (a); and an aerial view where the fringing reef can be observed and the sand extraction site is located (b) (image source: Google Earth 2018).
Jmse 08 00266 g001
Figure 2. Location of Victoria Beach (VB) and indication of the borrow site (named Placer de Meca) in Cadiz, SW Spain, (a); and a ground view of the reef platform (b) (source: Muñoz-Perez, 2009).
Jmse 08 00266 g002
Figure 3. Sketch clarifying different morphological terms used in the text. LLWL refers to the lowest low water level.
Jmse 08 00266 g003
Figure 4. Different aspects of the sediment pouring on Victoria Beach, showing (a) pipe assembly; (b) transport of the pipe to the sea; (c) aerial view of the pipe while pouring; and (d) pipe outlet onto the beach.
Jmse 08 00266 g004
Table 1. Comparison between Royal Hawaiian Beach (RHB) and Victoria Beach (VB) characteristics.
BeachSlope (%)D50
(mm)
Reef Width (m)Tidal
Range
(m)
Berm Elevation
(m)
Toe Elevation (m)LatitudeNature of Sediment
RHB13.30.3410000.9+2.0−1.021° NCalcareous
VB4.50.255003.80+4.0+0.036° NSilicic

