Article

Assessing Different Flood Risk and Damage Approaches: A Case of Study in Progreso, Yucatan, Mexico

by
Wilmer Rey
1,2,*,
Miranda Martínez-Amador
2,
Paulo Salles
2,3,
E. Tonatiuh Mendoza
2,3,
Miguel A. Trejo-Rangel
2,4,
Gemma L. Franklin
2,3,5,
Pablo Ruiz-Salcines
2,6,
Christian M. Appendini
2,3 and
Julián Quintero-Ibáñez
1
1
Centro de Investigaciones Oceanograficas e Hidrograficas del Caribe (CIOH), Cartagena de Indias 130001, Colombia
2
Laboratorio de Ingenieria y Procesos Costeros (LIPC), Instituto de Ingenieria, Universidad Nacional Autonoma de Mexico (UNAM), Sisal, Yucatan 97356, Mexico
3
Laboratorio Nacional de Resiliencia Costera (LANRESC), Consejo Nacional de Ciencia y Tecnologia (CONACyT), Sisal, Yucatán 97356, Mexico
4
Earth System Science Center, National Institute for Space Research (CCST-INPE), São José dos Campos, São Paulo 12227-010, Brazil
5
Cátedra CONACyT-Laboratorio de Ingenieria y Procesos Costeros (LIPC), Instituto de Ingenieria, Universidad Nacional Autonoma de Mexico (UNAM), Sisal, Yucatan 97356, Mexico
6
Programa de Maestría y Doctorado en Ingeniería, Universidad Nacional Autónoma de México, Mexico City 04510, Mexico
*
Author to whom correspondence should be addressed.
J. Mar. Sci. Eng. 2020, 8(2), 137; https://doi.org/10.3390/jmse8020137
Submission received: 31 December 2019 / Revised: 11 February 2020 / Accepted: 13 February 2020 / Published: 20 February 2020

Abstract

:
This study applies three different methods to assess the flood risk and damage from the strongest high-pressure cold front (locally known as ‘Norte’) event in terms of the residual tide from 30 years (1979–2008) of data for Progreso, Yucatan. The most important difference between the three methods is the estimation of flood vulnerability for Progreso. The first method, proposed by Mexico’s National Center for the Prevention of Disasters (CENAPRED) and used by the Mexican government is based mostly on economic asset (household goods) values and flood impacts. The second (CENAPREDv2) and third (FRI) methods are proposals for assessing risk that include 17 socioeconomic indicators. The former includes economic asset values, as is the case for CENAPRED, while the latter does not. The main results of this study show that the modeled ‘Norte’ event flooded 25% of Progreso’s city blocks, with an estimated economic flood risk of $USD 16,266 (CENAPRED) and $USD 223,779 (CENAPREDv2), and flood damage of $USD 48,848 and $USD 671,918, respectively. When calculating flood risk (FRI) and flood damage (FRI_FD) without monetary terms, the risk categories along the back-barrier behind Progreso varied spatially from ‘very low’ to ‘high’, while areas along the coastal side presented a ‘low’ and ‘very low’ risk. These categories increased for the flood damage because the exceedance probability of the flood was not considered as it was for flood risk in the three methodologies. Therefore, flood damage provides the losses caused by a given flood event without considering how probable that loss may be. In conclusion, this study proposes that the selection of the applied method depends on the main objectives and specific interests when assessing flood risk. For instance, if economic damage is the main concern, then the CENAPRED method should be used as it identifies where the larger economic impacts could occur; when a socioeconomic approach is needed then the FRI should be applied, but if both economic damage and socioeconomic aspects are needed, the CENAPREDv2 is recommended. Besides considering economic aspects, the FRI method also includes social variables that can help to map the most vulnerable population in terms of mobility, education, communication access and others. Therefore, the proposed FRI method is very relevant for disaster risk managers and other stakeholders interested in disaster risk reduction.

1. Introduction

The geographical position and topographical characteristics of the northern Yucatan Peninsula expose the coastal zone to flood threats induced by both tropical cyclones [1] and Central American cold surges, locally called ‘Nortes’ [2,3]. A ‘Norte’ event is defined as a cold anticyclonic air mass that originates poleward of Mexico and penetrates equatorward to at least 20° N [4,5,6]. ‘Nortes’ are mid-latitude disturbances characterized by sustained winds of up to about 30 m s−1 and associated with high-pressure systems that frequently originate in the rocky mountains in the United States [5]. They occur during the end of the fall and winter months (November-March) and present a strong interannual variability associated with ENSO conditions [4].
Norte-induced flood damage may be significant along the Mexican coast of the Gulf of Mexico. For instance, the fourth Norte event in 2007 (October 23) caused substantial flooding in the state of Tabasco (southern part of the Gulf of Mexico) with a total cost of damage and losses evaluated in $ USD 2.45 billion [7]. The northern coast of Yucatan is also vulnerable to Nortes, mainly when they occur during high spring tides [3]. As such, it is necessary to have data, tools, and methodologies to quantify flood damage in coastal zones to improve flood risk management related to Nortes. However, the lack of long-term tide gauge records along the Yucatan coast makes it challenging to perform extreme flood analysis in this area; consequently, there is a need to use model data, as is the case for the sea level and currents hindcast implemented for this area [3].
Flood threats increase during extreme events as a result of the wide and shallow Yucatan continental shelf, amplifying storm surge and hence augmenting the physical vulnerability of this region. Of particular interest in the northern Yucatan Peninsula are the ‘Norte’ events due to their higher yearly occurrence (~22 events/year) [2] with respect to less frequent tropical cyclones (0.16 events/year) [8]. Under scenarios of climate change, the number of high-intensity events for the former is likely to decrease, while mild events become more frequent [2]; for the latter, the intensity of hurricanes reaching the Yucatan Peninsula is expected to increase by the end of this century [9]. Recent projections of global mean sea-level rise for the end of the century, incorporating Antarctic ice sheet dynamics, indicate that sea level may rise 70–100 cm under representative concentration pathway (RCP) 4.5 and 100–180 cm under RCP 8.5, and could even exceed 2 m in far-tail scenarios [10,11,12,13]. Adding to this global mean sea level trend, observations in some regions also show increasing tidal amplitudes and increasing nontidal variations in sea surface height [14]. The combined effects of sea level rise, potentially increased tidal ranges, and more frequent hurricane storm surges, will have a significant impact on coastal inundation, which will elevate the risk to the population, economic and natural environments, and more of the low-lying areas may become uninhabitable [14,15]. Moreover, the pressure from the increasing population within low-lying coastal regions often translates into natural defense degradation such as dunes [16], in turn increasing coastal flooding and erosion risk [17]. However, the projection of flood risk due to the impact of climate change is marred by uncertainties related to the modeling of the physics of climate, hydrological, hydraulic domains, vulnerability domains, policies to curb greenhouse gas (GHG) emissions, future human behavior, including future GHG emissions, technological advancements, adaptation strategies, and other aspects [18].
This study aims to assess flood risk and flood damage for Progreso, Yucatan, during an extreme Norte event to improve the understanding and awareness of storm impacts to enhance management plans by strategically designing and implementing timely adaptation measures and resource allocation [17]. For this, three methodologies are compared: the first, which is designed in terms of asset values (household goods) by Mexico’s National Center for the Prevention of Disasters (CENAPRED) and implemented by governmental institutions, involves tangible damage and direct impacts. The second (CENAPREDv2) and third (Flood Risk Index-FRI) are the methodologies proposed in this study that include socioeconomic indicators, which are used to show the relevance of social variables that represent the capacities of people to cope with flood events. These proposed methodologies incorporate tangible and intangible damage as well as direct and indirect impacts since they consider not only economic variables, but also social variables that are used to estimate risk levels. CENAPREDv2 includes economic asset values, as is the case for CENAPRED, whereas the FRI does not. For the three approaches compared in this study, categorization and mapping are performed in order to identify the areas with the highest risk and potential damage, where coastal managers need to make timely decisions to mitigate the flood risk. Each flood risk method has its associated flood damage method. The latter differs from the former in excluding the exceedance probability of a given flood. When defining the vulnerability from an economic or socioeconomic perspective, the resulting flood risk allows emergency managers to decide what to protect from the flood hazard: economic resources (CENAPRED), the coastal community (FRI), or both (CENAPREDv2).

2. Theoretical Considerations
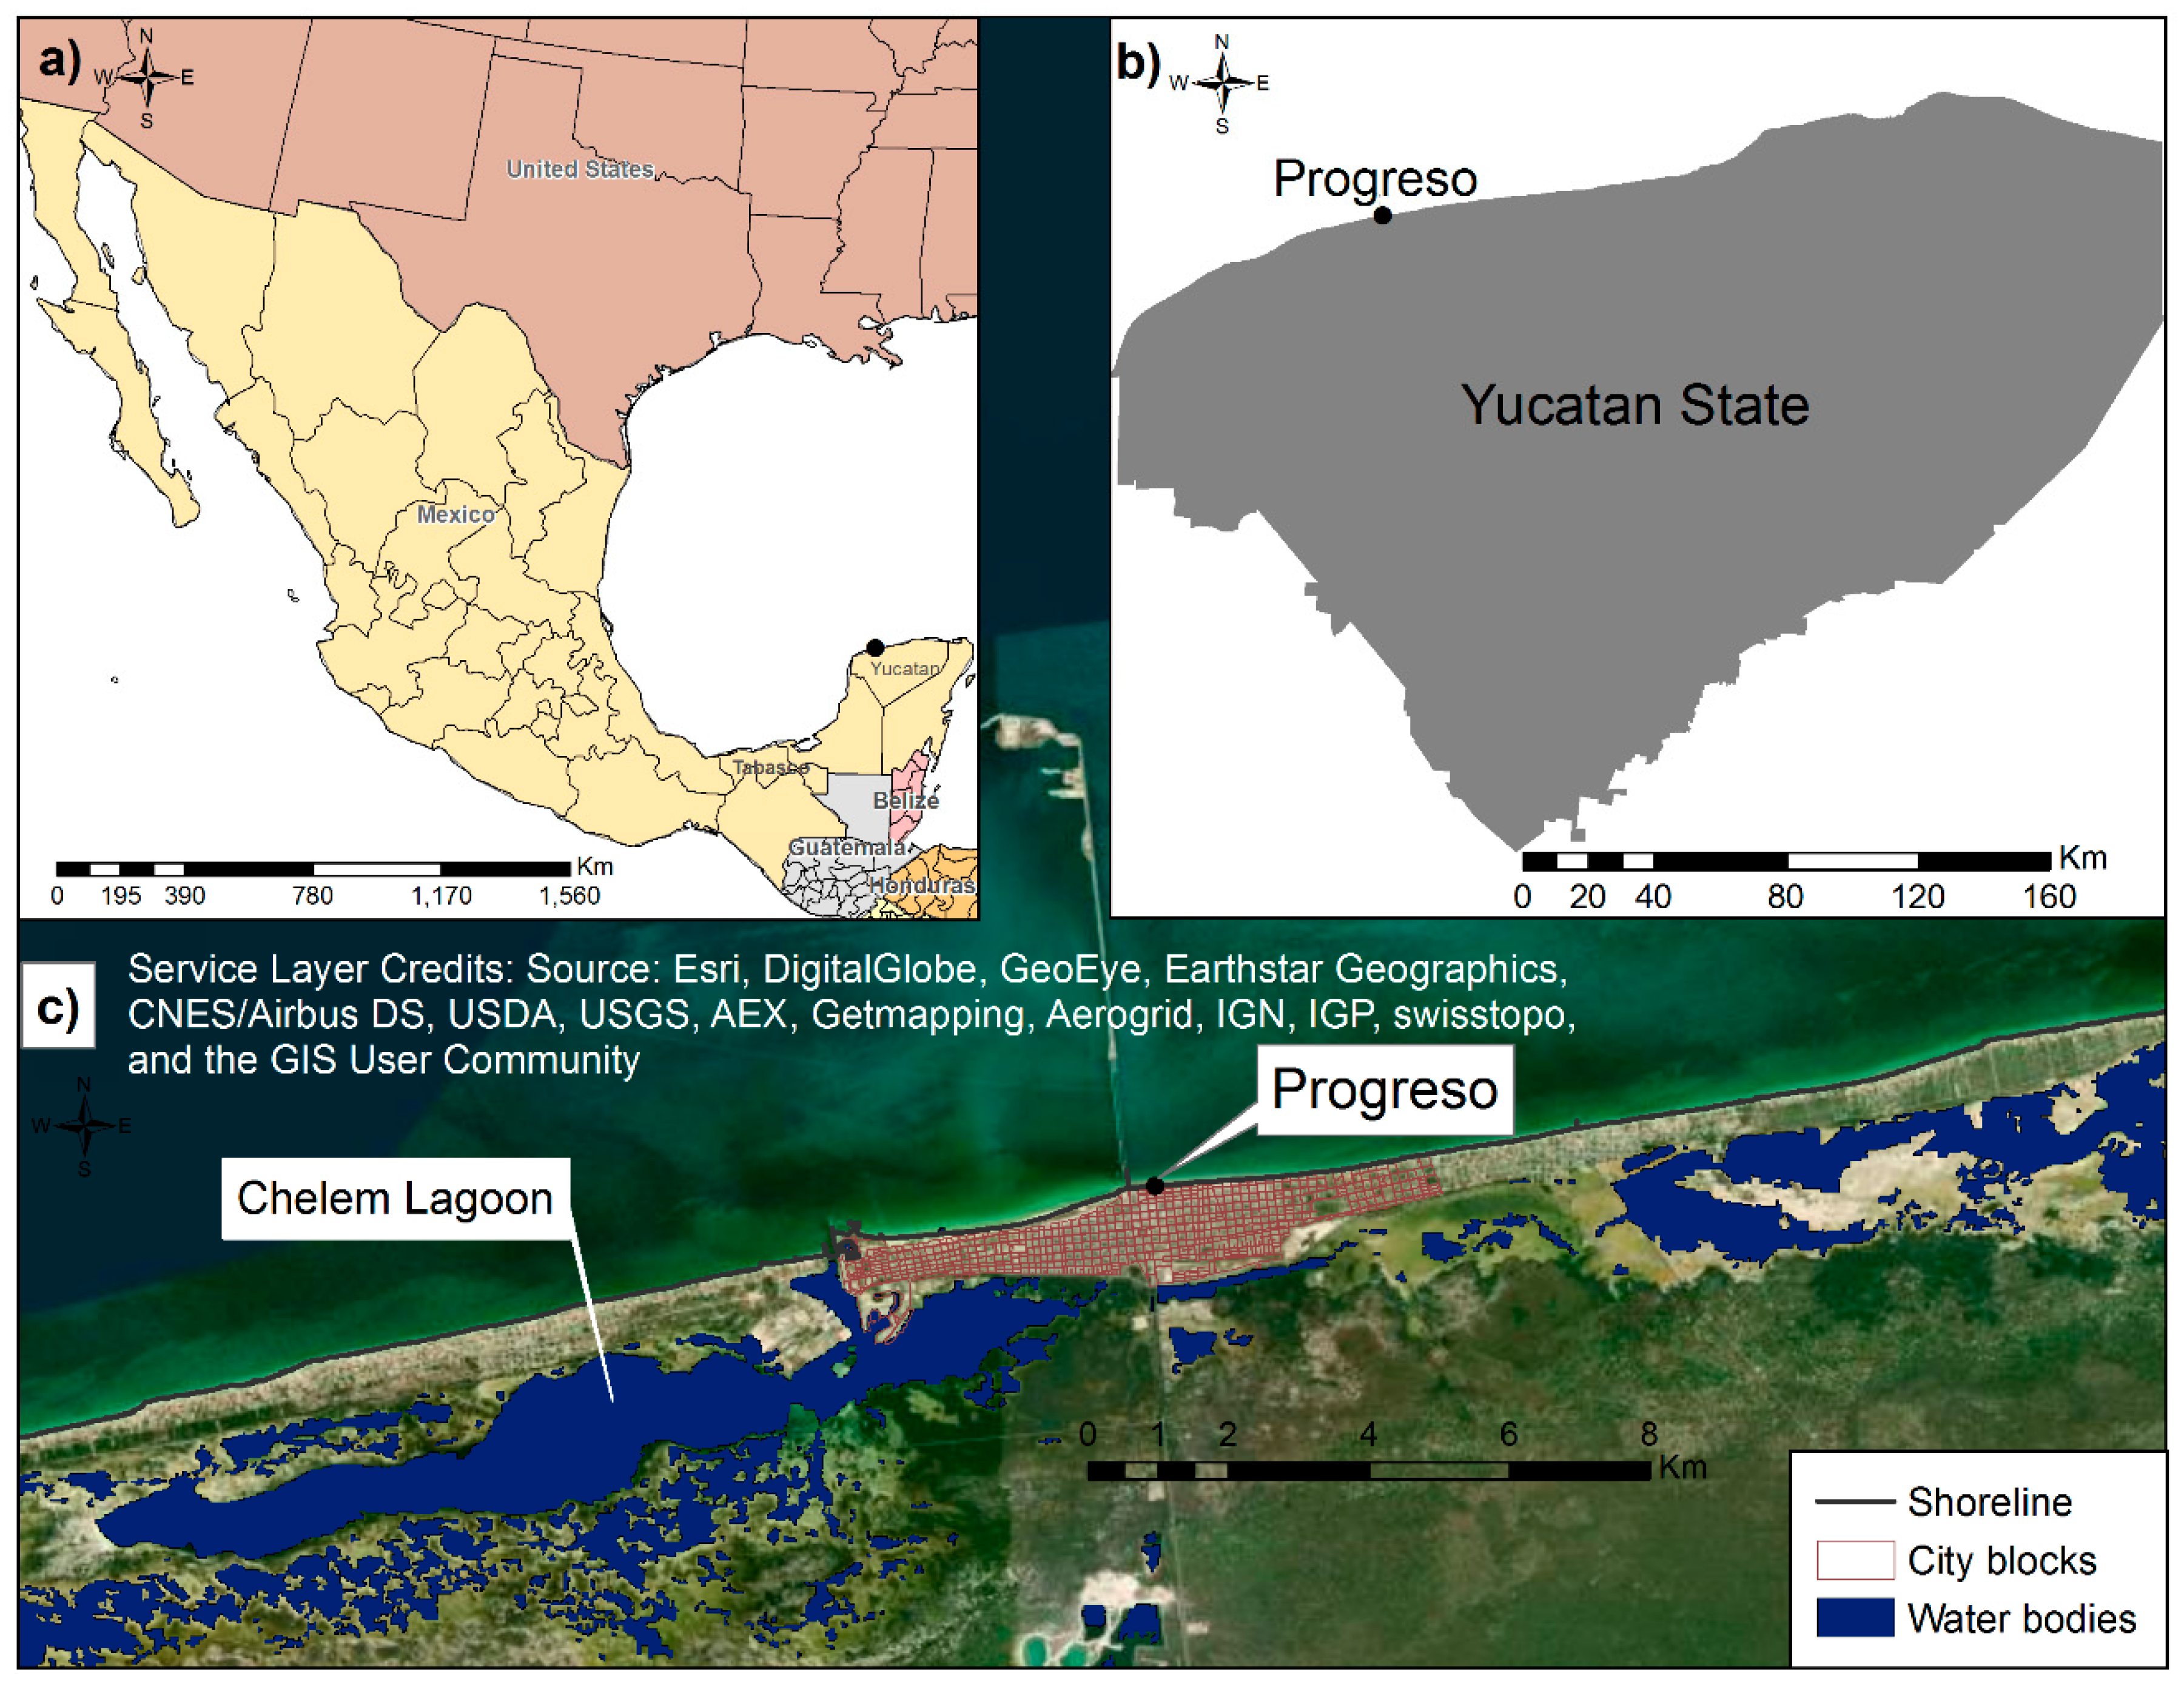
Given that there is no consensus on flood risk management terms such as flood hazard, flood vulnerability, flood damage, and flood risk [19,20], these need to be defined in each study. Hazard and risk are not synonyms, and their distinction depends on the area where they are used; while the former is unpredictable, the latter is predictable. The hazard becomes a risk only if there is a probability of occurrence of damage to exposed elements (all elements of the human system, both built and natural environments) [21,22]. Therefore, if there are no exposed elements, the flood is not considered a hazard [23]. The flood hazard definition adopted in the present study is considered as the exceedance probability of a potentially damaging flood event in a particular area and within a specific period of time, as defined by [22]. However, the flood hazard should quantify the intensity of the process that goes beyond a flood frequency curve, which does not provide information about the damage to the natural environment or the society. The flood damage depends, among other aspects, on the intensity of the flood and is usually transformed into inundation scenarios [22]. The flood hazard depends on many parameters such as occurrences, duration, magnitude, flow velocity, water depth, rate of water rise, sediment or contamination load, etc. [24,25,26,27]. Among these indicators, the one that has the most significant influence on flood damage is the water depth [28,29], also known as the inundation depth [22,27] or flood depth [26,30], which is the water elevation above the ground level. The exceedance probability of floods is usually calculated on the basis of the general water level, which has a limited range that is significant for risk analysis, even though potential flood damage is very high in the case of high water levels [21]. The water depth is the main element of hydrodynamic flood modeling [31] preferable for Geographic information system (GIS) models in the case of Coastal Flood Vulnerability Assessments (CFVA), as it avoids certain cases of over-estimation–and over-management–found in GIS-based results. In fact, hydrodynamic models are better suited for detailed CFVA, whereas GIS-based models, which do not take into account flow dynamics, can be used to model flood exposure for large sites [32]. For vulnerability, we considered the conditions determined by physical, social, economic, and environmental factors or processes that increase the susceptibility of an individual, a community, assets, or systems to the impacts of hazards, as defined by the UN Office for Disaster Risk Reduction [33]. In the case of inundations, a system is susceptible to floods due to exposure in conjunction with its capacity/incapacity to be resilient, to cope, recover, or adapt [34]. In the CENAPRED methodology, masonry structures [35] are considered in the definition of vulnerability, using the characterization of masonry structures to infer the value of household goods (refrigerator, washing machine, phone, TV, computer, etc.) that these houses may contain. It is therefore assumed that the better masonry structures the houses have, the more expensive the household goods within them are, hence they are more vulnerable to flooding. This definition is applied to all the exposed sectors (residential, industrial, etc.).
Flood risk is usually considered as the product of hazard and vulnerability, risk being defined as the probability that events of a given magnitude and a given loss will occur. Therefore, risk covers two aspects: hazard and vulnerability [22,26]. In Mexico, CENAPRED defines flood risk as the product of the cost of assets (household items) similar to [22], the vulnerability, and the exceedance probability of a given flood [36]; vulnerability is expressed as the percentage damage of the exposed assets, and as a function of the water depth (hazard) reached at each type of housing (economic vulnerability). Therefore, according to the definitions presented above, CENAPRED’s vulnerability is closer to the definition of risk than vulnerability itself.
In this study, we use the definition of [36] for flood damage, calculated as the product of the cost of exposed assets (household goods) and flood vulnerability. This means that flood damage is independent of the exceedance probability of a given flood. The magnitude of flood damage over a determined area does not only depend on the characteristics of the event that generates the hazard but also on the vulnerability of the elements exposed in the flooded area [30]. Therefore, areas with higher vulnerability experience greater damage from floods of a given intensity and given exceedance probability [22].

3. Study Area

The study area comprises the largest urban area of the municipality of Progreso, located on a barrier island on the northern coast of the Yucatan Peninsula (Figure 1). The community of Progreso is the most urbanized and economically important coastal city on the northern coast of Yucatan. The coast of this community can be classified geomorphologically as a type of barrier island, backed by the Chelem lagoon, which extends towards the western part of this community. Thus, important hydrodynamic processes increase the inundation threat on the back-barrier behind Progreso. Inland, the largest surface area corresponds to a mangrove ecosystem, although wetlands and petenes (islands of flooded jungle vegetation around freshwater springs or sinkholes) can be found. Along the Yucatan coast there are water bodies that are seasonally disconnected from one another, where the main contributor is fresh water from springs due to fractures in the largely confined aquifer [37]. Figure 1 (panel c) shows the spatial distribution of water bodies surrounding Progreso’s coast based on the global land cover classification with 30 m resolution from the National Geomatics Center of China data set [38].
Regarding the climate of the study zone, predominant winds are associated with sea and land breezes from the NE and SE, respectively with higher intensity and occurrence during spring [39]. The mixed tide has a diurnal dominance and strong neap-spring variability, with tidal ranges that vary from 0.1 m during neaps to 0.8 m during springs [40]. Given the wide (245 km) continental shelf and its mild slope (1/1000) [41], on the one hand, the wind-wave energy is dissipated far offshore [42], while on the other hand, the area is highly prone to being flooded by hurricane storm surges [1]. A detailed description of the characteristics of the study zone can be found in [3,43]. The study zone is boarded by city blocks, which are the smallest part of a town enclosed by streets (Figure 1, panel c).

4. Materials and Methods

To assess the Norte flood risk and flood damage for Progreso, Yucatan, three different approaches were used. For this, the characterization of the flood hazard was carried out based on the work of [3]. Section 4.1 describes this characterization. The vulnerability was calculated based on two different methodologies and combined with a flood hazard map to estimate the flood risk and flood damage as mentioned in Section 4.2 and Section 4.3, respectively.

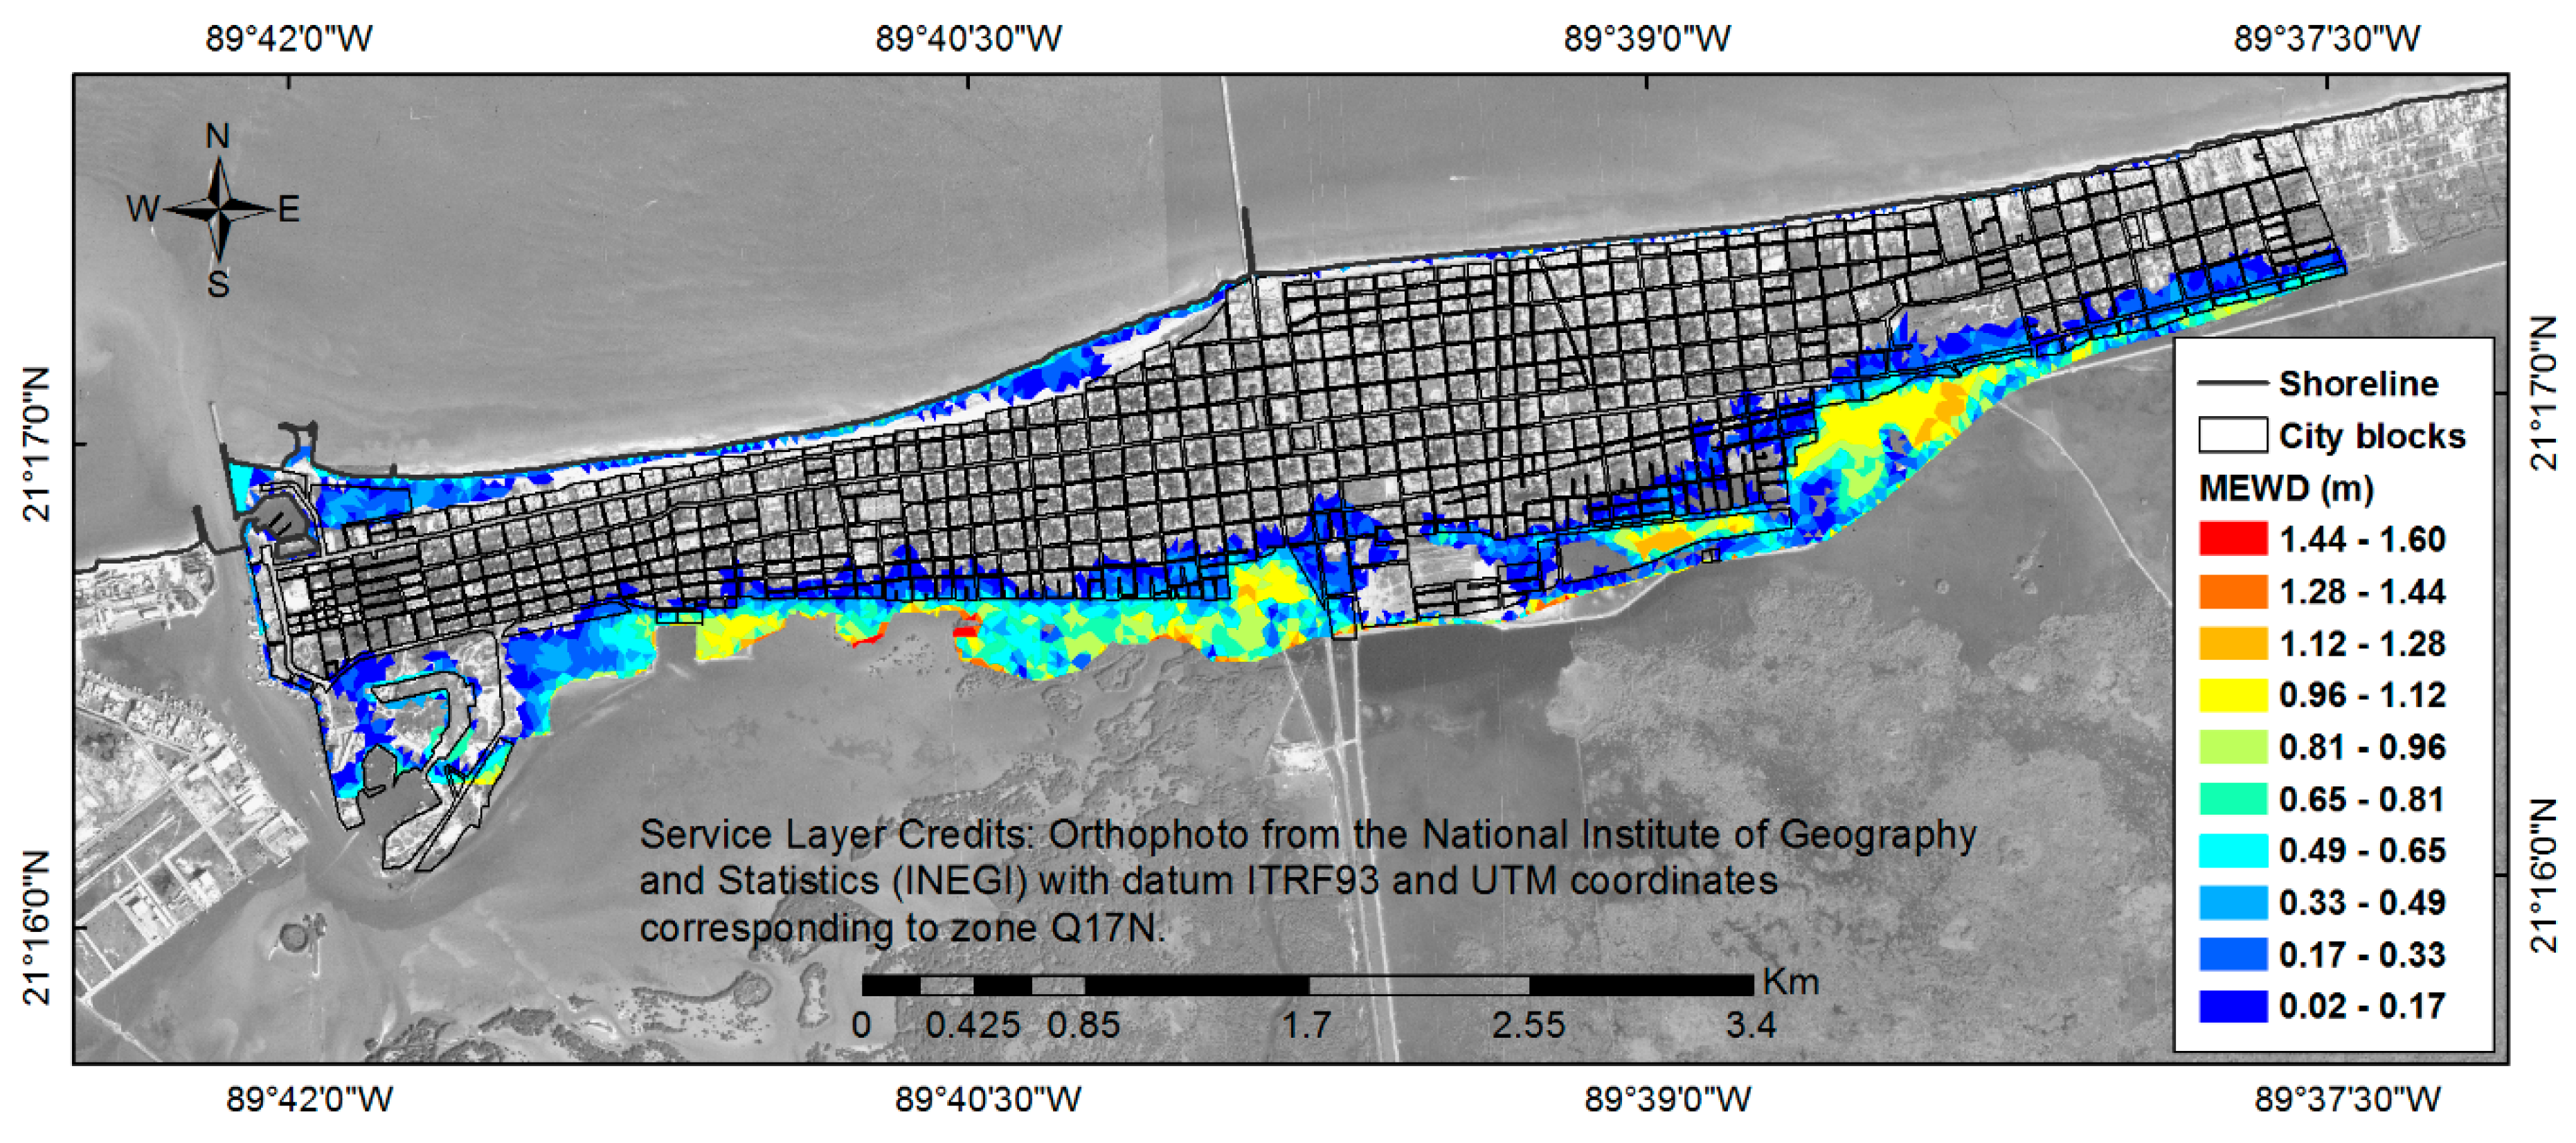
4.1. Flooding Assessment

To address the scarcity and large gaps of tide gauge data in the study area, we used a 30-year (1979–2008) hindcast of water level and currents (excluding sea level generated by tropical cyclones) [3]. This hindcast was obtained using a hydrodynamic model forced with astronomic tides from the global tide model [44], currents in the Yucatan channel based on results reported by [45], and wind and pressure fields from the Climate Forecast System Reanalysis (CFSR) database [46]. The readers are referred to [3] for more details regarding the model setup. The 30-year hindcast data were used by [3] to compute the extreme water levels at Progreso using the Generalized Distribution of Extreme Values [47,48], from which we selected the Norte event with the largest residual tide (12–14 March 1993) to assess the flood risk and damage for this study. The extreme analysis was performed based on sea surface water level time series extracted from the computational domain from a point located 2 km offshore (5 m depth), where the Progreso tide gauge is situated (with only six years of records, January 1, 1979–December 31, 1984). Based on tidal predictions [44] the Norte reached the Yucatan Peninsula near low tide and corresponds to a Type IV Norte as defined by [2], which are the second most energetic Norte event when considering wave power. The return period associated with the maximum water levels at Progreso was of only three years when including astronomical tides. However, if the extreme analysis is performed based on the residual tide (water level minus astronomical tide) the return period changes to 67 years. This shows that including astronomical tide is crucial for estimating return period for a given sea water level. If the interaction between the residual and astronomical tides is linear, the use of joint probability methods could be used [49]. However, [3], using numerical experiments, a non-linear relationship between astronomical and residual sea levels was found at Progreso. There are more complex alternatives to calculate sea water level probability given the height of the astronomical tide and phase when the storm surge arrives [50], which is beyond the aim of this study and for simplicity, the return period of three years associated with the water level induced by the Norte was used to estimate the flood risk at Progreso. An in-depth explanation of the characteristics of the Norte and the effects of astronomical tides on flooding is found in [3]. The exceedance probability of a flood ( P ) is, by definition, just the inverse of the return period. Thus, the three-year Norte-induced total water level (astronomical tide + residual tide) return period has a P of 0.333.
The Norte-induced flood simulation ran by [3] took into account the contribution of the astronomical tide, storm surge, and wave set-up. The readers are referred to [3] for more details. Using these results, the maximum envelope of water depth (MEWD) was computed, which is a map of the maximum water level at each cell element of the computational mesh and includes all of these ocean forcings. Figure 2 shows the distribution of the MEWD for this simulation, with maxima of up to 1.6 m, which was the only flood extension taken into account for the risk assessments for the three methodologies analyzed. The model result was extracted from the computational domain for the area of Progreso landward of the coastline. The most affected areas are along the back-barrier behind Progreso, given the hydrodynamic processes generated inside the Chelem lagoon. The total number of flooded city blocks was 157 (25% of the total number of city blocks for Progreso), with eight located along the coastal side, and 149 along the eastern lagoon shores.

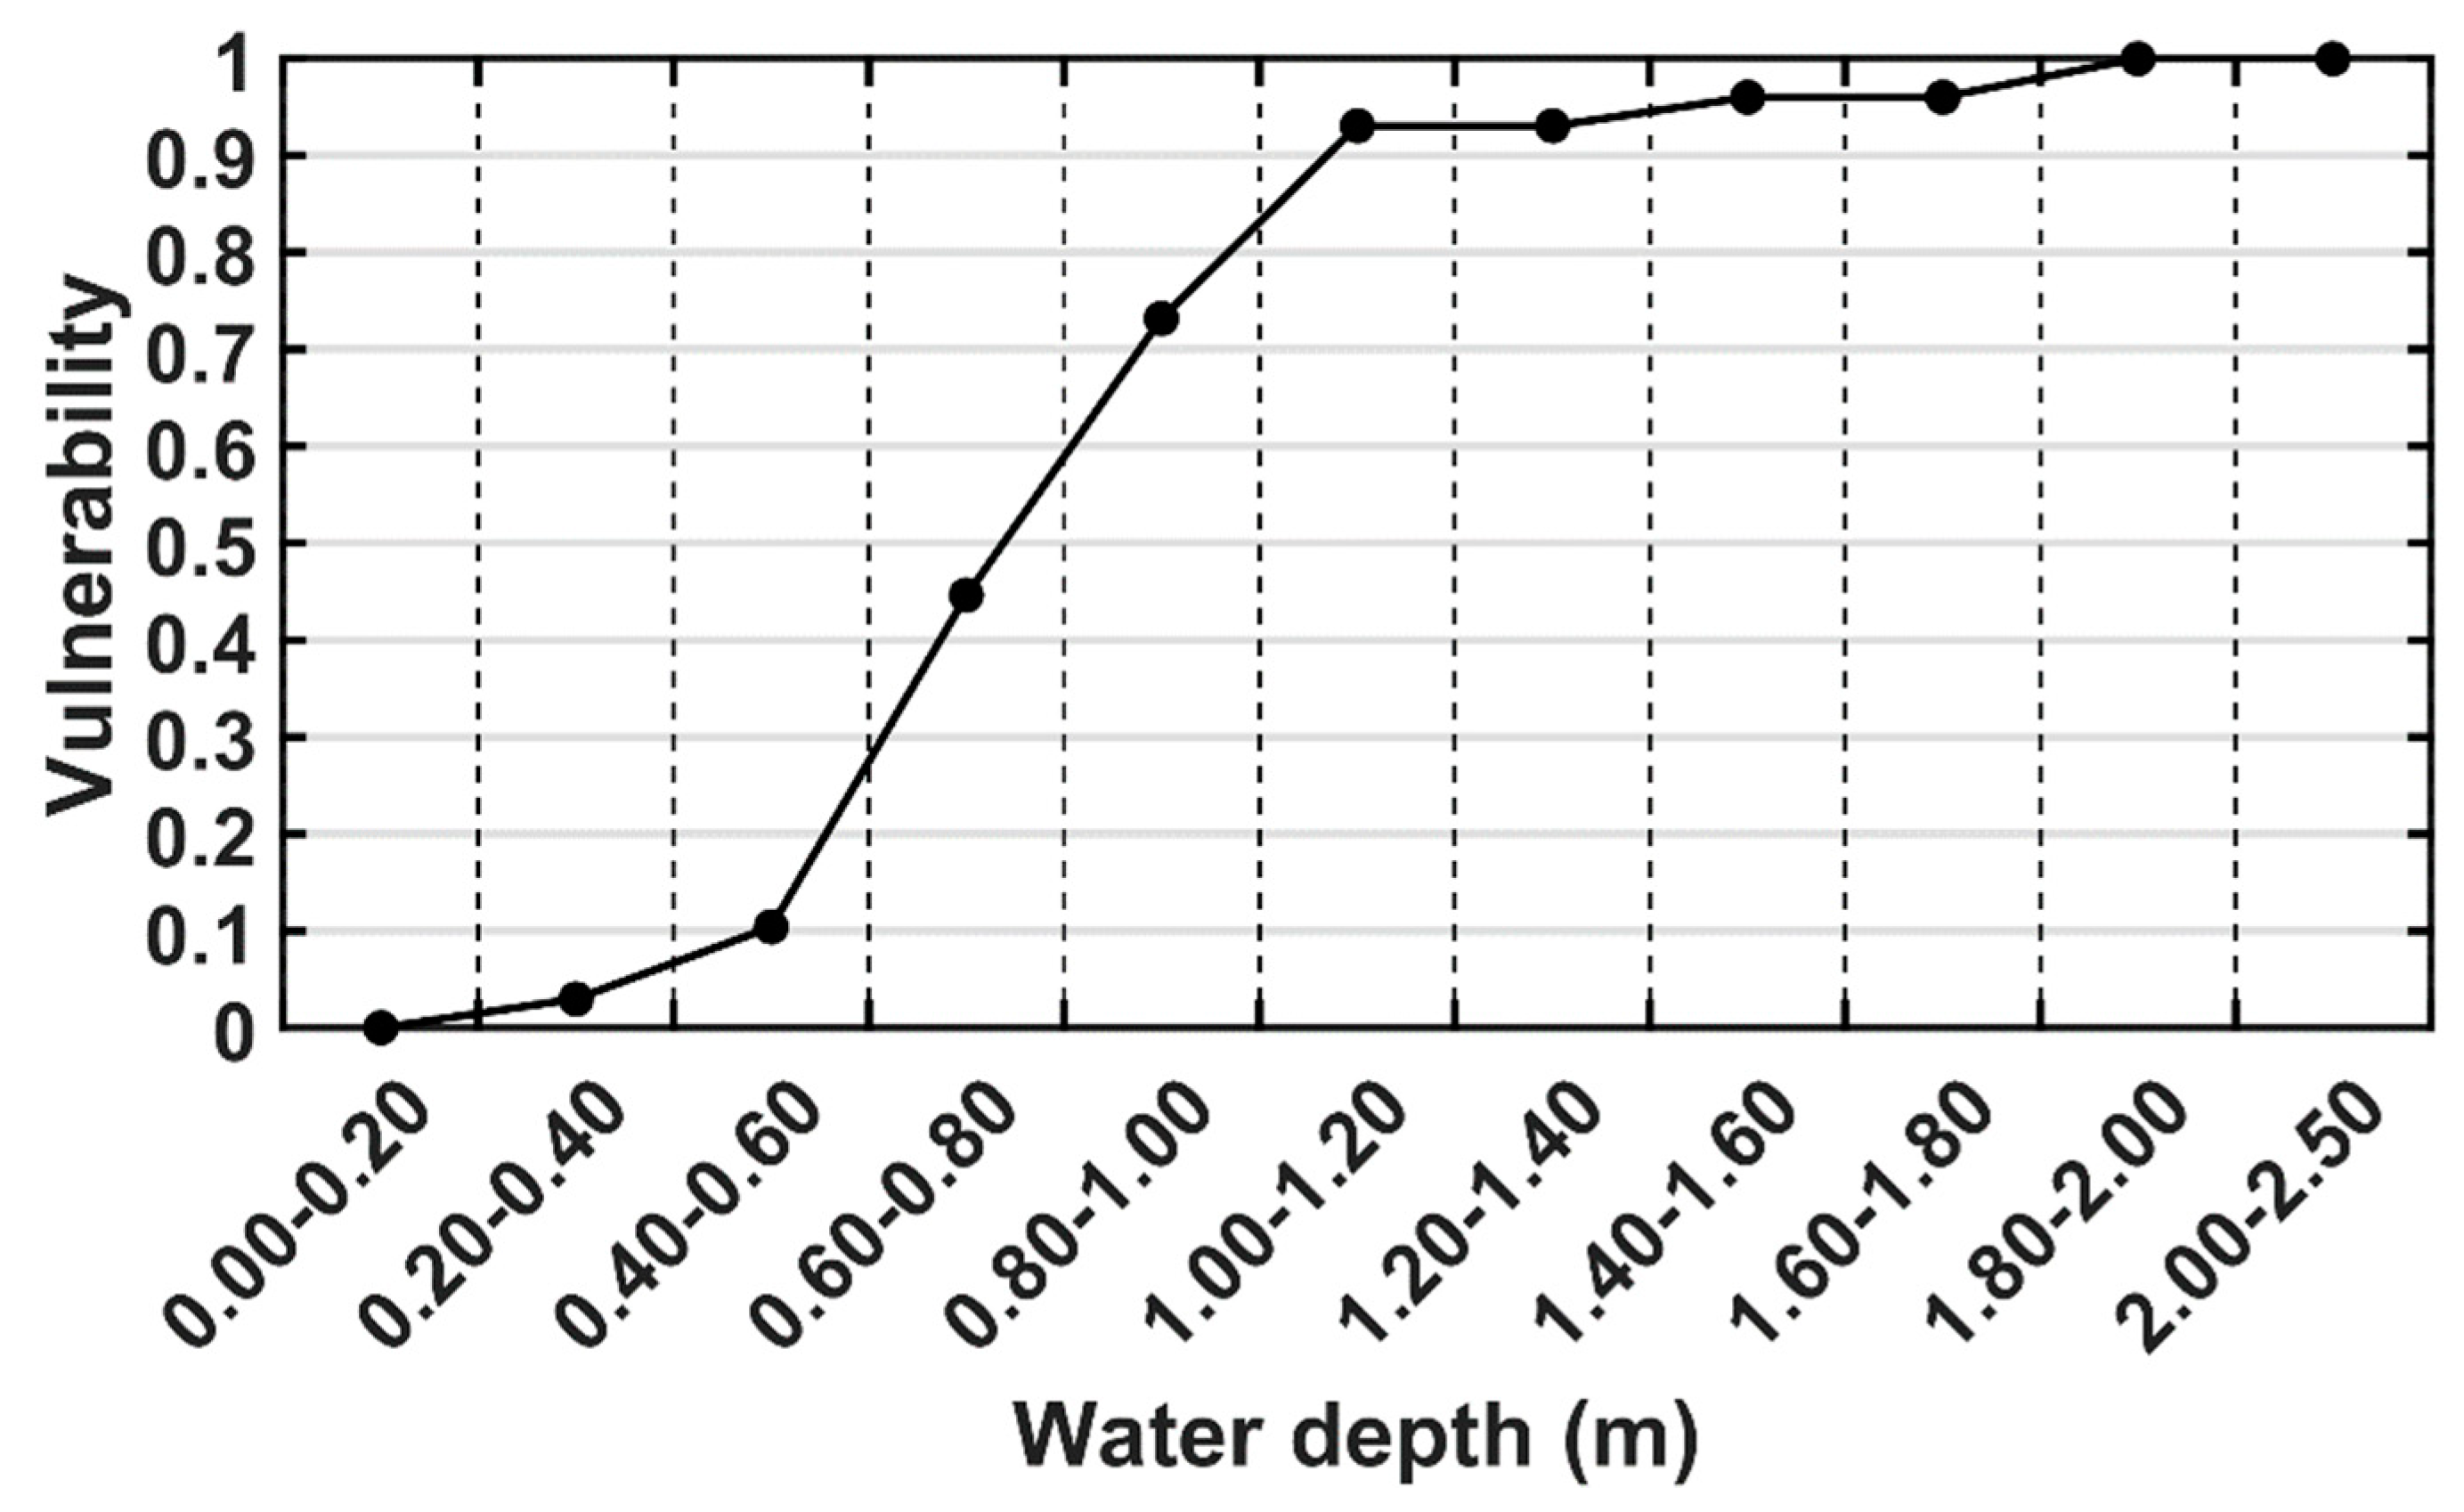
4.2. Flood Risk Assessment

Once the flood hazard had been characterized for the Norte, the vulnerability and flood risk were estimated following three different methodologies: CENAPRED, CENAPREDv2, and the FRI, as described below.
CENAPRED uses the following expression to compute the flood risk
R = C V P
where C is the cost of exposed assets (household items) to the flood hazard, V is the vulnerability expressed as the percentage damage of the goods resulting from a potentially damaging phenomenon, and P is the exceedance probability of a given flood hazard. For V , the CENAPRED methodology quantifies the flood vulnerability for each type of housing based on the most commonly used materials for the roofs and walls of Mexican homes.
Houses are classified into five levels according to their masonry structures to infer their ability to respond to flood events. To estimate vulnerability for every kind of housing, CENAPRED takes into account the configuration of furnishings and domestic appliances, quantifying the percentage damage to each house as a function of the water depth reached. This means that the higher the water levels reached at the more luxurious type of housing, the more vulnerable the households are from an economic perspective. However, according to the definitions of vulnerability [33,51,52], this is an independent variable that exists whether there is a flood or not, which may be considered as a limitation of the CENAPRED flood risk methodology. Figure 3 shows the vulnerability function for type I housing, while the functions for type II to V are presented in [36]. In the absence of a hazard (water depth = 0), vulnerability is zero. This vulnerability has non-dimensional units, ranging from 0 to 1, increasing when the water depth at the more luxurious housing increases. In this sense, the more household goods there are, the more flood damage is expected for a given flood. Table 1 shows the main characteristics of each house and the value of its associated household goods.
The housing lots for Progreso were defined according to the database of the National Institute of Statistics and Geography [53] and complemented with satellite images and a LIDAR topographic survey from 2011. Subsequently, to classify the properties of the lots according to the CENAPRED methodology, we collected the information through visual inspections outside of the houses in Progreso. Using a Geographical Information System, we assigned different attributes to each lot (type of housing, cost of exposed household items, maximum water depth reached, vulnerability, P , and risk).
Given that the variables for risk are dimensionless, except for the value of assets, which were converted to US dollars, taking into account the exchange rate and the accumulated devaluation from 2006 (year of the CENAPRED methodology) to 2018, which according to the Mexican consumer price index was 66.52% [54]. To estimate the total flood risk in monetary terms for each event, we calculated the sum of the individual flood risk per house for Progreso.
The CENAPRED methodology is the official approach used at the federal level in Mexico to assess coastal flood risk. It is a tool used for determining the flood risk in monetary terms for areas struck by storm events but has limitations in evaluating an integrated flood risk, as it does not take into account other aspects of vulnerability. For example it does not account social [20,51,55], cultural, educational, political, ideological, institutional [56], and ecological issues, which are closely interconnected and form characteristics of the socio-ecological communities which face the diverse impacts of floods. These aspects of vulnerability are crucial for obtaining an integrated flood risk assessment. For the CENAPRED methodology, the highest flood risks are for flooded areas with more expensive housing. For instance, from a socioeconomic perspective [57] found that the neighborhoods that were more vulnerable to flooding in Georgetown, Guyana, tended to be those with low household incomes, poor housing quality, and low levels of community organization. Another study by [56] at the regional level, focusing on the coastal zone of the Mexican Caribbean, shows that the vulnerability of human settlements in coastal areas is closely linked to social processes, social fragility, and a lack of capacity to recover from flood damage. Therefore, informal settlements with high population density, poor shelter, little or no access to resources such as safe water and public health services, and low adaptive capacity, are more vulnerable. Based on the importance of including these diverse impacts, which are not included by the CENAPRED methodology, we have proposed two alternatives to assess flood risk and damage, covering some of the aspects mentioned above.
CENAPREDv2 is a new alternative to the CENAPRED methodology. This methodology uses the following expression
R 1 = C V 1 P      
where C and P have the same definitions as in the CENAPRED methodology, but V 1 is the socioeconomic vulnerability proposed by [1] for the states of Yucatan and Campeche, which consists of 17 indicators: total inhabitants, people under 14 years old, people over 64 years old, unemployed population, illiterate population, disabled population, non-Spanish speakers (indigenous population), people born in a different entity, foreign population, population with no health services, divorced or windowed population, total homes, total inhabited homes, homes with no services such as electricity, water, sewer system, homes with no fridge, washing machine or car, homes with no communication technologies and homes with no home appliances. These indicators were selected in terms of mobility (age), education, households and communication access, similar to [58], and were standardized, weighted, and summed to obtain a single indicator. For more information the readers are referred to [1]. In the CENAPRED and CENAPREDv2 methodologies, the risk is expressed in US dollars; therefore, these two methodologies are comparable. Given that the socioeconomic vulnerability ranges from 0 to 1, the natural break method [59] was used to create five categories, as shown in Table 2. This classification was also used for the CENAPRED vulnerability for comparison purposes.
The FRI methodology has already been implemented for the states of Yucatan and Campeche, Mexico by [1], where risk is the product of the vulnerability and the hazard [26,30]. However, here we included P in the FRI expression as in CENAPRED, where the FRI formulation is defined as
R 2 = P V 1 w d 1      
where P has the same definition as in the CENAPRED methodology, V 1 is the same as in CENAPREDv2, and w d 1 is the normalized total water depth as defined in previous studies [1,22,30].
The units for R 2 are dimensionless, and it is the product of the hazard, the socioeconomic vulnerability [1,26,30], and P [36]. P was assumed to be constant for the entire flood-prone area for these three methodologies.

4.3. Flood Damage Assessment

The flood damage (FD) associated with the CENAPRED and CENAPREDv2 methodologies, hereafter referred to as CENAPRED_FD and CENAPREDv2_FD, respectively, was calculated as the product of the cost of exposed household goods and the flood vulnerability. The flood damage associated with the FRI, hereafter referred to as FRI_FD, was calculated as the product of the normalized water depth and the normalized socioeconomic vulnerability. Given that the FRI_FD has an associated return period of three years, it is sometimes defined as an FRI [26,30,52]. Nevertheless, these authors do not consider the exceedance probability of a given flood in their FRI formulation, and instead, they used the return period alone to show the water depths and extent of the floods associated with the FRI_FD. Therefore, the differences between an FRI and FRI_FD need to be defined. In this study, FRI is an estimate of the probability of occurrence of a given magnitude and a given loss, and FRI_FD estimates the losses in the case of occurrence. The Norte-induced FRI and FRI_FD categories were calculated as shown in Table 2, where the water depth ranges are based on the level of difficulties in daily life and/or damage to properties, as defined by [30], hazard ranges are the normalized water depth ranges. The vulnerability ranges, P and estimation of FRI have already been described in Section 4.2. Given that the ranges of FRI_FD are larger than for FRI, these were also used for FRI for comparison. FRI_FD ranges were subsequently converted into five categories, from ‘very low’ to ‘very high’.

5. Results

This section shows the results for the flood vulnerability, flood risk, and flood damage of the Norte for Progreso, Yucatan.

5.1. Flood Vulnerability of the Norte for Progreso

Figure 4 shows the Norte flood vulnerability estimated with the CENAPRED approach (top panel) and the socioeconomic vulnerability (lower panel). For the former, the values range from 0.02 up to 0.45, and since CENAPRED vulnerability depends on the water depth, the vulnerable areas are only located in flooded areas, showing ‘low’ and ‘very low’ as predominant categories. The socioeconomic vulnerability ranges from 0 to 1, and given that it is independent of the water depth, it is homogeneously spatially distributed across both dry and wet areas. This socioeconomic vulnerability was used to calculate CENAPREDv2, FRI, CENAPREDv2_FD, and the FRI_FD, where most of the areas along the back-barrier behind Progreso are in the ‘high’ and ‘very high’ categories.
The flood-prone area shown in the flood map (Figure 2) is larger than its associated CENAPRED vulnerability (Figure 4) since according to CENAPRED, vulnerability is zero for areas where there are no houses, regardless of the water depth reached.

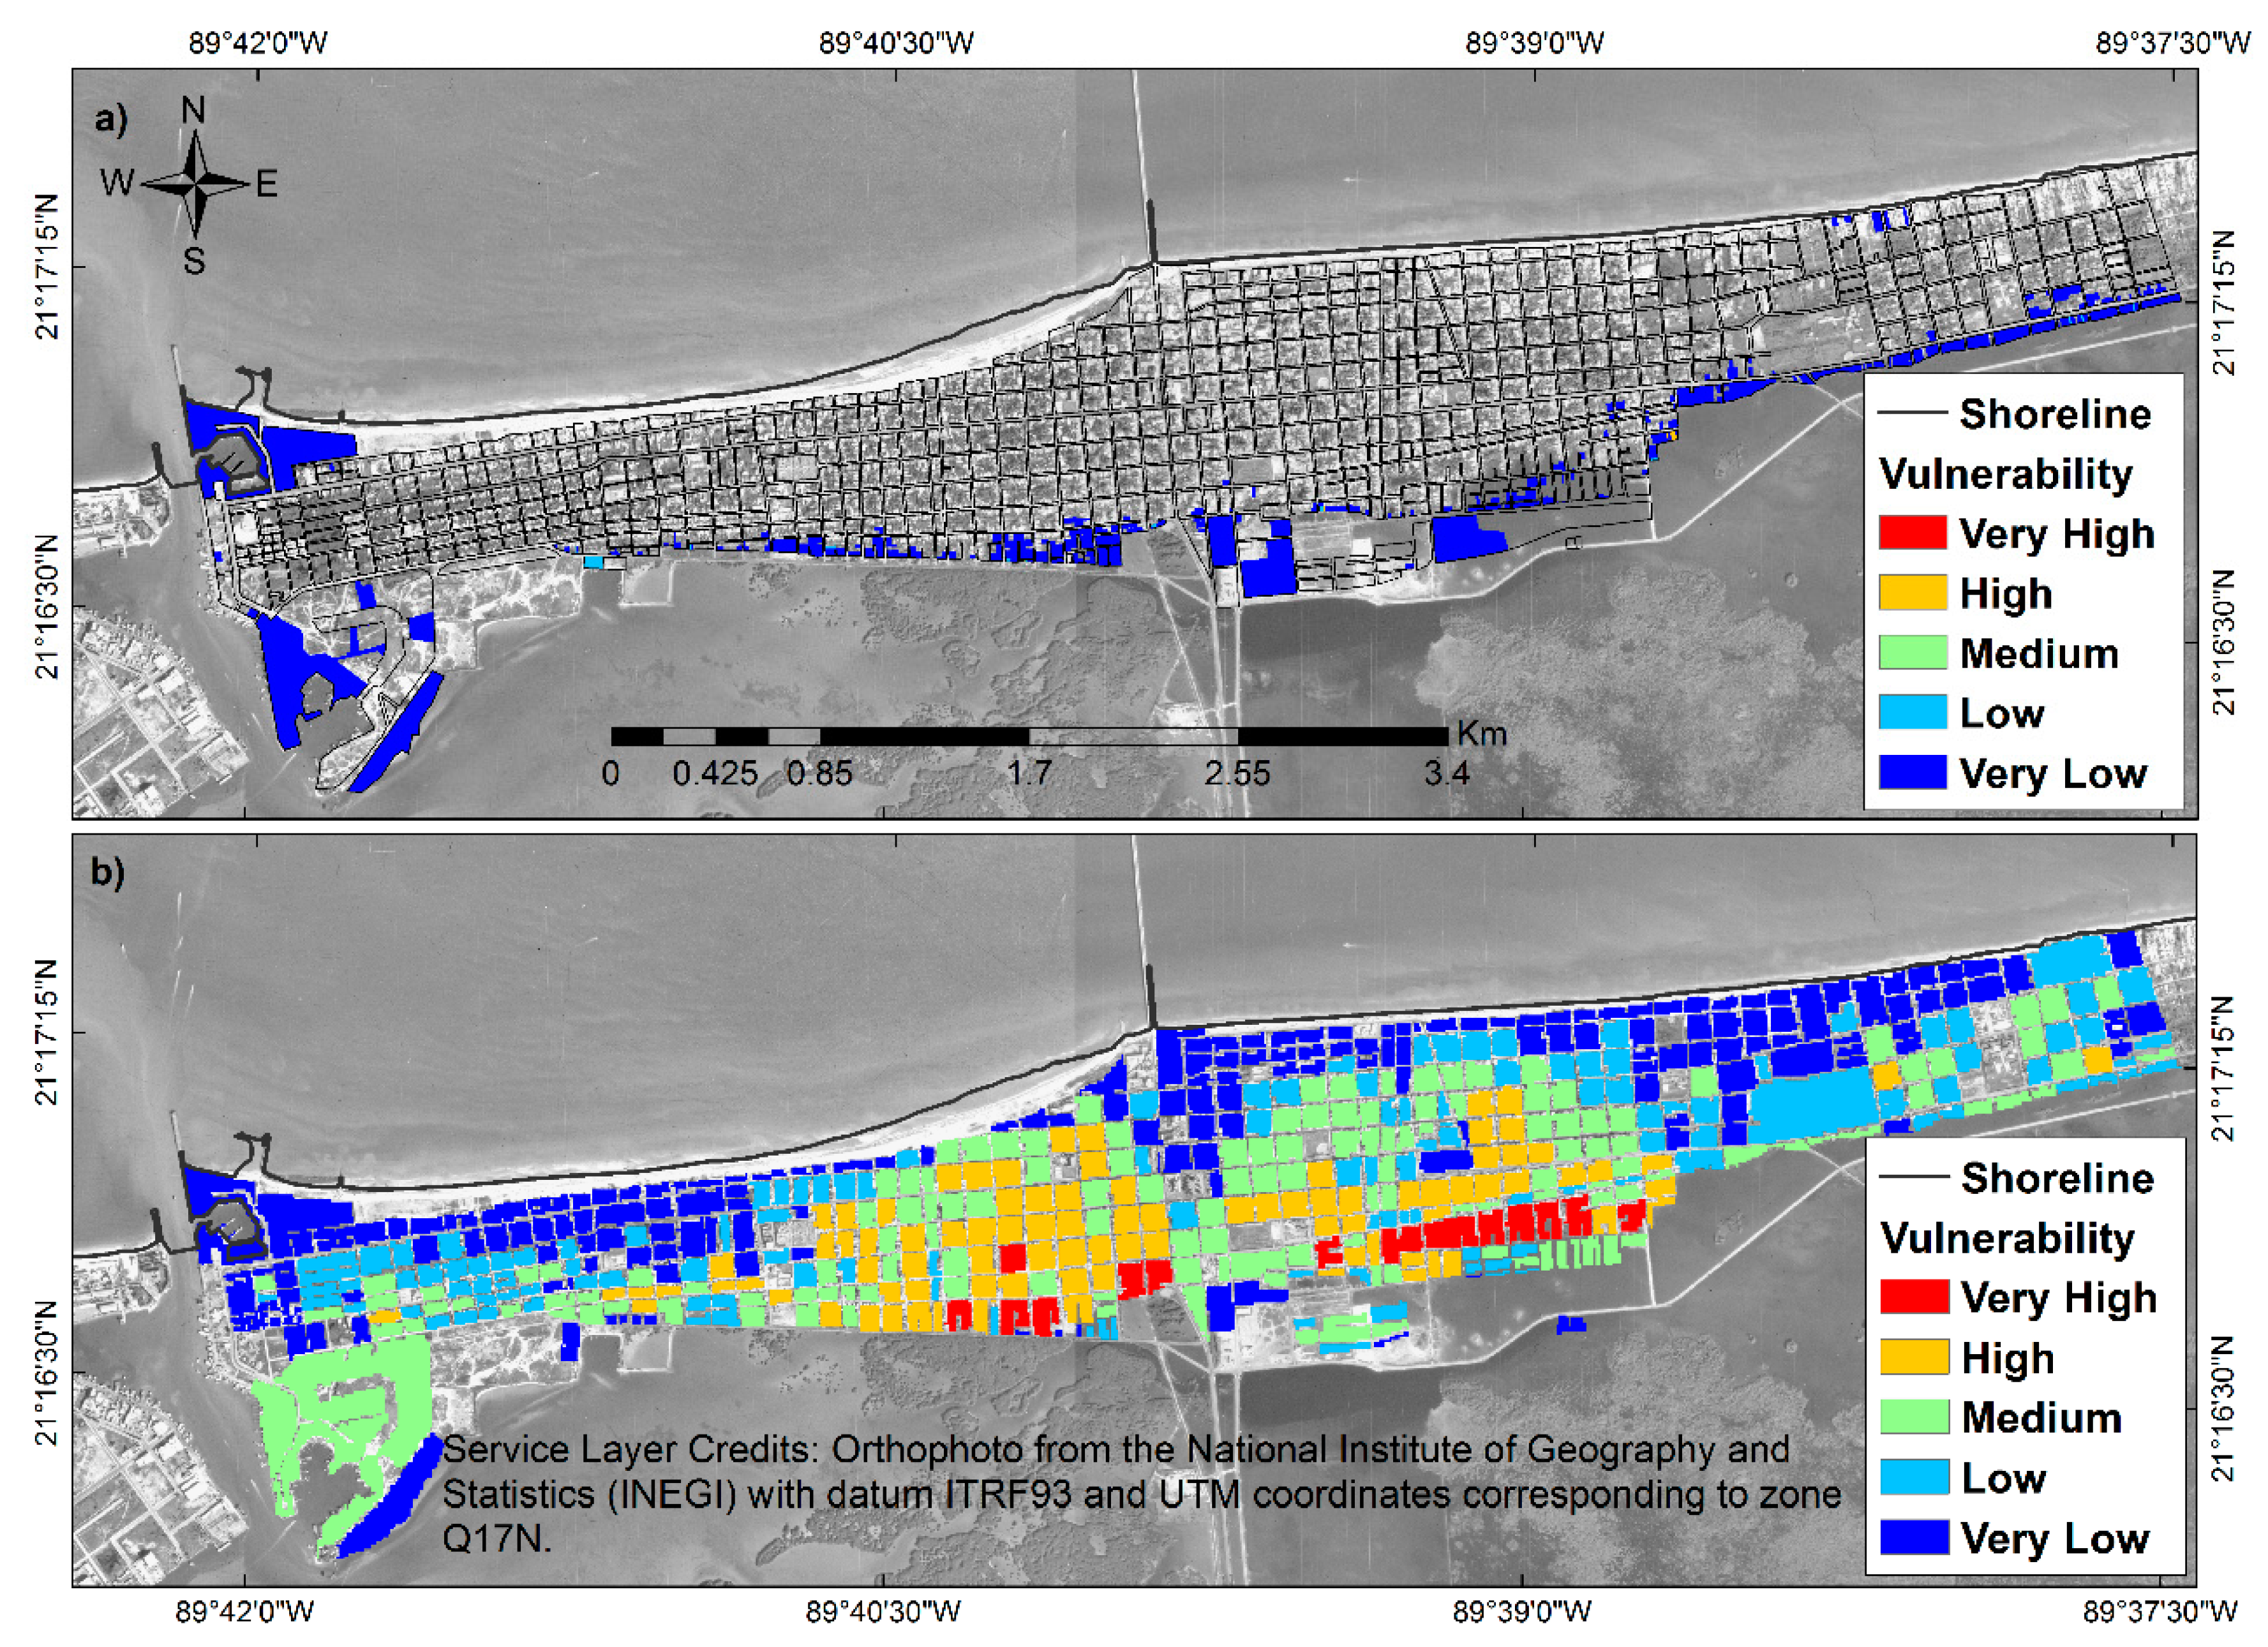
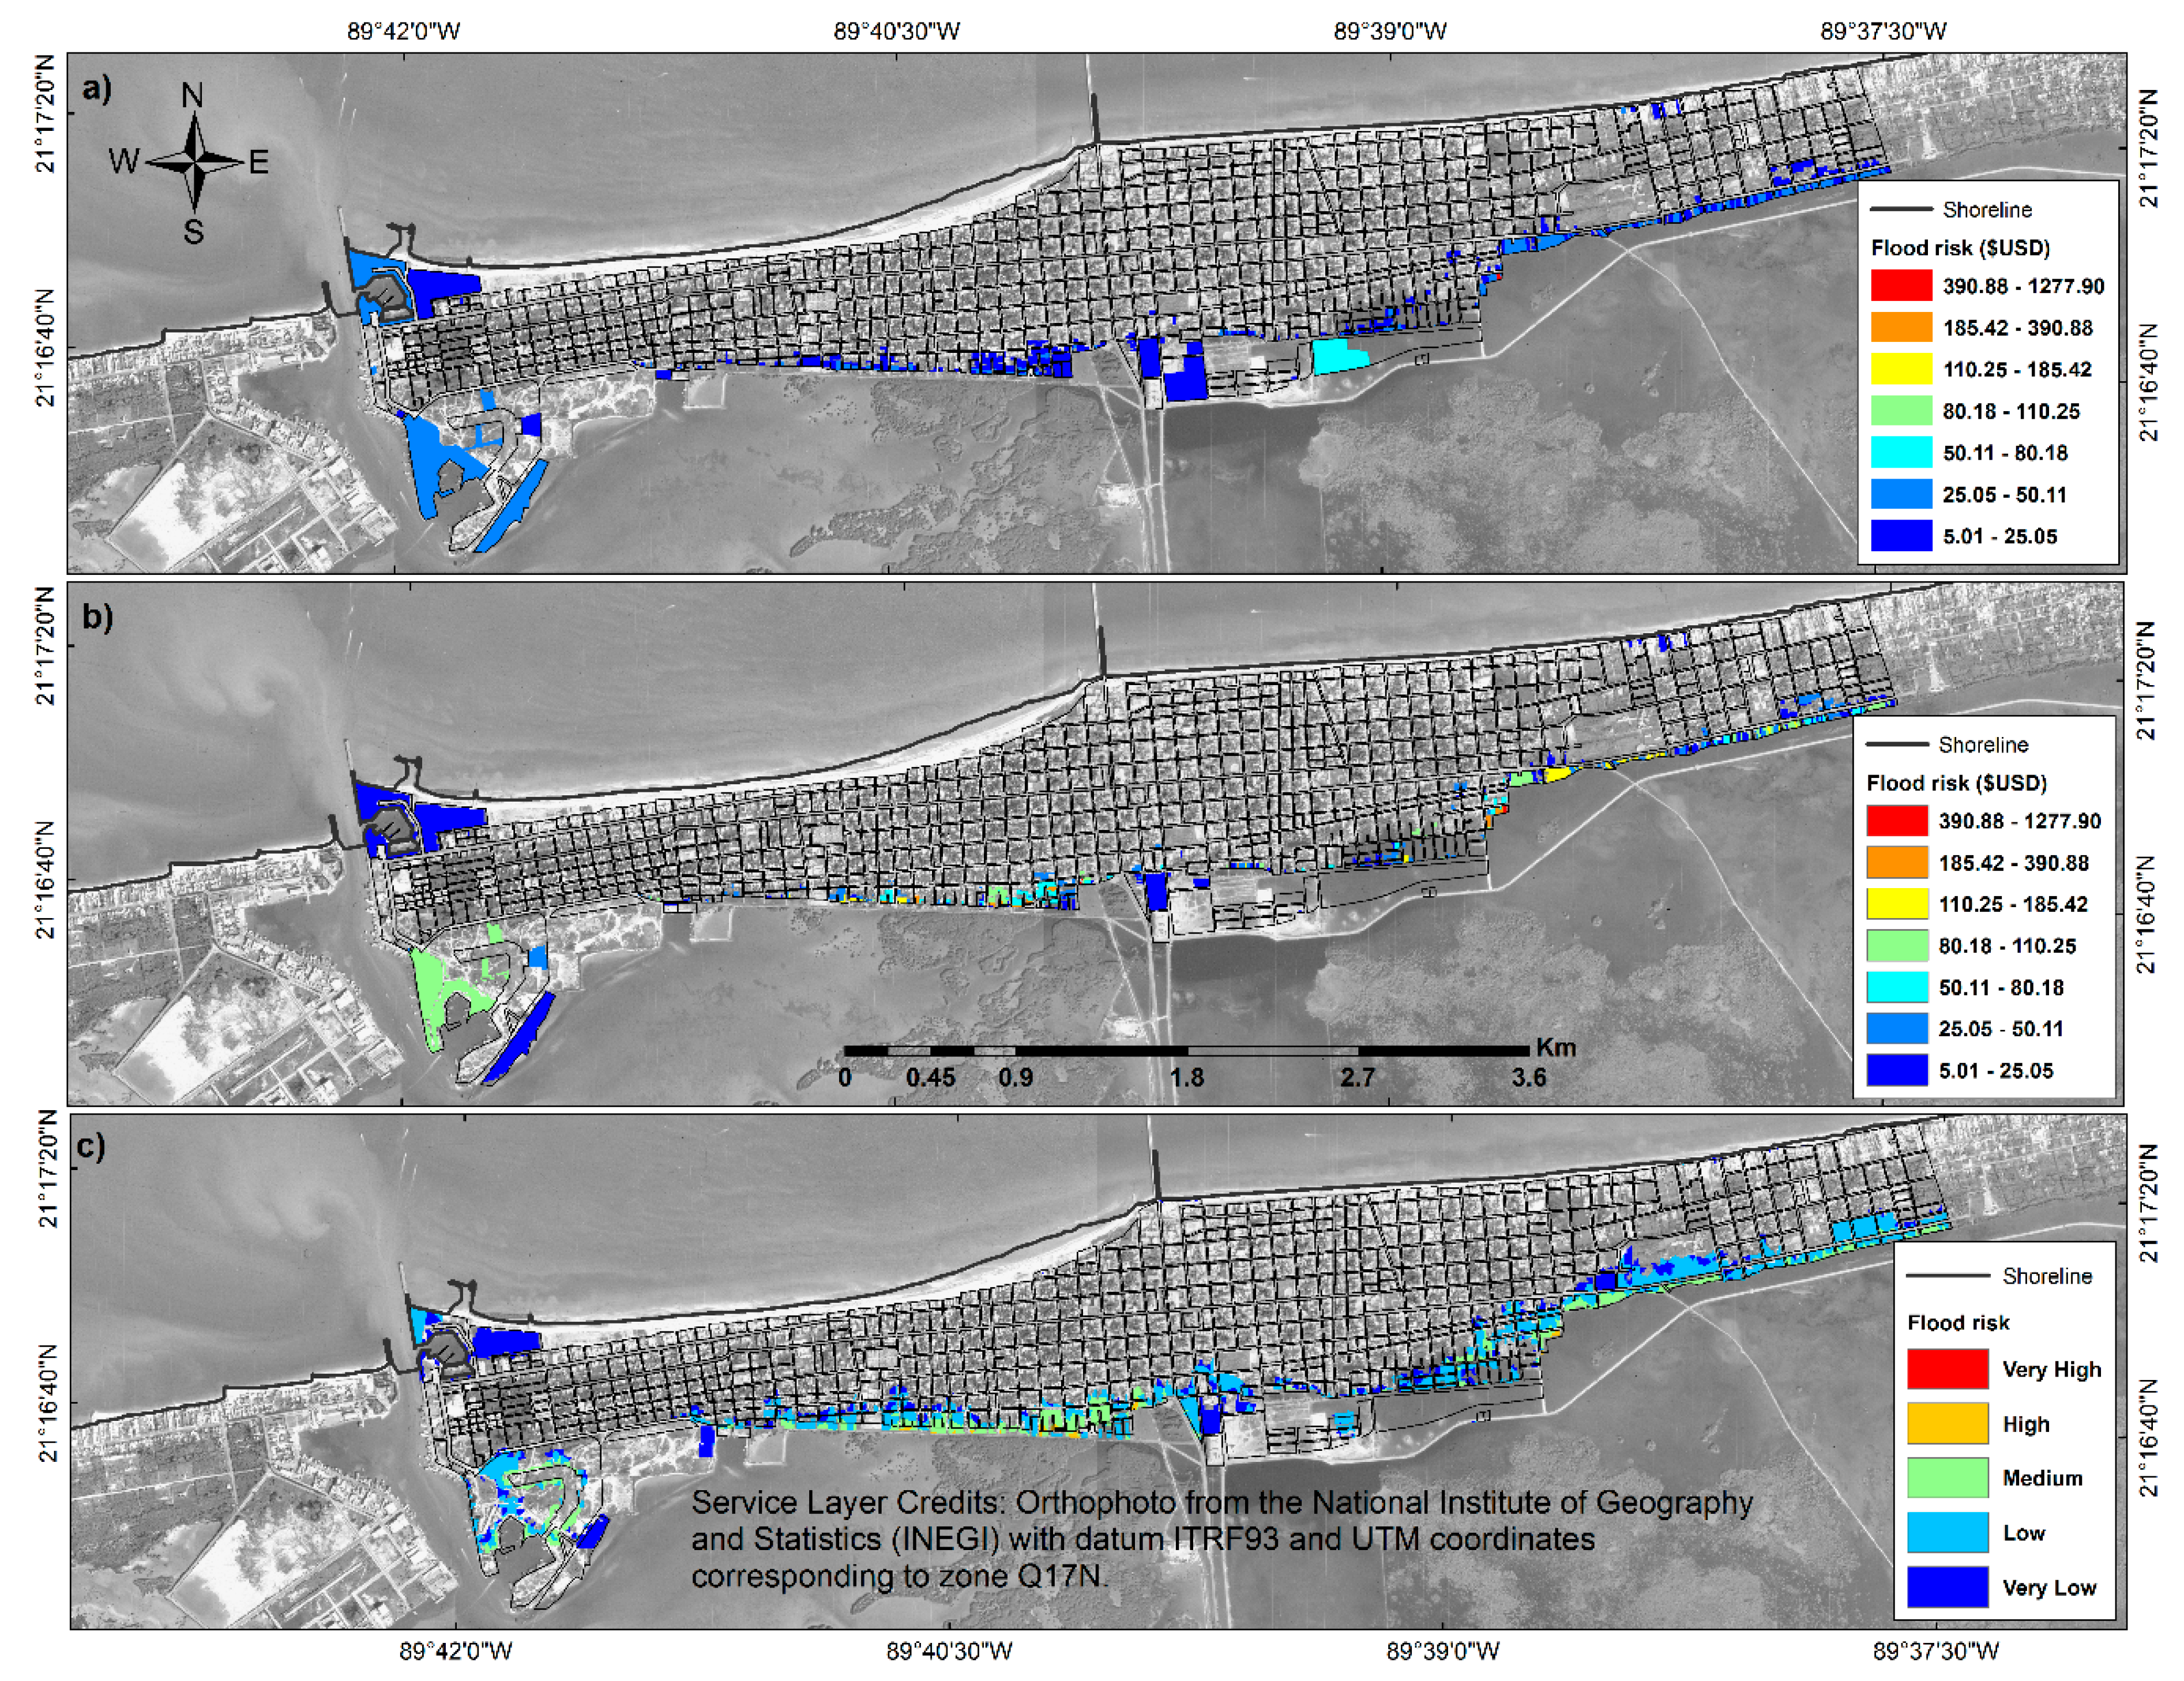
5.2. Flood Risk Assessment of the Norte for Progreso

Figure 5 shows the Norte flood risk for Progreso estimated by using the CENAPRED (top panel), CENAPREDv2 (middle panel), and the FRI methodologies (lower panel). The total flood risk in terms of USD for all individual houses in Progreso when using CENAPRED and CENAPREDv2 was $16,266 USD and $223,779 USD, respectively, as the CENAPRED vulnerability is lower. Regarding the FRI, the flood risk on the coastal side is ‘very low’ and ‘low’, and ranges from ‘very low’ to ‘high’ on the lagoon side.

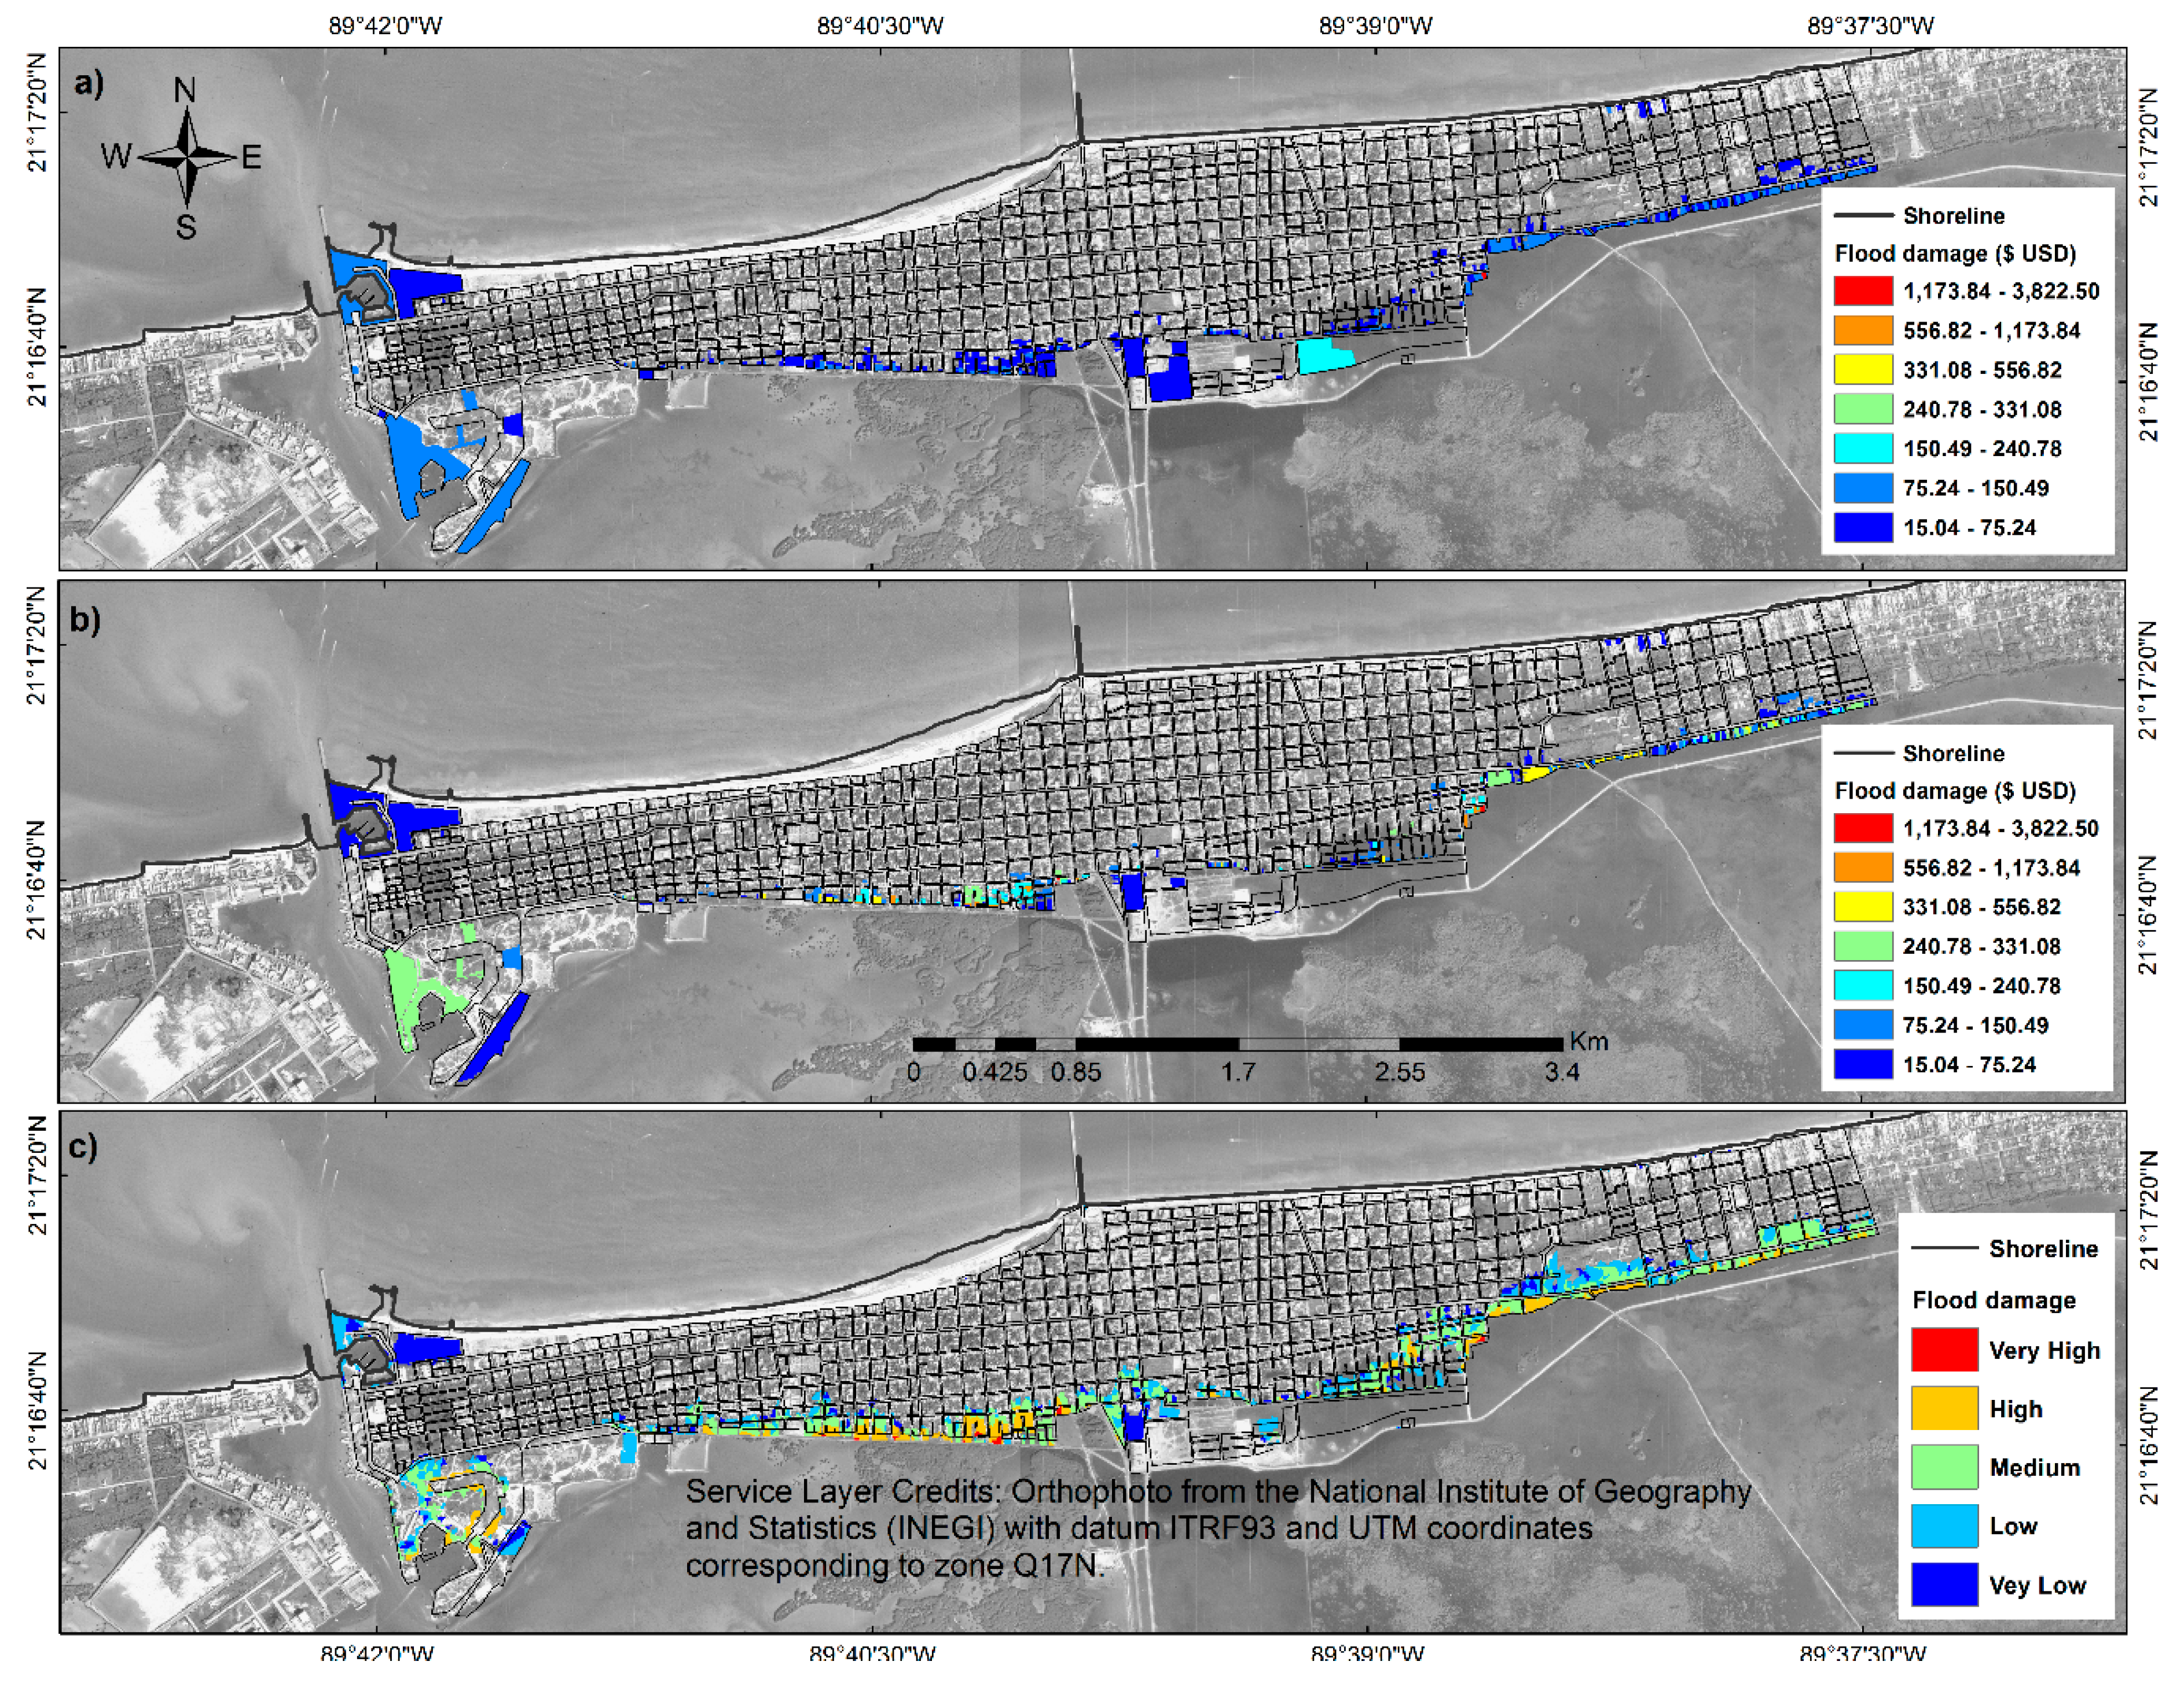
5.3. Flood Damage Assessment of the Norte for Progreso, Yucatan

Figure 6 shows the Norte-induced flood damage in Progreso obtained using the CENAPRED_FD (top panel), CENAPREDv2_FD (middle panel), and FRI_FD (low panel) methodologies. The total economic loss for all individual houses in Progreso when using the CENAPRED_FD and CENAPREDv2_FD methodologies was US $48,848 and $671,918, respectively. The flood damage categories for the FRI_FD on the lagoon side varied spatially from ‘very low’ to ‘very high’, and on the coastal side was ‘very low’ and ‘low’.

6. Discussion

The magnitude of extreme water level events has an inverse relationship with the frequency of its occurrence. In this sense, high-magnitude floods occur less frequently than more moderate events [52]. However, in our study area, the astronomical tides play a crucial role in coastal flooding. Even though the Norte used in this study generated the maximum residual tide in 30 years, the return period associated with the Norte-induced total water level was of only three years, as the highest wind intensity and storm surge associated with the Norte occurred near low tide. If the Norte had occurred during spring high tide, the storm impact would have been more significant [16]. Interaction between residual and astronomical tides, as well as their effect on determining return periods, is discussed in [3].
Regarding the Norte-induced flood affectation in Progreso, the flood hazard associated with this event at Progreso is described in [3]. However, the associated vulnerability and risk was not considered in their study. Therefore, the present study focuses on estimating the associated flood risk and damage for this event to demonstrate its consequences in Progreso, providing tools for flood risk management, which is not possible with the visualization of the flood hazard alone [26]. Reference [3] found that (i) on the coastal side, the flood was not significant because the Norte occurred near low tide, (ii) flooding was significant along the back-barrier because of the substantial contribution of hydrodynamic processes in the Chelem lagoon, mainly wind setup. Therefore, flood affectation was greater for houses located along the lagoon than those found along the coastal side.
Regarding the vulnerability, [56] stated that the vulnerability of coastal communities to flood hazards is usually estimated using socioeconomic indicators. However, for the CENAPRED methodology, vulnerability depends on the water depth and type of housing. Therefore, if the type of housing is more expensive, vulnerability is greater for a given water depth. The vulnerability obtained with the CENAPRED methodology was lower than for the CENAPREDv2 methodology. On the one hand, this is because the vulnerability used in CENAPRED depends on the water depths, which were not large enough for the Norte to generate high vulnerability values. On the other hand, the vulnerability used in CENAPREDv2 is based on socioeconomic indicators and is related to the coping capacity that human communities may have when a flood occurs [60]. Also, the datasets used to create each vulnerability map were different; for instance, the data for producing the vulnerability dataset used in the CENAPREDv2 and FRI methodologies were collected by [53] by means of a demographic census for Mexico, which is carried out every 10 years, whereas the data for the vulnerability dataset used in the CENAPRED methodology were collected in 2016 in this study. Therefore, it is likely that the CENAPREDv2 and FRI methodologies did not include the information from houses built after 2010, which would be included in the vulnerability dataset used by CENAPRED. Thus, the vulnerability map coverage results in larger or smaller areas due to small differences in the datasets. As expected, when the vulnerability is zero, the risk is zero. Therefore, CENAPRED and CENAPREDv2 methodologies are comparable only in areas where the settlements were not modified. However, we assumed that there were no significant changes in terms of population and number of properties since the geographical conditions of the study zone do not permit further urban development due to physical barriers such as the Chelem lagoon to the south, and the sea to the north. Nonetheless, this study can be updated as soon as a new Mexican census data become available. According to definitions found in [61], vulnerability, as defined in the CENAPRED methodology, focuses on variations in exposure to hazards, whereas in the CENAPREDv2 methodology it focuses on variations in people’s capacity to cope with hazards [62] suggests that it is the socio-political process by which people are made vulnerable. In this sense, the CENAPREDv2 and the FRI methodologies offer new approaches for estimating flood risk, taking into account socioeconomic aspects not considered in the CENAPRED methodology. As such, CENAPREDv2 and the FRI methodologies can help to make coastal communities more resilient from a socioeconomic perspective.
CENAPREDv2 has advantages over CENAPRED because it combines vulnerability, focusing on people’s capacity to cope with flood hazards and the values of exposed household goods. In financial terms, larger flood risks were obtained when using CENAPREDv2 than when using CENAPRED. This is in part because of the definition of vulnerability and the dataset used in each case to estimate vulnerability, which is part of the expression used to determine the flood risk. Figure 4 shows that the values for the CENAPRED vulnerability are lower than for the socioeconomic vulnerability throughout the flooded area. In comparison, when using the FRI methodology, the flood risk map shows a larger area to be at risk than for the other two methodologies, mainly because the value of household items was not considered in this method. For instance, when the value of household goods is zero for a given lot, the flood risk is zero for the CENAPRED and CENAPREDv2 methodologies, regardless of the water depth reached at each lot. The settlements located along the back-barrier behind Progreso are at higher risk than those along the beach due to the presence of the Chelem lagoon, where significant hydrodynamic processes are generated when storm events occur. The predominant flood risk categories are ‘low’ and ‘medium’ for the lagoon side and ‘low’ and ‘very low’ for the western part of the coastal side. The FRI methodology does not take into account the values of exposed household goods, mainly because according to recent studies poor settlements, such as Progreso, suffer more from hazards than wealthy settlements [56,57,63,64]. Thus, the more impoverished people are, the more vulnerable they are. When using the value of household goods in the flood risk formulation, the highest values of flood risk are for areas with greater availability of services, infrastructure, and economic resources [65]. The FRI method is based on a socioeconomic vulnerability, and is necessary to identify the location of the people who may have a more limited capacity to anticipate, cope with, resist, and recover from a flood event.
Regarding flood damage, the results show higher economic losses when using CENAPREDv2_FD than when using CENAPRED_FD, which is mainly related to the definition of vulnerability in each case. For the FRI_FD methodology, since P is not included in its formulation, the impact categories are higher than for the FRI methodology. In this sense, for events with large return periods, the flood risk is expected to be ‘very low’, but the flood damage is expected to be large. For instance, the return periods for events such as Hurricane Galveston and Hurricane Katrina are large, but their consequences were very significant, as thousands of lives were lost, and economic losses were estimated in thousands of billions of dollars [66]. Areas with higher vulnerability will be more affected than those with lower vulnerability by a given extreme flood event [22]. Therefore, people living in conditions of greater poverty are exposed to persistent, intersecting, and entrenched structural inequalities, making them particularly vulnerable to harm from the hazards unleashed by climate change [67].
While we do not have control over hazards, it is possible to reduce physical vulnerability through the optimization of flood protection measures that aim at limiting inundation. Although floods cannot be managed per se, we can manage flood risk by means of the measures implemented. For instance, in a city such as Amsterdam, exposure is extremely high (USD 83 billion of assets exposed to the 100-year flood), but the average annual economic losses do not exceed USD 3 million, because estimated defense standards are the highest that exists globally [64]. However, in poor settlements where engineering interventions are not possible or are scarce, nonstructural measures such as flood warning systems, evacuation programs, land use controls on flood-prone sites [68], building regulations to prevent the incursion of floodwaters, and insurance schemes have tended to grow in prominence [69].
Storms across the globe, as well as sea level rise due to climate change and their associated consequences in coastal zones represent a threat to life, assets and ecosystems [14,15]. Therefore, coastal managers and policymakers need to make effective and timely decisions on the use of resources in the immediate and longer-term [17]. More applied research, showing results with high spatial resolution, is needed to provide detailed information to local governments to mitigate the flood risk.

7. Conclusions

This study presents three different methodologies to assess the flood risk (CENAPRED, CENAPREDv2, and FRI) and flood damage (CENAPRED_FD, CENAPREDv2_FD, and FRI_FD) of the Norte that generated the highest residual tide in 30 years (1979–2008) of data for Progreso, Yucatan. The main conclusions from the analysis were as follows:
(a) When using the CENAPRED and CENAPREDv2 methodologies, the flood risk was estimated to be $US 16,266 USD and $US 223,779, respectively. These differences are mainly associated with the definition of vulnerability and, to a lesser extent, to the dataset used to create the vulnerability map in each approach. The FRI shows a higher flood risk for the lagoon side than for the coastal side.
(b) When using the CENAPRED_FD and CENAPREDv2_FD methodologies, the flood damage was of $US 48,848 and $US 671,918, respectively. The FRI_FD method shows considerable flood damage along the lagoon side but negligible damage on the coastal side.
(c) The CENAPRED flood risk methodology may be useful from an economic perspective to assess the flood risk during storm events. However, additional aspects of vulnerability need to be included to obtain an integrated flood risk assessment to improve flood risk management in Mexican coastal areas.
(d) This study highlights that the flood risk in terms of asset values (CENAPRED) is needed when financial analysis is going to be performed. However, when characteristics of the community need to be considered, the flood risk provided by the FRI methodology may be more useful. This information can be used for disaster risk reduction, depending on the goal and interests of the stakeholders. For instance, stakeholders or emergency managers who are mostly interested in economic resources should consider the CENAPRED method, but if they want to focus more on the socioeconomic perspective of coastal communities, they should implement the FRI method, and if they want to consider social aspects as well as financial issues, then CENAPREDv2 should be considered.
(e) Further research should address more aspects of vulnerability to obtain an integrated flood risk assessment for Mexican coasts. This would provide better tools for emergency managers to implement initiatives to make the coast more resilient.

Author Contributions

Conceptualization, W.R., M.M.-A., P.S., E.T.M., and M.A.T.-R.; Data curation, W.R. and P.R.-S.; Formal analysis, W.R., M.M.-A., and M.A.T.-R.; Funding acquisition, P.S. and J.Q.-I.; Investigation, W.R., M.M.-A., P.S., and E.T.M.; Methodology, W.R., M.M.-A., P.S., E.T.M., and M.A.T.-R.; Project administration, W.R., P.S., and E.T.M.; Resources, P.S. and J.Q.-I.; Software, M.M.-A., M.A.T.-R., and P.R.-S.; Supervision, W.R., P.S., and E.T.M.; Validation, W.R.; Visualization, W.R., M.A.T.-R., and P.R.-S.; Writing—original draft, W.R., M.M.-A., and M.A.T.-R.; Writing—review and editing, W.R., P.S., E.T.M., G.L.F., and C.M.A. All authors have read and agreed to the published version of the manuscript.

Funding

W.R. was funded by the Mexican National Council for Science and Technology (CONACYT), the Council of the National Research Training (COLCIENCIAS) and DIMAR with projects 236-SUBAFIN-2018, 110-SUBAFIN-2019. This research was supported by the UNAM-DGAPA project IN111916, CONACYT National Coastal Resilience Laboratory projects 271544 and 299063, CONACYT project INFR-2014-01-225561, as well as project 5341 from the Engineering Institute at UNAM. C.M.A acknowledges the support of project PAPIIT IA100418 from UNAM-DGAPA. G.L.F was funded by Project 1146: “Observatorio Costero para estudios de resiliencia al cambio climático” Cátedras CONACYT.

Acknowledgments

W.R. thanks DHI Water and Environment for facilitating a student license of MIKE 21 hydrodynamic and wave spectral models, Gonzalo U. Martín-Ruiz, Juan Alberto Gómez-Liera, and José López-González for their help with computer resources and technical support, and Cecilia Enriquez-Ortiz for providing the bathymetric data of the Chelem lagoon. This manuscript benefited from the comments and suggestions of Alec Torres-Freyermuth. Finally, all the authors gratefully acknowledge the support of NVIDIA Corporation for the donation of the Tesla K40 GPU used for this research.

Conflicts of Interest

The authors declare no conflict of interest. The funders had no role in the design of the study; in the collection, analyses, or interpretation of data; in the writing of the manuscript, or in the decision to publish the results.

References

  1. Rey, W.; Mendoza, E.T.; Salles, P.; Zhang, K.; Teng, Y.-C.; Trejo-Rangel, M.A.; Franklin, G.L. Hurricane flood risk assessment for the Yucatan and Campeche State coastal area. Nat. Hazards 2019, 96, 1041–1065. [Google Scholar] [CrossRef]
  2. Appendini, C.M.; Hernández-Lasheras, J.; Meza-Padilla, R.; Kurczyn, J.A. Effect of climate change on wind waves generated by anticyclonic cold front intrusions in the Gulf of Mexico. Clim. Dyn. 2018, 51, 3747–3763. [Google Scholar] [CrossRef]
  3. Rey, W.; Salles, P.; Mendoza, E.T.; Torres-Freyermuth, A.; Appendini, C.M. Assessment of coastal flooding and associated hydrodynamic processes on the Southeast coast of Mexico, during Central American Cold Surge events. Nat. Hazards Earth Syst. Sci. 2018, 18, 1681–1701. [Google Scholar] [CrossRef] [Green Version]
  4. Reding, P.J. The Central American Cold Surge: An Observational Analysis of the Deep Southward Penetration of North American Cold Fronts. M.S. Thesis, Department of Meteorology, Texas A&M University, College Station, TX, USA, 1992; p. 177. [Google Scholar]
  5. Schultz, D.M.; Bracken, W.E.; Bosart, L.F.; Hakim, G.J.; Bedrick, M.A.; Dickinson, M.J.; Tyle, K.R. The 1993 Superstorm Cold Surge: Frontal Structure, Gap Flow, and Tropical Impact. Mon. Weather Rev. 1997, 125, 5–39. [Google Scholar] [CrossRef] [Green Version]
  6. Schultz, D.; Bracken, W.; Bosart, L. Planetary and synoptic scale signatures associated with Central American cold surges. Mon. Weather Rev. 1998, 126, 5–27. [Google Scholar] [CrossRef]
  7. López-Méndez, J.V. Análisis del Evento Meteorológico del 2007 relacionado con la Inundación de Tabasco. M.S. Thesis, Centro de Ciencias de la Atmosfera, Ciudad Universitaria, National Autonomous University of Mexico, Mexico city, Mexico, 2009; p. 117. Available online: http://bibliotecas.unam.mx (accessed on 17 February 2020).
  8. Rosengaus-Moshinsky, M.; Jiménez-Espinosa, M.; Vázquez-Conde, M.T. Atlas Climatológico de Ciclones Tropicales en México; Centro Nacional de Prevención de Desastres, Instituto Mexicano de Tecnología del Agua: Ciudad de México, México, 2002; p. 108. ISBN 9706286330. [Google Scholar]
  9. Appendini, C.M.; Meza-padilla, R.; Abud-russell, S.; Proust, S.; Barrios, R.E.; Secaira-Fajardo, F. Effect of climate change over landfalling hurricanes at the Yucatan Peninsula. Clim. Chang. 2019, 157, 469–482. [Google Scholar] [CrossRef]
  10. Kopp, R.E.; Deconto, R.M.; Bader, D.A.; Hay, C.C.; Radley, M.; Kulp, S.; Oppenheimer, M.; Pollard, D.; Strauss, B.H. Earth’s Future Evolving Understanding of Antarctic Ice-Sheet Physics and Ambiguity in Probabilistic Sea-Level Projections. Earths Futur. 2017, 5, 1217–1233. [Google Scholar] [CrossRef] [Green Version]
  11. Bakker, A.M.R.; Wong, T.E.; Ruckert, K.L.; Keller, K. Sea-level projections representing the deeply uncertain contribution of the West Antarctic ice sheet. Sci. Rep. 2017, 7, 1–7. [Google Scholar] [CrossRef] [Green Version]
  12. Wong, T.E.; Bakker, A.M.R.; Keller, K. Impacts of Antarctic fast dynamics on sea-level projections and coastal flood defense. Clim. Chang. 2017, 144, 347–364. [Google Scholar] [CrossRef]
  13. Le Bars, D.; Drijfhout, S.; De Vries, H. A high-end sea level rise probabilistic projection including rapid Antarctic ice sheet mass loss. Environ. Res. Lett. 2017, 12, 044013. [Google Scholar] [CrossRef]
  14. Holleman, R.C.; Stacey, M.T. Coupling of Sea Level Rise, Tidal Amplification, and Inundation. J. Phys. Oceanogr. 2014, 44, 1439–1455. [Google Scholar] [CrossRef]
  15. Paprotny, D.; Terefenko, P. New estimates of potential impacts of sea level rise and coastal floods in Poland. Nat. Hazards 2017, 85, 1249–1277. [Google Scholar] [CrossRef] [Green Version]
  16. Rey, W.; Salles, P.; Torres-freyermuth, A.; Ruiz-Salcines, P.; Teng, Y.; Appendini, C.M. Spatiotemporal Storm Impact on the Northern Yucatan Coast during Hurricanes and Central American Cold Surge Events. J. Mar. Sci. Eng. 2020, 8, 1–15. [Google Scholar] [CrossRef] [Green Version]
  17. Brown, J.M.; Ciavola, P.; Masselink, G.; McCall, R.; Plater, A.J. Preface: Monitoring and modelling to guide coastal adaptation to extreme storm events in a changing climate. Nat. Hazards Earth Syst. Sci. 2016, 16, 463–467. [Google Scholar] [CrossRef] [Green Version]
  18. Salman, A.M.; Li, Y. Flood Risk Assessment, Future Trend Modeling, and Risk Communication: A Review of Ongoing Research. Nat. Hazards Rev. 2018, 19, 04018011. [Google Scholar] [CrossRef]
  19. Gallopín, G.C. Linkages between vulnerability, resilience, and adaptive capacity. Glob. Environ. Chang. 2006, 16, 293–303. [Google Scholar] [CrossRef]
  20. Cutter, S.L.; Barnes, L.; Berry, M.; Burton, C.; Evans, E.; Tate, E.; Webb, J. A place-based model for understanding community resilience to natural disasters. Glob. Environ. Chang. 2008, 18, 598–606. [Google Scholar] [CrossRef]
  21. Kuspilić, N.; Gilja, G.; Ocvirk, E. Calculation of Flood Event Exceedance Probability and Related Flood Risk. In Proceedings of the 6th Croatian Water Conference with International Participation, Opatija, Croatia, 20–23 May 2015; Croatian Waters on the Investment Wave: Opatija, Croatia, 2015; pp. 1–9. [Google Scholar]
  22. Merz, B.; Thieken, A.H.; Gocht, M. Flood Risk Mapping At the Local Scale: Concepts and Challenges. In Advances in Natural and Technological Hazards Research; Begum, S., Stive, M.J.F., Hall, J., Eds.; Springer: Dordrecht, The Netherlands, 2007; pp. 231–251. ISBN 978-1-4020-4200-3. [Google Scholar]
  23. Genovese, E. A Methodological Approach to Land Use-Based Flood Damage Assessment in Urban Areas: Prague Case Study; Technical EUR Reports; EUR: Luxembourg, Luxembourg, 2006. [Google Scholar]
  24. Panagoulia, D.; Dimou, G. Sensitivity of flood events to global climate change. J. Hydrol. 1997, 191, 208–222. [Google Scholar] [CrossRef]
  25. Panagoulia, D.; Mamassis, N.; Gkiokas, A. Deciphering the floodplain inundation maps in Greece. In Proceedings of the 8th International Conference Water Resources Management in an Interdisciplinary and Changing Context, Porto, Portugal, 26–29 June 2013; European Water Resources Association: Porto, Portugal, 2013; pp. 323–330. [Google Scholar]
  26. Dinh, Q.; Balica, S.; Popescu, I.; Jonoski, A. Climate change impact on flood hazard, vulnerability and risk of the Long Xuyen Quadrangle in the Mekong Delta Climate change impact on flood hazard, vulnerability and risk of the Long Xuyen. Int. J. River Basin Manag. 2012, 10, 103–120. [Google Scholar] [CrossRef]
  27. Ward, P.J.; De Moel, H.; Aerts, J.C.J.H. How are flood risk estimates affected by the choice of return-periods? Nat. Hazards Earth Syst. Sci. 2011, 11, 3181–3195. [Google Scholar] [CrossRef] [Green Version]
  28. Penning-Rowsell, E.; Fordham, M.; Correia, F.; Gardiner, J.; Green, C.; Hubert, G.; Ketteridge, A.-M.; Klaus, J.; Parker, D.; Peerbolte, B.; et al. Flood hazard assessment, modelling and management: Results from the EUROflood project. In Floods Across Europe: Flood Hazard Assessment, Modelling and Management; Penning-Rowsell, E., Fordham, M., Eds.; University Press: London, UK, 1994; pp. 37–72. [Google Scholar]
  29. Wind, H.G.; Nierop, T.M.; De Blois, C.J.; De Kok, J.L. Analysis of flood damages from the 1993 and 1995 Meuse floods. Water Resour. Res. 1999, 35, 3459–3465. [Google Scholar] [CrossRef]
  30. Tingsanchali, T.; Karim, M.F. Flood hazard and risk analysis in the southwest region of Bangladesh. Hydrol. Process. 2005, 19, 2055–2069. [Google Scholar] [CrossRef]
  31. Leandro, J.; Schumann, A.; Pfister, A. A step towards considering the spatial heterogeneity of urban key features in urban hydrology flood modelling. J. Hydrol. 2016, 535, 356–365. [Google Scholar] [CrossRef]
  32. Seenath, A.; Wilson, M.; Miller, K. Hydrodynamic versus GIS modelling for coastal flood vulnerability assessment: Which is better for guiding coastal management? Ocean Coast. Manag. 2016, 120, 99–109. [Google Scholar] [CrossRef]
  33. UNDRR Terminology on Disaster Risk Reduction. Available online: https://www.unisdr.org/we/inform/terminology (accessed on 9 July 2019).
  34. Balica, S.F.; Wright, N.G.; van der Meulen, F. A flood Vulnerability Index for Coastal Cities and Its Use in Assessing Climate Change Impacts. Nat. Hazards 2012, 64, 73–105. [Google Scholar] [CrossRef] [Green Version]
  35. Mebarki, A.; Valencia, N.; Salagnac, J.L.; Barroca, B. Flood hazards and masonry constructions: A probabilistic framework for damage, risk and resilience at urban scale. Nat. Hazards Earth Syst. Sci. 2012, 12, 1799–1809. [Google Scholar] [CrossRef]
  36. CENAPRED. Guía Básica Para la Elaboración de Atlas Estatales y Municipales de Peligros y Riesgos: Fenómenos Hidrometeorológicos; CENAPRED: Mexico city, Mexico, 2006; ISBN 970-628-905-4. [Google Scholar]
  37. Perry, E.; Swift, J.; Gamboa, J.; Reeve, A.; Sanborn, R.; Marin, L.; Villasuso, M. Geologic and environmental aspects of surface cementation, north coast, Yucatan, Mexico. Geology 1989, 17, 818–821. [Google Scholar] [CrossRef]
  38. Chen, J.; Chen, J.; Liao, A.; Cao, X.; Chen, L.; Chen, X.; He, C.; Han, G.; Peng, S.; Lu, M.; et al. Global land cover mapping at 30 m resolution: A POK-based operational approach. ISPRS J. Photogramm. Remote Sens. 2015, 103, 7–27. [Google Scholar] [CrossRef] [Green Version]
  39. Figueroa-Espinoza, B.; Salles, P.; Zavala-Hidalgo, J. On the wind power potential in the northwest of the Yucatan Peninsula in Mexico. Atmósfera 2014, 27, 77–89. [Google Scholar] [CrossRef] [Green Version]
  40. Cuevas-Jiménez, A.; Euán-Ávila, J. Morphodynamics of carbonate beaches in the Yucatán Peninsula. Ciencias Mar. 2009, 35, 307–319. [Google Scholar] [CrossRef] [Green Version]
  41. Enriquez, C.; Mariño-Tapia, I.J.; Herrera-Silveira, J.A. Dispersion in the Yucatan coastal zone: Implications for red tide events. Cont. Shelf Res. 2010, 30, 127–137. [Google Scholar] [CrossRef]
  42. Appendini, C.M.; Torres-Freyermuth, A.; Oropeza, F.; Salles, P.; López, J.; Mendoza, E.T. Wave modeling performance in the Gulf of Mexico and Western Caribbean: Wind reanalyses assessment. Appl. Ocean Res. 2013, 39, 20–30. [Google Scholar] [CrossRef]
  43. Medellín, G.; Brinkkemper, J.A.; Torres-Freyermuth, A.; Appendini, C.M.; Mendoza, E.T.; Salles, P. Run-up parameterization and beach vulnerability assessment on a barrier island: A downscaling approach. Nat. Hazards Earth Syst. Sci. 2016, 16, 167–180. [Google Scholar] [CrossRef] [Green Version]
  44. Andersen, O.B. Global ocean tides from ERS 1 and TOPEX/POSEIDON altimetry. J. Geophys. Res. 1995, 100, 25249–25259. [Google Scholar] [CrossRef]
  45. Abascal, J.; Sheinbaum, J.; Candela, J.; Ochoa, J.; Badan, A. Analysis of flow variability in the Yucatan Channel. J. Geophys. Res. 2003, 108, 1–18. [Google Scholar] [CrossRef]
  46. Saha, S.; Moorthi, S.; Pan, H.L.; Wu, X.; Wang, J.; Nadiga, S.; Tripp, P.; Kistler, R.; Woollen, J.; Behringer, D.; et al. The NCEP climate forecast system reanalysis. Bull. Am. Meteorol. Soc. 2010, 91, 1015–1057. [Google Scholar] [CrossRef]
  47. Ho, F.P.; Tracey, R.J.; Myers, V.A.; Foat, N.S. Storm Tide Frequency Analysis for the Open Coast of Virginia, Maryland, and Delaware; NOAA Technical Memorandum NWS HYDRO-32, Department of Commerce: Silver Spring, MD, USA, 1976. [Google Scholar]
  48. Jenkinson, A.F. Estimation of Maximum Floods. In Report of a Working Group of the Commission for Hydrometeorology; World Meteorological Organization: Geneve, Switzerland, 1969; p. 208. [Google Scholar]
  49. Chini, N.; Stansby, P.K. Extreme values of coastal wave overtopping accounting for climate change and sea level rise. Coast. Eng. 2012, 65, 27–37. [Google Scholar] [CrossRef]
  50. Lin, N.; Emanuel, K.; Oppenheimer, M.; Vanmarcke, E. Physically based assessment of hurricane surge threat under climate change. Nat. Clim. Chang. 2012, 2, 462–467. [Google Scholar] [CrossRef] [Green Version]
  51. Merz, B.; Hall, J.; Disse, M.; Schumann, A. Fluvial flood risk management in a changing world. Nat. Hazards Earth Syst. Sci. 2010, 509–527. [Google Scholar] [CrossRef] [Green Version]
  52. Balica, S.F.; Popescu, I.; Beevers, L.; Wright, N.G. Parametric and physically based modelling techniques for flood risk and vulnerability assessment: A comparison. Environ. Model. Softw. 2013, 41, 84–92. [Google Scholar] [CrossRef]
  53. INEGI Censo de Población y Vivienda. 2010. Available online: http://www.beta.inegi.org.mx/proyectos/ccpv/2010/ (accessed on 25 May 2017).
  54. INEGI Mexico Consumer Price Index. Available online: http://www.beta.inegi.org.mx/app/indicesdeprecios/CalculadoraInflacion.aspx (accessed on 13 November 2018).
  55. UNISDR. UNISDR-Terminology on Disaster Risk Reduction; UNISDR: Geneva, Switzerland, 2009; p. 30. [Google Scholar]
  56. Hernández, M.L.; Carreño, M.L.; Castillo, L. Methodologies and tools of risk management: Hurricane risk index (HRi). Int. J. Disaster Risk Reduct. 2018, 31, 926–937. [Google Scholar] [CrossRef]
  57. Pelling, M. What determines vulnerability to floods; a case study in Georgetown, Guyana. Environ. Urban. 1997, 9, 203–226. [Google Scholar] [CrossRef]
  58. Cutter, S.L.; Boruff, B.J.; Shirley, W.L. Social vulnerability to environmental hazards. Soc. Sci. Q. 2003, 84, 242–261. [Google Scholar] [CrossRef]
  59. Jenks, G.F. Generalization in statistical mapping. Ann. Assoc. Am. Geogr. 1963, 53, 15–26. [Google Scholar] [CrossRef]
  60. Wisner, B.; Blaikie, P.; Cannon, T.; Davis, I. At Risk: Natural Hazards, People’s Vulnerability and Disasters Second Edition; Routledge: London, UK; New York, NY, USA, 2004; Volume 2, ISBN 0-415-25216-4. [Google Scholar]
  61. Few, R. Flooding, vulnerability and coping strategies: Local responses to a global threat. Prog. Dev. Stud. 2003, 3, 43–58. [Google Scholar] [CrossRef]
  62. Pelling, M. The political ecology of flood hazard in urban Guyana. Geoforum 1999, 30, 249–261. [Google Scholar] [CrossRef]
  63. IPCC. Climate Change 2001: The Scientific Basis; Cambridge University Press: Cambridge, UK, 2001. [Google Scholar]
  64. Hallegatte, S.; Green, C.; Nicholls, R.J.; Corfee-Morlot, J. Future flood losses in major coastal cities. Nat. Clim. Chang. 2013, 3, 802–806. [Google Scholar] [CrossRef]
  65. Dréze, J.; Sen, A. Action for Social Security: Foundations and Strategy. In Public Action for Social Security in Developing Countries; Ahmed, E., Dréze, J., Hills, J., Sen, A., Eds.; Clarendon: Oxford, UK, 1991; pp. 1–49. ISBN 9780199682676. [Google Scholar]
  66. Lin, N.; Emanuel, K.A.; Smith, J.A.; Vanmarcke, E. Risk assessment of hurricane storm surge for New York City. J. Geophys. Res. 2010, 115, D18. [Google Scholar] [CrossRef] [Green Version]
  67. IPCC. Synthesis Report. Contribution of Working Groups I, II and III to the Fifth Assessment Report of the Intergovernmental Panel on Climate Change; IPCC: Geneva, Switzerland, 2014. [Google Scholar]
  68. Patro, S.; Chatterjee, C.; Mohanty, S.; Singh, R.; Raghuwanshi, N.S. Flood inundation modeling using MIKE FLOOD and remote sensing data. J. Indian Soc. Remote Sens. 2009, 37, 107–118. [Google Scholar] [CrossRef]
  69. Smith, K. Environmental Hazards: Assessing Risk and Reducing Disaster; Routledge: London, UK, 1996. [Google Scholar]
Figure 1. Study area location in (a) Mexico, and in the (b) Yucatan state, (c) Progreso and Chelem lagoon.
Jmse 08 00137 g001
Figure 2. Flood map of the Norte event for Progreso, Yucatan.
Jmse 08 00137 g002
Figure 3. Vulnerability for type I housing. Adapted from [36].
Jmse 08 00137 g003
Figure 4. Flood vulnerability maps. (a) CENAPRED vulnerability and (b) socioeconomic vulnerability for Progreso, Yucatan. The categories in (a,b) are similar and correspond to the values defined for vulnerability in Table 2.
Jmse 08 00137 g004
Figure 5. Flood risk of the Norte for Progreso, Yucatan, using (a) CENAPRED, (b) CENAPREDv2, and (c) FRI methodologies. The categories in FRI are also used in FDI_FD (see Table 2 and Figure 6) for comparison.
Jmse 08 00137 g005
Figure 6. Flood damage for Progreso, Yucatan, using (a) CENAPRED_FD, (b) CENAPREDv2_FD, and (c) FRI_FD methodologies.
Jmse 08 00137 g006
Table 1. Characteristics of each type of housing and the value assigned to its associated household goods
Type of HousingDescriptionAssigned Value ($USD)
IMost humble type of home, consisting of a single multifunctional room with the minimum indispensable household goods.$1041.00.
IIThe second type corresponds to low class homes which can be described as self-built homes or houses constructed with materials from the surrounding area, often without structural elements. With regards to household goods, it is assumed that the different rooms have their own furniture and are more or less defined.$4163.00
IIICan also be classified as low class, similar to type II, but with more resistant roofs, most often built without structural elements. Household goods correspond to those which are necessary for the different rooms, as in the previous level; however, they are considered of higher quality and therefore a higher cost.$12,530.00
IVThe typical middle class house, i.e., it can be compared to a house of social interest, most often built with structural elements. The household goods selected correspond to those of a typical house belonging to a family of professionals who work and live with no economic complications$24,978.00
VResidency built with finishes and decorative elements that substantially increase its value. The household goods consist of high quality items with many elements of comfort.$37,467.00
Table 2. Flood risk categories
Water Depth (m)HazardVulnerability P FRI FRI_FDHazard/Vulnera Bility/FRI/FRI_FD Zones
>20.4–10.61–10.330.081–0.3330.244–1Very high
1–20.2–0.40.37–0.60.330.025–0.0800.074–0.240High
0.5–10.1–0.20.21–0.360.330.007–0.0240.021–0.072Medium
0.2–0.50.04–0.10.075–0.20.330.003–0.0070.003–0.020Low
0–0.20–0.040–0.070.330–0.0010–0.003Very low

