Estimation of the Motion Performance of a Light Buoy Adopting Ecofriendly and Lightweight Materials in Waves


Abstract
:1. Introduction
2. Problem Formulation
2.1. Governing Equation
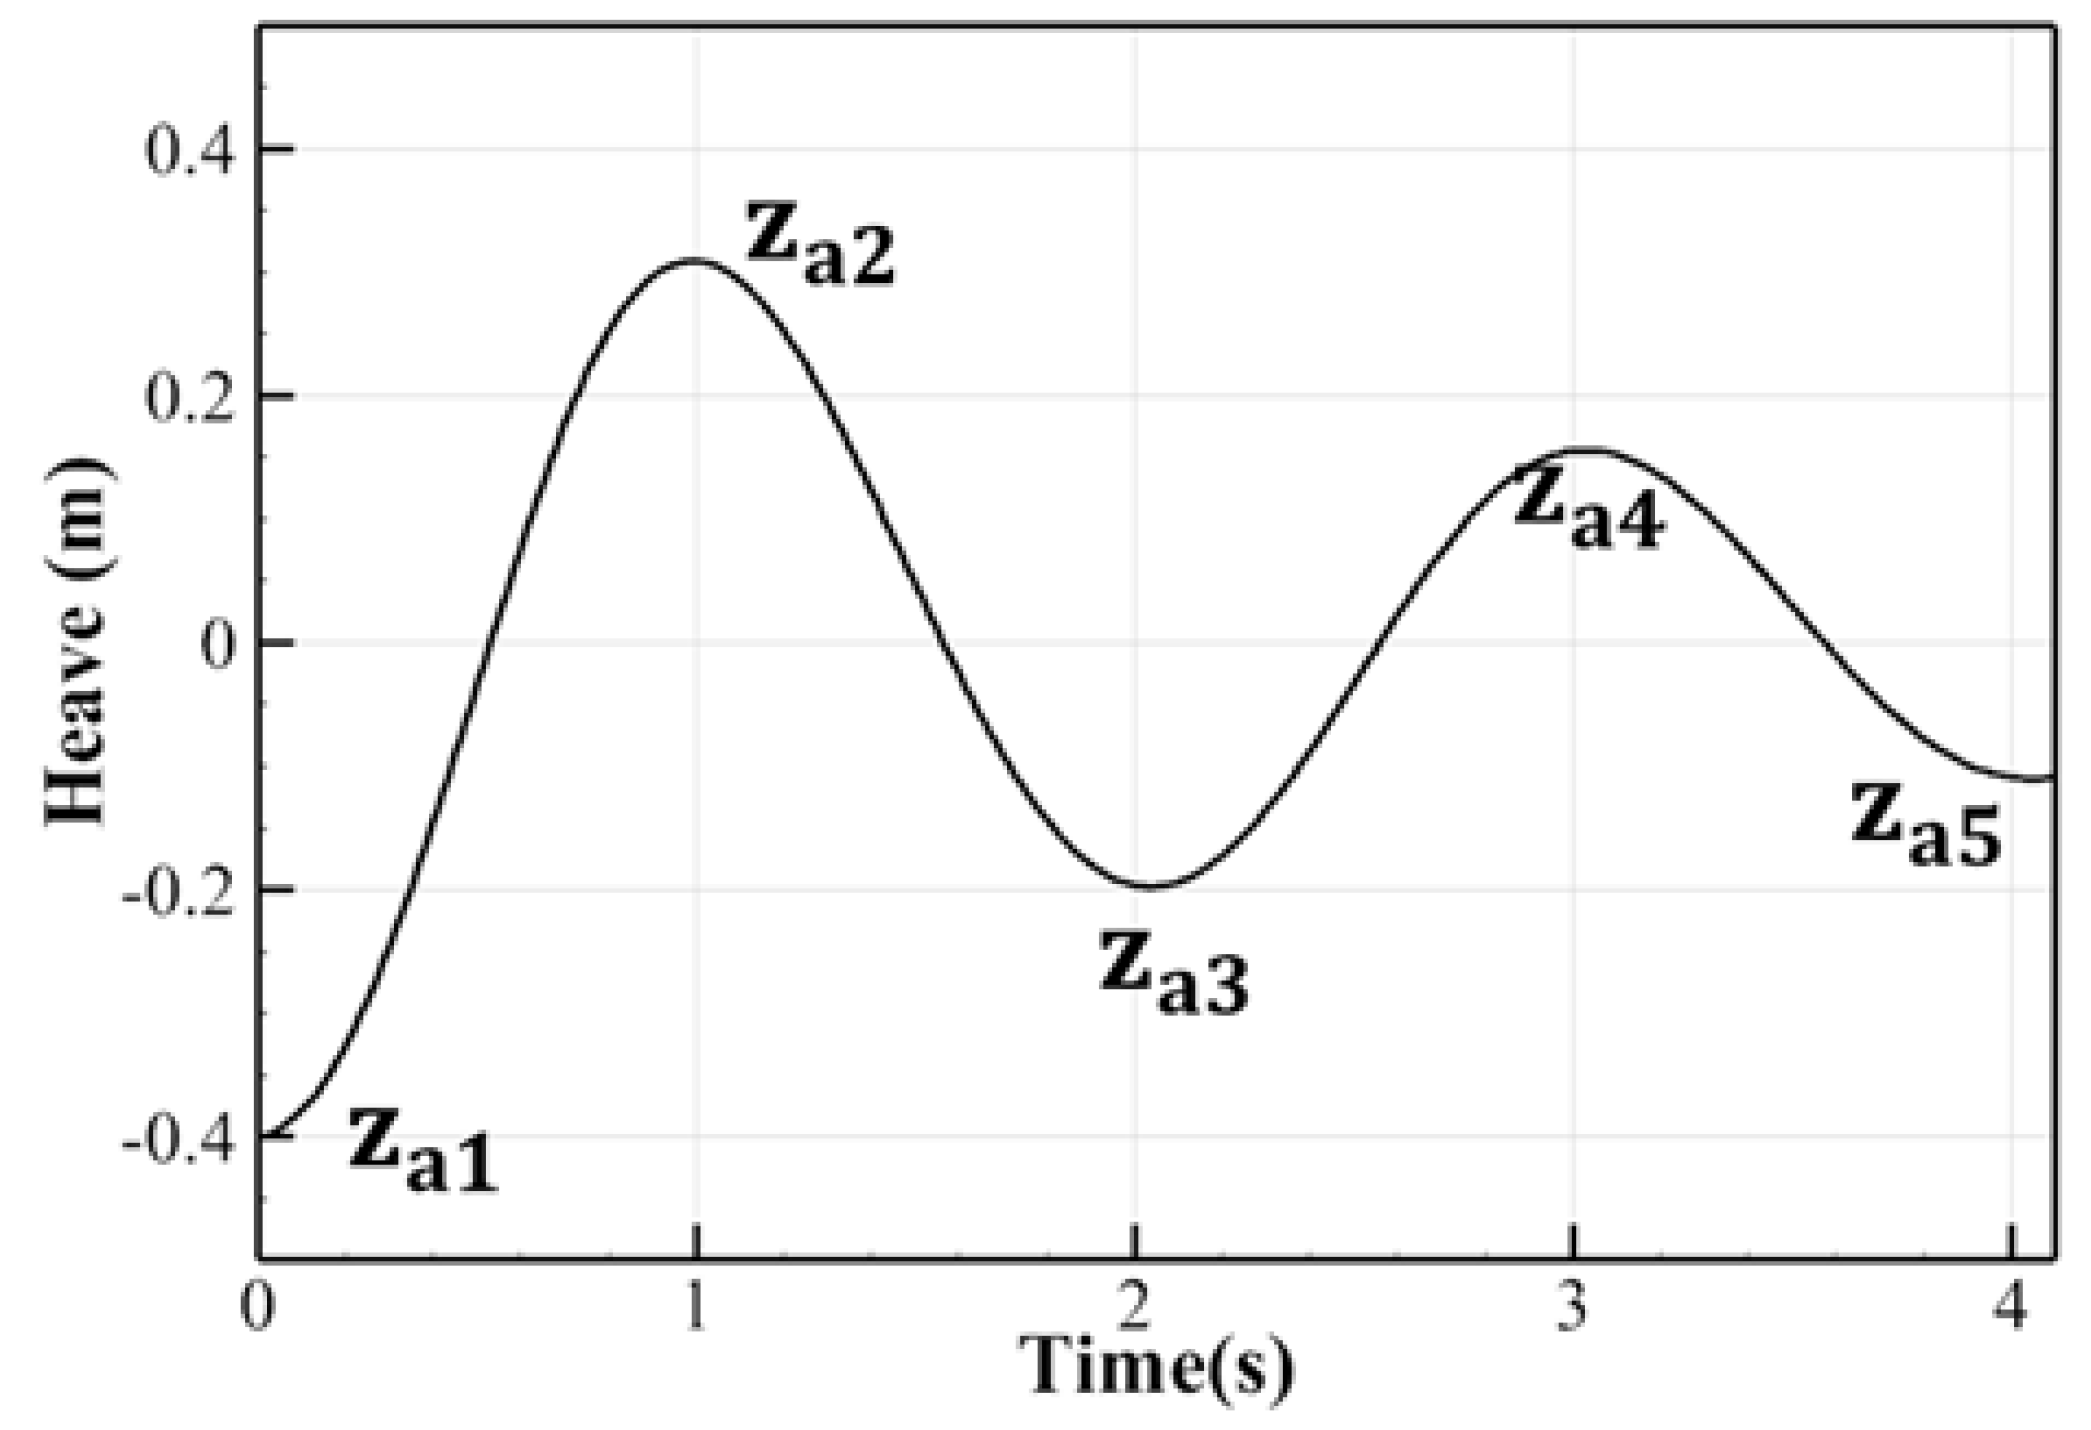
2.2. Estimation Procedure of Viscous Damping Coefficients from a Free Decay Test
3. Numerical Simulations
3.1. Simulation Method
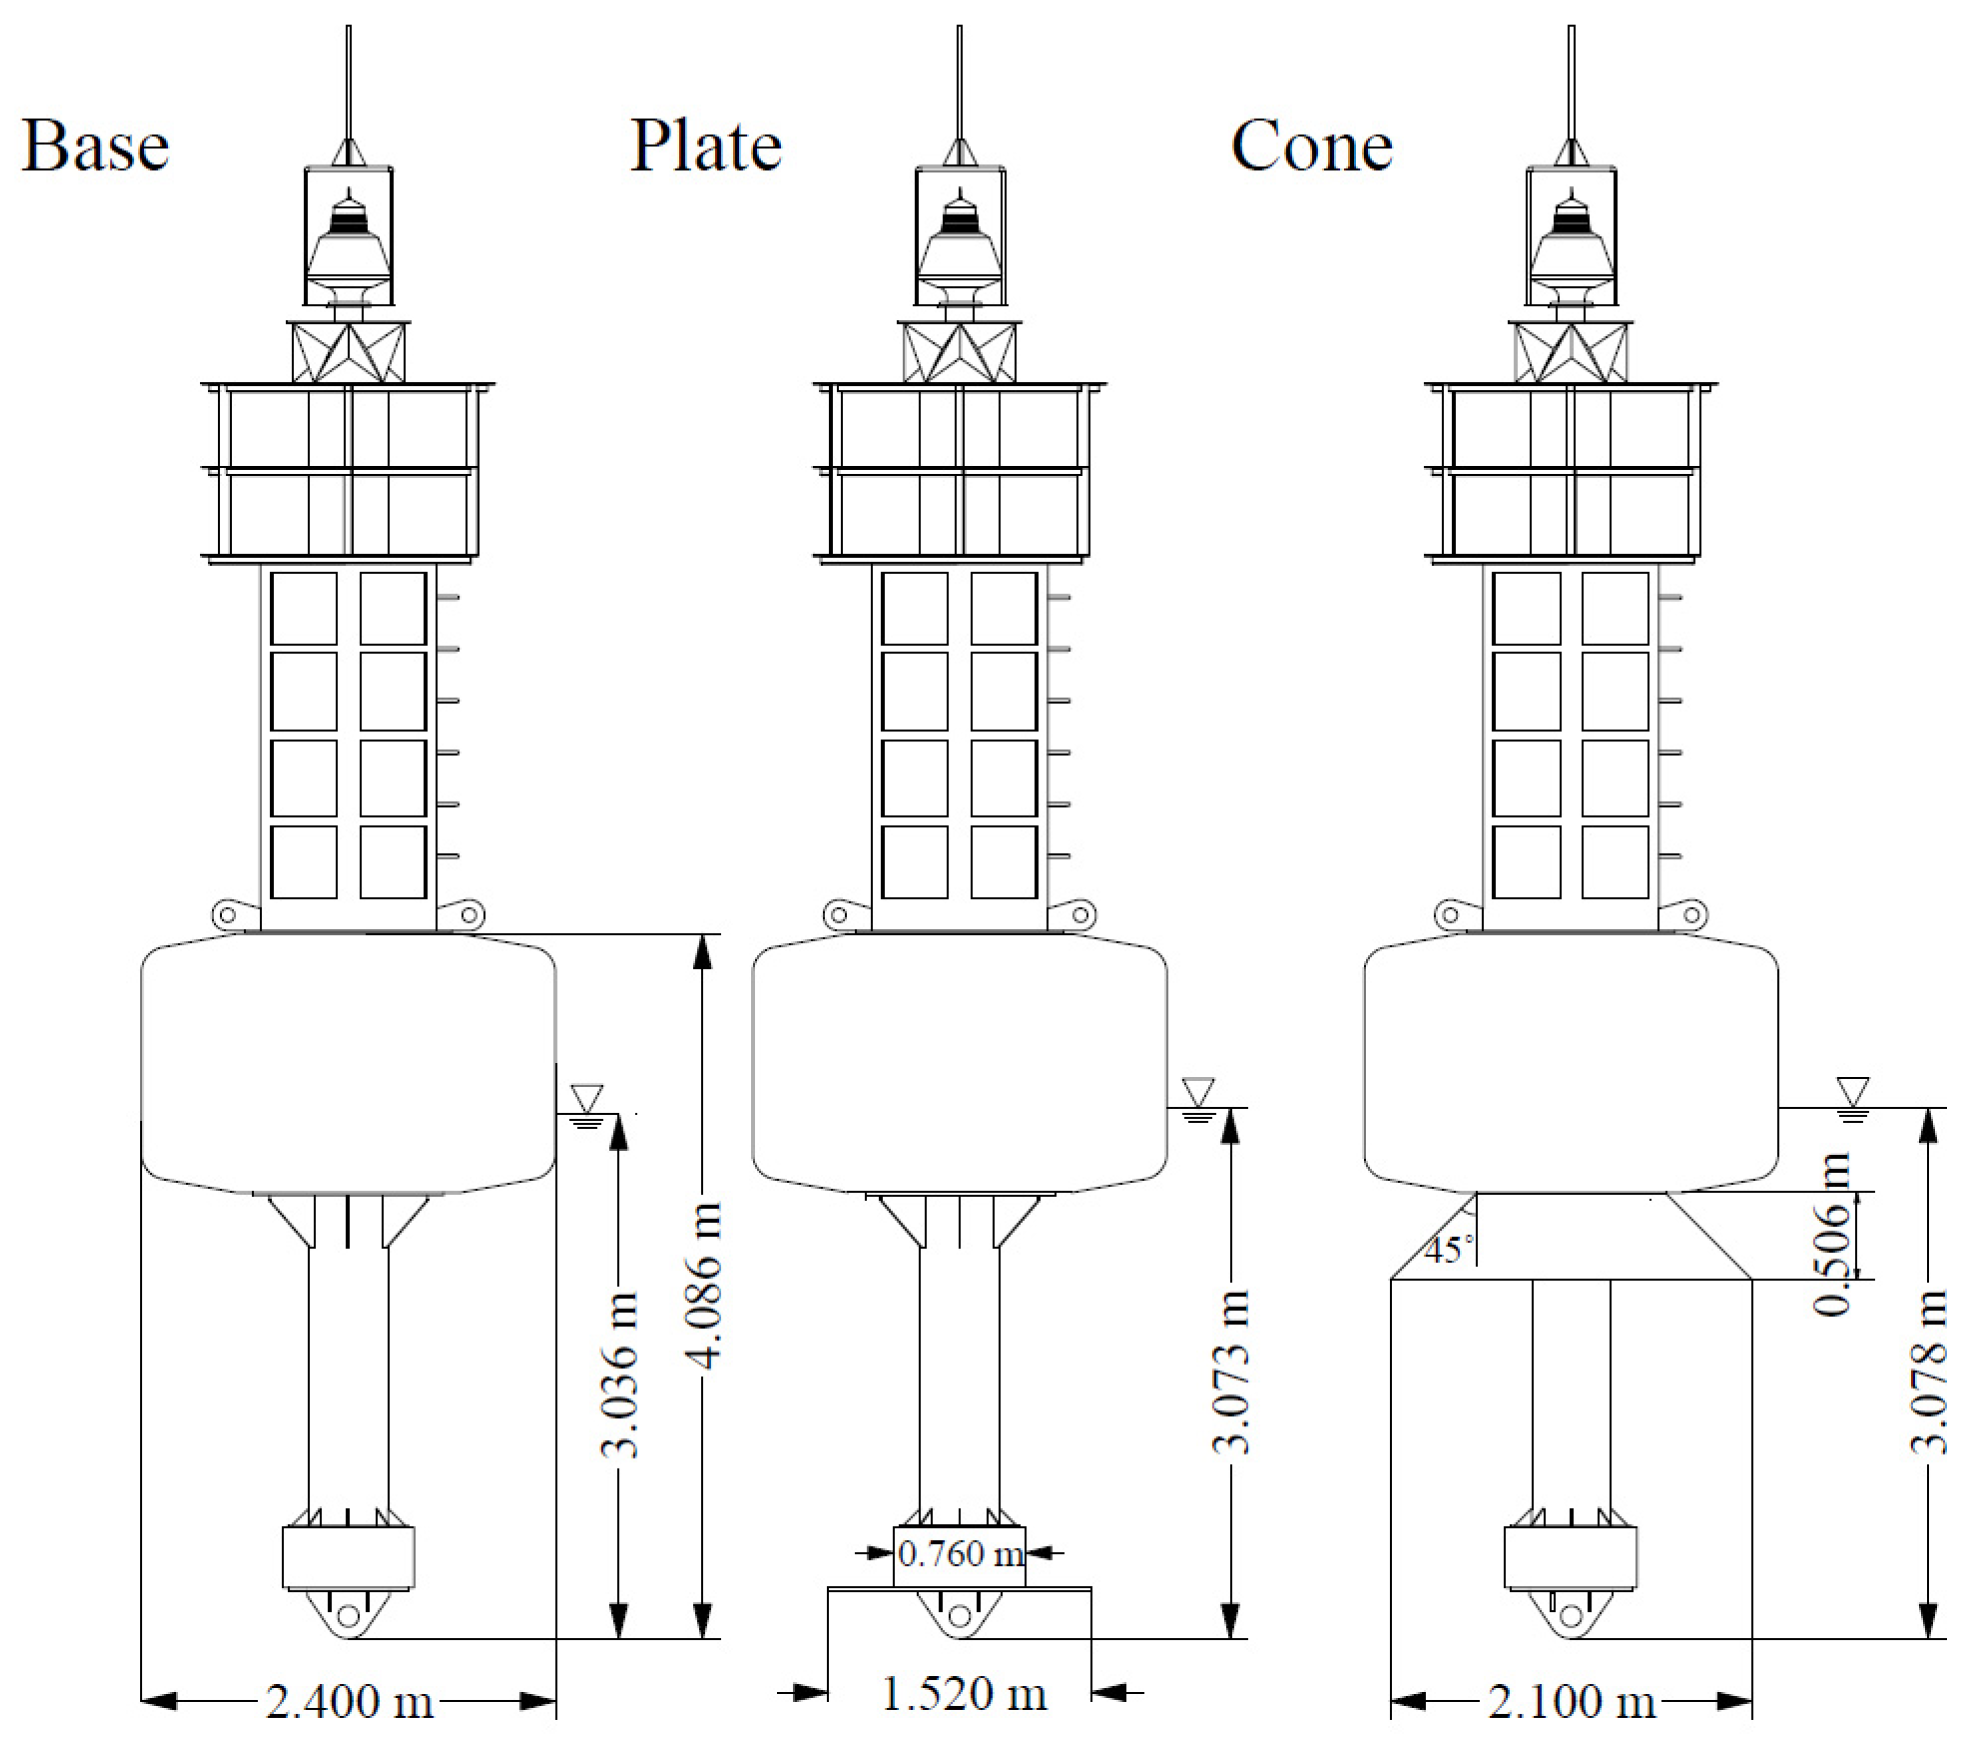
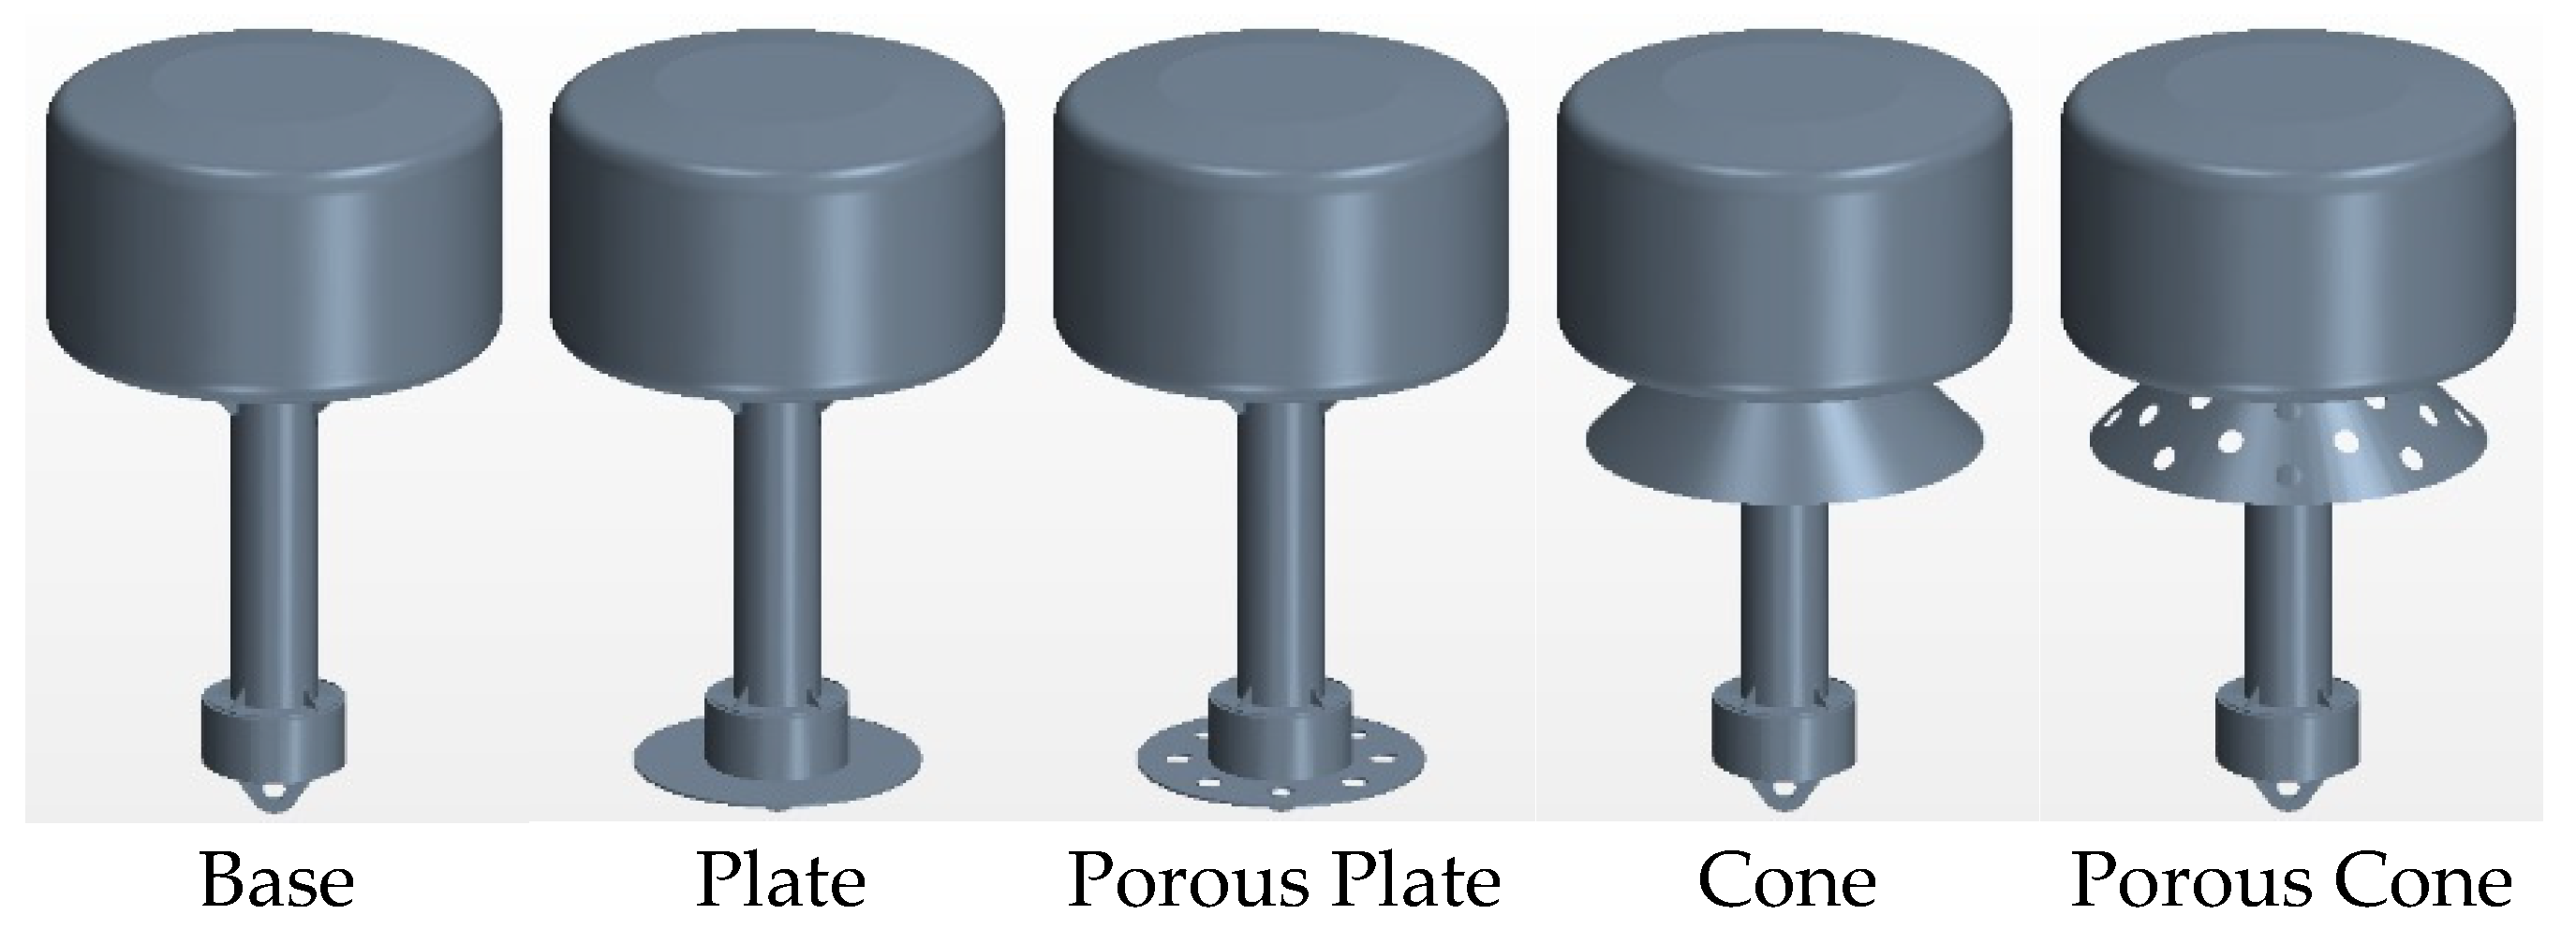
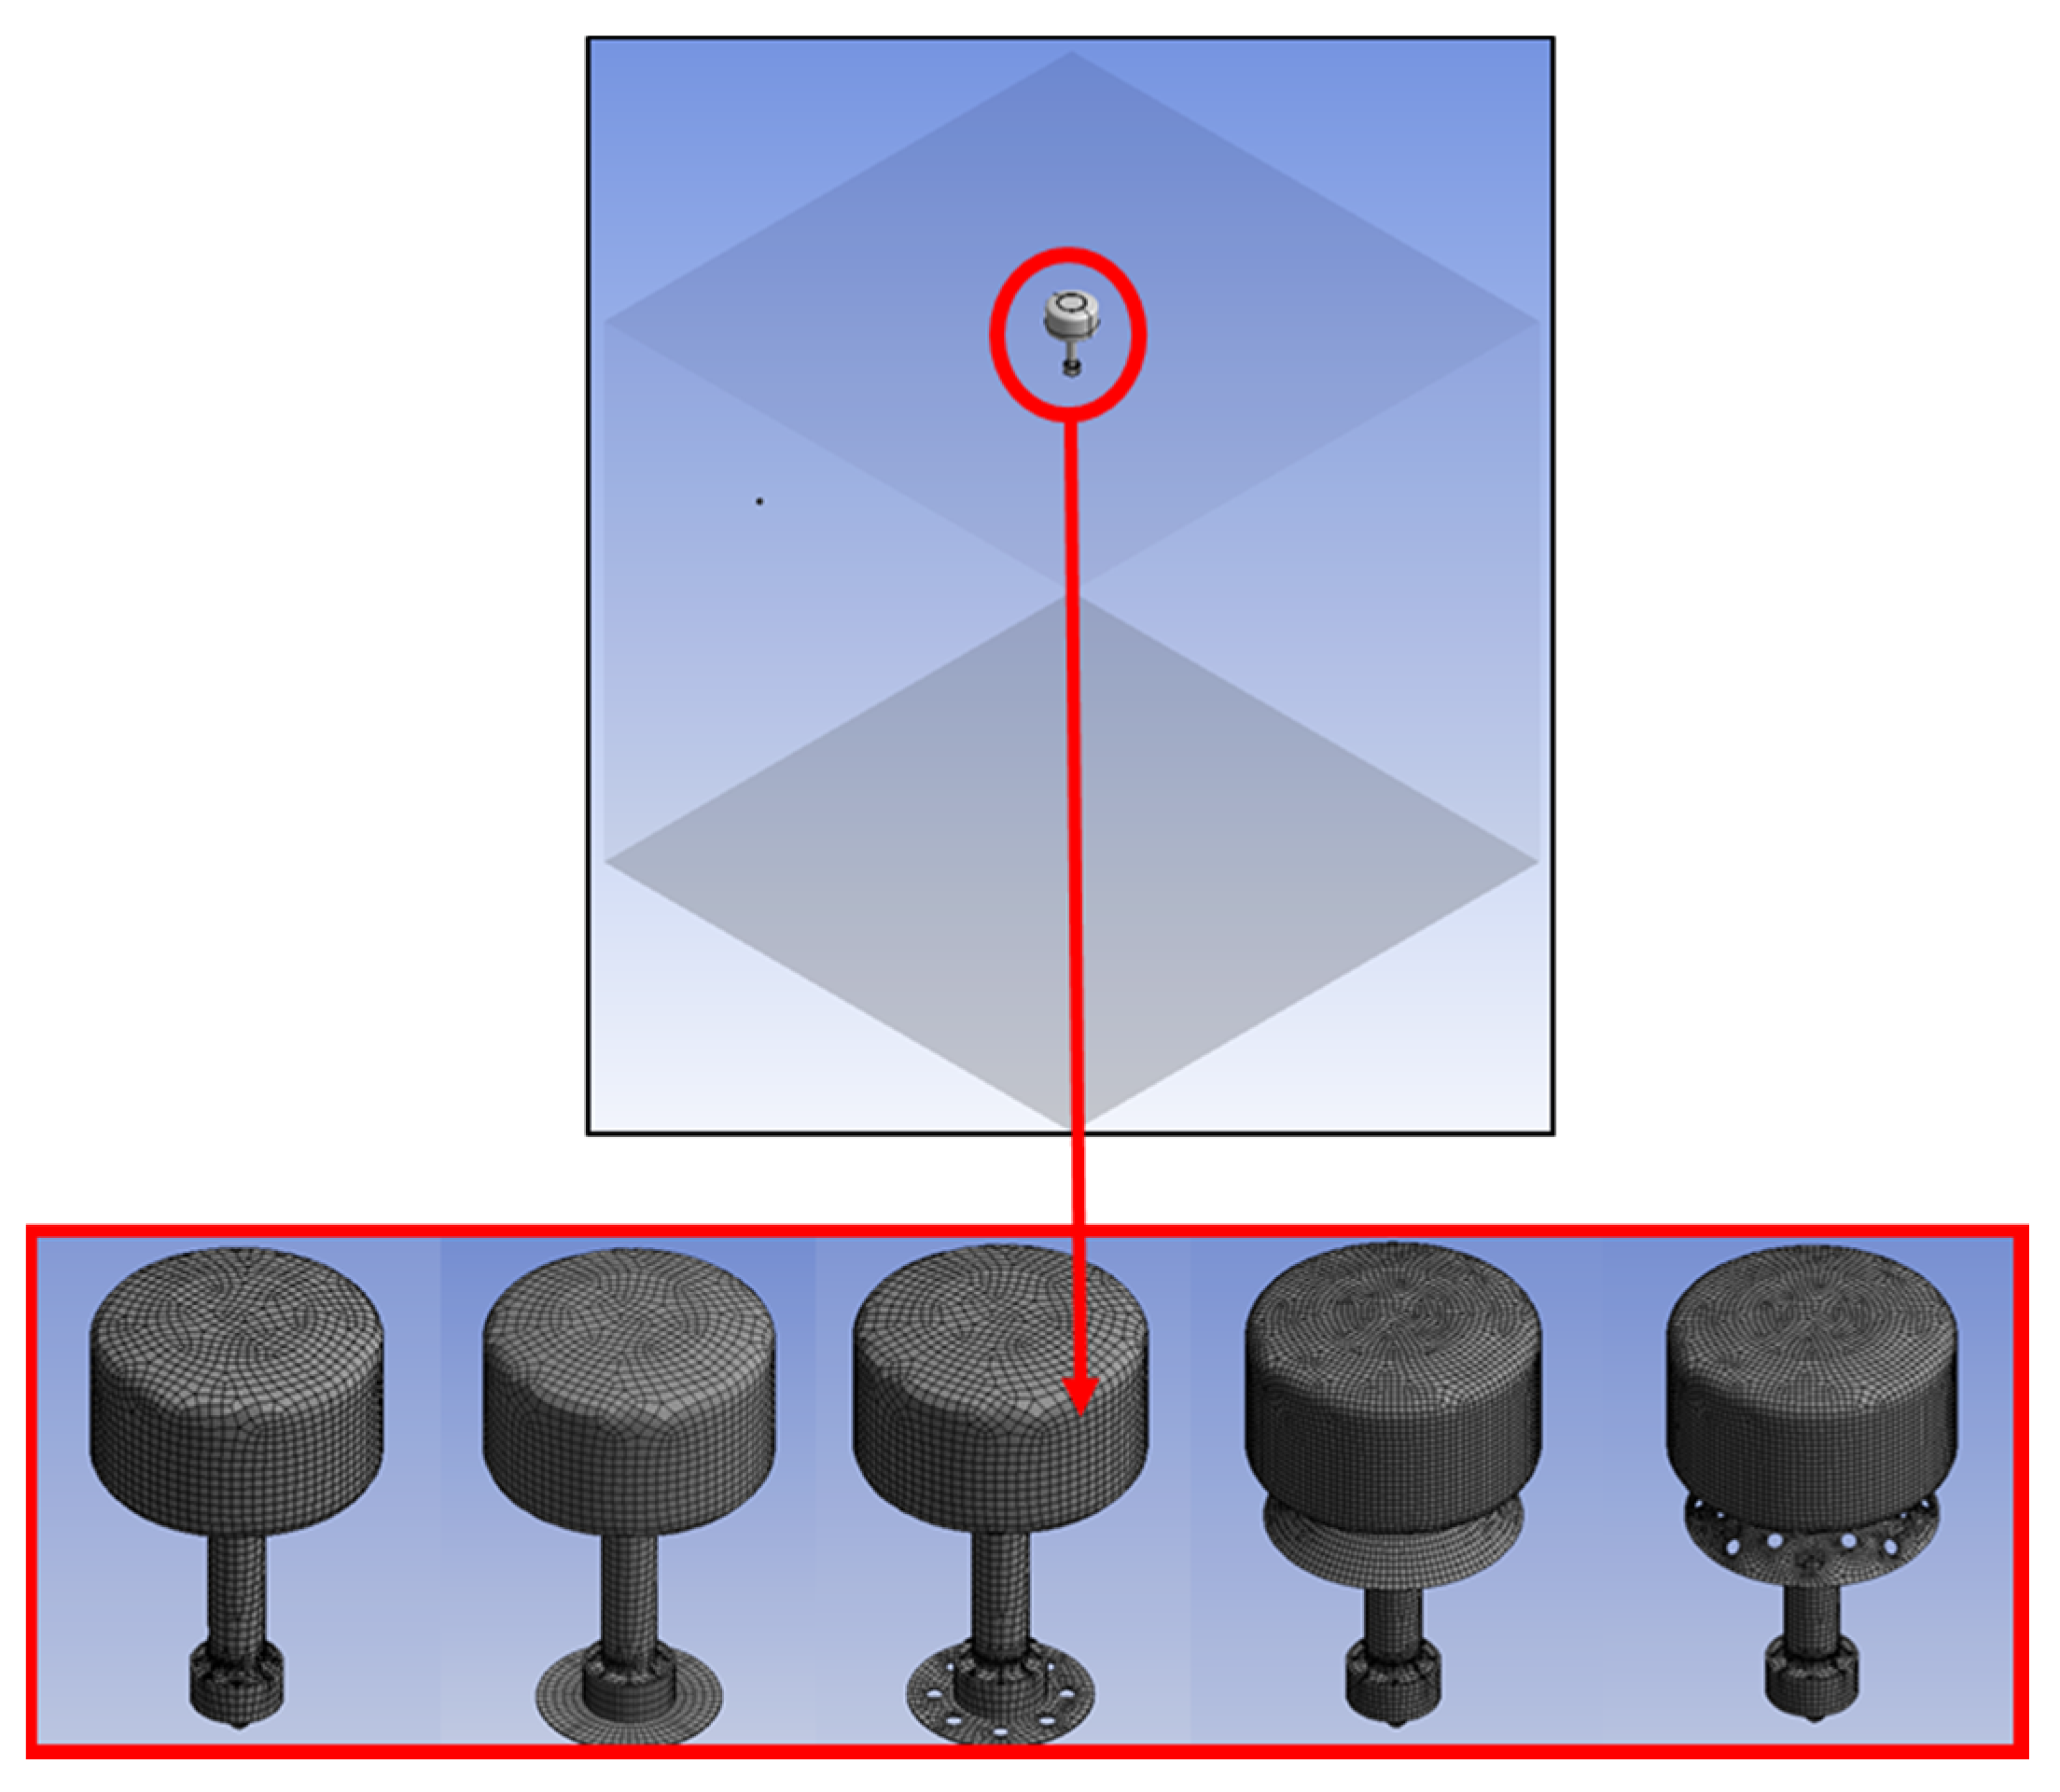
3.2. Modeling of Lightweight Light Buoys
3.3. Estimation of Viscous Damping Coefficient Using CFD Simulation
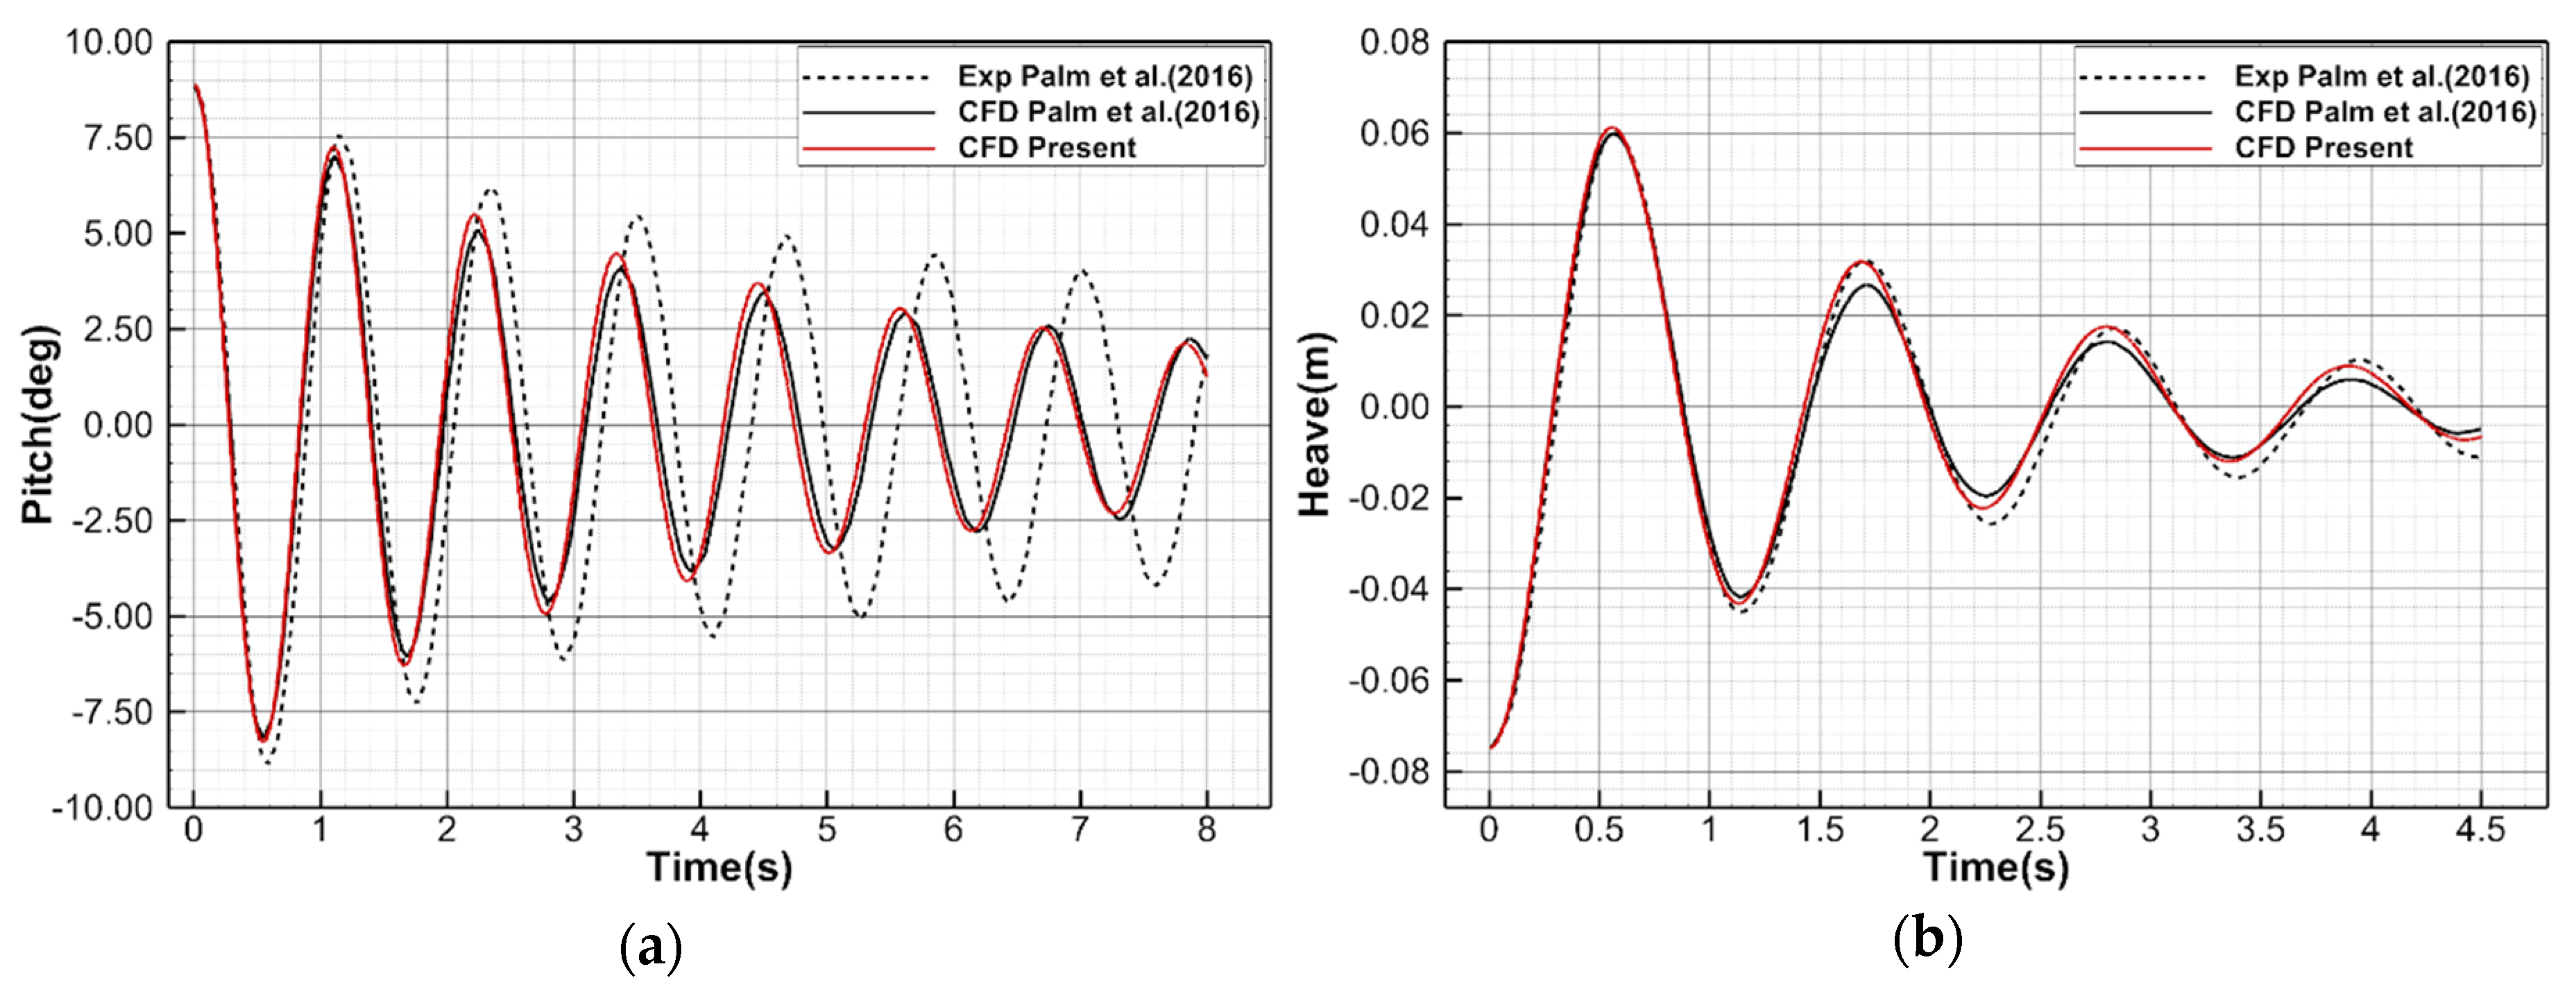
3.3.1. Validation
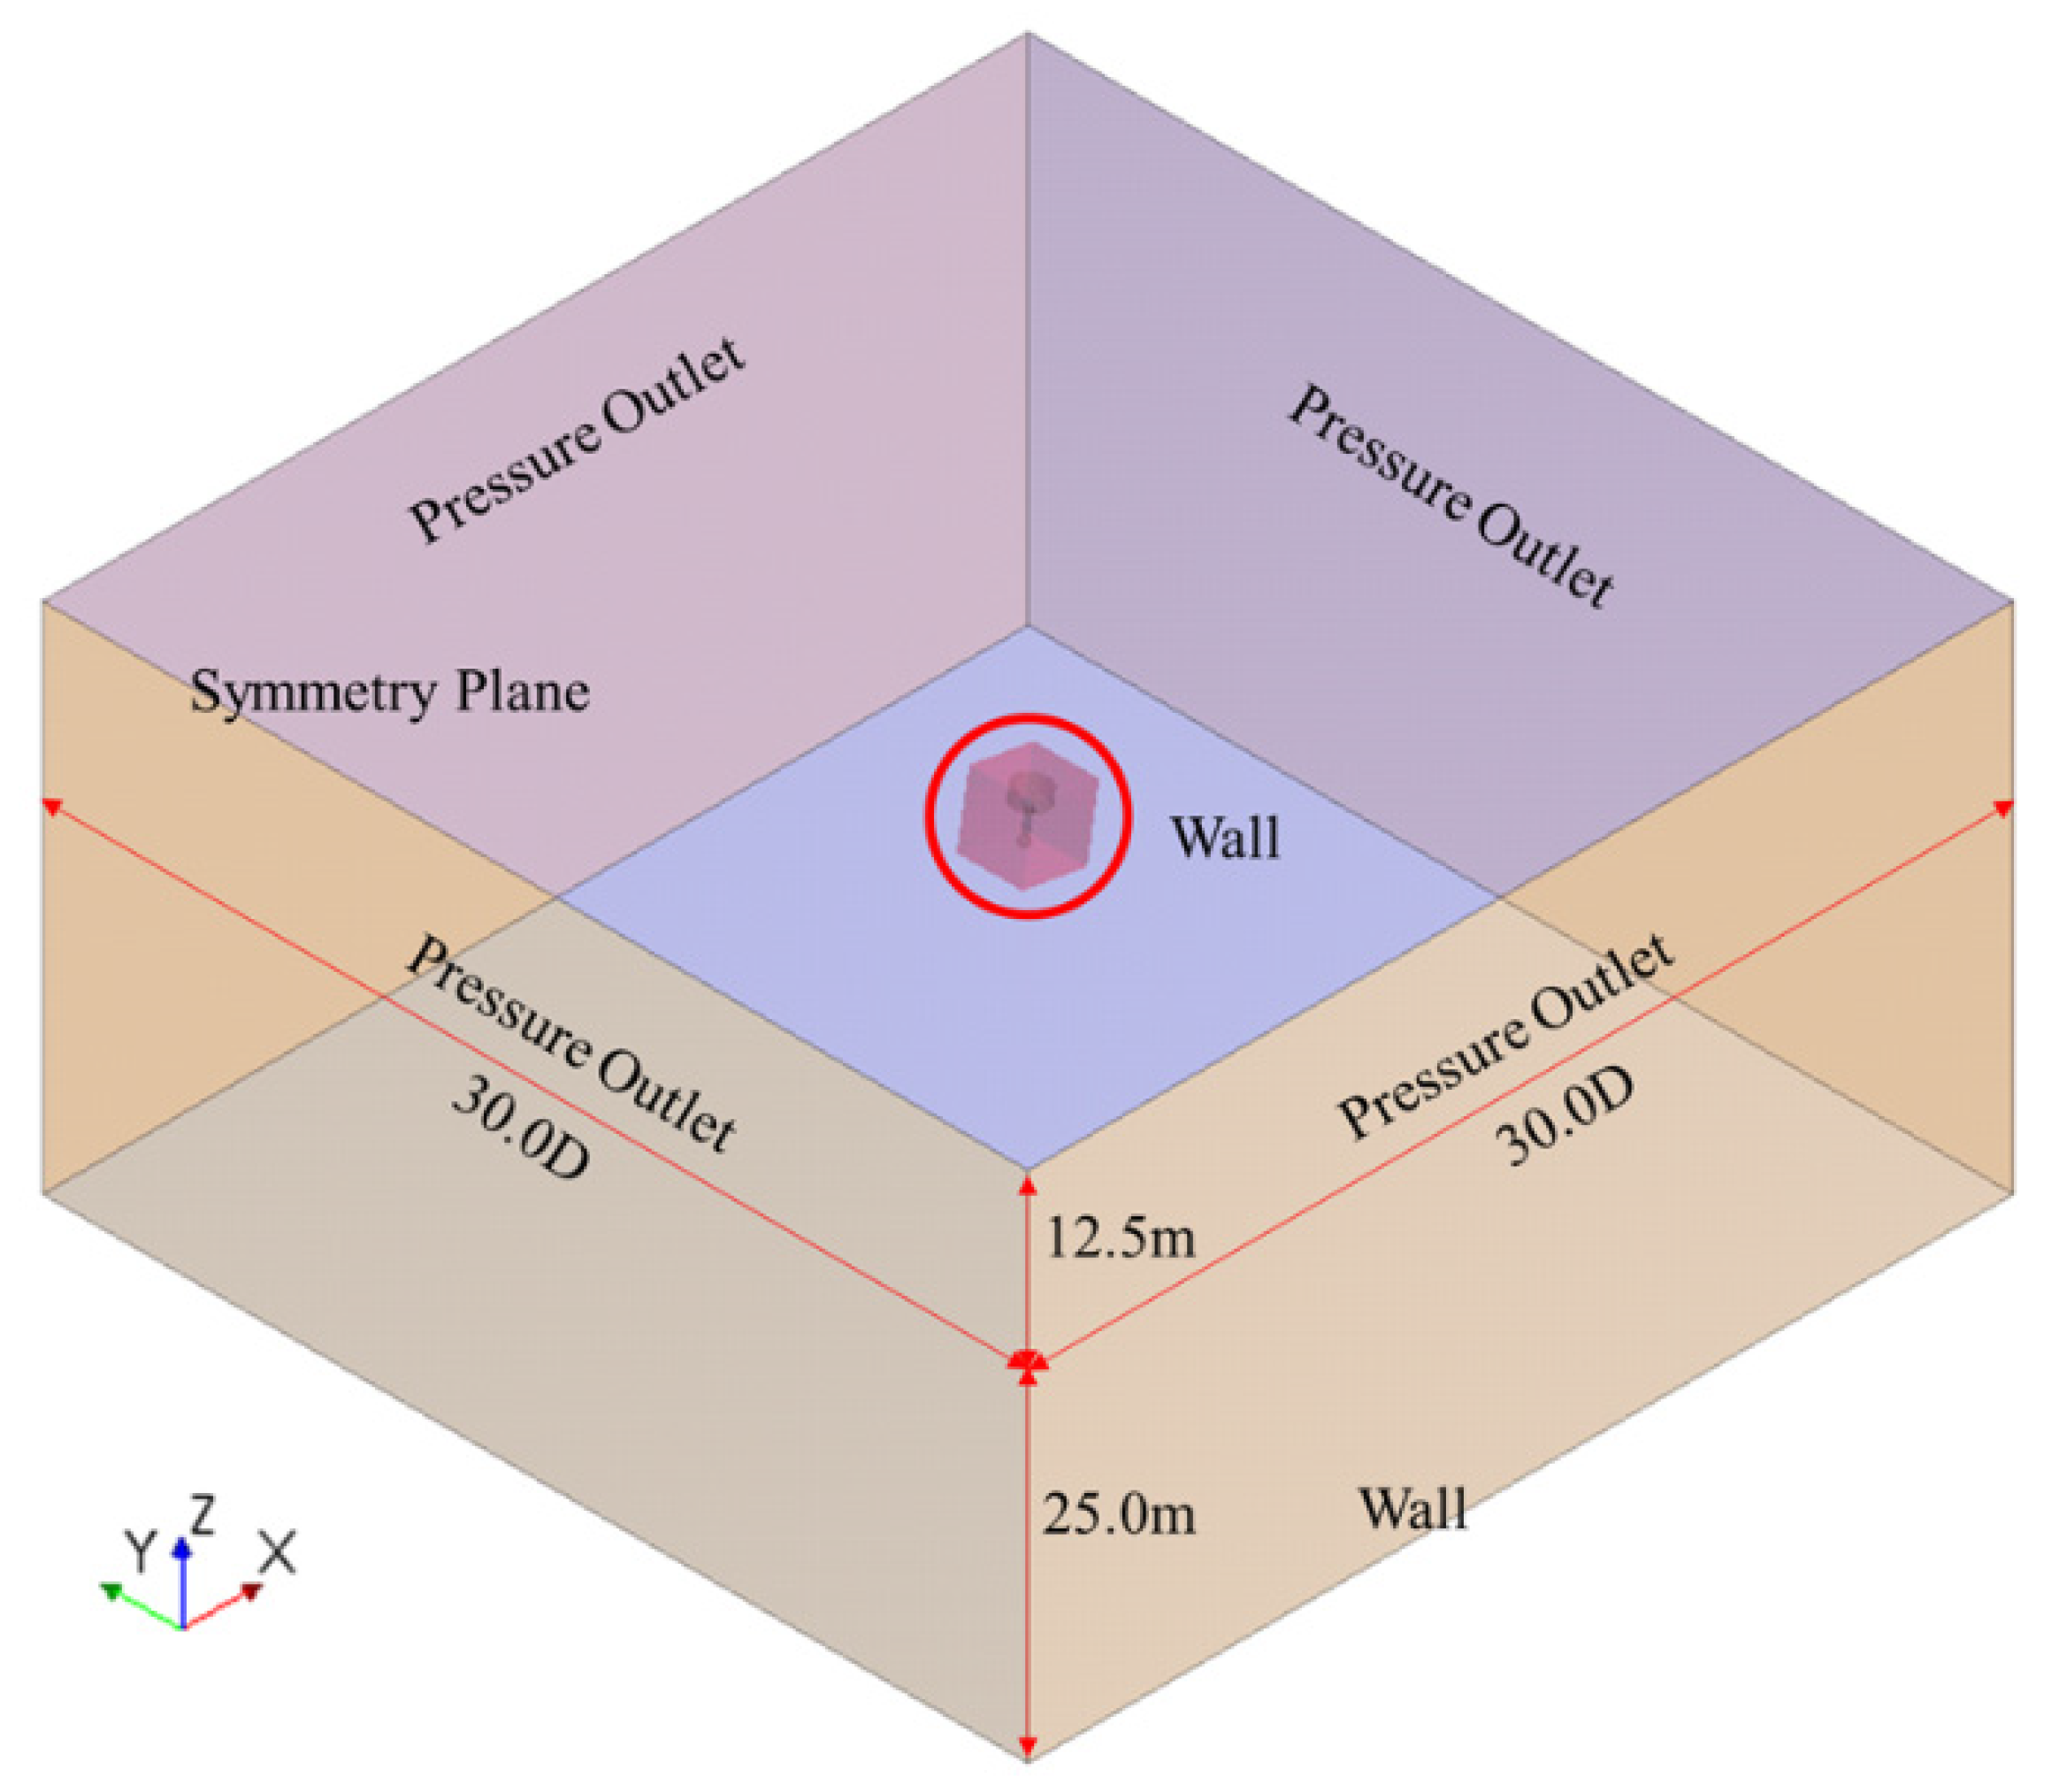
3.3.2. Computational Domain, Boundary Conditions, and Grid System
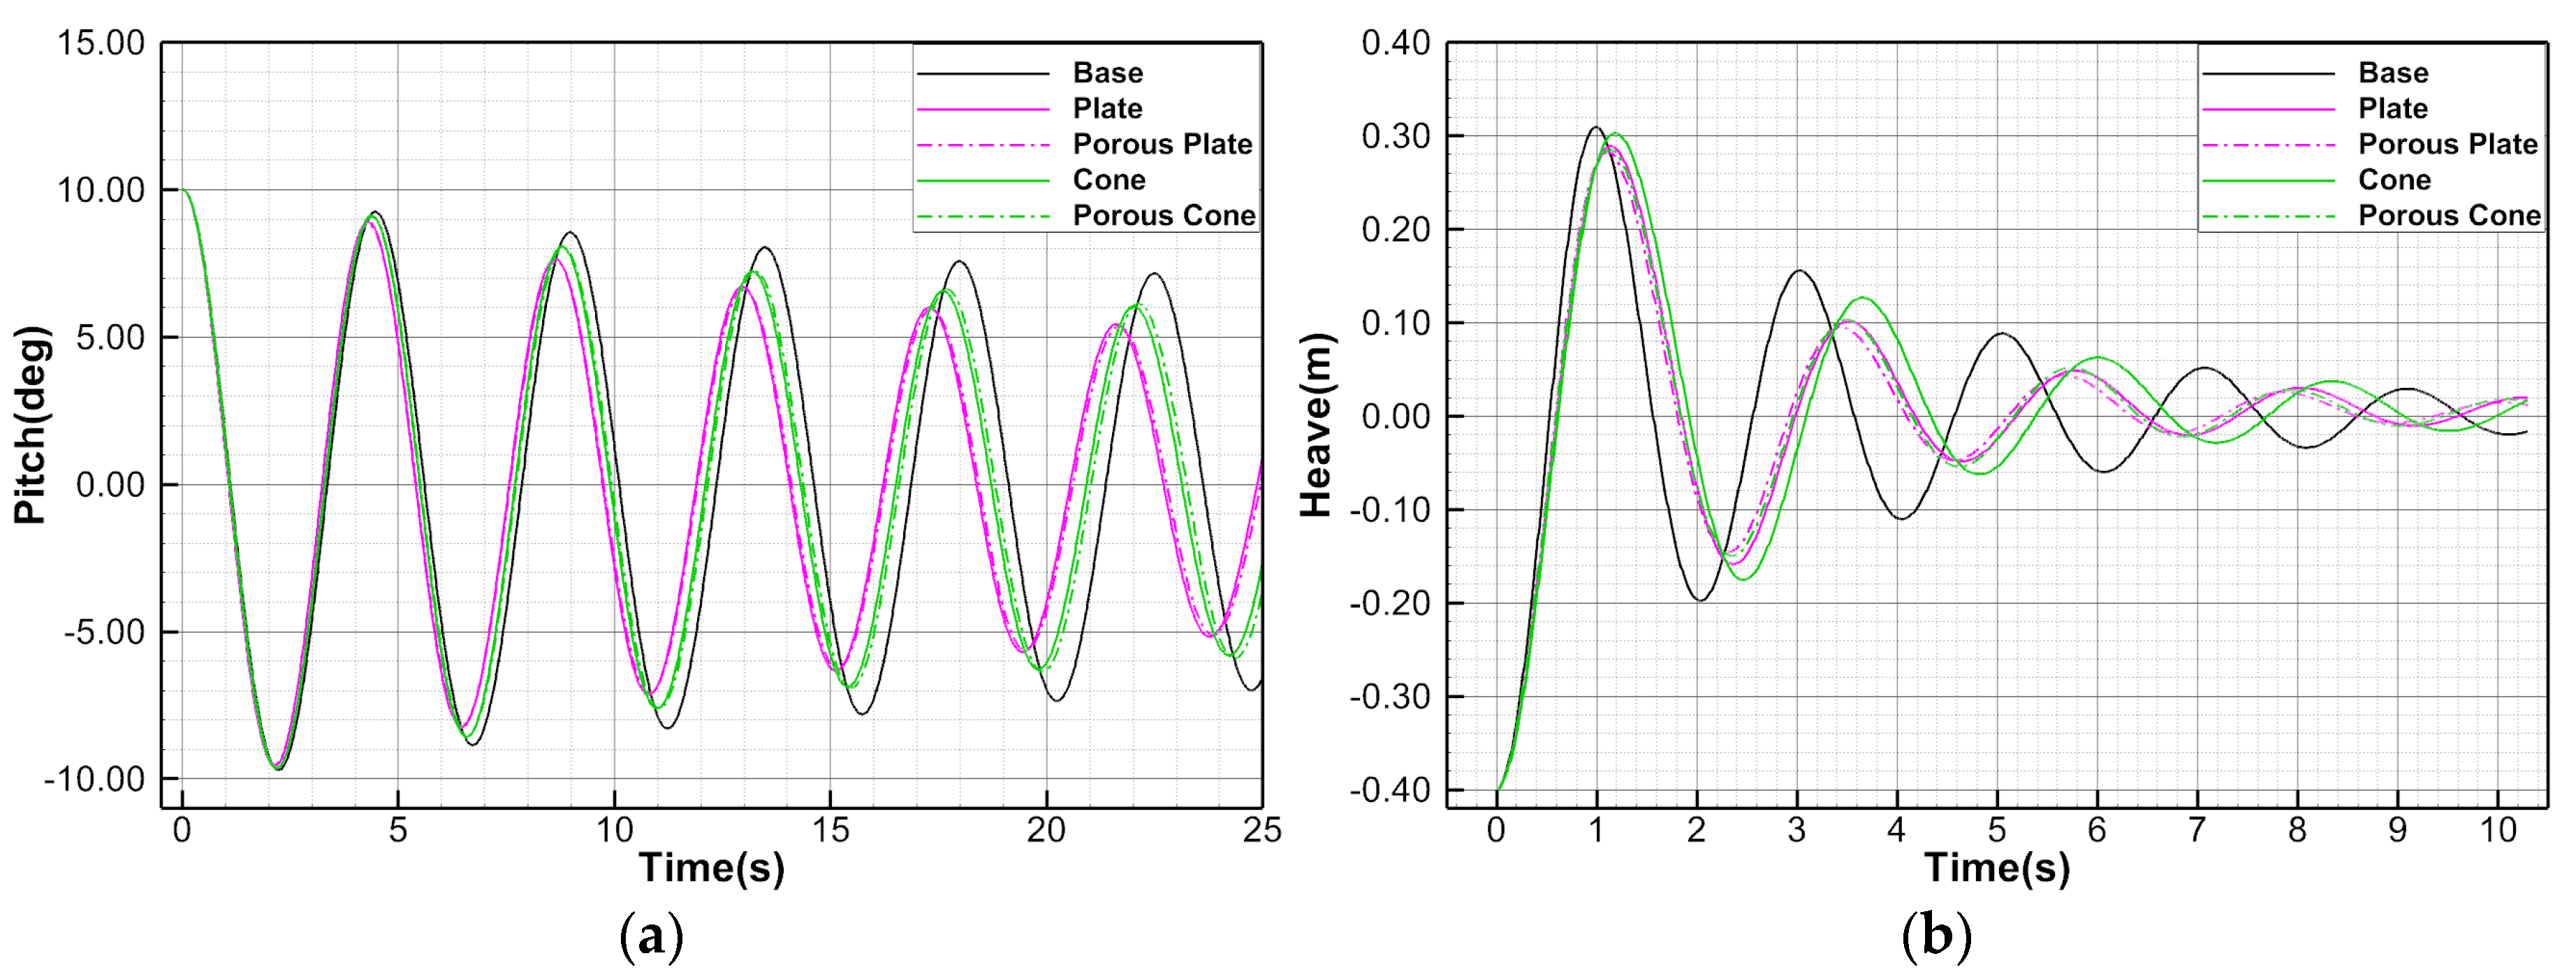
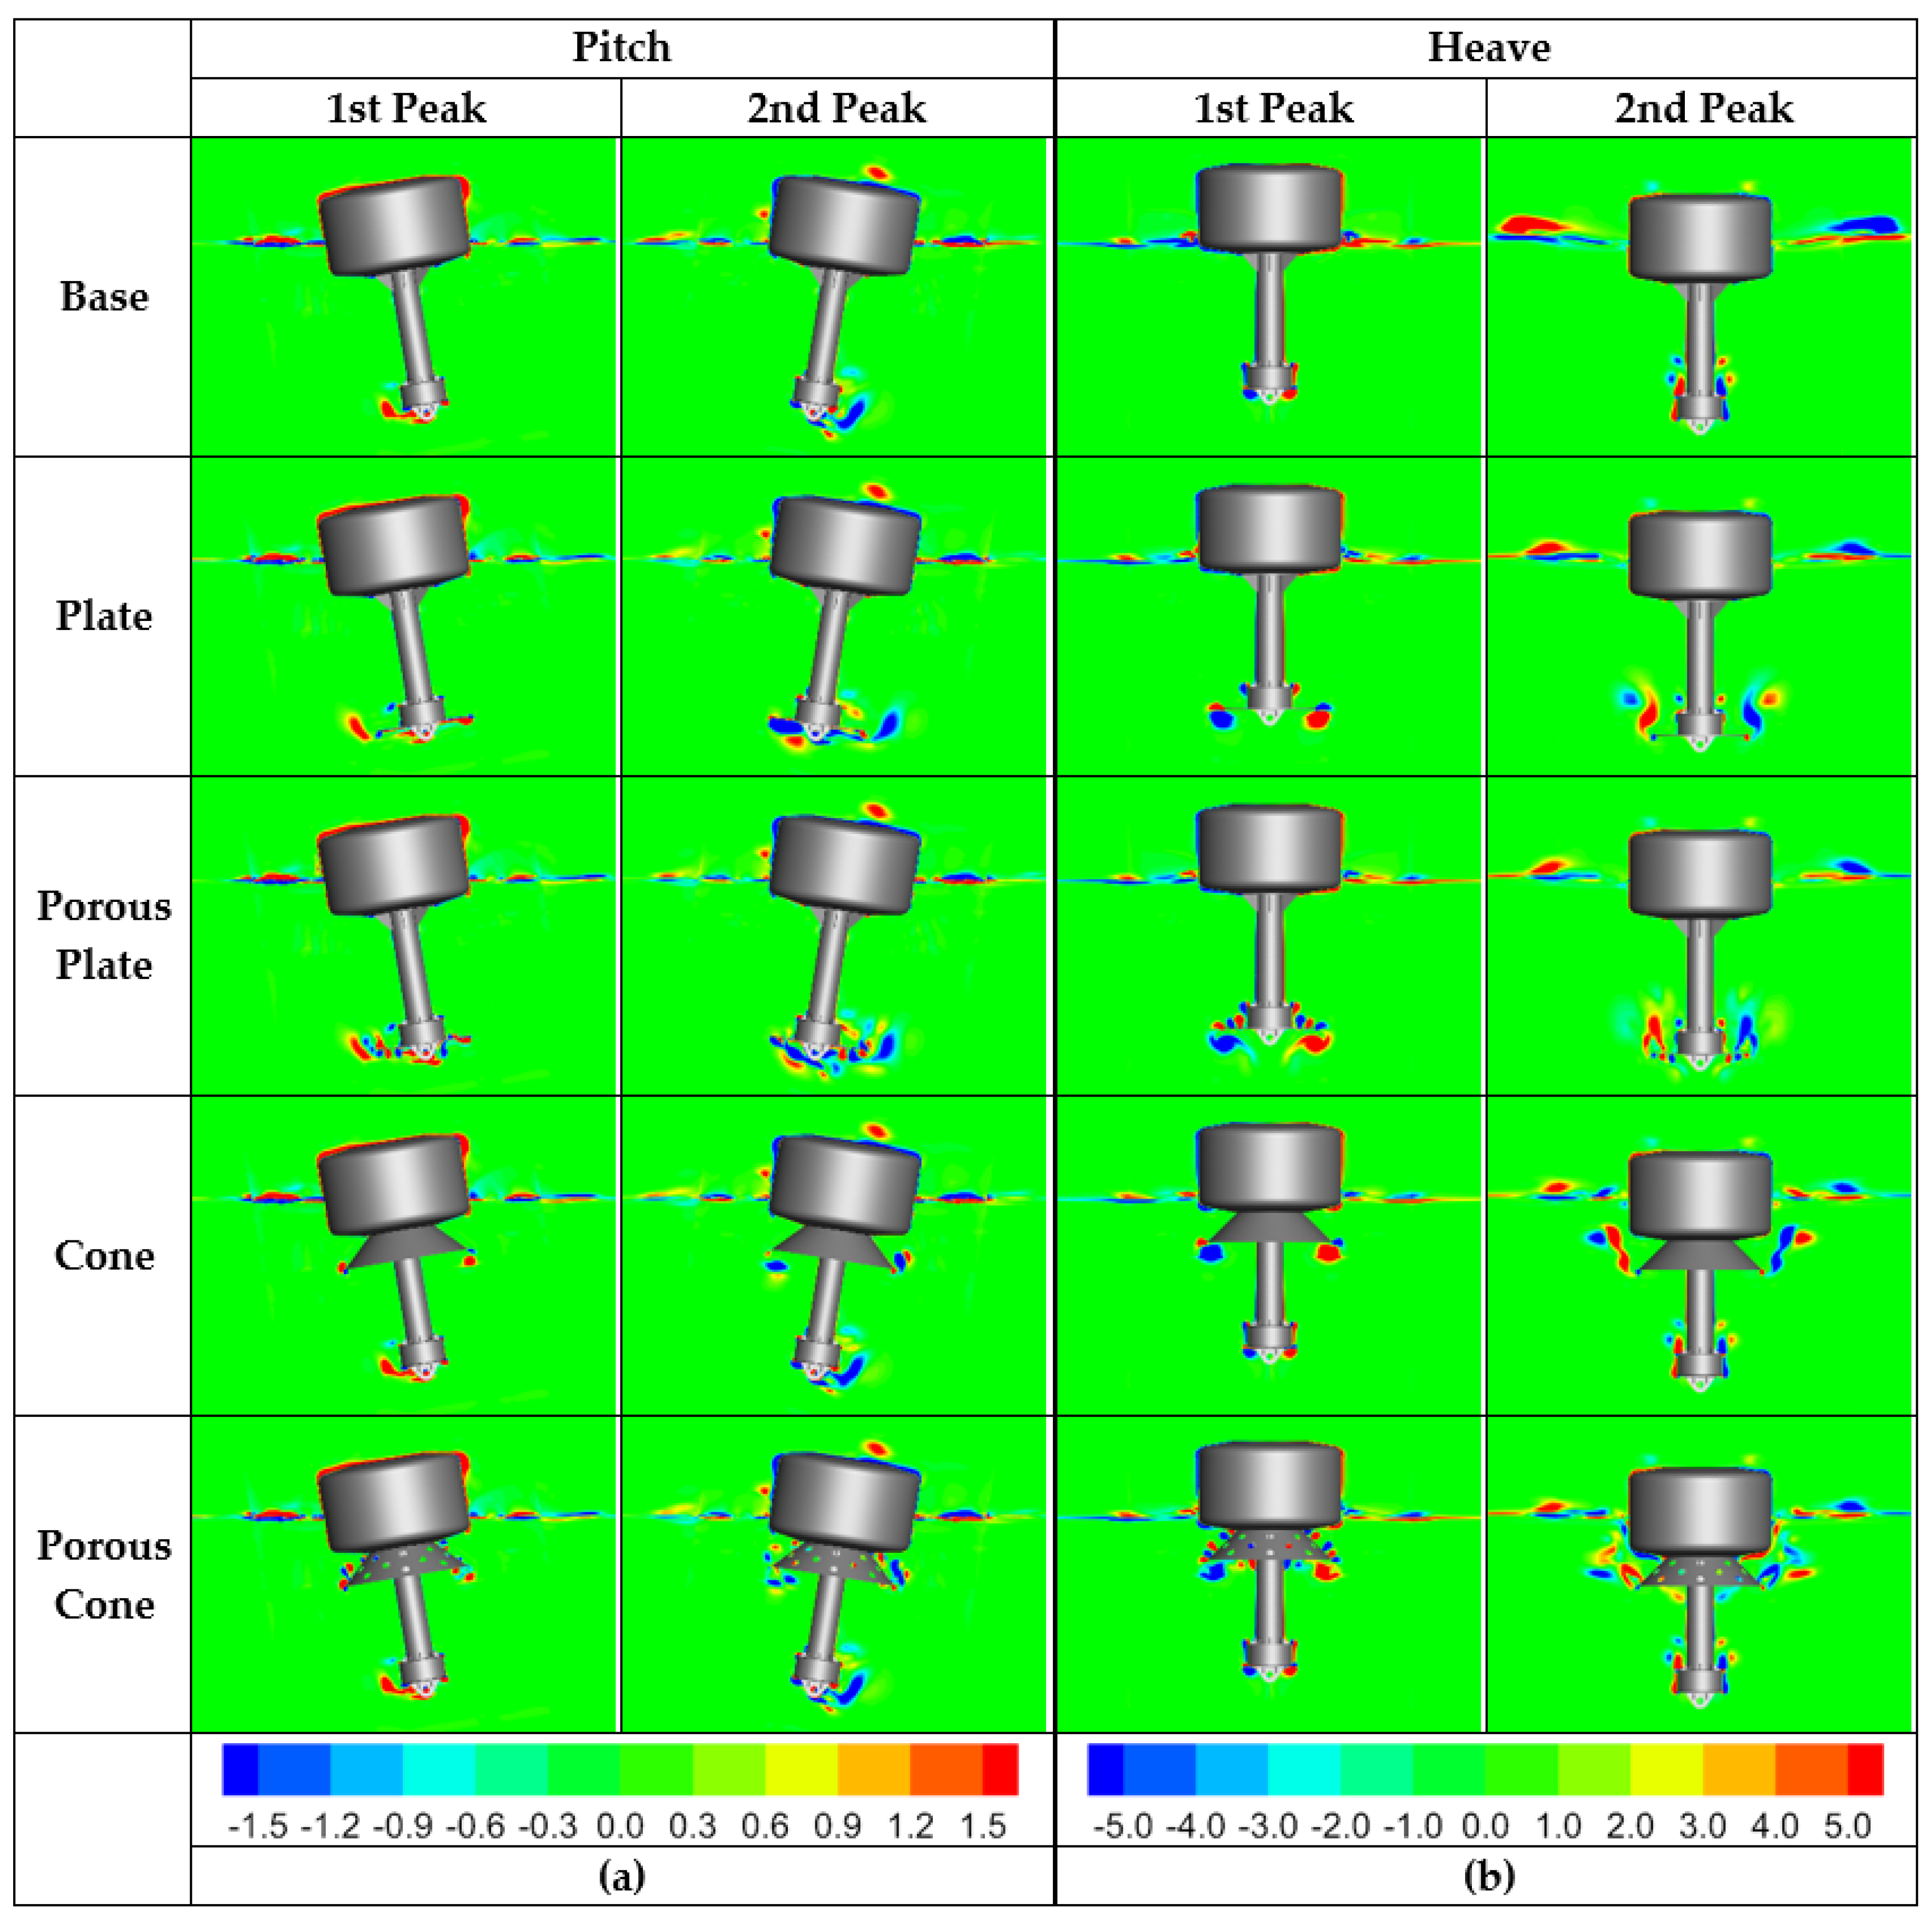
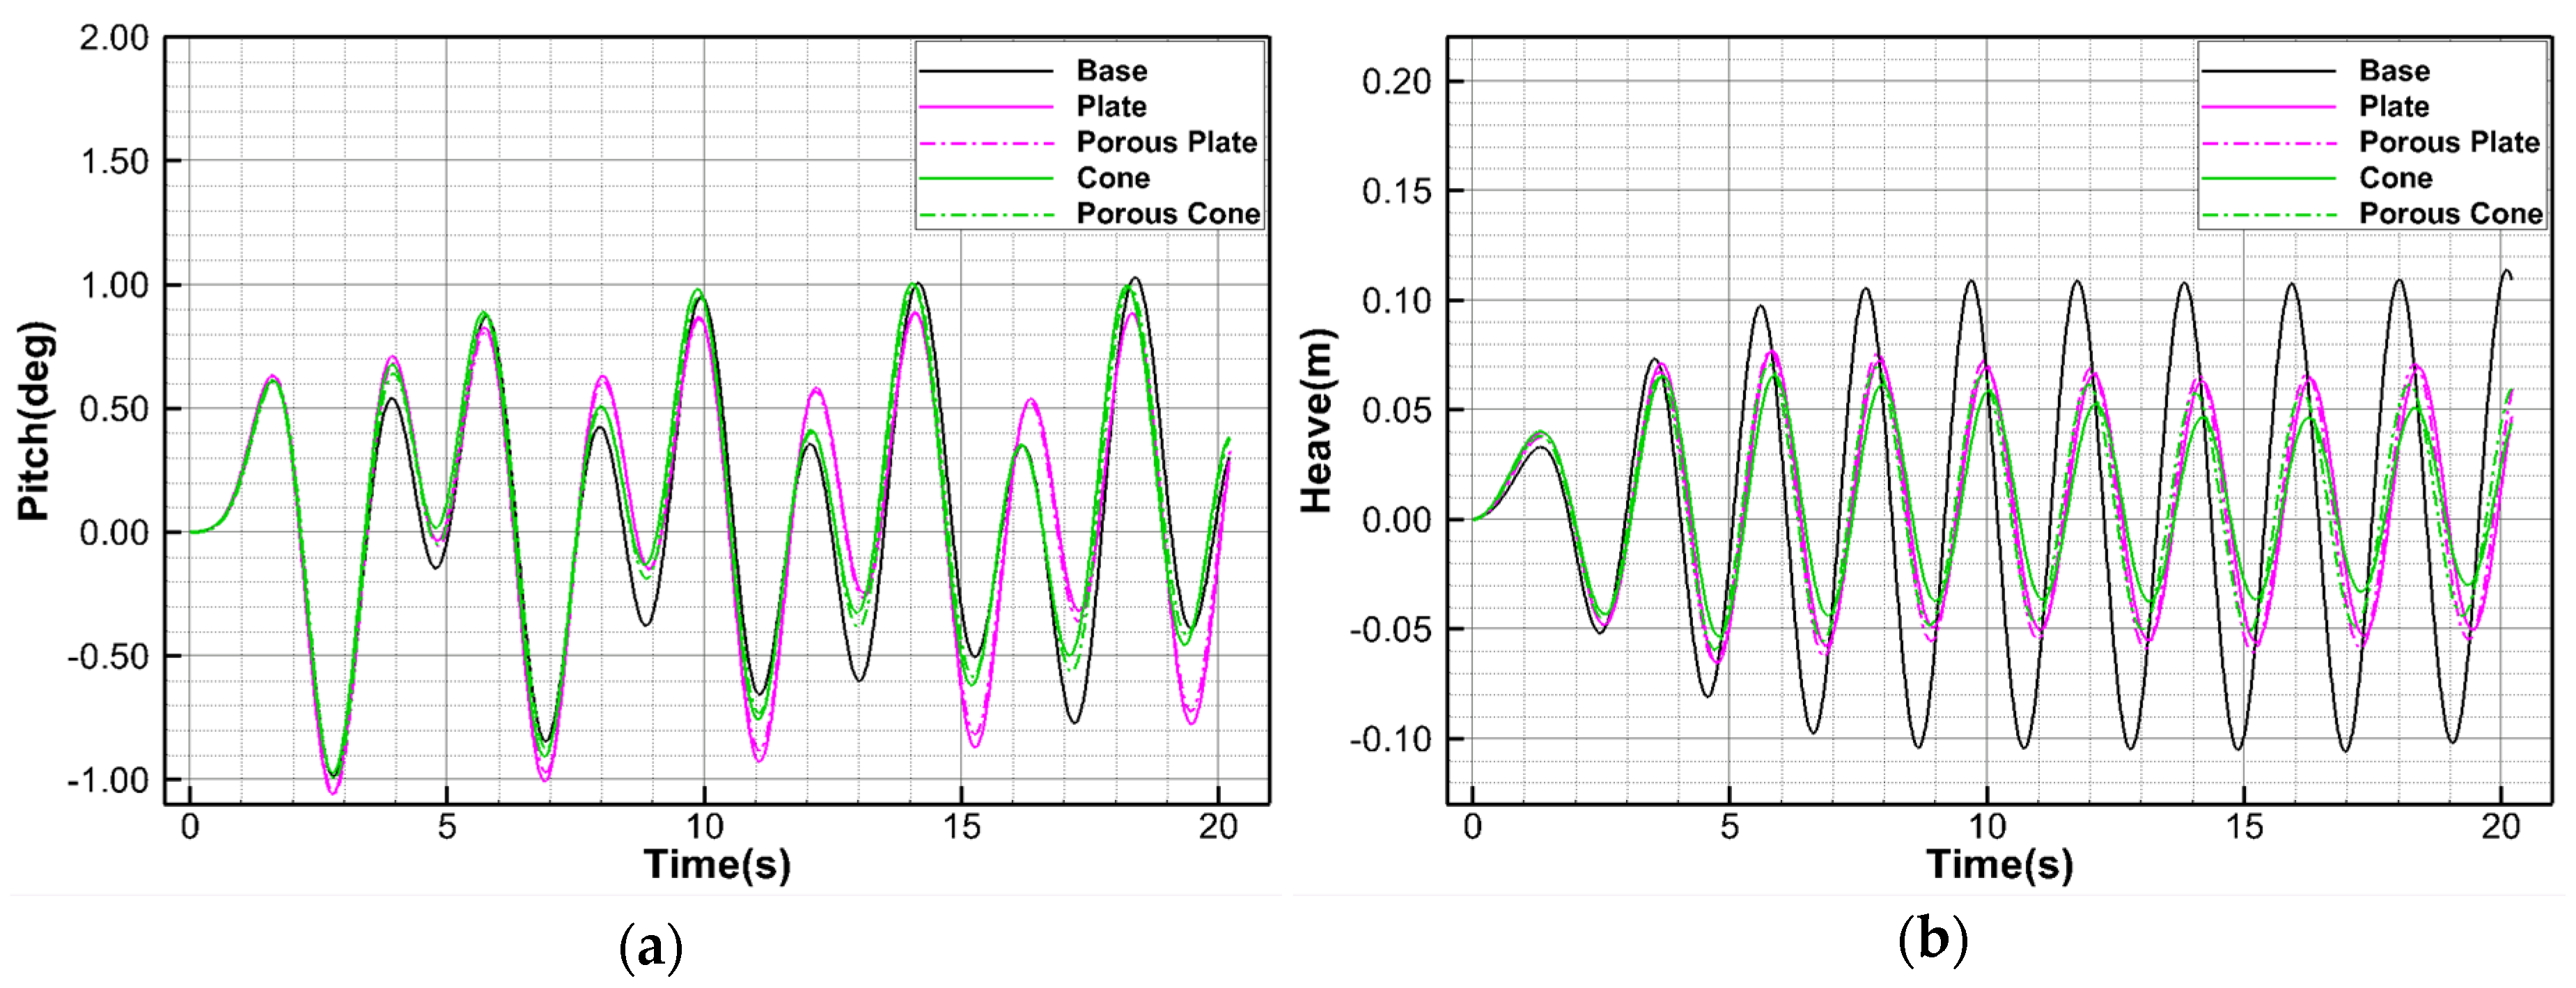
3.3.3. Results
3.4. Potential-Based Motion Analysis
3.4.1. Computational Conditions
3.4.2. Results
3.5. Motion Simulation in Regular Waves Using CFD
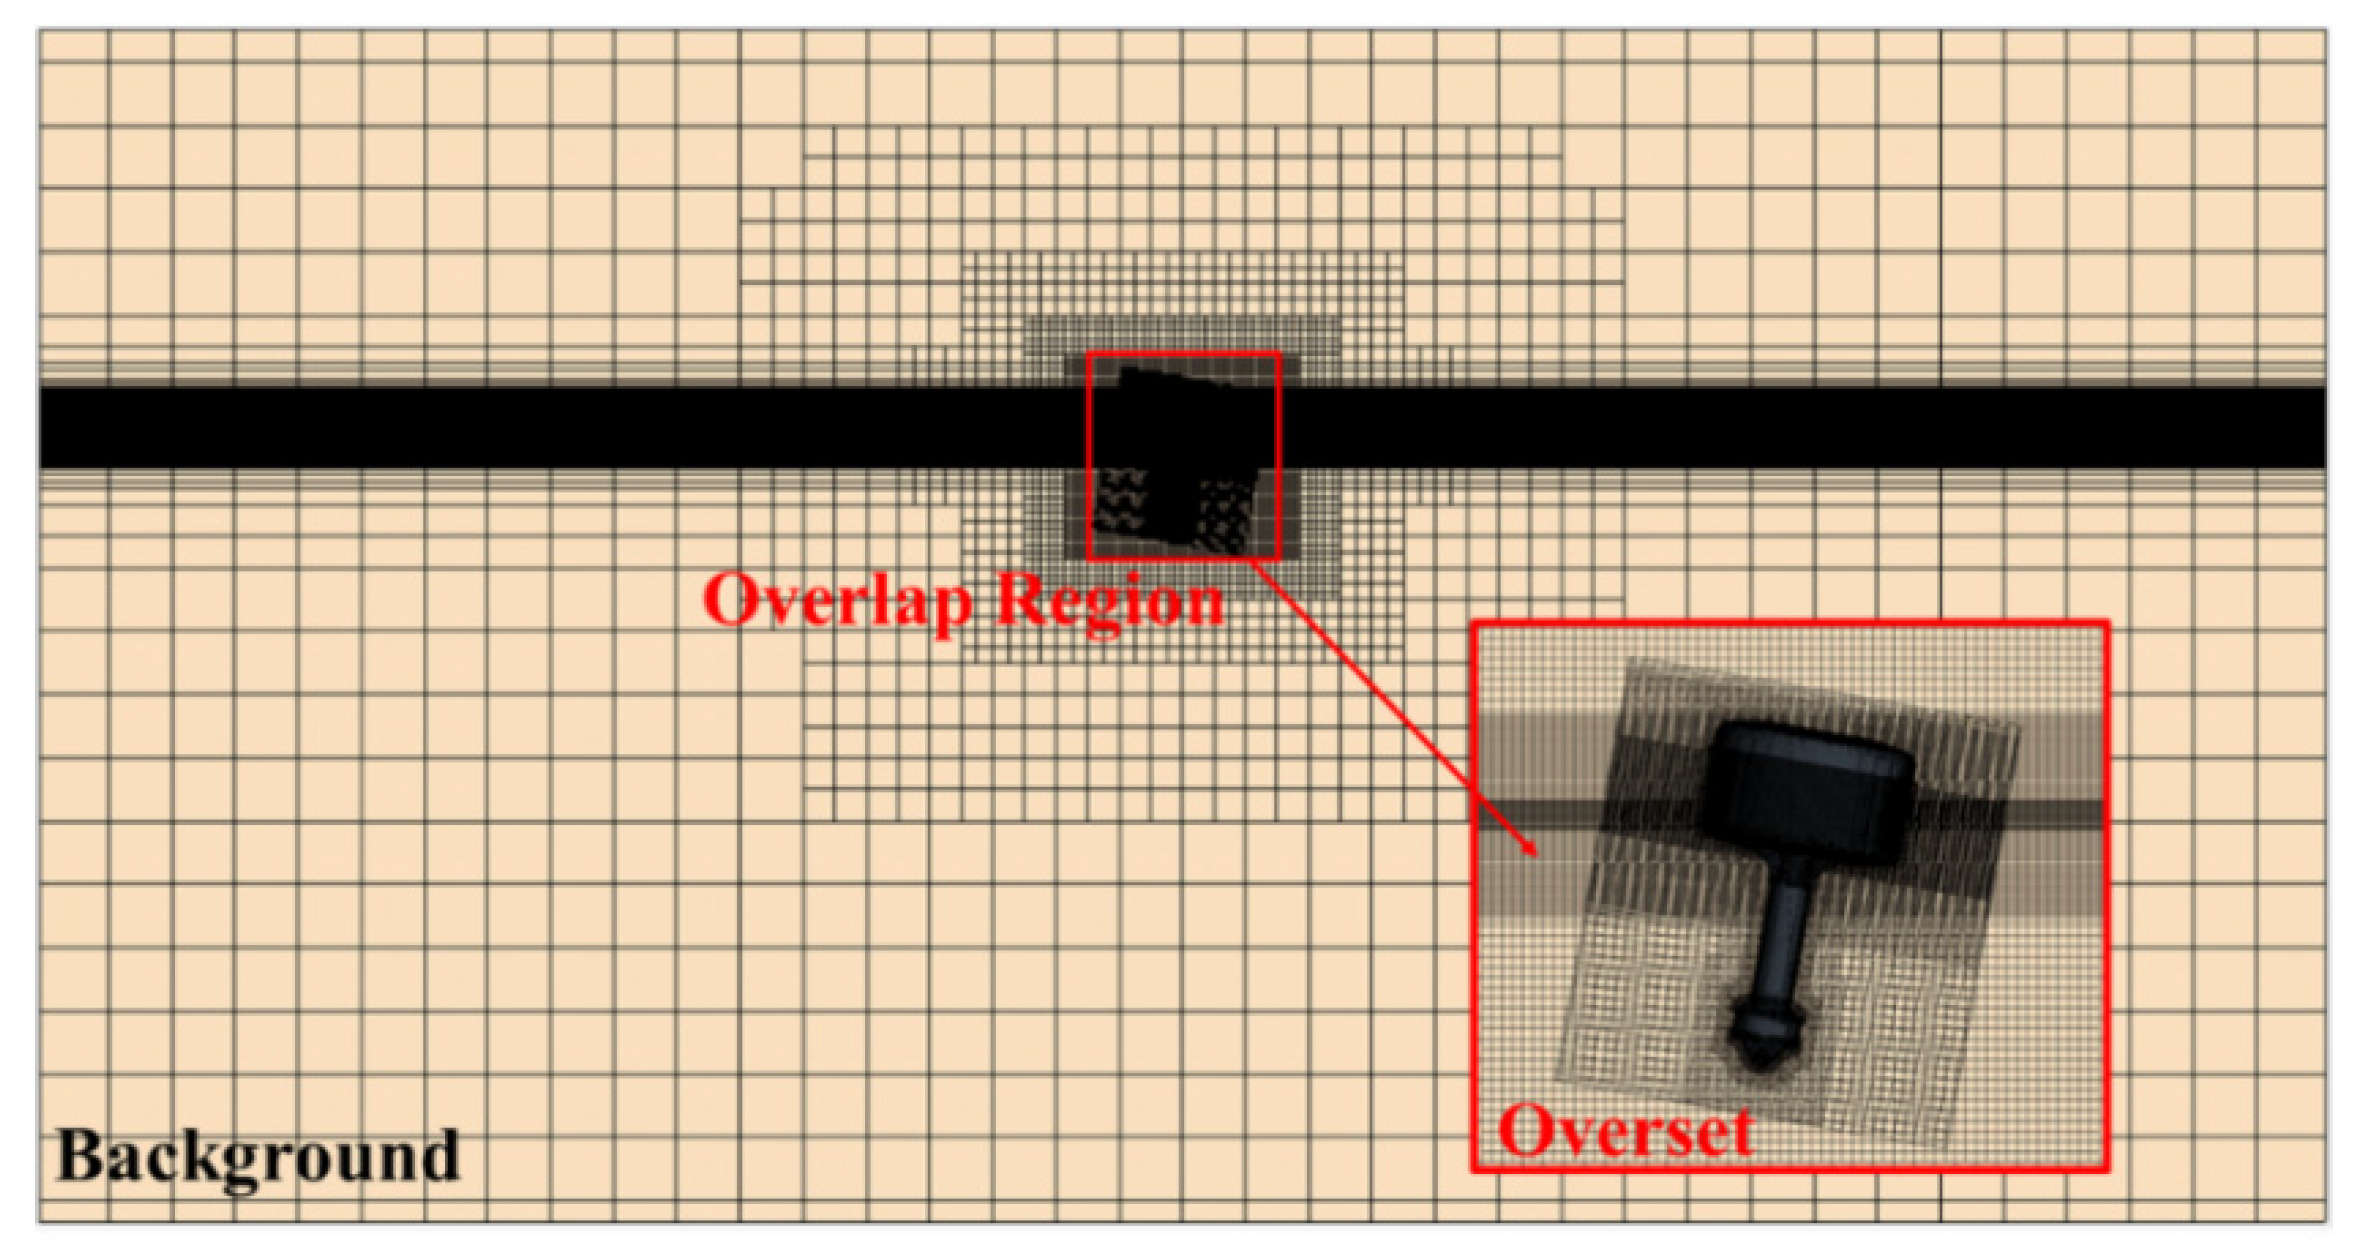
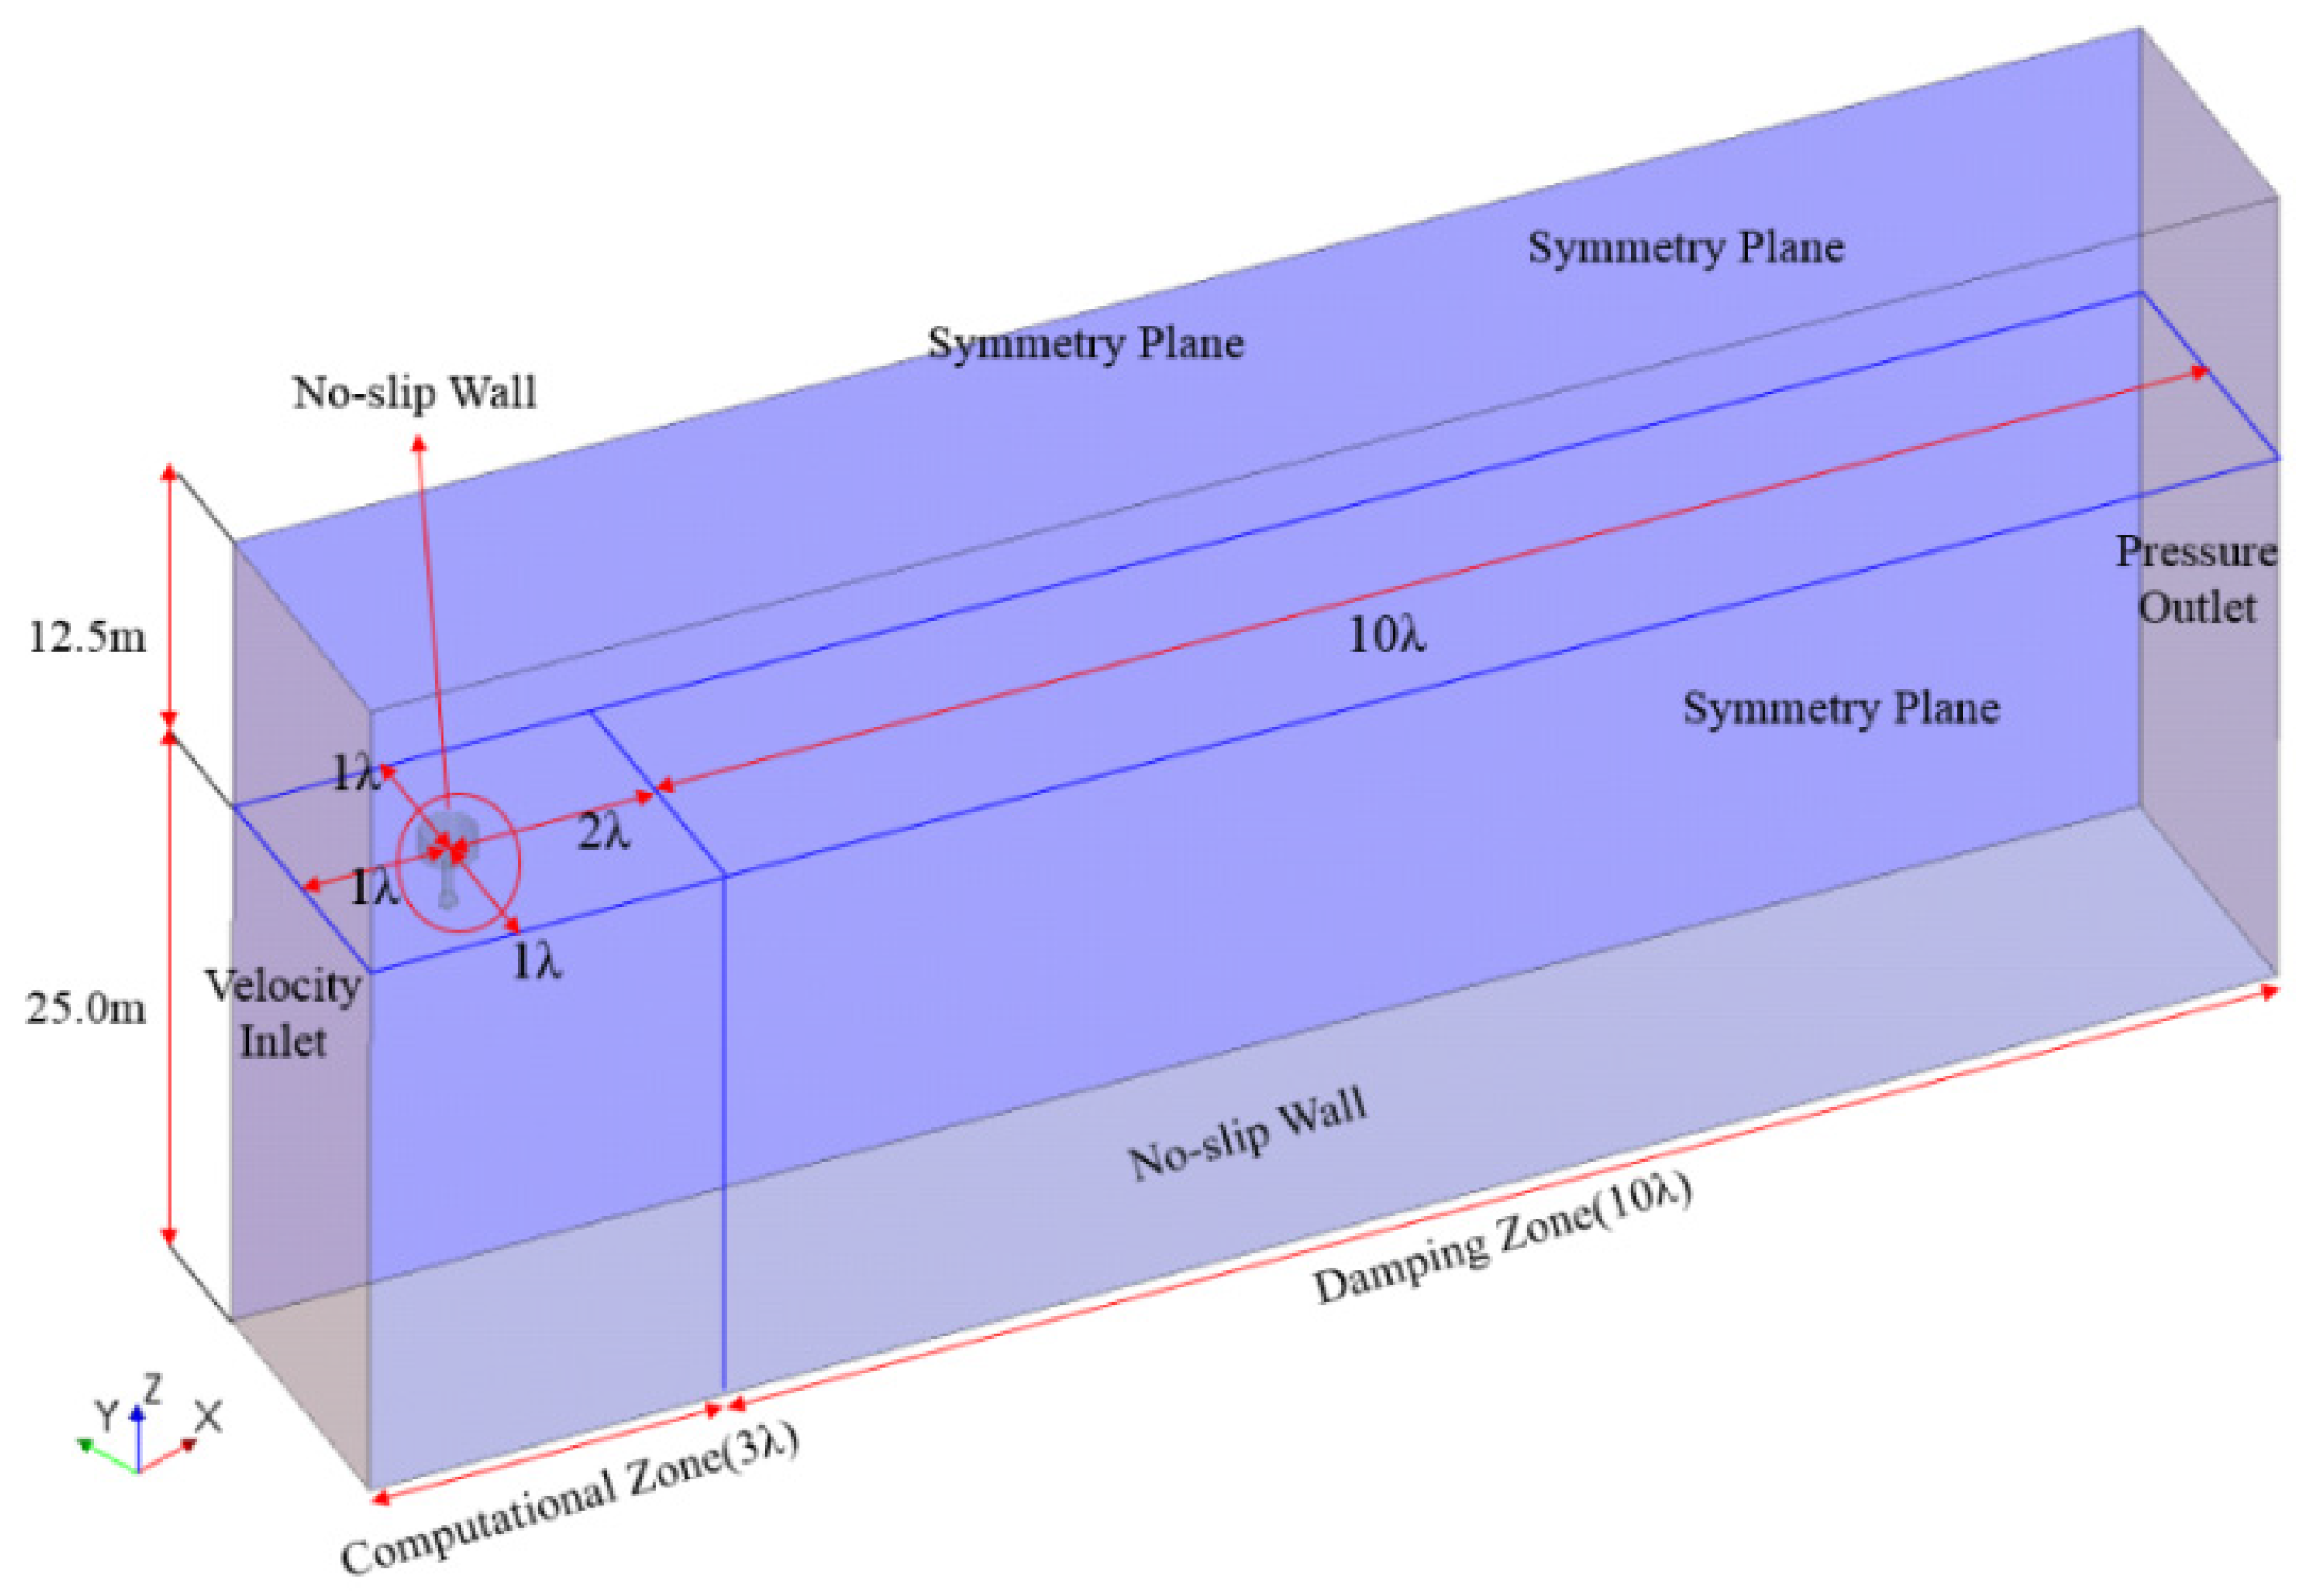
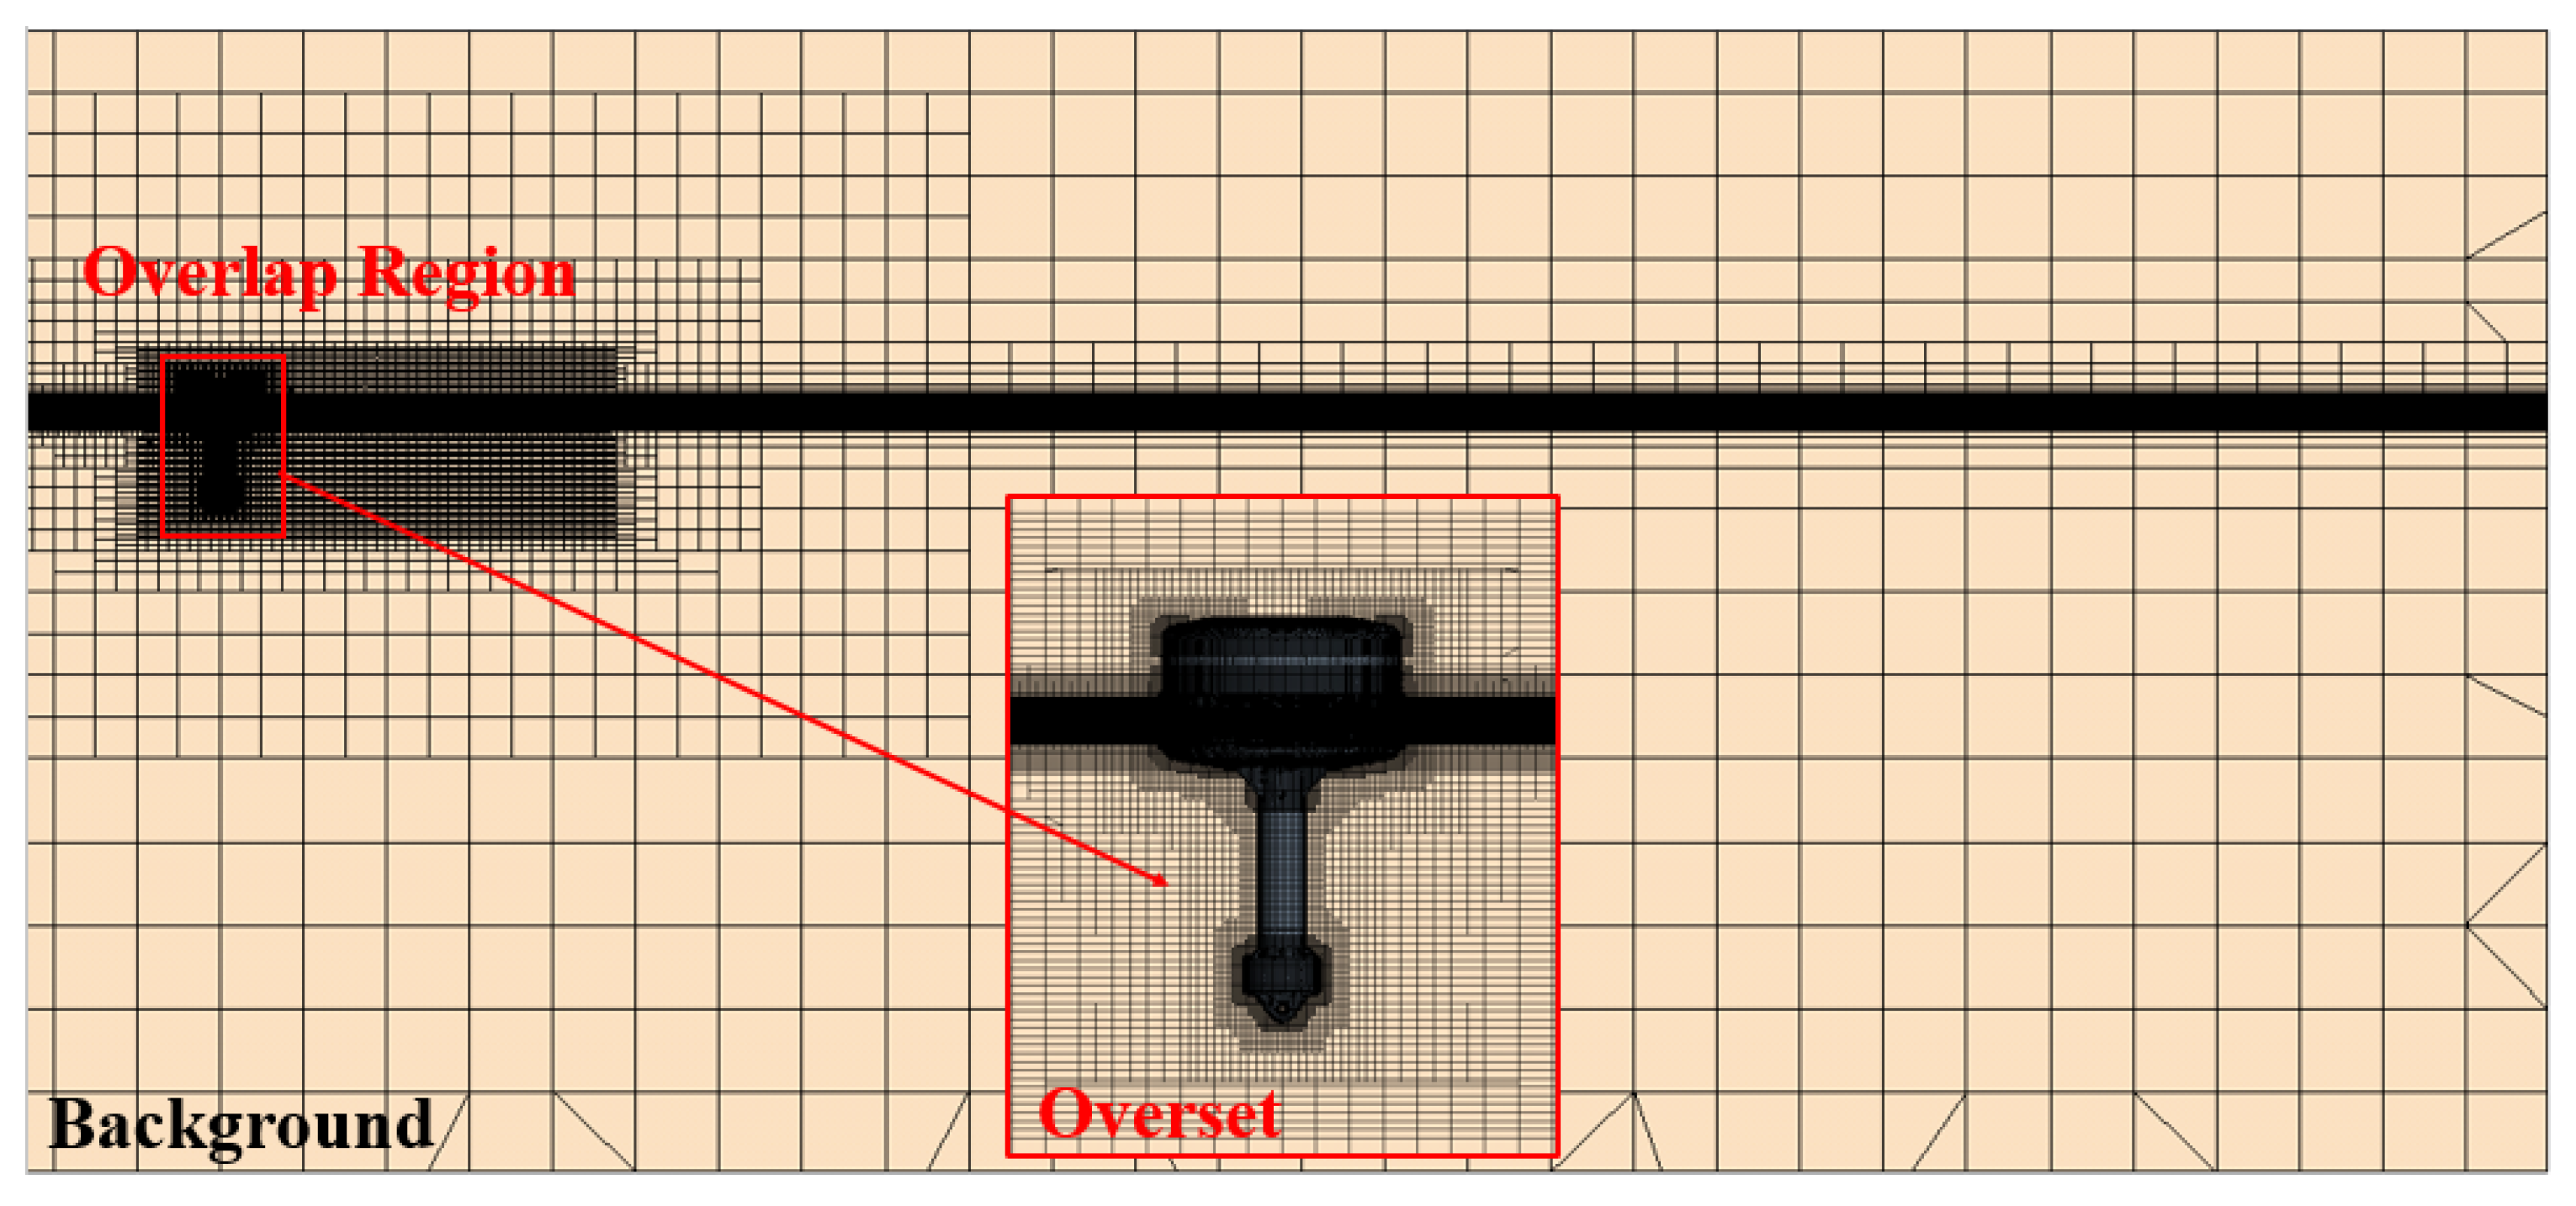
3.5.1. Computational Domain and Grid System
3.5.2. Regular Wave Conditions for Motion Analysis Using CFD
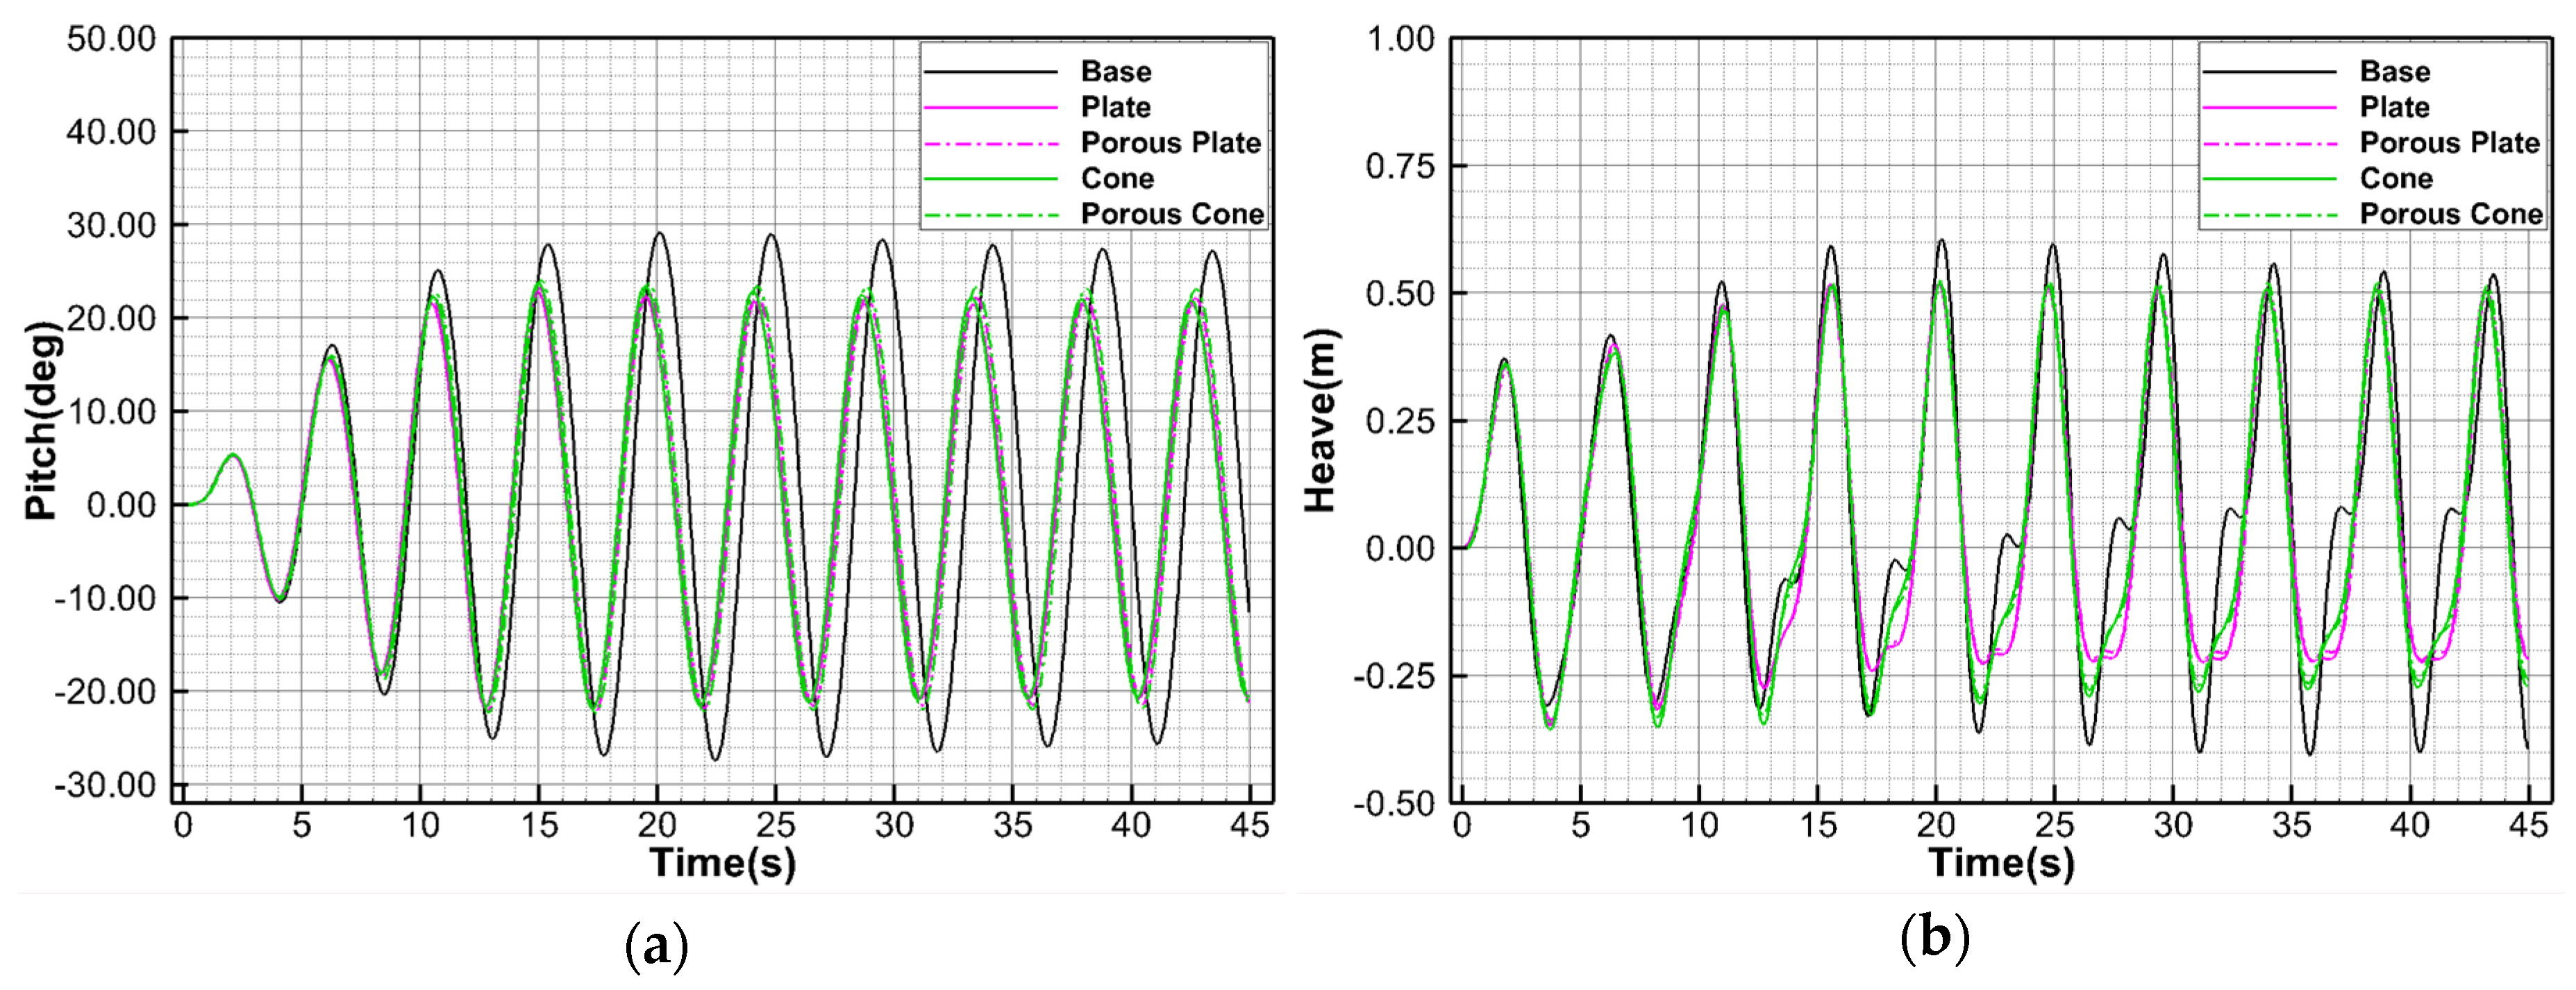
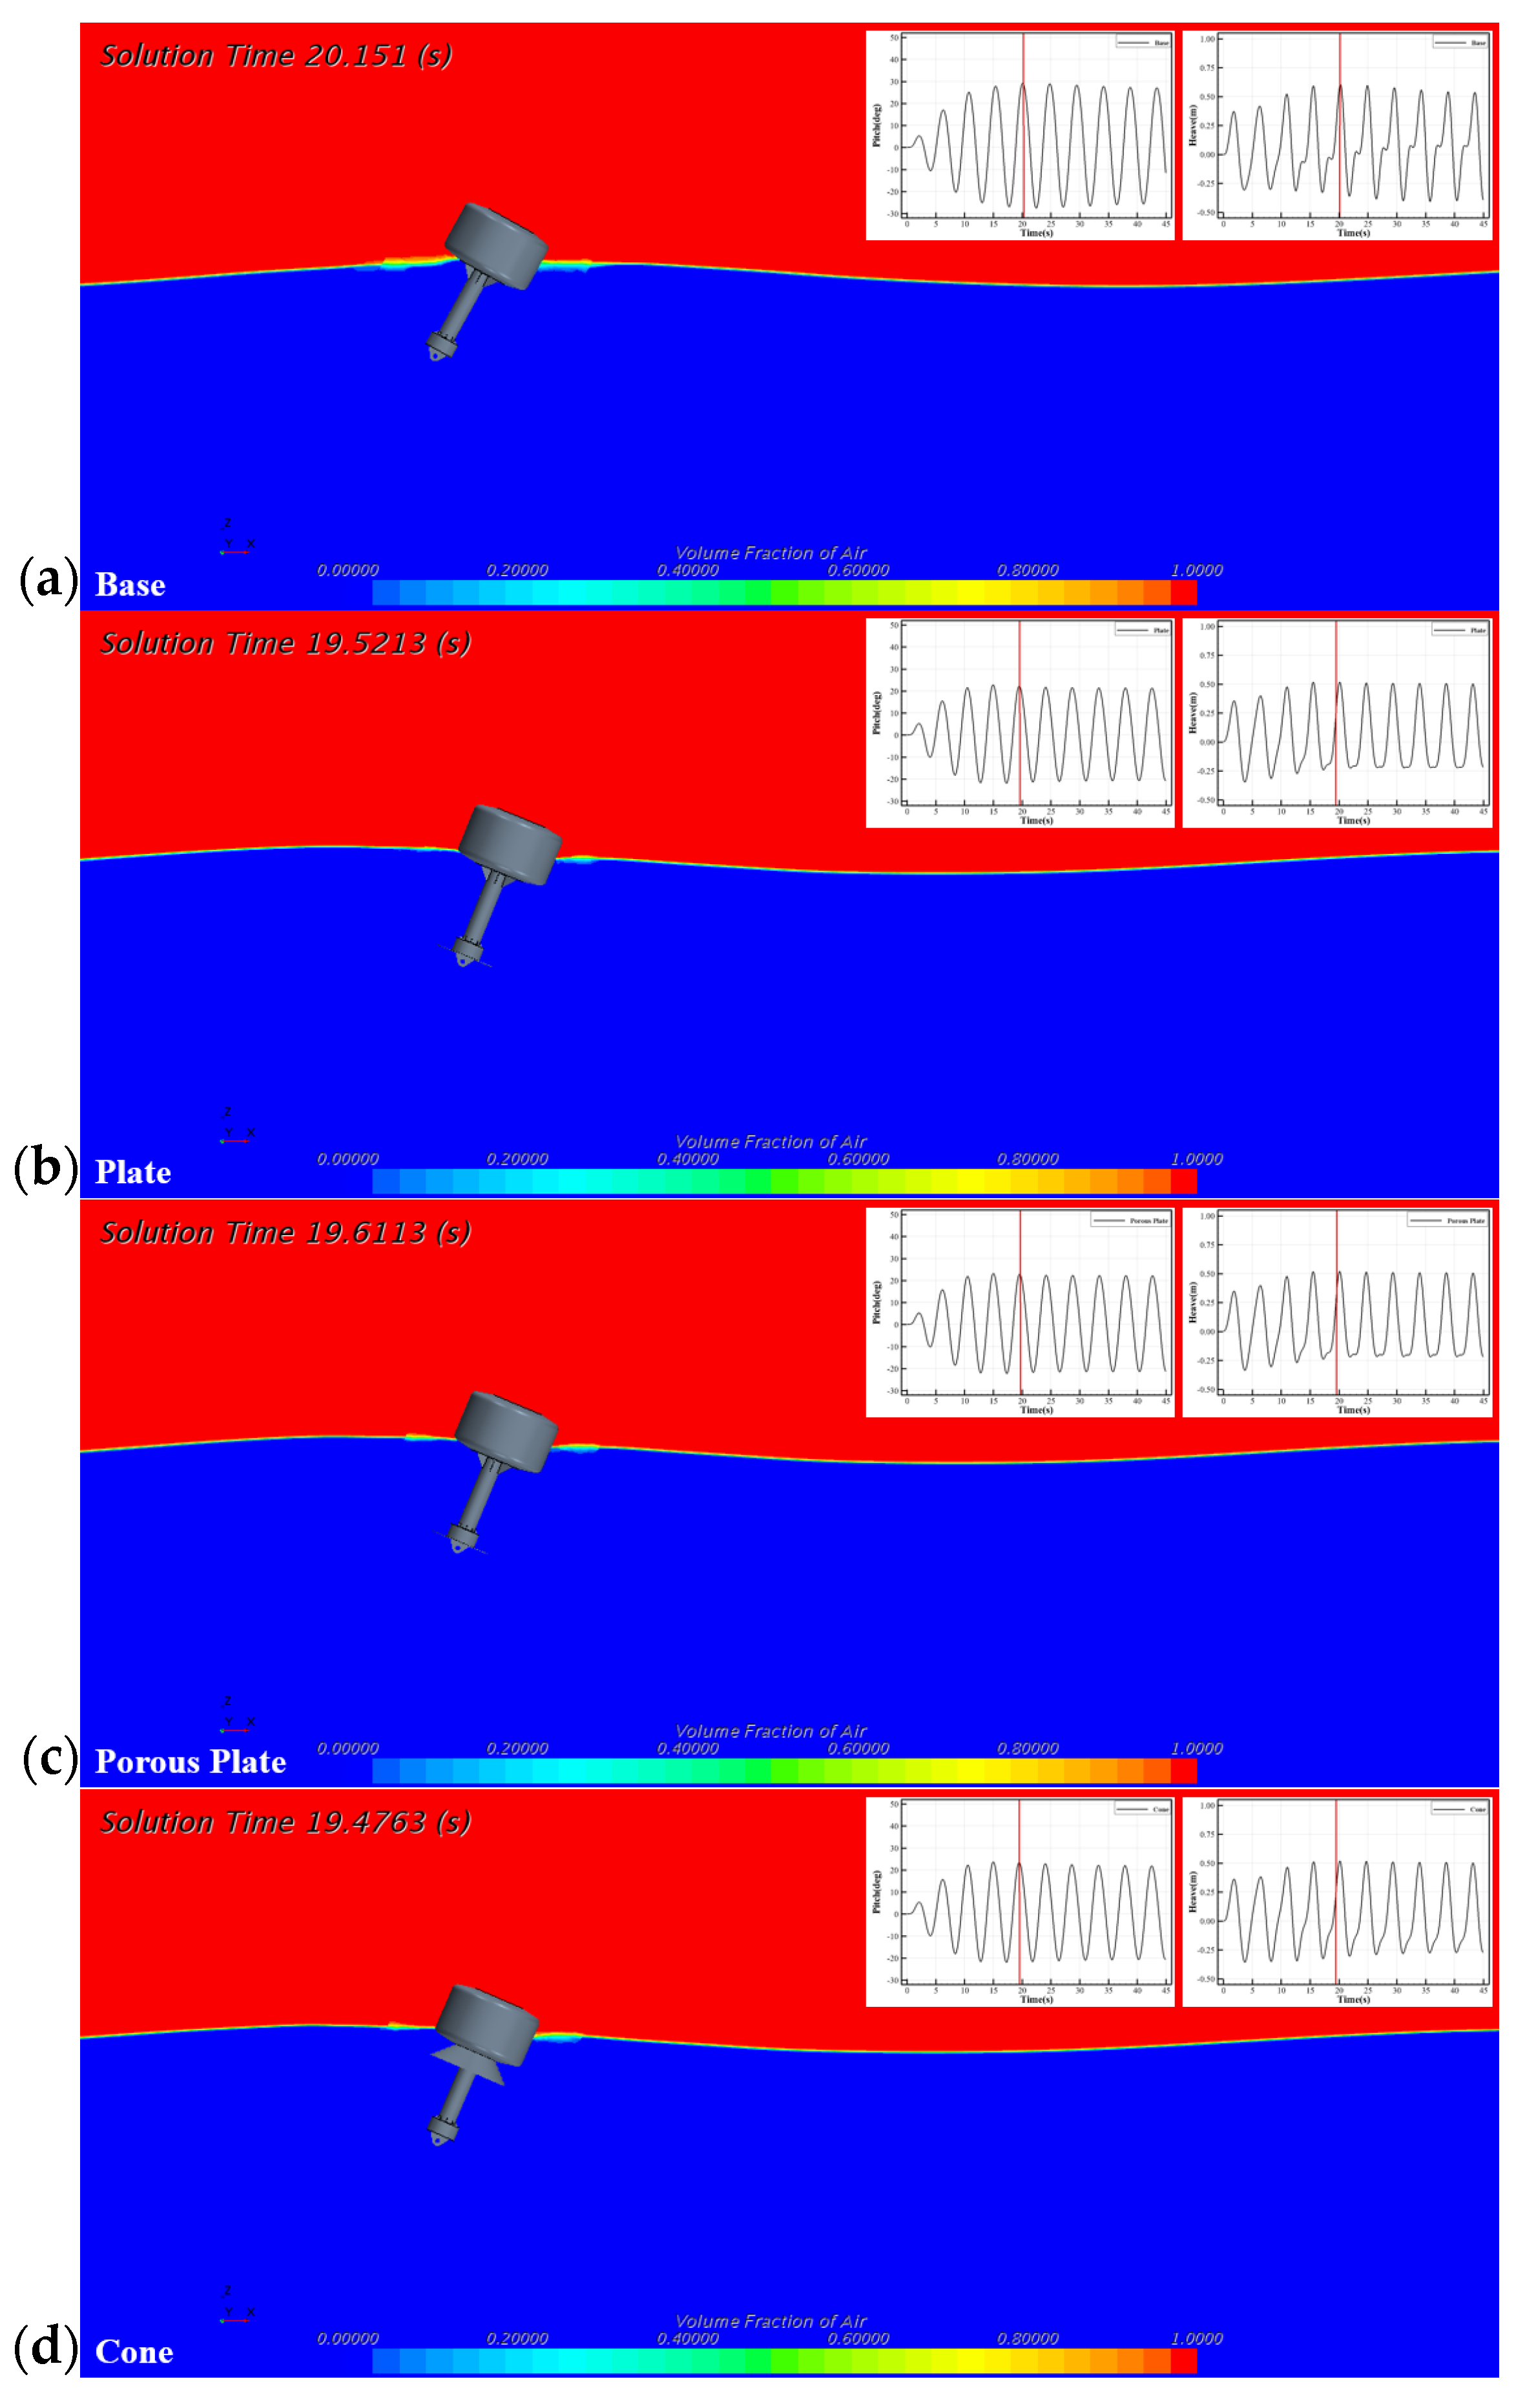
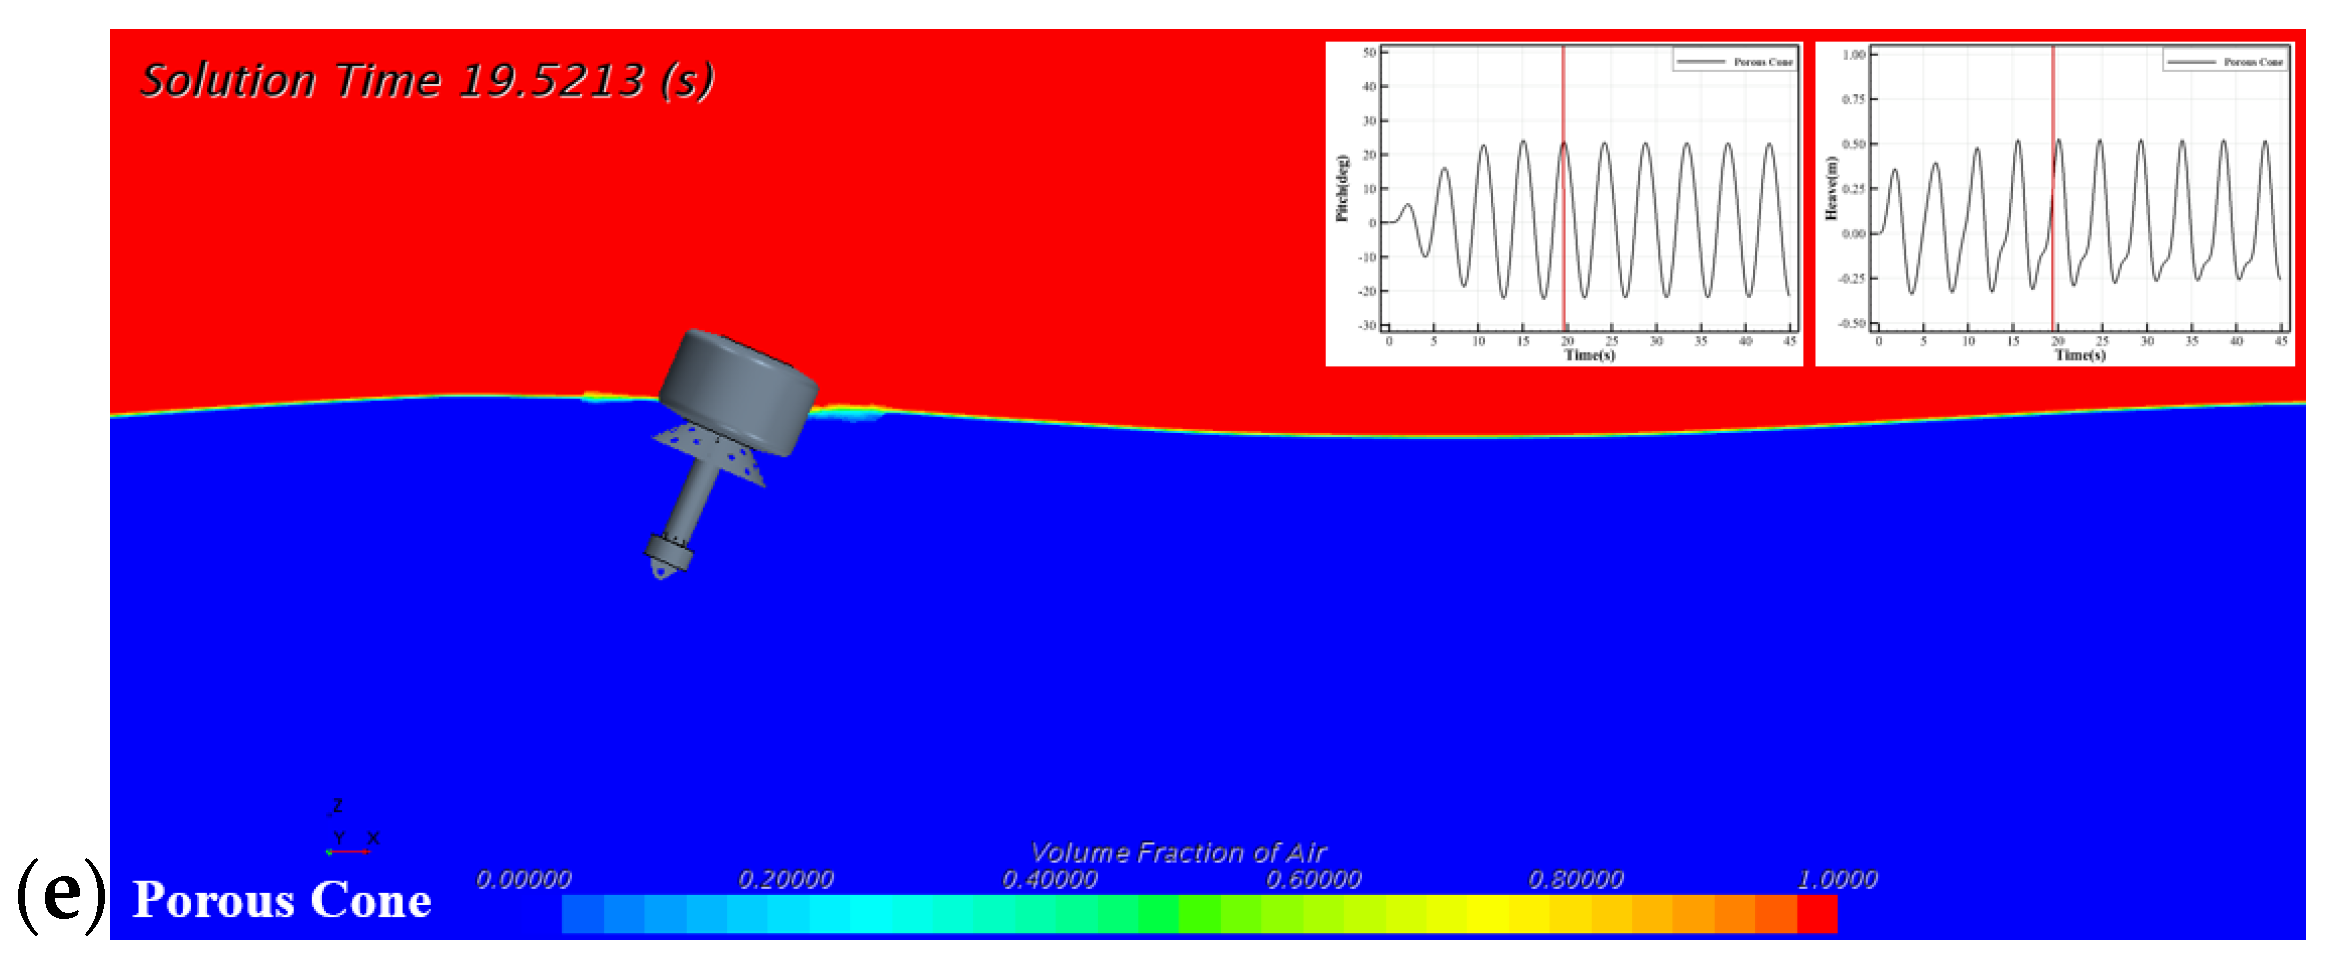
3.5.3. Results
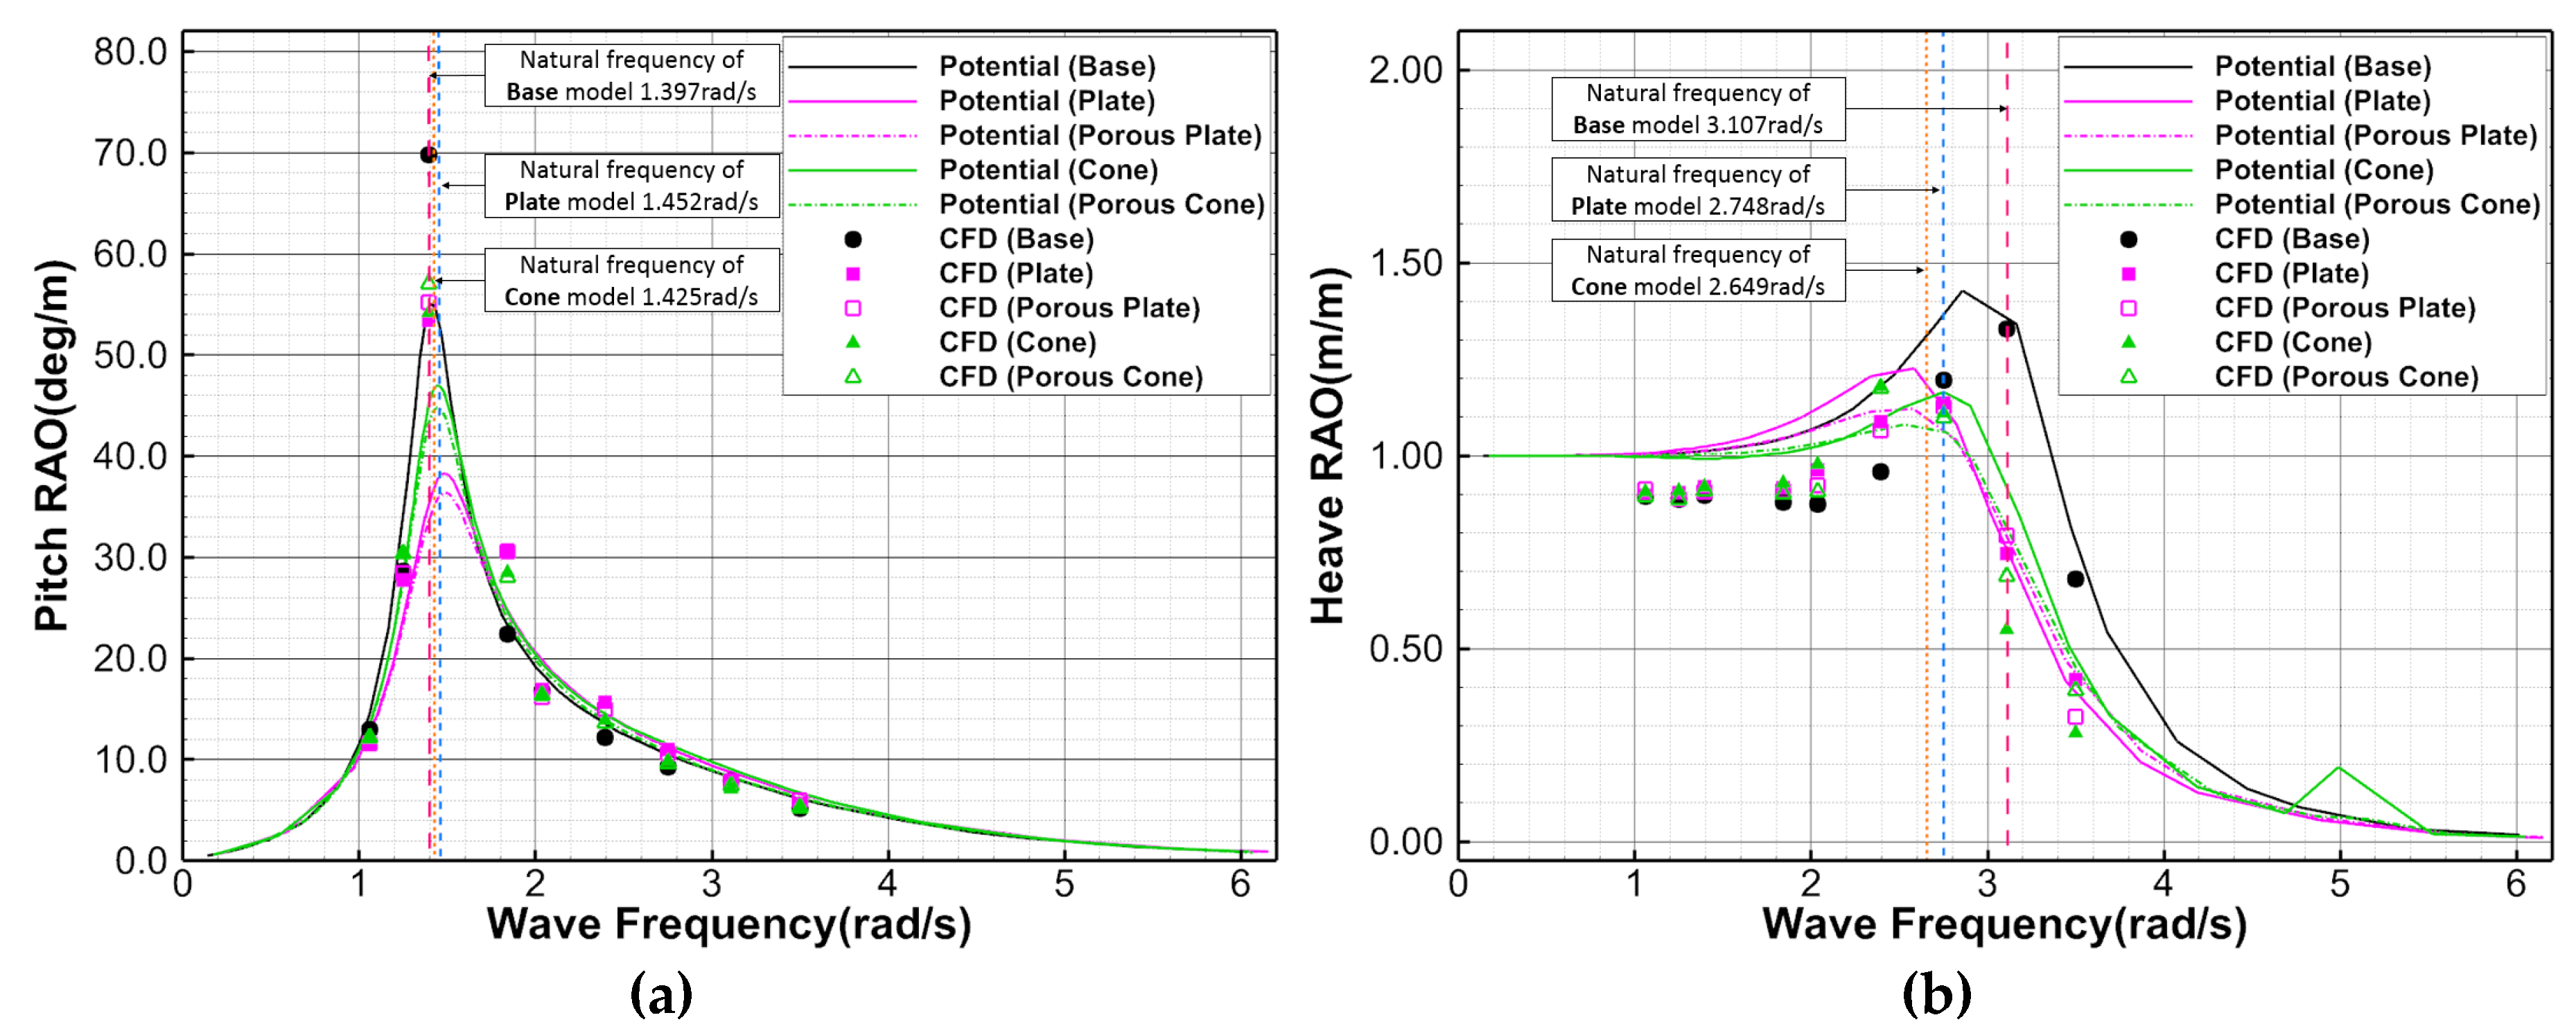
3.6. Comparison of RAOs between the Potential-Based Motion Analysis and CFD Simulations
4. Conclusions
Author Contributions
Funding
Conflicts of Interest
References
- Jeong, S.M.; Son, B.H.; Ko, S.W.; Park, S.H.; Jeong, D.S. Stability evaluation of light-buoys combined with 7 nautical mile self-contained lantern. In Proceedings of the Oceans-MTS/IEEE Kobe Techno-Oceans (OTO), Kobe, Japan, 28–31 May 2018. [Google Scholar]
- Son, B.H.; Ko, S.W.; Yang, J.H.; Jeong, S.M. Motion analysis of light buoys combined with 7 nautical mile self-contained lantern. J. Korean Soc. Mar. Environ. Saf. 2018, 24, 628–636. [Google Scholar] [CrossRef]
- Bhinder, M.A.; Murphy, J. Evaluation of the viscous drag for a domed cylindrical moored wave energy converter. J. Mar. Sci. Eng. 2019, 7, 120. [Google Scholar] [CrossRef] [Green Version]
- Kim, M.G.; Jung, K.H.; Park, S.B.; Suh, S.B.; Park, I.R.; Kim, J.; Kim, K.S. Experimental study on viscous effect in roll and heave motions of a rectangular structure. Ocean Eng. 2019, 171, 250–258. [Google Scholar] [CrossRef]
- Evans, D.V.; Jerey, D.C.; Salter, S.H.; Taylor, J.R.M. Submerged cylinder wave energy device: Theory and experiment. Appl. Ocean. Res. 1979, 1, 3–12. [Google Scholar] [CrossRef]
- Jung, K.H.; Chang, K.A.; Huang, E.T. Two-dimensional flow characteristics of wave interactions with a free-rolling rectangular structure. Ocean Eng. 2005, 32, 1–20. [Google Scholar] [CrossRef]
- Jung, K.H.; Chang, K.A.; Jo, H.J. Viscous effect on the roll motion of a rectangular structure. J. Eng. Mech. 2006, 132, 190–200. [Google Scholar] [CrossRef]
- Bhattacharyya, R. Dynamics of Marine Vehicles, 1st ed.; John Wiley & Sons Inc.: Hoboken, NJ, USA, 1978; pp. 75–80. [Google Scholar]
- Journée, J.M.J.; Massie, W.W. Offshore Hydromechanics; Lecture Notes; Delft University of Technology: Delft, The Netherlands, 2001. [Google Scholar]
- Wassermann, S.; Feder, D.F.; Abdel-Maksoud, M. Estimation of ship roll damping—A comparison of the decay and the harmonic excited roll motion technique for a post panamax container ship. Ocean Eng. 2016, 120, 371–382. [Google Scholar] [CrossRef]
- Wilson, R.V.; Carrica, P.M.; Stern, F. Unsteady rans method for ship motions with application to roll for a surface combatant. Comput. Fluids 2006, 35, 501–524. [Google Scholar] [CrossRef]
- Irkal, M.A.R.; Nallayarasu, S.; Bhattacharyya, S.K. Cfd approach to roll damping of ship with bilge keel with experimental validation. Appl. Ocean Res. 2016, 55, 1–17. [Google Scholar] [CrossRef]
- Song, S.S.; Kim, S.H.; Paik, K.J. Determination of linear and nonlinear roll damping coefficients of a ship section using CFD. Teorija i Praksa Brodogradnje i Pomorske Tehnike 2019, 70, 17–33. [Google Scholar] [CrossRef]
- Kianejad, S.S.; Lee, J.S.; Liu, Y.; Enshaei, H. Numerical assessment of roll motion characteristics and damping coefficient of a ship. J. Mar. Sci. Eng. 2018, 6, 101. [Google Scholar] [CrossRef] [Green Version]
- Zhang, X.; Zeng, Q.; Liu, Z. Hydrodynamic performance of rectangular heaving buoys for an integrated floating breakwater. J. Mar. Sci. Eng. 2019, 7, 239. [Google Scholar] [CrossRef] [Green Version]
- Luan, Z.; He, G.; Zhang, Z.; Jing, P.; Jin, R.; Geng, B.; Liu, C. Study on the optimal wave energy absorption power of a float in waves. J. Mar. Sci. Eng. 2019, 7, 269. [Google Scholar] [CrossRef] [Green Version]
- Mohapatra, S.C.; Islam, H.; Guedes Soares, C. Wave diffraction by a floating fixed truncated vertical cylinder based on Boussinesq equations. In Renewable Energy Offshore; Taylor & Francis: London, UK, 2019; pp. 281–289. [Google Scholar]
- Koh, H.J.; Cho, I.H. Heave motion response of a circular cylinder with the dual damping plates. Ocean Eng. 2016, 125, 95–102. [Google Scholar] [CrossRef]
- Tao, L.; Cai, S. Heave motion suppression of a spar with a heave plate. Ocean Eng. 2004, 31, 669–692. [Google Scholar] [CrossRef] [Green Version]
- Zhu, L.; Lim, H.C. Hydrodynamic characteristics of a separated heave plate mounted at a vertical circular cylinder. Ocean Eng. 2017, 131, 213–223. [Google Scholar] [CrossRef]
- Sudhakar, S.; Nallayarasu, S. Hydrodynamic responses of spar hull with single and double heave plates in random waves. Int. J. Ocean Syst. Eng. 2013, 4, 188–208. [Google Scholar] [CrossRef] [Green Version]
- Sudhakar, S.; Nallayarasu, S. Hydrodynamic response of spar with single and double heave plates in regular waves. Int. J. Ocean Syst. Eng. 2014, 4, 1–18. [Google Scholar] [CrossRef] [Green Version]
- Koh, H.J.; Kim, J.R.; Cho, I.H. Model test for heave motion reduction of a circular cylinder by a damping plate. J. Ocean. Eng. Tech. 2013, 27, 76–82. [Google Scholar] [CrossRef] [Green Version]
- Palm, J.; Eskilsson, C.; Paredes, G.M.; Bergdahl, L. Coupled mooring analysis for floating wave energy converters using cfd: Formulation and validation. Int. J. Mar. Energy 2016, 16, 83–99. [Google Scholar] [CrossRef] [Green Version]
- Lee, Y.G.; Kim, C.H.; Park, J.H.; Kim, H.; Lee, I.; Jin, B. Numerical simulations of added resistance in regular head waves on a container ship. Brodogradnja 2019, 70, 61–86. [Google Scholar] [CrossRef]
- Park, I.R.; Kim, J.I.; Suh, S.B.; Kim, J.; Kim, K.S.; Kim, Y.C. Numerical prediction of the powering performance of a car-Ferry in irregular waves for safe return to port (srtp). J. Ocean. Eng. Tech. 2019, 33, 1–9. [Google Scholar] [CrossRef] [Green Version]
- Kim, S.Y.; Kim, K.M.; Park, J.C.; Jeong, G.M.; Chun, H.H. Numerical simulation of wave and current interaction with a fixed offshore substructure. Int. J. Nav. Arch. Ocean 2016, 8, 187–197. [Google Scholar] [CrossRef] [Green Version]


| Models | Mass [kg] | Diameter of Buoyant Body [m] | Draft [m] | Center of Gravity [m] | Metacentric Height [m] | Mass Moment of Inertia [kg·m2] |
|---|---|---|---|---|---|---|
| Base | 2423 | 2.400 | 3.036 | 2.136 | 1.052 | 10,902 |
| Plate | 2596 | 3.073 | 2.009 | 1.144 | 11,490 | |
| Porous Plate | 2579 | 3.069 | 2.021 | 1.137 | 11,435 | |
| Cone | 2617 | 3.078 | 2.150 | 1.018 | 10,965 | |
| Porous Cone | 2597 | 3.073 | 2.149 | 1.021 | 10,958 |
| Pitch | Heave | |||
|---|---|---|---|---|
| [-] | [-] | |||
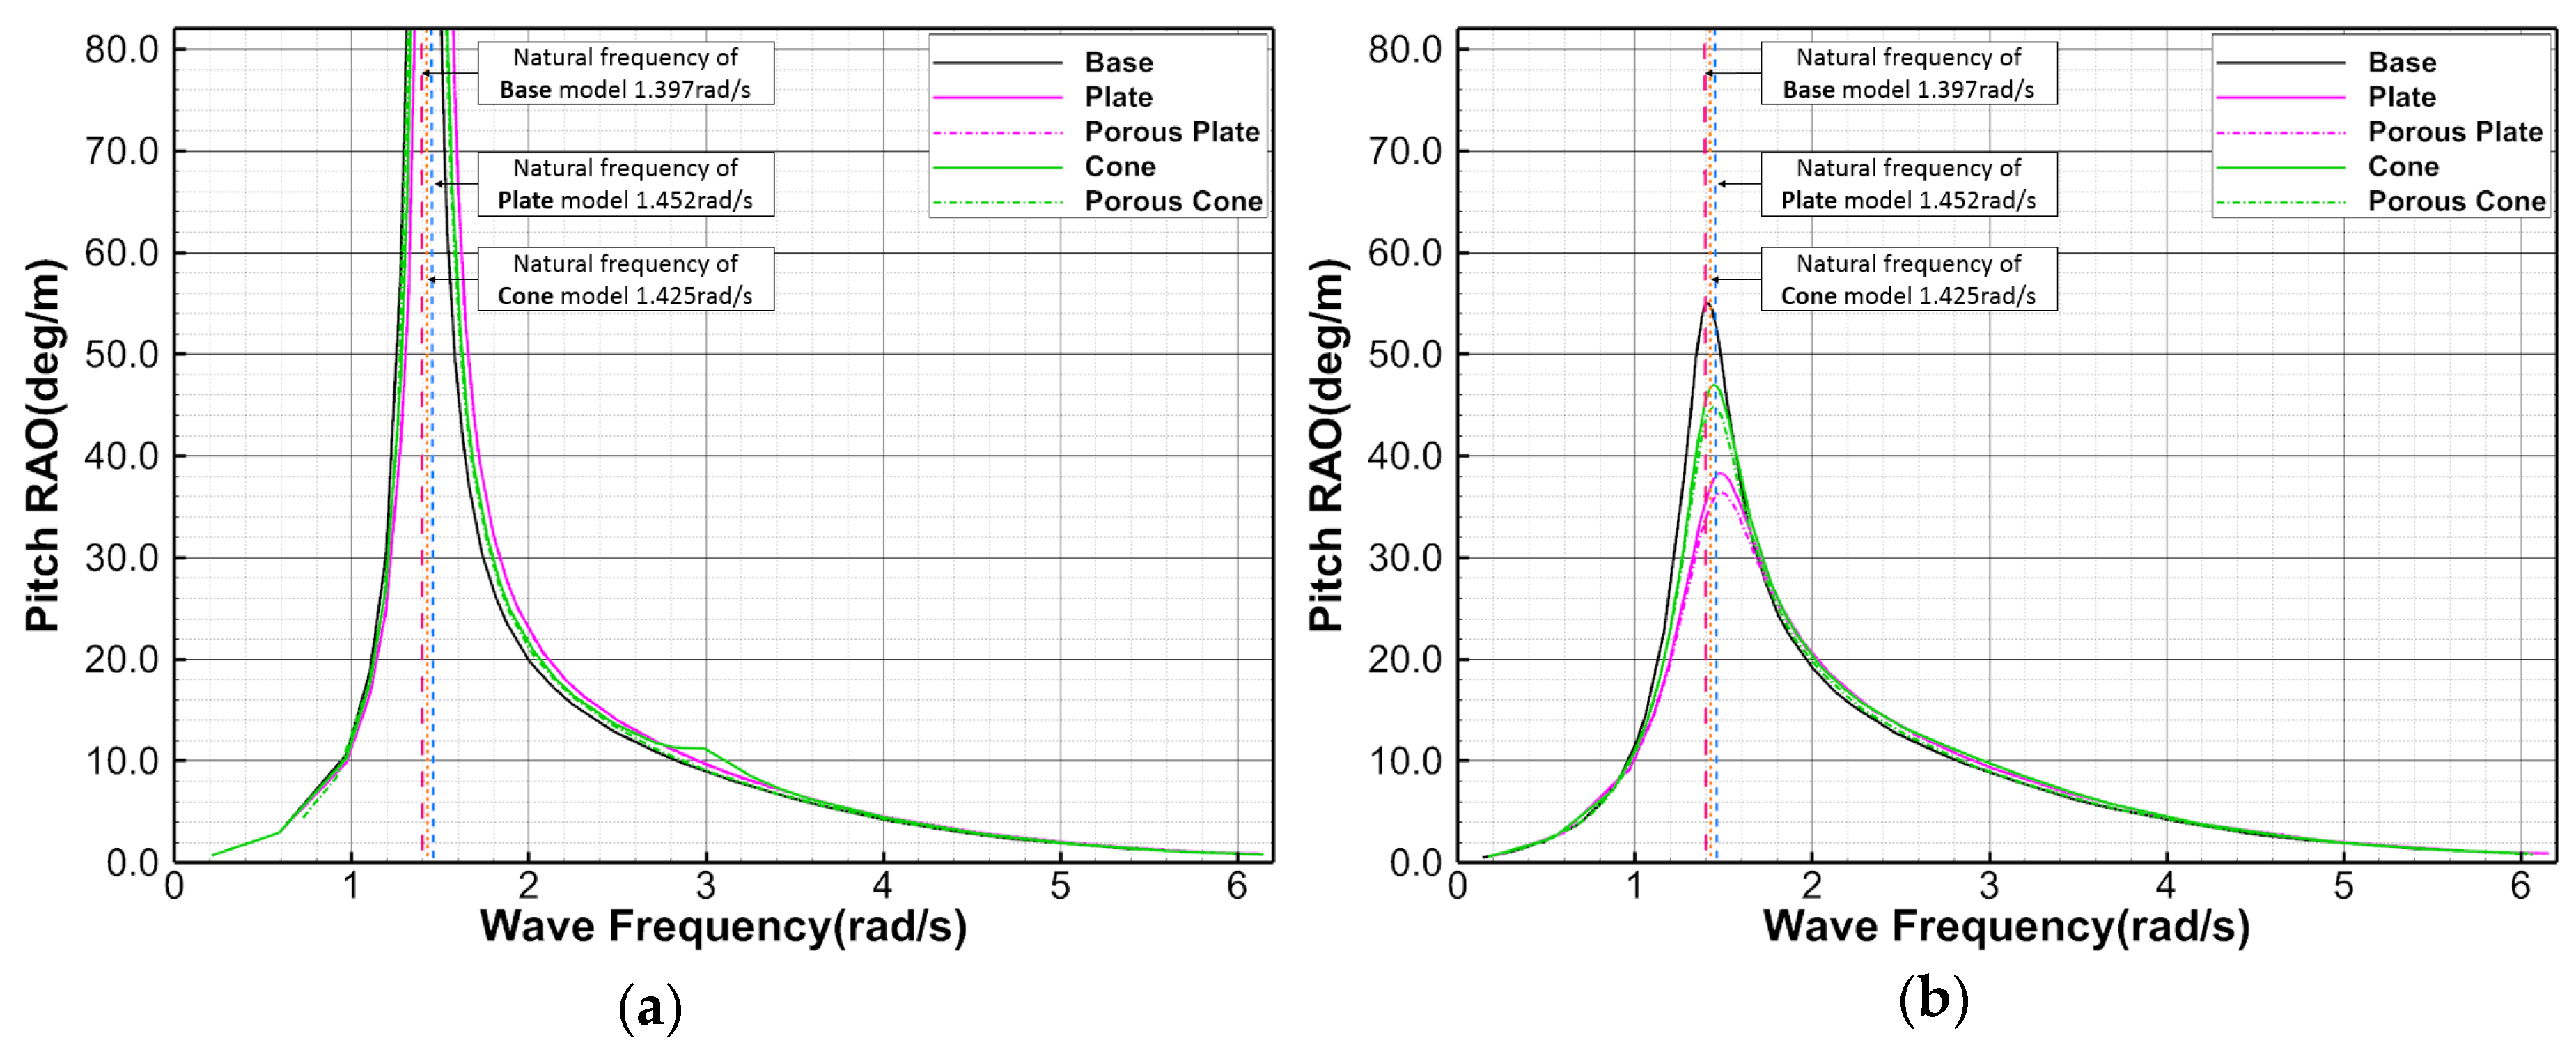
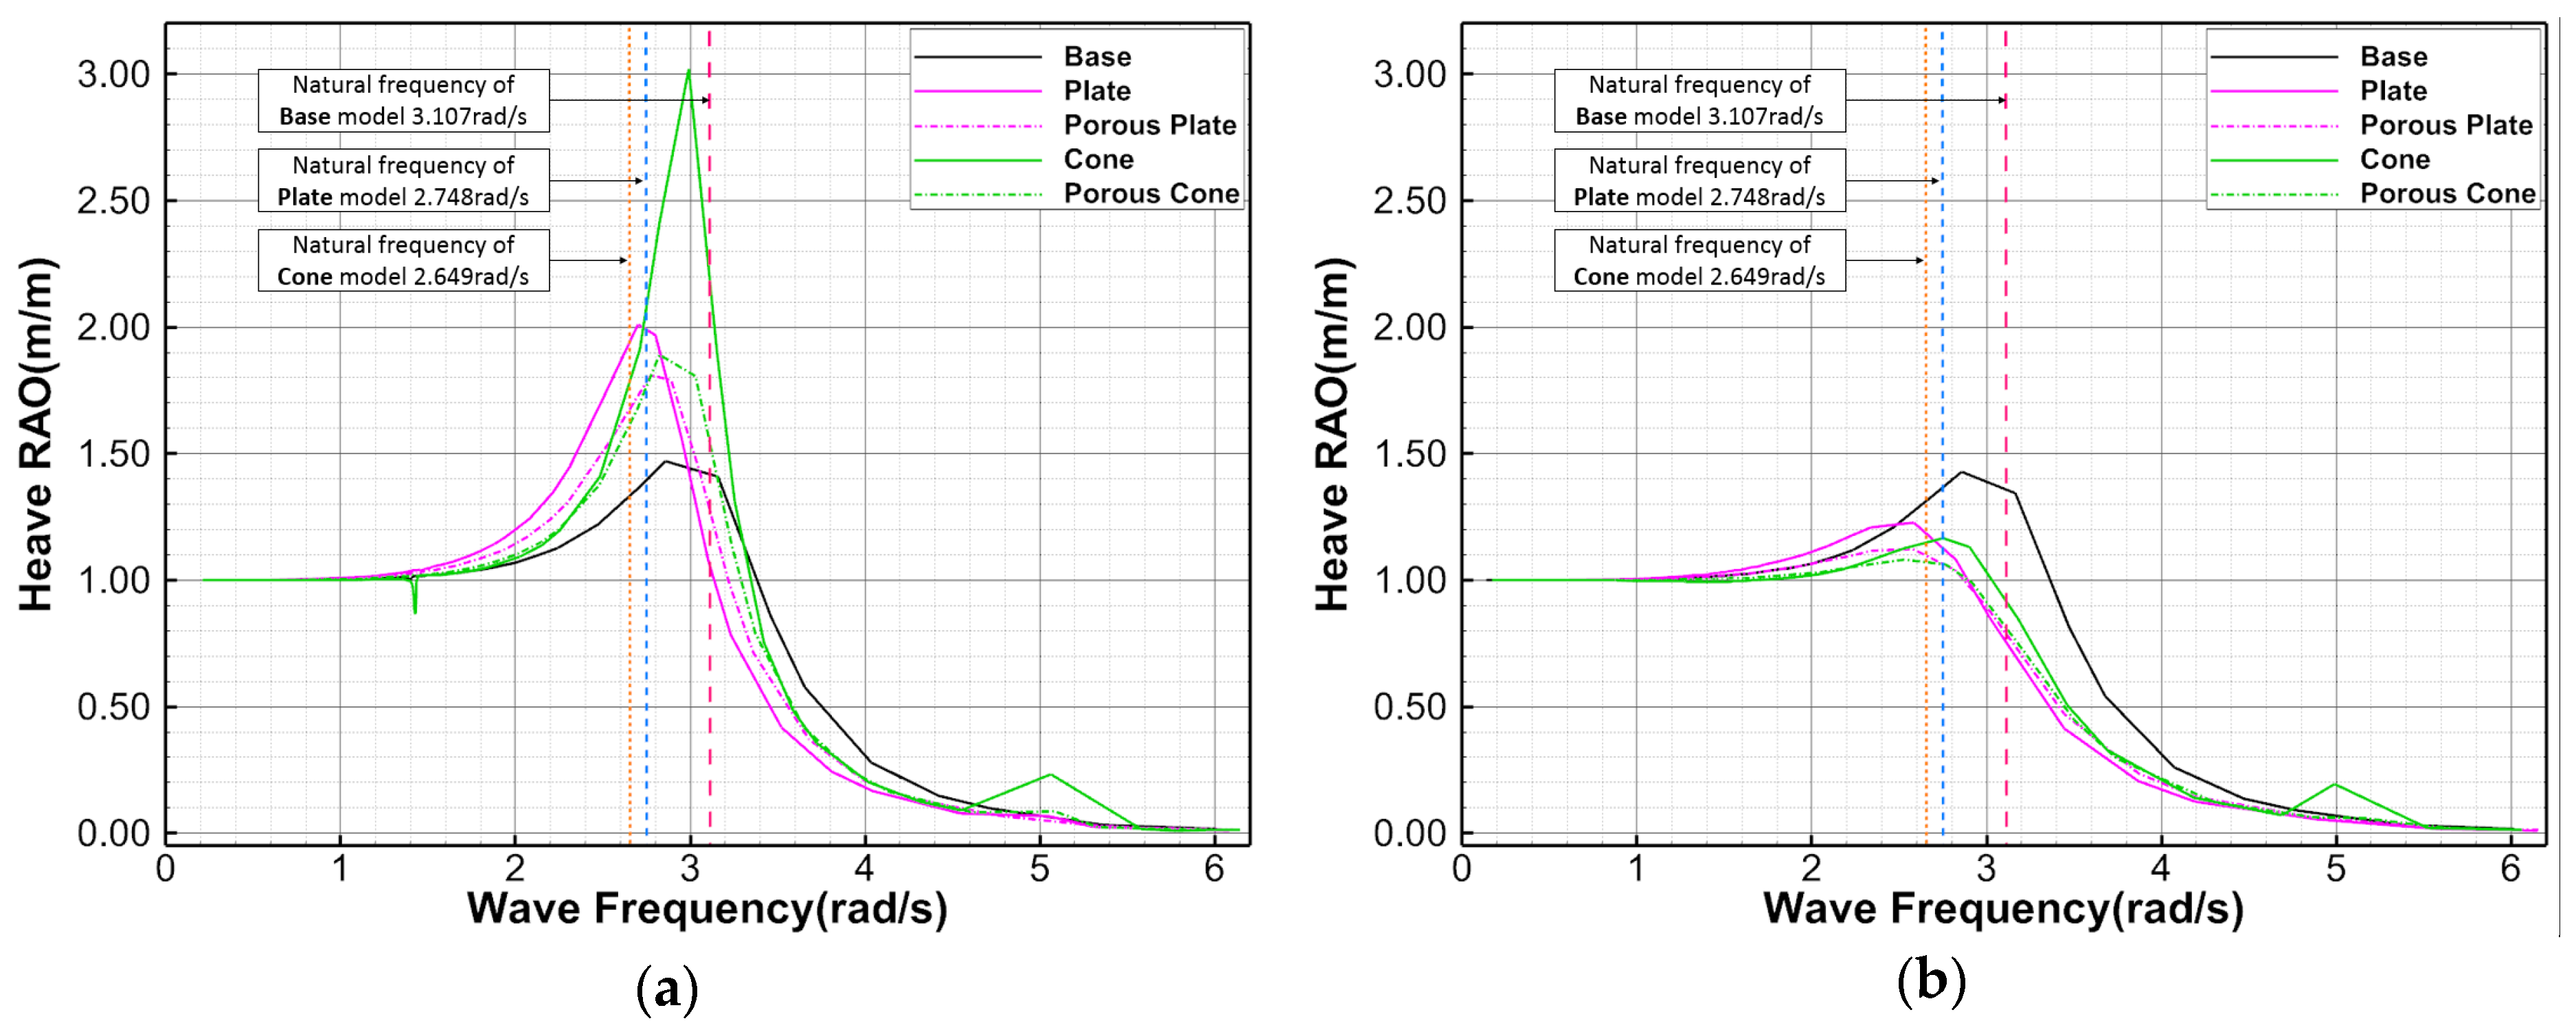
| Base | 0.0135 | 1.397 | 0.1107 | 3.107 |
| Plate | 0.0209 | 1.452 | 0.1550 | 2.748 |
| Porous Plate | 0.0219 | 1.447 | 0.1660 | 2.813 |
| Cone | 0.0167 | 1.425 | 0.1344 | 2.649 |
| Porous Cone | 0.0172 | 1.418 | 0.1587 | 2.795 |
| [-] | |||||
|---|---|---|---|---|---|
| Base | 1968 | 12,876 | 63.359 | 0.488 | 0.9924 |
| Plate | 2435 | 13,936 | 109.952 | 0.884 | 0.9920 |
| Porous Plate | 2556 | 14,002 | 114.261 | 0.842 | 0.9927 |
| Cone | 2145 | 13,121 | 80.067 | 0.656 | 0.9919 |
| Porous Cone | 2116 | 13,084 | 82.690 | 0.610 | 0.9927 |
| [-] | |||||
|---|---|---|---|---|---|
| Base | 2254 | 4677 | 136 | 3107 | 0.0419 |
| Plate | 2874 | 5470 | 2243 | 2890 | 0.4368 |
| Porous Plate | 3166 | 5745 | 2387 | 2987 | 0.4441 |
| Cone | 2549 | 5166 | 2907 | 1710 | 0.6295 |
| Porous Cone | 2609 | 5206 | 2570 | 2600 | 0.4970 |
| Wave Steepness [-] | Wave Frequency, | Wave Period, T [s] | Wave Length, [m] | Wave Height, [m] | Remark |
|---|---|---|---|---|---|
| 1/40 | 1.247 | 5.039 | 39.638 | 0.996 | |
| 1.397 | 4.498 | 31.583 | 0.794 | Pitch natural frequency (Base) | |
| 1.843 | 3.409 | 18.147 | 0.456 | ||
| 2.039 | 3.082 | 14.826 | 0.373 | ||
| 2.395 | 2.623 | 10.746 | 0.270 | ||
| 2.751 | 2.284 | 8.145 | 0.205 | ||
| 3.107 | 2.022 | 6.385 | 0.160 | Heave natural frequency (Base) | |
| 3.500 | 1.795 | 5.032 | 0.126 |
| Models | Maximum of pitch RAO [deg/m] | Maximum of Heave RAO [m/m] | ||||
|---|---|---|---|---|---|---|
| Potential | CFD | Remark | Potential | CFD | Remark | |
| Base | 54.841 | 69.743 | pitch natural frequency of Base model | 1.357 | 1.327 | heave natural frequency of Base model |
| Plate | 35.366 | 53.441 | 0.760 | 0.746 | ||
| Porous Plate | 33.736 | 55.230 | 0.790 | 0.793 | ||
| Cone | 45.211 | 54.222 | 0.920 | 0.549 | ||
| Porous Cone | 43.381 | 57.069 | 0.815 | 0.688 | ||
© 2020 by the authors. Licensee MDPI, Basel, Switzerland. This article is an open access article distributed under the terms and conditions of the Creative Commons Attribution (CC BY) license (http://creativecommons.org/licenses/by/4.0/).
Share and Cite
Jeong, S.-M.; Son, B.-H.; Lee, C.-Y. Estimation of the Motion Performance of a Light Buoy Adopting Ecofriendly and Lightweight Materials in Waves. J. Mar. Sci. Eng. 2020, 8, 139. https://doi.org/10.3390/jmse8020139
Jeong S-M, Son B-H, Lee C-Y. Estimation of the Motion Performance of a Light Buoy Adopting Ecofriendly and Lightweight Materials in Waves. Journal of Marine Science and Engineering. 2020; 8(2):139. https://doi.org/10.3390/jmse8020139
Chicago/Turabian StyleJeong, Se-Min, Bo-Hun Son, and Chang-Yull Lee. 2020. "Estimation of the Motion Performance of a Light Buoy Adopting Ecofriendly and Lightweight Materials in Waves" Journal of Marine Science and Engineering 8, no. 2: 139. https://doi.org/10.3390/jmse8020139