Article

Extracting Typhoon Disaster Information from VGI Based on Machine Learning

1
School of Geodesy and Geomatics, Wuhan University, Wuhan 430000, China
2
Faculty of Science, Agriculture, and Engineering, Newcastle University in Singapore, Singapore 567739, Singapore
*
Author to whom correspondence should be addressed.
J. Mar. Sci. Eng. 2019, 7(9), 318; https://doi.org/10.3390/jmse7090318
Submission received: 20 August 2019 / Revised: 7 September 2019 / Accepted: 9 September 2019 / Published: 12 September 2019
(This article belongs to the Special Issue Intelligent Marine Robotics Modelling, Simulation and Applications)

Abstract

:
The southeastern coast of China suffers many typhoon disasters every year, causing huge casualties and economic losses. In addition, collecting statistics on typhoon disaster situations is hard work for the government. At the same time, near-real-time disaster-related information can be obtained on developed social media platforms like Twitter and Weibo. Many cases have proved that citizens are able to organize themselves promptly on the spot, and begin to share disaster information when a disaster strikes, producing massive VGI (volunteered geographic information) about the disaster situation, which could be valuable for disaster response if this VGI could be exploited efficiently and properly. However, this social media information has features such as large quantity, high noise, and unofficial modes of expression that make it difficult to obtain useful information. In order to solve this problem, we first designed a new classification system based on the characteristics of social medial data like Sina Weibo data, and made a microblogging dataset of typhoon damage with according category labels. Secondly, we used this social medial dataset to train the deep learning model, and constructed a typhoon disaster mining model based on a deep learning network, which could automatically extract information about the disaster situation. The model is different from the general classification system in that it automatically selected microblogs related to disasters from a large number of microblog data, and further subdivided them into different types of disasters to facilitate subsequent emergency response and loss estimation. The advantages of the model included a wide application range, high reliability, strong pertinence and fast speed. The research results of this thesis provide a new approach to typhoon disaster assessment in the southeastern coastal areas of China, and provide the necessary information for the authoritative information acquisition channel.

1. Introduction

1.1. Background

Volunteer geographic information [1], which is also interpreted by domestic scholars as “spontaneous geographic information” [2], is similar to neogeography [3], or crowd sourcing geographic data [4,5], which refers to the phenomenon of public participation in contributing geographic information data [6] and is an important feature of “new geography” [3]. There are many VGI data sources, including both structured spatial data platforms (such as Open Street Map, or OSM for short) and unstructured social network data platforms with explicit or implicit location information (such as Twitter, Facebook, Sina Weibo, Tencent Weibo, etc.). Due to the characteristics of instantaneity and interaction of VGI, VGI played an important role in the “4.20” Lushan strong earthquake, the Haiti earthquake, and the Philippines typhoon Haiyan in 2012. The VGI played an important role that could not be achieved by traditional methods from disaster awareness, information identification, and information classification to disaster determination [7,8,9].
The southeastern coast of China is struck by typhoons every year. Secondary disasters caused by typhoons, such as heavy rainfall, storms, floods, debris flows, and landslides have a great impact on the eastern part of China [10]. During and after typhoon disasters, the relevant media track and report, and the affected people also interact with the typhoon-related information through various social networks (such as Weibo). According to the data, since 2012, during the period of each typhoon with a serious impact, the netizens in the affected areas published more than 100,000 microblog messages, including locations, winds, rainfalls, secondary disasters, rescue, and other related disaster information, with strong instantaneity and interaction. Compared to the disadvantages of using traditional means to obtain updates on the disaster situation during typhoon disasters, it is of great significance to use VGI to assist typhoon disaster situation assessment. In view of this, this paper established a classification system that meets the needs of typhoon emergency response based on the characteristics of microblog data, and constructed a generic typhoon disaster information automatic acquisition model using a neural network method. The model can automatically select microblogs related to disasters from a large number of microblog messages, and further subdivide them into different types of disasters, which is different from the general classification system, so as to facilitate subsequent emergency response and loss estimation. The advantages of the model included a wide application range, high reliability, strong pertinence, and fast speed.

1.2. Analysis of Existing Studies

Generally speaking, there are three ways to use social media [11]. One is to regard social media as a huge sensor through which we can collect a lot of information [12] about typhoon disasters. The difficulty lies in that the sensor is too sensitive. It not only collects information about the typhoon disaster, but also contains a lot of irrelevant information. And author et al. [13,14] mainly discussed how to extract effective information. The second is to make full use of the social media’s communication function. Emergency agencies use social media to publish corresponding emergency messages so that they can be received by the people who really need them, as it may be difficult to receive such information in time through other channels [15,16]. Thirdly, the analysis tools of social media, such as hot spot analysis, can be used to analyze the characteristics of the disaster [17].
From the perspective of research methods, many studies have focused on classifying and visualizing social media data in the order of pre-disaster, disaster, and post-disaster to verify the relationship between the number of tweets and the disaster process [11,18]. We implemented an algorithm based on K nearest neighbor (KNN) for extracting information from VGI which resulted in about 70% of microblogs classified correctly [19], which was not enough. A further approach used is to verify the coincidence of the typhoon trajectory and the number of tweets in conjunction with their time and location [13,20,21,22]. To date, not much research has been done to further analyze each twitter’s contents, and most studies have stayed at statistical analysis of the amount of data from a specific time or place, as described above. Clearly, the extraction of social media data is still a difficult point for researchers. Nevertheless, some papers have analyzed social media content, although the analysis has mainly stayed at the level of sentiment analysis, using SVM [20]. Although this is also an exploration, objectively speaking, staying at the level of sentiment analysis has had little effect on the emergency response. On the contrary, some studies have used relatively unique methods to carry out research which has been of great significance for reference, such as forecasting the areas of power outages caused by typhoon impact [23], and the idea of weighting different emergency strategies with social media information to ensure multi-sectoral collaboration [15]. Author et al. [24] focused on identifying informative tweets posted during disasters, naive Bayesian classifier and the classification model based on neural network were designed respectively, and their classification effects were compared. The results showed that the deep neural network, especially Convolutional Neural Network (CNN), were more effective in identifying informative tweets.
To sum up, there is great potential in the study of the application of social media data in typhoon emergency response. Nevertheless, its research is still in the exploratory stage, and there is no optimal method that can be consistently applied. To date, most research is still at a relatively superficial stage, and few papers have focused on deeper mining, and this is the main work of our study. In addition, the lack of a unified dataset and classification method is also a major problem hindering this research. Some researchers have attempted this work abroad [11,25,26], but it has not yet been seen in China. Therefore, the classification strategy used with the microblog data and the convolutional neural network used to classify the microblog data one by one are both somewhat original, and the classification effect was able to reach a good level. The specific classification results may have a great effect on subsequent emergency work.

2. Methodology

This paper first studied the characteristics of Weibo data related to typhoon disasters, and then established a classification system of typhoon disaster information which met the characteristics of Weibo data. On this basis, we established the corresponding dataset. Following the general process of text classification using a neural network [27], the model’s construction and the training process were then completed. Finally, the model was verified by the verification set to verify the effect of the model. The final result was an extraction model able to gather typhoon disaster information from Weibo data, and the model also fit other typhoons well.

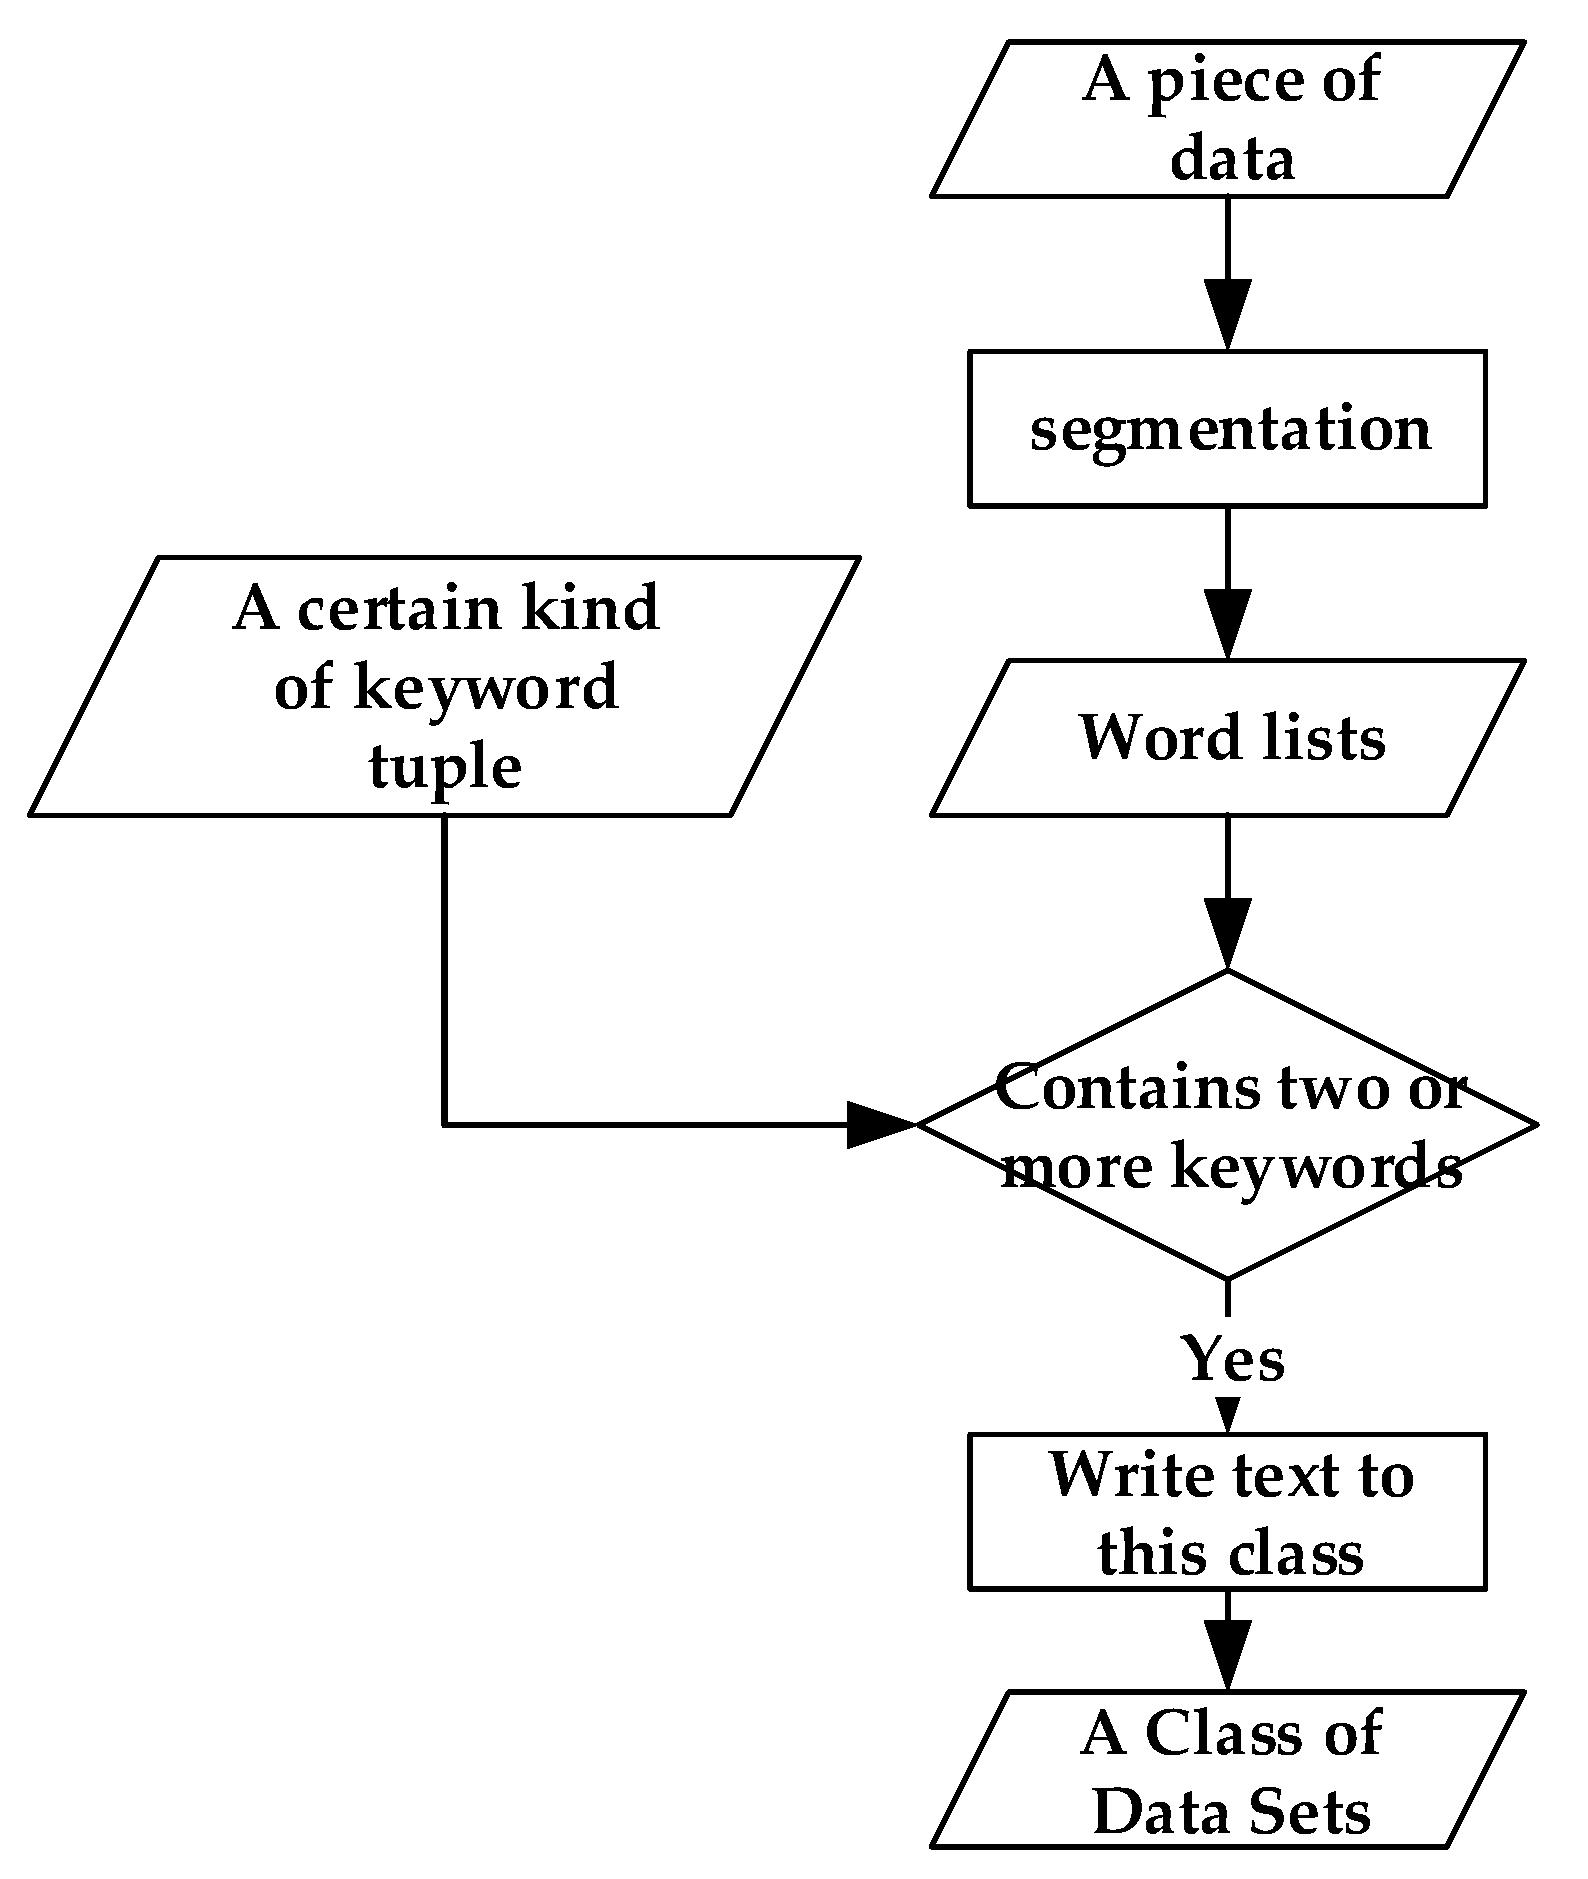
2.1. Design of Classification

Sina Weibo is an important source of typhoon disaster information, but as a public social platform, it contains a lot of useless information; even the useful information is generally lacking in professionalism and pertinence. Therefore, it was necessary to design a suitable classification method, which would not only separate the useful information from the useless information, but more importantly, link the colloquial expression about the disaster with the disaster situation. If the word description of the classification system was too professional, it might have collected little or no disaster information. For example, when marine fisheries are damaged, there are specific categories like aquaculture affected area, aquaculture disaster area, aquaculture ruin area, etc. It is conceivable that the possibility of such professional terminology appearing in Sina Weibo is extremely low. However, if the classification design is too casual, then the value of the collected data will be debatable. After reading and analyzing a certain amount of Weibo information, and considering it comprehensively, this paper divided the Weibo disaster information into the following categories:
  • Building: Weibo content mainly describing damage to buildings, such as water flooding into the house, buildings destroyed, billboards blown off, etc;
  • Green plants: Weibo content mainly describing damage to trees, green belts, etc. in the city;
  • Transportation: Weibo content mainly describing road flooding caused by the typhoon, poor traffic, etc.;
  • Water and electricity: Weibo content mainly describing water being cut off and power cuts caused by typhoons;
  • Other: Data related to typhoon disaster information, but not explicitly related to the above categories;
  • Useless: Data that were not related to the above categories.

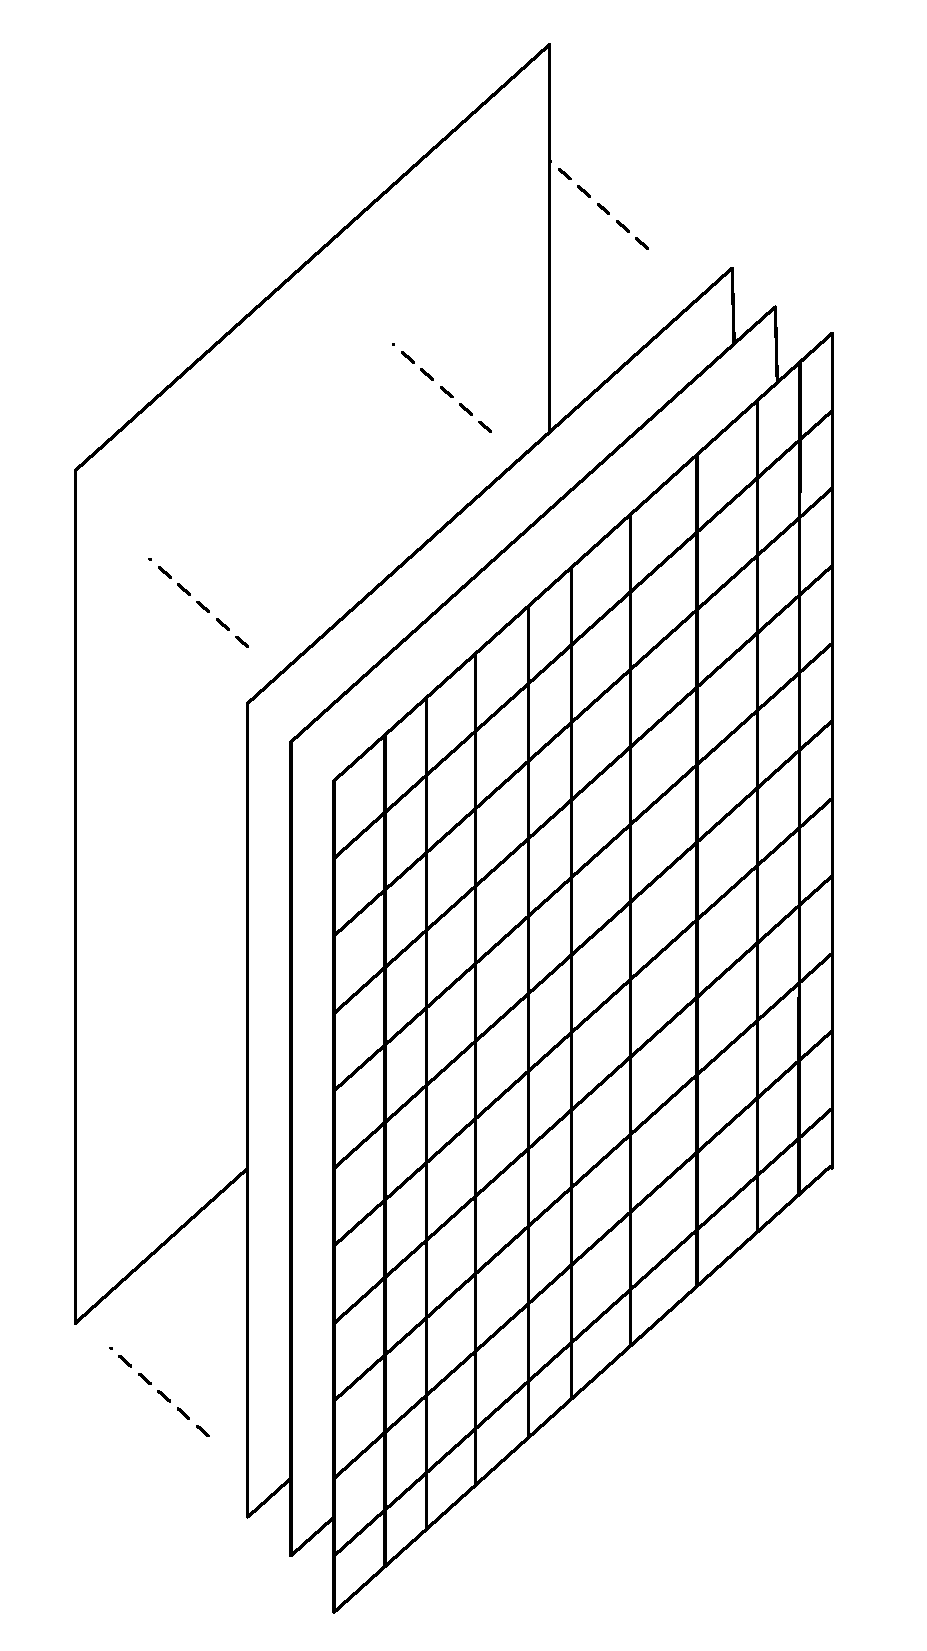
2.2. Text Representation

The study used the method of word embedding [28] for text representation. In this paper, we used the embedding layer of Tensorflow to complete word embedding. The embedding layer, as a part of the deep learning model, trains with the model and updates the word embedding vector. After word embedding, the vector corresponding to each word and punctuation was of equal length. The text was converted into the form shown in Figure 1, and each microblog text was converted into a two-dimensional matrix in which each line was a vector form of a word or punctuation symbol constituting the text. The number of rows in the two-dimensional matrix was the number of words and punctuation the text contained. For the convenience of subsequent processing, each microblog text was artificially changed into equal length. Thus, the final result was a batch of two-dimensional matrices of the same size as shown in Figure 2. The actual processing was stored in a three-dimensional array when the data were finally entered into the model.

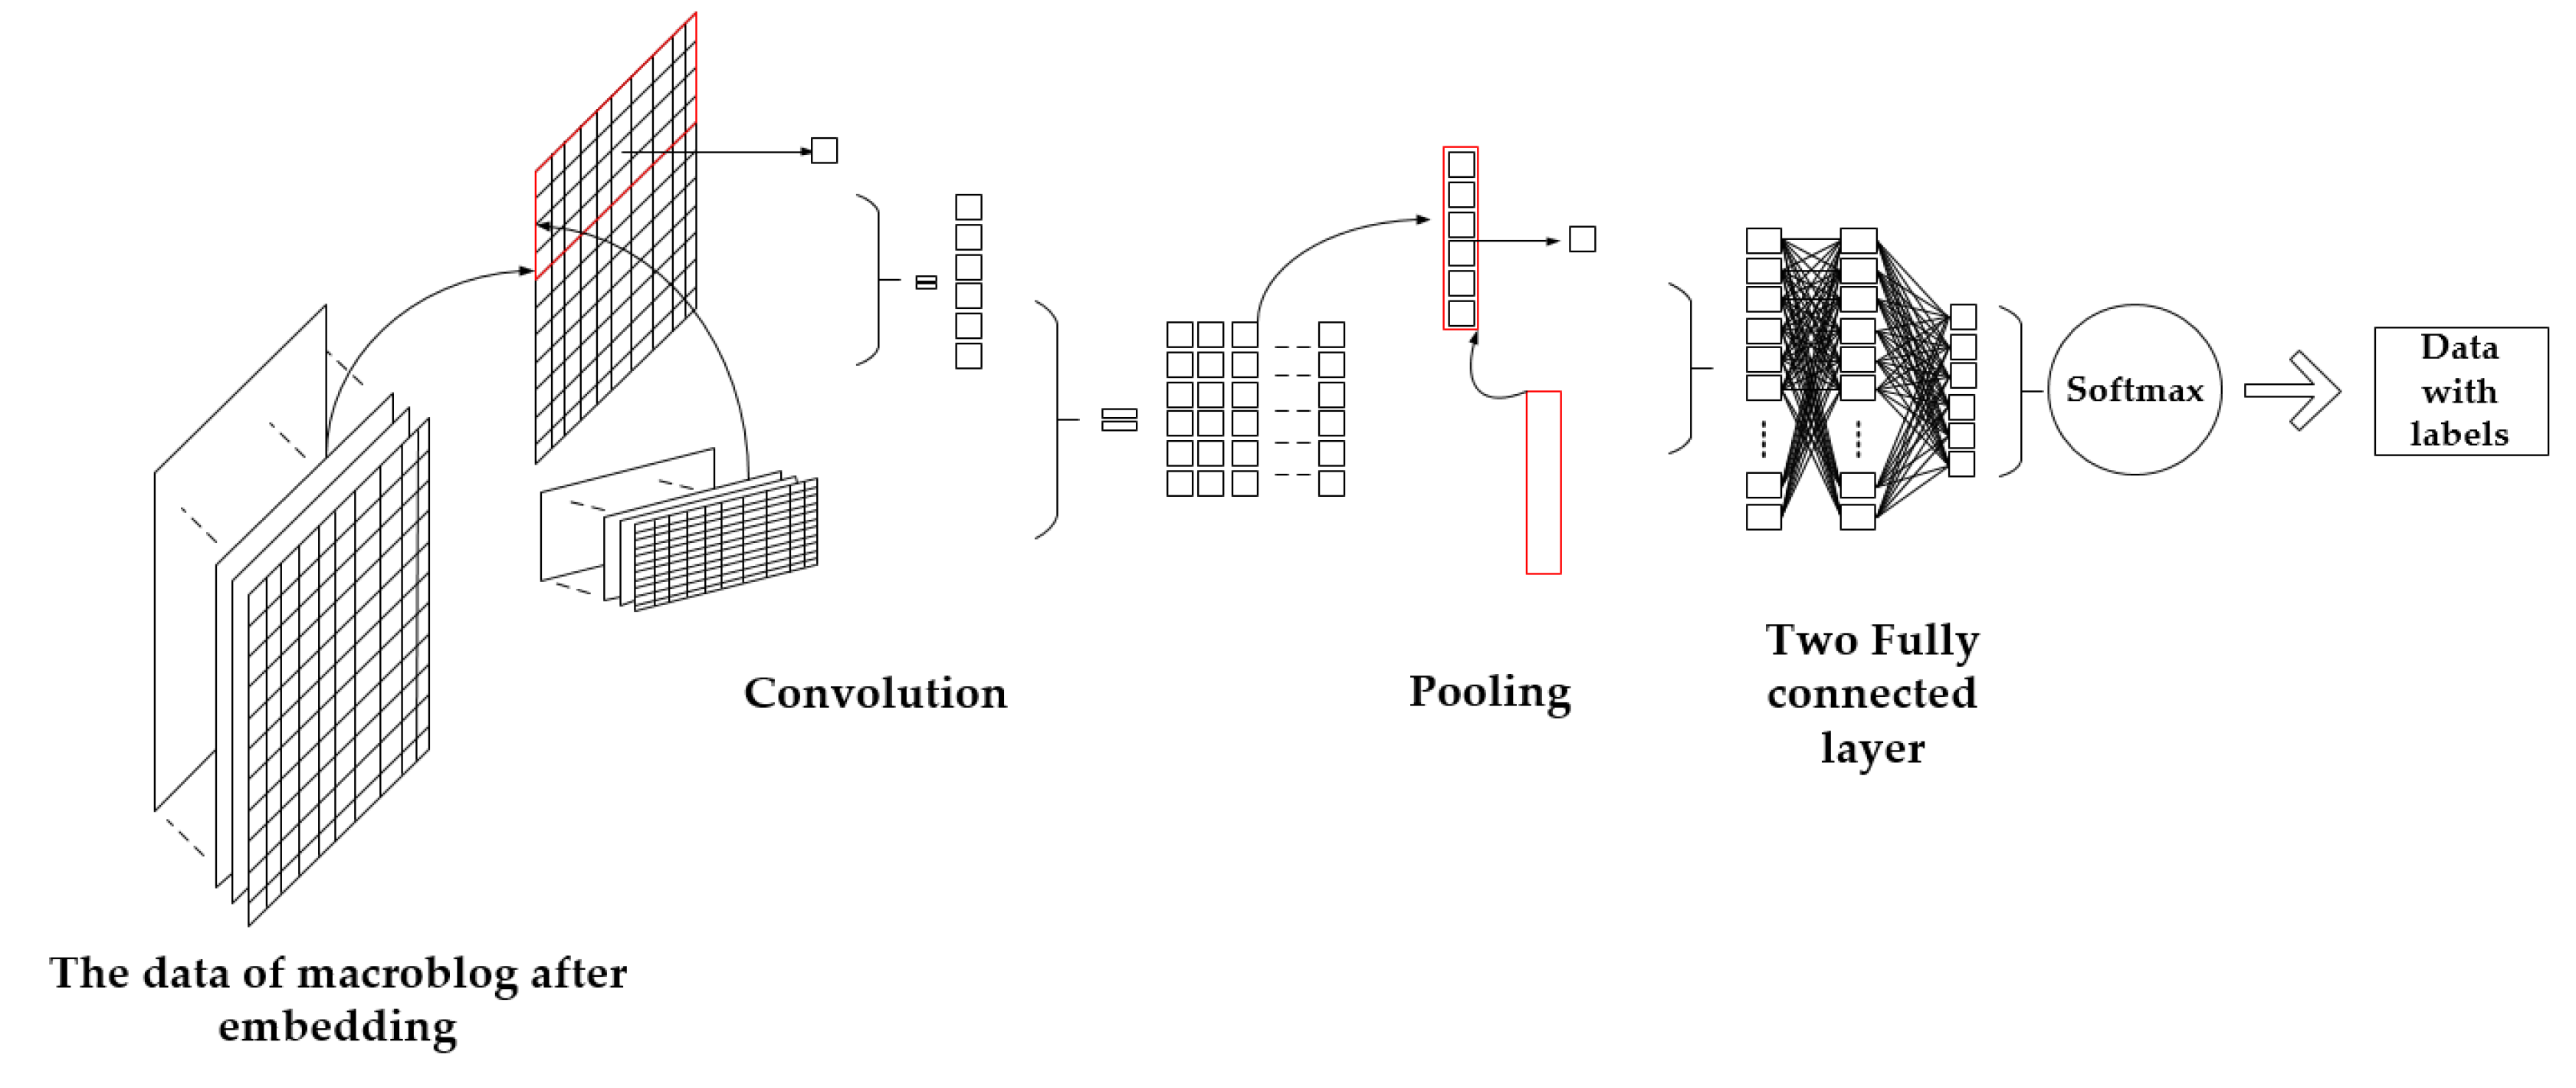
2.3. Model Construction

2.3.1. Structure of Model

We use the basic model structure from the research of Reference [29,30]; the structure of the model is shown in Figure 3 below. The left side the figure shows the input layer, with each input entering one piece of texts to build a two-dimensional matrix. Feature extraction was performed on the convolutional layer using 128 different filters with a height of 5, and 128 feature vectors were obtained. The kernel of max pooling was used at the pooling layer to get the strongest part of each feature and combine them. These features were then integrated through the fully connected layer, and finally input into the Softmax classifier to obtain classification results.

2.3.2. The Loss Function

The above describes the specific structure of the convolutional neural network used in this study, from the input layer to the output layer. The mainframe of the entire network has been established. However, a very important aspect that has been missed so far is the evaluation of the classification results. There is no doubt that the quality of the classification results is the most concerning issue. In addition, the training of neural networks is aimed at continuously improving the accuracy of classification. If there is no good method to assess the results of the classification, the training of the neural network cannot be carried out, let alone the model be finally used to help us classify. The concept of the loss function was proposed to solve this problem. The loss function reflects the quality of the classification by measuring the closeness between the classified result and the expected output. There are many forms of loss function, and in our study we use cross entropy as a loss function. There are three main features of the cross entropy: (1) the cross entropy of two identical functions is zero; (2) The smaller the cross entropy of the two functions, the more similar the two functions are, and the larger, the opposite; (3) Cross entropy can measure the difference between two random distributions with values greater than zero [22].

3. Case Study

In order to verify the feasibility and effect of the proposed method, this paper selected the relevant microblog texts of Typhoon Anemone for a case study. Anemone landed in Zhejiang on August 8, 2012, affecting five provinces (cities), namely Zhejiang, Shanghai, Jiangsu, Anhui, and Jiangxi. Anemone was strong and had a long stay over the mainland. It had caused tremendous damage to the affected area. The specific statistics are shown in the Table 1. Anemone was a typical typhoon landing on the coast of China, and it had a large social impact, resulting in lots of microblog texts, giving it a certain representativeness as a research object. The Typhoon Anemone database contained a total of 22,317 microblog texts. Some texts only had description about the typhoon disaster, and some data included both content and position information of the people who posted on Weibo.

3.1. Data Preprocessing

For the smooth progress of the experiment, data preprocessing was required. It was mainly divided into two parts: dataset production and text representation. The text representation has been described in detail in the previous section, and will not be repeated here. This section mainly introduces the process of making the dataset.
Dataset production mainly consists of two parts: one is classification and screening, and the other is unified formatting. The data format specified in this article was: label + tab + content, with each line separated by a new line. These messages translated into English looked like this:
(1)
/Green plants/tab/After the typhoon, the trees on the side of the road fell down and the traffic lights were broken./
(2)
/Water and electricity/tab/#typhoon# Go ahead, it’s all the sound of the wind and the wind..., And it’s still out of power./
The difficulty in dataset production is screening and classification (data labeling), which was the most time-consuming part of the whole experiment. After trying manual screening and search keyword screening, we combined our previous experience to write a program to achieve the coarse classification of Weibo data. The algorithm flow used was as follows in Figure 4:
Through the above procedures, most of the classification work was completed, only needing manual refinement of the already classified data and marking of other disasters at the same time.
The datasets obtained in this paper were as follows: 335 disasters in construction; 378 disasters in traffic; 525 disasters in green plants; 399 disasters in hydropower; 435 in other disasters; and 1419 in useless categories, with 3491 data in total.

3.2. Training and Verification

This section mainly introduces the implementation ideas and processes of the program, and does not discuss the specific implementation of the function. The program can be roughly divided into three parts: one is the generation of the dictionary and one-hot vector, the second is the configuration of the CNN model, and the last is the training and verification of the model in combination with the first two steps.

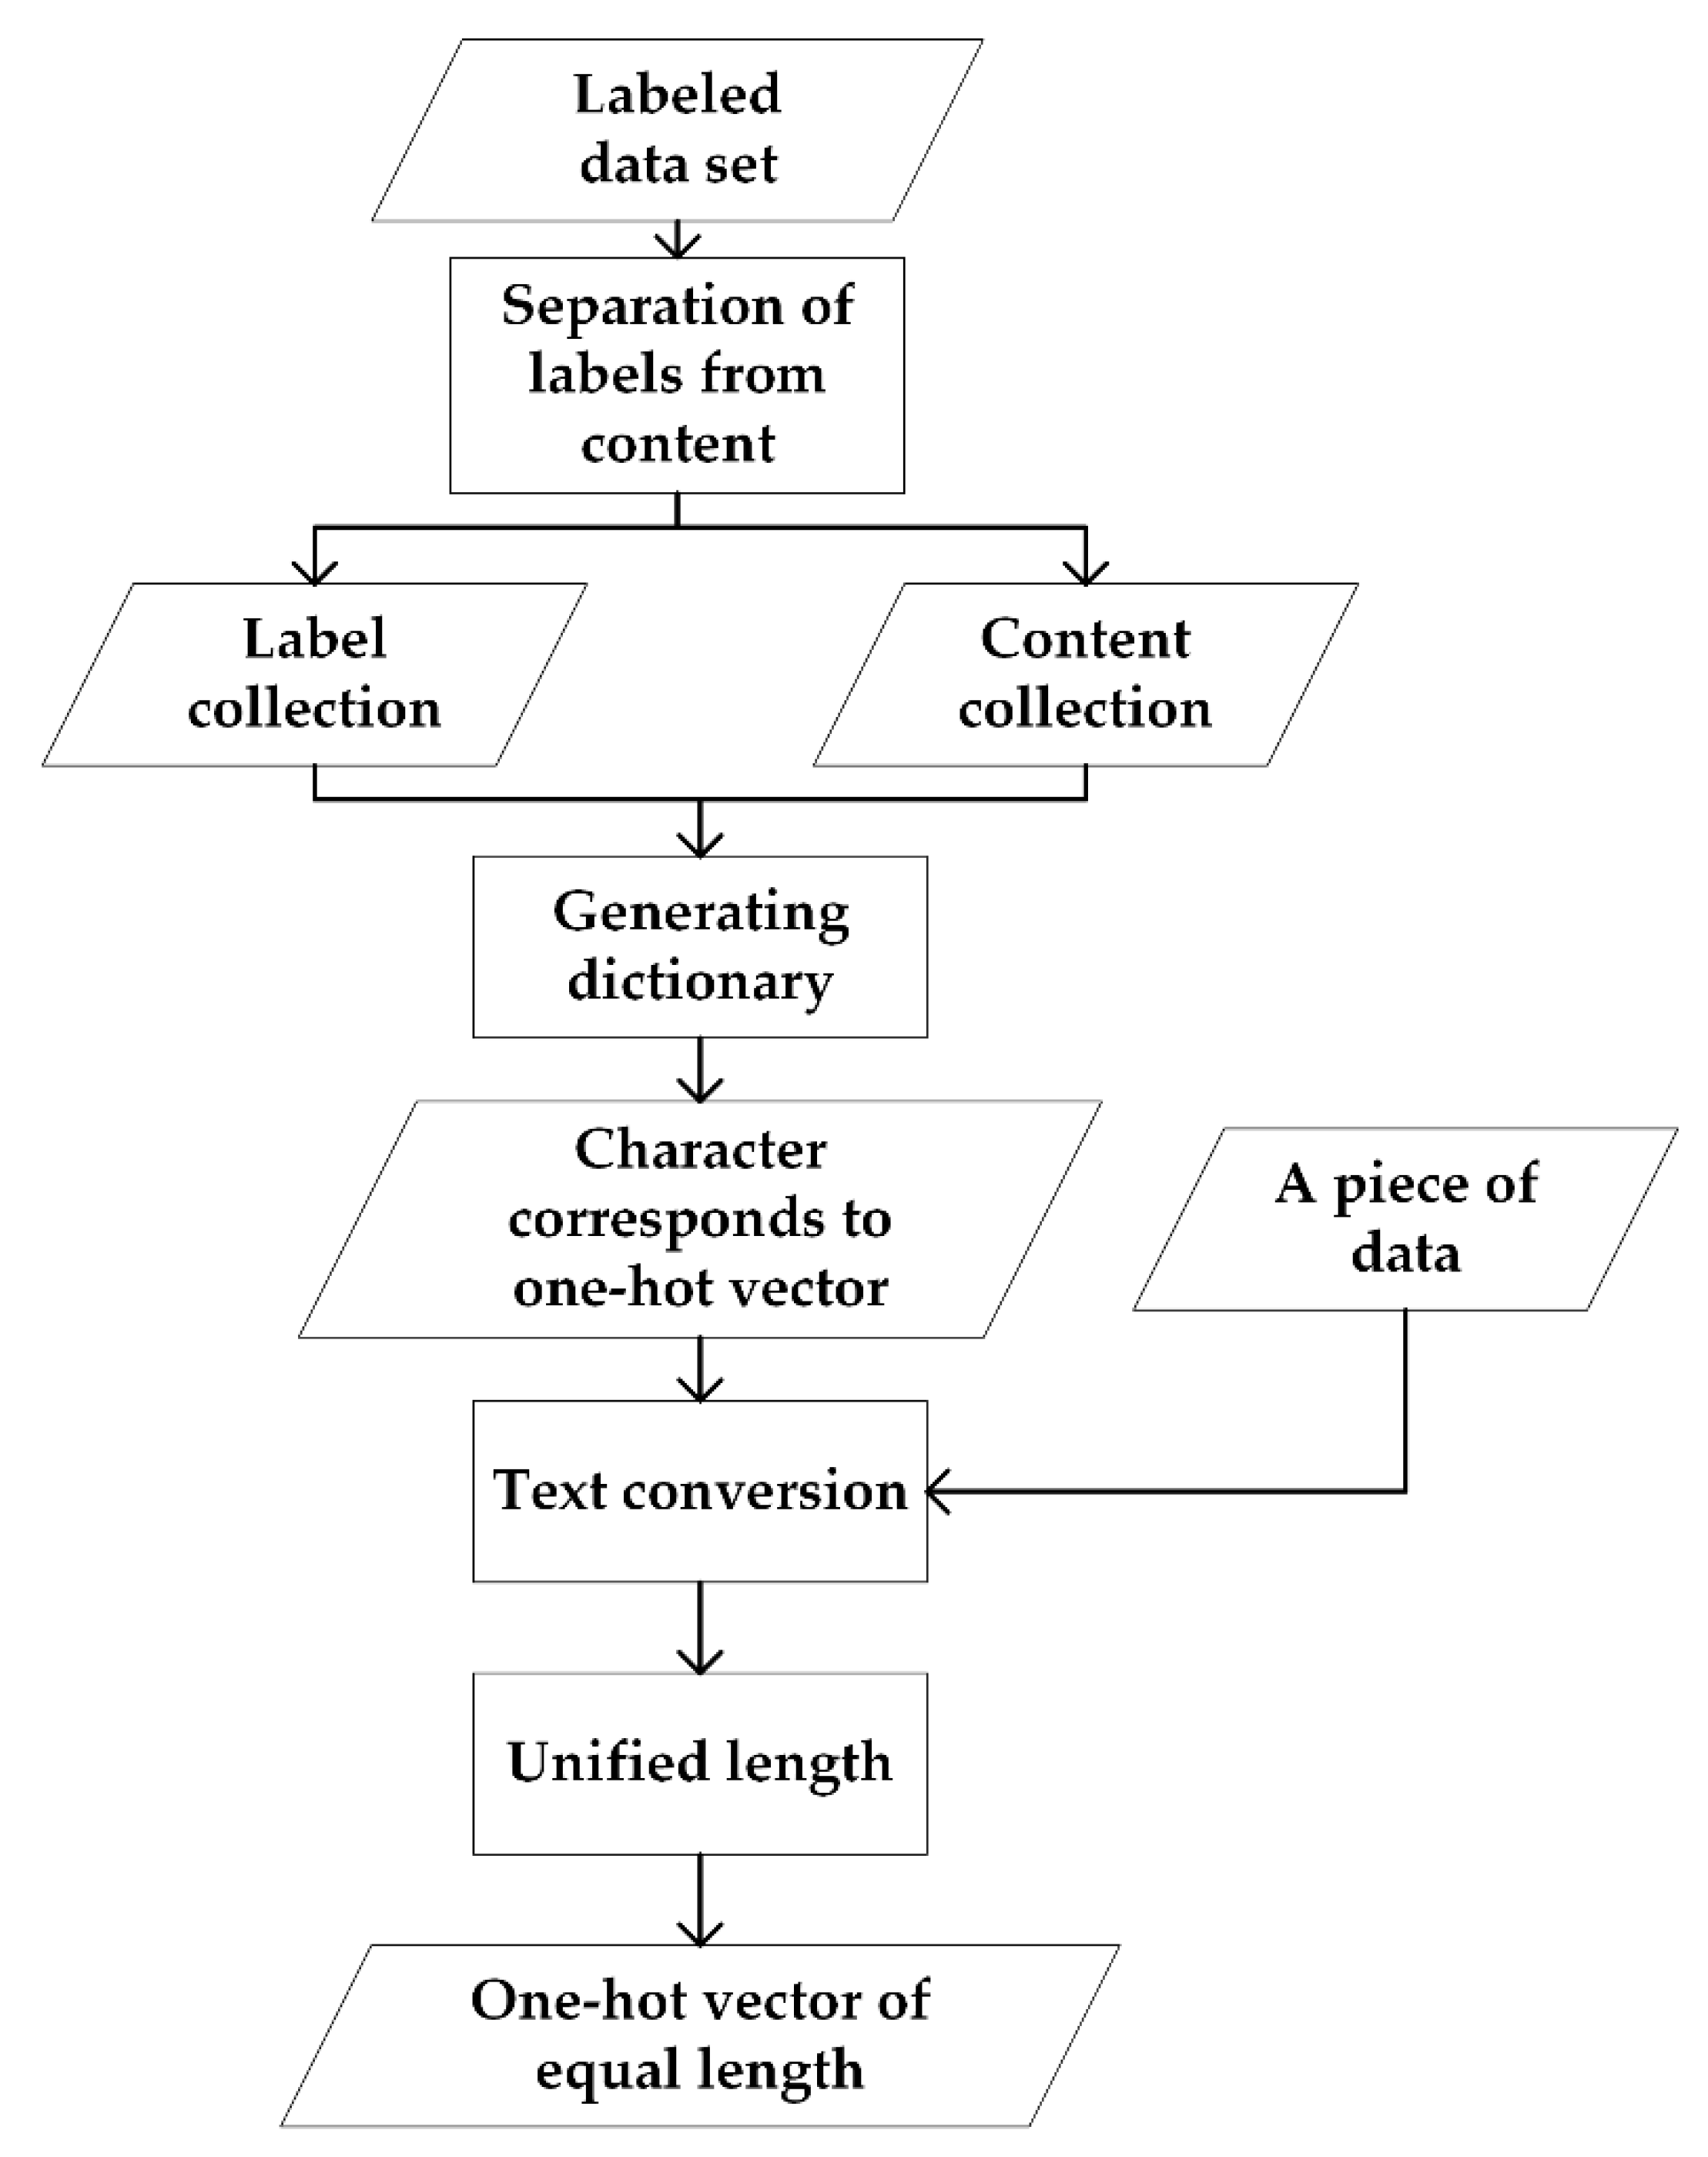
3.2.1. Generation of the Dictionary and the One-Hot Vector

The generation of the dictionary and the one-hot vector was the preparation work required before word embedding. The generation process was as follows in Figure 5:
The created dataset file was read, and the label and content saved separately in two lists. The two lists of tags and content were then processed separately to generate their respective dictionaries. According to the generated dictionary, the index form of the one-hot vector of each character in the dictionary was obtained. After the correspondence between the label, the character and its one-hot vector was established, each piece of data could be processed according to the corresponding relationship, and converted from the text format to the corresponding one-hot vector form. All the one-hot vectors of all sentences were then unified to the same length by adding 0.

3.2.2. Construction of the CNN Model

The construction of the CNN model included setting parameters, implementation of each layer structure, and connection.
After setting the parameters, the appropriate Tensorflow function was selected to implement the function of the corresponding layer, and the output of the previous function was then used as the input of the next function to achieve connection between the layers. Finally, the loss function and optimizer were added.

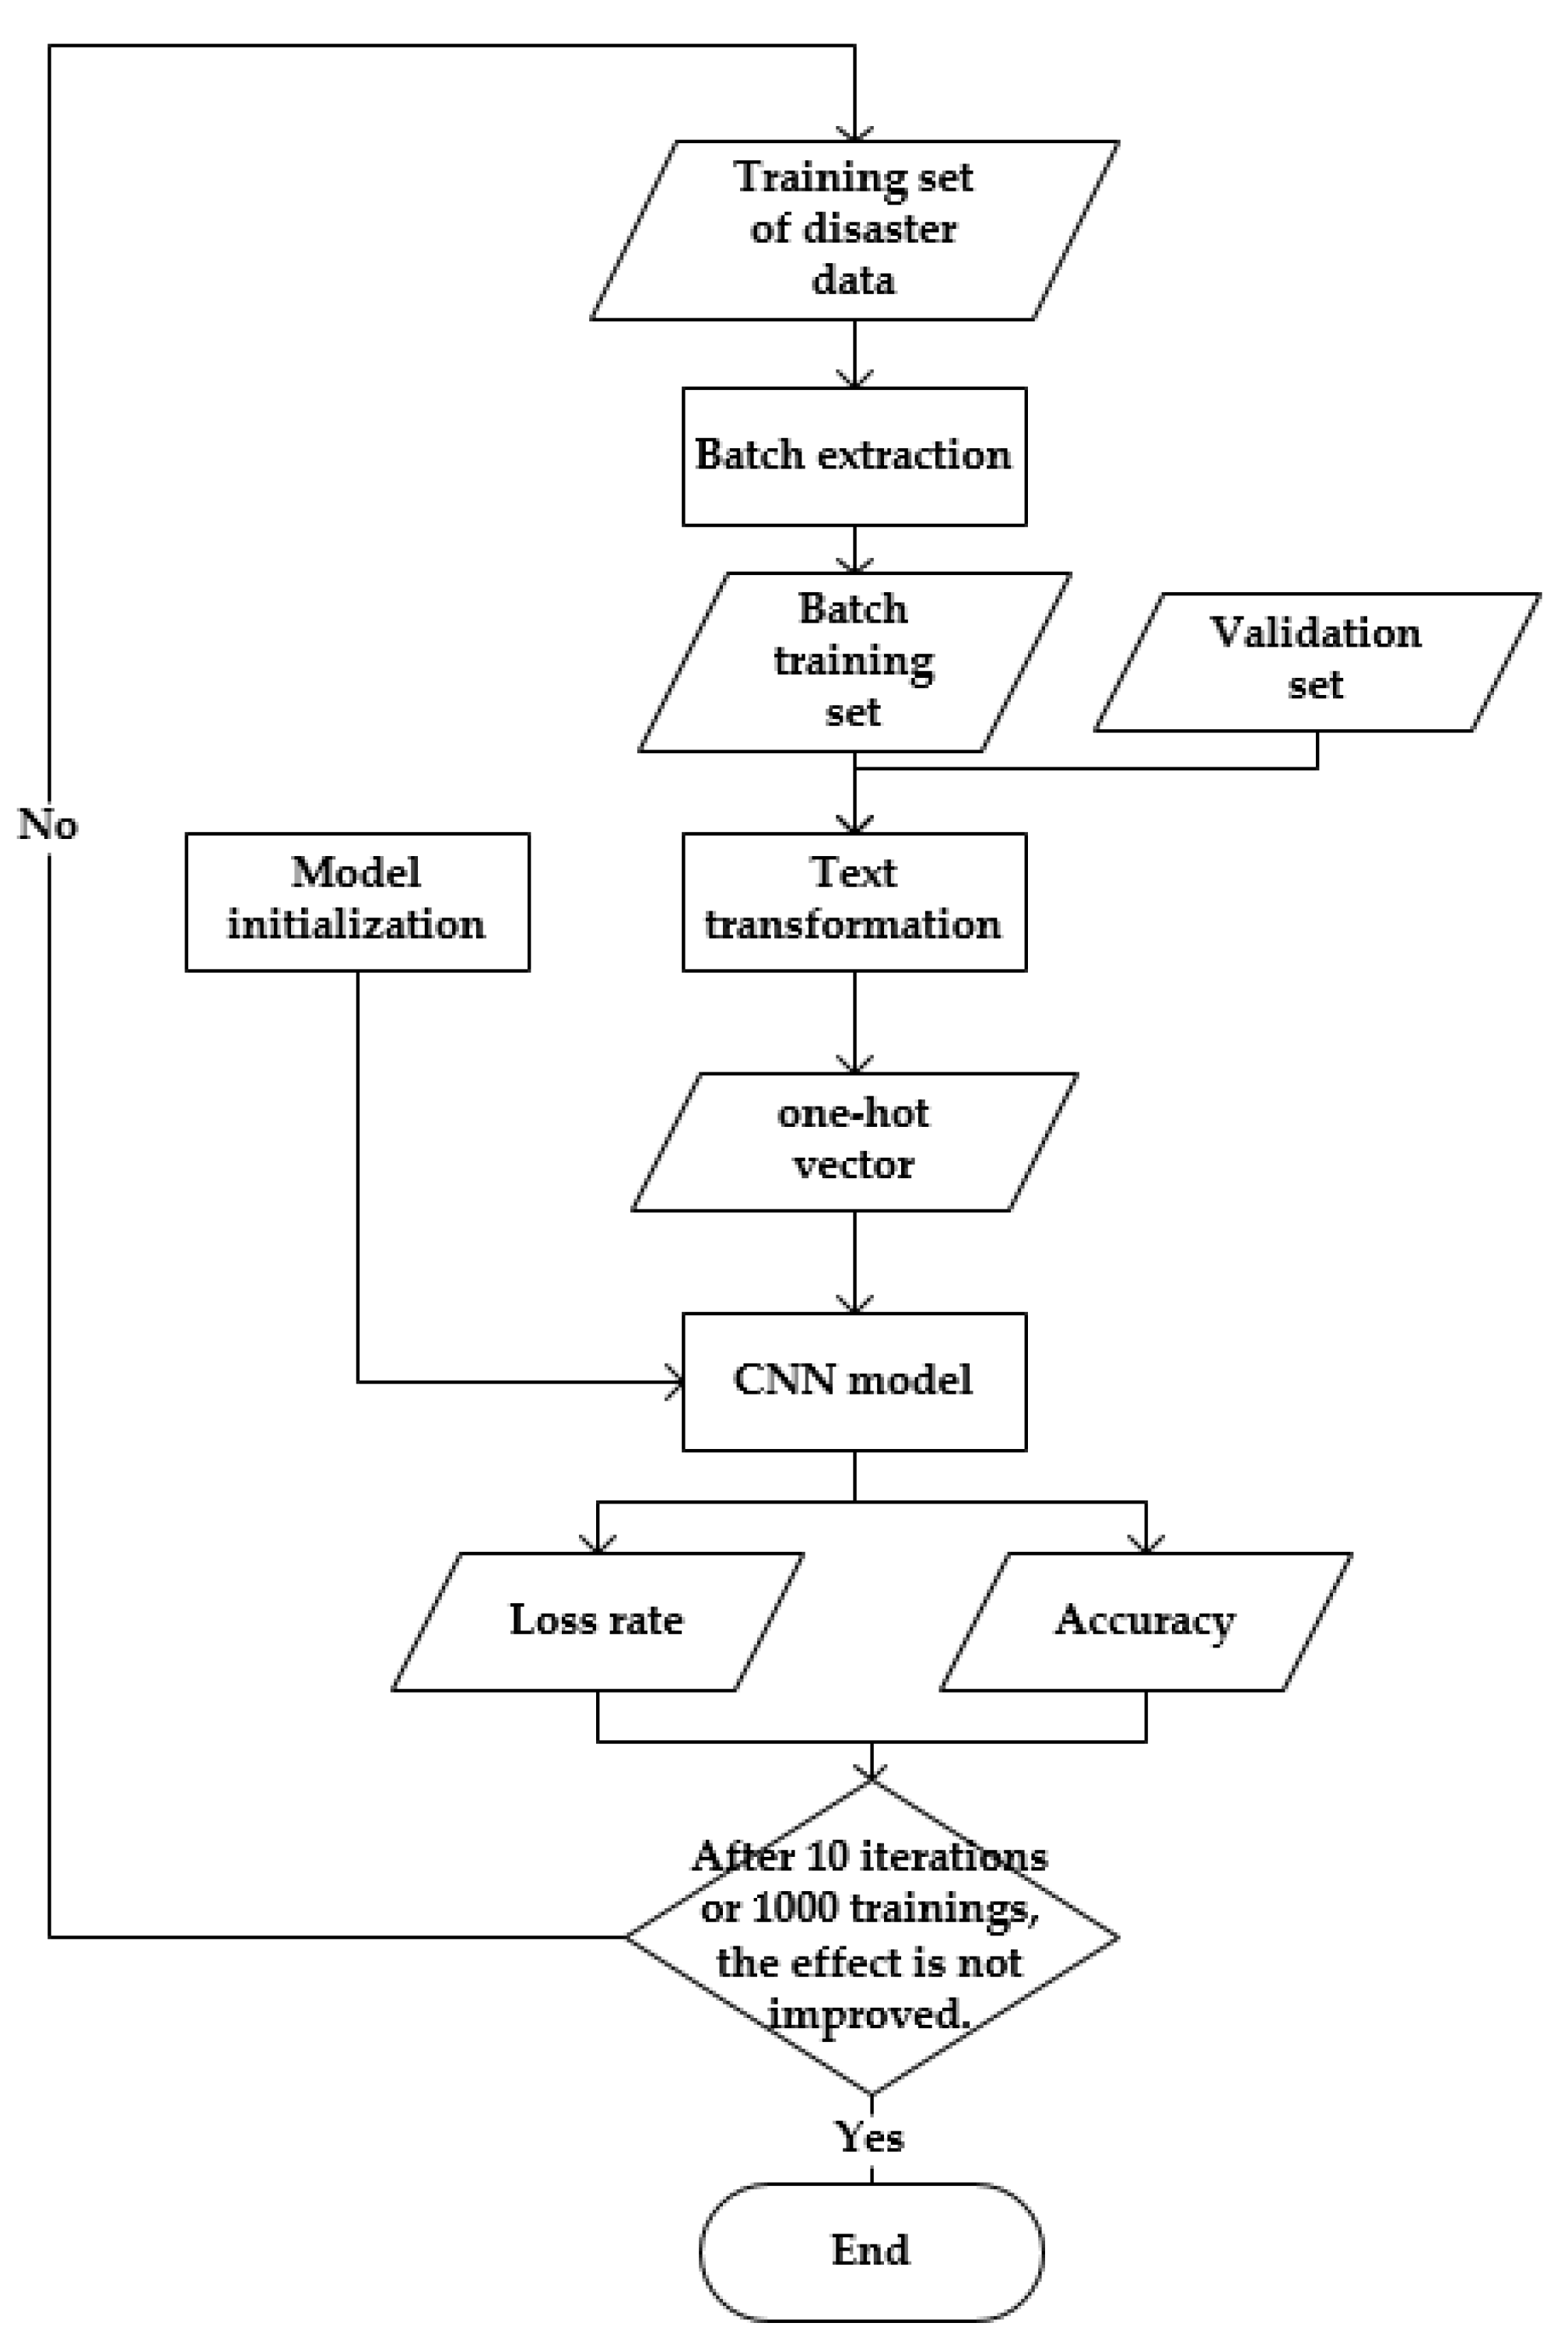
3.2.3. Training and Testing

The training process of the model was as follows in Figure 6:
Figure 6 shows the training process. First, the training set and the verification set were prepared, then the data were extracted from the training set according to the set batch size. Next, these data and the verification set were embedded, then imported into the initialized CNN model. The loss rate and accuracy of the model were then output, and then the parameters were adjusted to reduce losses. This cycle was repeated until the entire training set had been used to complete 10 rounds trainings, or there was no improvement in long-term. The process of testing and verification was similar, except that the process of initializing the model needed to be changed into importing the existing model, and then the accuracy and the loss rate were directly output.

3.3. Discussion

According to the experimental procedure described above, six experiments were carried out. First, 50% of the dataset was randomly extracted for training and verification of the model, and then 60%, 70%, and 100% of the dataset. Each time, data were randomly extracted from the dataset as a training set, a test set, and a verification set at a ratio of 7:2:1. The rest of this section is mainly divided into three subsections to explain the experimental results. First, the results are analyzed in detail with 70% of the data training and test results. The experimental results of the different-sized datasets are then compared and analyzed based on the above analysis.

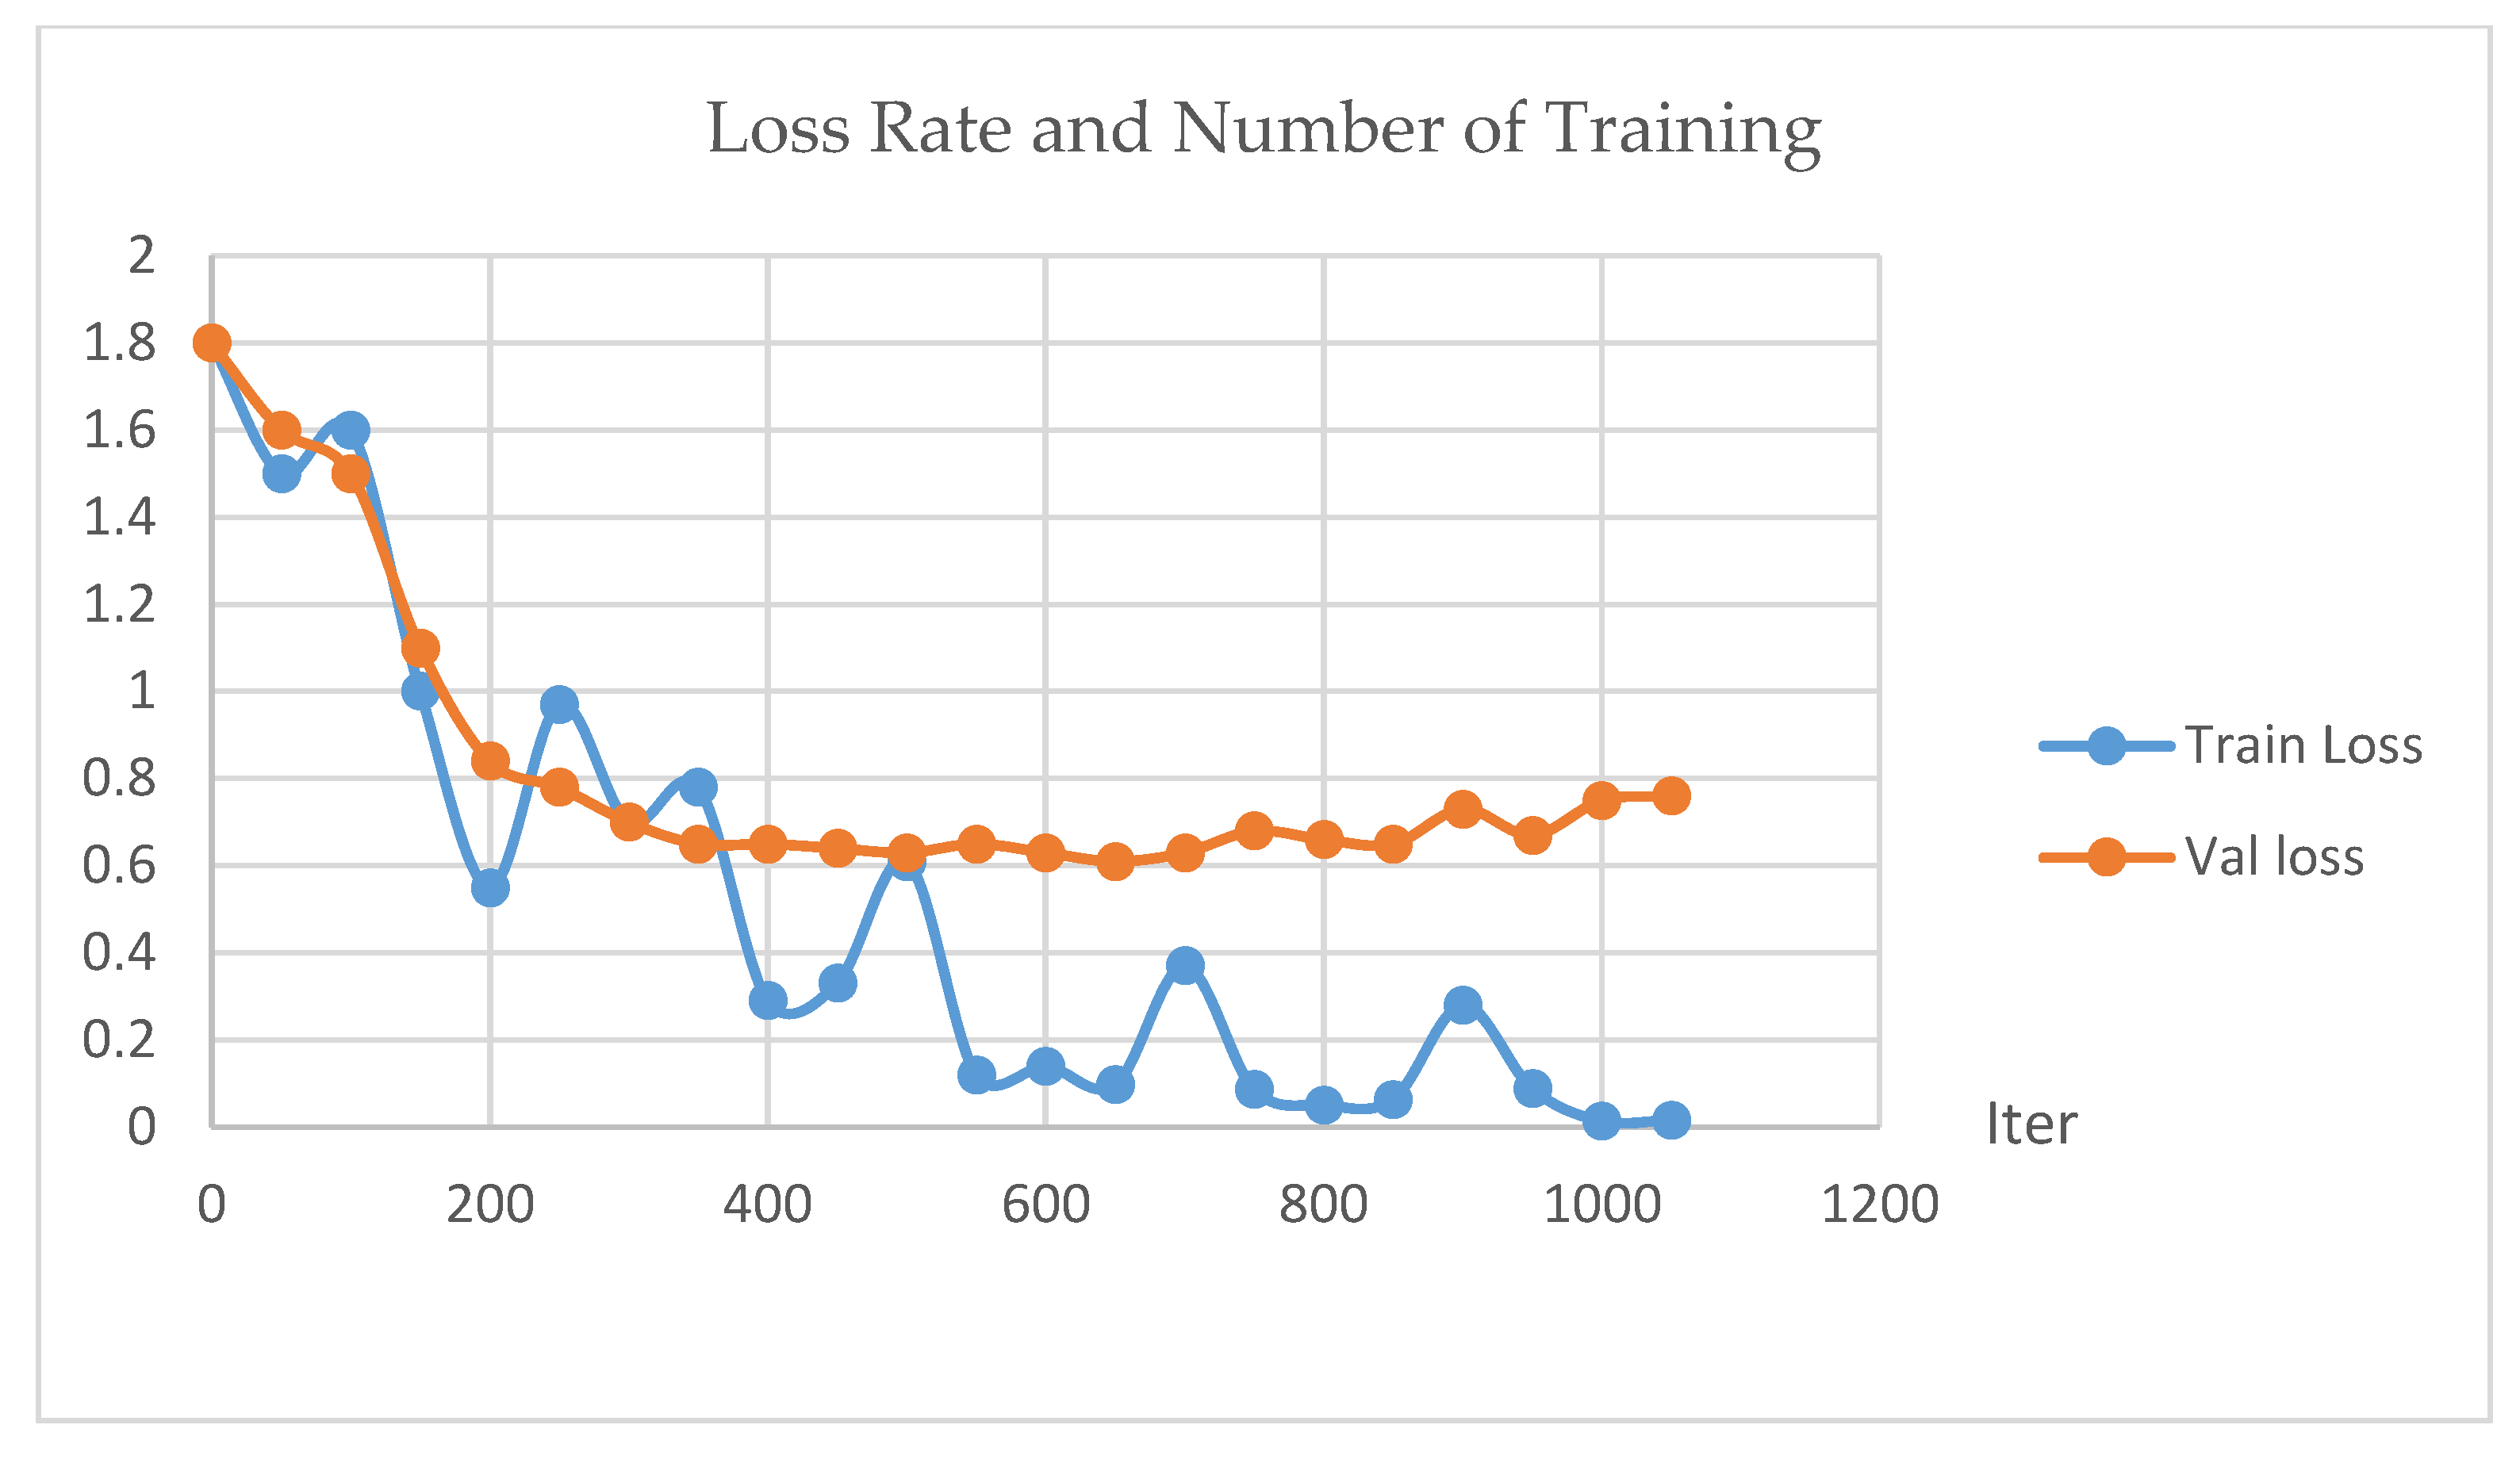
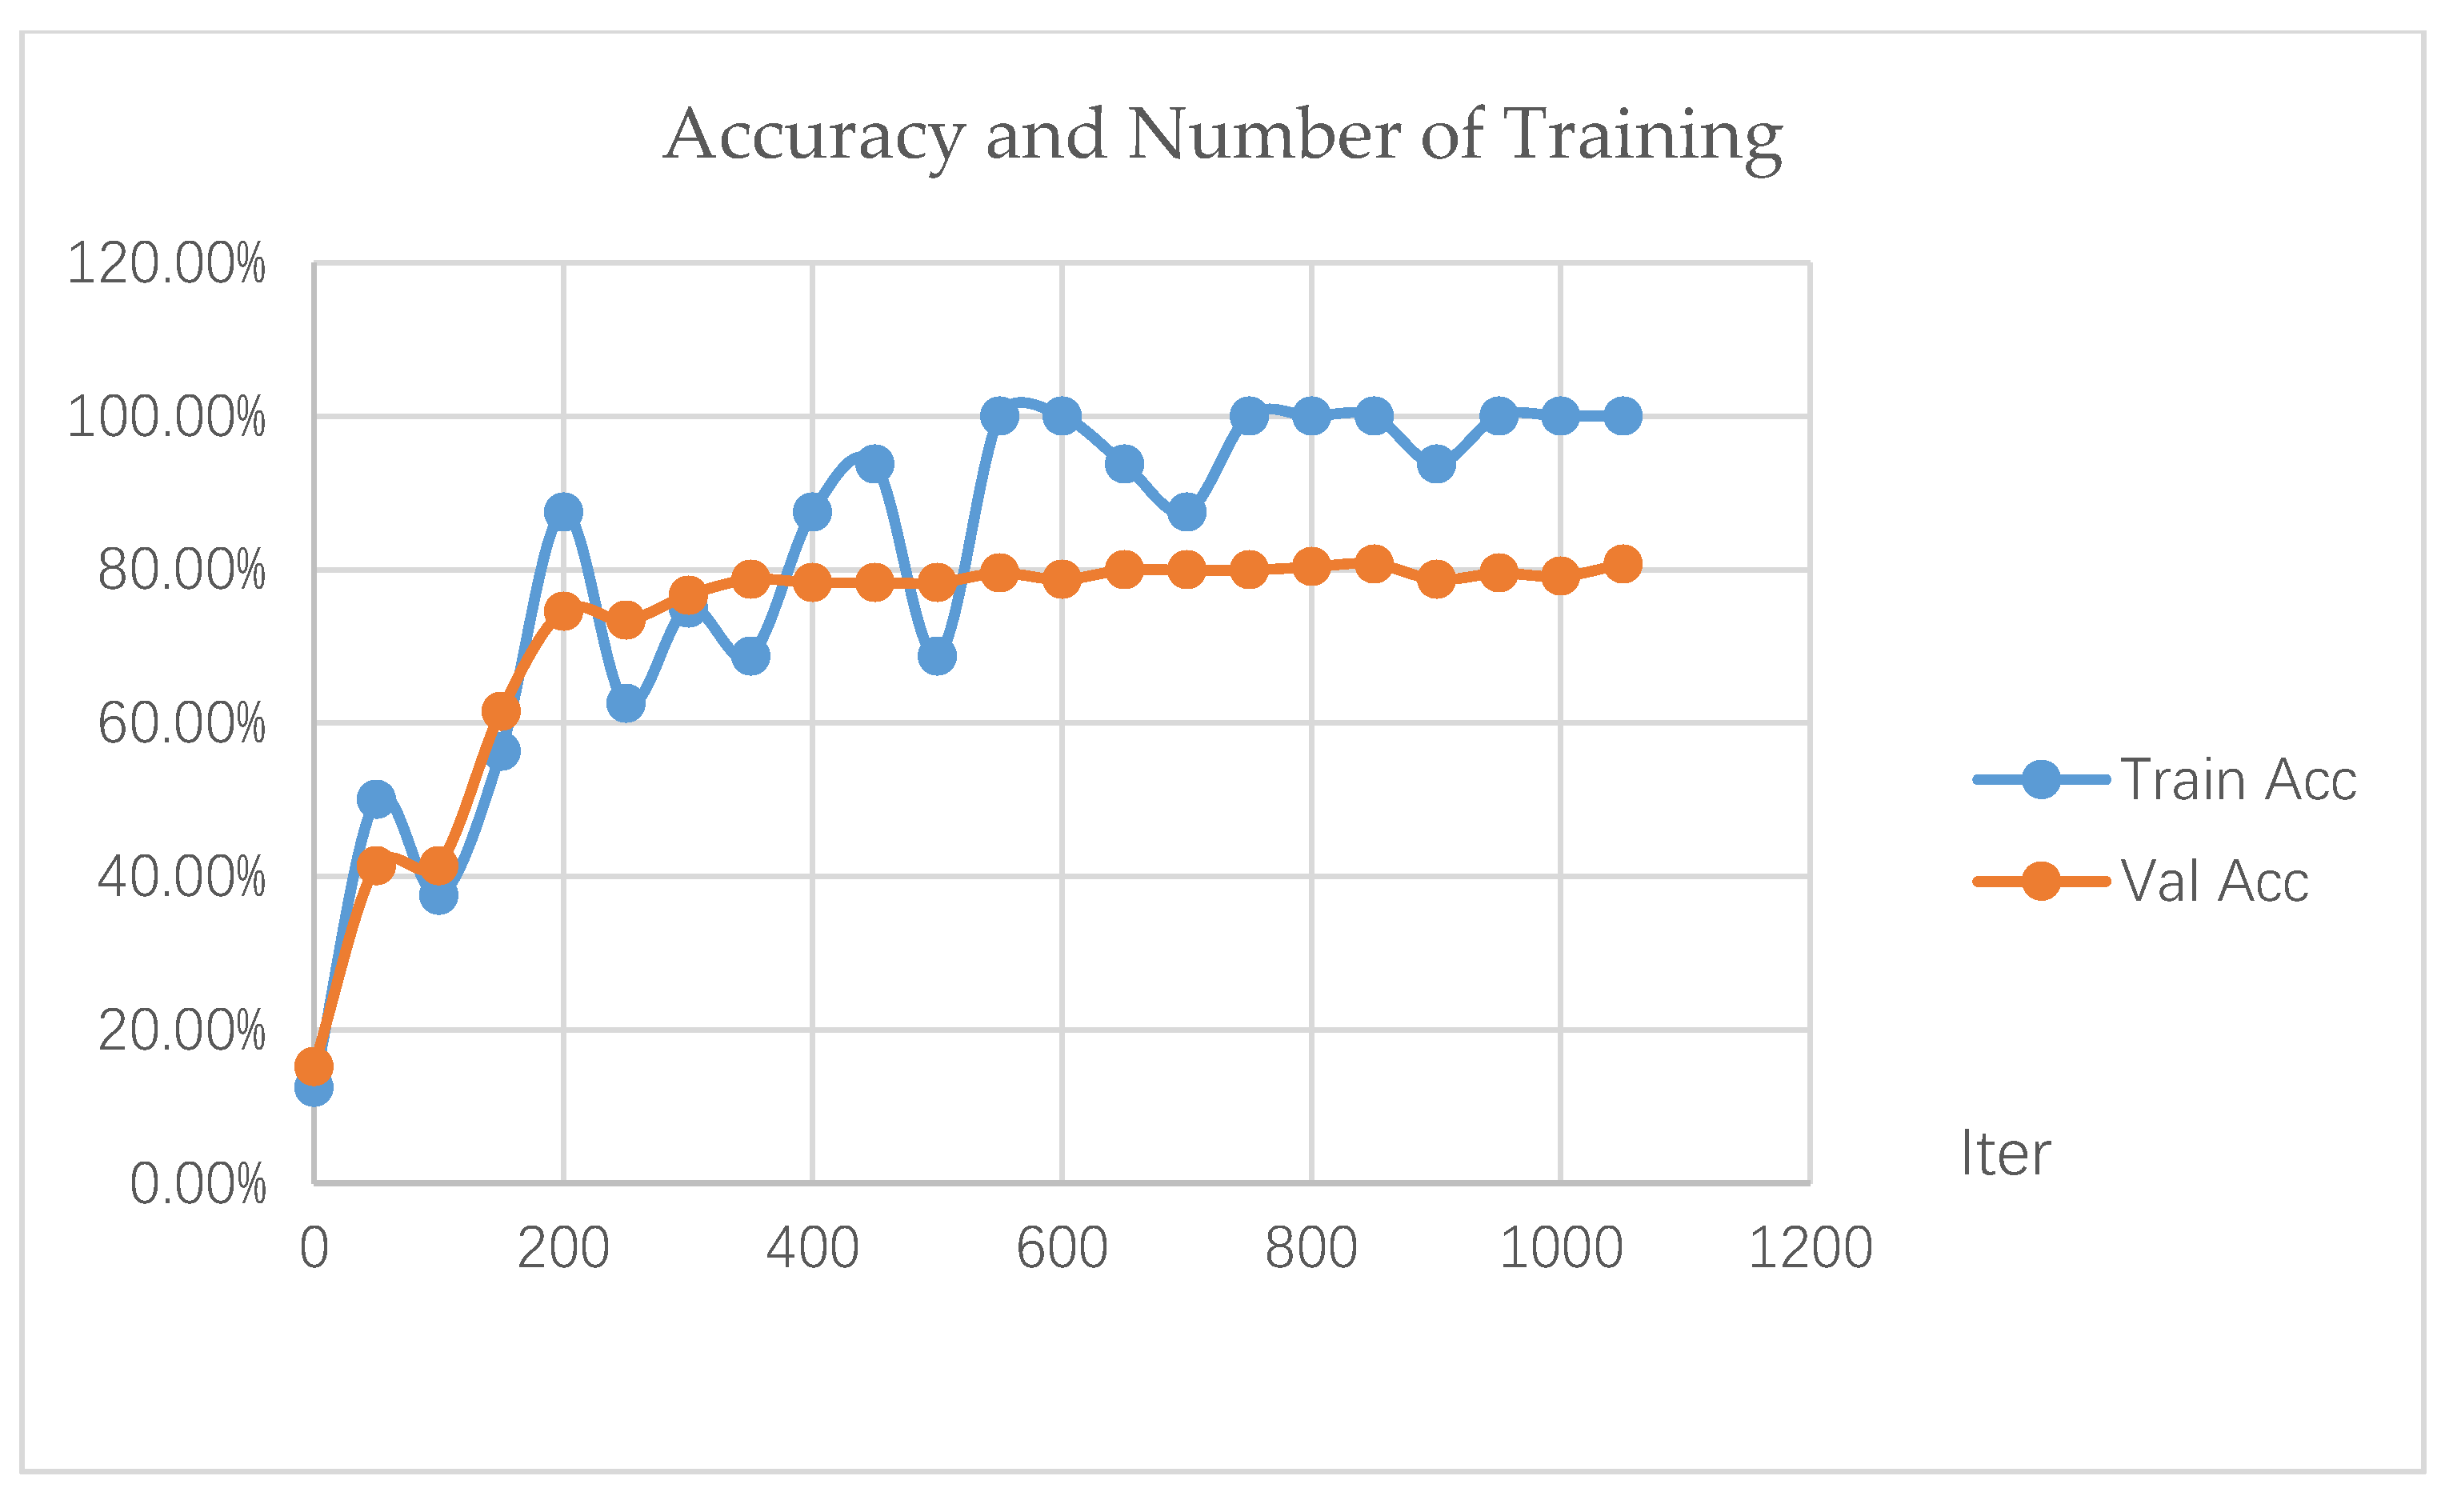
3.3.1. Description of Training Results

The columns in Table 2 in represent the iteration round (Epoch), the training batch (Iter), the loss rate(Train Loss) and accuracy (Train Acc) on the training set, and the loss rate (Val Loss) and accuracy (Val Acc) on the verification set. For the convenience of analysis, these data have been visualized in Figure 7 and Figure 8.
After analysis, the reason for the abnormal oscillation of the loss rate and accuracy curve of the training set was that the data batch was too small, but this situation did not affect the training effect of the model, so no further analysis was needed. Ignoring the abnormal oscillation of the curve, we concluded that the loss of the model dropped rapidly and then stabilized, and the accuracy first rose rapidly and then stabilized. The above conclusions were true for both the training set and the verification set. Specifically, the loss rate of the training set finally stabilized at around 0, and the accuracy finally stabilized at 100%. As far as verification is concerned, the loss rate finally stabilized at around 0.6 and the accuracy was maintained at 80%.

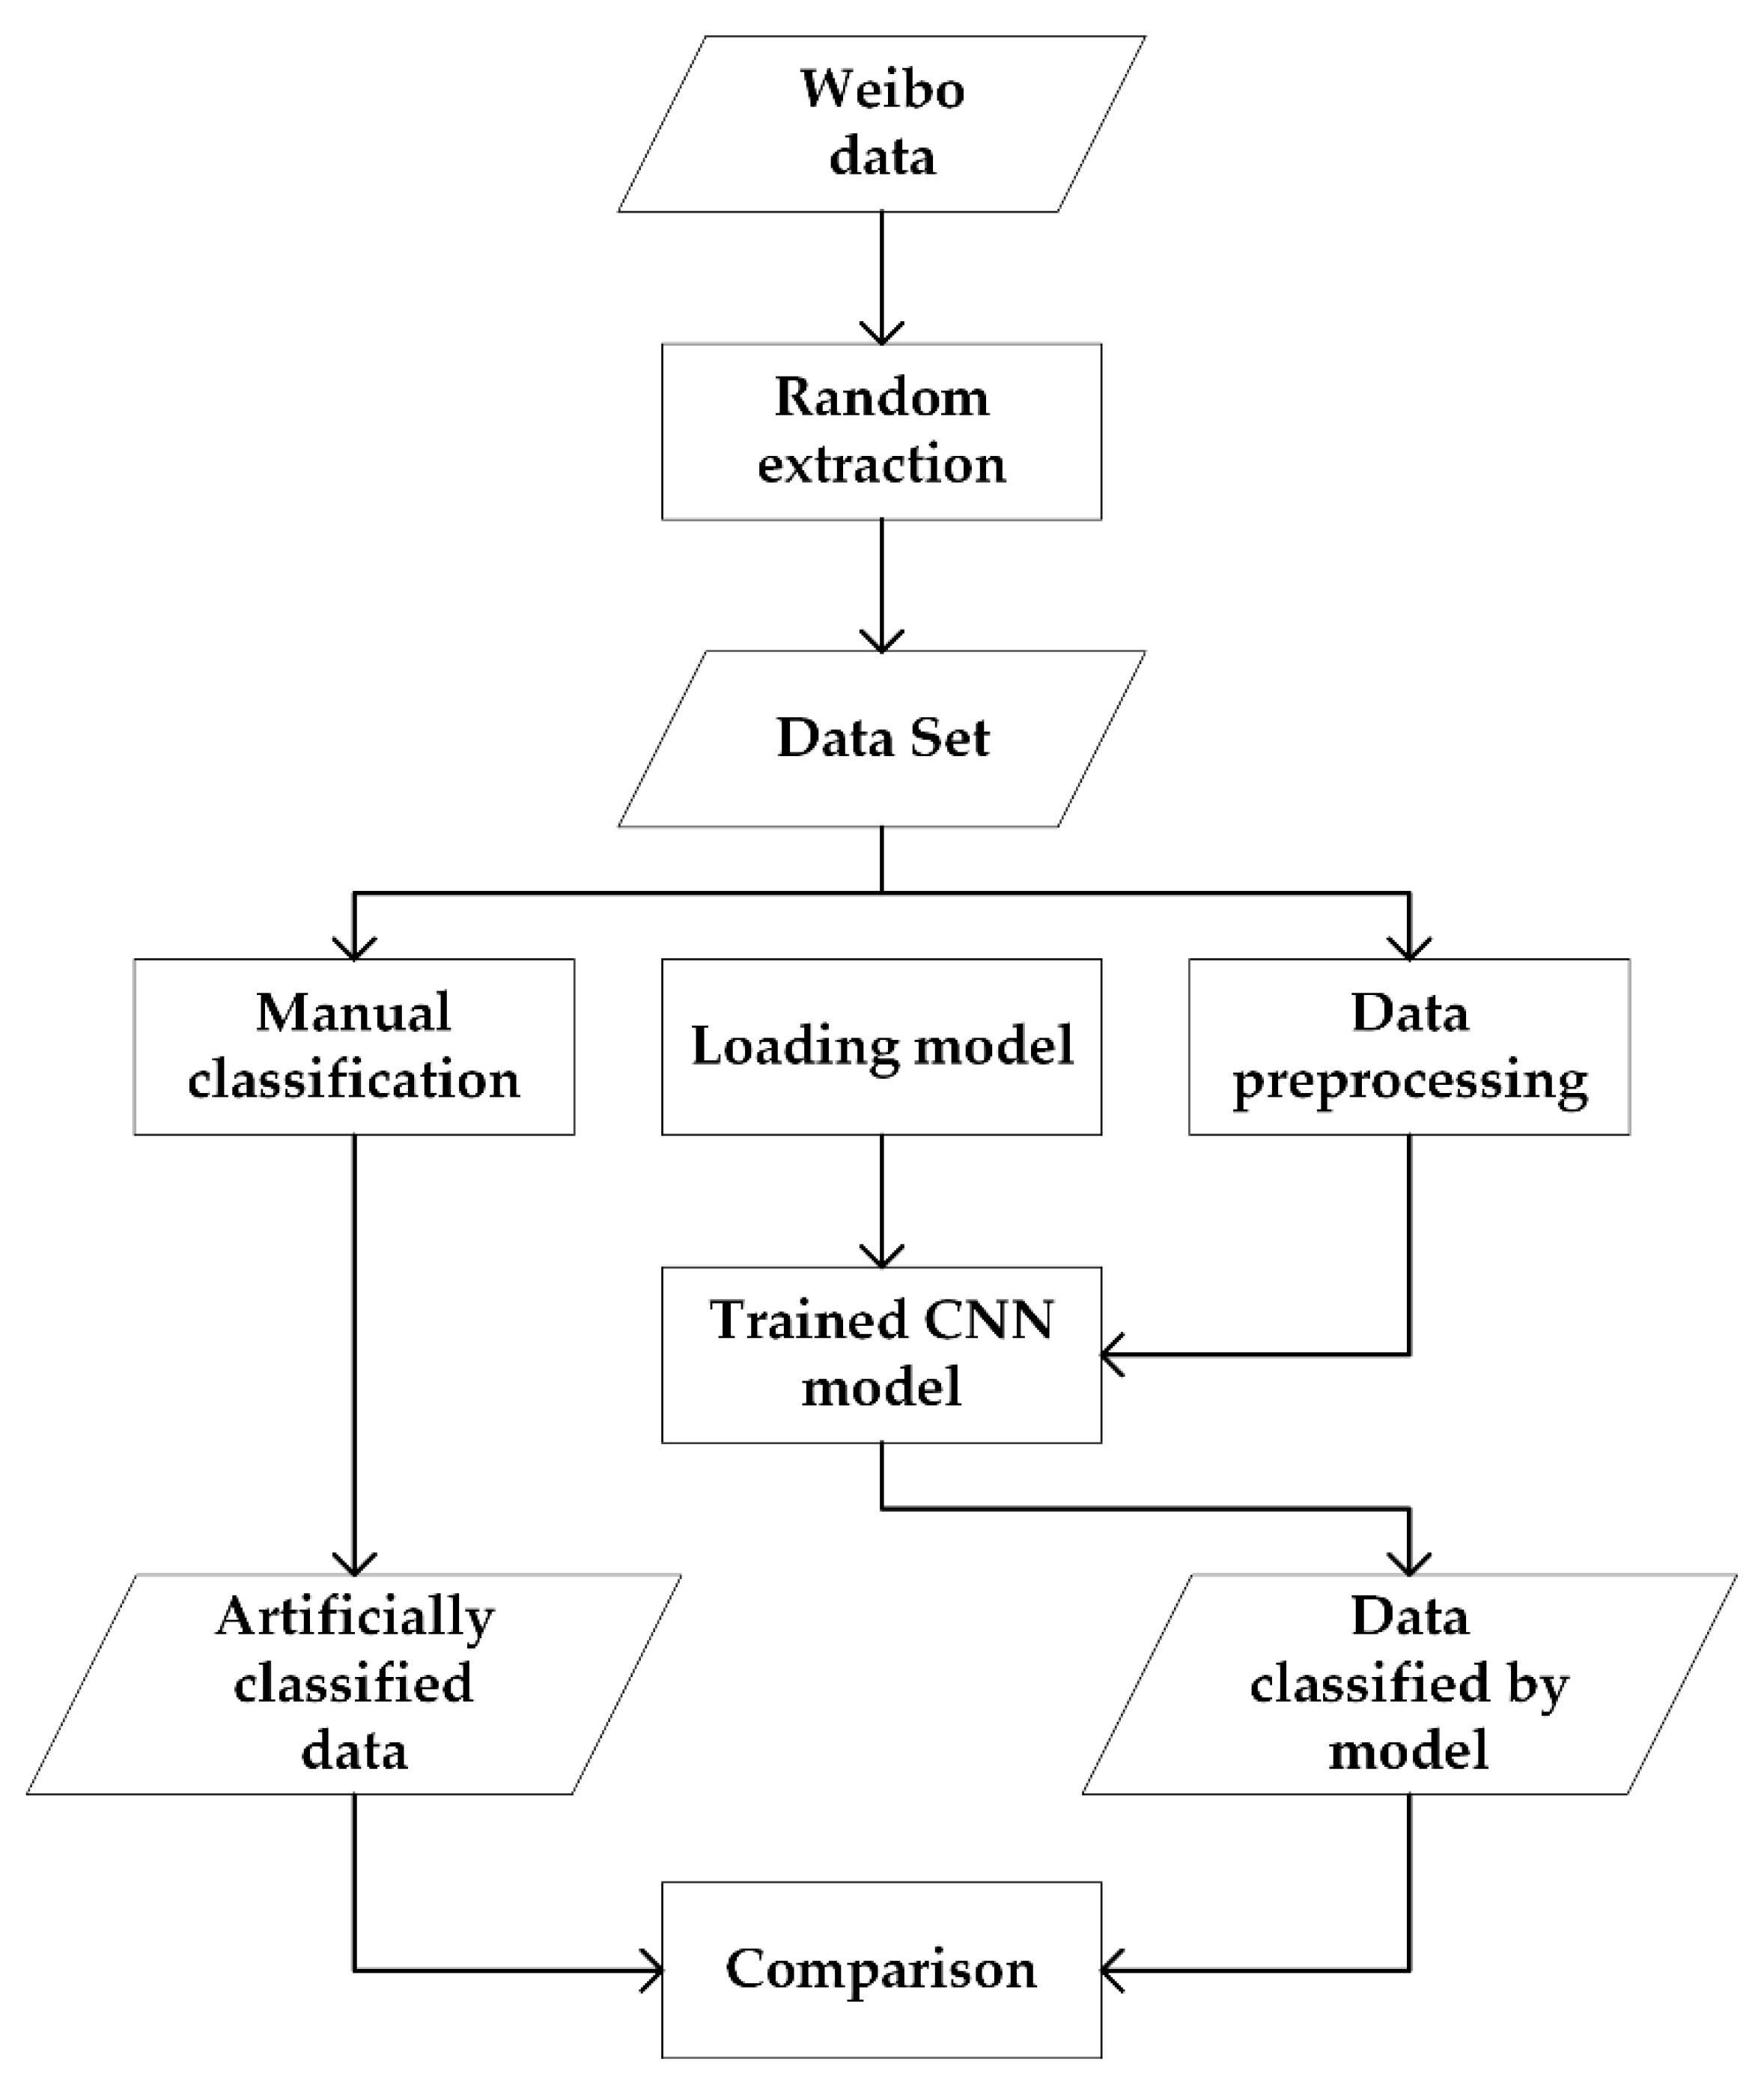
3.3.2. Description of Test Results

As shown in Table 3, the test results consisted mainly of two parts. Table 3 gives the various indicator values of the classification effect of each category, as well as the overall classification effect, which is convenient for the overall analysis model. Table 4 shows the classification confusion matrix. Each type can be analyzed in more depth through the confusion matrix.
As shown in Table 3, there were two indicators—that is, the loss rate and the accuracy rate—which were 0.62 and 80.29% respectively. As analyzed in the previous section, there was no substantial difference between the verification process and the training process. Therefore, the loss rate and the accuracy rate on the test set were consistent with the analysis of the verification set; the loss rate was finally maintained at 0.6 and the accuracy was maintained at 80%.
There were three new indicators added, namely “precision”, “recall”, and “F1-score”. Precision indicates the accuracy of the prediction, which can be defined by the following formula: p i = a i / n i , where n i represents the number of data in the i-th class after the model classification is completed, and a i represents the number of data pieces that belong to the class in the n i data. For example, after the classification was completed, there were a total of 100 pieces of data ( n i = 100 ) classified into the construction disaster category. Compared with the original data label, it was found that there were 90 pieces of data that belonged to the construction disaster category ( a i = 90 ); thus, for the construction class, the accuracy of the classification was p i = a i / n i = 90 % . Recall represents the recall rate, which represents the probability that the tagged data have been correctly classified. In the same way, for example, in the construction class, assuming that there were 120 construction-labeled items in the training set data, if there were 90 construction-labeled items still in the construction category after the classification, then the recall rate would be 75%. F1-score is the harmonic mean of the accuracy and recall rate, which can comprehensively reflect the effect of classification. Next, we analyzed the prediction effect by category:
Building category: accuracy rate of 93%, recall rate of 71%, and F1-score of 0.8. The classification accuracy of the building category was very high, reaching 93%. However, the recall rate was relatively low, only 71%, which meant that nearly 30% of the data belonging to the building category were misclassified by the model to other types. Combining the accuracy and the recall rate, we made the inference that the model gave too much weight to certain special features of the building class. These features generally belonged to data of building category, but not all building data had these characteristics or the features were not obvious enough, so those data may not have been classified into the building class correctly. This is why the building category had a high accuracy rate and a low recall rate. As for why some features were given too high a weight, two conjectures can be made. One is that the sample types used for training were not rich enough, so that some feature models that also belonged to the building category could not be learned. Second, the features of model learning were not abstract enough to distinguish the data belonging to the building category.
Green plants: accuracy rate of 80%, recall rate of 86%, F1-score of 0.83. Compared with the construction category, the accuracy of green plants dropped a lot to only 80%, but the recall rate increased a lot, reaching 86%. The final F1-score was also higher than the building category. According to the classification results of green plants, we speculated that there were many data for model training, and the model learned a lot about the features of green plants, so the recall rate of the model was relatively high. However, due to the limitation of the performance of the model, the characteristics learned were not deep enough, so that the distinguishing degree from other categories was not high enough, and thus there were also many misclassifications and the accuracy was reduced.
Transportation: accuracy rate of 87%, the recall rate of 70%, F1-score of 0.78. The classification situation of traffic was very similar to the building category; the supposed reasons are the same, and will not be repeated.
Hydropower: accuracy rate of 75%, the recall rate of 94%, the F1-score of 0.84. The accuracy of hydropower was ordinary, but the recall rate was high. The reason is likely similar to the green plants class.
Other category: 77% accuracy, 44% recall, F1-score of 0.56. The other class had average accuracy, but the recall rate was very low, not even reaching 50%. That is to say, more than half of the data marked as other classes were classified into the remaining categories. Two possibilities were considered. One follows the above ideas: that is, that the sample types in this category were not rich enough. The second was misclassification when making labels. Because the definition of the other class was not clear, and those data related to typhoon disasters but not obviously belonging to the above four categories will be classified into other categories, this category is very subjective. It may be that some of the data in author’s opinion should not belong to the above four categories, but actually they do; the model correctly marked the data of some classification errors by comparing the characteristics, so that the recall rate of the other category was relatively low. The second possibility seems more likely in this case.
Useless class: accuracy rate of 79%, recall rate of 90%, F1-score of 0.84. Compared with the previous categories, it was seen that the final classification results of the useless class were superior not only in accuracy and recall rate, but its F1-score was also the highest. This was actually quite unexpected, because unlike the previous categories, any content data will be classified as useless as long as it is not related to the disaster. The authors originally thought that because of this arbitrariness, it would be difficult to classify useless classes, because arbitrariness means that the data characteristics of useless classes may also be diverse. If analyzed carefully, the model should not be able to achieve such a good effect by completely extracting the characteristics of useless classes, perhaps by means of reverse thinking. That is, if the last extracted feature of the sentence is not similar to the first five categories, then it is classified into the useless class, so the classification effect of the useless class actually depends on the classification effect of the first five categories.
Through the analysis, the classification effect of each type of data could be more clearly seen, as shown in Table 3. The rows and columns of the confusion matrix are arranged in the order of construction, green plants, transportation, water and electricity, others, and uselessness. Each row shows the distribution of the data with the corresponding label for that row, and each column shows the distribution of the labels of the data classified as that class. For example, the first line shows the distribution of the data with the building label after the classification was completed. Of these, 39 were classified as buildings, 1 was classified as green plants, 1 was classified as traffic, 3 were classified as hydropower, 0 were classified into other categories, and 11 were classified as useless. A total of 55 data: 39/55 = 0.71 is the recall rate, which can be found from the distribution of data with building tags. The building features learned by the model were generally consistent with the test set, but there were also some building data that were classified into useless classes. These should be the data of the building category with less obvious features, and therefore features not too similar to the building classes in the model, but since the data were labeled as a building, its features were not similar to those of other categories. Thus, they were classified as useless, that is, in the category where features were not identified as being disaster-related at all. Some readers may question why these data would be classified into the useless class rather than the other class, since the other class is at least related to disasters. The suggested reasons are as follows. From the above data, the prediction accuracy of the other class reached 77%, which was similar to the accuracy of the remaining categories, indicating that the features of the other category had been learned in the model. Therefore, it was found that the features of these data were not the same as those of the other class, and so they were not classified into the other class. Note the data in the first column, which represents the actual labels of the data that were finally classified into the building category. In other words, 39 of the data points classified as buildings were indeed in the building class, one was actually in green plants, and the other two were useless. A total of 42 data, 39/45 = 0.94 is the accuracy rate. It was seen that the differences between the characteristics of buildings and the other types of features learned by the model were still relatively large, so misclassification was rare.
The specific meanings of the rows and columns of the confusion matrix have been carefully described above. In fact, most of the information in the confusion matrix has been reflected in the analysis of the accuracy and recall rate of the previous part. Only by analyzing the confusion matrix, we can find out which classes of features in the model are not clearly separated, so it is easy to misclassify each other. For example, data of other class can be easily classified into useless class, which is hard to see by accuracy and recall.
This study has carried out a detailed analysis of the results obtained by using the 70% dataset, and obtained the relationship between the loss rate and the correct rate of the model and the number of training in experiment. And through the experiment in test set, it is proved that the prediction accuracy of the model can indeed reach 80%, and the effect and causes of the classification are analyzed. In the following, the experimental results of different size datasets are compared horizontally to find the relationship between the dataset size and the classification effect.

3.3.3. Comparison of Results of Datasets with Different Sizes

The results of one experiment have been thoroughly analyzed in the previous section. The final results of the other datasets were similar and will not be repeated. In this section, we mainly compare the effect of different size datasets on the accuracy of the model. Based on the results of the test set for each experiment, the statistical table is as follows:
The above Table 5 shows the classification effect corresponding to the datasets of different sizes. It can be seen that the accuracy rate increased with the increase of the dataset at the beginning, but after increasing to about 80%, there was a tendency to stabilize. As the dataset continued to increase, the accuracy of the model did not seem to increase accordingly. The number 80% has appeared many times in this paper; whether using a single training set or a different training set, the accuracy of the model could not easily break the 80% limit. Thus, 80% was the precision limit of the model in this paper.

3.3.4. Actual Forecasting Effect

In order to further test the generalization ability of the model, a verification experiment was carried out. We selected some Weibo data from another typhoon to see if the model can correctly classify it. The experimental process was as follows in Figure 9:
This study randomly selected 105 items of typhoon-related data. It was first manually classified, then the model is used for prediction, and finally, the two classification results are compared. After comparison, it was found that among the 105 data, there were 21 inconsistencies between the model prediction and the manual classification and the accuracy rate was 80%, which was consistent with the level on the test set. It is also worth mentioning that when there was a contradiction between manual classification and model prediction in the comparison process, most of the time it was indeed a prediction error of the model, but in some cases, the authors believe that the prediction of the model was more in line with the meaning of the data. With this in mind, the accuracy of the model could be slightly higher than 80%.

4. Conclusions

Starting from VGI, this paper used deep learning tools to process and classify microblog data collected after a typhoon occurred, and to extract information related to typhoon disasters to help prevent and mitigate disasters. The paper introduced the design of a classification system and the structure and function of a convolutional neural network model. The model was then programmed and implemented, and it was trained and verified by the dataset we designed. A typhoon disaster mining model with universality was obtained, which achieved 80% classification accuracy and has a certain practical value.
The biggest advantage of this model is that it is convenient and fast, our group finished the classification work in a week, and the same work could be done in two seconds using the model, which greatly reduces the labor and shortens the time required for classification. It has a high practical value in disaster situations where time and manpower are scarce. The disadvantage is that the accuracy of the model is not high enough, and the highest precision is currently around 80%. However, the accuracy is actually relative; the Sina Weibo data itself had some ambiguity. Unlike some texts classified in the past, such as sentiment analysis (positive and negative) or news classification, there were almost no difficulties and misjudgments for manual marking, this was not the case with Weibo data. In the authors’ experience of manually marking more than 3000 pieces of data, many data expressions were ambiguous and the mark-up took a lot of effort. Despite this, there were still some pieces of data that were considered inappropriately when looking back at the previous mark. Therefore, the extraction of Weibo data is different from general text classification. In other words, whether the accuracy of the model in this paper should be measured by general accuracy is still open to question.
There are basically three ways to improve: First, continue to increase the dataset; because the current number of data was in the thousands, which is a relatively small dataset, 80% may have been just because the dataset number was not enough. The second is to adjust the design of the classification system; because the current categories were just my own ideas, the boundaries between classes may not have been clear enough, especially in the other category. More scientific design would not only help to reduce the mistakes of manual classification and label making, but would also help to use the data. The third is to optimize the structure of the model to give it stronger learning ability.

Author Contributions

Y.J. and Q.Z. contributed to the work equally and should be regarded as co-first authors. Contributions from each author in this work can be described by: Literature search, Q.Z., Y.J.; Methodology, Y.J., Q.Z.; Software, Y.J.; Validation, Y.J., Q.Z. and C.S.C.; Data collection, Y.J., Data analysis, Y.J., Q.Z.; Data interpretation, Y.J., Q.Z.; Writing–Original Draft Preparation, Y.J.; Writing–Review & Editing, Q.Z. and C.S.C.; Supervision, Q.Z.; Project Administration, Q.Z.; funding acquisition, Q.Z.

Funding

This work was supported by the National Key Research and Development Program of China (Grant No. 2017YFC1405300).

Acknowledgments

This work was supported by the National Key Research and Development Program of China (Grant No. 2017YFC1405300). The authors would like to express their sincere thanks to the editors and anonymous reviewers for their valuable comments and insightful feedback.

Conflicts of Interest

The authors declare no conflict of interest. The funders had no role in the design of the study; in the collection, analyses, or interpretation of data; in the writing of the manuscript, or in the decision to publish the results.

References

  1. Goodchild, M.F. Citizens as sensors: The world of volunteered geography. GeoJournal 2007, 69, 211–221. [Google Scholar] [CrossRef]
  2. Li, D.R.; Qian, X.L. A Brief Introduction of Data Management for Volunteered Geographic Information. Geom. Inf. Sci. Wuhan Univ. 2010, 35, 379–383. [Google Scholar]
  3. Turner, A. The role of angularity in route choice: an analysis of motorcycle courier GPS traces. In Proceedings of the Spatial Information Theory, Aber Wrac’h, France, 21–25 September 2009; pp. 489–504. [Google Scholar]
  4. Heipke, C. Crowd Sourcing Geospatial Data. ISPRS J. Photogramm. Remote Sens. 2010, 65, 550–557. [Google Scholar] [CrossRef]
  5. Starbird, K. Digital Volunteerism During Disaster: Crowdsourcing Information Processing. In Proceedings of the Human Factors in Computing Systems, Vancouver, BC, Canada, 7–12 May 2011; pp. 7–12. [Google Scholar]
  6. Shan, J.; Qin, K.; Huang, C.; Hu, X.; Yu, Y.; Hu, Q.; Lin, Z.; Chen, J.P.; Jia, T. Methods of Crowd Sourcing Geographic Data Processing and Analysis. Geom. Inf. Sci. Wuhan Univ. 2014, 39, 390–396. [Google Scholar]
  7. Yates, D.; Paquette, S. Emergency knowledge management and social media technologies: A case study of the 2010 Haitian earthquake. Int. J. Inf. Manag. 2011, 31, 6–13. [Google Scholar] [CrossRef]
  8. Camponovo, M.E.; Freundschuh, S.M. Assessing uncertainty in VGI for emergency response. Cartogr. Geogr. Inf. Sci. 2014, 41, 440–455. [Google Scholar] [CrossRef]
  9. Liu, S.B. Crisis Crowdsourcing Framework: Designing Strategic Configurations of Crowdsourcing for the Emergency Management Domain. Comput. Supported Cooper. Work 2014, 23, 389–443. [Google Scholar] [CrossRef]
  10. Niu, H.Y.; Liu, M.; Lu, M.; Quan, R.S.; Zhang, L.J.; Wang, J.J. Risk Assessment of Typhoon Disasters in China Coastal Area during Last 20 Years. Sci. Geogr. Sin. 2011, 31, 764–768. [Google Scholar]
  11. Wang, L.H.; Hovy, E.; Dredze, M. The Hurricane Sandy Twitter Corpus. In Proceedings of the AAAI Workshop on the World Wide Web and Public Health Intelligence, Quebec, QC, Canada, 27 July 2014; pp. 20–24. [Google Scholar]
  12. Qu, Y.; Huang, C.; Zhang, P. Microblogging after a Major Disaster in China: A Case Study of the 2010 Yushu Earthquake. In Proceedings of the 2011 ACM Conference on Computer Supported Cooperative Work, CSCW 2011, Hangzhou, China, 19–23 March 2011. [Google Scholar]
  13. Yury, K.; Haohui, C.; Esteban, M. Performance of Social Network Sensors during Hurricane Sandy. PLoS ONE 2015, 10, e0117288. [Google Scholar]
  14. Wang, Y.D.; Wang, T.; Ye, X.Y. Using Social Media for Emergency Response and Urban Sustainability: A Case Study of the 2012 Beijing Rainstorm. Sustainability 2015, 8, 142–143. [Google Scholar] [CrossRef]
  15. Wang, D.; Qi, C.; Wang, H. Improving emergency response collaboration and resource allocation by task network mapping and analysis. Saf. Sci. 2014, 70, 9–18. [Google Scholar] [CrossRef]
  16. Lerman, K.; Ghosh, R. Information Contagion: An Empirical Study of the Spread of News on Digg and Twitter Social Networks. Comput. Sci. 2010, 52, 166–176. [Google Scholar]
  17. Lazo, J.K.; Bostrom, A.; Morss, R.E. Factors Affecting Hurricane Evacuation Intentions. Risk Anal. 2015, 35, 1837. [Google Scholar] [CrossRef] [PubMed]
  18. Dittus, M.; Quattrone, G.; Capra, L. Mass Participation during Emergency Response: Event-centric Crowdsourcing in Humanitarian Mapping. In Proceedings of the Acm Conference on Computer Supported Cooperative Work & Social Computing, Portland, OR, USA, 25 February–1 March 2017. [Google Scholar]
  19. Zhao, Q.S.; Chen, Z.; Liu, C.; Luo, N.X. Extracting and classifying typhoon disaster information based on volunteered geographic information from Chinese Sina microblog. Concurr. Comput. Pract. Exp. 2019, 31, e4910. [Google Scholar] [CrossRef]
  20. Neppalli, V.K.; Caragea, C.; Squicciarini, A.; Stehle, S. Sentiment analysis during Hurricane Sandy in emergency response. Int. J. Disaster Risk Reduct. 2017, 21, 213–222. [Google Scholar] [CrossRef] [Green Version]
  21. Neppalli, V.K.; Caragea, C.; Caragea, D.; Medeiros, M.C.; Tapia, A.H.; Halse, S.E. Predicting tweet retweetability during hurricane disasters. Int. J. Inf. Syst. Crisis Response Manage. 2016, 8, 32–50. [Google Scholar] [CrossRef]
  22. Kogan, M.; Palen, L.; Anderson, K.M. Think Local, Retweet Global: Retweeting by the Geographically-Vulnerable during Hurricane Sandy. In Proceedings of the 18th ACM Conference on Computer Supported Cooperative Work & Social Computing, Vancouver, BC, Canada, 14–18 March 2015. [Google Scholar]
  23. Guikema, S.D.; Nateghi, R.; Quiring, S.M. Predicting Hurricane Power Outages to Support Storm Response Planning. IEEE Access 2017, 2, 1364–1373. [Google Scholar] [CrossRef]
  24. Neppalli, V.K.; Caragea, C.; Caragea, D. Deep Neural Networks versus Naive Bayes Classifiers for Identifying Informative Tweets during Disasters. In Proceedings of the Information Systems for Crisis Response and Management Asia Pacific Conference, Rochester, NY, USA, 20–23 May 2018. [Google Scholar]
  25. Chew, C.; Eysenbach, G. Pandemics in the Age of Twitter: Content Analysis of Tweets during the 2009 H1N1 Outbreak. PLoS ONE 2010, 5, e14118. [Google Scholar] [CrossRef] [PubMed]
  26. Imran, M.; Diaz, F.; Elbassuoni, S. Practical Extraction of Disaster-Relevant Information from Social Media. In Proceedings of the 22nd International Conference on World Wide Web, Rio de Janeiro, Brazil, 13–17 May 2013. [Google Scholar]
  27. Michael, A. Nielsen, Neural Networks and Deep Learning, Determination Press 2015. Available online: http://neuralnetworksanddeeplearning.com (accessed on 22 July 2019).
  28. Mikolov, T.; Sutskever, I.; Chen, K.; Corrado, G.; Dean, J. Distributed representations of words and phrases and their compositionality. In Proceedings of the International Conference on Neural Information Processing Systems, Lake Tahoe, Nevada, 8–13 December 2013; pp. 3111–3119. [Google Scholar]
  29. Kim, Y. Convolutional Neural Networks for Sentence Classification. Comput. Sci. 2014, arXiv:1408.5882. [Google Scholar] [Green Version]
  30. Zhang, X.; Zhao, J.; Lecun, Y. Character-level Convolutional Networks for Text Classification. In Proceedings of the 28th International Conference on Neural Information Processing Systems, Montreal, QC, Canada, 7–12 December 2015; pp. 649–657. [Google Scholar]
Figure 1. Word embedding.
Jmse 07 00318 g001
Figure 2. Two-dimensional matrices of the same size.
Jmse 07 00318 g002
Figure 3. Neural network structure.
Jmse 07 00318 g003
Figure 4. Pre-classification process.
Jmse 07 00318 g004
Figure 5. Generation of the one-hot vector.
Jmse 07 00318 g005
Figure 6. Training process.
Jmse 07 00318 g006
Figure 7. Loss rate and number of trainings.
Jmse 07 00318 g007
Figure 8. Accuracy and number of trainings.
Jmse 07 00318 g008
Figure 9. Verification experiment.
Jmse 07 00318 g009
Table 1. Statistics of losses caused by typhoon anemone.
Provinces (Cities)People AffectedTransferredDiedHouses CollapsedDamaged
Zhejiang7,010,0001,546,0000510015,000
Shanghai361,000311,000250700
Jiangsu662,000126,00016002400
Anhui1,576,000163,0000150013,000
Table 2. Training result.
EpochIterTrain LossTrain AccVal LossVal Acc
101.812.50%1.815.16%
501.550.00%1.641.39%
1001.637.50%1.541.39%
2150156.25%1.161.48%
2000.5587.50%0.8474.59%
32500.9762.50%0.7873.36%
3000.775.00%0.776.64%
43500.7868.75%0.6578.69%
4000.2987.50%0.6578.28%
54500.3393.75%0.6478.28%
5000.6168.75%0.6378.28%
65500.12100.00%0.6579.51%
6000.14100.00%0.6378.69%
76500.09793.75%0.6179.92%
7000.3787.50%0.6379.92%
87500.086100.00%0.6879.92%
8000.051100.00%0.6680.33%
8500.064100.00%0.6580.74%
99000.2893.75%0.7378.69%
9500.088100.00%0.6779.51%
1010000.014100.00%0.7579.10%
10500.0161100.00%0.7680.74%
Table 3. Test result.
Test Loss0.62 Test Acc80.29%
Class NamePrecisionRecallF1-ScoreNumber of Entries in the Category
Building0.930.710.8055
Green plants0.800.860.8378
Transportation0.870.700.7857
Water and electricity0.750.940.8454
Other0.770.440.5654
Useless0.790.900.84189
Mean/sum0.810.800.80487
Table 4. Confusion matrix.
Class NameBuildingGreen PlantsTransportation Water and ElectricityOtherUseless
Building39113011
Green plants1670226
Transportation05400111
Water and electricity0005103
Other04382415
Useless27244170
Table 5. The relationship between the size of the dataset and the accuracy.
Size of the Dataset0.50.60.70.80.91.0
Accuracy70.61%74.70%80.29%78.64%77.39%79.66%

