Article

Numerical Simulations of Wave-Induced Soil Erosion in Silty Sand Seabeds

College of Civil Engineering and Architecture, Zhejiang University, Hangzhou 310058, China
*
Author to whom correspondence should be addressed.
J. Mar. Sci. Eng. 2019, 7(2), 52; https://doi.org/10.3390/jmse7020052
Submission received: 10 January 2019 / Revised: 17 February 2019 / Accepted: 18 February 2019 / Published: 20 February 2019
(This article belongs to the Special Issue Coastal Geohazard and Offshore Geotechnics)

Abstract

:
Silty sand is a kind of typical marine sediment that is widely distributed in the offshore areas of East China. It has been found that under continuous actions of wave pressure, a mass of fine particles will gradually rise up to the surface of silty sand seabeds, i.e., the phenomenon called wave-induced soil erosion. This is thought to be due to the seepage flow caused by the pore-pressure accumulation within the seabed. In this paper, a kind of three-phase soil model (soil skeleton, pore fluid, and fluidized soil particles) is established to simulate the process of wave-induced soil erosion. In the simulations, the analytical solution for wave-induced pore-pressure accumulation was used, and Darcy flow law, mass conservation, and generation equations were coupled. Then, the time characteristics of wave-induced soil erosion in the seabed were studied, especially for the effects of wave height, wave period, and critical concentration of fluidized particles. It can be concluded that the most significant soil erosion under wave actions appears at the shallow seabed. With the increases of wave height and critical concentration of fluidized particles, the soil erosion rate and erosion degree increase obviously, and there exists a particular wave period that will lead to the most severe and the fastest rate of soil erosion in the seabed.

1. Introduction

Silty sand is widely distributed in the eastern coast of China, among which the most representative area is the Yellow River subaqueous delta. According to the in-situ survey data [1], the silty sand sediment (typical median particle size less than 50.00 µm, silt content over 80%) accounts for 90% of the northeast of the delta. There commonly exists a kind of hard crust with a thickness of 2.00–3.00 m in the shallow stratum of seabeds. Sumer et al. [2] presented the results of an experimental investigation of the complete sequence of sediment behavior beneath progressive waves and reported a similar hard crust in sandy seabeds. The main reason for the formation of hard crust was thought to be the compaction or solidification of sand layers induced by waves. However, for silty sand seabeds, the coarse and fine particles coexist and the particle size distribution varies greatly. Thus, the inner mechanism becomes different and complicated. Under wave actions, fine particles filling in the pore space tend to move with the seepage flow, but the coarse particles remain in their initial positions. This characteristic has been verified by the previous work of Shi [3]. Using a scanning electron microscope, Shi [3] investigated the micro-structures of the hard crust, and found that the hard crust is constituted of uniform coarse particles and a few fine particles. Based on a lot of field and experimental tests, Jia et al. [1] pointed out that the hard crust is mainly caused by the wave-induced reformation and erosion of the sediments near the surface. As shown in Figure 1a [4], under continuous wave actions, plumes of sediment deposit over the seabed surface due to the upward movement of fine particles. Figure 1b [4] shows the micro-holes in the silty sediment as the result of fine particle transportation. This phenomenon is also named “seabed coarsening”. The seabed coarsening phenomenon commonly appears in shallow seabeds, but currently suitable theoretical or numerical models are still lacking for the wave-induced erosion process of silty sand seabeds. The coarsening phenomenon of the seabed will lead to the increase of soil permeability, which is the most important effect that can significantly affect the potential and the depth of seabed liquefaction. In addition, the mechanical properties of seabed soil will also be changed when seabed coarsening is occurred.
As mentioned above, the soil erosion is induced by the seepage flow within the seabed under wave actions. Under the extreme wave condition, the excess pore-pressure is always large enough for the occurrence of soil liquefaction, and thus soil particles will be repositioned and reconsolidated [5]. For the normal wave condition, the wave height is small and continuous seepage flow can be induced, so some fine particles in the silty sand seabed move upwards under the seepage force, and the coarsening phenomenon will emerged in shallow seabeds [6], as shown in Figure 2. It is also pointed out that the hydrodynamic condition plays a significant role in topography construction and seabed erosion process.
In this paper, a three-phase soil model (soil skeleton, pore fluid, and fluidized soil particles) was established to study the soil erosion process induced by waves in the silty sand seabed. In the numerical simulation, the Darcy flow law, mass conservation, and generation equations were coupled into COMSOL Multiphysics [7] to perform the studies. COMSOL Multiphysics is a kind of finite element method (FEM) software which is developed by COMSOL INC found in Stockholm, Sweden. Jeng et al. [8] discussed two mechanisms for wave-induced pore pressures in a porous seabed, i.e., oscillatory, residual excess pore pressures, and an analytical solution for the wave-induced residual pore pressure was derived. Using the residual pore-pressure analytical solution [8], the process of wave-induced soil erosion was investigated. Then, the parametric studies were performed to study the influences of wave height, wave period, and critical concentration of fluidized particles on the erosion process in the seabed. It is found that the most significant soil erosion mainly occurred at the shallow seabed. With the increases of wave height and critical concentration of fluidized particles, the soil erosion rate and erosion degree increase obviously, and there exists a particular wave period that will lead to the most severe and the fastest rate of soil erosion in the seabed.

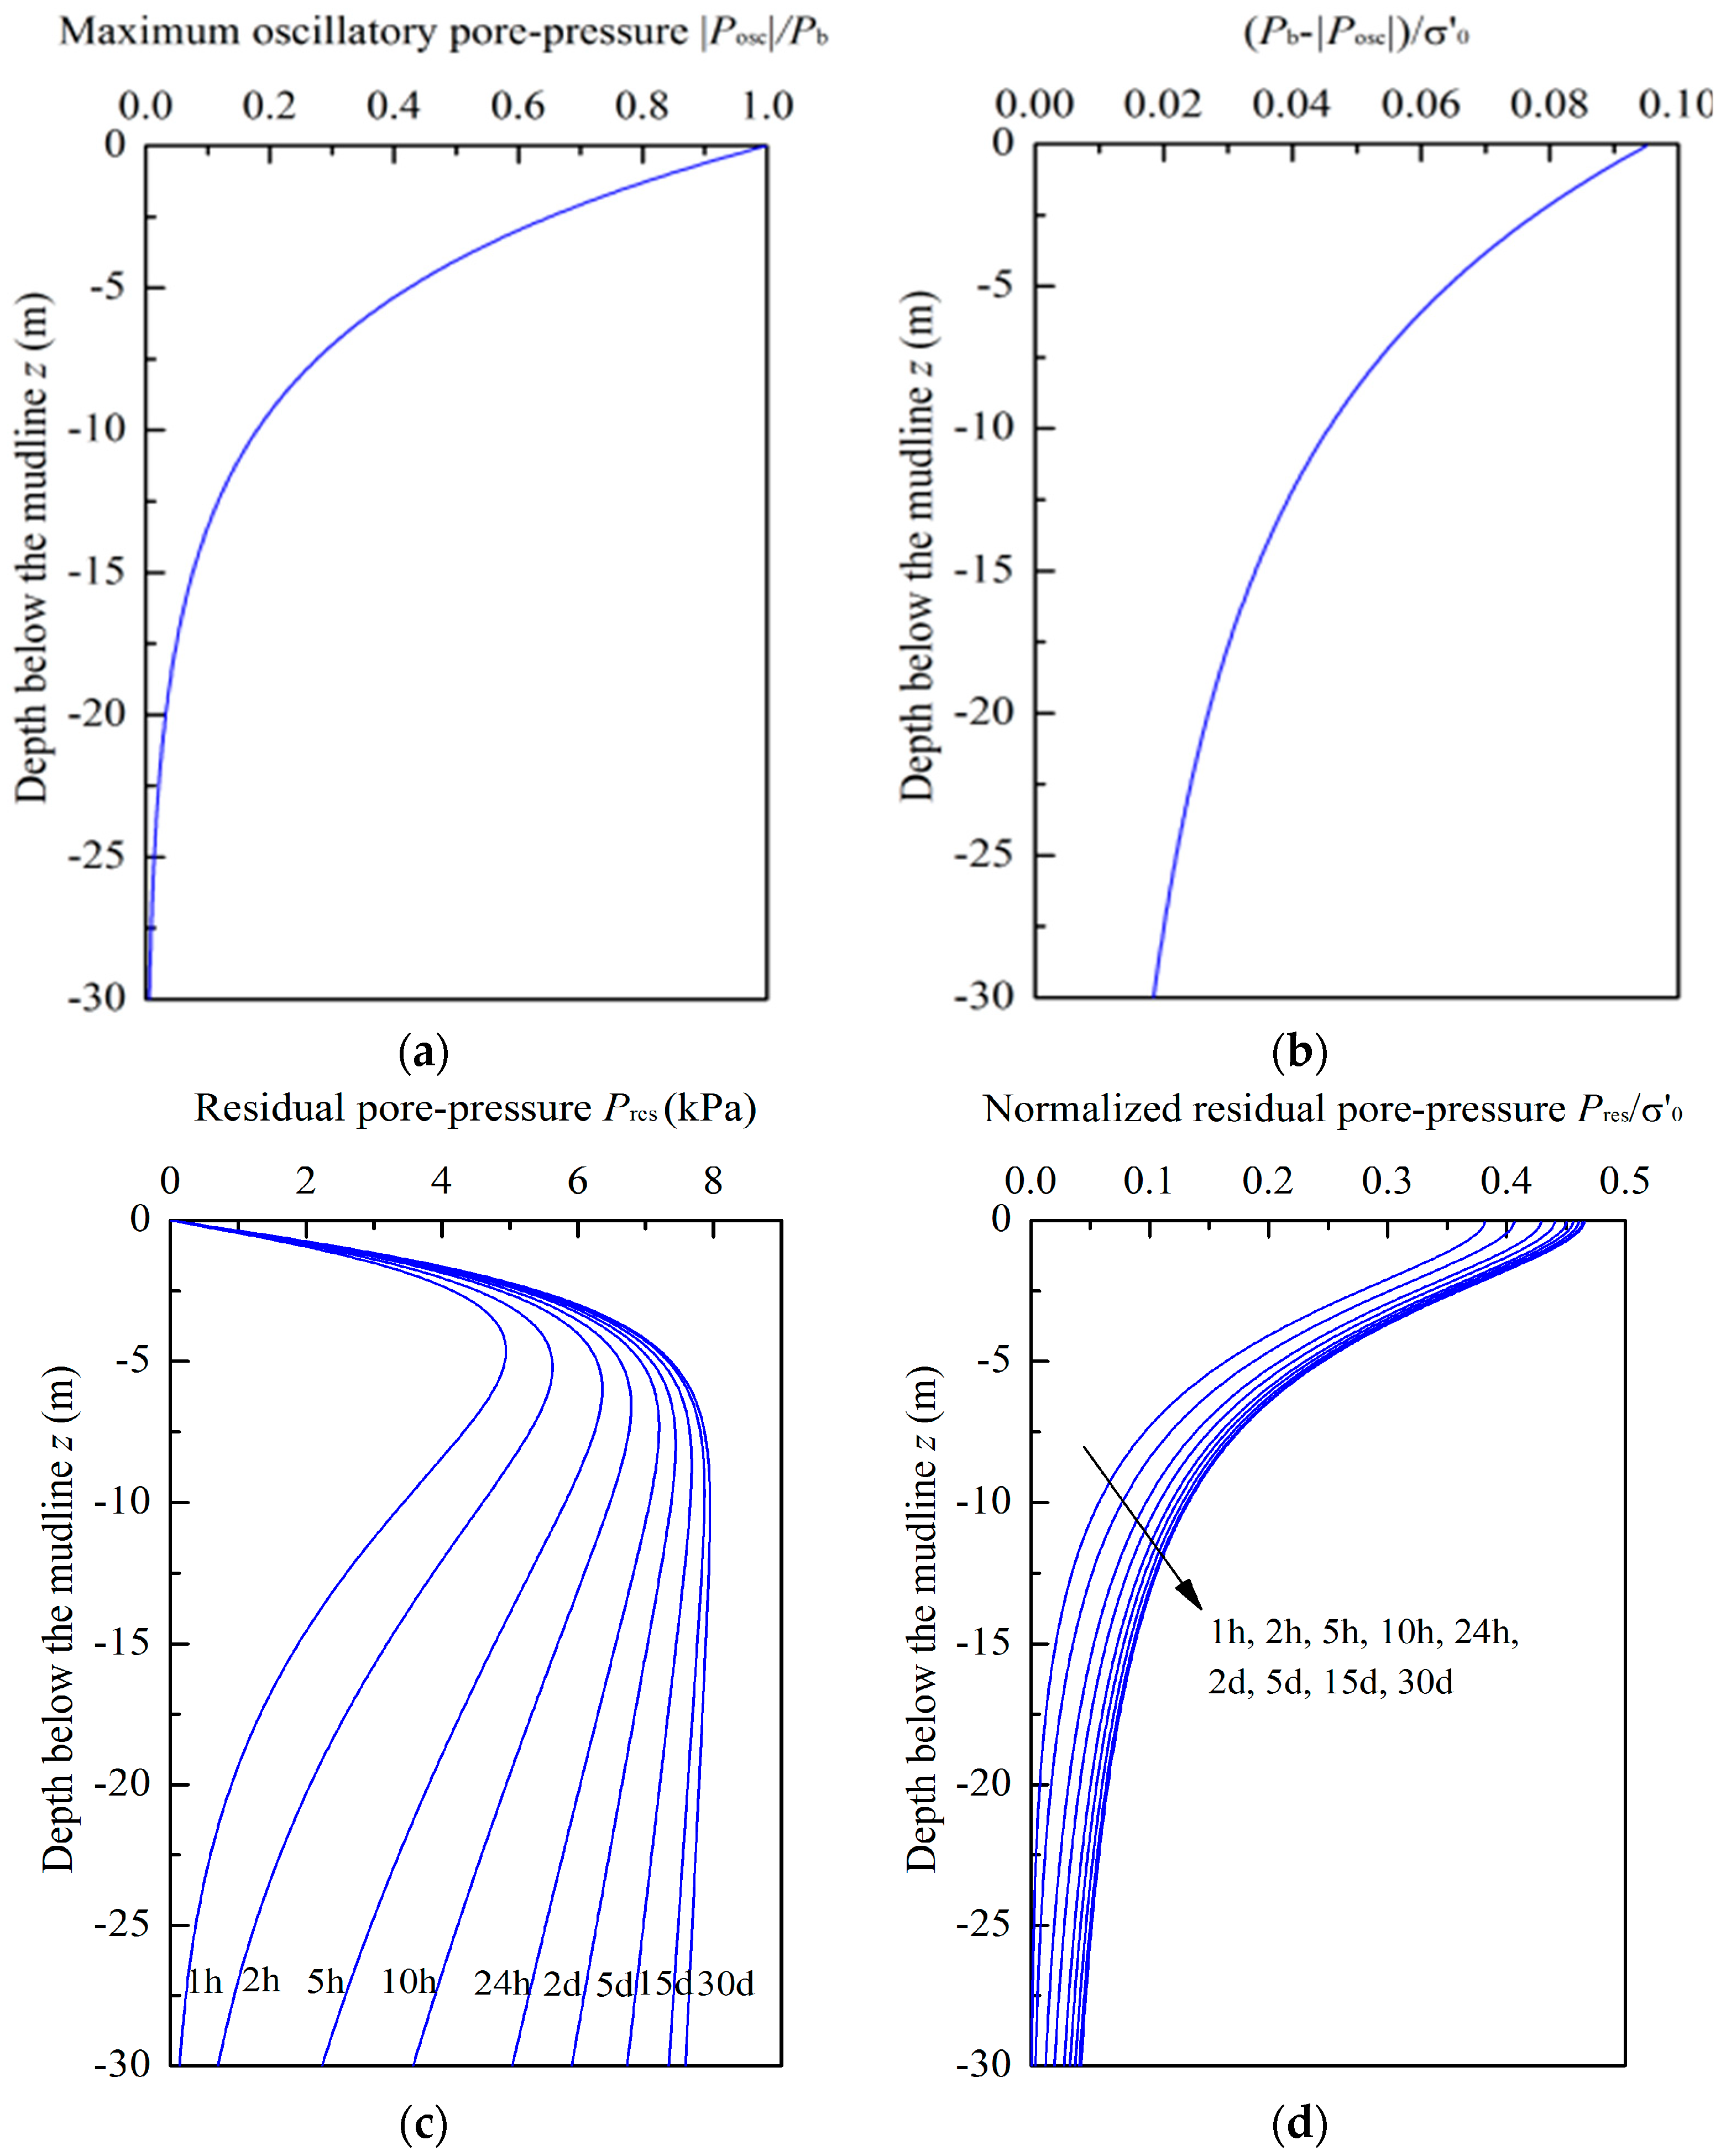
2. Analytical Solution for Wave-Induced Pore-Pressure Accumulation

Generally speaking, based on the generation mechanism, as shown in Figure 2, the total excess pore-pressure is composed of the oscillatory pore-pressure and the residual pore-pressure when waves propagate along the seabed surface [5,9,10,11,12], and it can be expressed by
P = P o s c + P r e s
where Posc is the oscillatory pore-pressure corresponding to the elastic deformation of the soil skeleton. Posc fluctuates in both temporal and spatial domains, and the fluctuation is accompanied by the attenuation of the amplitude and phase lag under wave actions [13,14,15]. Pres is the residual pore-pressure that is period-averaged, and is the result of accumulated plastic deformation of the soil skeleton. It has been acknowledged recently that with the accumulation of pore-pressure, continuous seepage flow appears near the seabed surface and may lead to obvious particle migration [16,17,18].
Many studies have been performed for the accumulation of excess pore-pressure in the seabed induced by waves [8,19,20,21,22]. According to Jeng et al. [8], for the waves, according to linear wave theory, the residual pore-pressure in infinite thickness seabed can be derived based on Biot’s consolidation equation in one-dimension [23], and the analytical solution can be expressed as
P r e s = 2 A c v λ k 3 [ 1 ( λ k z 2 + 1 ) exp ( λ k z ) 1 π 0 exp ( r c v λ k 2 t ) r ( r + 1 ) 2 sin ( r λ k z ) d r ]
A = γ ( 1 + 2 K 0 ) 3 T [ 3 P b k s β ( 1 + 2 K 0 ) γ ] 1 / η
λ k = k s η
where cv is the consolidation coefficient, K0 is the coefficient of lateral earth pressure, β and η are empirical constants, which can be confirmed based on the soil type and the relative density [24], ks is the wave number, T is the wave period, and Pb is the amplitude of the dynamic wave pressure on the seabed surface.

3. Theoretical Model for Soil Erosion Process

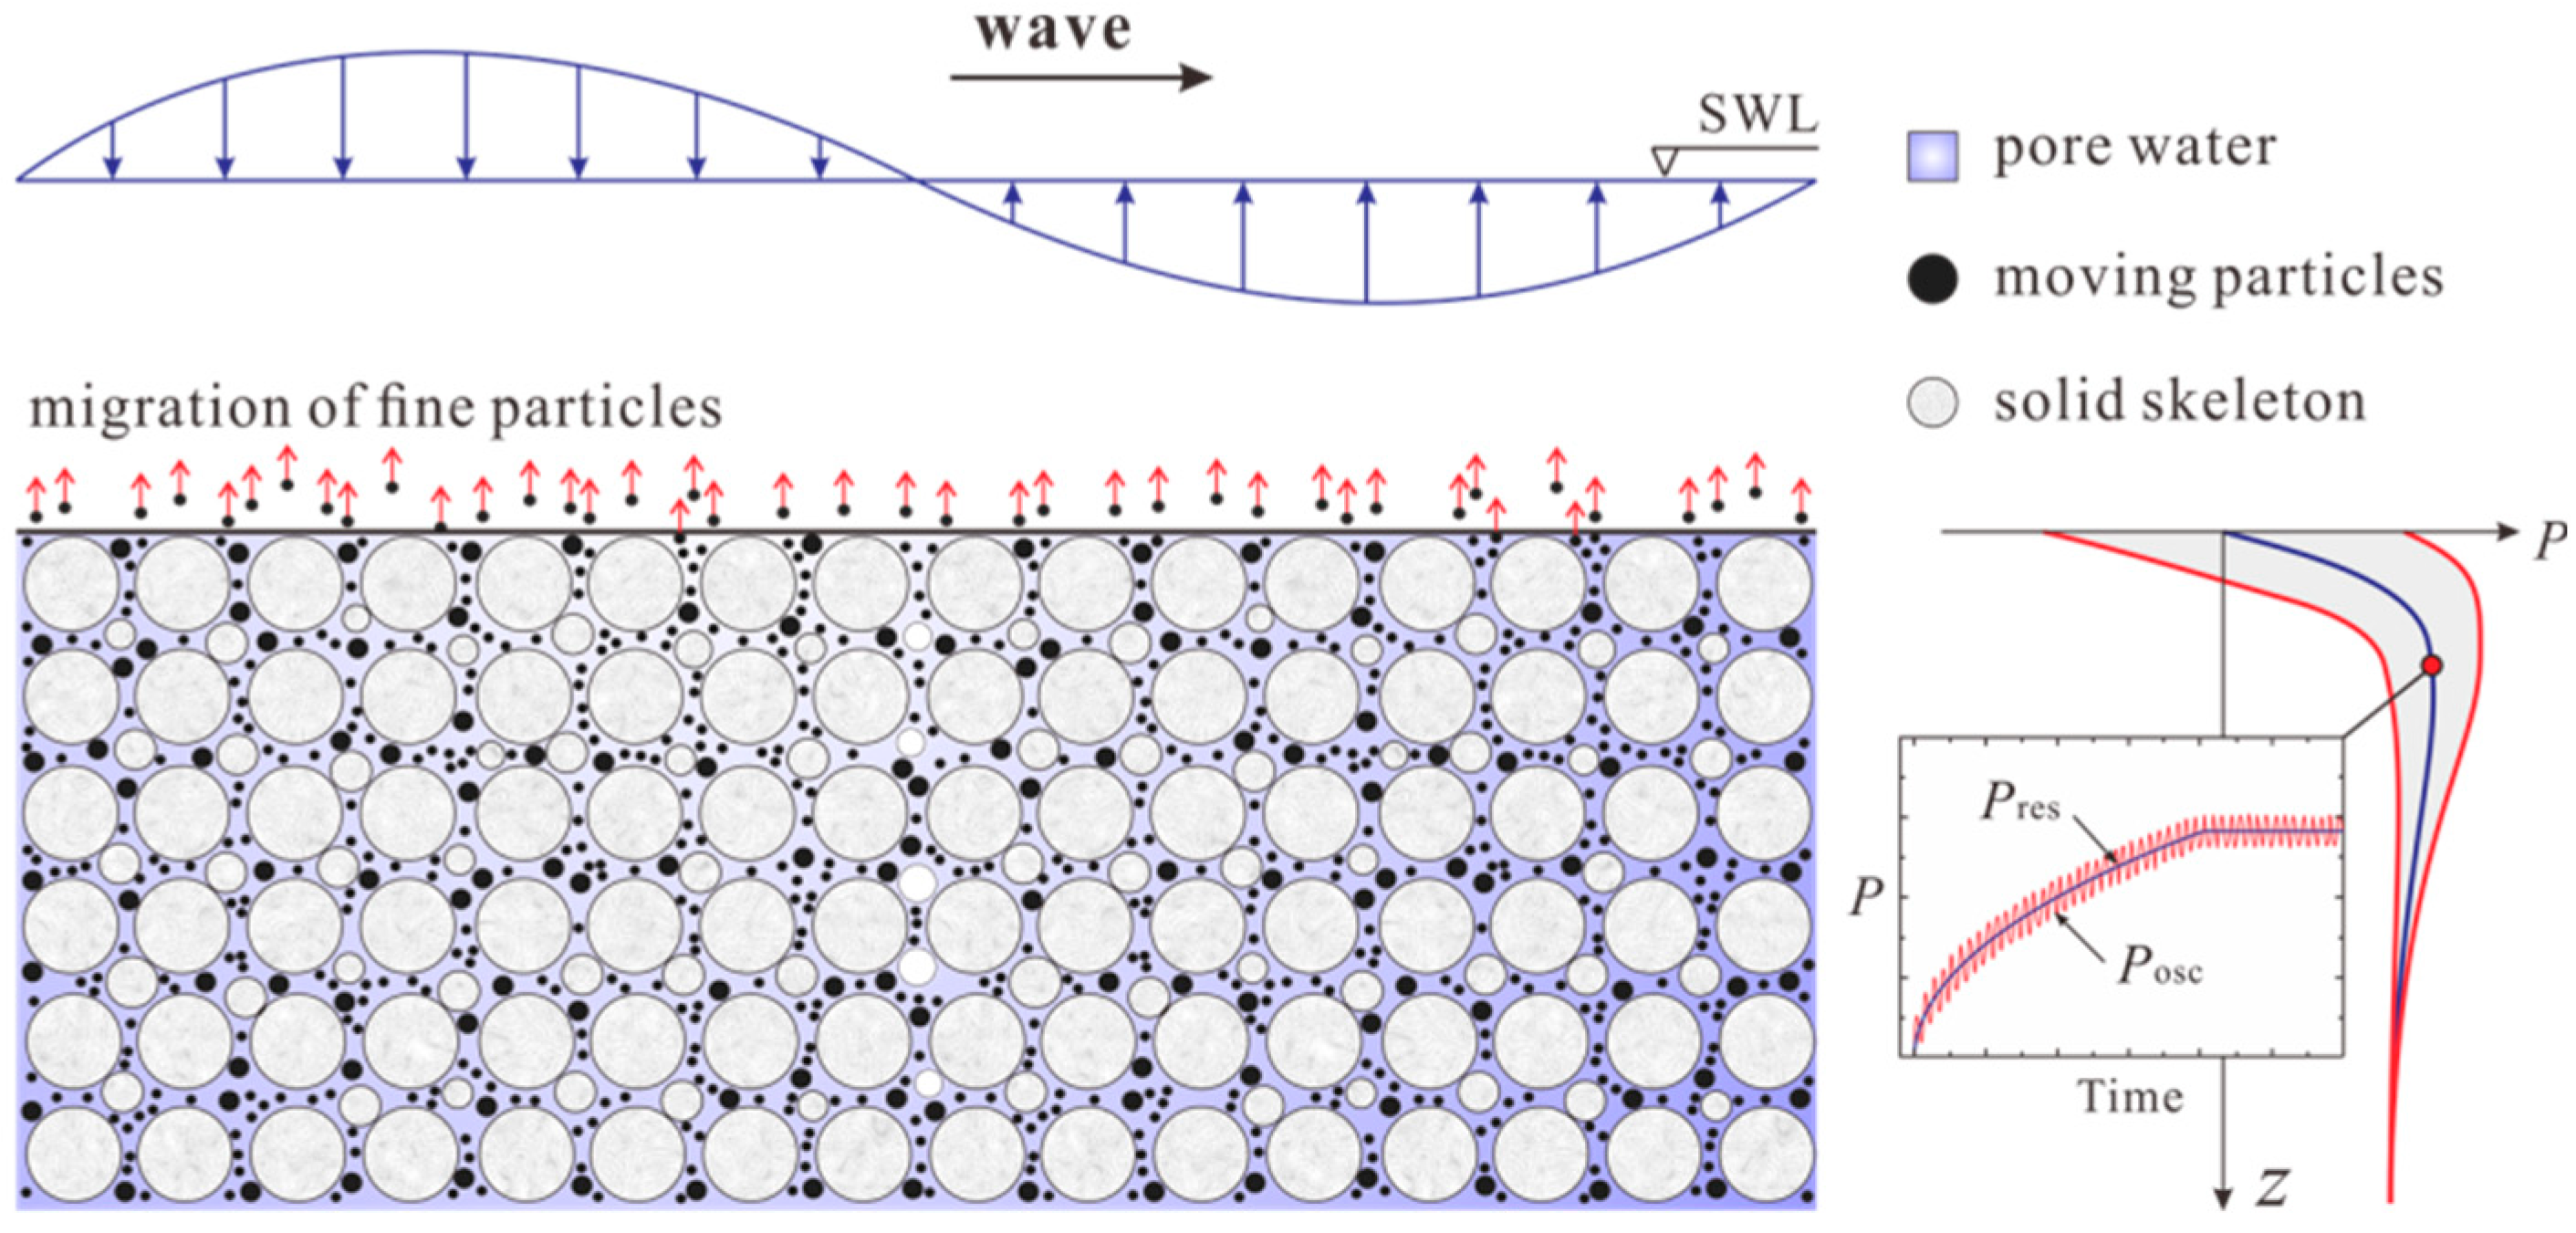
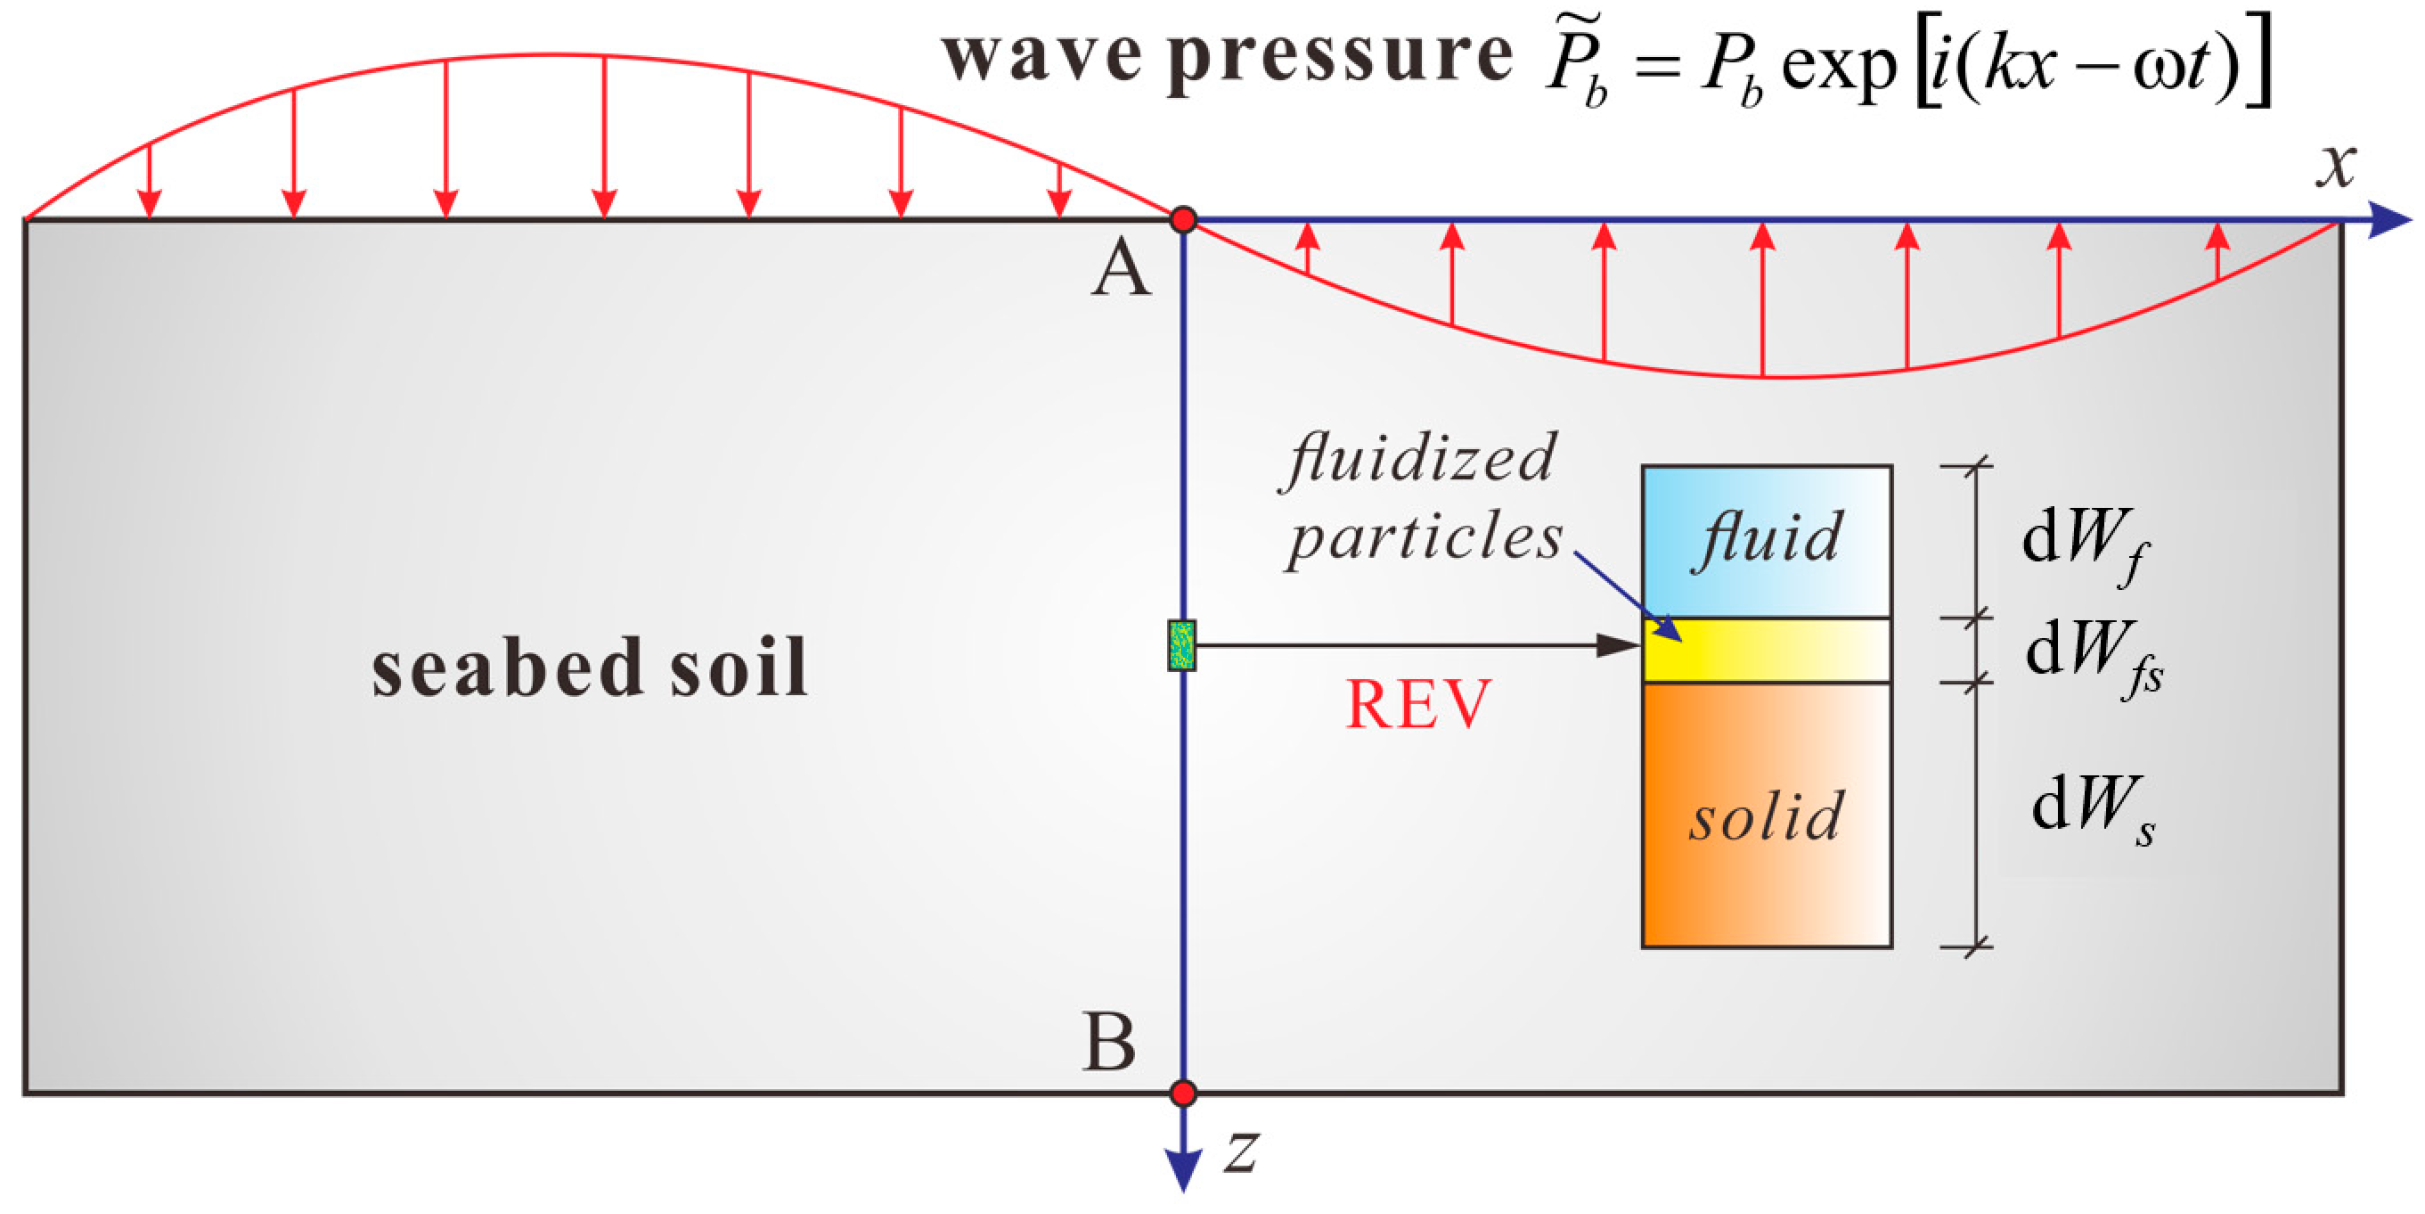
3.1. Definition of Three-Phase Soil Model

As shown in Figure 3, under the effect of wave-induced seepage, the transportation of the fine particles will be induced. In this paper, a kind of three-phase soil model is defined and used to simulate the transportation process of fine particles. The three-phase model was first proposed by Vardoulakis et al. [25] to analyze the sand production problem. Accordingly, the soil element is defined to be the combination of the soil skeleton (s), pore fluid (f), and fluidized soil particles (fs), which can be expressed as
d W = d W f + d W f s + d W s
where dW, dWf, dWf s, and dWs are the volumes of the soil element, soil skeleton, pore fluid, and fluidized soil particles, respectively. The masses of soil element, soil skeleton, pore fluid, and fluidized soil particles are represented by dM, dMf, dMfs, and dMs, respectively.
In the three-phase model, the velocities of the three phases are
v f s = v f = v ¯
v s = 0
where v f s , v f , v ¯ , v s are the velocities of the fluidized soil particles, pore fluid, the mixture (pore fluid and fluidized soil particles), and soil skeleton, respectively.
The concentration of the fluidized soil particles c can be expressed by
c = d W f s d W f s + d W f
The soil porosity φ can be defined as
φ = d W f + d W f s d W
The density of the mixture ρ ¯ is
ρ ¯ = ( 1 c ) ρ f + c ρ s
where ρf, ρs are the densities of the pore fluid and the solid skeleton.
The apparent density of the fluidized soil particles can be defined as
ρ ¯ f s = d M f s d W = c φ ρ s
The volume discharge rate q ¯ and the velocity v ¯ of the mixture are
q ¯ = d W ¯ d S d t
v ¯ = d W ¯ d S ¯ d t = d W ¯ φ d S d t = q ¯ φ
where d W ¯ is the volume of the mixture through the cross-sectional d S within dt time, d S ¯ is the pore part of d S .

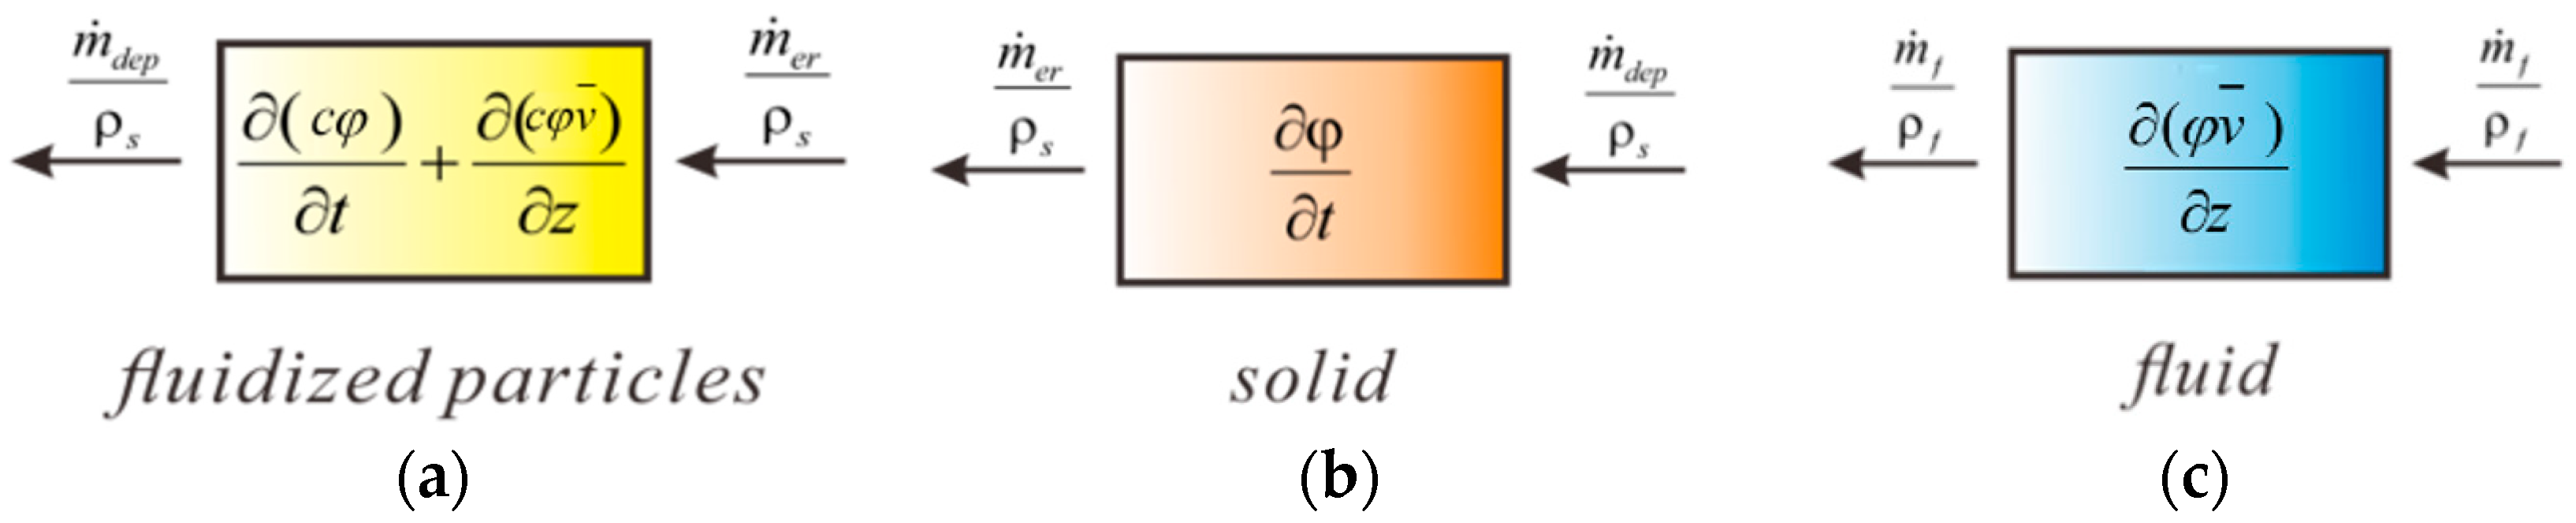
3.2. Mass Conservation Equations

Vardoulakis et al. [25] and Sterpi [26] introduced the mass conservation equation of the three-phase in one-dimension shown as
ρ α t + z ( ρ α v α ) = m ˙ α
where m ˙ α is the mass generation term, which means the mass generation rate of phase α (the phase α can represent the fluidized particles phase with subscript fs or solid phase with subscript s or fluid phase with subscript f), and ρ α t is the density change rate with time of phase α.
In detail, the three phases can be expressed as follows and the related diagrams are shown in Figure 4.
(1) Fluidized soil particles
Combining Equation (6), (11), and (14), the mass conservation equation of the fluidized soil particles can be expressed as
( c φ ) t + z ( c φ v ¯ ) = m ˙ ρ s
where m ˙ = m ˙ e r m ˙ d e p , m ˙ e r is the rate of eroded mass and m ˙ d e p is the rate of deposited mass.
(2) Soil skeleton
Here, we divided the soil element into the solids (index 1) and the mixture (index 2). According to Equation (14), the mass conservation equations of the two phases are
m ˙ = ρ 1 t + z ( ρ 1 v 1 )
m ˙ = ρ 2 t + z ( ρ 2 v 2 )
where ρ1, ρ2 are the densities of the soil phase and the mixture phase, v1, v2 are the velocities of the soil phase and the mixture phase.
The mass conservation equation of the soil skeleton is
φ t = m ˙ ρ s = m ˙ e r m ˙ d e p ρ s
Using Equation (18), Equation (15) can be re-expressed by
φ t = ( c φ ) t + z ( c φ v ¯ )
(3) Pore fluid
Combining Equation (10) and (15), Equation (17) can be transformed into
t [ ( 1 c ) φ ] + z [ φ ( 1 c ) v ¯ ] = 0
With Equation (19), Equation (20) can be re-expressed by
( φ v ¯ ) z = 0
Thus, the simplifications of these three equations are
{ φ t = m ˙ ρ s φ t = ( c φ ) t + z ( c φ v ¯ ) ( φ v ¯ ) z = 0
There are four basic variables ( φ , m ˙ , c , v ¯ ) in Equation (22), and a constituted equation for m ˙ is needed to solve the problem.

3.3. Constitutive Laws of Mass Generation

The rate of the soil erosion m ˙ e r can be expressed by
m ˙ e r = ρ s λ ( 1 φ ) c q ¯
where λ is the parameter used to describe the spatial frequency of the potential erosion starter points in the soil skeleton of the porous medium and can be obtained using experiments [25]. It can be seen that m ˙ e r is proportional to c, which means the erosion process can go on until c is equal to 0. The particle deposition takes place in parallel with the particle erosion. According to Vardoulakis et al. [25], the particle deposition rate can be expressed by
m ˙ d e p = ρ s λ ( 1 φ ) c 2 c c r q ¯
Combining Equations (23) and (24), the net particle erosion m ˙ can be expressed by
m ˙ = m ˙ c r m ˙ d e p = ρ s λ ( 1 φ ) ( c c 2 c c r ) q ¯

3.4. Darcy Flow Law

With the loss of fine particles in the erosion process, the grain size distribution of the silty sand will be changed and the soil porosity will be increased. Grain size distribution of sand affects its permeability. It is known that poorly-graded soil has higher porosity and its permeability is larger than that of the well-graded soil, in which smaller grains tend to fill the voids between larger grains. According to the Carman-Kozeny equation [27], the relationship between the soil permeability and the porosity can be described as
k = K φ 3 ( 1 φ ) 2
where k is the soil permeability, K is the reference permeability.
The seepage flow under hydraulic gradient can be described by Darcy flow law [28], shown as
q ¯ = k η k ρ ¯ P z
where η k is the kinematic viscosity of the mixture of pore fluid and fluidized particles.

3.5. Governing Equations for Soil Erosion

By including mass conservation equations, mass generation law, and Darcy flow law, the governing equations for the soil erosion process induced by waves in one-dimension are shown in Equation (28).
{ φ t = ( c φ ) t + ( c q ¯ ) z φ t = λ ( 1 φ ) ( c c 2 c c r ) q ¯ ( q ¯ ) z = 0 q ¯ = K φ 3 ( 1 φ ) 2 η k ρ ¯ P z
In Equation (28), the basic variables are only φ , c , P, and all of which are the functions of time t and position z.

4. Numerical Implement of Seabed Erosion Model and Simulations

In this section, a numerical model was established to analyze the erosion process of silty sand seabeds induced by waves. COMSOL Multiphysics is a kind of general-purpose simulation software for FEM modelling in all fields of engineering and scientific research [7]. In this paper, the Partial Differential Equation (PDE) module was used for the secondary development. In detail, the numerical implement process can be described as follows. Firstly, the residual pore-pressure in the seabed induced by waves can be obtained using Equation (2) proposed by Jeng [8]. The distribution of the residual pore-pressure is inputted into the seabed erosion model. Then, with full drainage conditions on the seabed surface and the impermeable seabed bottom, the Darcy seepage process can be solved. For the seabed erosion model, the PDE module in COMSOL is used to solve Equation (28), thus the erosion process (changes of φ, c) can be obtained. In the numerical model, the Lagrange shape function and the quadratic element order were adopted. The backward difference method was selected to discretize the time domain and the Newton-Raphson method was used to solve the governing equations iteratively. To satisfy the request of convergence, the time step Δ t satisfy
Δ t l E / ρ s
where l is length of the minimum element, E is elastic modulus of soil.
In the numerical model, the geometry of seabed depth ds is equal to 30.00 m and the average mesh size is 0.1 m. More parameters can be listed as follows: water depth dw = 10.00m, wave height H = 2.00 m, wave period T = 5.00 s, wave length L = 36.59 m. According to the judgement criterion about the seabed depth [12], ds/L = 0.82>0.3, and thus the depth of seabed can be treated as infinite thickness. For the soil condition, the initial porosity φ0 = 0.42, initial concentration of the fluid soil particles c0 = 0.001. More details can be found in Table 1. For a typical wave condition, a series of numerical studies have been performed. It is known that the wave-induced erosion is not only associated with soil properties, but also closely related to wave characteristics. So, the influences of wave height H, wave period T, and critical concentration of the fluidized soil particles c c r on the process of wave-induced erosion were discussed. The simulation cases are listed in Table 2.

5. Time Characteristics of Wave-Induced Soil Erosion Process

To investigate the time characteristics of the wave-induced soil erosion process, a typical wave condition case under normal sea state was analyzed in the simulation. The wave acting time t was selected as 1 h, 2 h, 5 h,10 h, 24 h, 2 d, 5 d, 15 d, 30 d (h is one hour and d refers to one day), respectively. The distributions of the oscillatory pore-pressure and the residual pore-pressure in the seabed are shown in Figure 5. As shown in Figure 5a, the dimensionless maximum oscillatory pore-pressure | P o s c | /Pb decreases from 1.00 on the seabed surface to 0 at the −30.00 m depth. The liquefaction of the seabed can be divided into the oscillatory and residual liquefactions [5]. According to Jeng et al. [8] and Okusa [29], the criterions of oscillatory and residual liquefactions are P o s c σ 0 1 and P r e s σ 0 1 , respectively ( σ 0 is the effective vertical stress of soil). Figure 5b indicates that the oscillatory liquefaction will not occur under the typical wave condition. Figure 5c shows the evolution of the residual pore-pressure along depths. It is noted that the residual pore-pressure develops gradually with the extension of wave acting time and tends to be stable. The maximum value of Pres occurs at about −5 m to −10 m (below the seabed surface) depth in the whole process of wave actions. In Figure 5d, it also reveals that there is no potential soil liquefaction in the seabed with the accumulation of Pres. Under normal sea state, the soil erosion is the common behavior for the silty sand seabed.
In the erosion process, part of the soil skeleton is transformed into fluidized particles, which remain in suspension under the effect of seepage flow, and thus the concentration of fluidized particles will be increased. Figure 6 shows the variations of c along depth for different wave acting times. It shows that the maximum value of c occurs on the seabed surface in the erosion process. For the shallow depth (within −2.00 m), c increases from the initial value 0.001 to the critical value 0.30 and then keeps a stable state. When the wave acting time t = 30 d, the seabed depth affected by wave-induced erosion is up to −4.00 m.
The soil porosity increases with the loss of fine particles during the erosion process. It can be seen in Figure 7 that the soil porosity gradually increases with the extension of wave acting time at shallow depths (within −5.00 m), and the soil porosity in deep depths remains almost constant. When the wave acting time is less than 24 d, the maximum value of soil porosity occurs on the seabed surface. After 24 d, the most severe erosion occurs at the depth of about −0.50 m, and the soil porosity keeps the value of 0.55 on the seabed surface. It illustrates that the greatest loss of fine particles occurs at approximately −0.50 m depth. The evolution of soil permeability in the erosion process is shown in Figure 8. It is shown that k/k0 increases with the extension of wave acting time and the maximum value reaches 4.10 at −0.50 m depth after 24 d. When t = 30 d, the depth with k/k0 over 2.00 is around −2.30 m. These results indicate that the soil permeability increases significantly with the extension of wave acting time at the shallow seabed.
Two physical quantities c t and φ t are introduced in this paper to describe the rate of the soil erosion at every moment, as shown in Figure 9. It can be seen that the erosion rate firstly increases until reaching the peak value, and then gradually decreases. The deeper the seabed soil, the later the peak values of c t , φ t can reach and the smaller the peak values of c t , φ t . On the seabed surface, the erosion rate reaches the peak value fastest and decreases to negative values, which indicates that the deposition effects play an obvious role in the later stage of the erosion process.

6. Results for Affecting Factors and Interpretations

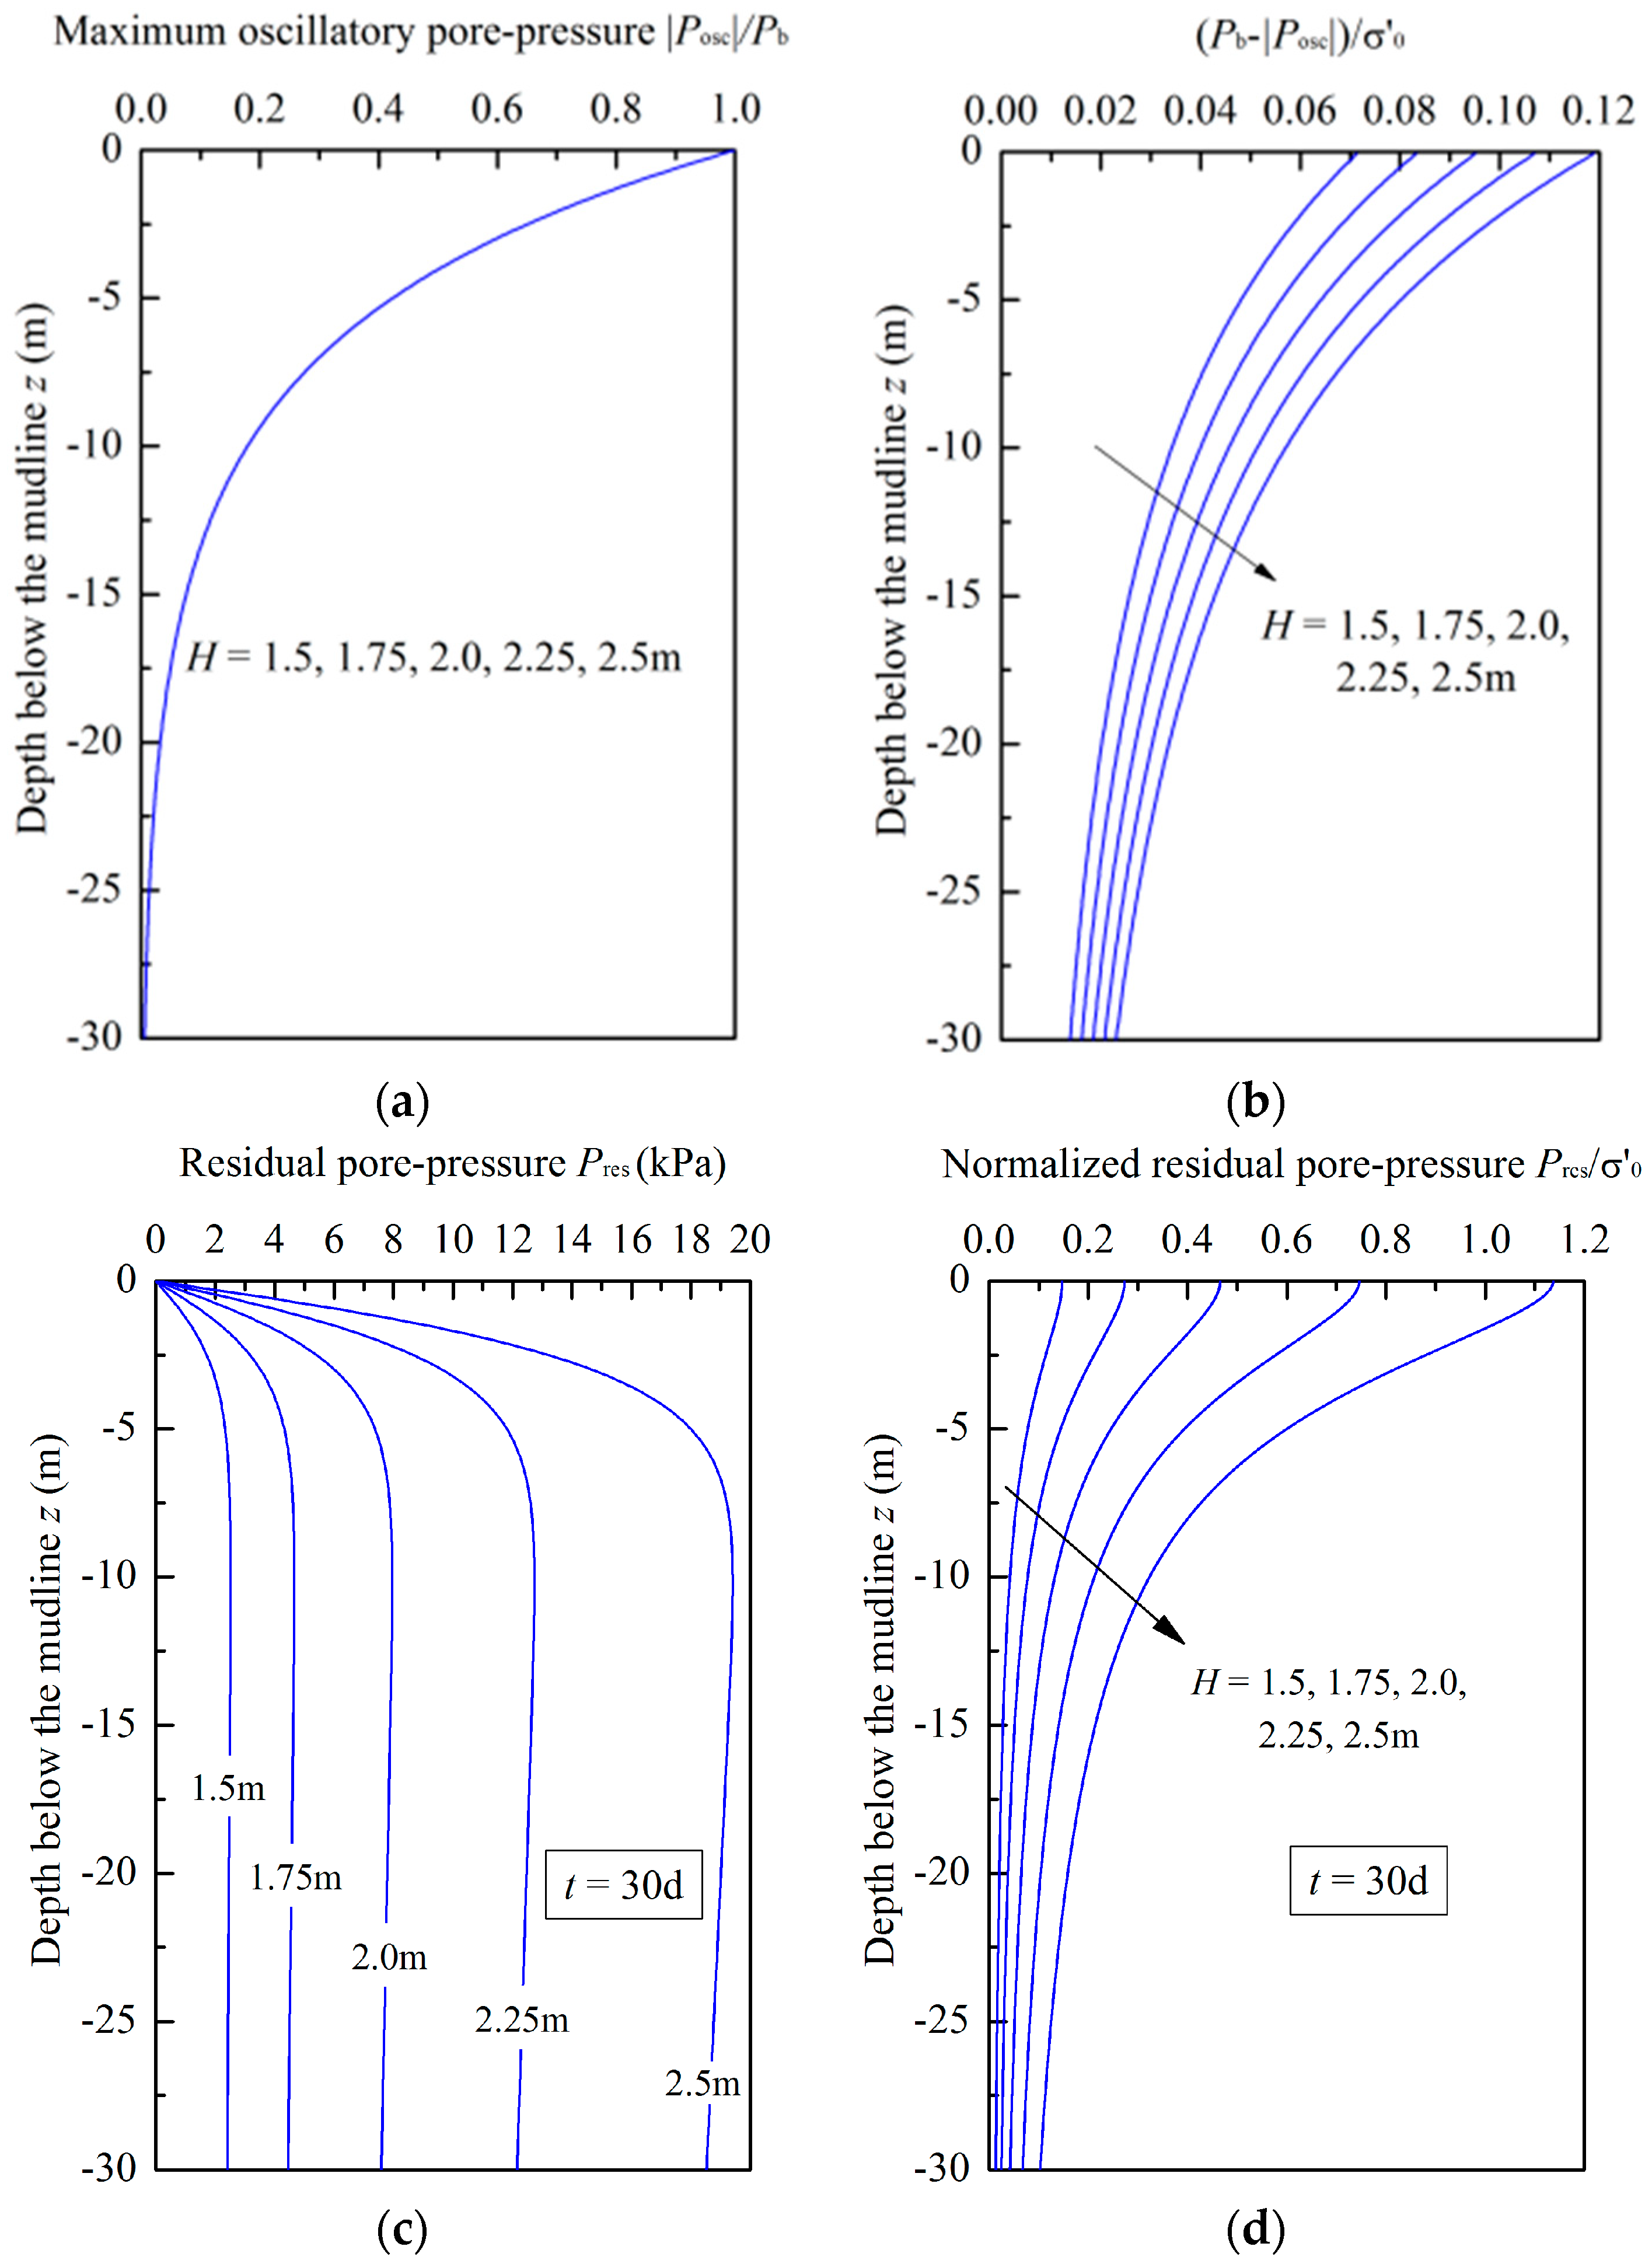
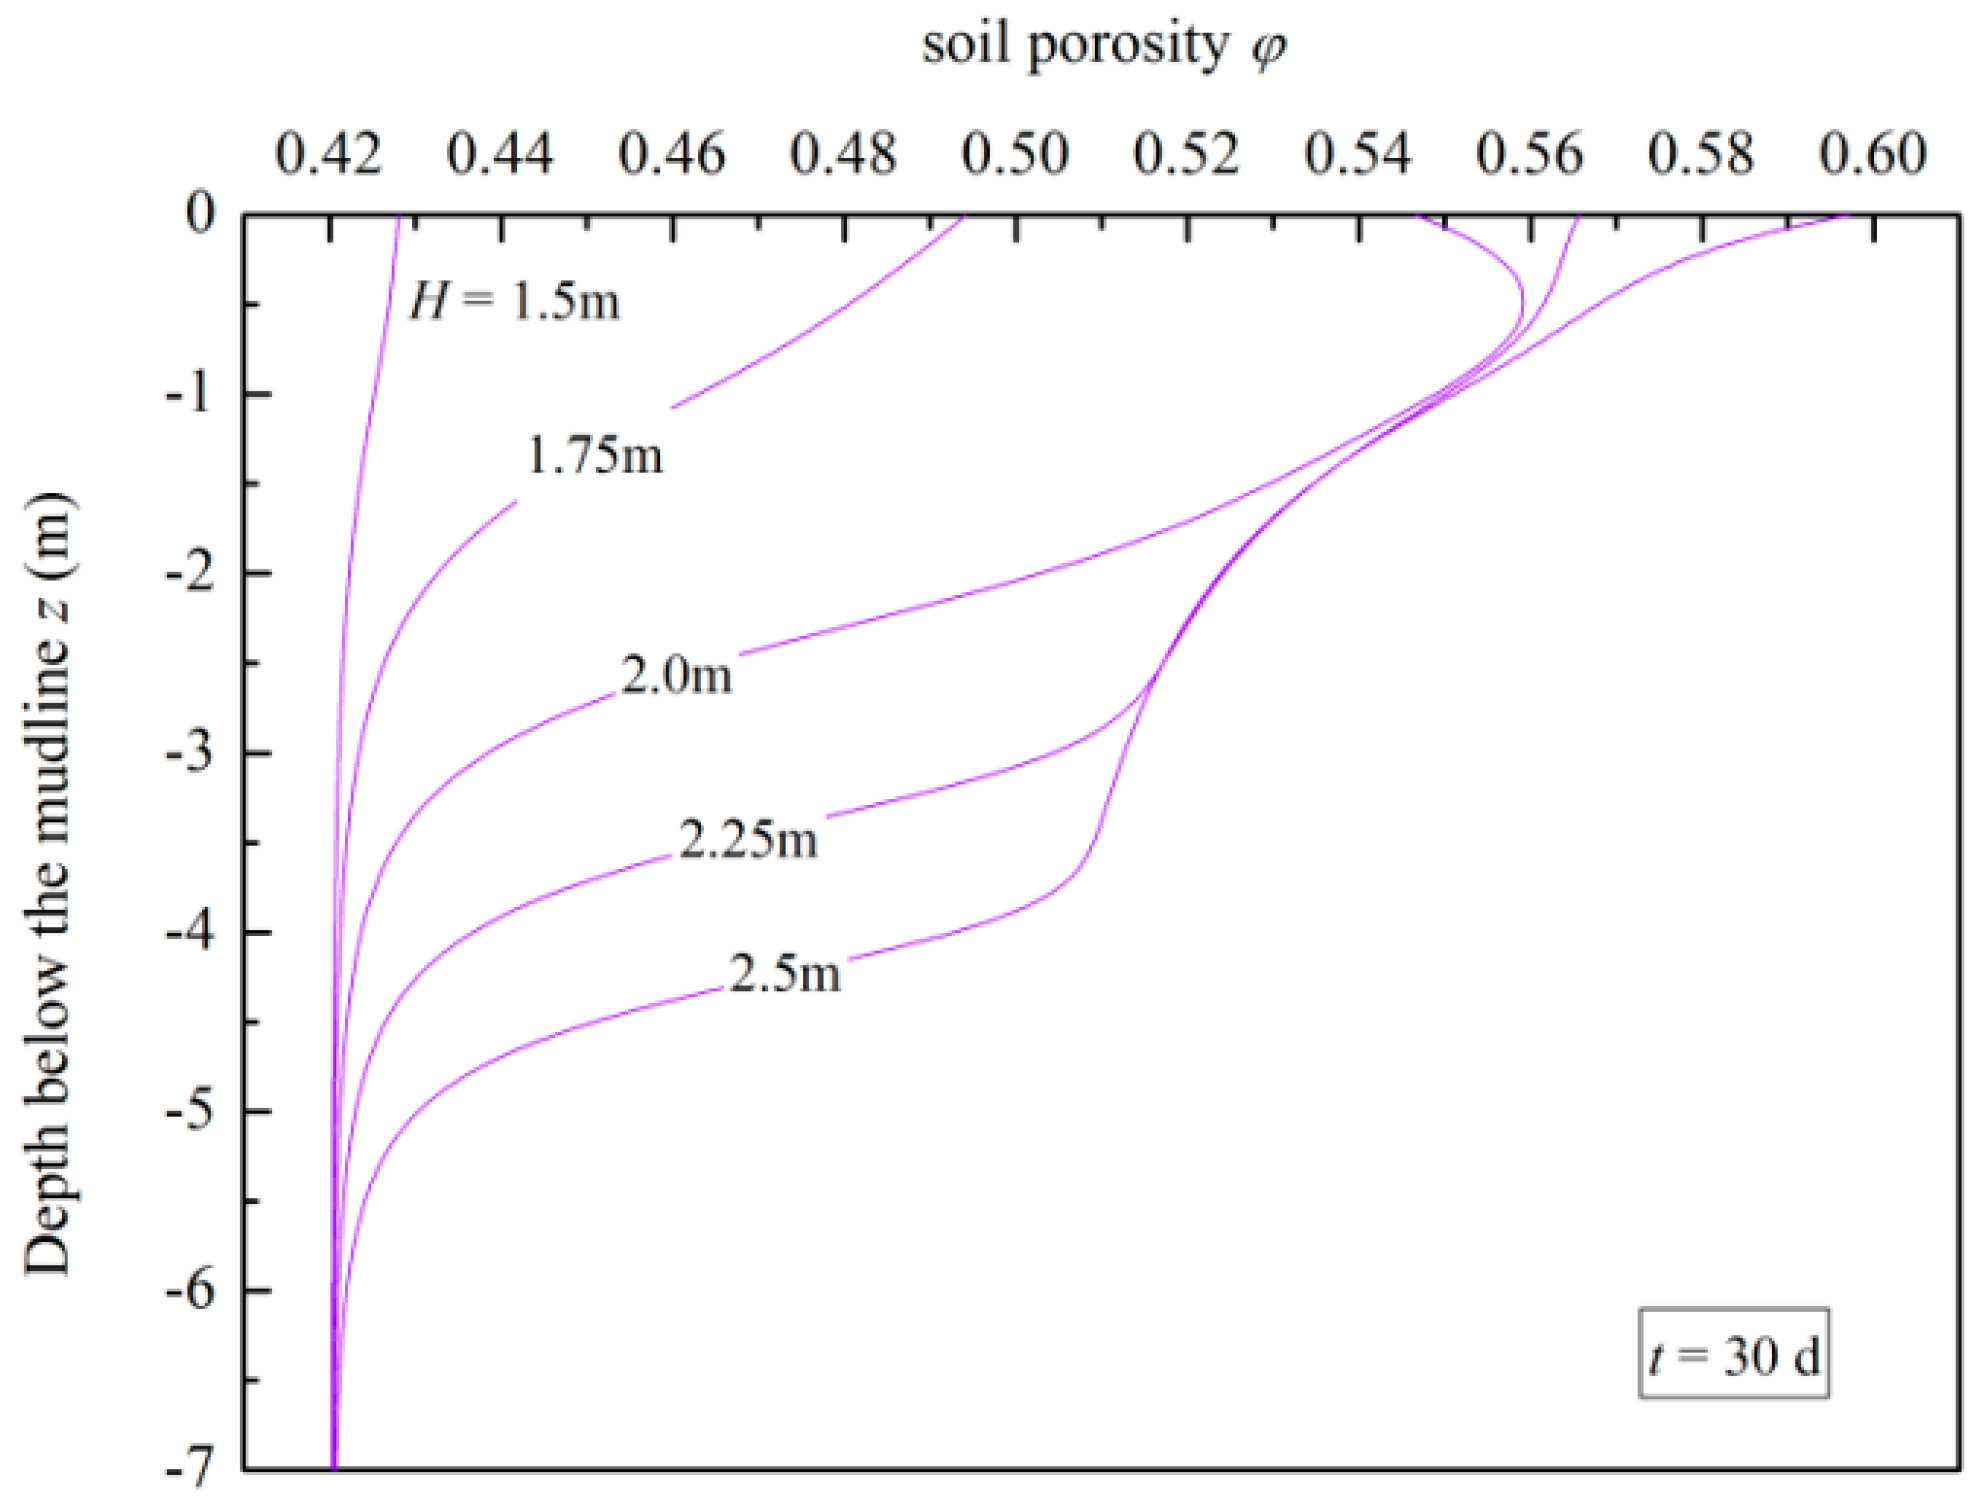
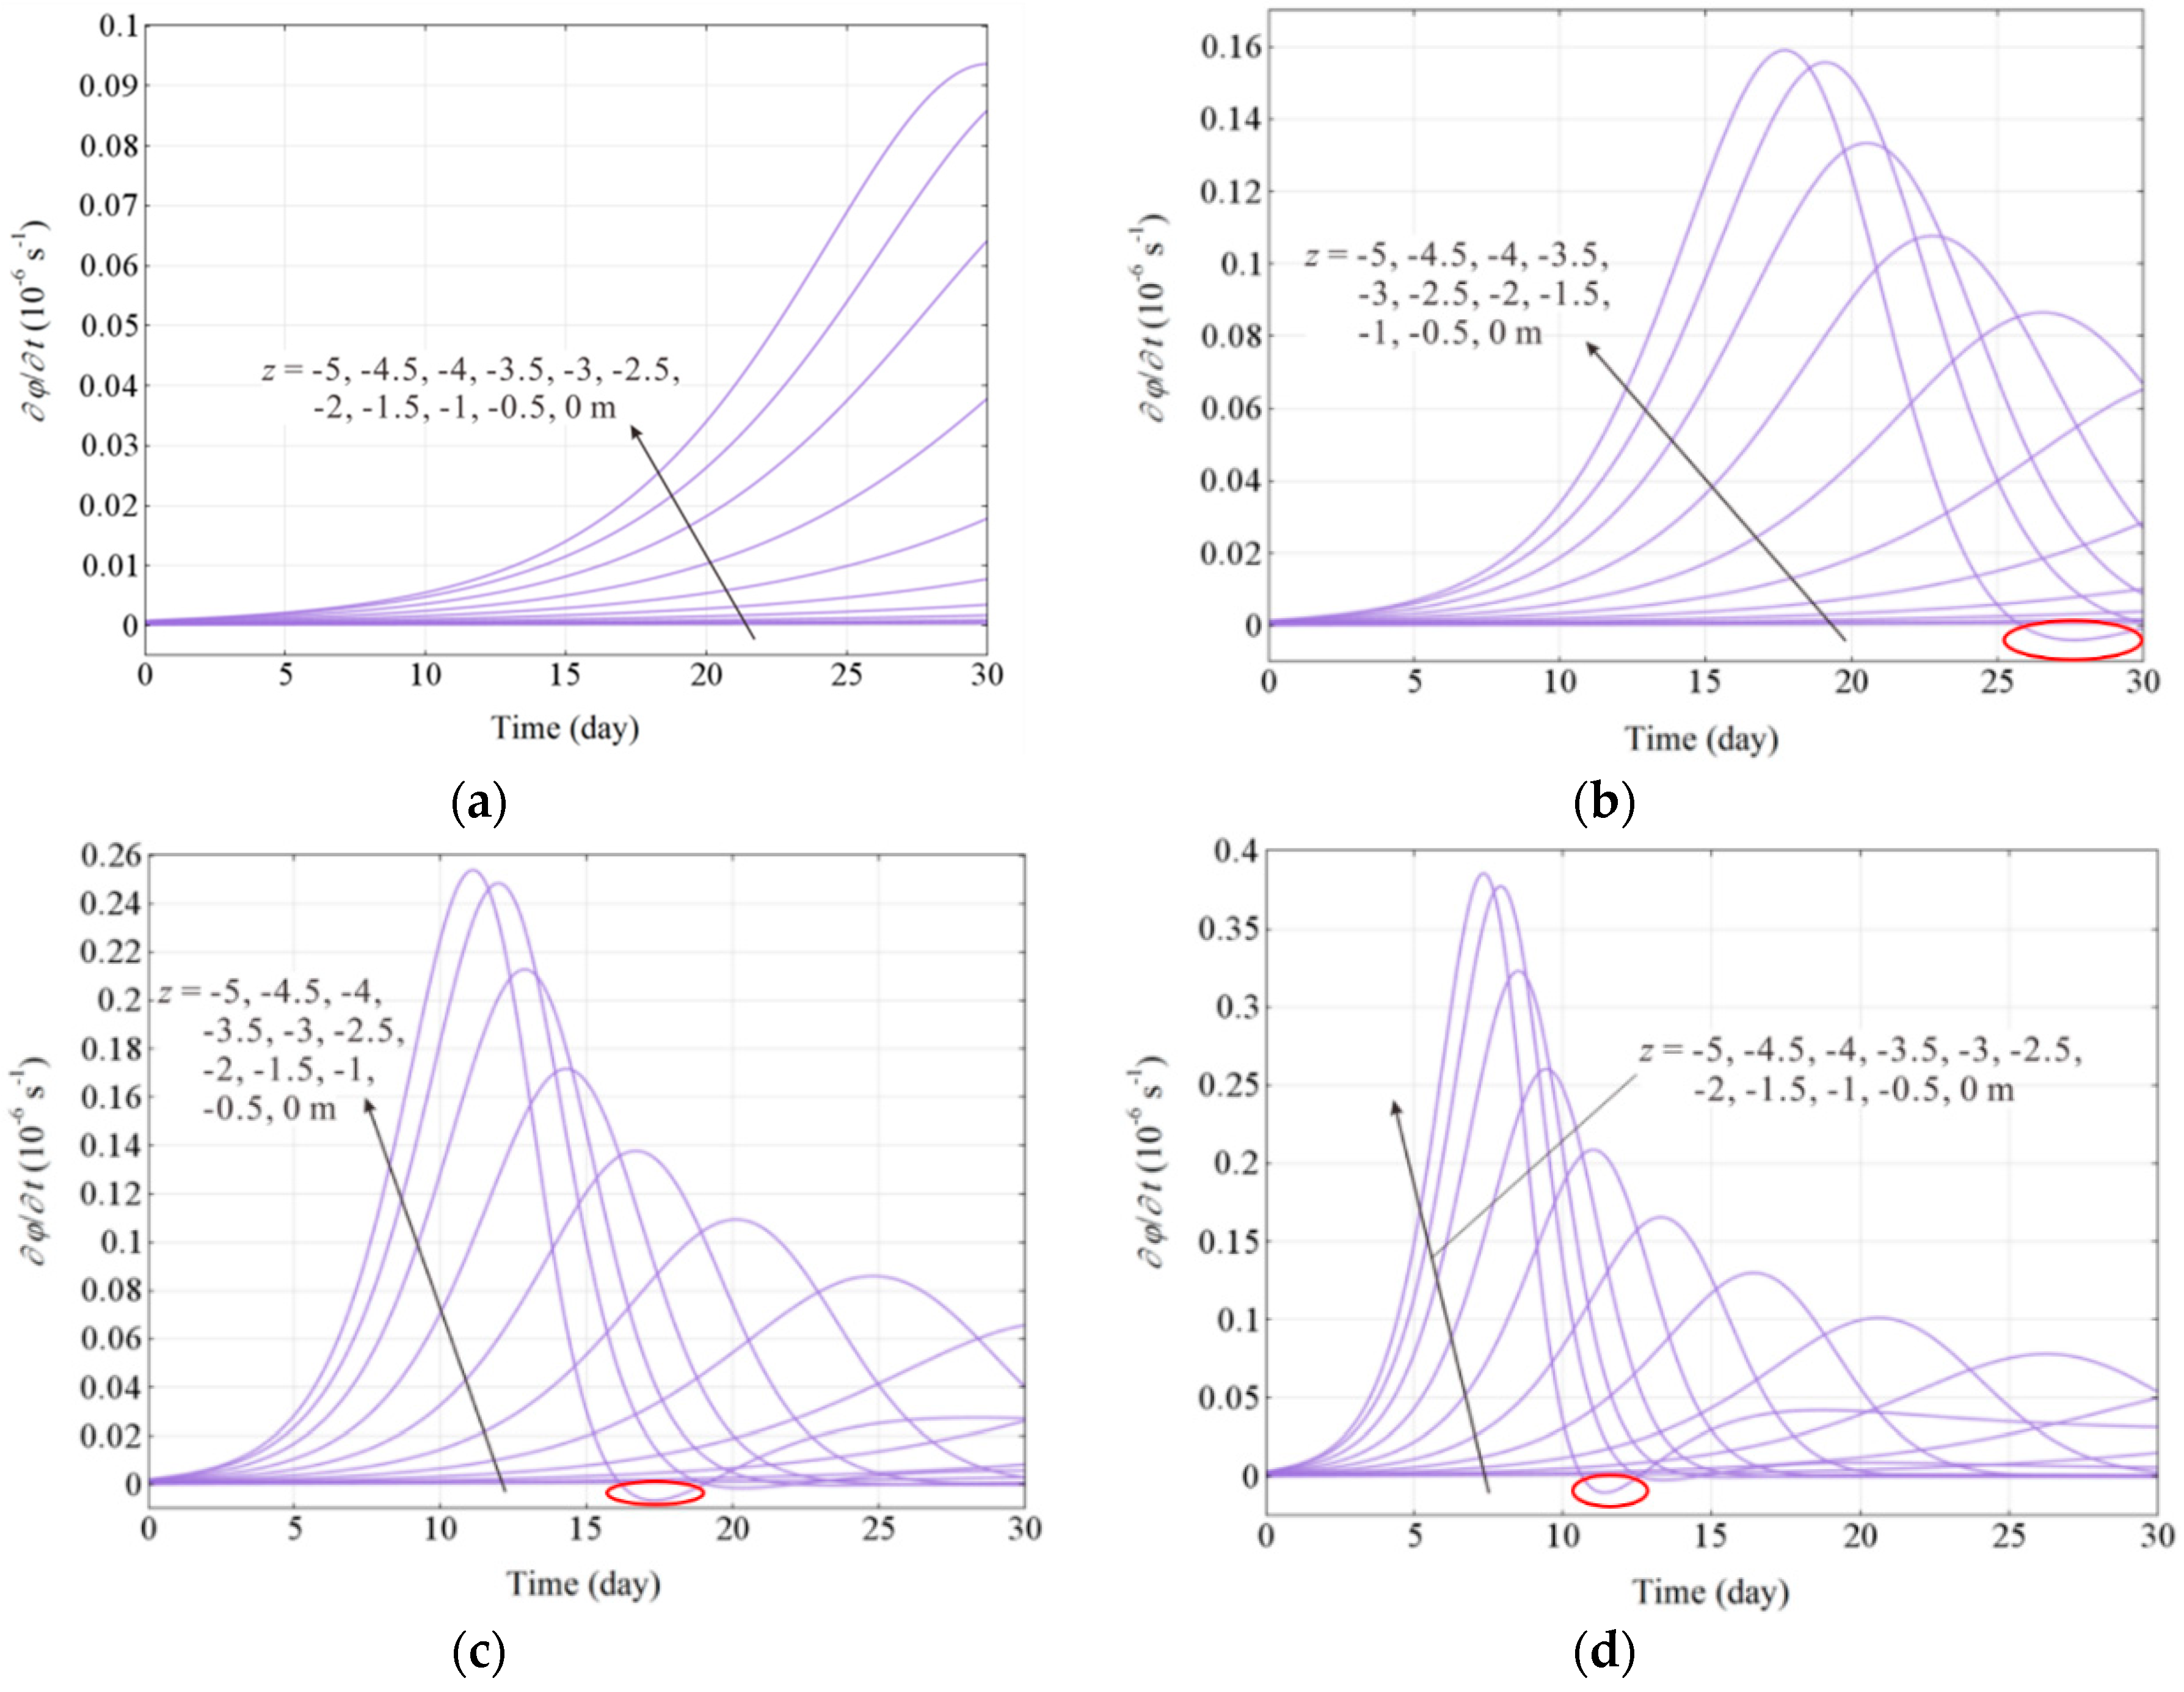
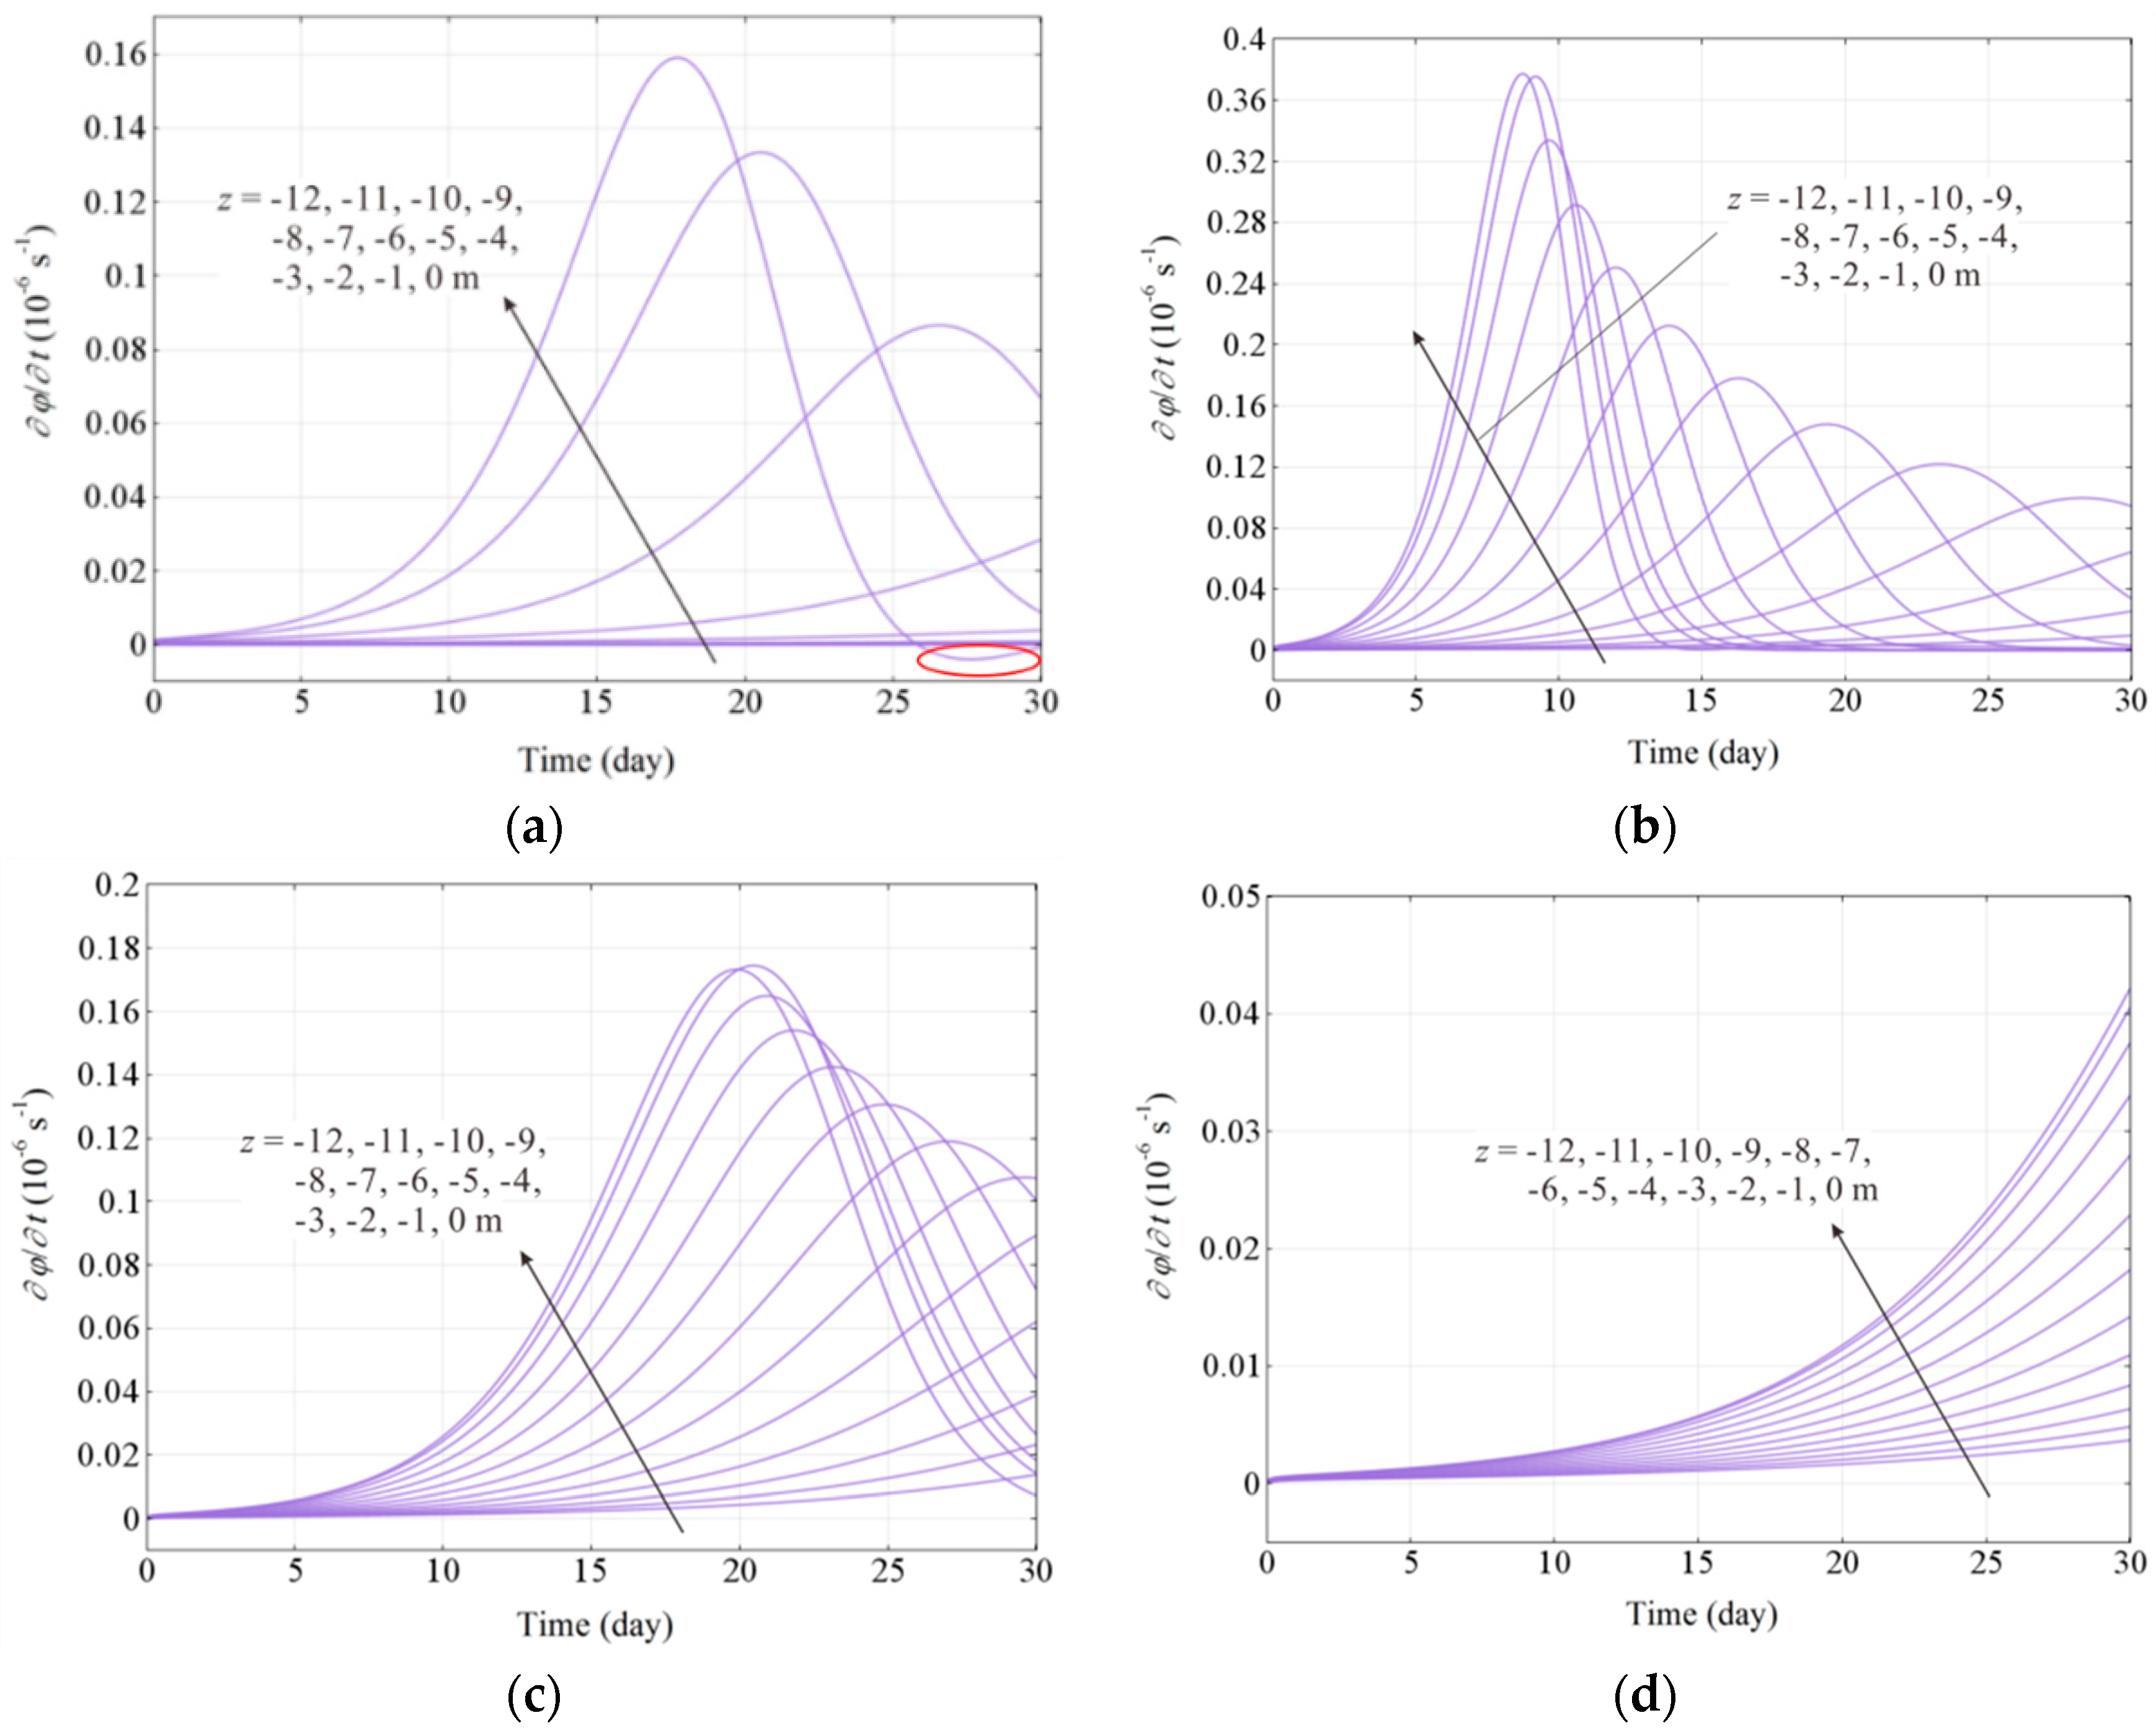
6.1. Effect of Wave Height

Wave height is one of the most important wave parameters, as it directly affects the wave pressure and energy inputted into the seabed [12]. To assess the effect of wave height on the erosion process, the wave height was selected as 1.50 m, 1.75 m, 2.00 m, 2.25 m, and 2.50 m, respectively. Figure 10a shows the distributions of | P o s c | / P b along depth for different wave heights, which reveal | P o s c | / P b is only related to soil depth and has no relationship with wave height. In Figure 10b–d, it can be seen that ( P b | P o s c | ) / σ 0 , P r e s , and P r e s / σ 0 increase obviously with the growth of wave height. Compared with the oscillatory pore-pressure, the residual pore-pressure increases more rapidly with the increase of wave height when t = 30 d. No oscillatory liquefaction occurs, and the residual liquefaction only occurs with H = 2.50 m and t = 30 d at shallow depths (within −1.80 m).
Figure 11 shows the evolution of soil porosity with wave height when t = 30 d. It can be seen that the soil porosity increases significantly at shallow seabeds with the growth of wave height. The affected depth increases from −2.00 m to −6.00 m when the wave height increases from 1.50 m to 2.50 m. It is also noted that when the wave height is bigger than 2.00 m, the soil erosion on the seabed surface develops rapidly. The effect of wave height on the erosion rate φ t is shown in Figure 12. The soil erosion rate at shallow depths increases obviously with the growth of wave height. Similar to Figure 9b, when H equals 2.00 m, 2.25 m, and 2.50 m, a negative value of φ t appears on the seabed surface at a certain time and then the value becomes positive later in the erosion process. It illustrates that the erosion effect plays a main role again after the deposition effect takes the lead.

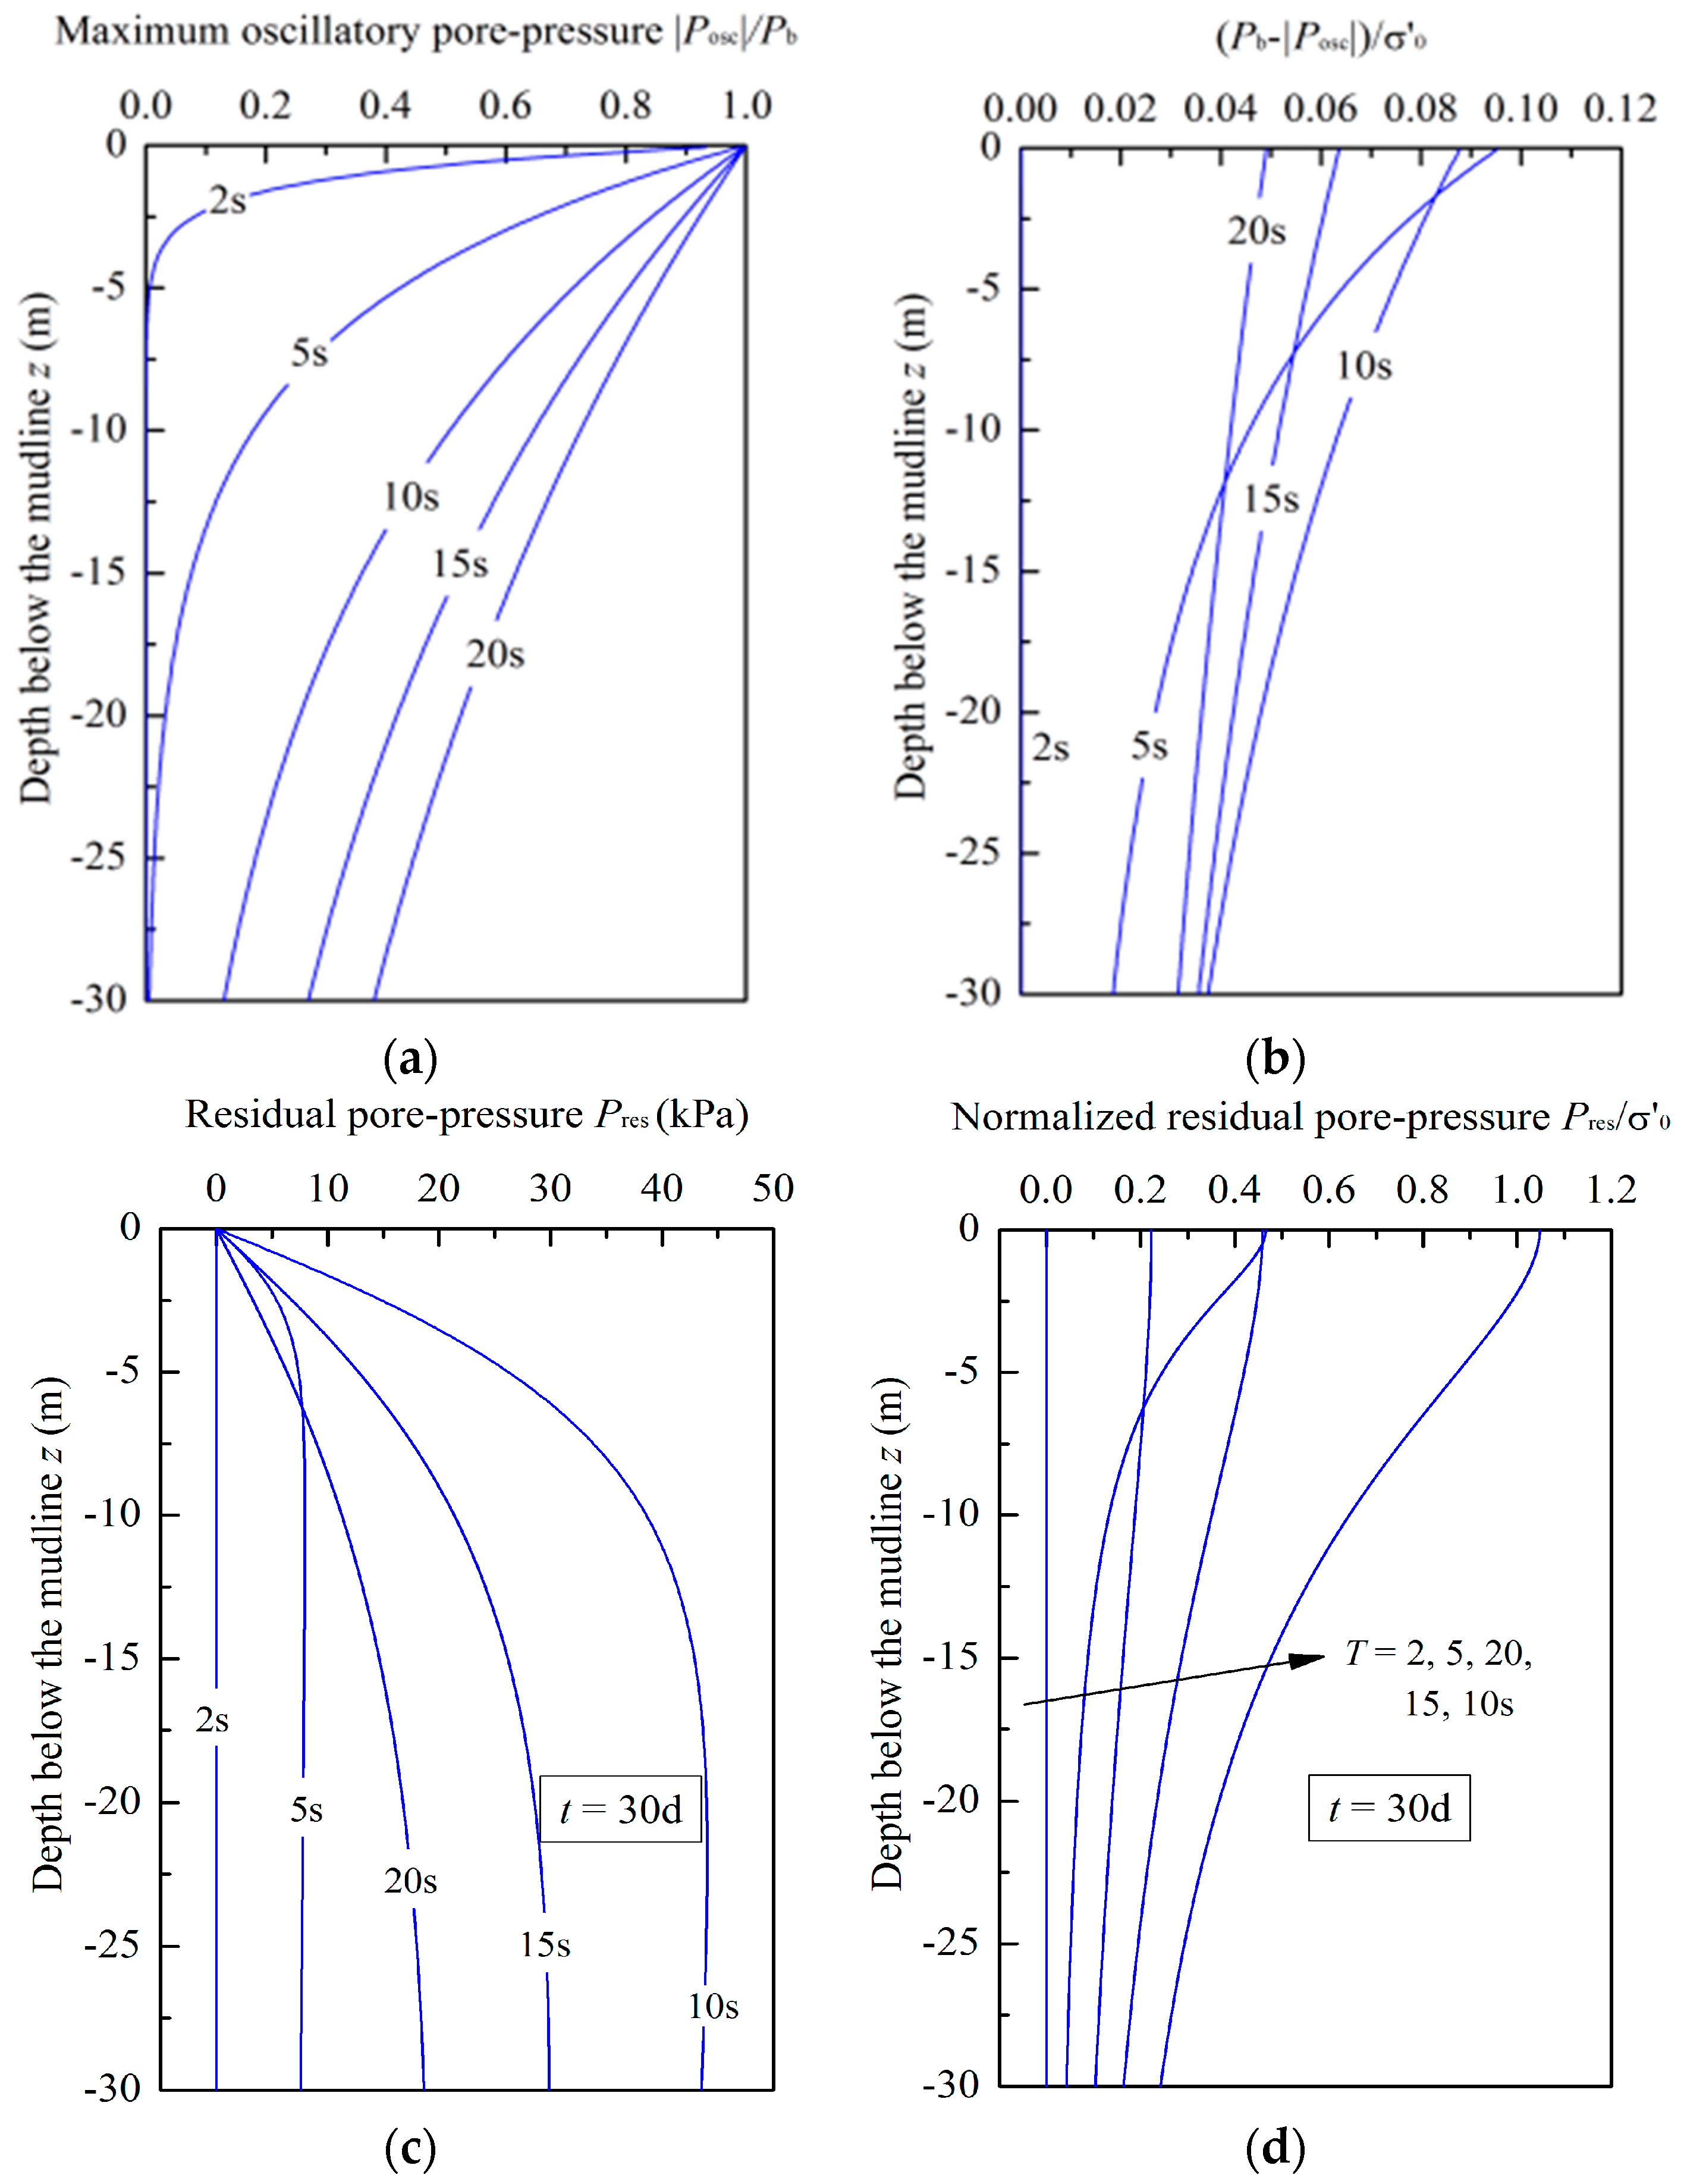
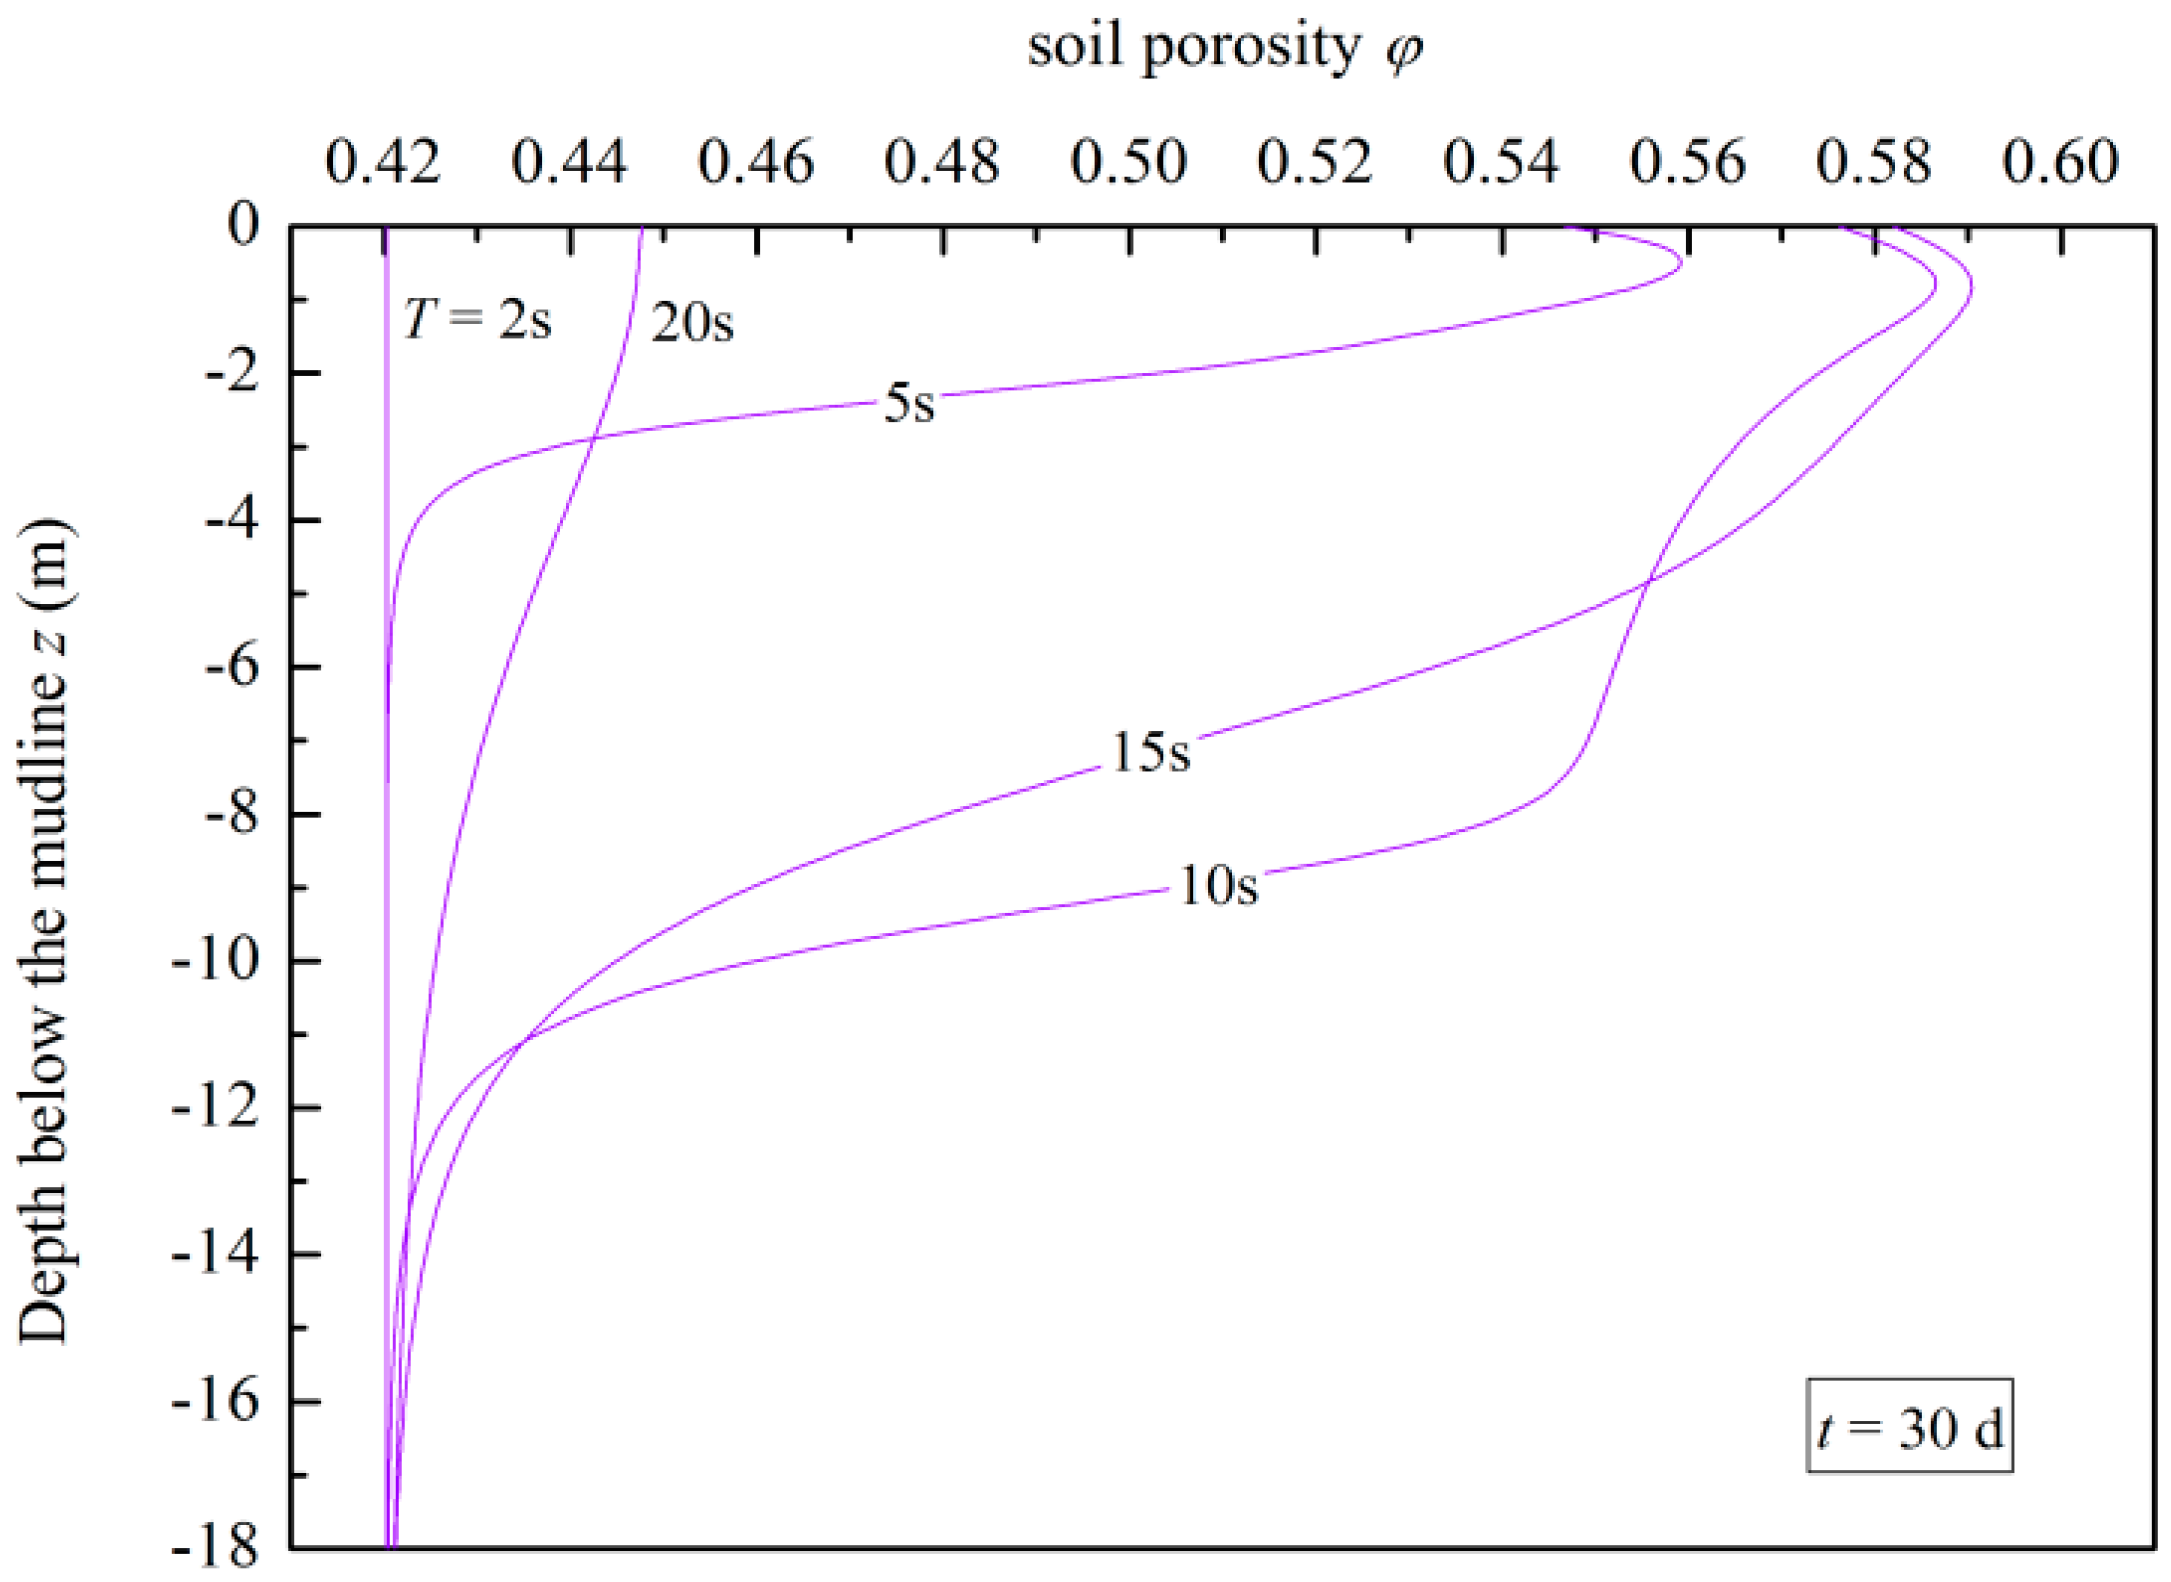
6.2. Effect of Wave Period

The wave length is always related to the wave period and water depth [12]. In this section, the effect of wave period on the wave-induced erosion was studied. The wave period was selected as 2 s, 5 s, 10 s, 15 s, and 20 s. The responses of the pore-pressure for different wave periods are plotted in Figure 13. Figure 13a clearly shows that the maximum value of oscillatory pore-pressure and the affected depth increases significantly with the extension of the wave period. The responses of ( P b | P o s c | ) / σ 0 , P r e s and P r e s / σ 0 for different wave periods are shown in Figure 13b–d, respectively. These three physical quantities first increase and then decrease. There is a competition mechanism between the accumulation and the dissipation of the residual pore-pressure. For the waves with bigger periods, the dissipation of residual pore-pressure becomes relatively obvious. Therefore, there exists a particular wave period corresponding to the maximum residual pore-pressure. The oscillation liquefaction will not occur due to ( P b | P o s c | ) / σ 0 always being less than 0.1, and the residual liquefaction appears on the seabed surface when wave period T=10s.
The wave period has obvious effects on the soil porosity (Figure 14). The affected depth increases greatly when T>5 s. For the soil within the affected depth in the seabed, its porosity increases with the extension of wave period first, and then shows a decreasing trend. The soil erosion is not obvious with a small or big wave period and there exists a particular wave period to make the soil erosion most severe in the seabed. For wave period T = 2 s, the soil porosity almost equals the initial value, but the soil porosity increases most obviously when T = 10 s. Figure 15 shows the variations of φ t for different wave periods. When T = 10 s, the values of φ t at different depths reach the peak values fastest and the peak values are the biggest compared with the other wave periods. This wave period leads to the fastest wave-induced erosion in the seabed.

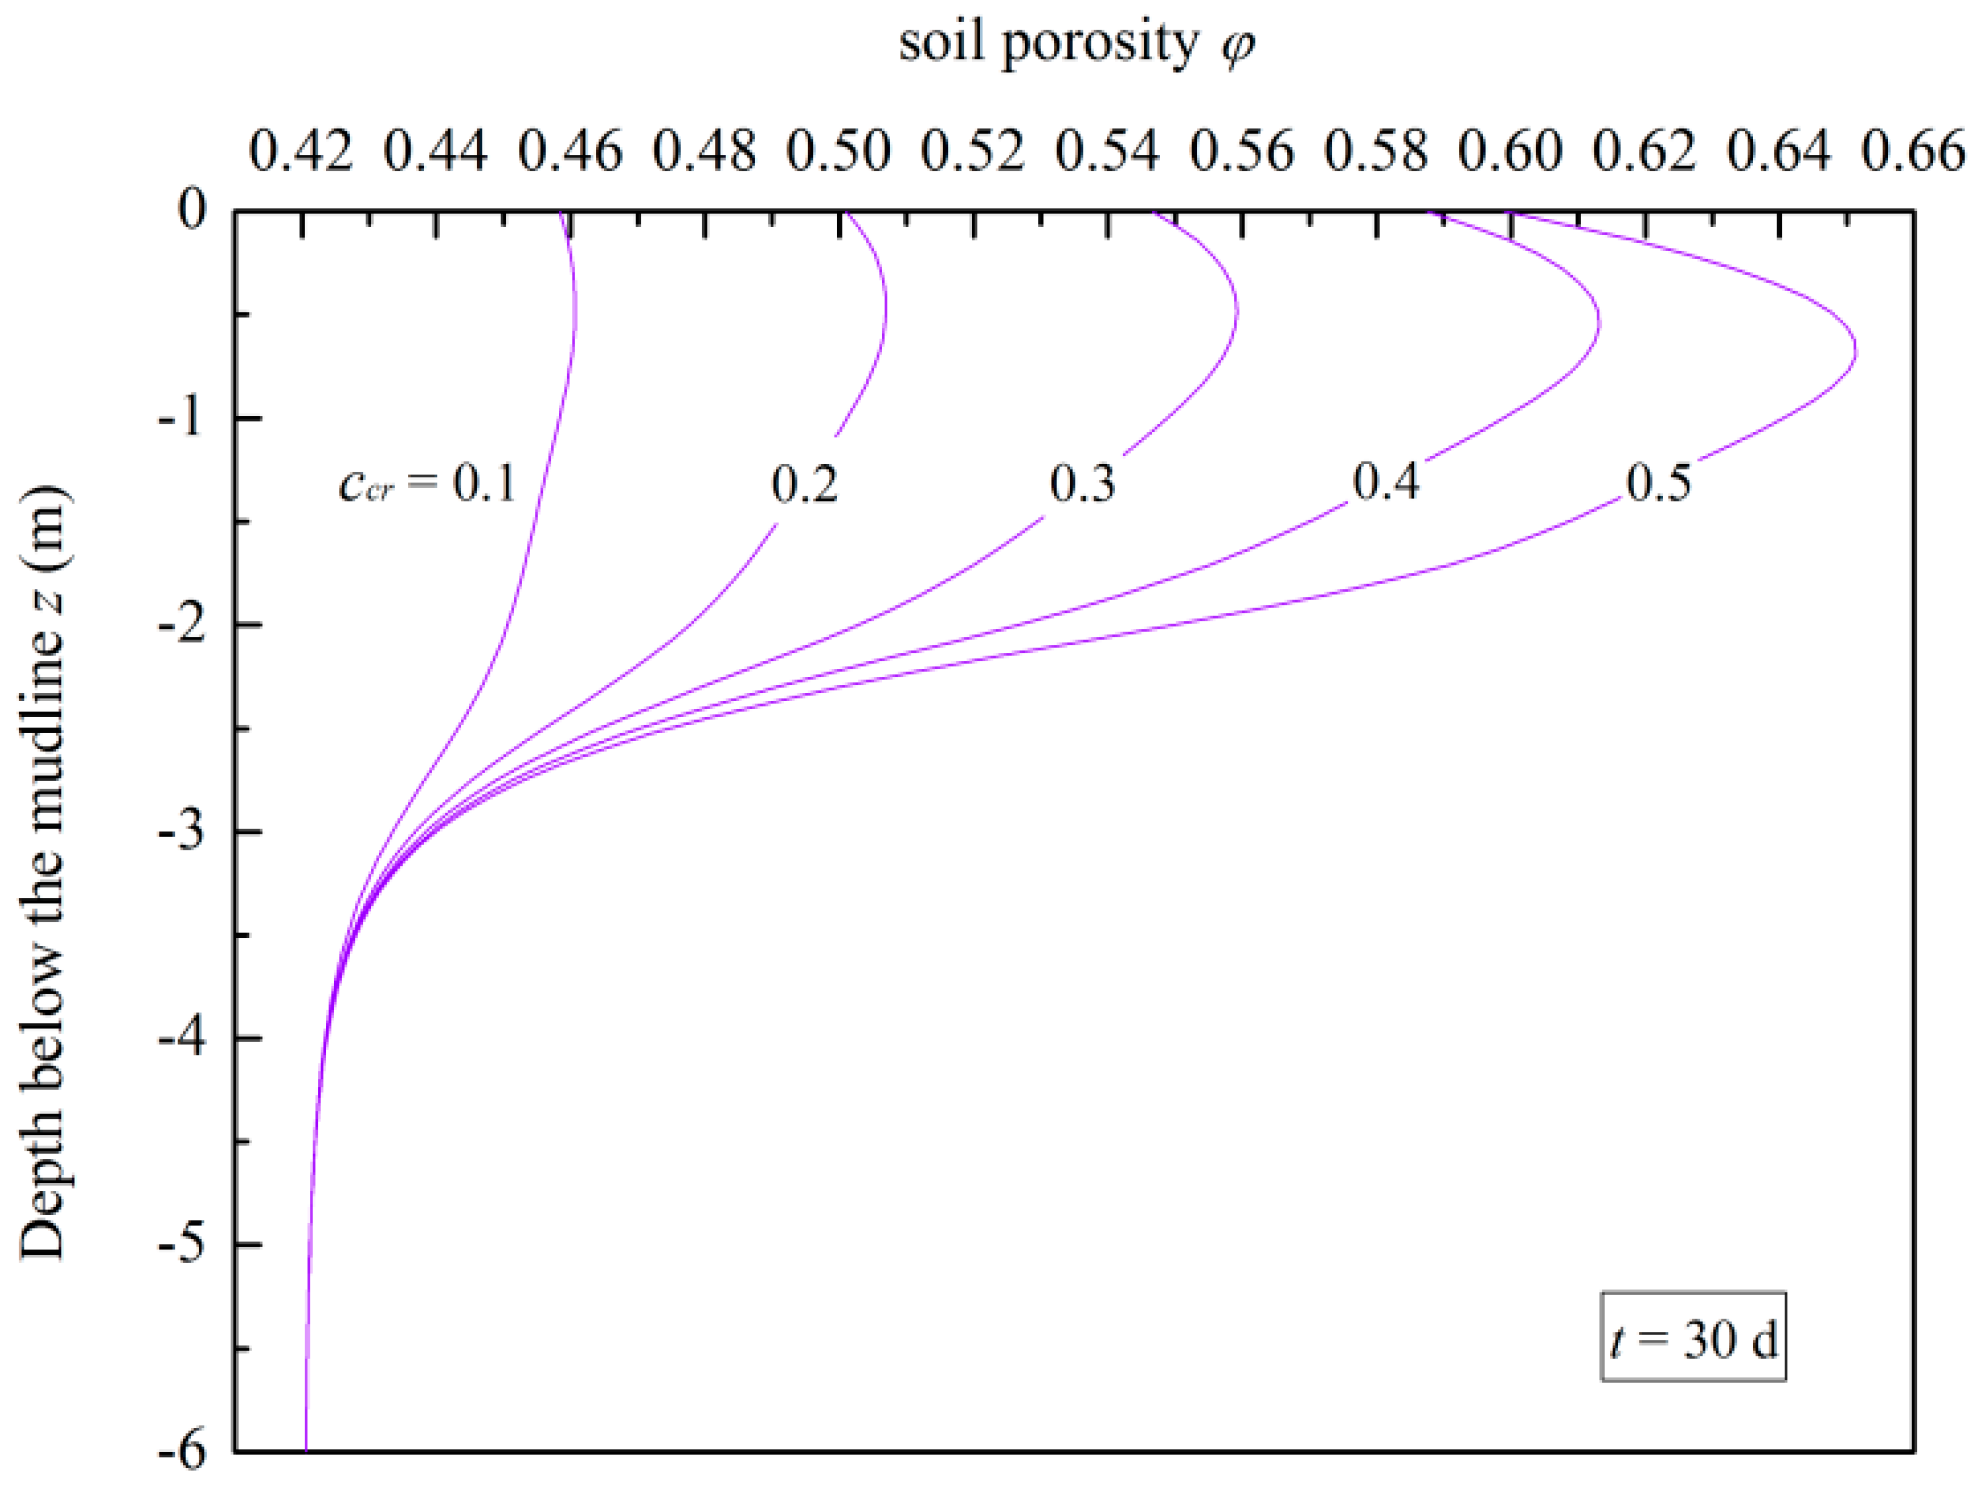
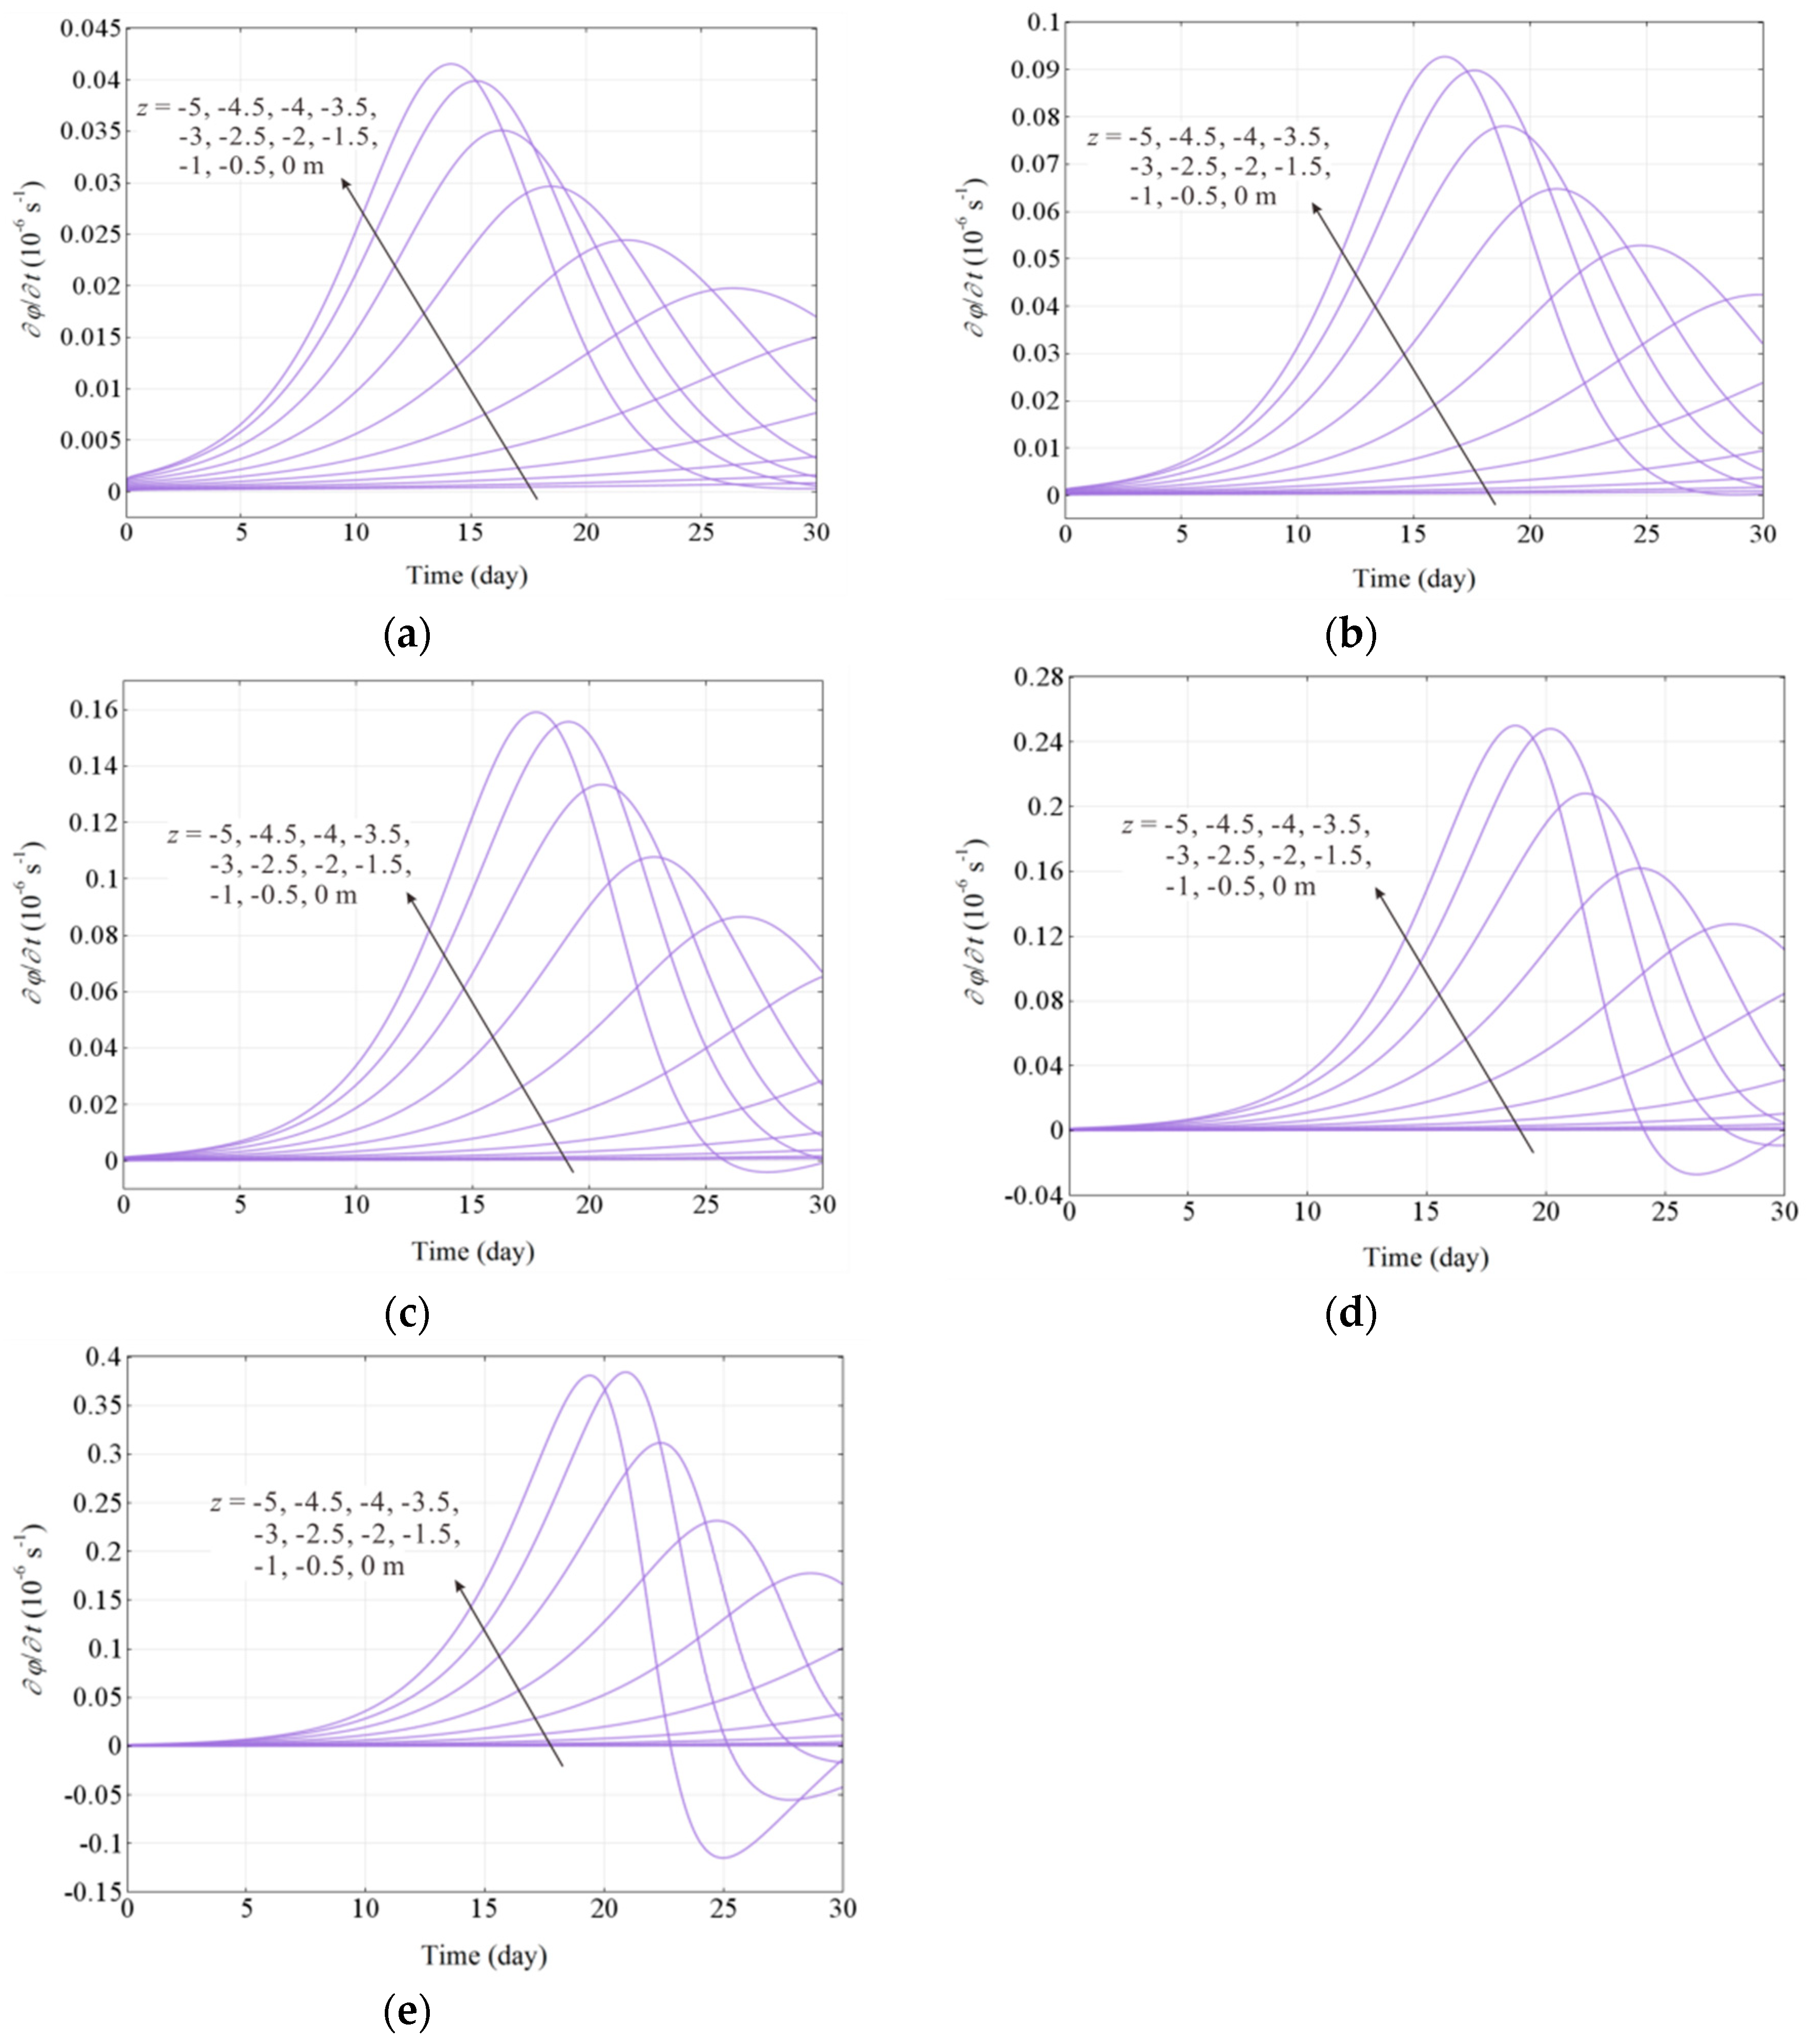
6.3. Effect of Critical Concentration of Fluidized Soil Particles

This section aims to assess the effect of critical concentration of the fluidized soil particles on the wave-induced erosion. The values of ccr were selected as 0.10, 0.20, 0.30, 0.40, and 0.50, respectively. Figure 16 gives the simulation results of soil porosity versus the depth for different ccr. It can be seen that the soil porosity increases mainly at shallow depths (within −4 m) with the growth of ccr. The soil at deep depths is not affected by ccr. The bigger the ccr, the more severe the soil erosion is. As shown in Figure 17, the erosion rate φ t is obviously affected by ccr at shallow depths. Combined with Figure 17a–e, it can be seen that the peak values of φ t for the selected depths increase obviously and φ t reach the peak values later with the growth of ccr. Furthermore, the value of φ t becomes negative in the later stage of the erosion process when c c r 0.30 . It can be concluded that the bigger the ccr, the more remarkable the deposition effect.

7. Conclusions

In this paper, the soil erosion in silty sand seabeds induced by wave actions was numerically investigated. A kind of three-phase soil model was used in the simulation, which includes the soil skeleton, pore fluid, and fluidized soil particles. By combining the Darcy flow law, mass conservation, and mass generation equations, the wave-induced erosion process for a typical wave condition case was simulated using COMSOL Multiphysics. Then, the influences of wave height, wave period, and critical concentration of moving particles were studied. Some useful conclusions can be drawn as follows:
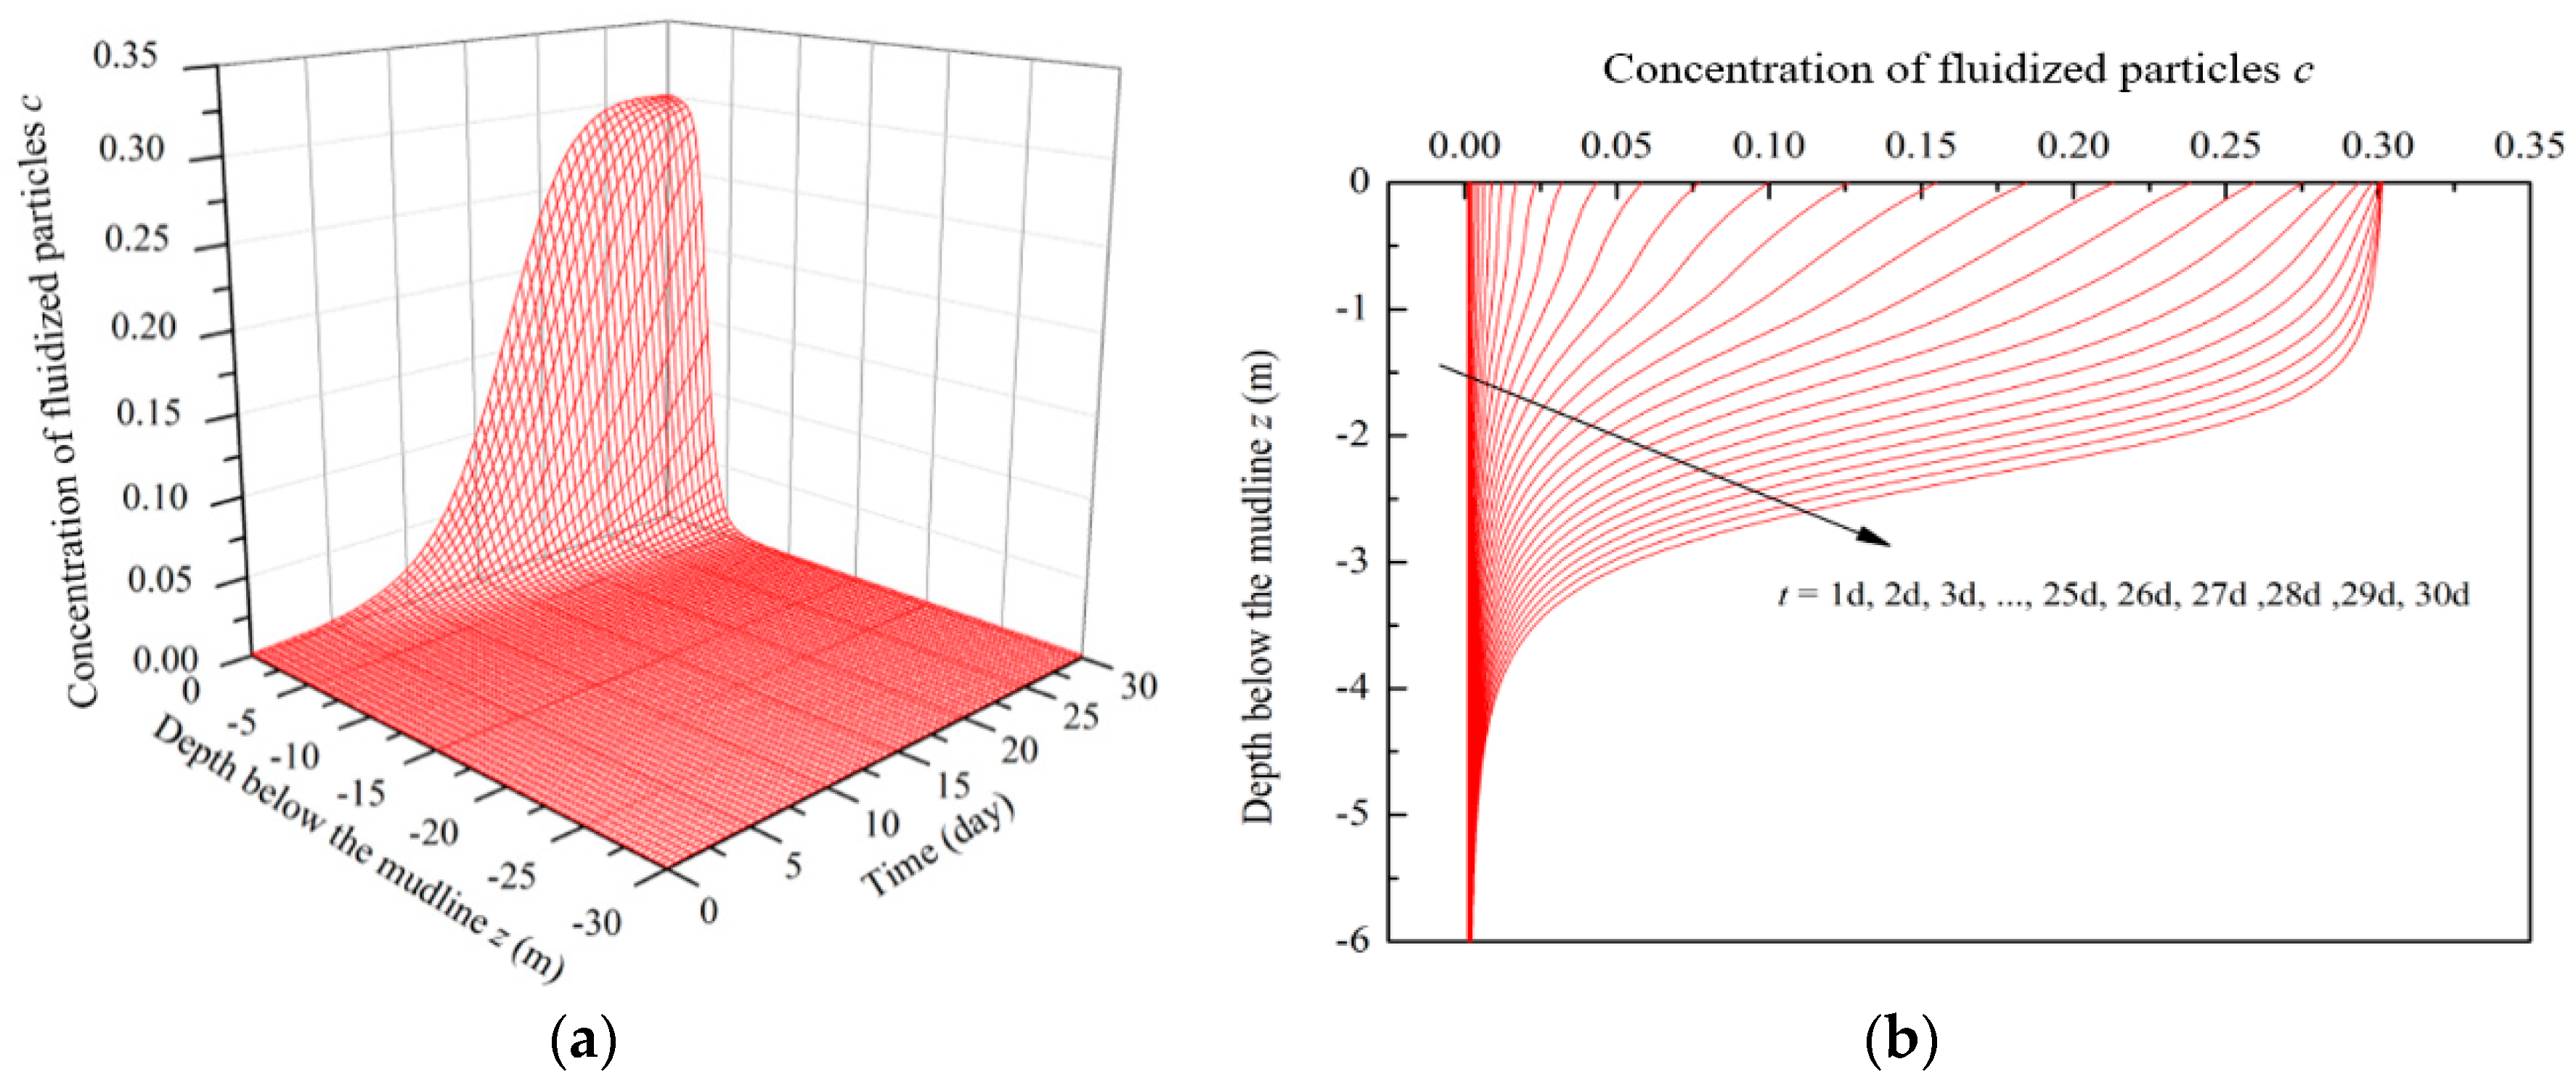
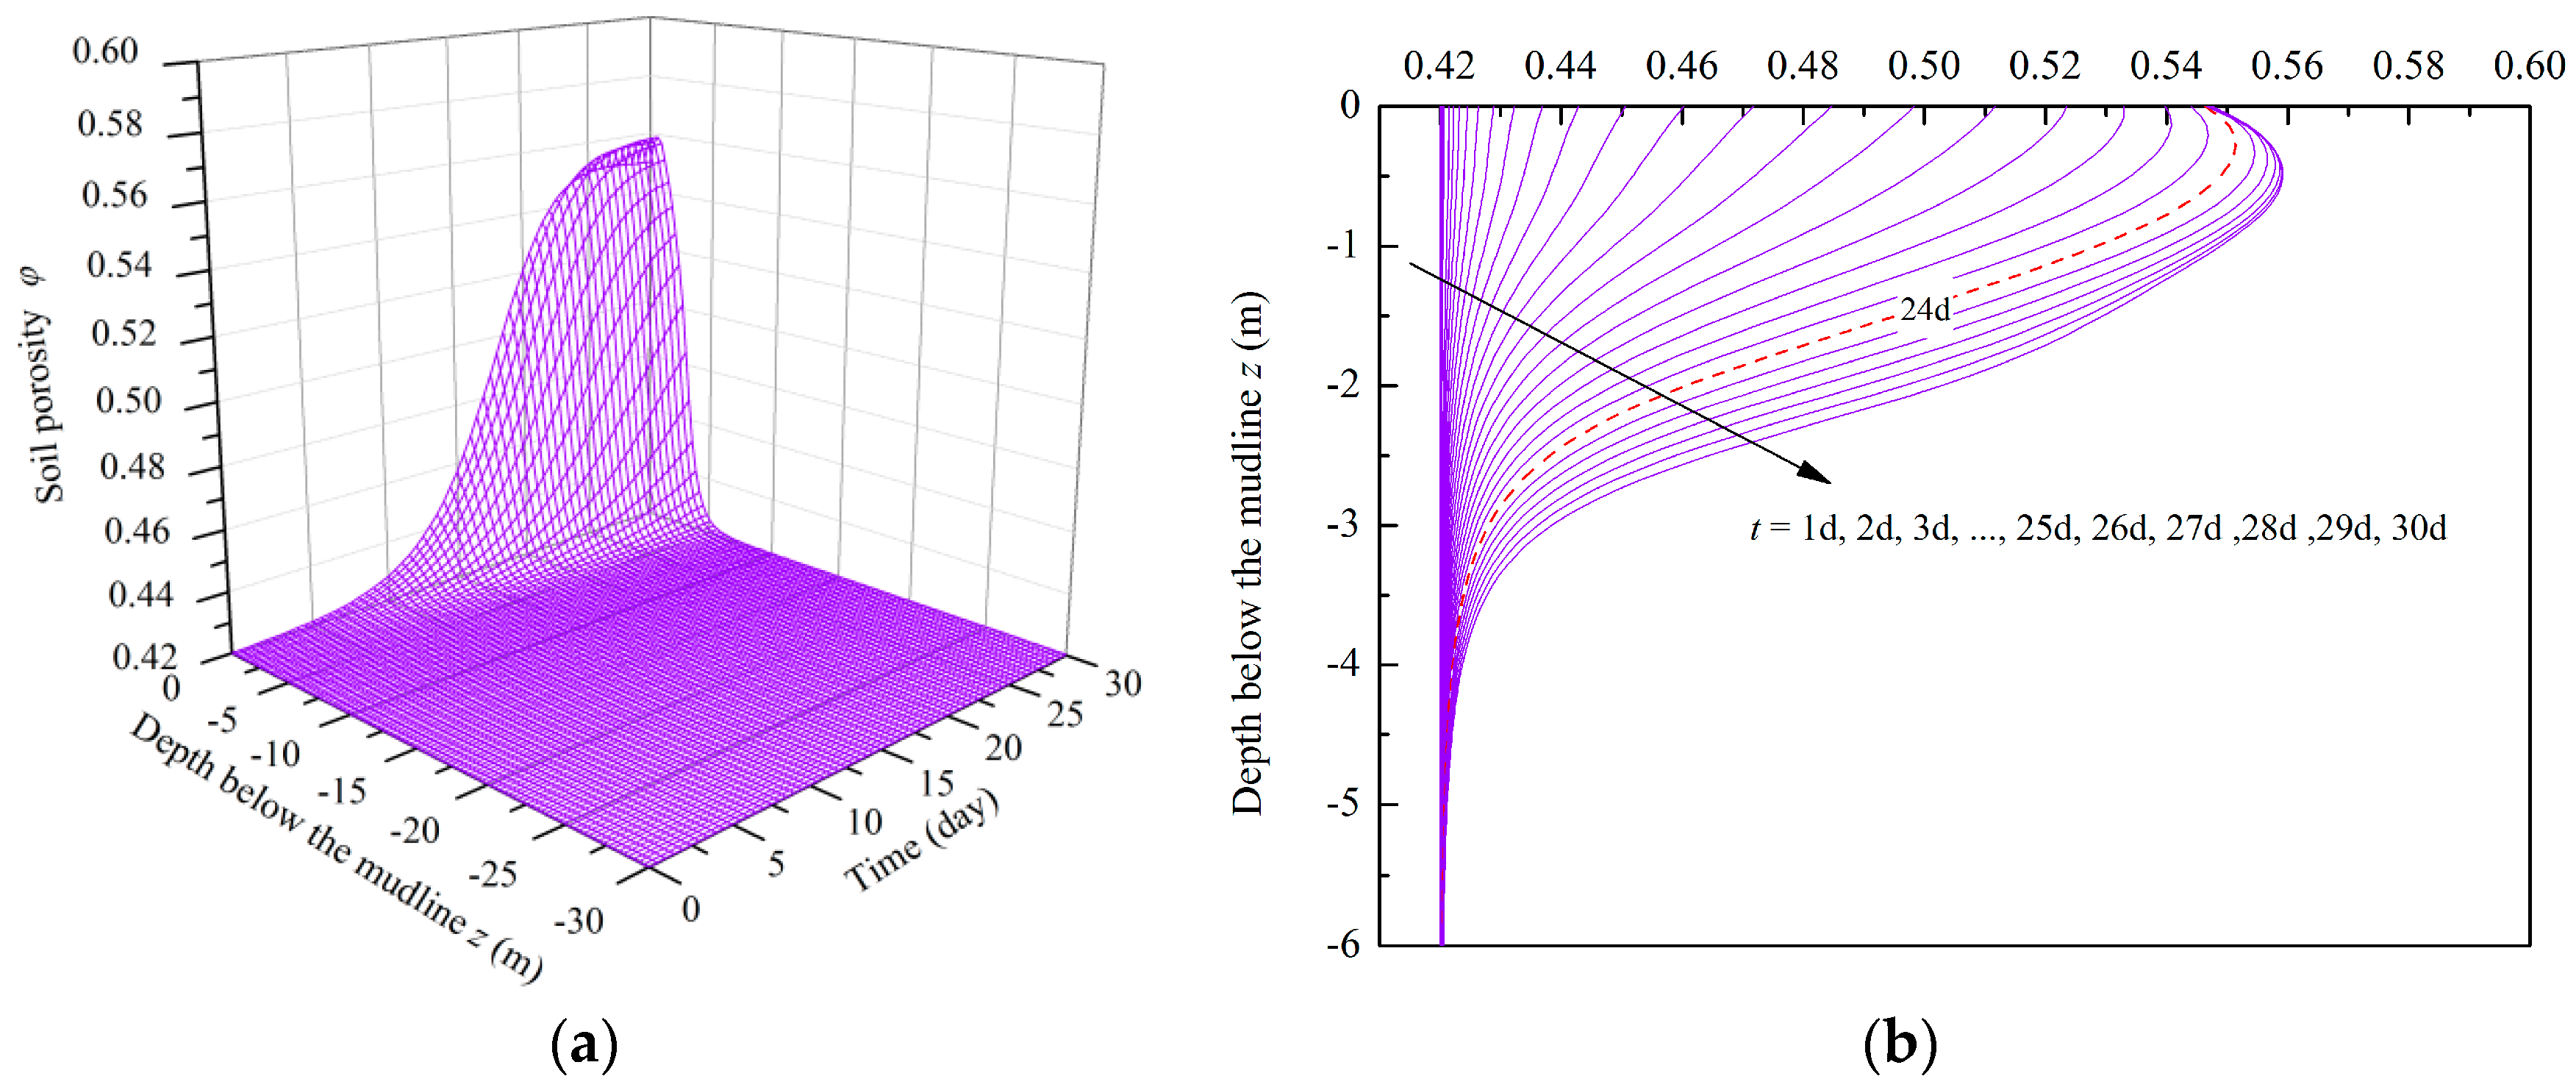
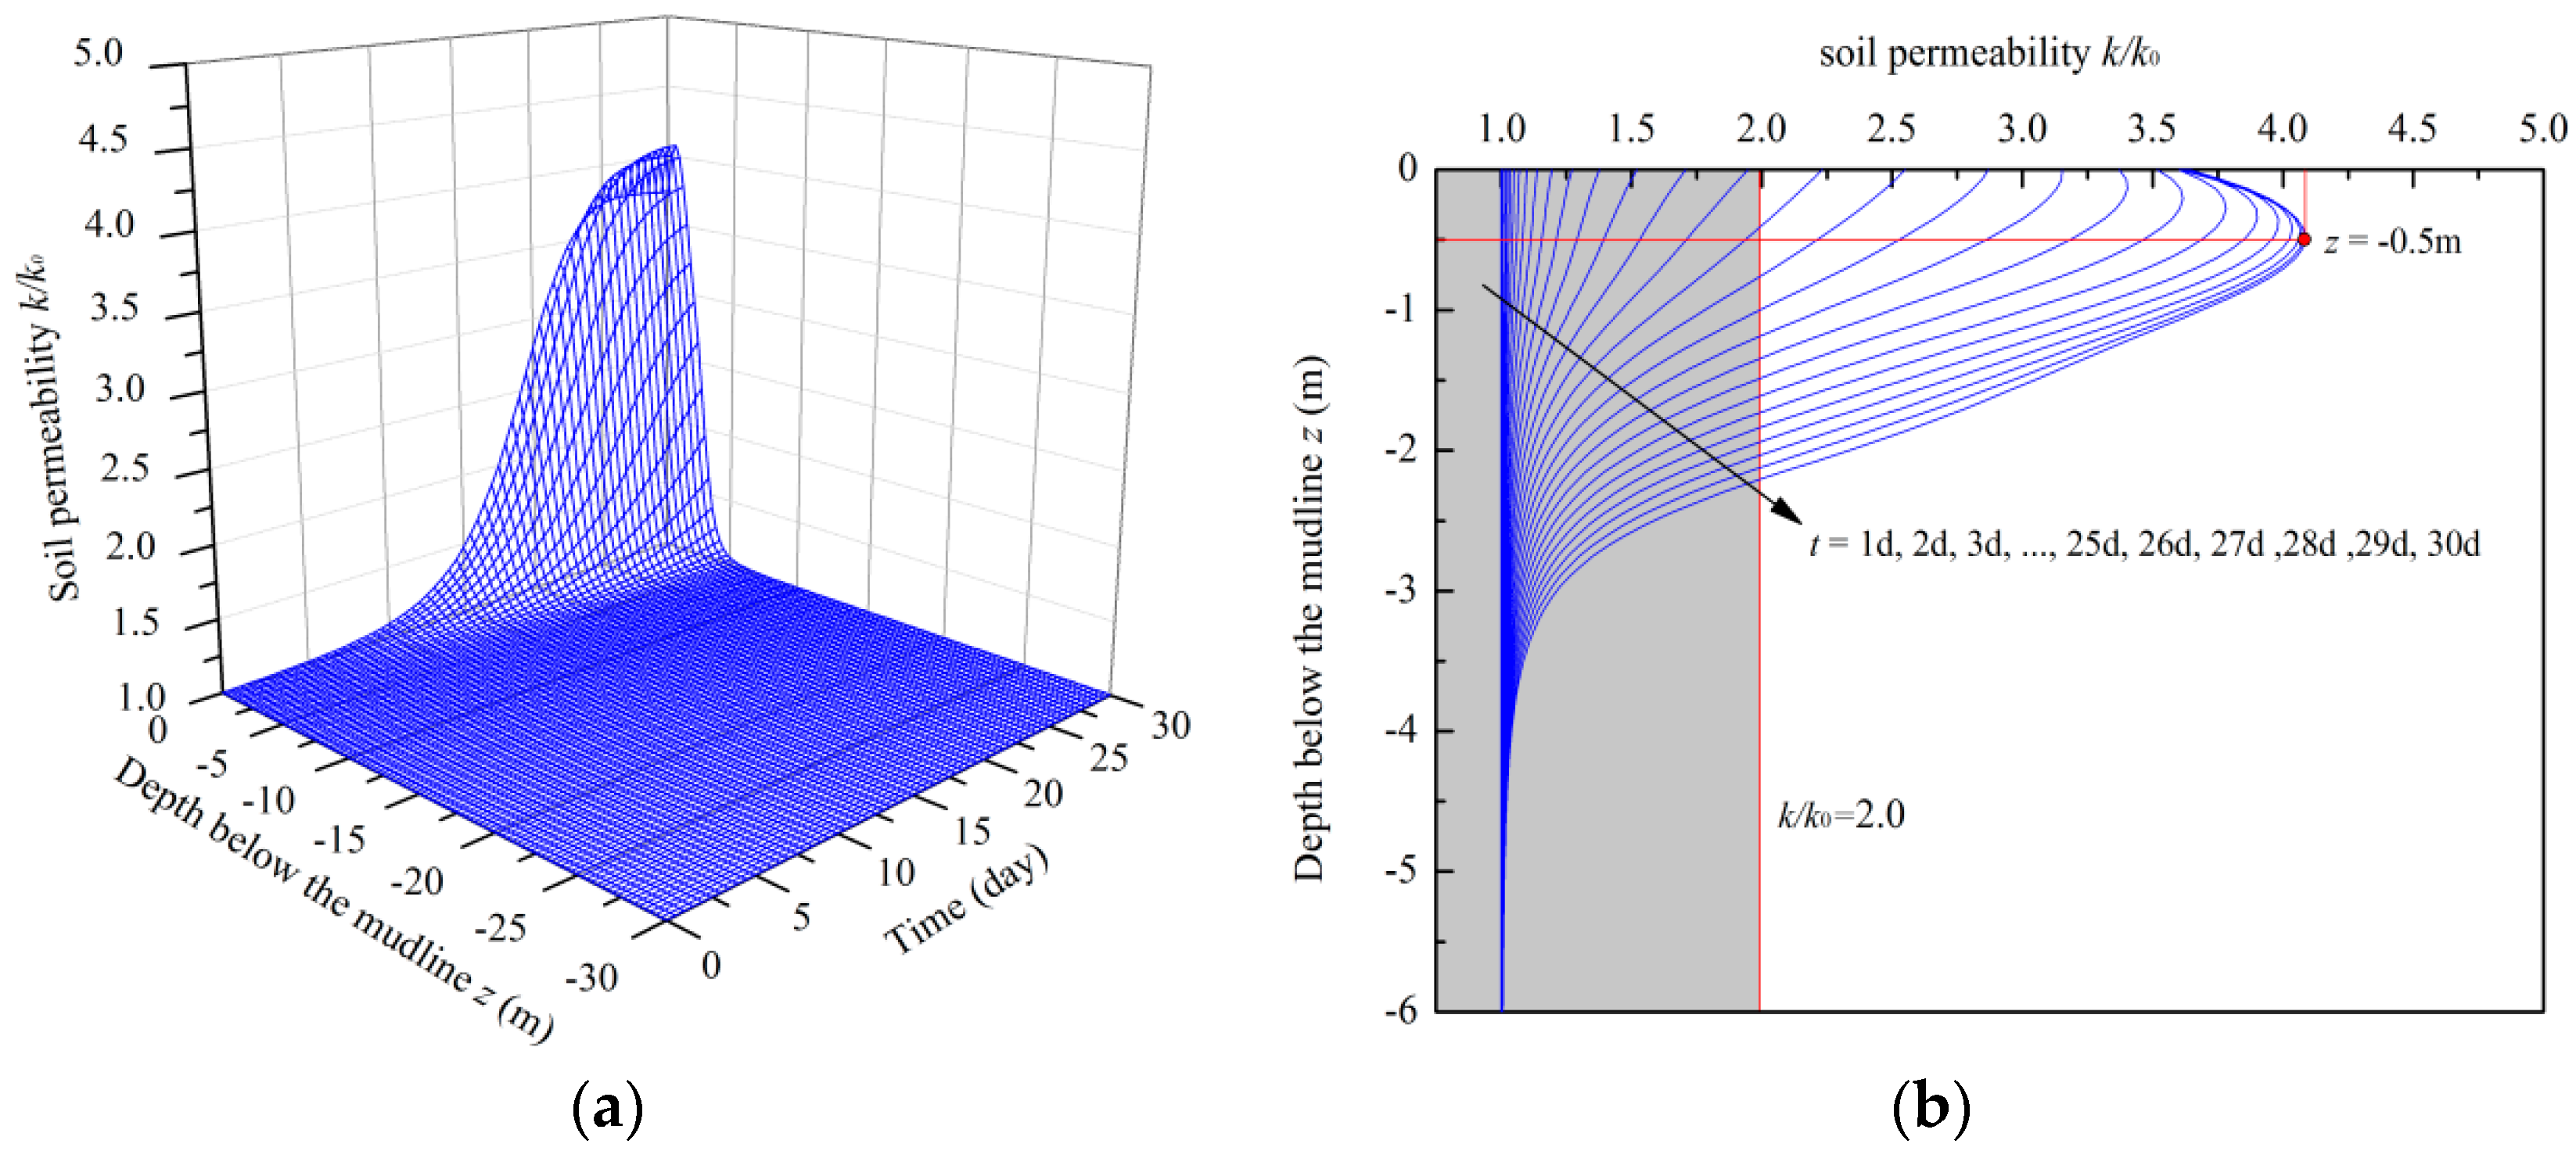
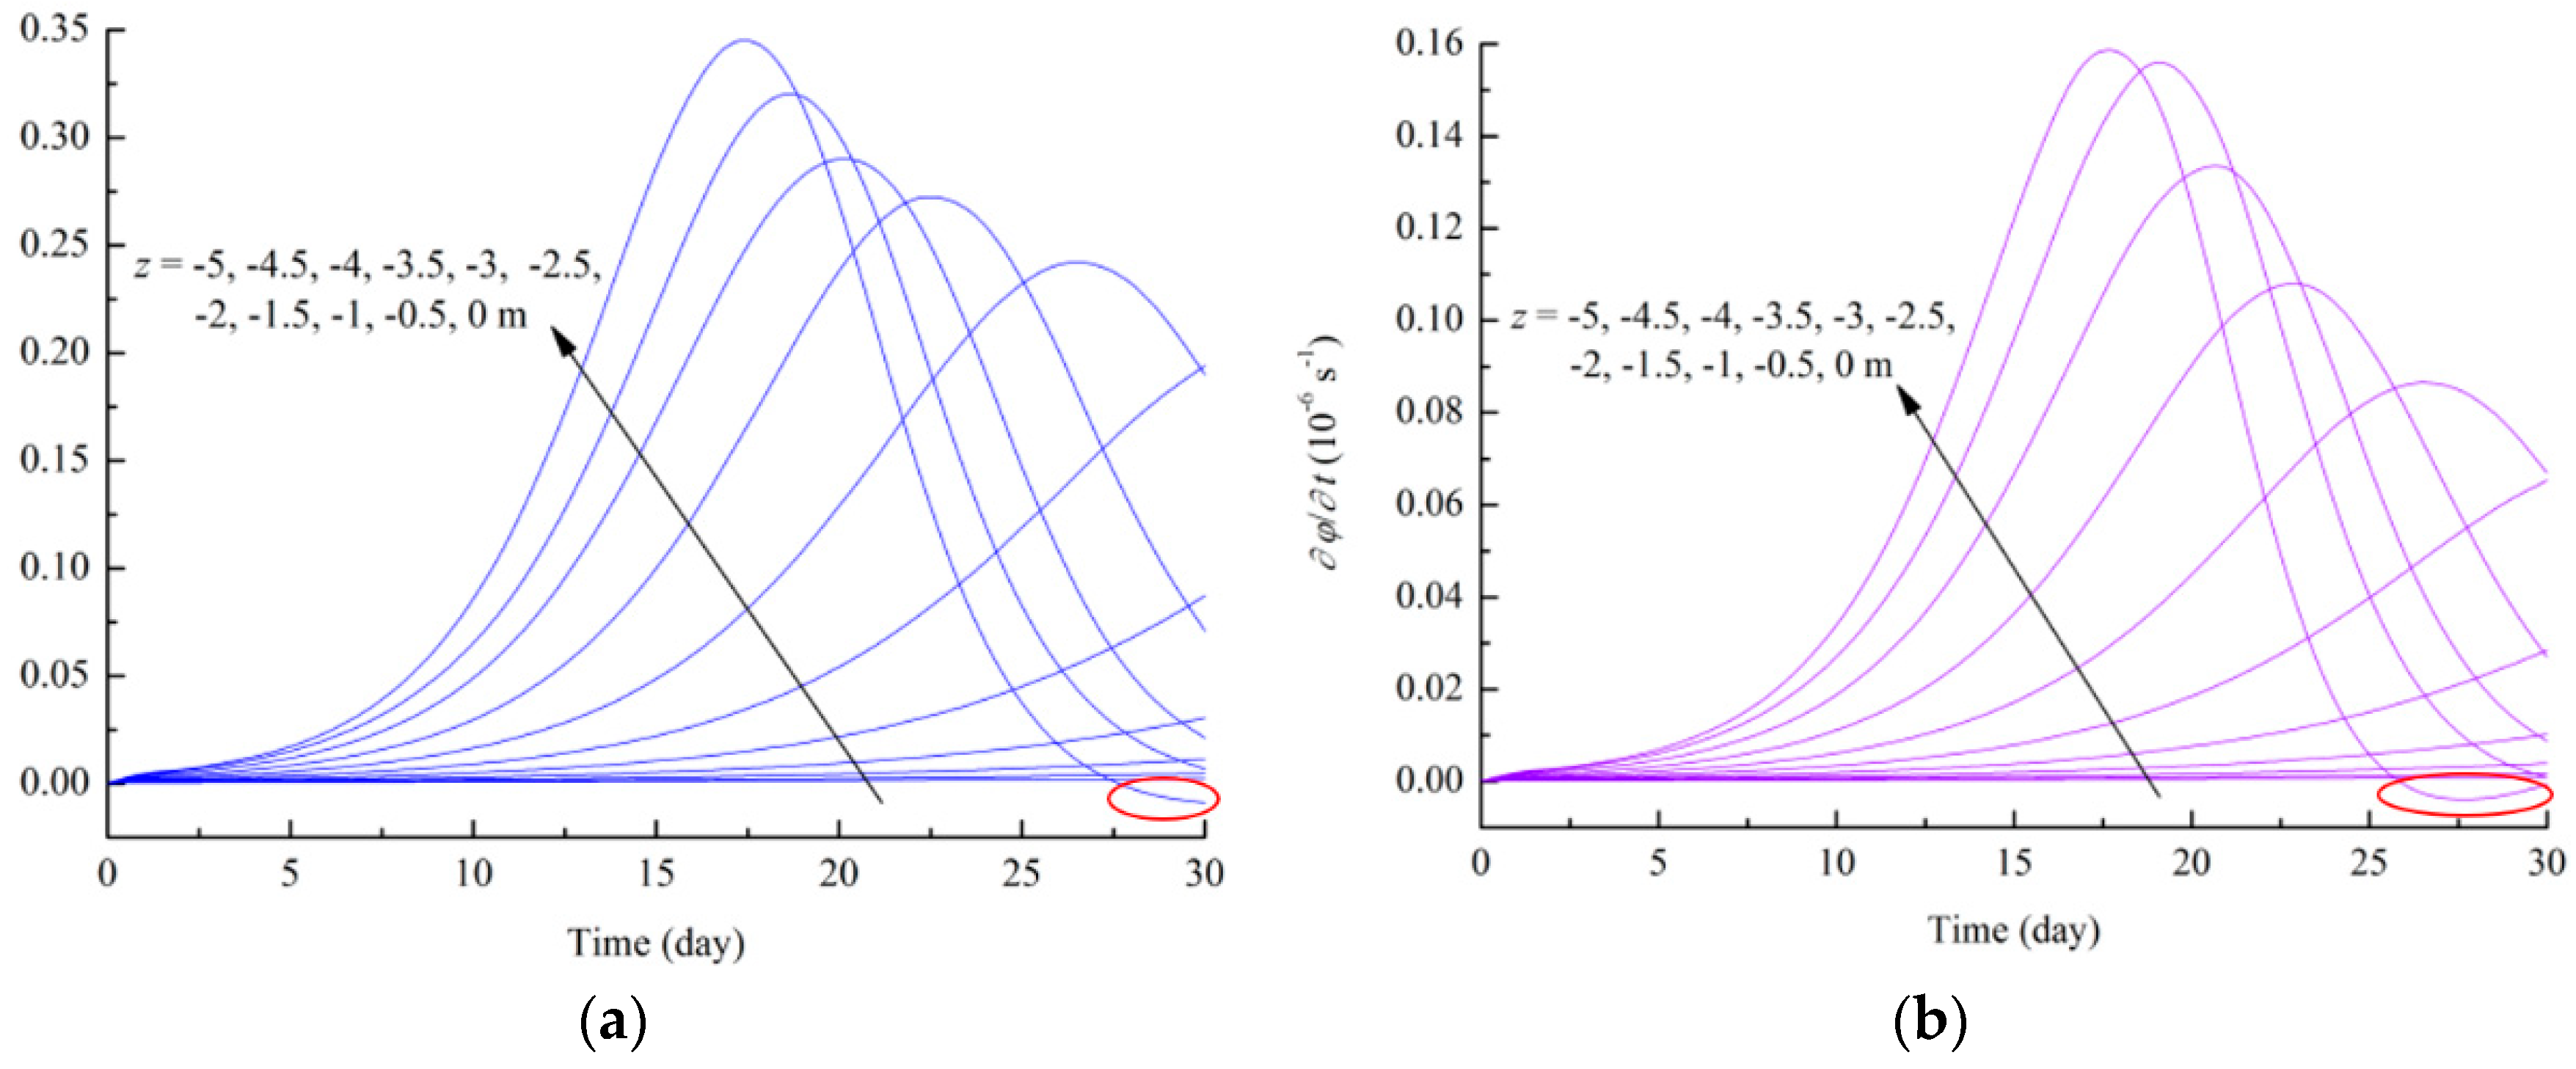
  • The wave-induced erosion mainly occurred at the shallow depth of the seabed. For the typical wave condition, the depth affected by the wave-induced erosion is within approximately −5.00 m. In the erosion process, the concentration of the fluidized particles increases to the critical value and then remains at a stable state within −2.00 m depth. The soil porosity and soil permeability increase significantly in the shallow seabed. The maximum values of soil porosity and soil permeability occurred at depths of about −0.50 m. It is also found that the deeper the soil, the slower the erosion rate, and the later the peak erosion rate can reach. The numerical model proposed in this paper can be used for the analysis of the seabed coarsening phenomenon.
  • With the increase of wave height, the soil porosity, the affected depth, and the erosion rate increase obviously. When the wave height is over 2.00 m, the soil erosion on the seabed surface develops rapidly. In the later stage of the erosion process, the change rate of soil porosity can be negative, which illustrates that the deposition effect of fine particles plays an obvious role in the later stage of the erosion process.
  • The wave period has an obvious effect on the soil porosity and the erosion rate, but the effect is not always promotional to the soil erosion. This is because the development of the residual pore-pressure is controlled by a competition mechanism between the accumulation and the dissipation. There exists a particular wave period to make the erosion induced by waves the fastest and most severe.
  • The critical concentration of the fluidized soil particles has an obvious effect on the evolution of wave-induced erosion, including erosion rate and erosion degree. The bigger the critical concentration of the fluidized soil particles, the more severe the soil erosion. The erosion depth of seabeds is not affected by the critical concentration of the fluidized soil particles.
The seabed coarsening phenomenon commonly appears at shallow seabeds, which is because the fine particles filling in the pore space tend to move with the seepage flow under wave actions. The coarsening phenomenon of the seabed will lead to the increase of soil permeability. This is the most important effect that can significantly affect the potential and the depth of seabed liquefaction. In addition, the mechanical properties of seabed soil will also be changed with seabed coarsening. There has been no published experiment so far about the seabed erosion process induced by waves, which will be our aim in the next step.

Author Contributions

Methodology, Z.G.; Validation, W.Z., C.Z. and S.R.; Formal analysis, F.Y.; Writing—Original Draft preparation, C.Z. and W.Z.; Writing—Review and Editing, F.Y.; Supervision, Z.G.

Funding

This research was funded by National Natural Science Foundation of China (51779220, 51209183), Natural Science Foundation of Zhejiang Province (LHZ19E090003).

Conflicts of Interest

The authors declare no conflict of interest.

Nomenclature

cconcentration of the fluidized soil particlesPoscoscillatory pore-pressure
ccrcritical concentration of the fluidized soil particlesPresresidual pore-pressure
cvconsolidation coefficientPbamplitude of the dynamic wave pressure
dsdepth of the seabed q ¯ volume flow rate
dwdepth of the waterTwave period
dWvolume of the soil elementvfsvelocity of the fluidized soil particles
dWfvolume of the soil skeletonvfvelocity of the pore fluid
dWf svolume of the pore fluid v ¯ velocity of the mixture
dWsvolume of the fluidized soil particlesvsvelocity of the soil skeleton
dMmasse of the soil elementv1velocity of the soil phase
dMfmasse of the soil skeletonv2velocity of the mixture phase
dMfsmasse of the pore fluidρ1density of the soil phase
dMsmasse of the fluidized soil particlesρ2density of the mixture phase
d s ¯ pore part of dsρfdensity of the pore fluid
ksoil permeabilityρsdensity of the solid skeleton
Kreference permeability ρ ¯ density of the mixture
Kwbulk modulus of pore water ρ ¯ f s apparent density of the fluidized soil particles
K0coefficient of lateral earth pressureφsoil porosity
kswave numberγ’effective unit weight of soil
Lwwave lengthβ, ηempirical constants for soil type, relative density
m ˙ α mass generation termηkkinematic viscosity of the mixture
m ˙ e r rate of eroded massμPoisson’s ratio of soil
m ˙ d e p rate of deposited mass
Ptotal excess pore-pressure
d W ¯ the volume of the mixture through the cross-sectional ds within dt time
αthe fluidized particles phase or solid phase or fluid phase
λthe parameter used to describe the spatial frequency of the potential erosion starter points

References

  1. Jia, Y.G.; Huo, S.X.; Xu, G.H.; Shan, H.X.; Zheng, J.G.; Liu, H.J. Intensity variation of sediments due to wave loading on subaqueous delta of Yellow River. Rock Soil Mech. 2004, 25, 876–881. (In Chinese) [Google Scholar]
  2. Sumer, B.M.; Dixen, F.; Fredsoe, J.; Sumer, S.K. The sequence of sediment behaviour during wave-induced liquefaction. Sedimentology 2010, 53, 611–629. [Google Scholar] [CrossRef]
  3. Shi, W.J. Wave-induced soils failure subaqueous hard crust on delta of Yellow River. Master’s Thesis, Ocean University of China, Qingdao, China, 2004. (In Chinese). [Google Scholar]
  4. Li, X.D. Research on wave induced silty soil liquefaction in Yellow River Estuary. Master’s Thesis, Ocean University of China, Qingdao, China, 2008. (In Chinese). [Google Scholar]
  5. Zen, K.; Yamazaki, H. Mechanism of wave-induced liquefaction and densification in seabed. Soil Found. 1990, 30, 90–104. [Google Scholar] [CrossRef]
  6. Jia, Y.G.; Zheng, J.G.; Yue, Z.Q.; Liu, X.L.; Shan, H.X. Tidal flat erosion of the Huanghe River Delta due to local changes in hydrodynamic conditions. Acta Oceanol. Sin. 2014, 33, 116–124. [Google Scholar] [CrossRef]
  7. COMSOL. Multiphysics User Guide, Version 4, 3rd ed.; COMSOL AB: Stockholm, Sweden, 2013. [Google Scholar]
  8. Jeng, D.S.; Seymour, B.; Gao, F.P.; Wu, Y.X. Ocean waves propagating over a porous seabed: Residual and oscillatory mechanisms. Sci. China Ser. E-Technol. Sci. 2007, 50, 81–89. [Google Scholar] [CrossRef]
  9. Seed, H.B.; Rahman, M.S. Wave-induced pore pressure in relation to ocean floor stability of cohesionless soils. Mar. Georesour. Geotechnol. 1978, 3, 123–150. [Google Scholar] [CrossRef]
  10. Nago, H.; Maeno, S.; Matsumoto, T.; Hachiman, Y. Liquefaction and densification of loosely deposited sand bed under water pressure variation. In Proceedings of the 3rd International Offshore and Polar Engineering Conference, Singapore, 6–11 June 1993; pp. 578–584. [Google Scholar]
  11. Jeng, D.S. Wave-induced sea floor dynamics. Appl. Mech. Rev. 2003, 56, 407–429. [Google Scholar] [CrossRef]
  12. Jeng, D.S.; Seymour, B.R.; Li, J. A new approximation for pore pressure accumulation in marine sediment due to water waves. Int. J. Numer. Anal. Methods Geomech. 2010, 31, 53–69. [Google Scholar] [CrossRef]
  13. Madsen, O.S. Wave-induced pore pressure and effective stresses in a porous bed. Geotechnique 1978, 28, 377–393. [Google Scholar] [CrossRef]
  14. Yamamoto, T.; Koning, H.; Sellmejjer, H.; Hijum, E.V. On the response of a poroelastic bed to water waves. J. Fluid Mech. 1978, 87, 193–206. [Google Scholar] [CrossRef]
  15. Qi, W.G.; Gao, F.P. Wave induced instantaneously-liquefied soil depth in a non-cohesive seabed. Ocean Eng. 2018, 153, 412–423. [Google Scholar] [CrossRef]
  16. Liao, C.C.; Chen, J.J.; Zhang, Y.Z. Accumulation of pore water pressure in a homogeneous sandy seabed around a rocking mono-pile subjected to wave loads. Ocean Eng. 2019, 173, 810–822. [Google Scholar] [CrossRef]
  17. Guo, Z.; Jeng, D.S.; Zhao, H.Y.; Guo, W.; Wang, L.Z. Effect of seepage flow on sediment incipient motion around a free spanning pipeline. Coast. Eng. 2019, 143, 50–62. [Google Scholar] [CrossRef]
  18. Li, K.; Guo, Z.; Wang, L.Z.; Jiang, H.Y. Effect of seepage flow on shields number around a fixed and sagging pipeline. Ocean Eng. 2019, 172, 487–500. [Google Scholar] [CrossRef]
  19. Sumer, B.M.; Cheng, N.S. A random-walk model for pore pressure accumulation in marine soils. In Proceedings of the 9th International Offshore and Polar Engineering Conference (ISOPE99), Brest, France, 30 May–4 June 1999; pp. 521–528. [Google Scholar]
  20. Cheng, L.; Sumer, B.M.; Fredsöe, J. Solution of pore pressure build up due to progressive waves. Int. J. Numer. Anal. Geomech. 2001, 25, 885–907. [Google Scholar] [CrossRef]
  21. Guo, Z.; Jeng, D.S.; Guo, W. Simplified approximation of wave-induced liquefaction in a shallow porous seabed. Int. J. Geomech. ASCE 2014, 14, 06014008-1-5. [Google Scholar] [CrossRef]
  22. Chen, W.Y.; Fang, D.; Chen, G.X.; Jeng, D.S.; Zhu, J.F.; Zhao, H.Y. A simplified quasi-static analysis of wave-induced residual liquefaction of seabed around an immersed tunnel. Ocean Eng. 2018, 148, 574–587. [Google Scholar] [CrossRef]
  23. Sumer, B.M.; Fredsoe, J. The Mechanics of Scour in the Marine Environment; World Scientific: Singapore, 2002; ISBN 978-981-02-4930-4. [Google Scholar]
  24. Sumer, B.M.; Kirca, V.S.O.; Fredsøe, J. Experimental validation of a mathematical model for seabed liquefaction under waves. Int. J. Offshore Polar Eng. 2012, 22, 133–141. [Google Scholar]
  25. Vardoulakis, I.; Stavropoulou, M.; Papanastasiou, P. Hydromechanical aspects of sand production problem. Transp. Porous Media 1996, 2, 225–244. [Google Scholar] [CrossRef]
  26. Sterpi, D. Effects of the erosion and transport of fine particles due to seepage flow. Int. J. Geomech. ASCE 2003, 3, 111–122. [Google Scholar] [CrossRef]
  27. Carman, P.C. Flow of Gases through Porous Media; Butterworths Scientific Publications: London, UK, 1956. [Google Scholar]
  28. Luo, Y.L. A continuum fluid-particle coupled piping model based on solute transport. Int. J. Civ. Eng. 2013, 11, 38–44. [Google Scholar]
  29. Okusa, S. Wave-induced stresses in unsaturated submarine sediments. Geotechnique 1985, 32, 235–247. [Google Scholar] [CrossRef]
Figure 1. Plumes of sediment and micro-holes in silty sediment seabed: (a) The plumes of sediment on the silty sediment surface; (b) The micro-holes due to erosion. [4].
Jmse 07 00052 g001
Figure 2. Two mechanisms of the wave-induced pore-pressure and the erosion process.
Jmse 07 00052 g002
Figure 3. Three-phase theoretical model for the seabed soil.
Jmse 07 00052 g003
Figure 4. Mass conservation of the three phases: (a) Fluidized particles; (b) soil skeleton; (c) Pore fluid.
Jmse 07 00052 g004
Figure 5. Distributions of the oscillatory pore-pressure and the residual pore-pressure: (a) Vertical distribution of | P o s c | / P b ; (b) vertical distribution of ( P b | P o s c | ) / σ 0 ; (c) vertical distribution of Pres for different times; (d) vertical distribution of P r e s / σ 0 for different times.
Jmse 07 00052 g005
Figure 6. Variations of the concentration of moving particles with the increase of wave acting time: (a) Diagram of three-dimensions; (b) diagram of two-dimensions.
Jmse 07 00052 g006
Figure 7. Variations of the soil porosity with the increase of wave acting time: (a) Diagram of three-dimensions; (b) diagram of two-dimensions.
Jmse 07 00052 g007
Figure 8. Variations of the soil permeability with the increase of wave acting time: (a) Diagram of three-dimensions; (b) diagram of two-dimensions.
Jmse 07 00052 g008
Figure 9. Variations of c t , φ t at different depths with the increase of wave acting time: (a) c t t ; (b) φ t t .
Jmse 07 00052 g009
Figure 10. Distributions of the oscillatory pore-pressure and the residual pore-pressure for different wave heights: (a) Vertical distribution of | P o s c | / P b for different H; (b) vertical distribution of ( P b | P o s c | ) / σ 0 for different H; (c) vertical distribution of Pres for different H; (d) vertical distribution of P r e s / σ 0 for different H.
Jmse 07 00052 g010
Figure 11. Variations of the soil porosity for different wave heights.
Jmse 07 00052 g011
Figure 12. Variations of φ t for different wave heights: (a) H = 1.50 m; (b) H = 2.00 m; (c) H = 2.25 m; (d) H = 2.50 m.
Jmse 07 00052 g012
Figure 13. Distributions of the oscillatory pore-pressure and the residual pore-pressure for different wave periods: (a) Vertical distribution of | P o s c | / P b for different T; (b) vertical distribution of ( P b | P o s c | ) / σ 0 for different T; (c) vertical distribution of Pres for different T; (d) vertical distribution of P r e s / σ 0 for different T.
Jmse 07 00052 g013
Figure 14. Variations of the soil porosity for different wave periods.
Jmse 07 00052 g014
Figure 15. Variations of φ t for different wave periods: (a) T = 5 s; (b) T = 10 s; (c) T = 15 s; (d) T = 20 s.
Jmse 07 00052 g015
Figure 16. Variations of the soil porosity for different critical concentrations of the fluidized soil particles.
Jmse 07 00052 g016
Figure 17. Variations of φ t for different critical concentrations of the fluidized soil particles: (a) ccr = 0.10; (b) ccr = 0.20; (c) ccr = 0.30; (d) ccr = 0.40; (e) ccr = 0.50.
Jmse 07 00052 g017
Table 1. Parameters used in the numerical model for the typical wave condition case.
PropertiesValue
Wave height Hw (m) 2.00
Wave period T (s)5.00
Wave length Lw (m)36.59
Water depth dw (m)10.00
Depth of the seabed ds (m)30.00
Density of the fluidized soil particles ρfs (kg/m3)2650.00
Effective unit weight of soil γ’ (kN/m3)10.20
Density of the fluid ρf (kg/m3)980.00
Shear modulus of the soil skeleton Gs (MPa)50.00
Poisson’s ratio of soil μ0.33
Bulk modulus of pore water Kw (MPa)2.0e3
Coefficient of lateral earth pressure K0 0.40
Initial concentration of the fluid soil particles c00.001
Critical concentration of the fluid soil particles ccr0.30
Initial porosity of soil in seabed φ00.42
Table 2. Calculation cases of the parametric analyses.
VariablesValue
Wave height Hw (m)1.50, 1.75, 2.00, 2.25, 2.50
Wave period T (s)2.00, 5.00, 10.00, 15.00, 20.00
Critical concentration of fluid soil particles ccr0.10, 0.20, 0.30, 0.40, 0.50

