Article

Mapping Heavy Metal Concentrations in Beach Sands Using GIS and Portable XRF Data

1
Division of Graduate Education for Sustainability of Foundation Energy, Seoul National University, Seoul 08826, Korea
2
Department of Energy Resources Engineering, Pukyong National University, Busan 48513, Korea
*
Author to whom correspondence should be addressed.
J. Mar. Sci. Eng. 2019, 7(2), 42; https://doi.org/10.3390/jmse7020042
Submission received: 16 January 2019 / Revised: 2 February 2019 / Accepted: 4 February 2019 / Published: 8 February 2019
(This article belongs to the Section Coastal Engineering)

Abstract

:
It is necessary to investigate the contamination of beach sands to ensure water safety, as they may contain potentially toxic trace elements. Tourists, oil spills, or replenishing sands can cause beach sand contamination. In this study, heavy metal contamination maps of lead (Pb) and zinc (Zn) were created for Wolpo Beach, on the eastern coast of Korea, using portable X-ray fluorescence and geographic information systems (GIS). Interpolation methods, such as kriging and inverse distance weighting, were used in this study and their results were compared. Understanding the spatial variation of potentially toxic trace elements in beach sand is necessary to determine suitable measures for preventing contamination. Sufficient sand data for understanding spatial patterns can be acquired by using rapid portable X-ray fluorescence analysis. As a result, we could create heavy metal concentration maps for the sand of Wolpo Beach. It was confirmed that the southern part of the target area is more contaminated than the northern part. However, there are no sand areas with highly concentrated heavy metal levels. In addition, no sample data exceed the soil contamination standards. This study demonstrates that portable X-ray fluorescence and geographic information systems can be utilized for investigating and preventing the contamination of beach sands by creating heavy metal concentration maps.

1. Introduction

Many people visit the eastern coast of Korea for vacations every summer. Therefore, it is important to preserve and clean the sandy beaches on the coast to ensure human health and safety. However, the coastal environment is vulnerable to pollution from tourists or oil spills. In addition, coastal sand is continually eroded and supplemented with replenishing sand, which can contain potentially toxic trace elements (PTEs). Therefore, to prevent the damage caused by heavy metals in the sand, it is necessary to investigate the harmful heavy metal content of coastal sand and map the degree of contamination.
To evaluate the contamination of replenishing sand, several studies have been conducted, analyzing their heavy metal content. Di Lauro et al. [1] analyzed the concentrations of some heavy metals along the coastline of the bay of Nice using a geochemical approach to determine the impact of replenishment. Pezzuto et al. [2] sampled the Balneario Camboriu replenishment operations to assess their environmental impacts. In Korea, the Petroleum Management Service [3] reported that the beaches on the western coast of Korea are safe for human health. Park et al. [4] conducted an elemental analysis for five heavy metals using inductively coupled plasma (ICP) and atomic absorption spectrophotometry (AAS) on the eastern coast of Korea.
These studies did not analyze the overall spatial distribution of the heavy metals in sand, however, the degree of pollution in the sample was evaluated. The following studies aimed to map the distribution of pollution at beaches. Jensen et al. [5] proposed and mapped the coastal environmental sensitivity for oil spills in the United Arab Emirates using remote sensing and geographic information system (GIS) technologies. Nobi et al. [6] studied the spatial distribution of metal concentrations in surface sediment samples collected from 16 marine locations covering different coastal ecosystems on the Andaman Islands, India. Ip et al. [7] analyzed the distribution of Cu, Cr, Pb, and Zn in the Pearl River Estuary and its surrounding coastal area in China, and exhibited a typical diffusion pattern from the land to the direction of the sea.
In addition, some studies have been conducted using portable X-ray fluorescence (PXRF) to analyze PTEs in soil. Higueras et al. [8] estimated the spatial distribution of PTEs cost-effectively, by applying PXRF to the soil in abandoned mines in developing countries. Kalnicky and Singhvi [9] confirmed that the PXRF analysis of environmental samples can save time and money without complicated preprocessing. PXRF and GIS have been used together to effectively identify and map the spatial distribution of PTEs. Lee and Choi [10] analyzed the spatial distribution of PTEs in the soil for both operating and abandoned mining areas using PXRF and GIS techniques, and proposed appropriate measures to prevent contamination. However, there are few cases where PXRF and GIS techniques are applied to determine the spatial distribution of PTEs in beach sands.
Interpolation methods, such as kriging and inverse distance weighting (IDW), are used in this study to understand the spatial variation and map the risk of PTEs in beach sands. PXRF analysis, which is relatively cost- and time-effective, was used to acquire the heavy metal concentrations from sand sampling data. Sand data were acquired from the Wolpo Beach on the eastern coast of Korea and were used to map heavy metal concentrations.

2. Materials and Methods

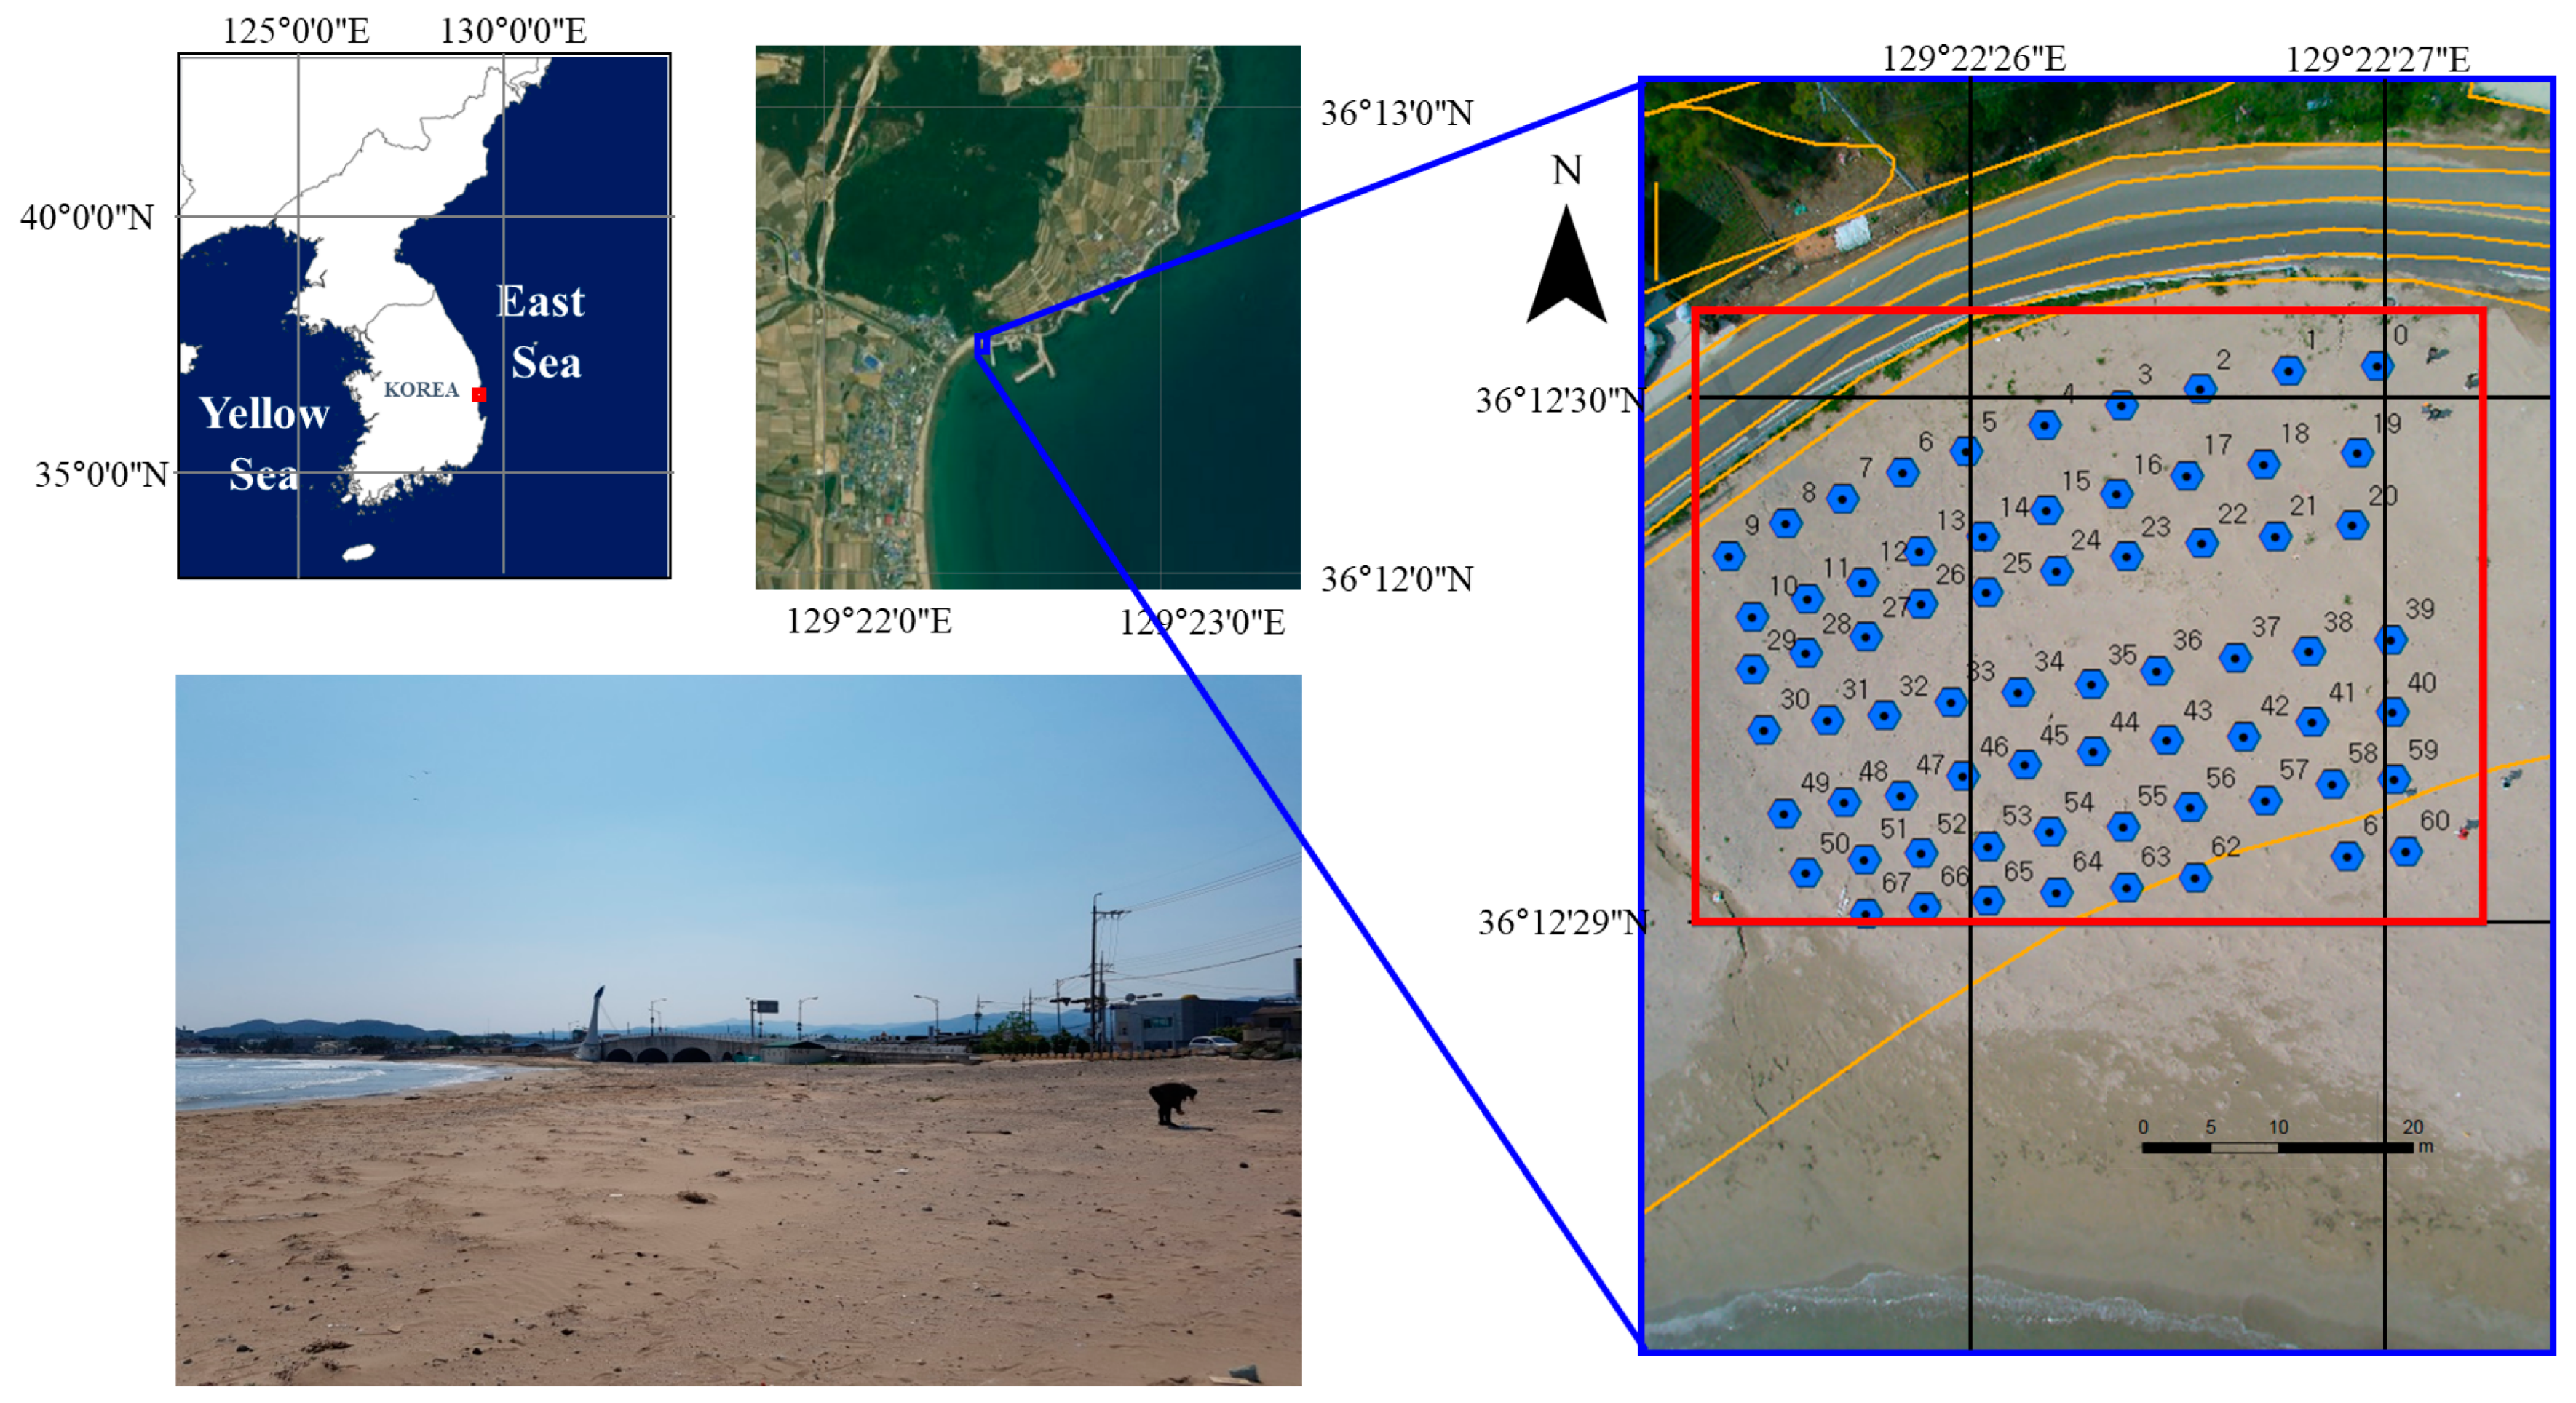
2.1. Target Area and Sand Sampling

Wolpo Beach was selected as the target area to analyze the distribution of heavy metal contamination on the eastern coast. Some coasts in Korea are consistently eroded and supplemented with replenishing sand, and this is the case for Wolpo Beach [11]. The target area covered 60 × 50 m of the area where sampling can be conducted without the effect of waves. Sampling and geochemical analysis were performed at 68 points using PXRF (Figure 1).
PXRF can analyze multiple elements at the same time. In this study, an Innov-X DELTA Handheld XRF analyzer operating at 40 kV and 0.1 mA was used to acquire the dataset (Olympus, Japan), which is equipped with a gold anode as the excitation source and a silicon drift detector. Using a hand auger, surface sand samples were disaggregated and sieved through a <2 mm mesh to generate loose powders in the field for PXRF analysis. The results of the elemental analysis by the PXRF instrument may vary depending on the moisture in the sample. Tolner et al. [12] confirmed that the metallic element content, measured in soil with high water content, is lower than that measured in completely dried soil. In this study, elemental analysis using PXRF was performed after confirming that the water content in the sample was less than 10%, using a portable soil moisture meter (PMS-714, Lutron, Taiwan). To support quantitative analysis, the fundamental parameters (FP) method was employed, which uses stored libraries for elemental analysis [13].
The instrument used in this study is capable of analyzing more than 30 elements, including PTEs such as cadmium (Cd) and arsenic (As), but PTEs other than lead (Pb) and zinc (Zn) were not detected in most samples. Therefore, geochemical mapping was conducted using the measured concentration values for Pb and Zn in this study. Pb is a heavy metal that can fatally affect humans and can cause symptoms such as malacosteon, kidney damage, and relatively complex cancers [14]. Zn is an essential element in the human body, found in trace amounts, and is relatively less harmful than other heavy metals. However, long-term exposure to high levels of Zn can cause symptoms such as sideroblastic anemia, hypochromic microcytic anemia, leukopenia, lymphadenopathy, neutropenia, hypocupremia, and hypoferremia [15]. Therefore, it is necessary to maintain an awareness of these heavy metals and to understand their degree of pollution and distribution in the sandy beaches on the eastern coast, which many people visit.

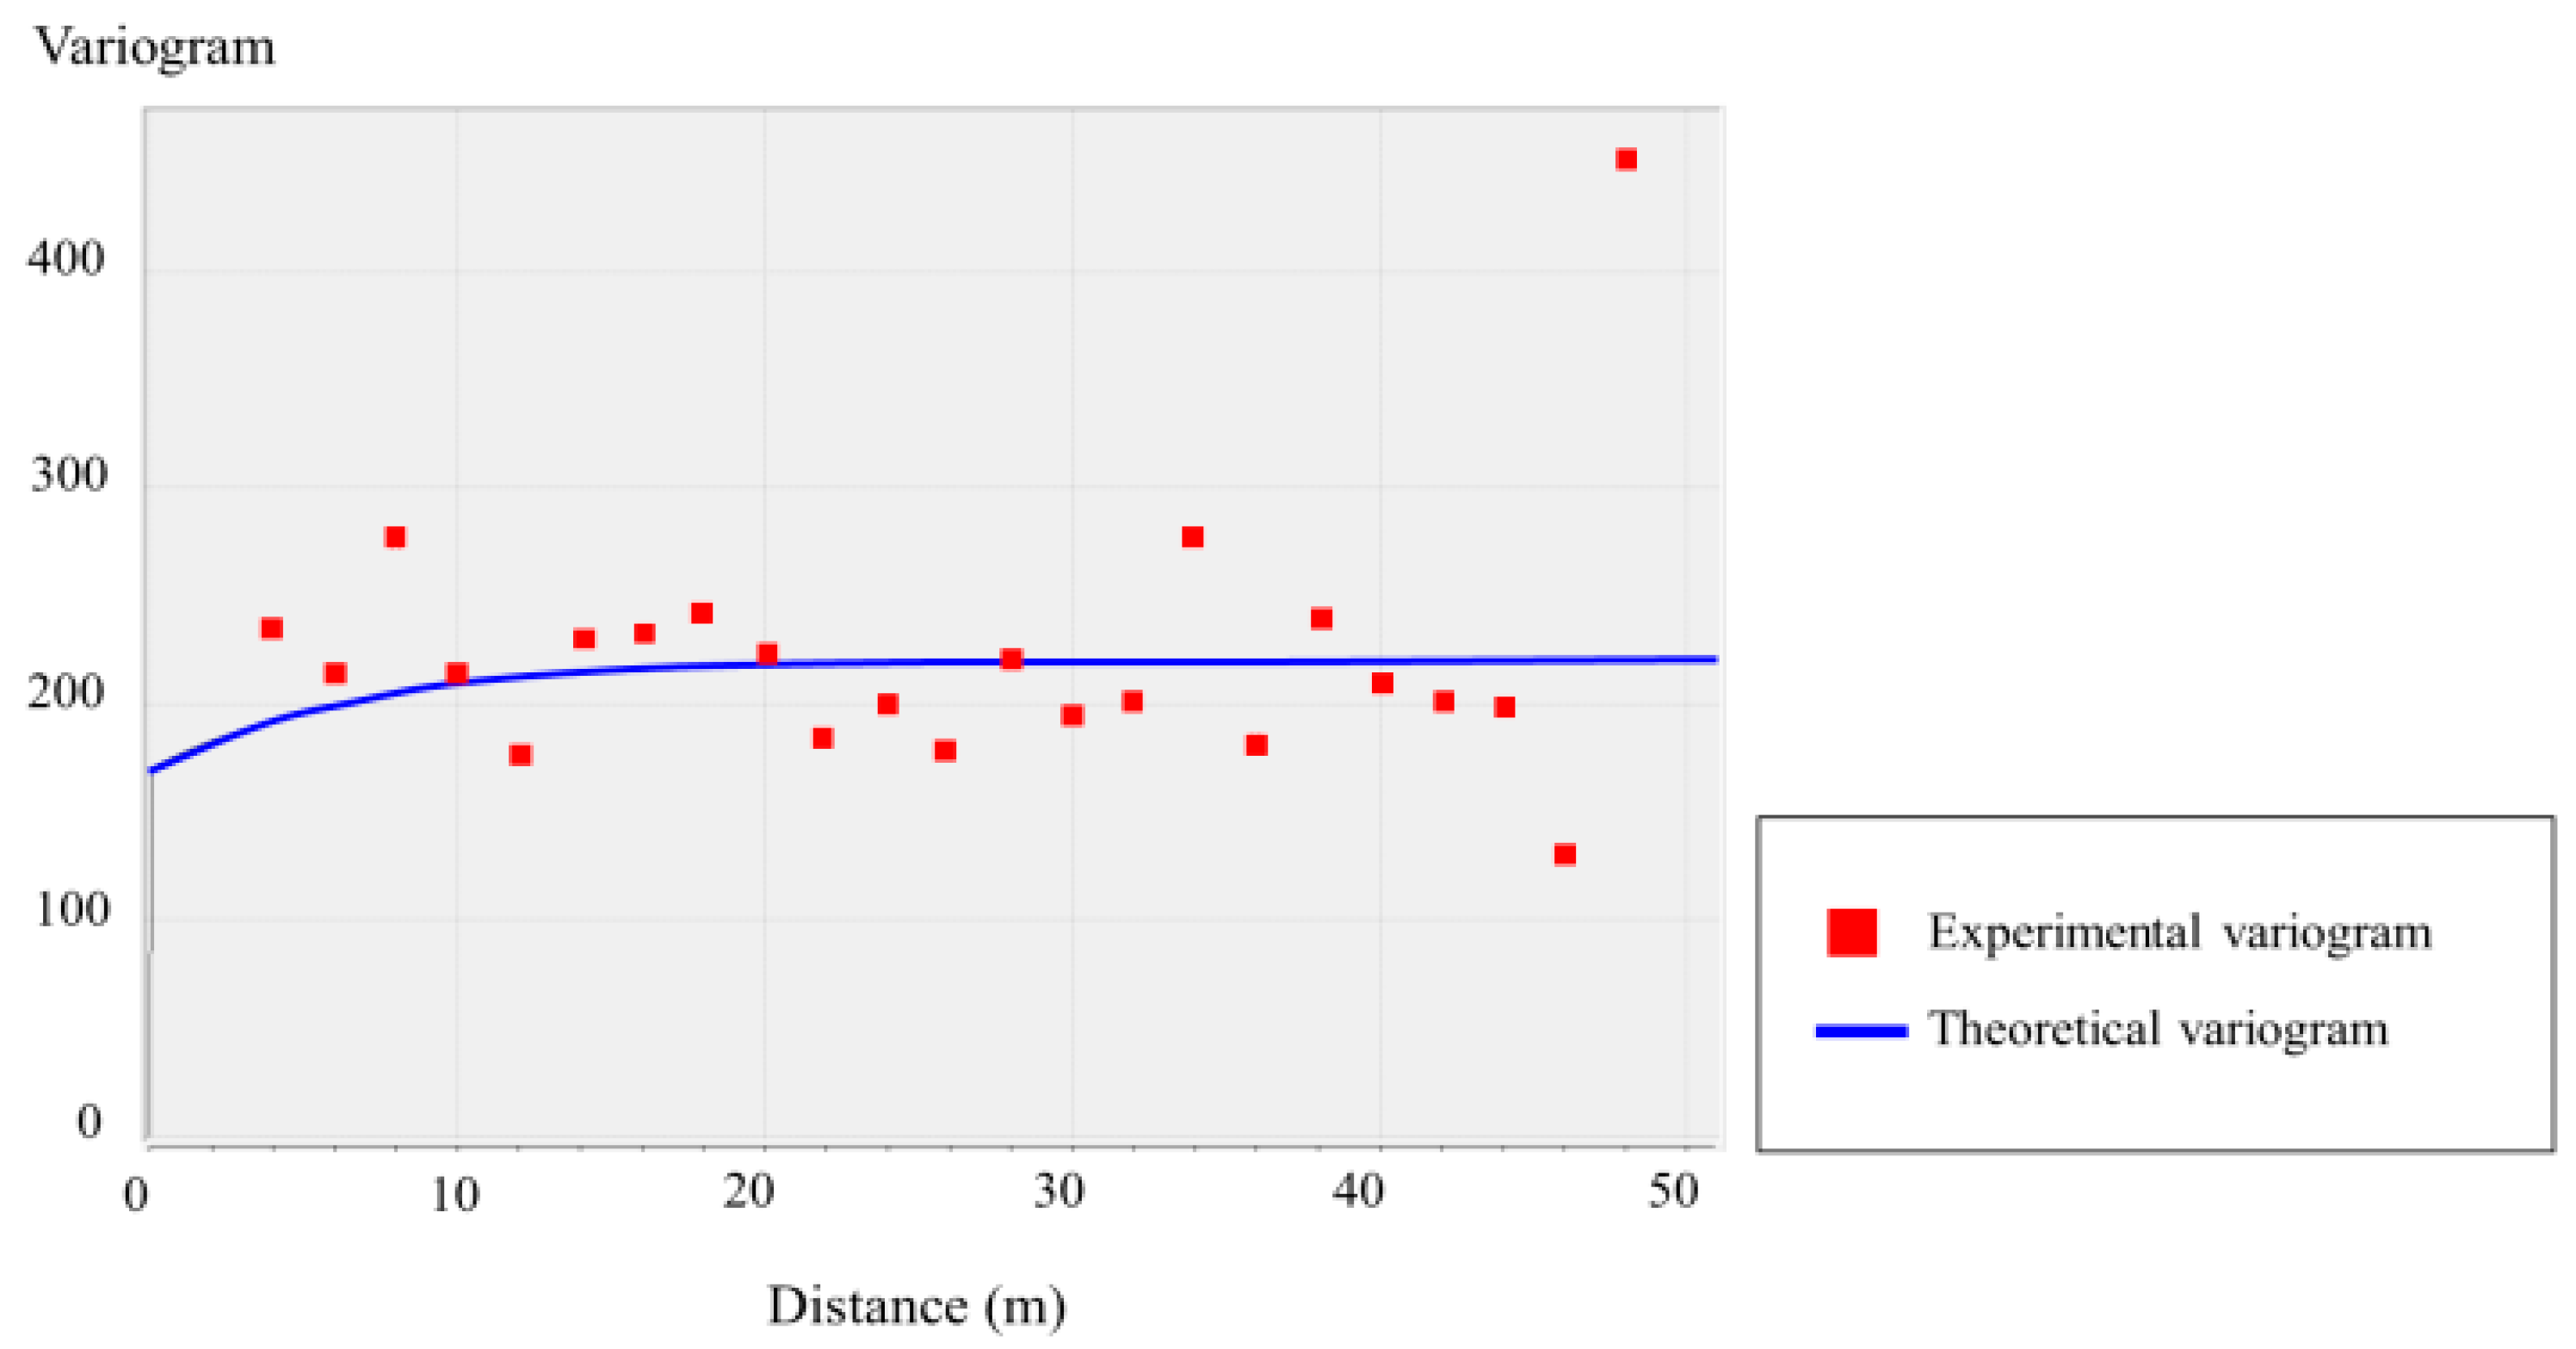
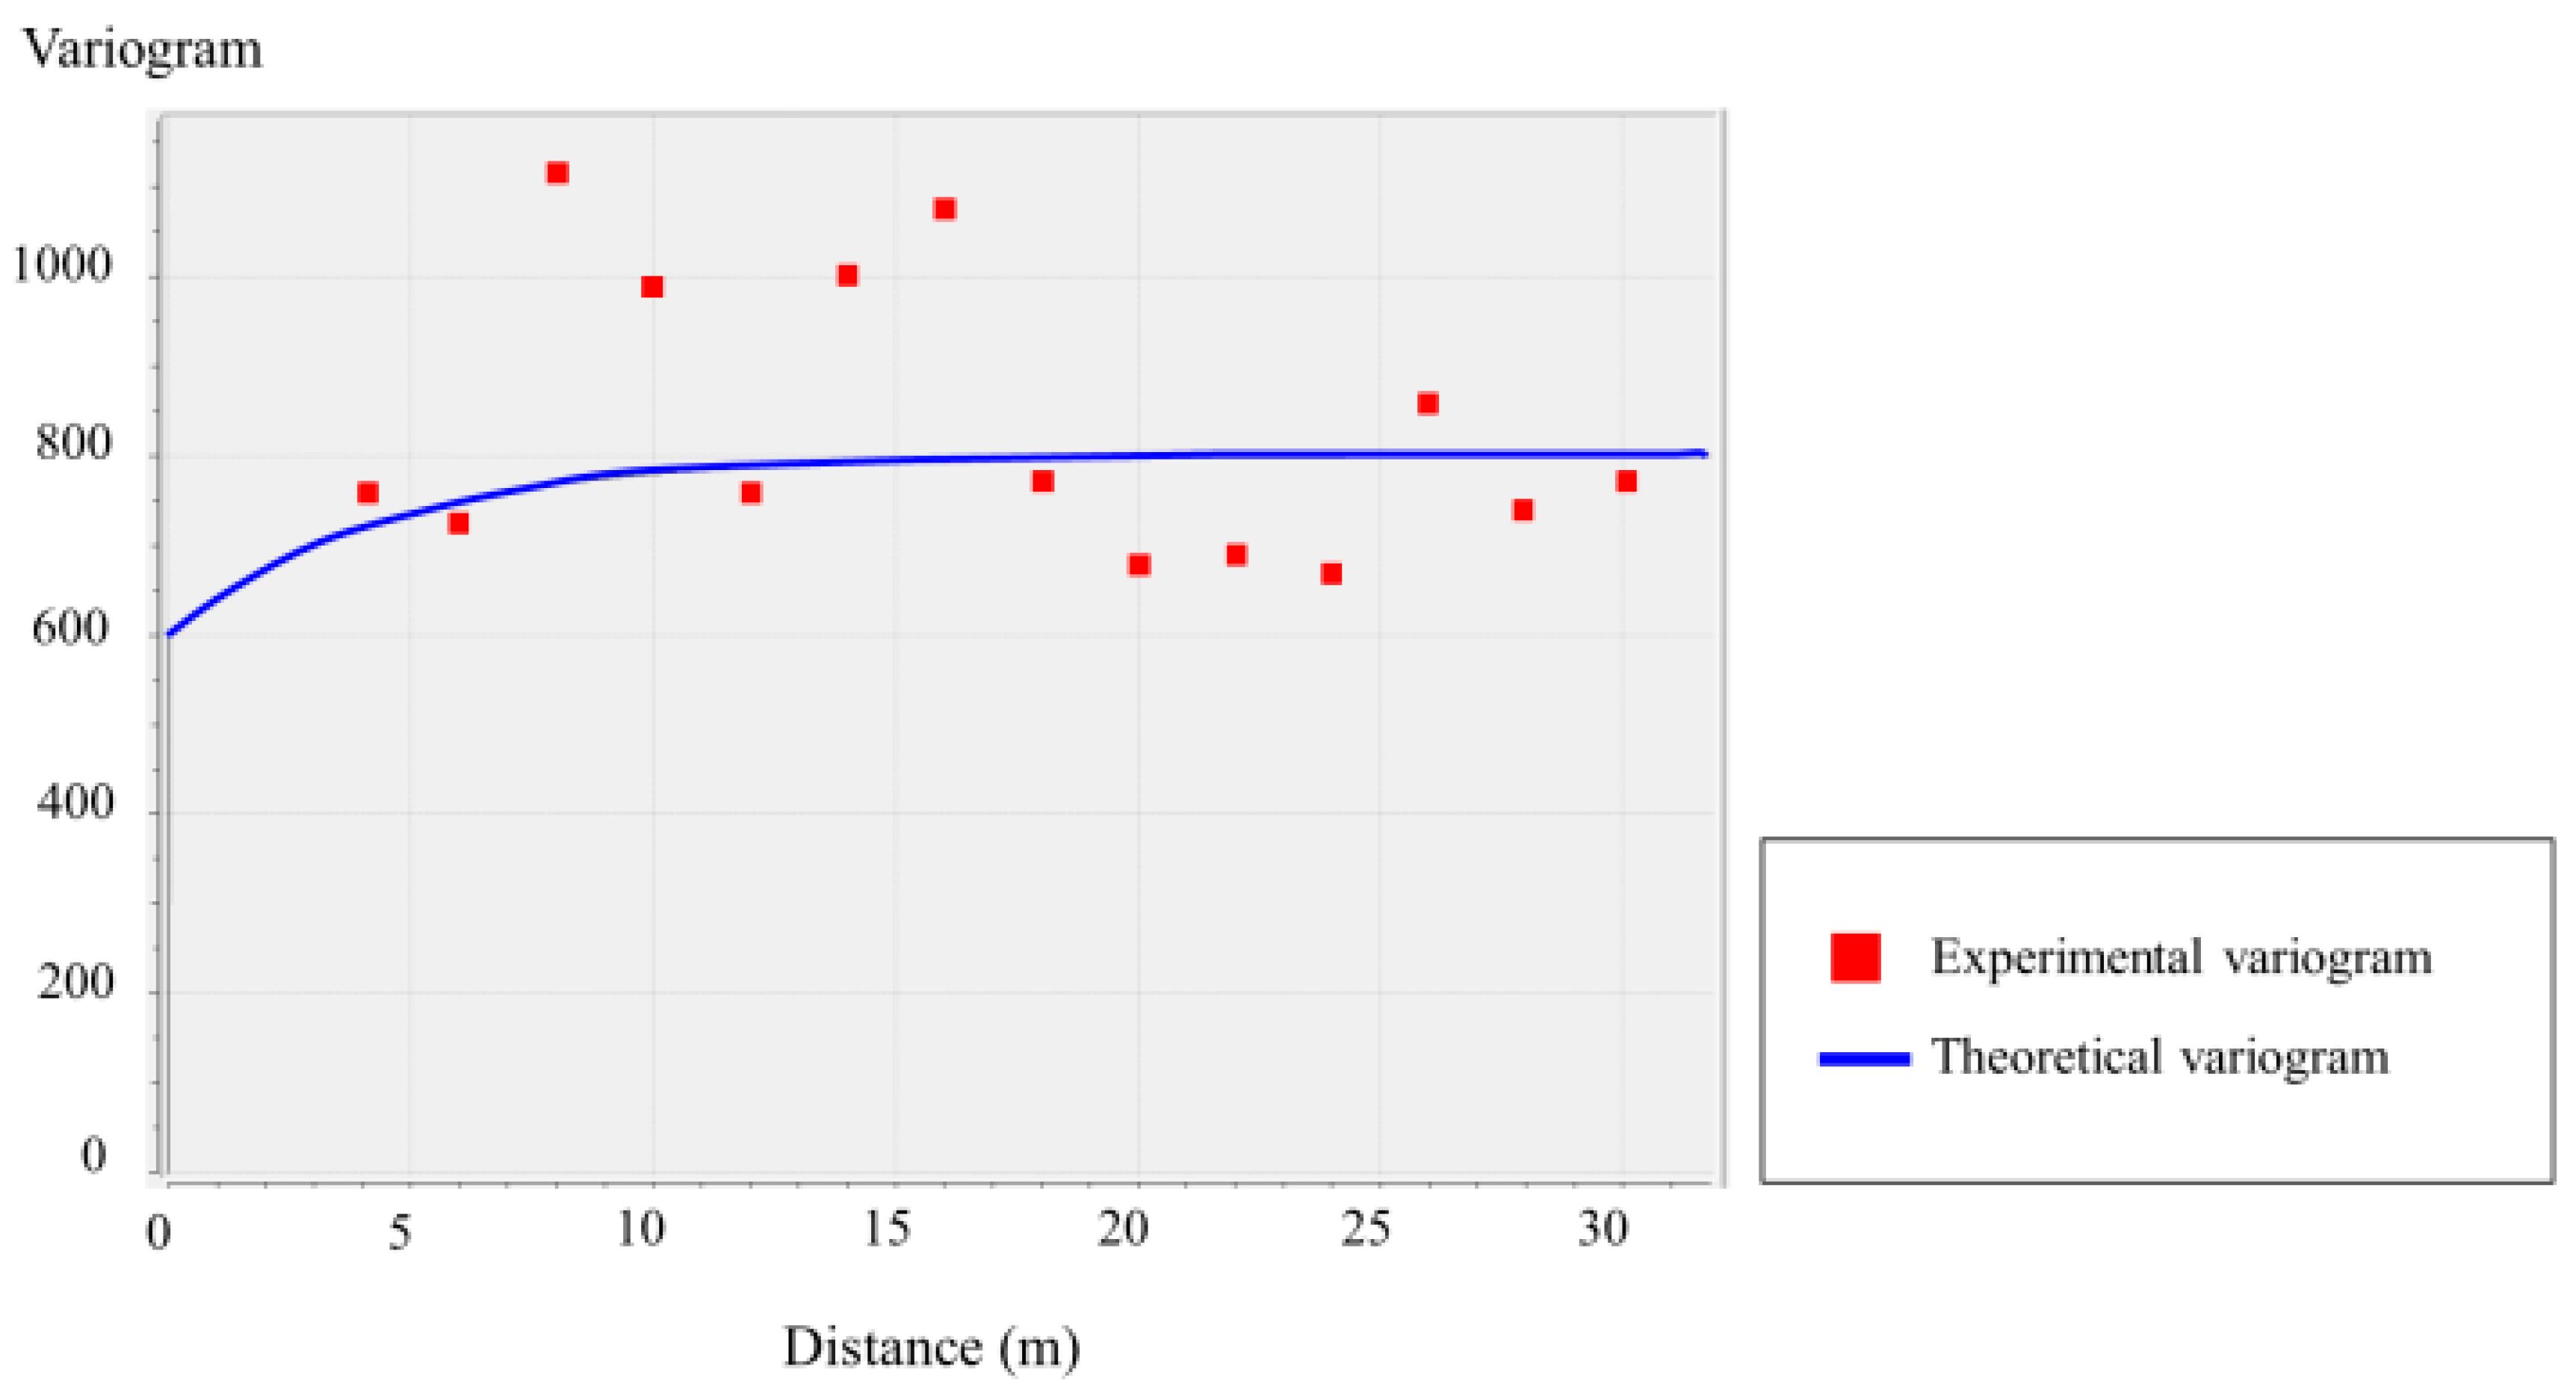
2.2. Geostatistical Spatial Interpolation
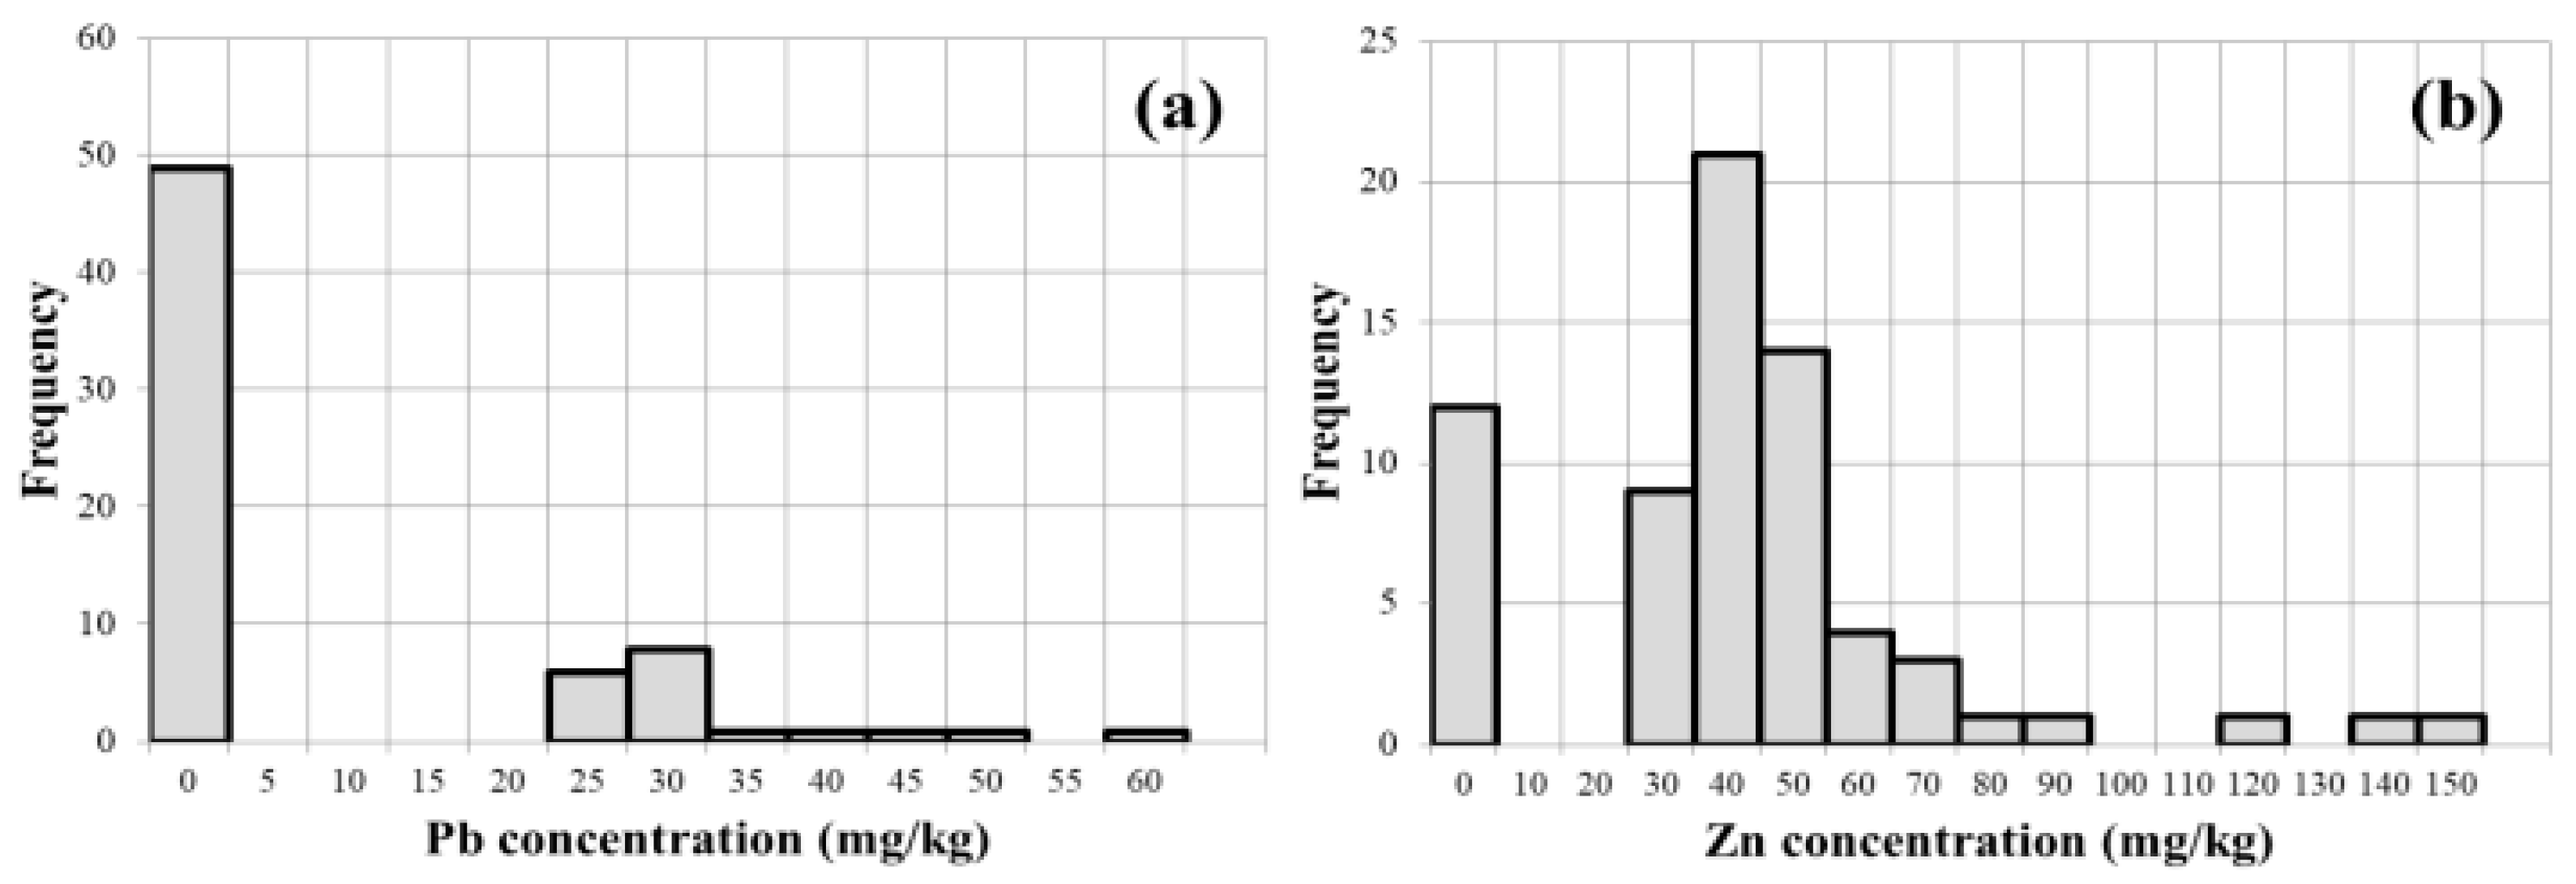
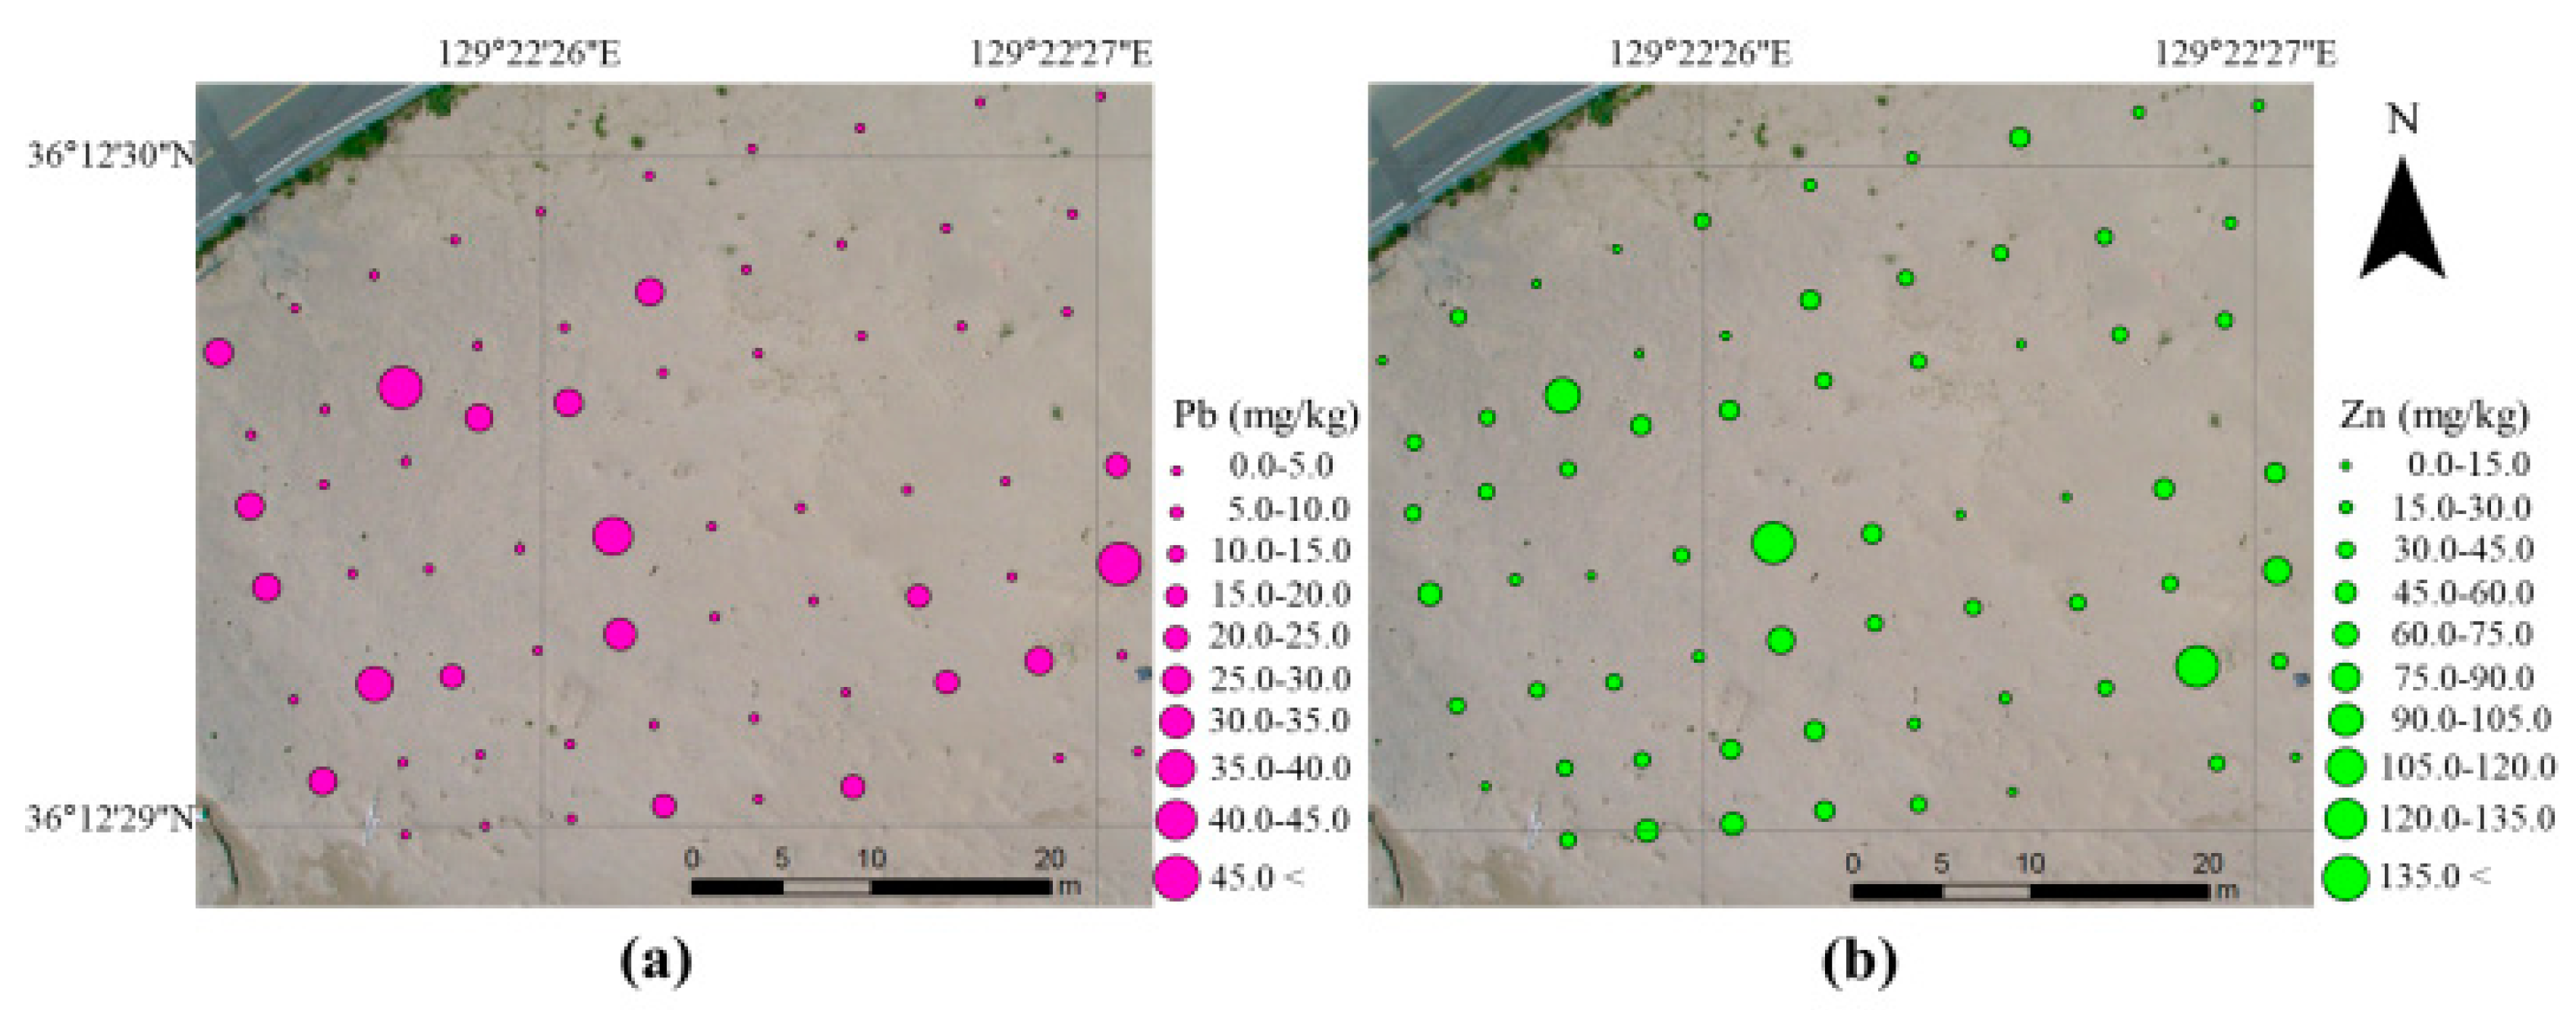
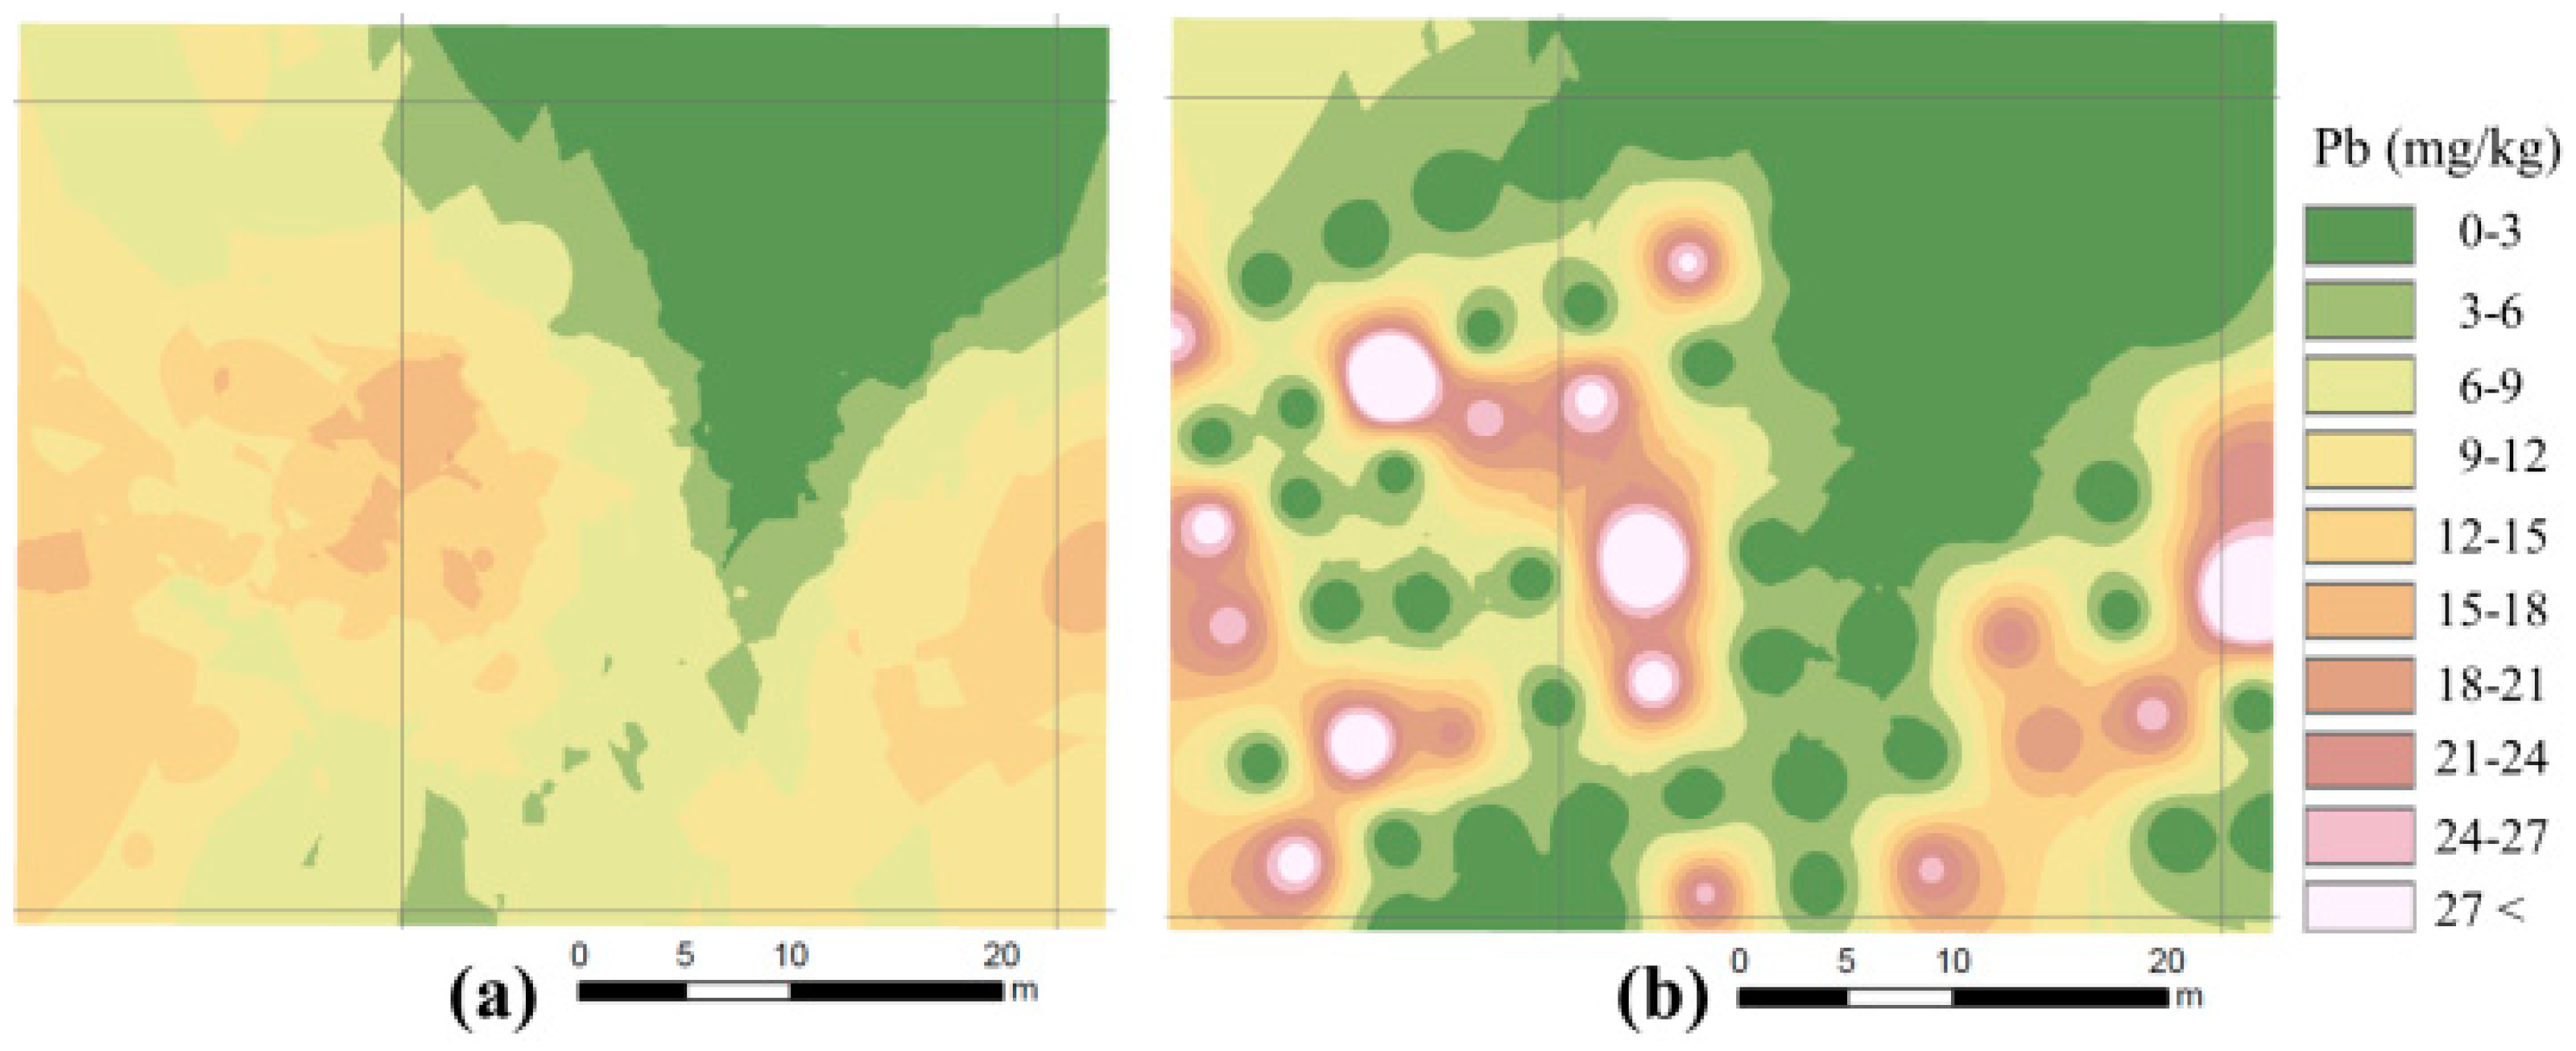
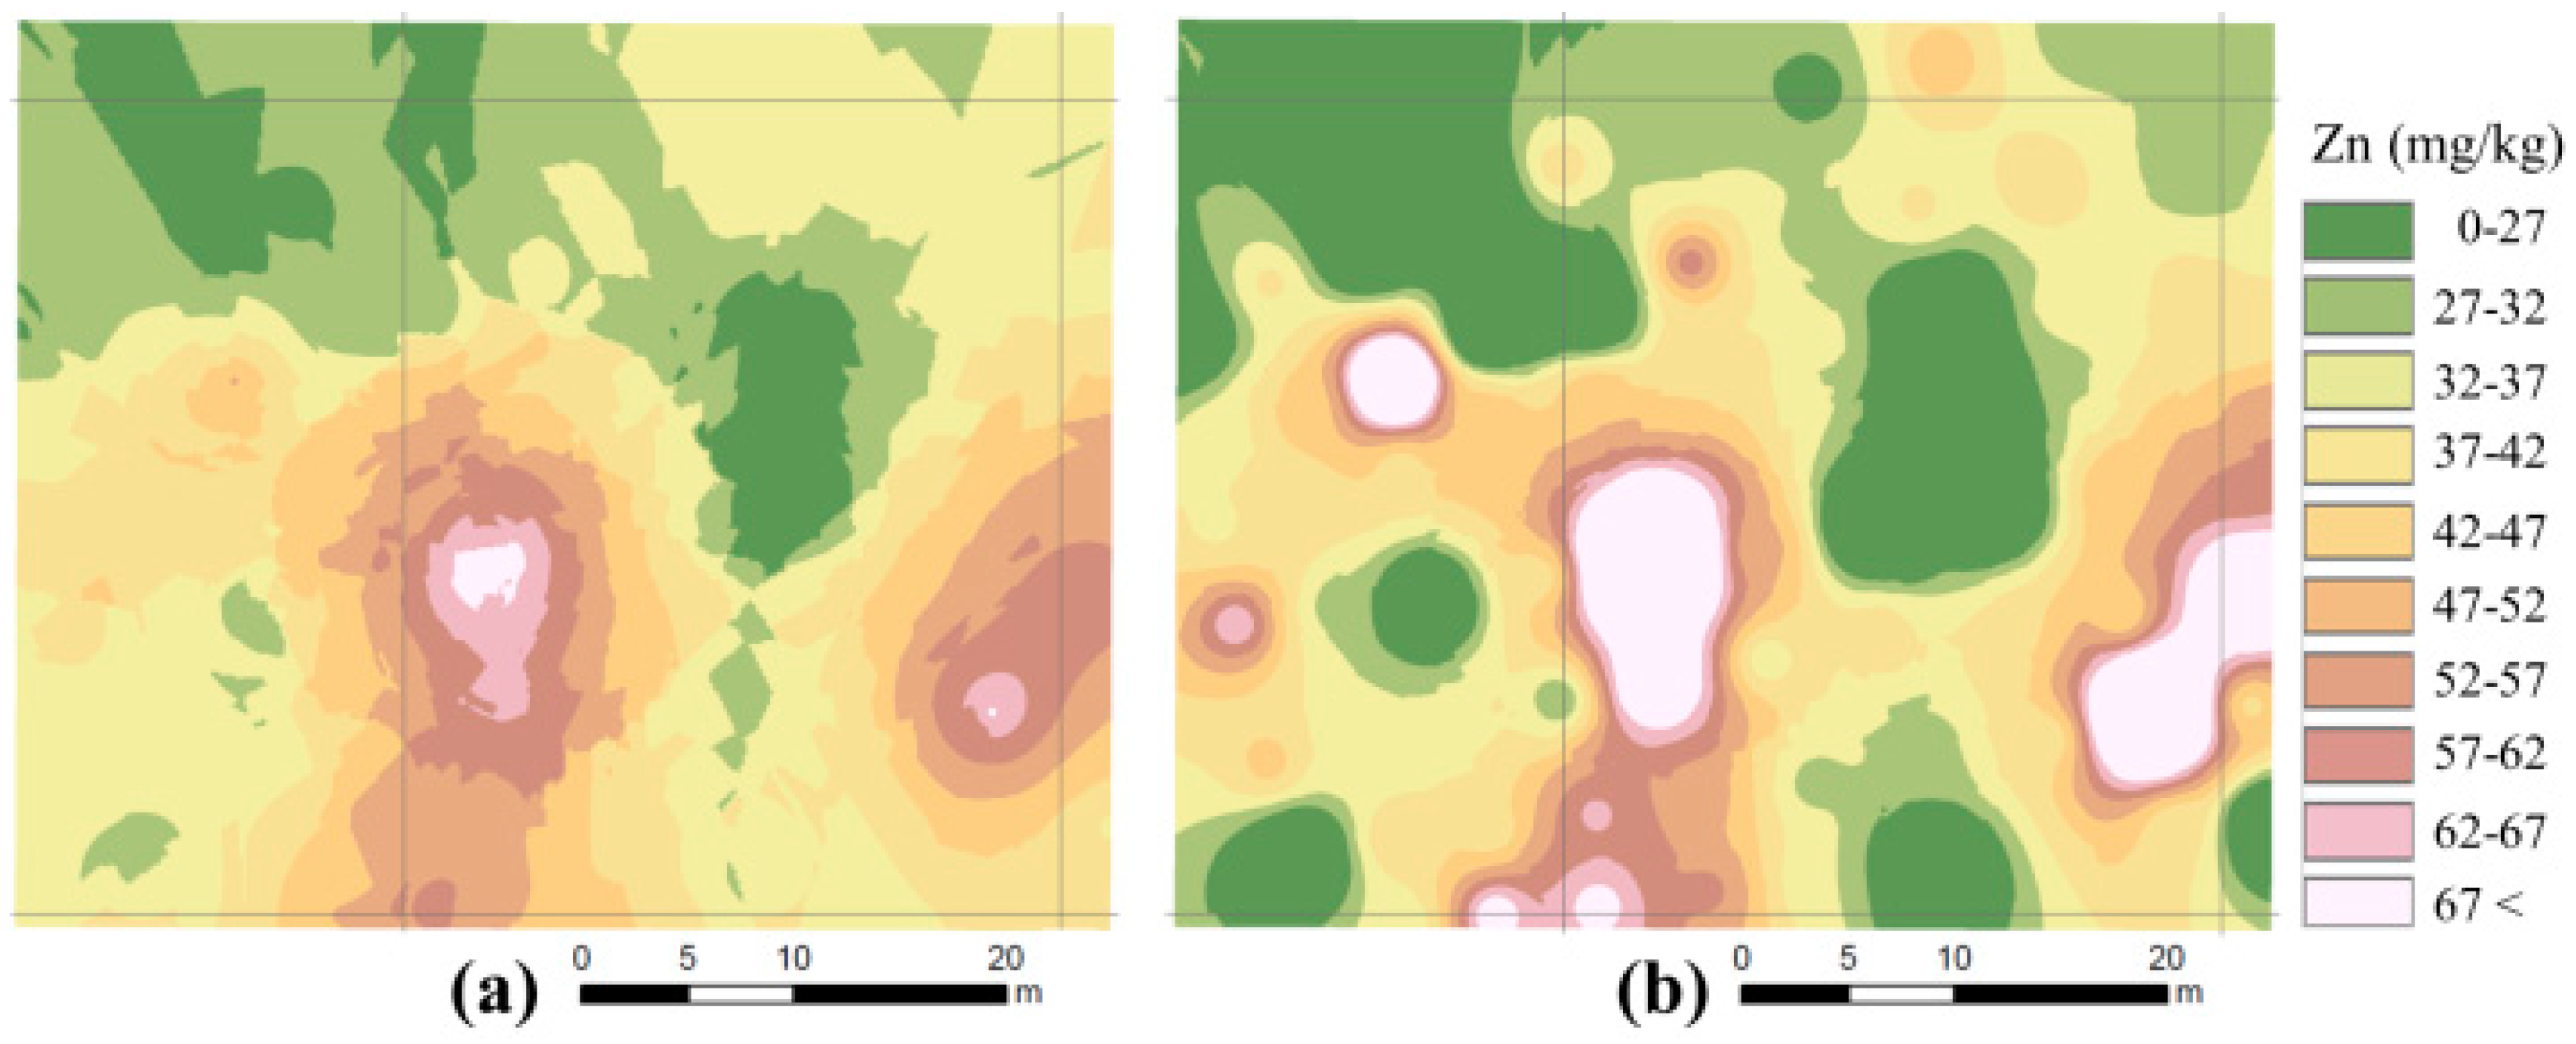
The best method of determining the spatial distribution of heavy metals is to sample as much of the target area as possible. It would be best to use a high-precision instrument, such as an inductively coupled plasma atomic emission spectroscopy (ICP-AES). ICP-AES instruments are known to have a high accuracy in chemical element analysis [16,17]. Therefore, it has been used to analyze PTEs in soils and in spatial distribution analysis combined with GIS [18,19,20]. However, it is difficult to analyze many samples because ICP-AES is relatively time-consuming and costly, due to the complexity of the preprocessing process. Therefore, geostatistical spatial interpolation, using the data of PXRF analysis, was used to create a grid-based contamination map in this study. Interpolation is a method of predicting unknown values from limited data, and excellent results can be obtained when large amounts of data are used. However, due to the limited availability of such data, various geostatistical interpolation methods have been developed to obtain optimal prediction results.
In this study, kriging, a common interpolation method used in geostatistics, was used to predict the Pb and Zn concentrations in beach sand from the target area. Kriging is a geostatistical technique that estimates values at unknown locations by considering both the distance and degree of variation between known data points.
z * = i = 1 N λ i z i
In Equation (1), z * denotes the kriging prediction result for an unknown point, and z i denotes a known value obtained from sampling. λ i corresponds to the weight of each data point for the unknown value, and N is the total amount of data used in the kriging prediction, i.e., the number of sampled datapoints. Kriging is divided into several methods based on the method used to determine the weight and ordinary kriging was used in this study, which is the most commonly used geostatistical estimator, and has been widely applied in the fields of soil pollution [21,22] and mineral resource exploration [23,24]. In this method, the equation is not biased when estimating unknown values and minimizes error variance. The conditions for ensuring that the equation is not biased are as follows:
b z * = E ( z ) E ( z * ) = E ( z ) E ( i = 1 N λ i z i )
where b z * denotes the bias of z * , and the sum of the weights must be equal to 1, according to the above equation. Therefore, the condition that the kriging estimation equation is unbiased can be expressed as the following equation:
1 i = 1 N λ i z i = 0
In this study, we also utilized IDW for a comparison with the results from the kriging analysis. The values assigned to unknown points were calculated using a weighted average of the values available at the known points. In IDW, the inverse of the distance to each known point is assigned as the weights, as follows:
z * = i = 1 N w i z i i = 1 N w i ,   w i = 1 d ( x ,   x i ) p
where x denotes an interpolated point, x i is an interpolating (known) point, d is the distance from the known point x i to unknown point x , N is the total number of known points, and p is a power parameter. The p -value used in this study was 2. IDW is simple and can produce stable results from a small dataset. However, the result is greatly affected when the predicted point is located near the sample data.

3. Results

The PXRF analysis results for the Pb and Zn concentrations are shown in Table 1. The Pb data were positively skewed, as shown in the histogram presented in Figure 2a. Pb was not detected in 49 of the 68 samples. According to the chemical analysis of the beach sand in Korea [4], Pb in pure sand was estimated to be about 8.3 mg/kg, and the result was similar to 10.33 mg/kg in this study. The maximum value of the Pb concentration, 58 mg/kg, was well below 200 mg/kg, which is the value of the soil contamination warning standards. The Zn data were also positively skewed, as shown in Figure 2b. There are few cases of Zn analysis in beach sand, but the mean value of 39.79 mg/kg of this study was smaller than the mean value of soil in Korea (80 mg/kg) [25]. The maximum Zn concentration was 149 mg/kg, which was also lower than the value of 300 mg/kg stated in the soil contamination warning standards. In Korea, the criteria for soil contamination are defined [26] by dividing land use into three types. The beach sand is not specified in these types, but because it corresponds to a tourist spot, the most stringent standards were considered in this study. Compared to the soil contamination warning standards which require attention, the soil contamination countermeasure standards that require substantial response have higher values. It was confirmed that contamination is not a concern in this study area because the maximum value of each element was smaller than the warning standard of each element.
PXRF is known to be less accurate than ICP-AES, but the elemental analysis results of PXRF and ICP-AES were highly correlated. In addition, the content of element found by PXRF analysis was generally slightly higher than that of ICP-AES [22]. The purpose of this study was to evaluate the feasibility of using PXRF for the analysis of PTEs contamination distribution in beach sand, rather than analyzing the accurate pollution degree. Therefore, we used the results of PXRF directly, which is highly correlated with ICP-AES. The spatial locations of the PXRF Pb and Zn data are shown in Figure 3a,b, respectively. Pb was not detected in most of the samples, but relatively high values were distributed in the northwest and southeast regions of the target area, while Zn was mainly distributed in the southwest and southeast. However, high concentrations were found in some samples from the northwestern part of the target area.
Prior to the kriging analysis, variogram modeling was conducted to determine the spatial correlation of the Pb data (Figure 4). No significant spatial correlation was observed, because there were many samples in which Pb was not detected and the degree of contamination was not severe. Therefore, the influence of the nugget value was larger than that of the typical variogram. Several lag distance conditions were considered to examine the theoretical variogram, which fitted the overall pattern of an experimental variogram. An exponential model was selected as a fitting function for the theoretical variogram, and an isotropy model was selected as there was no distinct anisotropy in the data. The variogram modeling parameters of the nugget, sill, and range were set to 170, 50, and 20, respectively.
Figure 5a,b shows the Pb contamination maps obtained from the kriging and IDW analyses, respectively. Both analysis results exhibited a high overall Pb distribution in the southern region, and it can be confirmed that the southwestern region had a greater influence than it did when the distribution of the data was observed visually (Figure 2a). For the kriging analysis, the effect of high values was reduced by the smoothing effect, however, the bull’s eye effect could be observed for the IDW analysis, which was influenced by high values. For example, the kriging analysis presented a maximum value of 18.36, which was much lower than the maximum value of 58 for the measured data. However, the maximum value obtained by the IDW analysis was 53.86, which was similar to the maximum measured value. This was because the influence of the nugget value greatly affected the kriging analysis process [24,27]. It was difficult to determine which one was correct, but the spatial correlation of the data in the target area was not large, therefore, it is possible that the influence of the data itself in the IDW analysis were exaggerated.
Figure 6 shows the result of the variogram modeling for the Zn PXRF data and indicates that there was no significant spatial correlation among the Zn data. Therefore, the model for these data differs from the typical variogram form. An exponential and isotropic model was selected for the theoretical variogram. The parameters of the nugget, sill, and range for the generation of the Zn contamination map were set to 600, 200, and 13, respectively.
Unlike Pb, Zn was distributed throughout the target area (Figure 7). High values were mainly distributed in the south rather than the north, and this trend was similar to that of Pb. The predicted maximum value from the kriging analysis was 67.18, which indicated that the value was predicted smoothly, while the maximum value of the measured data was 149. The maximum value of the IDW analysis was 148.93, which was similar to the maximum measured value.

4. Conclusions

In this study, kriging and IDW analysis methods were employed to create contamination maps of Pb and Zn in the sands of a beach on the eastern coast of Korea. We used a PXRF instrument to conduct elemental analysis as it can obtain data relatively cheaply and quickly. The spatial interpolation analysis confirmed that both Pb and Zn are mainly distributed in the south. The reason for this is unclear, but it may be because some of the replenishing sand supplied to prevent the erosion of sandy beaches could contain some heavy metals.
The maximum value of Pb from the PXRF measurement was 58 mg/kg, and that of Zn was 149 mg/kg. The kriging analysis results were predicted to be considerably lower than the measured values. This is the result of the smoothing effect of kriging, caused by the nugget effect and may be because the spatial correlation of the pollution in the target area is low. However, in the case of IDW, the effect of the data itself was remarkable. Kriging is the most commonly used geostatistical technique for contamination mapping, but the preservation of original data may be difficult if there is a lack of data or a weak spatial correlation. Therefore, it is necessary to conduct a complex analysis using other methods, such as IDW.
As a result of the PXRF and the interpolation analyses, beach sands in the target area were presumed not to be significantly affected by pollution. Pb, which has a higher risk, was not detected in most samples. Zn was detected in more samples, but their maximum Zn values did not exceed the soil contamination warning standards.
The PXRF used for conducting the elemental analysis in this study can be used in conjunction with geostatistical methods, such as kriging and IDW, to determine the distribution of heavy metal contamination in sandy beaches. The results of this study indicate that heavy metal pollution in the sandy beaches on the eastern coast of Korea is not serious. However, there is a possibility that the sand is contaminated. If contamination of the beach sand is more serious, additional sampling and more precise chemical analysis such as ICP analysis are needed. A variety of spatial analysis techniques can be applied to identify areas where further investigation is required. Therefore, the proposed method will be a countermeasure to rapidly address the contamination of beach sands.

Author Contributions

Y.C. conceived and designed the experiments; S.-M.K. performed the experiments and analyzed the data; Y.C. contributed the reagents/materials/analysis tools; S.-M.K. and Y.C. wrote the paper.

Funding

This work was supported by Basic Science Research Program through the National Research Foundation of Korea (NRF) funded by the Ministry of Education (2018R1D1A1A09083947).

Conflicts of Interest

The authors declare no conflict of interest.

References

  1. Di Lauro, A.; Fernex, F.; Fierro, G.; Ferrand, J.L.; Pupin, J.P.; Gasparro, J. Geochemical approach to the sedimentary evolution of the Bay of Nice (NW Mediterranean sea). Cont. Shelf Res. 2004, 24, 223–239. [Google Scholar] [CrossRef]
  2. Pezzuto, P.R.; Resgalla, C., Jr.; Abreu, J.G.N.; Menezes, J.T. Environmental impacts of the nourishment of Balneário Camboriú beach, SC, Brazil. J. Coast. Res. 2006, SI39, 863–868. [Google Scholar]
  3. Petroleum Management Service. Available online: http://www.joongboo.com/news/articleView.html?idxno=1176307 (accessed on 15 May 2017).
  4. Park, D.; Choi, H.; Yoon, I.; Kim, Y.; Lee, K.; Choi, C.; Park, J. Heavy metal survey of white sandy beaches in east coast beach. J. GBIHE 2016, 29, 317–323. [Google Scholar]
  5. Jensen, J.R.; Narumalani, S.; Weatherbee, O.; Murday, M.; Sexton, W.J.; Green, C.J. Coastal environmental sensitivity mapping for oil spills in the United Arab Emirates using remote sensing and GIS technology. Geocarto Int. 1993, 8, 5–13. [Google Scholar] [CrossRef]
  6. Nobi, E.P.; Dilipan, E.; Thangaradjou, T.; Sivakumar, K.; Kannan, L. Geochemical and geo-statistical assessment of heavy metal concentration in the sediments of different coastal ecosystems of Andaman Islands, India. Estuar. Coast Shelf Sci. 2010, 87, 253–264. [Google Scholar] [CrossRef]
  7. Ip, C.C.; Li, X.D.; Zhang, G.; Wai, O.W.; Li, Y.S. Trace metal distribution in sediments of the Pearl River Estuary and the surrounding coastal area, South China. Environ. Pollut. 2007, 147, 311–323. [Google Scholar] [CrossRef] [PubMed]
  8. Higueras, P.; Oyarzun, R.; Iraizoz, J.M.; Lorenzo, S.; Esbri, J.M.; Martinez-Coronado, A. Low-cost geochemical surveys for environmental studies in developing countries: Testing a field portable XRF instrument under quasi-realistic conditions. J. Geochem. Explor. 2012, 113, 3–12. [Google Scholar] [CrossRef]
  9. Kalnicky, D.J.; Singhvi, R. Field portable XRF analysis of environmental samples. J. Hazard. Mater. 2001, 83, 93–122. [Google Scholar] [CrossRef]
  10. Lee, H.; Choi, Y. A Study on the soil contamination maps using the handheld XRF and GIS in abandoned mining areas. J. Korean Assoc. Geogr. Inf. Stud. 2014, 17, 195–206. [Google Scholar] [CrossRef]
  11. Hu, Y.S. Disappearing sandy beaches on the Eastern Coast. J. Korean Soc. Civil. Eng. 2017, 65, 36–37. [Google Scholar]
  12. Tolner, M.; Vaszita, E.; Gruiz, K. On-Site Screening and Monitoring of Pollution by a Field-Portable X-Ray Fluorescence Measuring Device. In Proceedings of the Consoil 2010 Conference, Salzburg, Austria, 22–24 September 2010. [Google Scholar]
  13. Kim, S.M.; Choi, Y. Assessing statistically significant heavy-metal concentrations in abandoned mine areas via Hot Spot Analysis of portable XRF data. Int. J. Environ. Res. Public Health 2017, 14, 654. [Google Scholar] [CrossRef] [PubMed]
  14. Zhang, C.; Luo, L.; Xu, W.; Ledwith, V. Use of local Moran’s I and GIS to identify pollution hotspots of Pb in urban soils of Galway, Ireland. Sci. Total Environ. 2008, 398, 212–221. [Google Scholar] [CrossRef] [PubMed]
  15. Nriagu, J. Encyclopedia of Environmental Health; Elsevier: London, UK, 2011; pp. 1–80. [Google Scholar]
  16. Hou, X.; He, Y.; Jones, B.T. Recent advances in portable X-ray fluorescence spectrometry. Appl. Spectrosc. Rev. 2004, 39, 1–25. [Google Scholar] [CrossRef]
  17. Spiers, G.A.; Dudas, M.J.; Hodgins, L.W. Instrumental conditions and procedure for multielement analysis of soils and plant tissue by ICP-AES. Commun. Soil Sci. Plant. Anal. 1983, 14, 629–644. [Google Scholar] [CrossRef]
  18. Steiger, B.; Webster, R.; Schulin, R.; Lehmann, R. Mapping heavy metals in polluted soil by disjunctive kriging. Environ. Pollut. 1996, 94, 205–215. [Google Scholar] [CrossRef]
  19. Goovaerts, P. Geostatistics for Natural Resources Evaluation; Oxford University Press: New York, NY, USA, 1997. [Google Scholar]
  20. Li, X.; Lee, S.; Wong, S.; Shi, W.; Thornton, I. The study of metal contamination in urban soils of Hong Kong using a GIS-based approach. Environ. Pollut. 2004, 129, 113–124. [Google Scholar] [CrossRef] [PubMed]
  21. Suh, J.; Lee, H.; Choi, Y. A rapid, accurate, and efficient method to map heavy metal-contaminated soils of abandoned mine sites using converted portable XRF data and GIS. Int. J. Environ. Res. Public Health 2016, 13, 1191. [Google Scholar] [CrossRef]
  22. Lee, H.; Choi, Y.; Suh, J.; Lee, S.H. Mapping copper and lead concentrations at abandoned mine areas using element analysis data from ICP–AES and portable XRF instruments: A comparative study. Int. J. Environ. Res. Public Health 2016, 13, 384. [Google Scholar] [CrossRef]
  23. Yi, H.; Choi, Y.; Park, H.D. Application of multiple indicator Kriging for RMR value estimation in areas of new drift excavation during mine site redevelopment. Environ. Earth Sci. 2014, 71, 4379–4386. [Google Scholar] [CrossRef]
  24. Kim, S.M.; Choi, Y.; Park, H.D. New outlier top-cut method for mineral resource estimation via 3D hot spot analysis of Borehole data. Minerals 2018, 8, 348. [Google Scholar] [CrossRef]
  25. Ministry of Government Legislation. Soil Environment Conservation Act; Ministry of Government Legislation: Sejong, Korea, 2011.
  26. Ministry of Environment Republic of Korea. Environmental Statistics Yearbook; Ministry of Environment Republic of Korea: Sejong, Korea, 2003.
  27. Abzalov, M. Applied Mining Geology; Springer: Berlin, Germany, 2016. [Google Scholar]
Figure 1. Sampling points in the target area of the eastern coast.
Jmse 07 00042 g001
Figure 2. (a) Pb and (b) Zn concentration histograms of PXRF data.
Jmse 07 00042 g002
Figure 3. Spatial distributions of the concentrations of (a) Pb and (b) Zn analyzed by PXRF.
Jmse 07 00042 g003
Figure 4. Variogram modeling of the Pb content of the target area.
Jmse 07 00042 g004
Figure 5. Sand contamination map of Pb. (a) Kriging result and (b) inverse distance weighting (IDW) result.
Jmse 07 00042 g005
Figure 6. Variogram modeling of the Zn content of the target area.
Jmse 07 00042 g006
Figure 7. Sand contamination map of Zn. (a) Kriging result and (b) IDW result.
Jmse 07 00042 g007
Table 1. The portable X-ray fluorescence (PXRF) results of the Pb and Zn concentrations of each sample.
Sample IDPb (mg/kg)Zn (mg/kg)Sample IDPb (mg/kg)Zn (mg/kg)
1N.D.303544149
2N.D.2936N.D.48
3N.D.4637N.D.N.D.
4N.D.2438N.D.N.D.
5N.D.2739N.D.46
6N.D.40402452
7N.D.N.D.414789
8N.D.N.D.42N.D.42
9N.D.38432340
1028N.D.44N.D.42
11N.D.3445N.D.34
12N.D.44463180
135811347N.D.27
14N.D.N.D.482235
15N.D.N.D.493736
16285450N.D.44
17N.D.315130N.D.
18N.D.3852N.D.42
19N.D.4253N.D.38
20N.D.2854N.D.58
21N.D.3955N.D.50
22N.D.3456N.D.30
23N.D.N.D.57N.D.29
24N.D.34582138
25N.D.415926137
26294760N.D.41
27264661N.D.N.D.
28N.D.3962N.D.38
29N.D.386325N.D.
30303664N.D.32
312661652553
32N.D.3066N.D.65
33N.D.N.D.67N.D.67
34N.D.3968N.D.32
Limit of detection (mg/kg)515Mean (mg/kg)210.3339.79
Minimum (mg/kg)12124Standard deviation (mg/kg)14.6628.49
Maximum (mg/kg)58149Skewness1.491.53
1 Where the minimum value means the smallest value of the detected values. 2 The mean value is calculated assuming that the undetected value is half of the limit of detection value.

