1. Introduction
Petrogenic oil slicks in offshore areas can occur naturally through oil seeps or be caused by anthropogenic activities related to oil exploration, production and transportation. Depending on the amount and characteristics of the oil, as well as the sea state and drift direction, oil can reach coastal regions, increasing environmental damages.
During emergency response, the oil containment and recovery are the main cleanup operations with potential to minimize these impacts. The thickness of the oil slick has a significant effect on the recovery efficiency rates, being higher over the thicker layers [
1,
2].
Synthetic Aperture Radars (SAR) data are most frequently used by operational oil spill surveillance service providers to detect and monitor oil slicks on the sea surface. Within the microwave region of the electromagnetic spectrum, oil slicks and look-alikes dampen the sea surface roughness and are detected as low backscatter regions [
1,
2,
3,
4,
5,
6].
Previous research [
2,
5,
7] indicated a relationship between the oil slick thickness and the damping effect on the sea surface roughness. Thicker layers cause more damping of the capillary and gravity-capillary waves, and hence appear darker than thinner layers of oil in SAR imagery.
The potential of the polarimetric SAR (PolSAR) data in full, dual, and compact polarization modes was indicated to distinguish petrogenic from biogenic oil slicks and other look-alikes in some circumstances [
8,
9,
10]. However, methodologies able to characterize oil slicks by extracting additional information regarding the thickness variations within the slicks have been less explored until recently [
2,
5,
11,
12,
13,
14].
PolSAR data has the potential to detect a wide range of scattering mechanisms that may be related to oil slick thickness, weathering, as well as different concentrations of water in oil-mixtures and emulsions [
2,
5,
8,
12,
13]. However, there is evidence that low noise airborne SAR instruments are also able to characterize oil slicks with single polarization SAR data. In these cases, the most sensitivity was obtained transmitting and receiving the electromagnetic pulse in the vertical direction (VV). The VV damping ratio, a contrast measure, or the VV intensity [
2,
11,
13] can also be used.
The potential of SAR to detect and characterize an oil slick varies depending on several factors [
4,
6,
8,
15] such as: (
i) physical characteristics of oil and oil layer: the denser, more viscous and thicker the oil, the higher the damping effect; (
ii) Wind intensity: greater contrast within the limits considered ideal for oil detection, between 3 and 10 m/s; (
iii) Currents intensity and wave height: the larger, the less the contrast of the slicks with the ocean; (
iv) Radar frequency: the higher, the greater the interference from adverse atmospheric conditions, but also the greater the sensitivity to ocean capillary; (
v) Polarization: the greater the number of polarimetric channels available, the greater potential to detect different scattering mechanisms; (
vi) Incidence angle: greater contrast of the slicks in the near range within Bragg scattering limits, and; (
vii) Signal to Noise Ratio (SNR): a higher SNR increases the potential of each polarization channel to detect oil slicks at sea surface.
The numerous aerial and orbital platforms available, acquiring PolSAR and SAR data with different configurations and formats (single look complex, intensity or amplitude) increase this challenge, and there is a need to understand which is the better format and statistical model to improve oil slick detection and characterization.
Considering all aforementioned factors, the better configuration to detect and characterize an oil slick may be different according to different acquisition scenarios. From the operational point of view, the use of only one polarization channel simplifies data acquisition, the statistical modeling needed, and reduces the complexity and the time required for processing. However, in some cases the polarimetric data may extract key information to characterize the oil slicks.
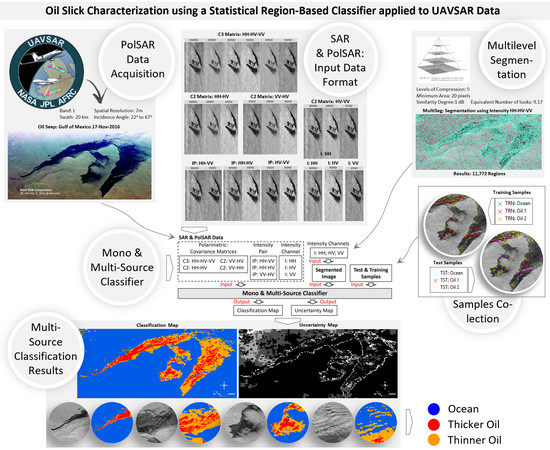
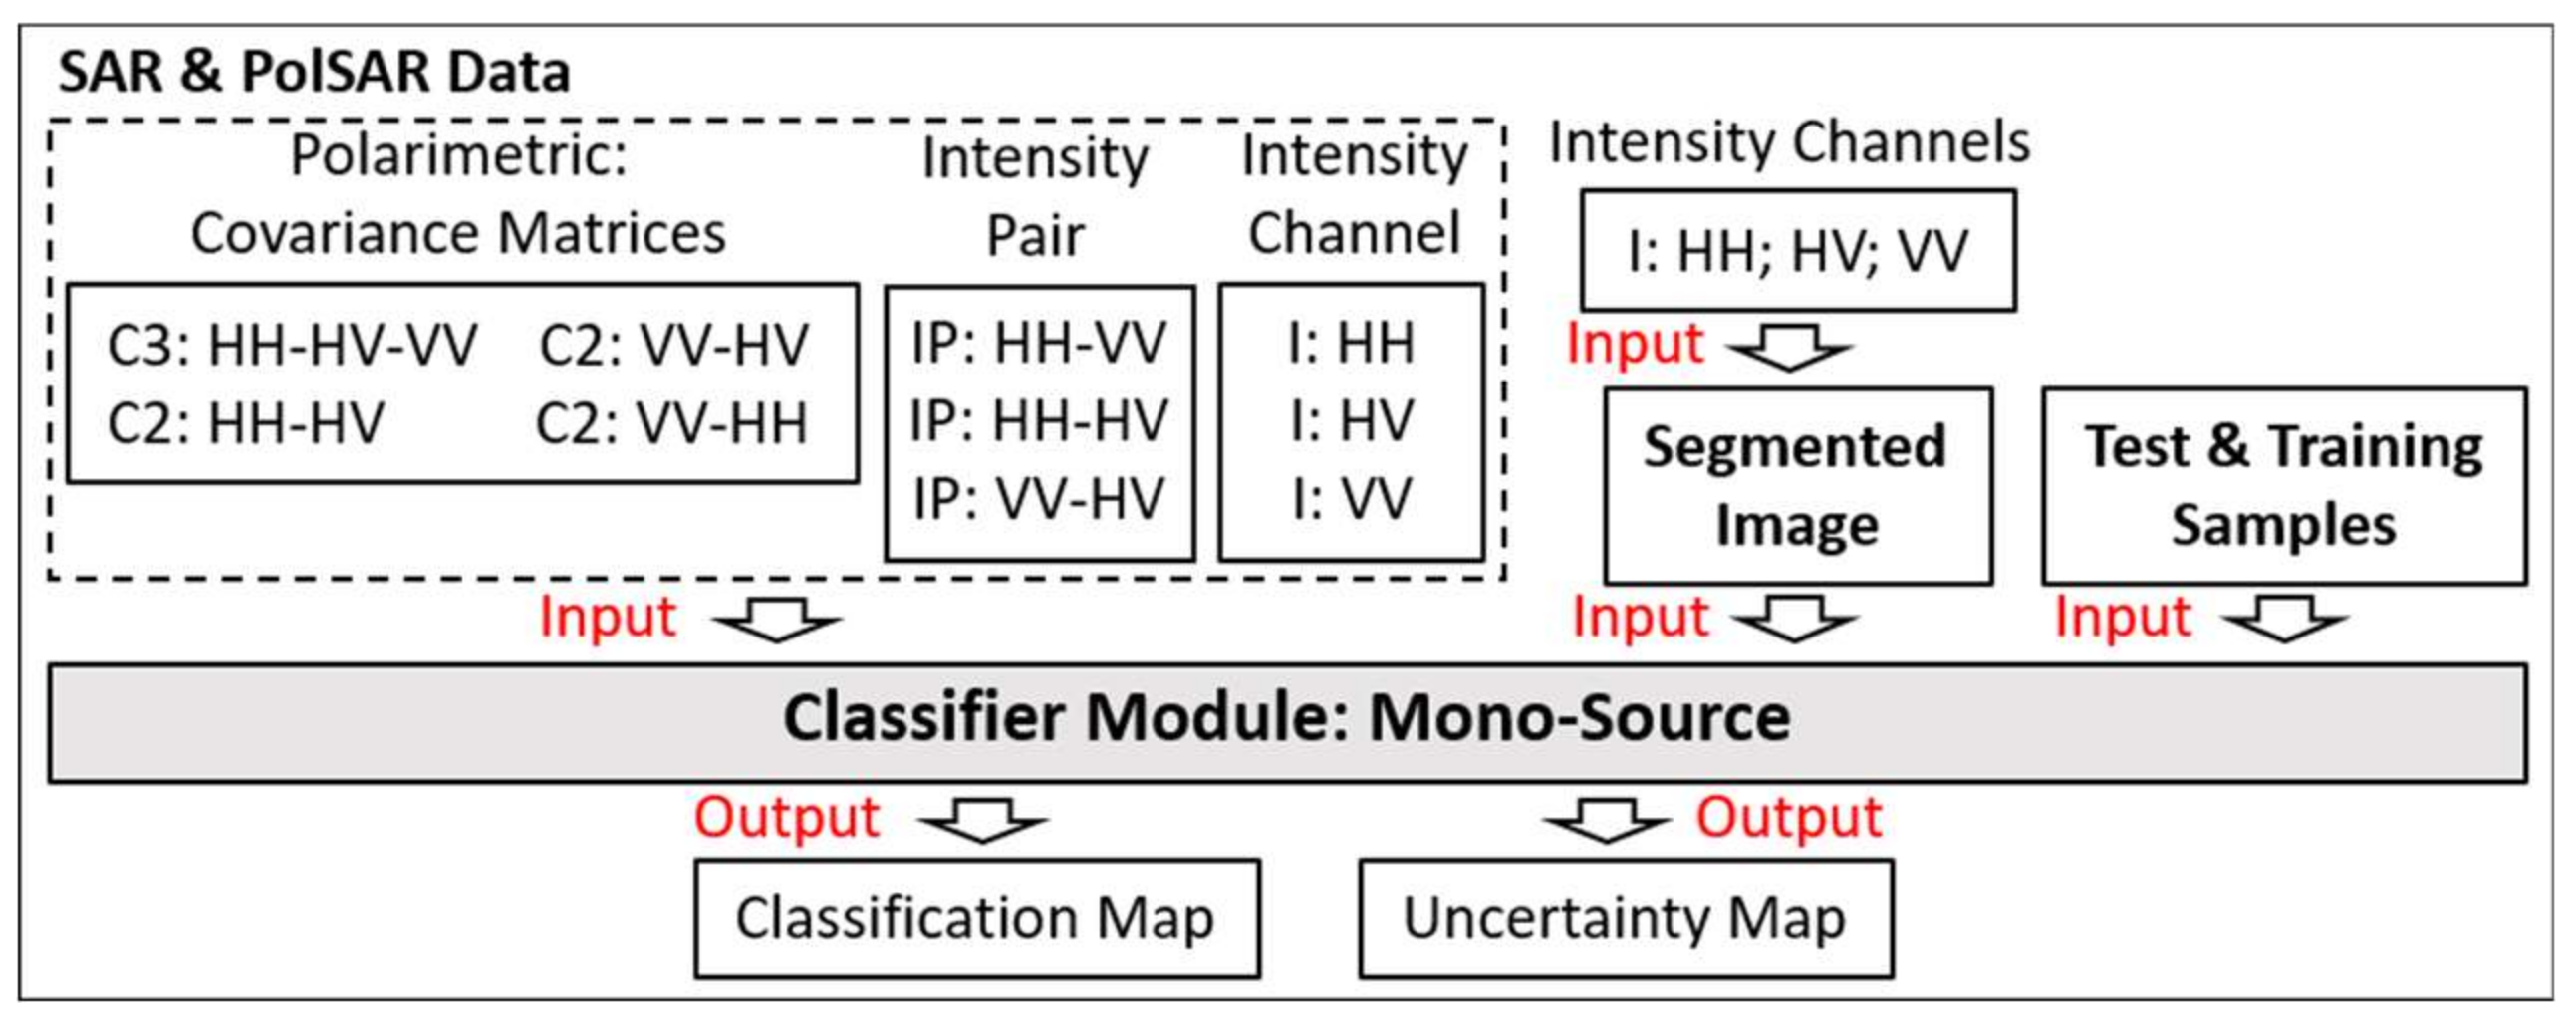
In this context, testing a Multi-Source Image Processing System developed to integrate SAR & PolSAR data of different formats and with different statistical properties, aiming to discriminate and characterize oil slicks, represents strategical research. This Multi-Source system, based on information theory and using stochastic distances to perform the region-based classification process, was previously developed [
16,
17,
18]. The supervised classifier uses stochastic distances between different statistical distributions (
fx) and hypothesis tests to classify the regions and associate confidence levels to the classification results. The multi-source approach permits the integration of SAR (intensity and amplitude), PolSAR (single look complex) and optical data considering proper statistical modelling for each type of data, and processing single or multi-source data in a customized computational system.
Previous research using satellite acquired PolSAR data [
5,
19] has shown the potential of this system, not to characterize, but rather to discriminate oil slicks considering different oil types. In that research, it is shown that the polarimetric information provided improvements that are statistically significant in terms of accuracy. It also shows that the classification performance is dependent on the input data format and, consequently, on the statistical modeling used to represent the diversity of formats properly.
The objective of the work reported here is to evaluate the potential of the Multi-Source Image Processing System to characterize thickness variations within the oil slick, indicating the better format and statistical modeling for this application, considering as a study case an oil seep detected by NASA’s UAVSAR, with components ranging from thin sheen through thick emulsions [
2]. As the system is being tested for the first time with this focus, a complete scientific investigation using the amount of available data and combining all formats is recommended.
To accomplish this investigation, the polarized information in intensity format as well as all polarimetric complex information contained in the PolSAR data was considered by using the full and dual-polarization (dual-pol) covariance matrices. The integration of the uncertainty levels in the interpretation process provided additional information to more reliably indicate the regions of likely thicker oil within the slick.
The fast processing of multiple products, all of them integrated to generate operational maps to inform the position, area and likely thicker oil layers, constitutes an important method to be used by the contingency team during the clean-up operations. This specific demand for spatial intelligence during oil spill emergencies emphasizes the importance of developing and testing robust image processing systems, as proposed in this research. As indicated by reference [
2], once validated, a system like that could be implemented on an aircraft and incorporated into an on-board processor (OBP) to be used operationally, transmitting all information in near real time (NRT) to the incident command system (ICS).
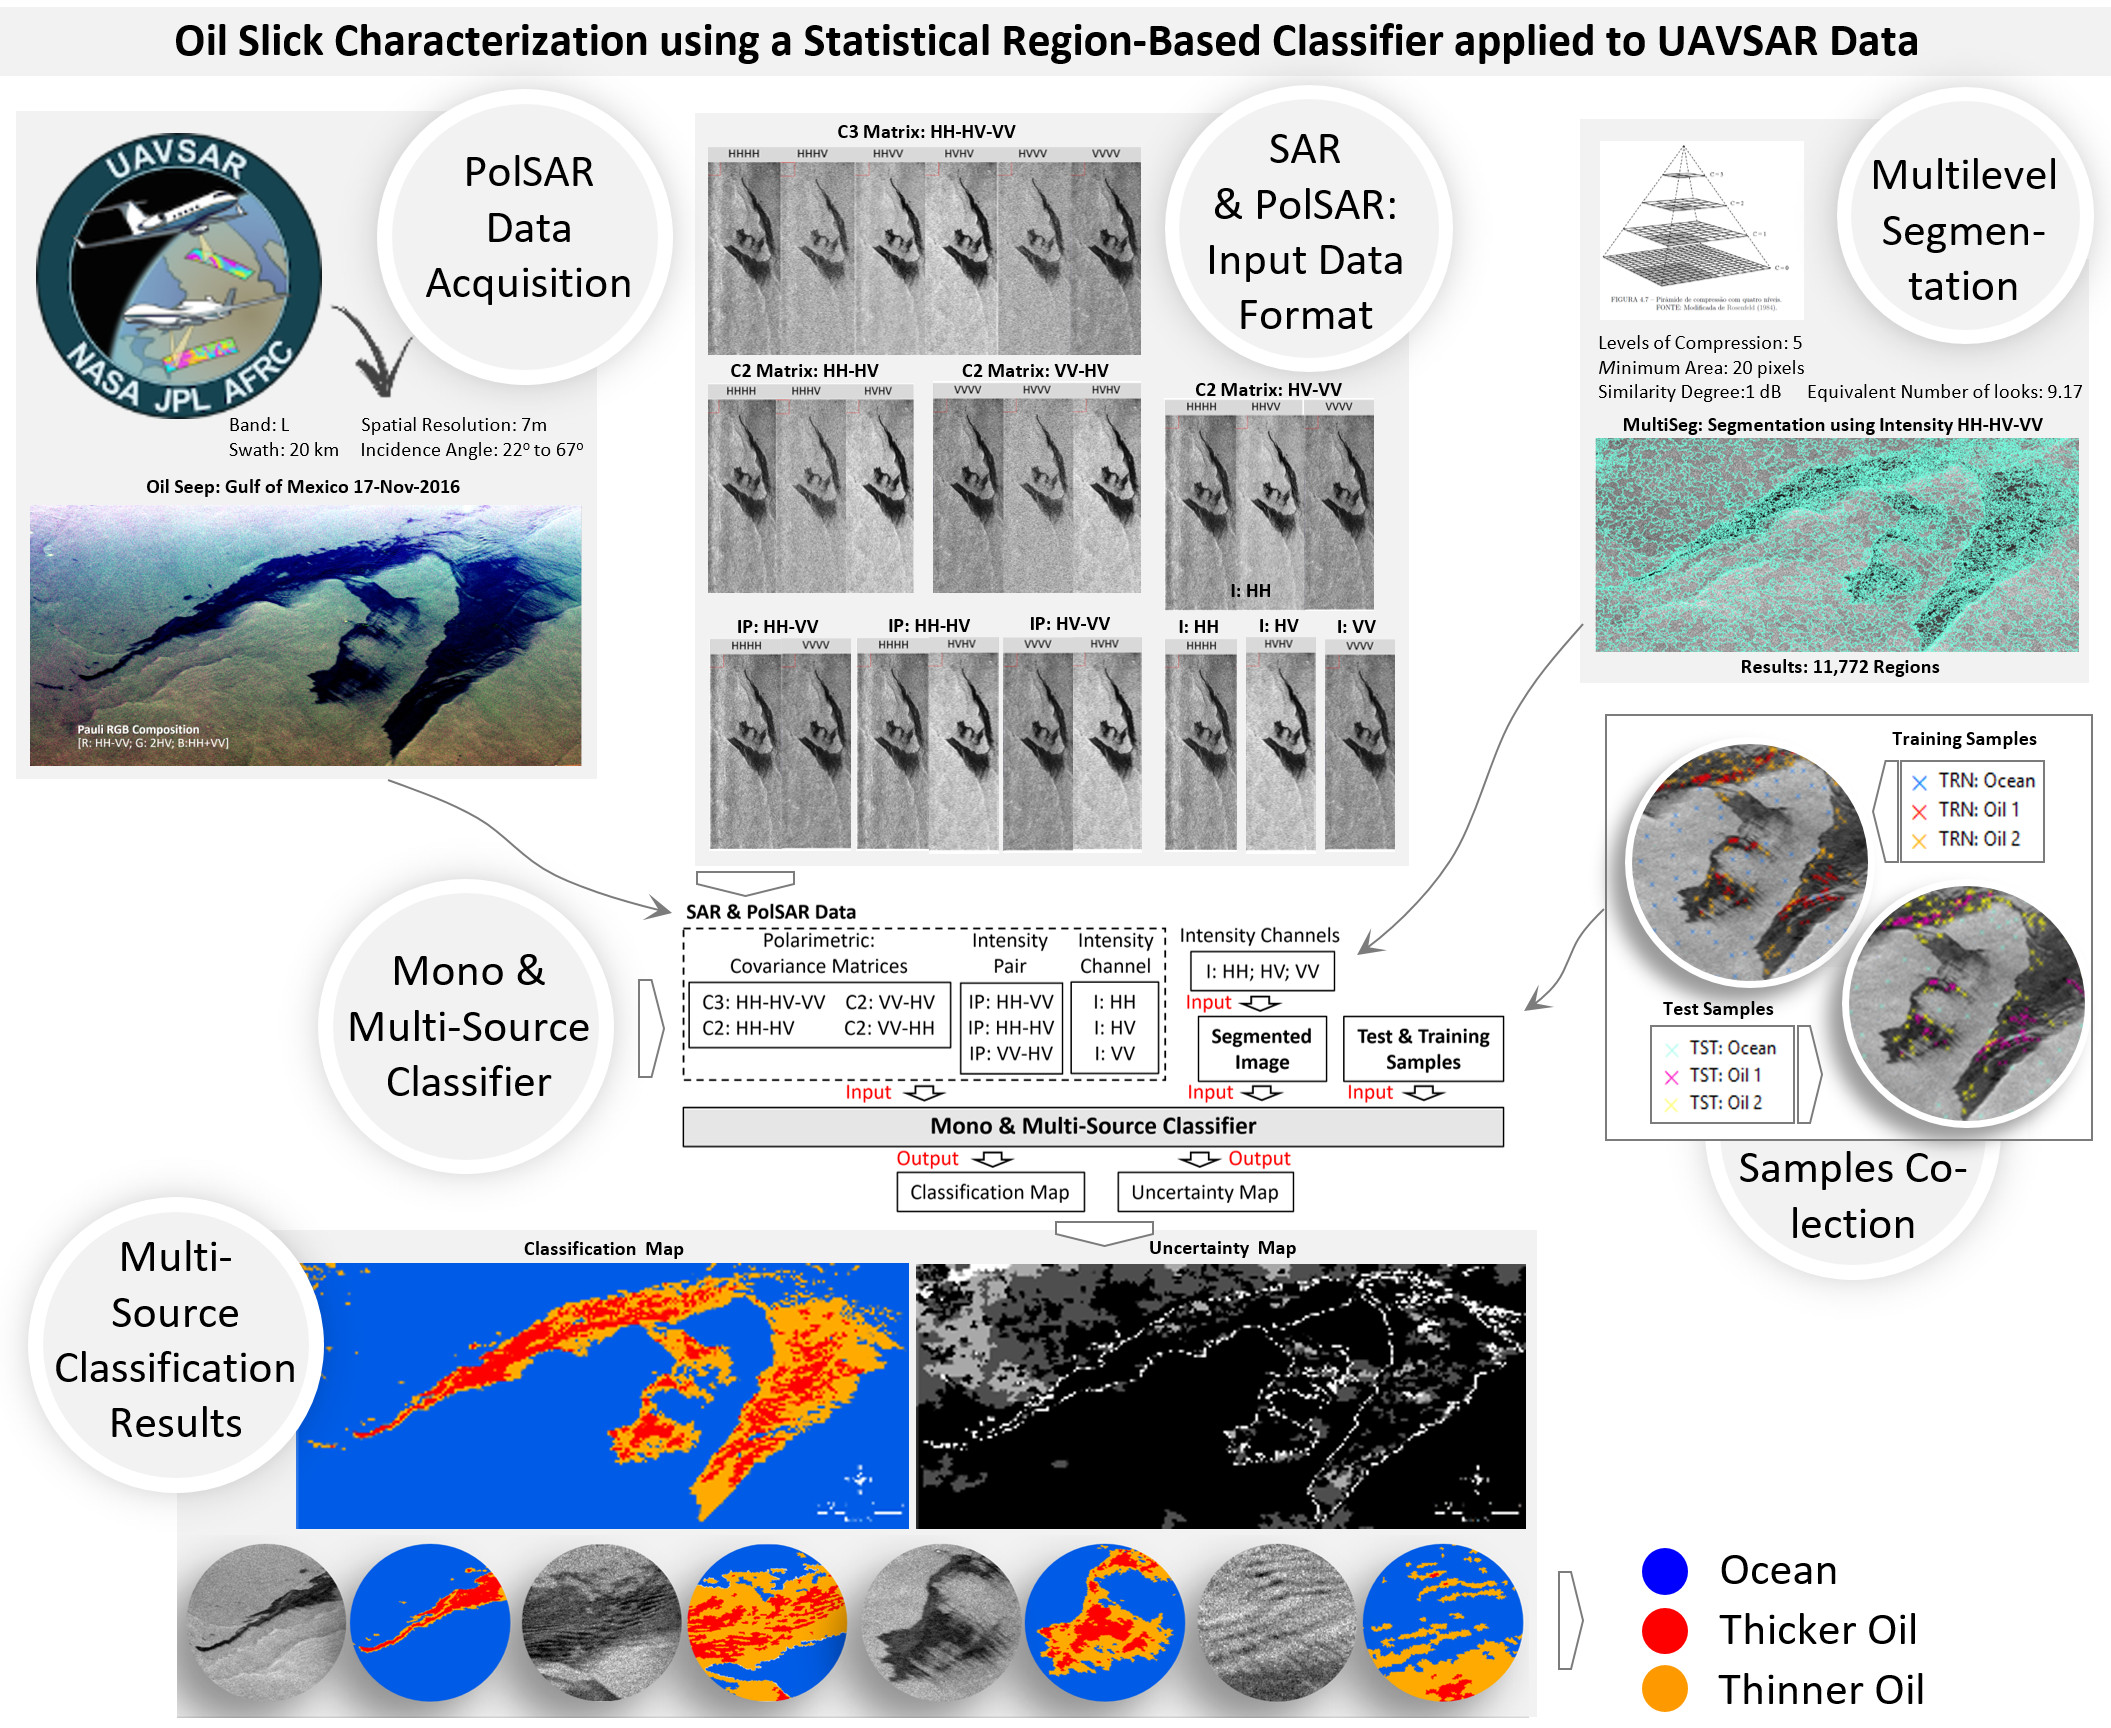
2. Statistical Modeling Classification Based on Stochastic Distances
The statistical classifiers require proper models to represent the statistical nature of the pixels (or image regions). Depending on the sensor used (optical, microwave, etc.), the acquired data format (polarimetric, intensity, amplitude, etc.) and the scene backscattering characteristics, different probability density functions (
fx) are needed to represent and process the data properly [
20].
Research to develop and test computational systems able to process this diversity of data is essential, especially considering the wide range of remote sensors available operating in multi-frequency and multi-resolution. Optimized systems to integrate different data sources, as well as to deliver operational reports in near real time, are needed to plan and implement response actions during emergencies involving oil spills.
In this way, a Multi-Source Image Processing System able to utilize this data diversity and complexity has been developed and tested by the Brazilian Institute for Space Research (INPE) [
16,
17,
18] in different real applications, including oil slick detection. The Multi-Source statistical region-based classifier performs a supervised classification using stochastic distances (
d) and statistical tests (
S), considering proper statistical modeling for different data formats [
16,
17,
18]. Its architecture (
Figure 1) is designed in four processing modules according to the statistical distribution (
fx) of the input data:
Polarimetric: consider as input full or dual-pol covariance matrices in a complex format, assuming that the data comes from a Scaled Complex Wishart distribution (fx = SCW);
Intensity Pair: consider as input a pair of SAR images in intensity format, assuming as statistical distribution the multi-look Intensity Pair (fx = IP);
Intensity Single-channel: consider as input each channel individually in intensity format, assuming the Gamma distribution for the data (fx = G);
Multivariate Amplitude: consider as input optical and/or SAR data in amplitude format, assuming the Multivariate Gaussian (fx = MG) as statistical distribution.
This is an innovative approach that permits us to process and integrate different data types in a single computational system, considering two approaches: (i) Mono-Source: process each data type independently, and; (ii) Multi-Source: integrate the mono-source classifications searching for the best classification performance.
Figure 1 illustrates the architecture of the Multi-Source Image Processing System, indicating the proper statistical modeling for each data type and the stochastic distances available for each module. The type of mathematical solution used—analytical or numerical—was also indicated.
In order to understand the trade-off between each data type in capability to characterize an oil slick, a mono-source approach, with proper statistical modeling, was used to process three different types of SAR & PolSAR data, those being: (i) Polarimetric full & dual-pol; (ii) intensity pairs (Intensity Pair); and (iii) single-channel intensity (Intensity single-channel).
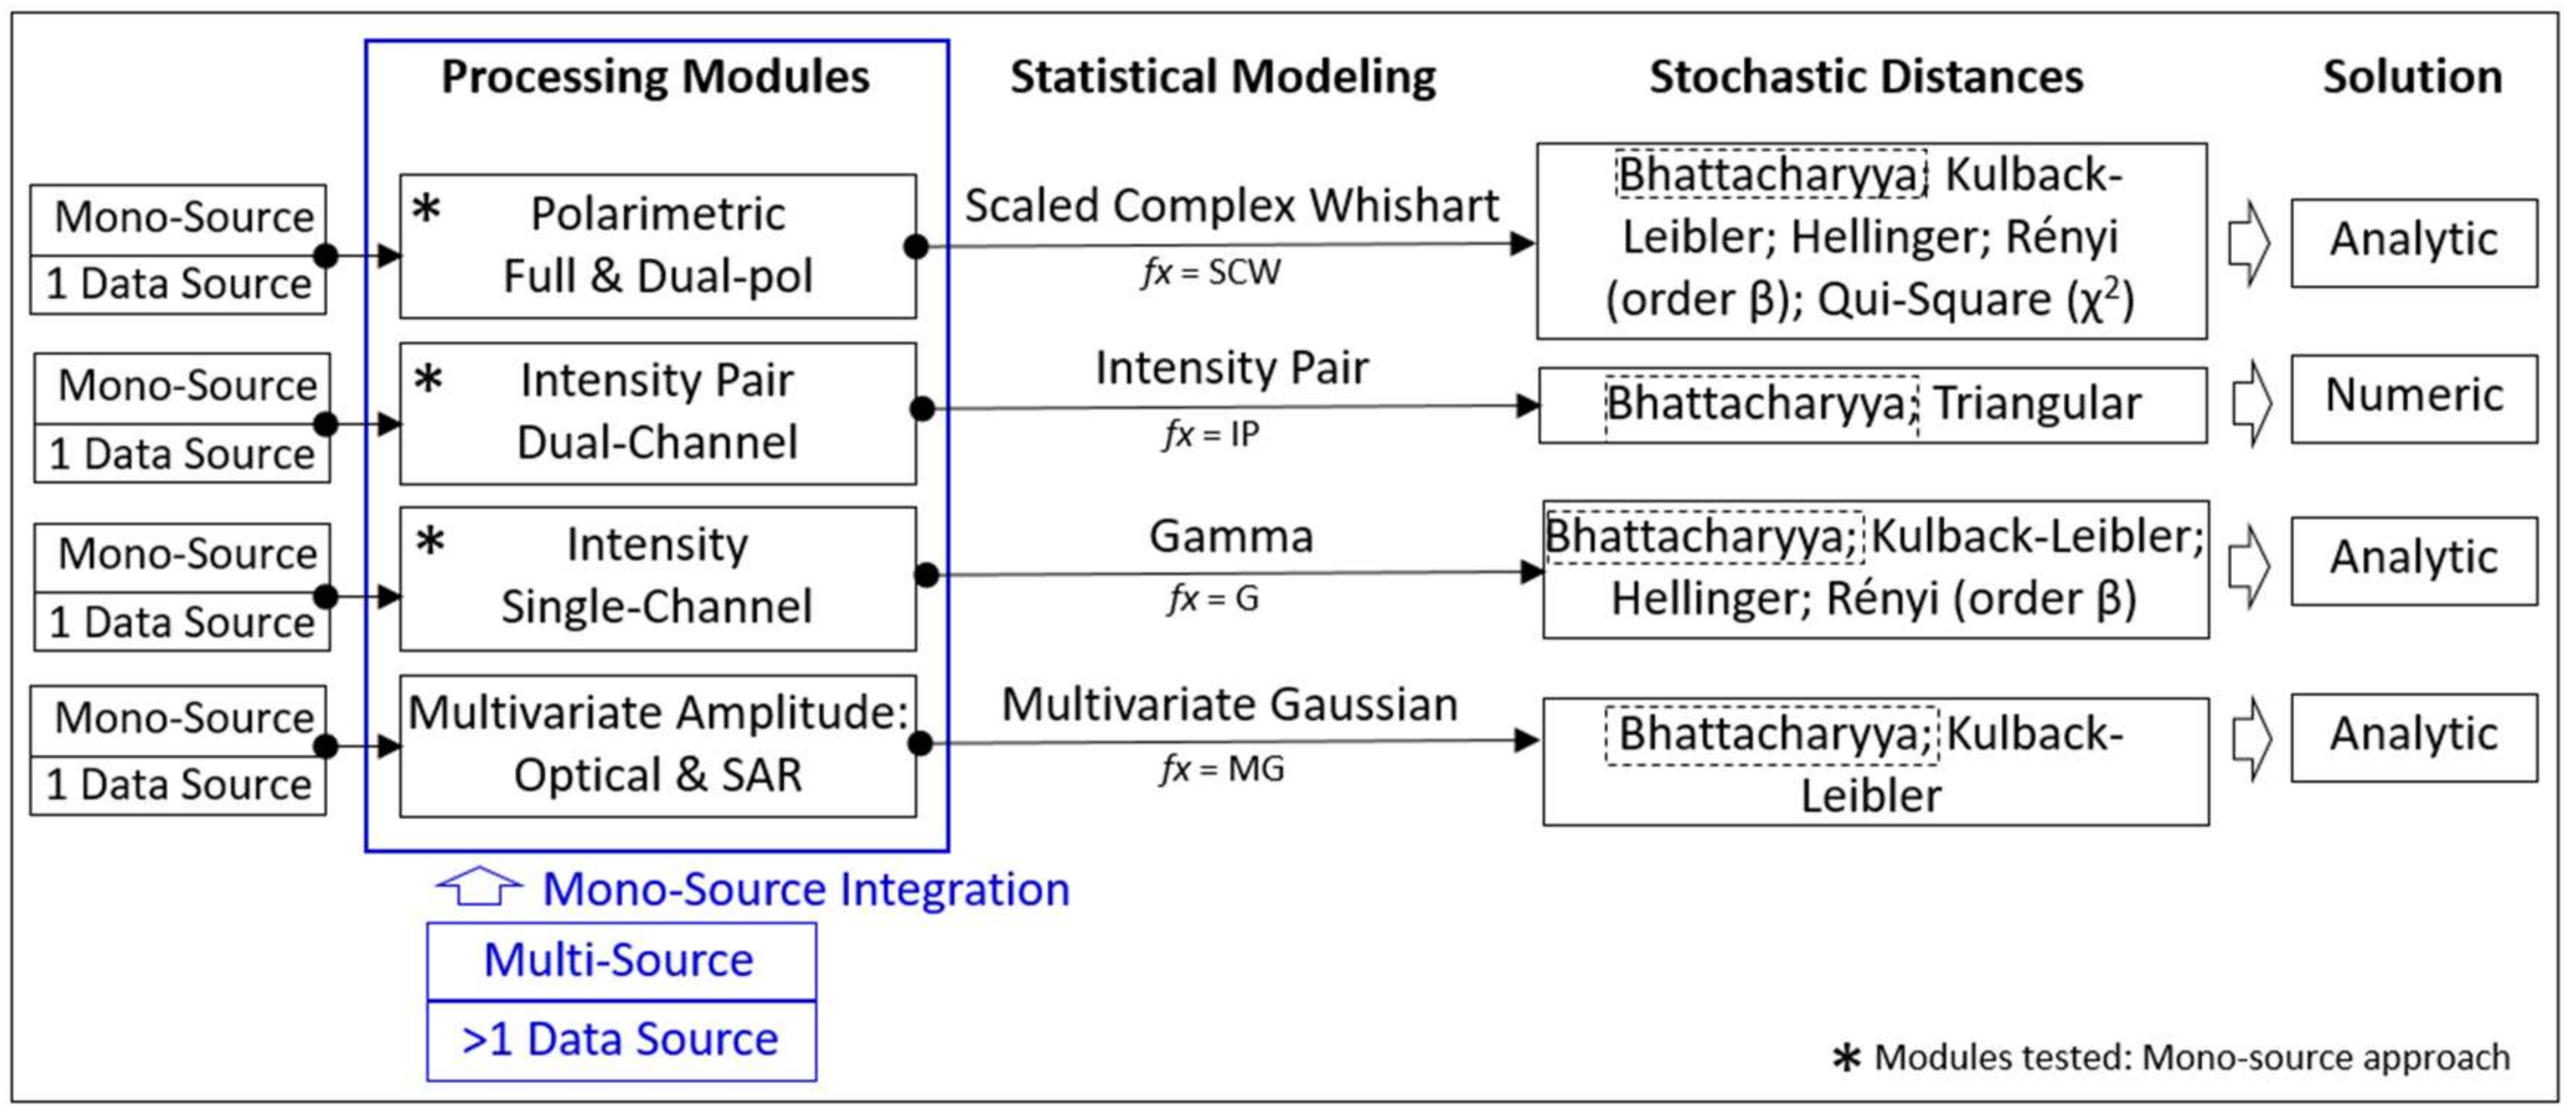
A region-based classification provides K disjoint segments, R1, … Rk; and a set of training samples defined for each class. The data (pixels) in the segment k are denoted by Zik, with k = 1, …, K and i = 1, …, Nk, where Nk is the number of pixels within the segment k.
It is important to highlight that
Zik is a matrix whereby the SAR data can be represented in complex, intensity or amplitude format assuming different statistical distributions (
fx). In this way, assuming that
Zik (
k = 1, …,
K) follows a
fx distribution with parameters
and
L (number of looks), the maximum likelihood (ML) estimator of
is:
The purpose of the classifier is to classify each of the
k segments into one of the
C classes, assuming that (
i) the training samples follows a
fx distribution with parameter
L and
, with
j = 1, …,
C; and (
ii) the ML estimator of
, based on samples of size
Mj, is denoted by
. This classification is performed calculating stochastic distances (
d) between different statistical distributions (
fx) associated to each region
Rk (
k = 1, …,
K) and to each training sample of class
Cj. Then, using these distances and the results given in references [
21,
22], a statistic
Skj is used to perform a statistical test to verify the hypothesis that
=
for all
k,
j (
k = 1, …,
K and
j = 1, …,
C).
At the end of the process, each segment
Rk is assigned to a class which presents: (
i) the lower distance (
d) between
and
, (
ii) the lower or equivalently statistical test (
Skj), and a higher associated
p-value
pkj. The Bhattacharyya stochastic distance (
dB) was used because it is available in all modules (
Figure 1), being the only option to compare the classifier potential combining all data formats and polarimetric channels.
For the Polarimetric module, the
dB between two SCW distributions (
dWB), one associated to segment
k and the other associated to the class
j, is given by [
21]:
For the Intensity Single-channel module, the
dB distance was derived between Gamma distributions (
dGB), being [
18]:
Under the conditions stated by [
11,
12], the hypothesis test
can be performed using the test statistics
Sfx defined by each stochastic distance. The equations developed for the statistical tests between SCW distributions (
SWB) and between the Gamma distributions (
SGB) are given in the Equations (4) and (5), following [
16,
18]:
The equations for the Intensity Pair module were defined by reference [
23], being the distance (
dIPB) and statistical test (
SIPB) derived from a Bivariate Gamma distribution extracted from the SCW distribution. However, the distance and the statistical test need an extensive and complex numerical solution, available in reference [
16].
The null hypothesis is rejected at α significance level if the probability
, where
represents a chi-square distribution with
ν degrees of freedom, where
ν is the number of parameters of the distribution. The classification based on a minimum test statistic consists in assigning the segment (
Rk) to the class
Cl if:
When a segment
Rk is assigned to the class
l, the
p-value (
pk,l) is calculated as:
It is a measure of certainty that the segment
k belongs to the class
l. At the end of the process, the classification and the uncertainty (1 −
pkl) maps are provided. To illustrate the region-based classification,
Figure 2 indicates the class assignment process considering only one segment as an example.
3. SAR & PolSAR Data Description and Methodology
During Hurricane Ivan in 2004 a persistent seep source developed following damage caused to production infrastructure in the Mississippi Canyon 20 area of the Gulf of Mexico. This study case used L-Band PolSAR data acquired over this region on 17 November 2016 by the NASA’s UAVSAR sensor. In this occasion, a large oil slick with thickness ranging from thin sheen through thick emulsion was detected [
2].
In this study, a Multi-source Image Processing System—able to process different data formats, with different statistical properties—was tested to characterize and extract regions with different oil thicknesses using both UAVSAR SAR & PolSAR data. The goal was to differentiate sheen from thicker layers, as well as indicate the better format and statistical modeling to do this.
The PolSAR data provides the amplitude and phase information, while the polarized SAR data only provides the amplitude of the backscattered signal. The electromagnetic pulse can be transmitted and received by the antenna in different directions, Vertical (V) or Horizontal (H), being: (
i) co-polarized—transmitting and receiving in one single direction (VV or HH), or; (
ii) cross-polarized – transmitted and received in orthogonal directions (HV) or (VH). Different combinations are possible, defining the SAR systems as: (
i) single: VV, HH or HV; (
ii) dual: HH-HV, HH-VV or VV-HV, and; (
iii) full (quad): HH-HV-VH-VV. The term ´polarimetric` is applied only when the amplitude and phase information are available. For monostatic antennas, HV is considered equivalent to VH, configuring a full polarimetric system with 3 bands HH-HV-VV. Details about different mathematical forms to represent SAR and PolSAR data including the scattering matrix, covariance matrix (C) and others can be found in reference [
24].
Standard full-polarimetric UAVSAR products in ground projected format (grd) contain the calibrated complex cross products HHHH, HVHV, VVVV, HHHV, HVHV and HVVV used to calculate the elements of the multi-looked covariance matrix (C). The PolSAR image was acquired with 20 km swath width, incidence angle 22° (near range) to 67° (far range), and 7 m spatial resolution after multilooking, and the intensity products were extracted from the main diagonal of the covariance matrix.
To perform the case study, three types of data were used as input. The Polarimetric module used as input the covariance matrices in a full-pol (C3: HH-HV-VV) and dual-pol (C2: HH-HV or HH-VV or VV-HV) format. The Intensity Pair module uses as input pairs of intensity images (IP) combining the polarized channels as indicated: HH-HV or HH-VV or VV-HV. The Intensity Single-channel module processes each channel individually using the intensity (I) format as input. The segmented image, the training and test samples are also needed as input to process the classification in all modules.
Figure 3 depicts the classification methodology, indicating the input and output data.
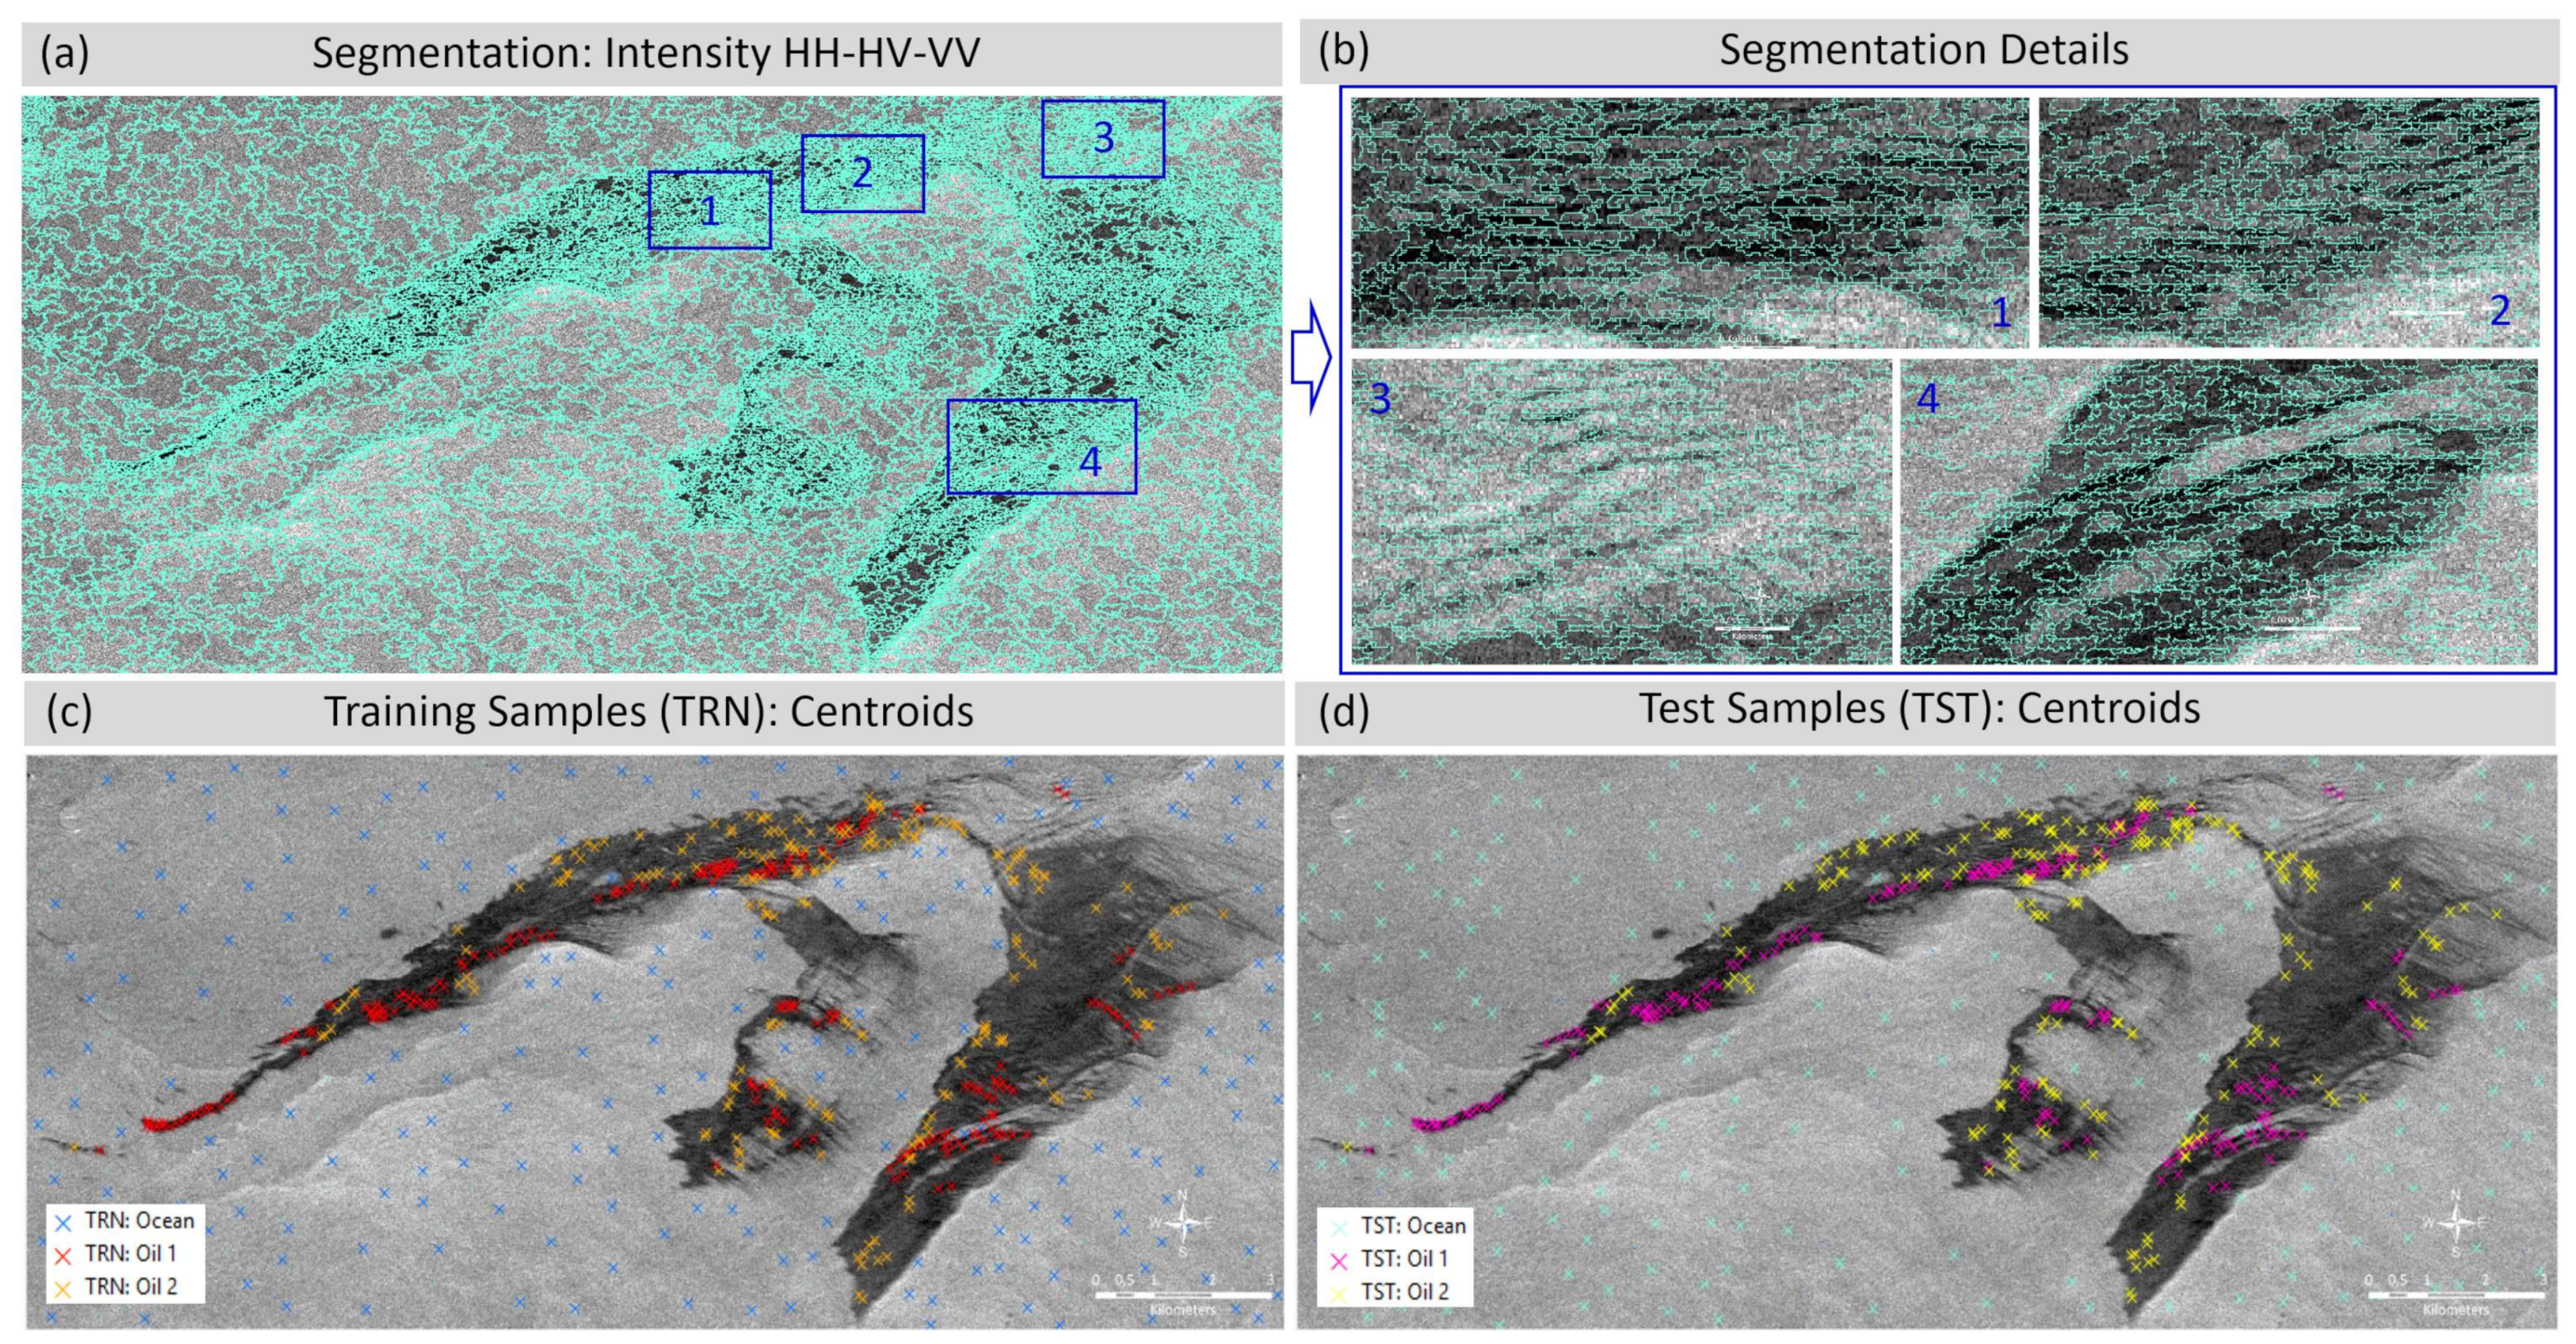
The segmented image (
Figure 4) was obtained applying the multi-level region-growing algorithm, MultiSeg [
25]. MultiSeg is a hierarchical segmentor which uses the information contained at the top level to segment the subsequent levels through a pyramidal compression, integrating region growing and clustering techniques, edge detection, minimum area threshold and homogeneity tests to split & merge pixels in segments. The cartoon model, used in this work, considers that the image is formed by homogeneous regions, being themselves clustered according to predefined parameters. The larger the similarity index, the greater the area of the generated segments. In this study case the following parameters were considered: (
i) 5 levels of compression; (
ii) minimum area of 20 pixels; (
iii) 1 dB of similarity degree, and (
iv) 9.17 equivalent number of looks.
The segmentation process was completely unsupervised and considered as input the three polarized channels HH-HV-VV in intensity format. The algorithm automatically recognized 11,772 representative segments (
Figure 4a), which delineated even the smaller dark regions (
Figure 4b) originated by the influence of the internal waves and currents. This result is relevant considering that without representative segments it is impossible reach a good classification accuracy.
Considering the aforementioned oil slick properties, three classes were defined, namely, (
i) Ocean, (
ii) Oil 1: representing the thicker layers (crude oil or emulsion), and (
iii) Oil 2: representing the thinner layers (sheen). The classes definition was reinforced by previous research which detected thickness variations within the same oil slick using the VV damping ratio [
2]. As described by reference [
2], the VV damping ratio is the contrast between the clean sea water vs. slicked water, using the VV channel in intensity format (VVclean/VV).
The samples collection considered that thicker layers cause more damping, appearing darker than thinner layers, as observed previously [
2,
7,
11,
12,
13]. Therefore, the training and test samples were collected manually, based on the interpreter’s experience, searching for darker areas to represent the thicker oil (class Oil 1) and the less dark areas to represent the thinner oil (class Oil 2). The ocean samples were collected over the brighter areas in the background.
Figure 4c,d illustrates the centroids position of the training (TRN) and test (TST) samples collected per class, being the total number of pixels collected per class: 1887 for Ocean-TRN, 1890 for Oil 1-TRN, 1886 for Oil 2-TRN, 1887 for Ocean-TST, 1890 for Oil 1-TST and 1886 for Oil 2-TST.
The class assignment process associates the class of the training sample to the analyzed segment, considering the lowest statistic and the highest p-value, all computed for each segment k (k = 1, …, 11,772) and each class Cj (j = 1, …, 3). The statistical reports, as well as the classification and uncertainty maps, are the classifier output. The validity of the mineral oil slick characterization was evaluated considering visual interpretation, statistical accuracy indexes and the statistical uncertainty levels.
It is important to note that the proposed methodology is designed to be applied when mineral oil slicks are confirmed in the field, determining a real emergency situation. In this context, the goal is to characterize the oil slicks and extract additional information such as the relative thickness variation within the slicks. The spatial location, the area of the slicks, as well as identifying the thickest layers are all extremely important data to support decision making during clean-up operations.
4. Oil Slick Characterization
The classification results obtained for all formats tested are available in
Table 1 and
Figure 5 providing (
i) the overall accuracies, (
ii) the variances of the overall accuracies, (
iii) the Kappa coefficient of agreement, and (
iv) the Kappa Variance. The Kappa coefficient is another index to do the accuracy assessment in remote sensing data classification. An explanation can be found in references [
26,
27,
28].
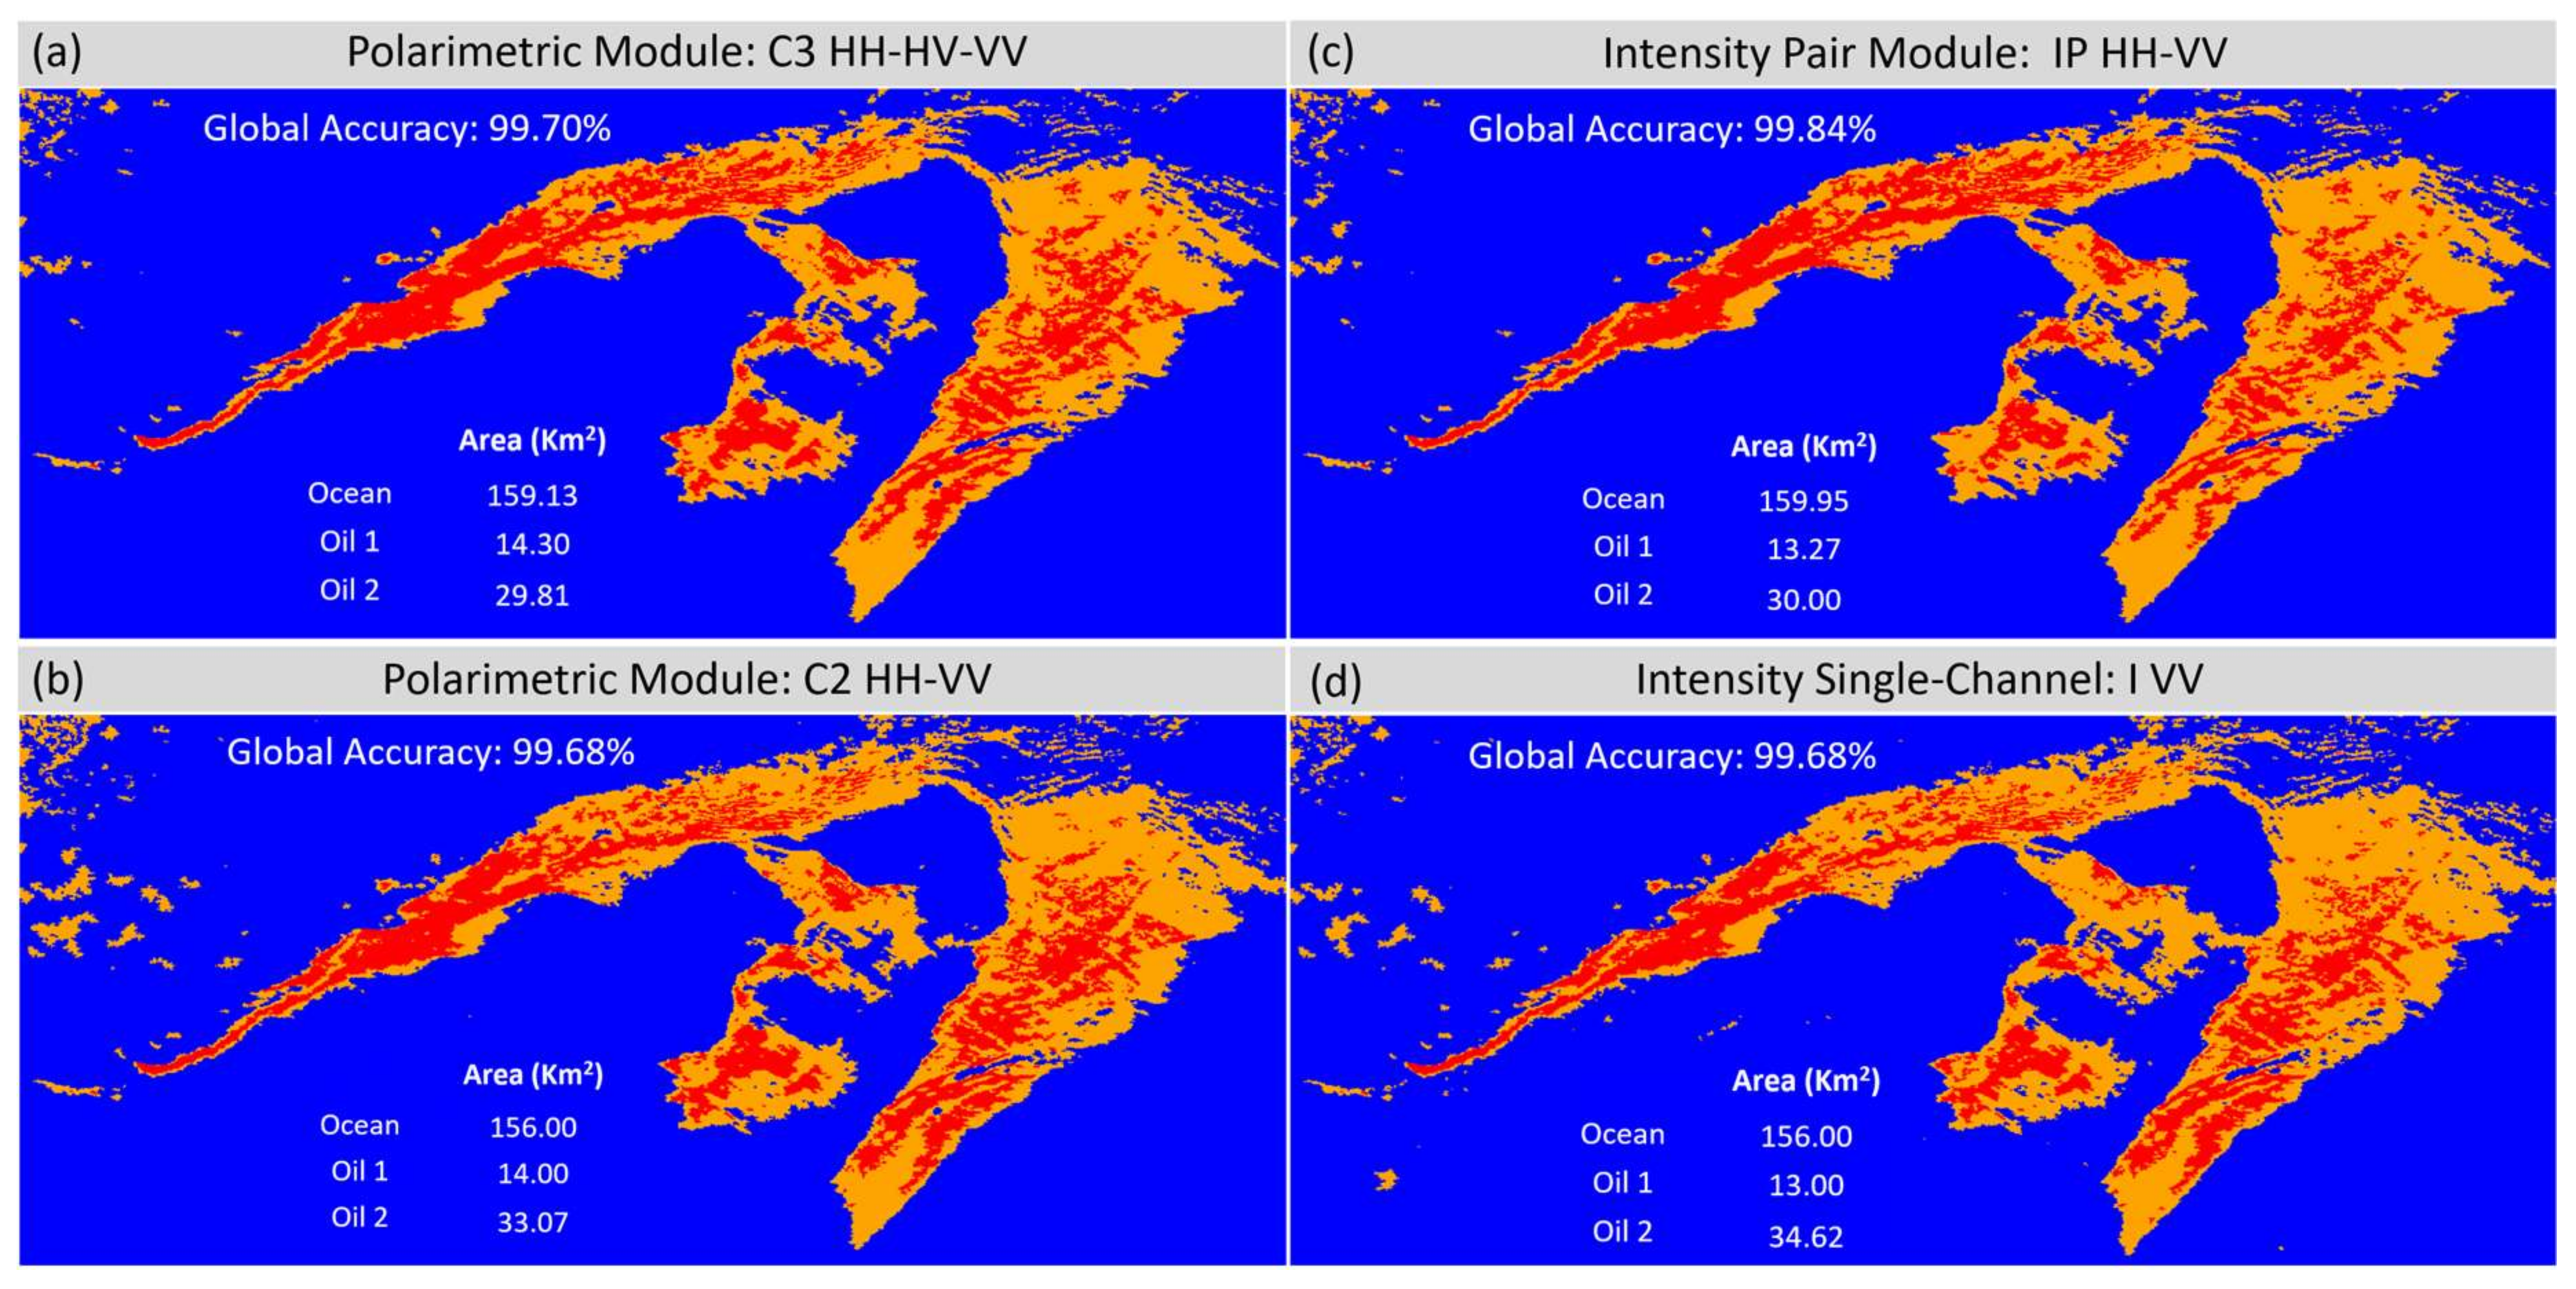
The oil slick characterization using a statistical approach and applying stochastic distances achieved global accuracies above 99% for all data types. However, the best result was obtained by the IP: HH-VV (99.84%). This result is statically equivalent to C3: HH-HV-VV (99.70%), C2: HH-VV (99.68%) and I: VV (99.68%) (
Table 1: results highlighted in blue) and statistically superior to the remaining results, at the 95% confidence level.
Despite these differences, the results obtained by the best data formats were very similar and statistically equivalent. Therefore, for this study case, the oil slick characterization can be done using a fully polarized data, as well as using only the VV channel in intensity, as these results are statistically equivalent.
The classification maps and the detected area (km
2) per class are available at
Figure 5a–d, only the best overall accuracies are considered statistically equivalent. It is interesting to note that the potential to recognize different patterns within the oil slick was more stable for the thicker layers of oil, represented by the class Oil 1 (red regions). For this class, the detected area was very similar between these different data types, ranging between 13 and 14 km
2.
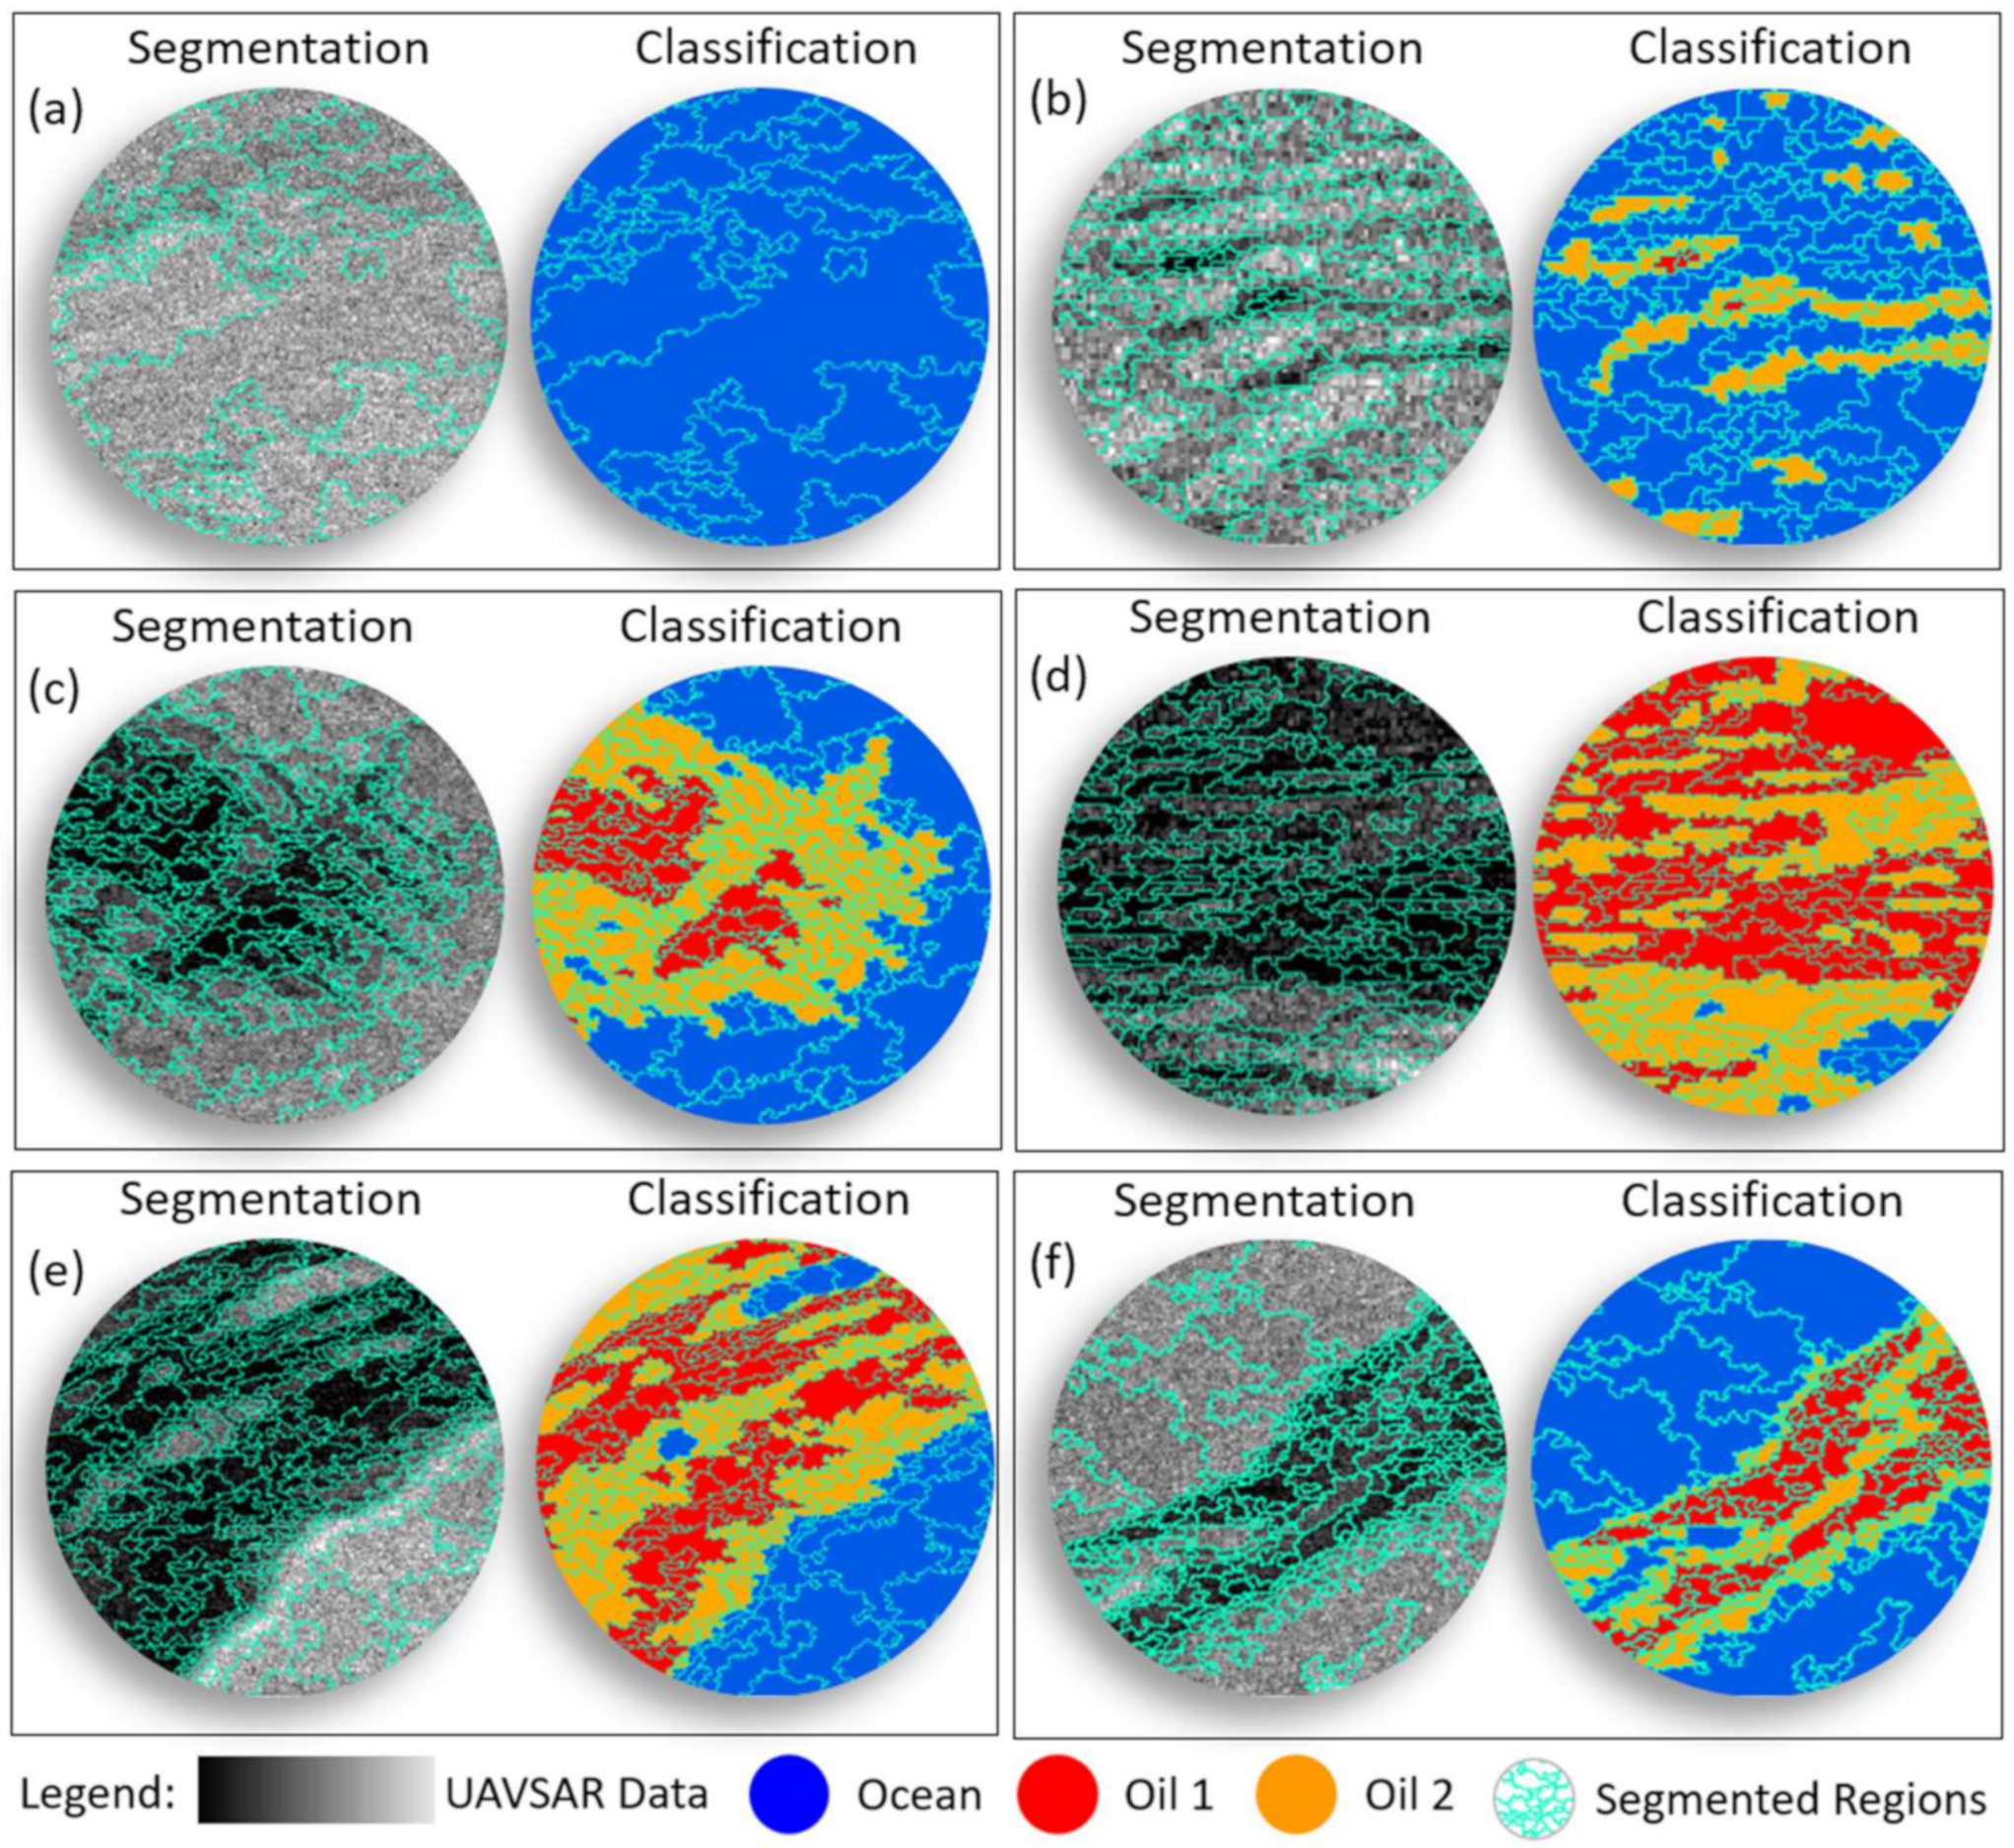
A higher confusion visible in the background of all classification maps was observed between the classes Oil 2 (orange regions) and Ocean (blue regions). However, a higher instability was observed for the I: VV and C2: HH-VV, which presented higher classification noise in the background generated by the confusion between these classes, returning the smaller oceanic areas (≈156 km2).
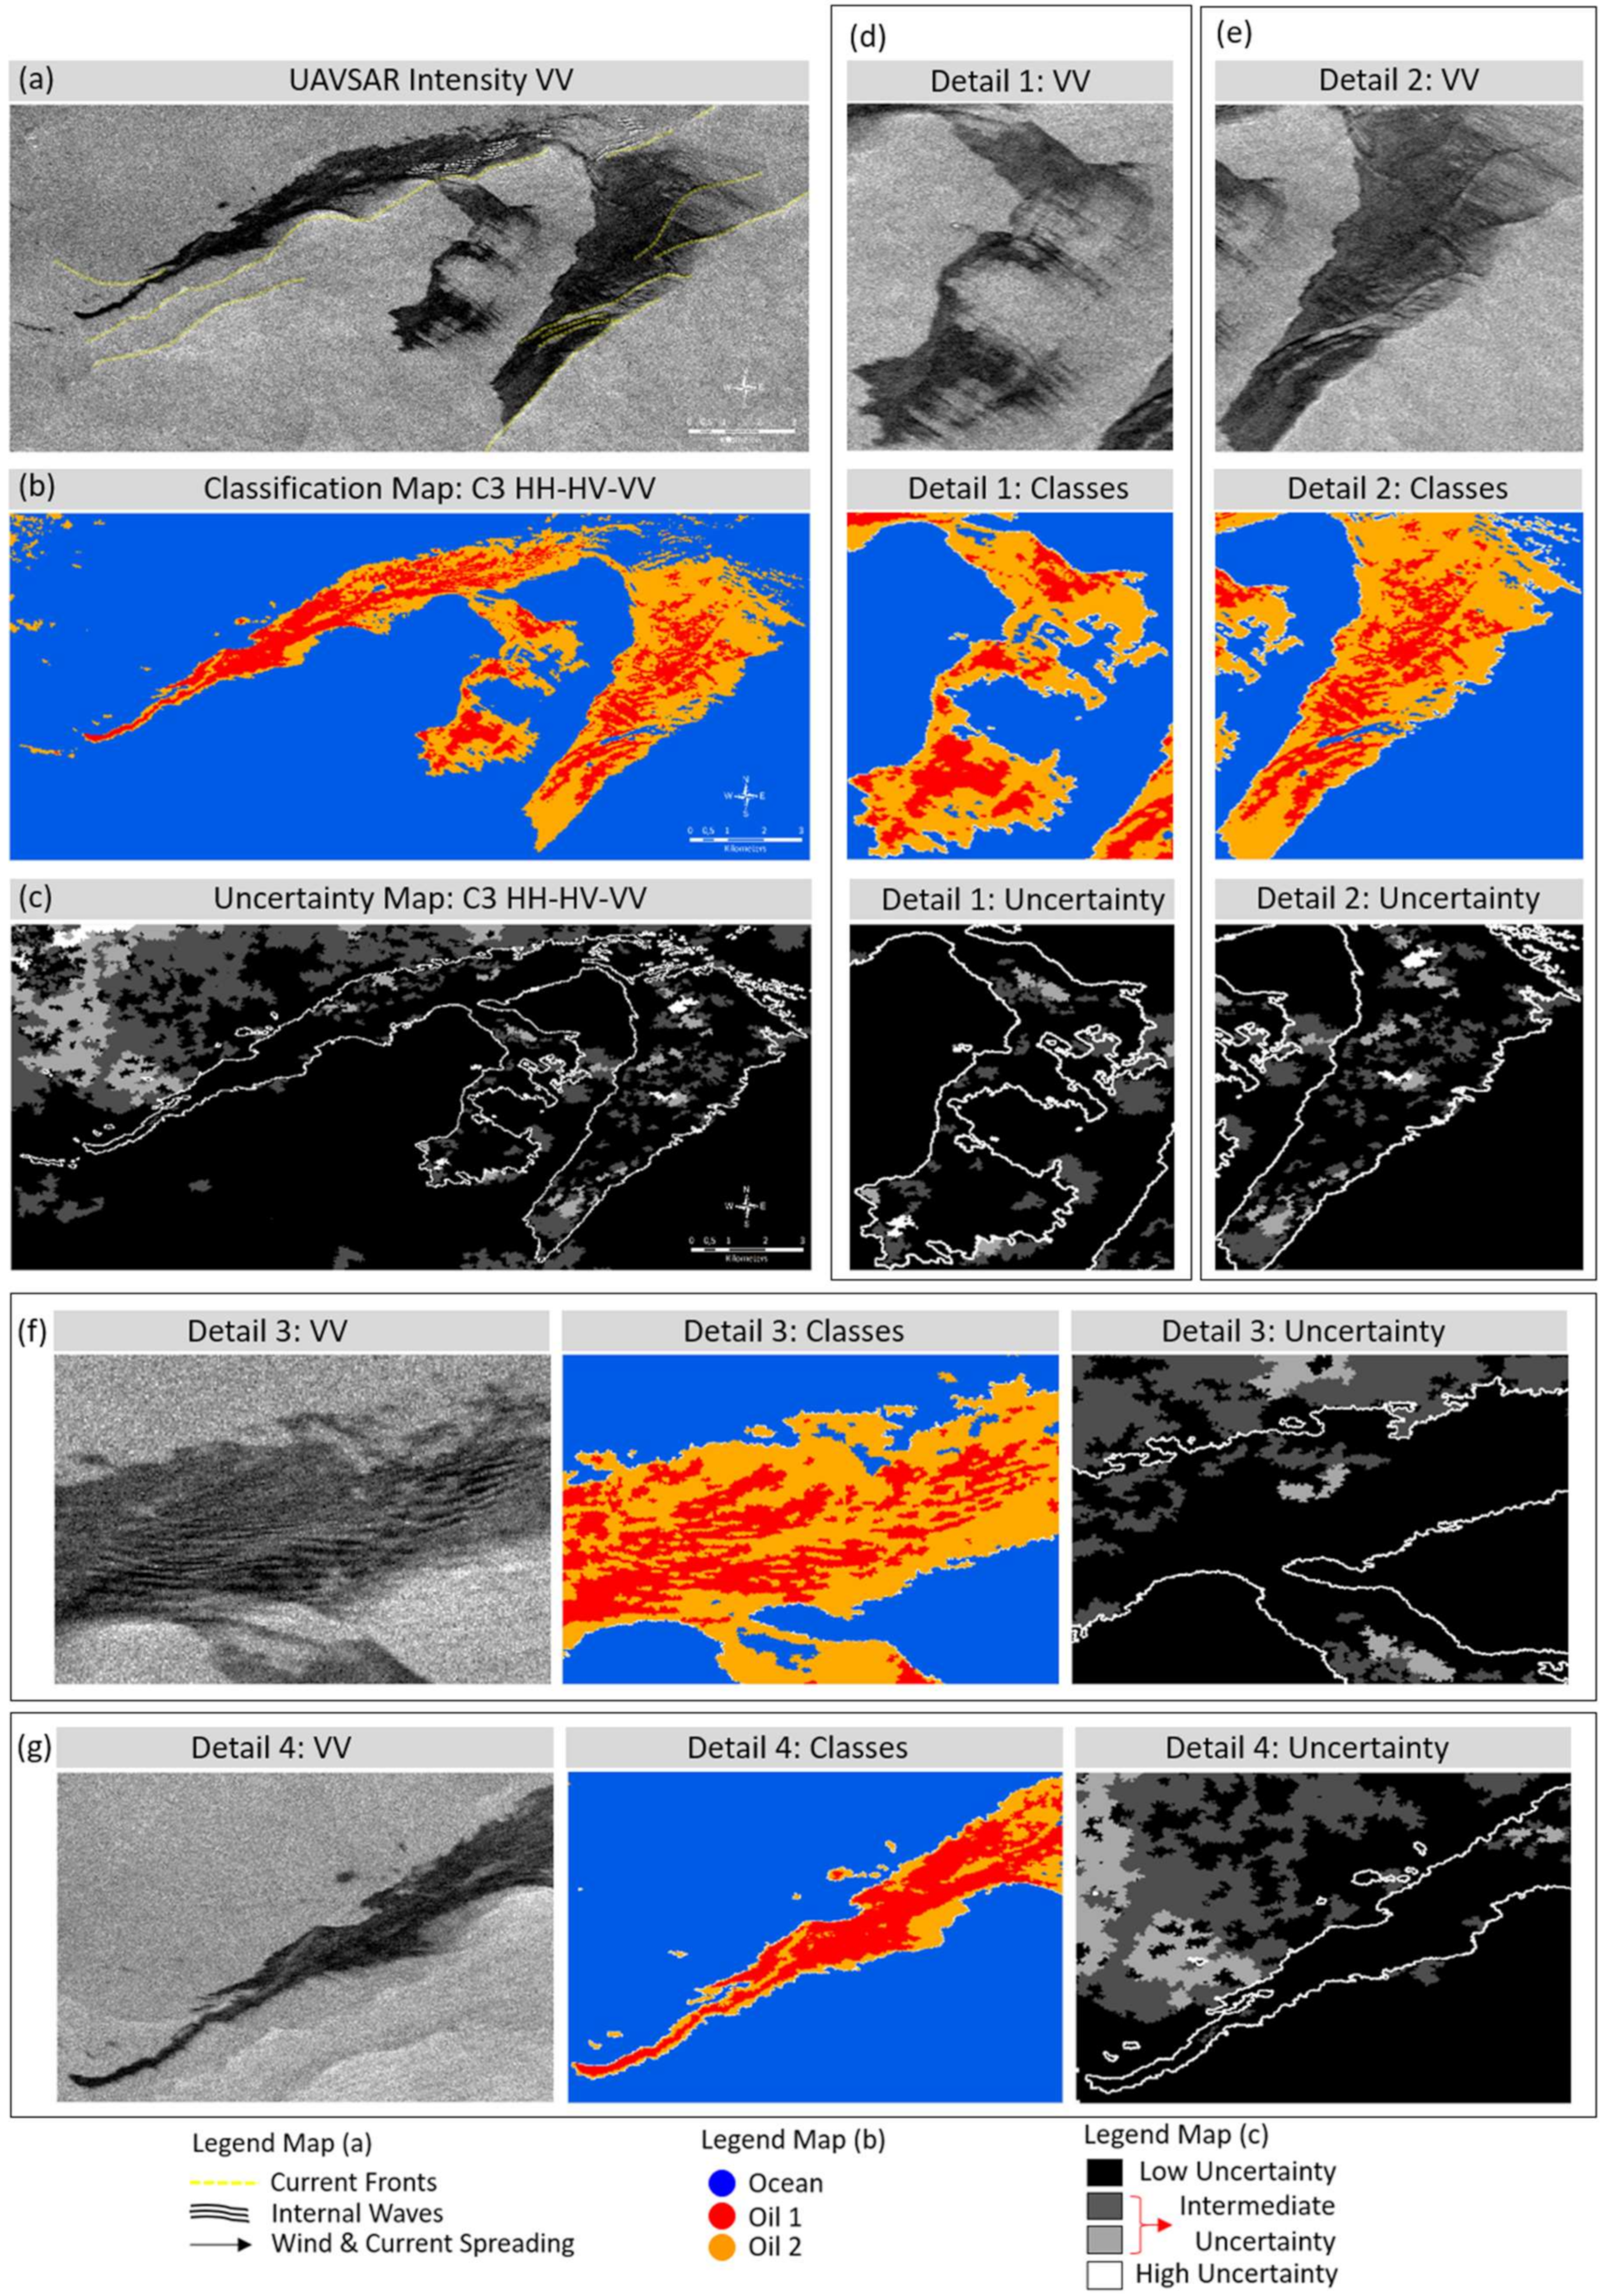
To conduct a detailed analysis regarding the confidence levels applied to oil slick characterization, only the C3 classification result was considered (
Figure 6).
The criteria used for this choice were: (i) the best results are very similar so it is feasible to choose any one of them to evaluate details, (ii) the C3 classification had lower confusion between the classes Ocean and Oil 2, (iii) using covariance matrix results, it is possible to discuss the results in terms of scattering mechanisms if the returns are significantly above the noise floor.
Figure 6a illustrates the oil slick detected by the UAVSAR using the VV channel. The classification map (
Figure 6b) and uncertainty map (
Figure 6c) are available only for the result C3. In
Figure 6c low uncertainties are represented in black, while high uncertainties are represented in white.
Figure 6d–g provides details of the oil slick classification along selected ocean features, allowing us to compare the dark spots backscattering, the classification results and the uncertainty levels.
The results show the potential of the Multi-source Image Processing System for characterizing the oil slick. The two oil classes show general differences with respect to their location within the slick, likely related to oil thickness variations, with Oil 1 class (red regions) likely related with the thicker layers, as discussed below, and the thinner layers, represented by the Oil 2 class (orange regions), spreading around the thicker layers.
Usually the thickest layers are concentrated at the center of the slicks, becoming gradually thinner towards the edges, where the spreading mechanisms are stronger, as shown in
Figure 6d. However, the presence of the intense oceanic fronts and currents may create convergence zones (
Figure 6e,g), which influence the dispersion, shape and concentration of the thickest layers within the oil slicks. A similar effect occurs when internal waves or fronts are observed (
Figure 6f). In the UAVSAR data used for this study, these two patterns are present, influencing the concentration of the thickest oil layers within the slick.
The first pattern is visible in the
Figure 6d and the second in
Figure 6e,g, where the thickest layers are concentrated near the borders in the convergence zones, being influenced by the currents, as well as following the geometry of the oceanic fronts (
Figure 6 e,g) and the internal waves (
Figure 6f). This is consistent with the oil being trapped by the internal waves and concentrated along the oceanic fronts. The detection of zones within slicks was also demonstrated in other published research using only the VV channel [
2,
11,
13] or including the polarimetric information [
5,
12]. The authors of reference [
2], evaluating the same slick as the one studied here, showed that the VV-intensity contrast between clean and slicked water (damping ratio) could be used to identify likely concentrated oil along convergence features in the scene.
Regarding the classification uncertainty levels, for all classes, most of the regions show low uncertainties in the class assignment process. These regions are seen in dark in the uncertainty map (
Figure 6c) and within detailed regions shown in
Figure 6d–g. The ocean class has the greater uncertainty variability, with the higher incidence of regions with intermediate and high uncertainties.
Almost all regions classified as Oil 1 presented low uncertainty levels, as seen in
Figure 6d–g. Oil 2 regions returned mainly low uncertainty levels but with some regions of moderate and high uncertainties, albeit lower than that observed for the ocean class. This makes sense considering that the thickest oil layers likely evolve in thin layers through spreading and some weathering processes, increasing the uncertainties during the class assignment process.
It is important to note that the multilevel segmentation algorithm was essential to provide the high level of accuracy achieved by the statistical region-based classifier. The satisfactory delineation of smaller dark paths was obtained through a hierarchical process, splitting and merging pixels from segments, according to statistical tests applied along the five compression levels.
Over the slick-free ocean, where the homogeneity is higher, the segmentor was able to merge more pixels in larger segments and to reduce the classification noise in the background (
Figure 7a). However, the lower homogeneity within the oil slick generated a higher number of smaller segments, making it feasible to delineate and to detect small thicker layers (in red,
Figure 7b).
Figure 7b–f exemplify in details the potential of the tested method to characterize the oil slick, indicating the contour of the segments and the regions classified as Oil 1 (thicker layers: red) and Oil 2 (thinner layers: orange).
This type of information, organized in thematic maps and integrating in situ measurements about the sea state and meteorological conditions, is a valuable instrument to guide the response actions in the field. During emergencies involving rapid spillage of large volumes of oil or continuous long-term spills, the action of wind and currents can form kilometer-long slicks, which can be fragmented, contain weathered oil, and drift in multiple directions depending upon the time on surface and changing winds and currents. Especially in these situations, using remote sensing instruments to rapidly identify the location of the thicker oil layers is highly valuable to efficiently and effectively guide the aircraft flight planning and oil dispersion or recovery activities.
5. Conclusions
The Multi-source Image Processing System provided promising results in separating the slick into two classes of oil and differentiating sheen from thicker oil, a distinction that is important to responders. The classifier was able to detect zoning regions within the slick and to identify specific locations - convergence zones - where the oil was concentrated by the influence of the oceanic waves and currents. These areas are likely sites of the thicker oil layers. The statistical analysis showed that this method could classify most of the regions within oil slicks containing sheen and thicker layers with high global accuracy and low uncertainty levels. Further study in controlled releases of known amounts of oil or with in situ validation data would provide more stringent validation, but those studies are costly and their data are not often available.
In this study case, oil slick characterization is possible using fully polarized data, as well as only the VV channel in intensity format, with both being statistically equivalent. Other research using UAVSAR data characterized oil slicks using only the VV through the damping ratio [
2,
11,
13]. One reason for this is the higher signal-to-noise ratio (SNR) provided by airborne SAR sensors compared with satellite SAR sensors [
2]. Because polarimetric data contains all possible information about the sea surface backscattering, it is an important data source for understanding different scattering mechanisms. Thus, given that UAVSAR provides a complete polarimetric dataset, it is interesting to explore the possible combinations of multi-polarization and polarimetric data.
The equivalence of the classification using the three types of input data tested does not invalidate the results and importance of the Multi-Source classifier. Different classification accuracies may be reached by oil slicks detected in different wind and current conditions, acquired by airborne or satellite sensors, in multi-frequency, multi-resolutions and with different acquisition geometries. Within this broader trade space, polarimetric data may contribute to better discriminate and characterize oil slicks detected under diverse and unknown conditions, which is the situation faced by operational surveillance agencies, including differentiation of different types of surface slicks, such as from biogenic and petrogenic oils.
In particular during environmental emergencies when any and all remote sensing data are used for responses, the possibility to use and integrate all data available, including polarimetric and optical data, within the same processing system has both tactical and strategic advantages. The system tested was shown capable of extracting essential information on the location of relatively thicker oil from each SAR data set both individually and in combination, offering the capability to customize an operational tool to deliver to the incident command system (ICS) in near real time thematic maps and accuracy reports.
For the operational activities, the use of only one polarization channel simplifies the data acquisition, the statistical modeling needed, as well as the complexity and the time required for processing. In some cases, the polarimetric data may extract key information to characterize the oil slicks, but at the expense of increasing the time needed to process and evaluate the results. This reinforces the relevance and importance of continuing this avenue of research into SAR and PolSAR-based oil classification, and suggests extending it to include study cases acquired with multi-frequency, polarimetry, or different resolution, and including optical imagery. Therefore, consolidating a database with several examples of mineral oils and look-alikes validated in the field using a multi-sensor approach would be of high value to evaluating the full potential of the proposed system.
Considering that oil thickness has a significant effect on recovery efficiency, the possibility to identify the thicker layers of the spilled oil using SAR and PolSAR data is a significant contribution to ongoing efforts to improve emergency responses. Methods that work to locate the thickest oil layers irrespective of the particular type of available remote sensing data will aid in directing responders to the best regions for barriers and skimmer deployment, thereby increasing the oil recovery efficiency and ultimately minimizing environmental impacts.


