1. Introduction
Against the backdrop of “carbon peaking” and “carbon neutrality,” distributed generation technology is increasingly being used in the grid, and microgrids have become an effective form of distributed generation technology. The development of ship microgrids using new energy technology is expected to achieve energy conservation and emission reduction goals in the maritime industry [
1,
2].
Depending on the electrical system, ship microgrids can be classified into AC and DC. In comparison to AC microgrids, DC microgrids exhibit prominent advantages, such as high efficiency, a low cost, and high reliability [
3,
4,
5]. However, with the penetration of electronic devices and the negative impedance characteristics of constant power loads, ship DC microgrid systems are becoming less stable [
6,
7,
8]. This mainly includes the rotor angle stability of the generator and the DC bus voltage stability. With the introduction of asynchronous generators, rotor angle stability has been effectively addressed, allowing us to focus more on the stability of the DC bus voltage. In this field, both domestic and international scholars have conducted extensive research, aiming to solve this complex and crucial problem.
Currently, research on the stability of ship DC microgrids primarily involves mechanism modeling and selecting effective control theories to analyze the local stability of the system. This can be categorized into large- and small-signal stability analyses [
9]. The common methods used in small-signal analysis include eigenvalue and impedance analyses, the Routh–Hurwitz criterion, etc. [
10,
11,
12]. To further enhance the stability of DC microgrid systems, other researchers have proposed various control optimization techniques that are categorized mainly into passive and active damping control technologies [
13].
Passive damping technology is primarily achieved by adding passive components (such as resistors, inductors, or capacitors) to the converter ports. However, passive damping solutions increase the systems’ costs, reduce the power density, and lack adaptability and flexibility [
14,
15,
16]. Therefore, passive damping technology is not suitable for DC microgrids. Active damping technology, on the other hand, modifies the control loop of the converter via the serial or parallel connection of virtual impedances to maintain power balance on the power source and load sides, stabilize the DC bus voltage, and increase the stability margin of the system. In reference [
17], a first-order low-pass filter in series with a droop loop effectively suppressed high-frequency oscillations in the DC bus voltage caused by constant power loads. The authors of reference [
18] employed parallel virtual impedance to suppress high-frequency oscillations in the DC bus voltage, achieving a good stability margin for the system. The authors of reference [
19] proposed an advanced power management system (PMS) to reconfigure the control parameters, executing control tuning by integrating the PMS, thereby maintaining system stability without any load shedding, sustaining dynamic performance, and extending the flexibility and resilience of regional DC grid operation. Building upon [
19], the authors of reference [
20] further addressed the issue of configuring the PMS after predicting unstable conditions by implementing a weighted bandwidth method (WBM). By adjusting the control gains to ensure that the stable power distribution is unaffected by the system configurations, they verified the reconfiguration algorithm’s capability through real-time platform C-HIL testing.
However, when the power converter is not under closed-loop control, the traditional series and parallel virtual impedance schemes fail to address this issue. Therefore, scholars at home and abroad have conducted in-depth research on methods to control the bus voltage stability of DC microgrids using impedance reshaping. The authors of reference [
21] established a detailed impedance model, considering the influences of grid impedance and control delay, analyzed the main factors leading to enhanced negative damping effects and high-frequency resonance in voltage source converters (VSCs), and proposed a coordinated reshaping approach using this analysis, effectively suppressing the high-frequency resonance caused by high-frequency negative damping. The authors of reference [
22] proposed an impedance reshaping control method that extracts the dynamic components of grid voltage, compensates for the power output accordingly, coordinates power output regulation, and neutralizes voltage dynamics in the power flow direction, thereby stabilizing the bidirectional power flow and grid-side voltage. Experimental verification has demonstrated the correctness and feasibility of this method.
In summary, although methods have been proposed to address the instability issue of the DC bus voltage caused by constant power negative impedance at the load side, DC microgrid systems feature multiple types of power sources and converters, each with unique characteristics and behaviors. This complexity and unpredictability significantly increase the challenges of system dynamics and stability. In such scenarios, achieving comprehensive impedance modeling and stability analysis of the entire system becomes a crucial and challenging task, considering the characteristics of various types of power sources and converters as well as their interactions and coupling effects.
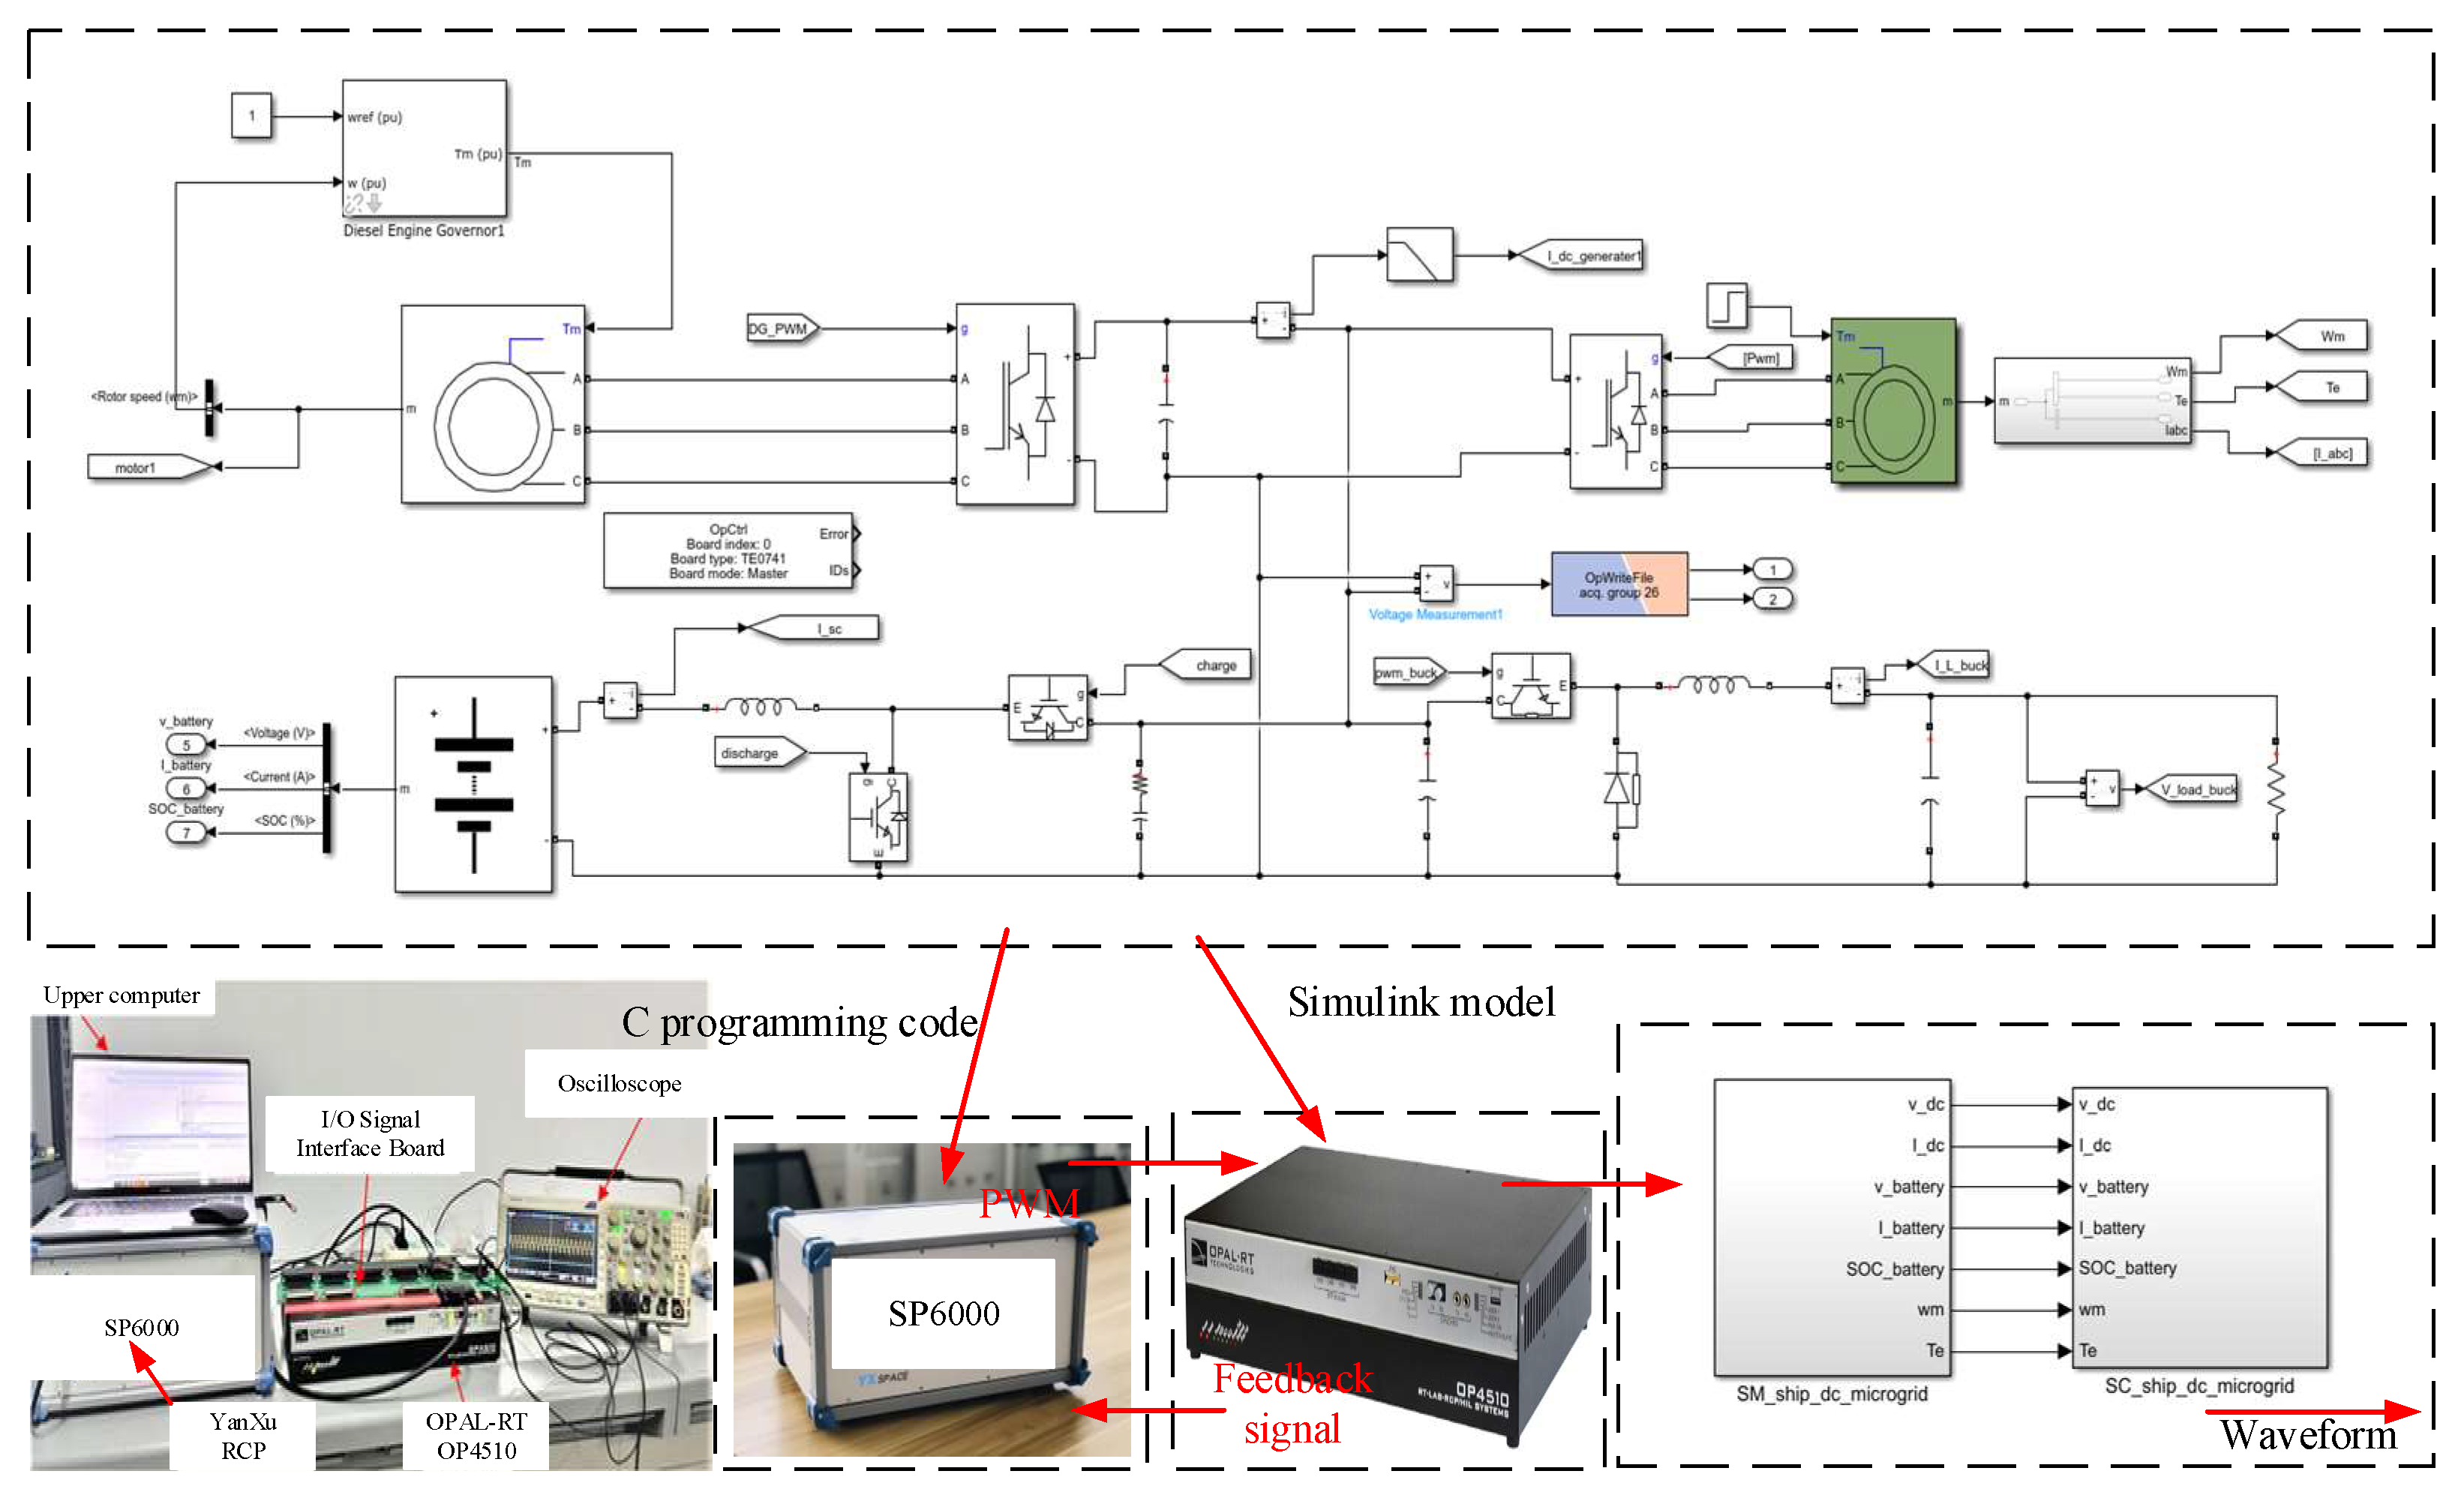
Therefore, to address the DC bus voltage instability caused by constant power, negative impedance on the load side, this paper proposes an impedance magnitude reshaping method using bus voltage feedback based on the power-source-side impedance reshaping theory. This paper provides a detailed design approach for the impedance regulator parameters, models the reshaped system using MATLAB R2022a/Simulink, performs stability comparative analysis, and finally validates the method on a semi-physical simulation platform. The research results indicate that this method effectively increases the stability margin of the DC bus voltage and stabilizes the DC microgrid.
2. Lithium Battery Energy Storage Unit Output Impedance Model
A schematic diagram of the ship DC microgrid studied in this paper is shown in
Figure 1. This system is primarily composed of a diesel engine unit, an asynchronous generator unit, a lithium battery energy storage unit, a main propulsion load unit, and an auxiliary load unit. These components are connected to the DC bus through power electronic converters.
Given the significant impact of the lithium battery energy storage unit on system stability [
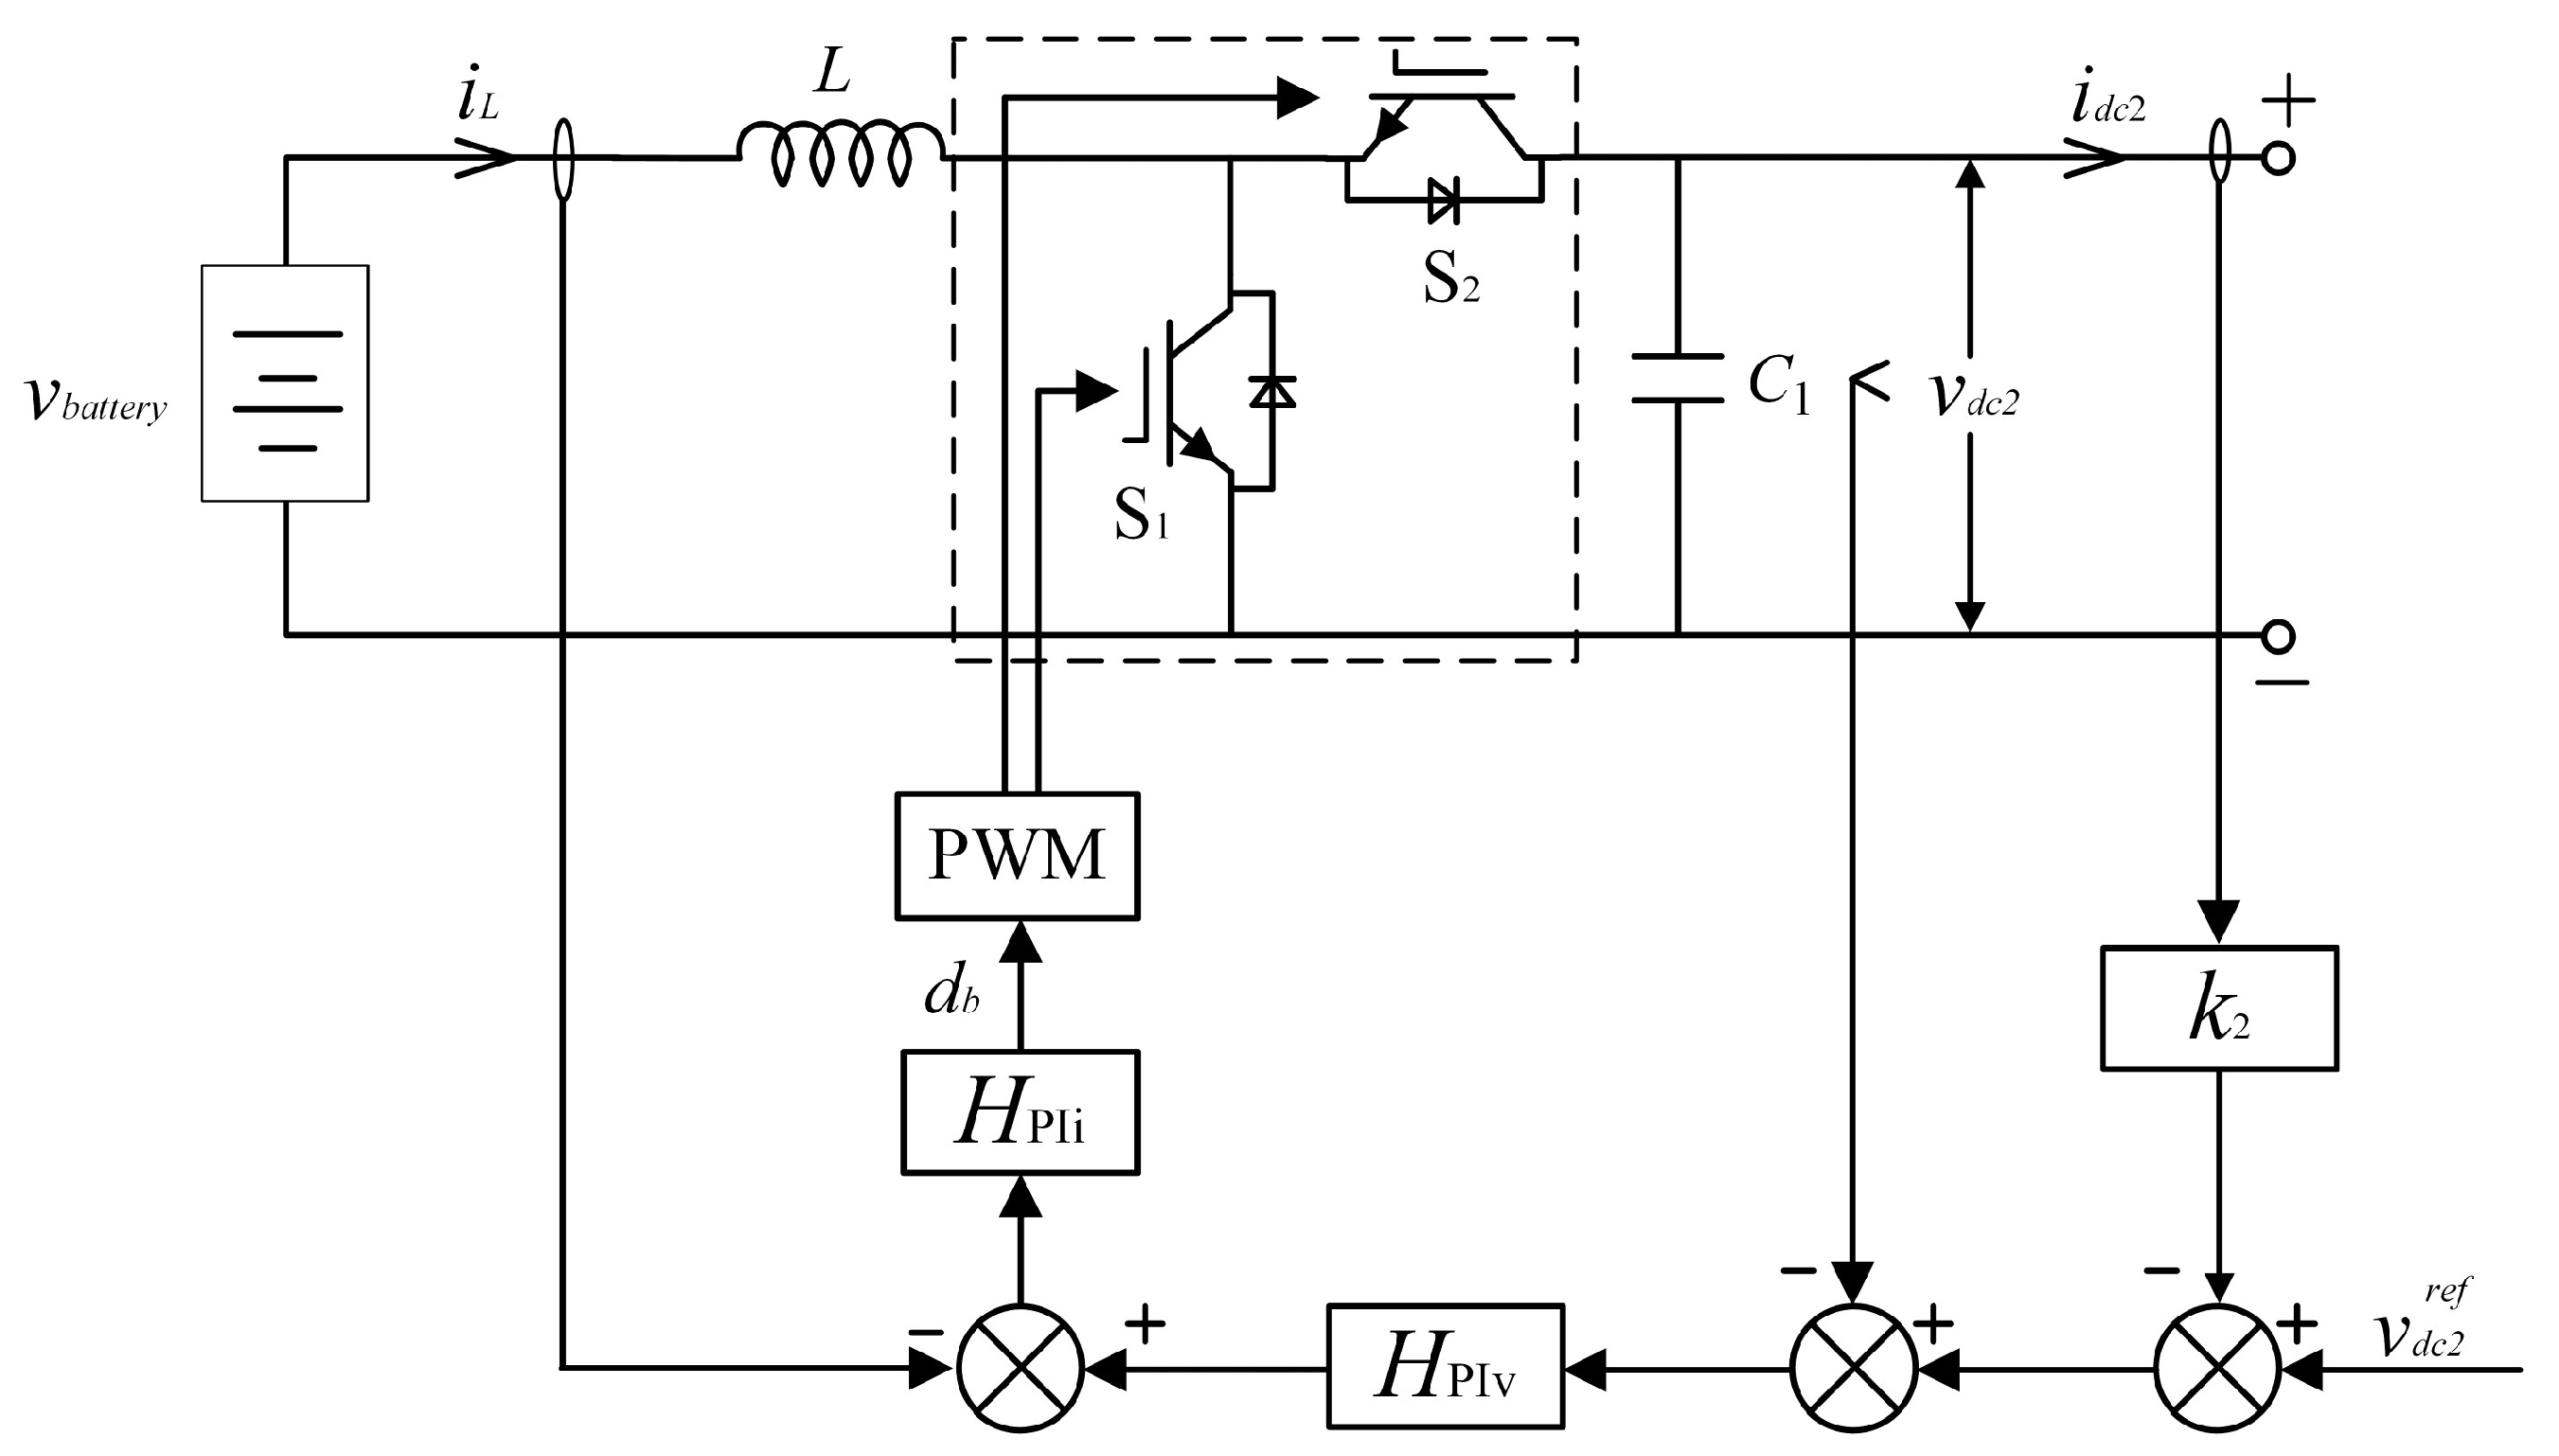
23], the primary task is to accurately and mathematically model the output impedance of the lithium battery. The bidirectional DC/DC converter of the lithium battery energy storage unit adopts a droop control strategy with dual voltage and current closed loops. When the load side is in high-power mode, energy flows from the power source side to the load side. Therefore, we analyze the Boost operation mode of this bidirectional DC/DC converter as an example. Its circuit topology and control structure are shown in
Figure 2.
In the diagram, represent the reference value for the output voltage of the bidirectional DC/DC converter; and represent the actual output voltage and current of the bidirectional DC/DC converter, respectively; and denote the input voltage and current of the bidirectional DC/DC converter; and represent the filtering inductance and duty cycle of the bidirectional DC/DC converter, respectively; is the output capacitance of the bidirectional DC/DC converter; and represent the transfer functions of the voltage and current loop PI controllers, respectively; and denotes the droop coefficient.
A mathematical model of the bidirectional DC/DC converter of the lithium battery energy storage unit is established using
Figure 2.
Small disturbances are applied to the mathematical model of the bidirectional DC/DC converter in the lithium battery energy storage unit (
,
,
,
, and
). By neglecting the second-order disturbance component, the small-signal mathematical model of the bidirectional DC/DC converter in the lithium battery energy storage unit can be represented as follows:
In this equation, represents the steady-state value of the output voltage of the bidirectional DC/DC converter at the operating point. represents the steady-state value of the current through the output voltage filtering inductor of the bidirectional DC/DC converter at the operating point. represents the steady-state value of the duty cycle of the bidirectional DC/DC converter at the operating point.
To convert the time-domain small-signal mathematical model expression of the bidirectional DC/DC converter in the lithium battery energy storage unit into a frequency-domain small-signal model, we use the following equation:
Matrix operations are performed using Equation (3) to solve the transfer function expressions between various disturbance quantities of the bidirectional DC/DC converter in the lithium battery energy storage unit, as shown in Equations (4) to (9).
The transfer from the lithium battery terminal voltage
to the inductor current
of the bidirectional DC/DC converter in the lithium battery energy storage unit is represented as follows:
The transfer from the lithium battery terminal voltage
to the DC bus-side output voltage
of the bidirectional DC/DC converter in the lithium battery energy storage unit is represented as follows:
The transfer from the DC bus-side output current
to the inductor current
of the bidirectional DC/DC converter in the lithium battery energy storage unit is represented as follows:
The transfer from the DC bus-side output current
to the DC bus-side output voltage
of the bidirectional DC/DC converter in the lithium battery energy storage unit is represented as follows:
The transfer from the duty cycle
to the inductor current
of the bidirectional DC/DC converter in the lithium battery energy storage unit is represented as follows:
The transfer from the duty cycle
to the DC bus-side output voltage
of the bidirectional DC/DC converter in the lithium battery energy storage unit is represented as follows:
According to the transfer function expressions between various disturbance quantities of the bidirectional DC/DC converter in the lithium battery energy storage unit, a small-signal control block diagram for the lithium battery energy storage unit DC/DC converter is established, as shown in
Figure 3.
In which,
and
represent the transfer functions of the voltage and current loop PI controllers for the bidirectional DC/DC converter in the lithium battery energy storage unit, and their expressions are as follows:
In which, and represent the proportional and integral coefficients of the voltage loop PI controller for the bidirectional DC/DC converter in the lithium battery energy storage unit; and represent the proportional and integral coefficients of the current loop PI controller for the same converter.
The small-signal control block diagram of the bidirectional DC/DC converter in the lithium battery energy storage unit is simplified, as shown in
Figure 3, and an expression for the closed-loop output impedance of the lithium battery energy storage unit is obtained.
In this equation,
represents the closed-loop transfer function of the current inner loop for the bidirectional DC/DC converter in the lithium battery energy storage unit, and its expression is as follows:
3. Voltage Feedback-Based Impedance Reshaping Control Optimization Method
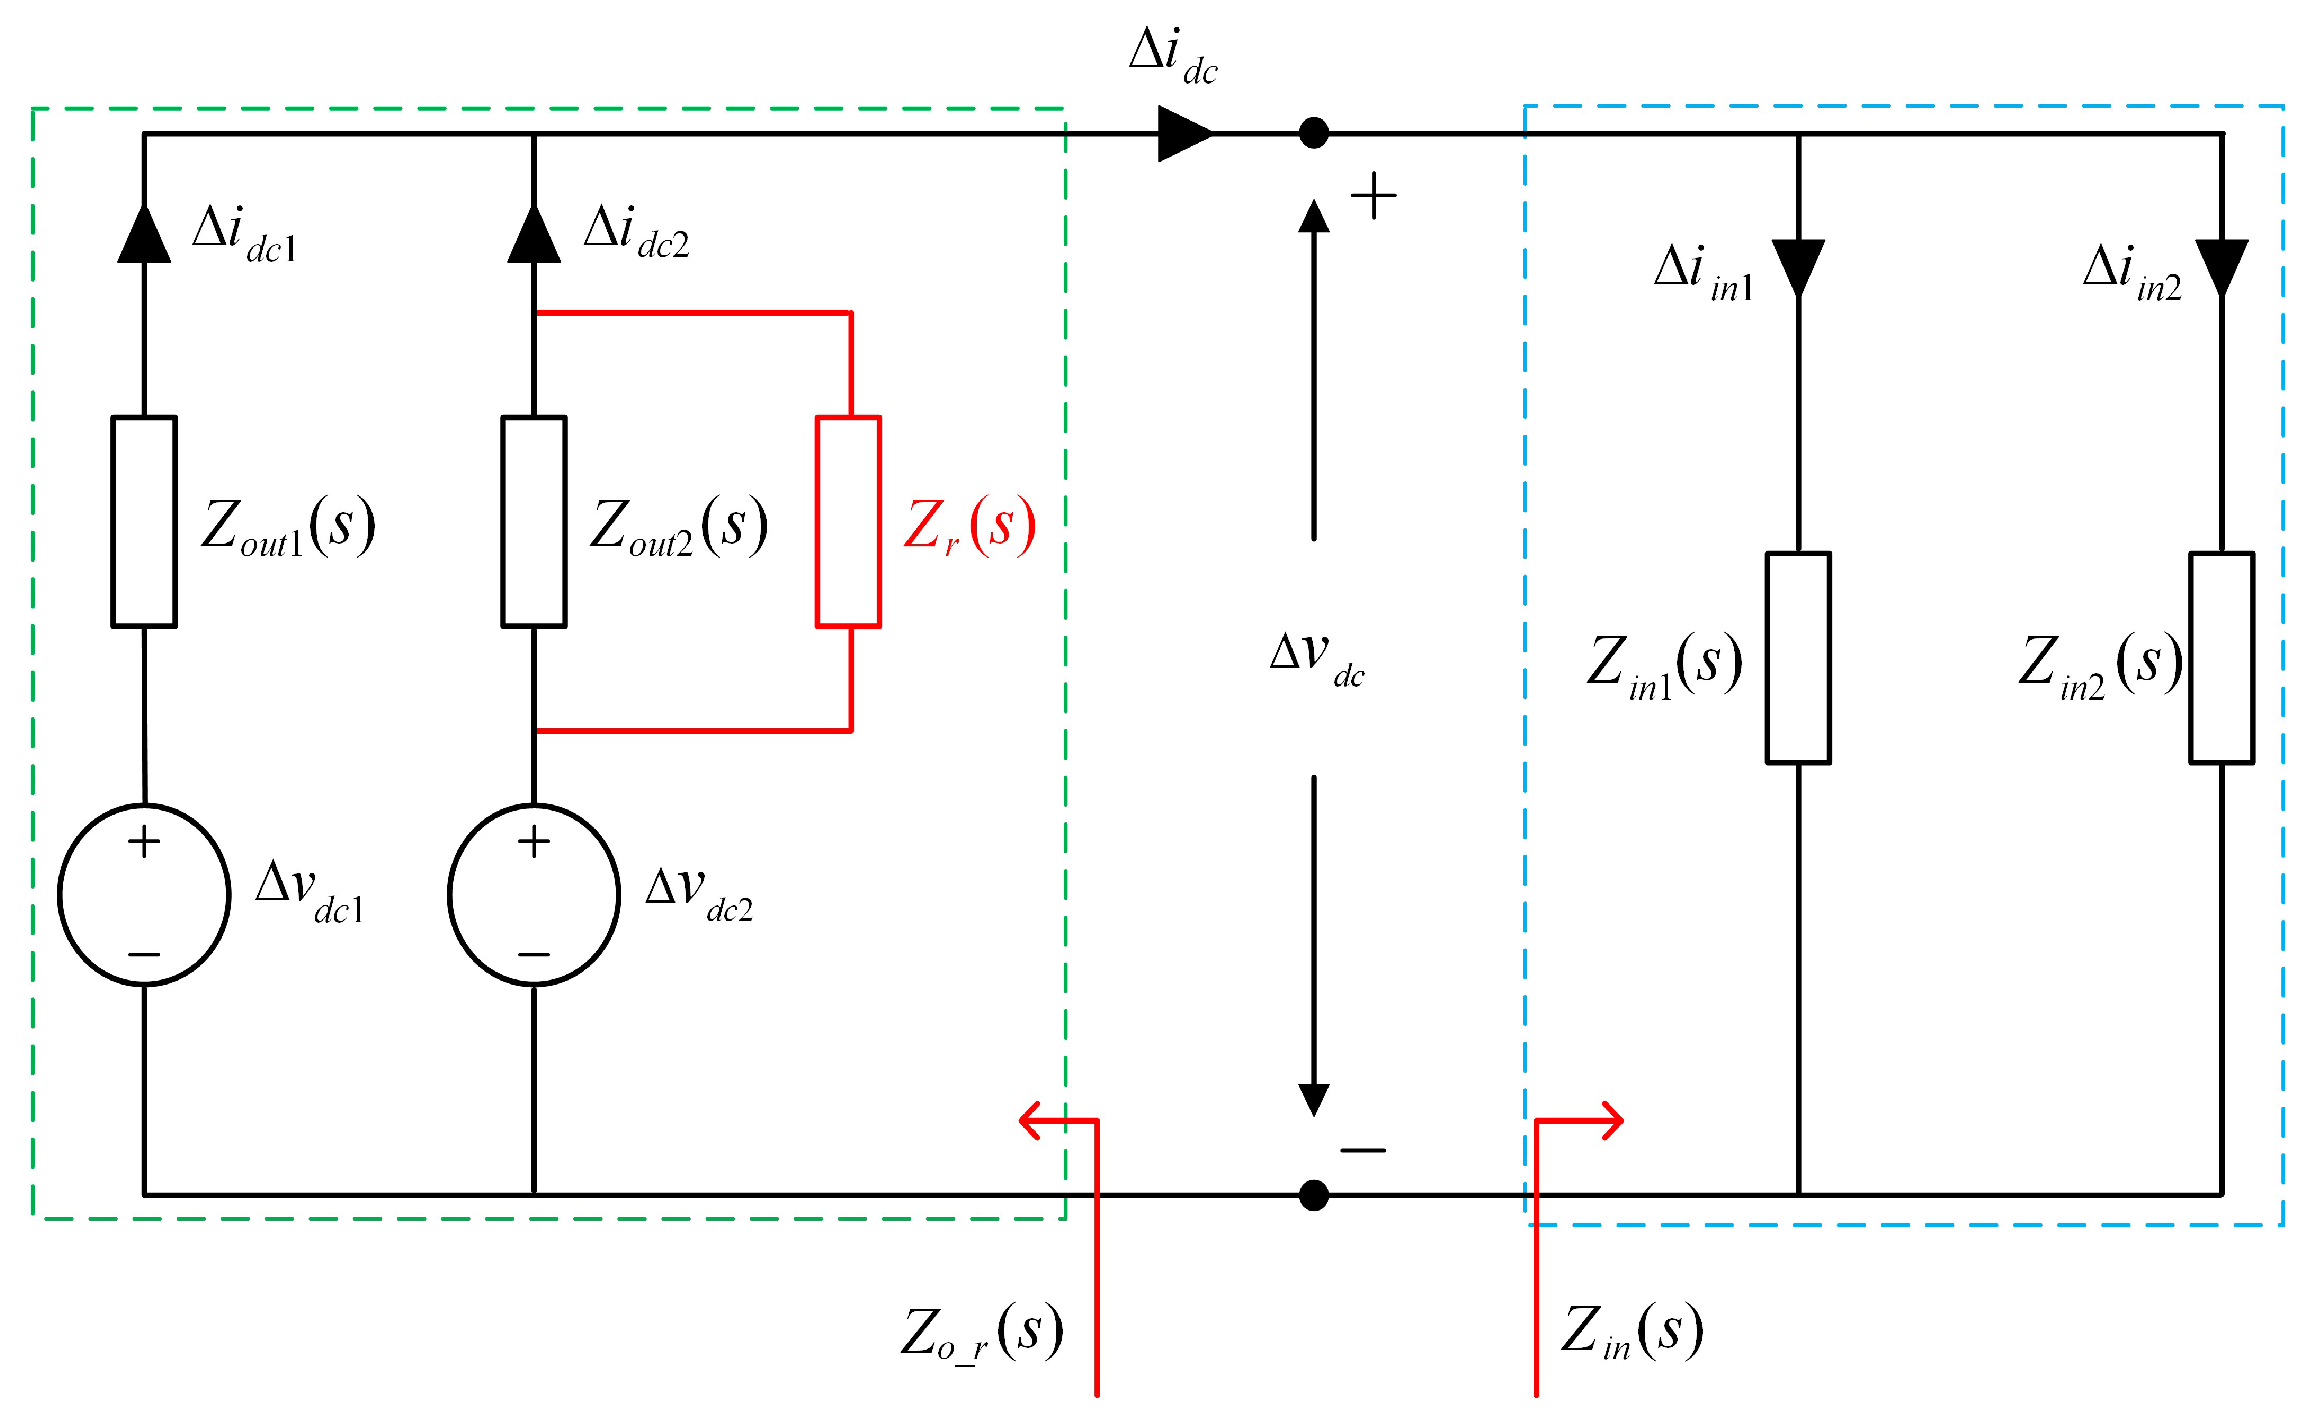
In a DC microgrid, when the equivalent output impedance on the power source side and input impedance on the load side intersect, failing to meet the impedance ratio Nyquist stability criterion, it leads to instability in the DC bus voltage. Therefore, employing impedance reshaping as a method to optimize the system control structure can stabilize the system. According to the impedance stability analysis theory, an equivalent impedance model of the DC microgrid is obtained, as shown in
Figure 4.
By connecting the virtual impedances on the DC bus side of the bidirectional DC/DC converter in the lithium battery energy storage unit in parallel, the output impedance of the lithium battery energy storage unit is reshaped, thereby impacting the equivalent output impedance on the power source side. An equivalent impedance model of the DC microgrid after impedance reshaping is shown in
Figure 5. The green and blue dotted boxes represent the power source subsystem and the load subsystem, respectively.
Figure 6 shows a small-signal control block diagram of the bidirectional converter in the lithium battery energy storage unit after impedance reshaping, where
represents the output impedance regulator.
Figure 6 is simplified to derive an expression for the closed-loop output impedance
of the bidirectional DC/DC converter after impedance reshaping. This is then rewritten in the admittance form, as shown in Equation (13).
Equation (13) is reorganized to obtain Equation (14).
According to Equation (14), the closed-loop output impedance of the bidirectional DC/DC converter in the reshaped lithium battery energy storage unit is obtained via the parallel combination of the original impedance
and the virtual impedance
, where the virtual impedance
can be expressed as follows:
where
represents the inherent term for virtual impedance, which can be obtained based on the system parameters. Considering an ideal voltage source, the impedance is zero across all the frequency bands. To approximate a voltage source, the parameters of the impedance regulator
can be designed to approximately offset
. Through equivalent elimination, a constant amplitude virtual impedance
can be obtained. Further adjusting the parameters of
allows for the adjustment of closed-loop output impedance
of the bidirectional DC/DC converter in the lithium battery energy storage unit, and consequently, the effective output impedance
on the power source side can be changed. To properly design the parameters of the impedance regulator
, it is necessary to analyze the Bode plot of
under different load powers, as shown in
Figure 7. From the Bode plot, it can be observed that the amplitude curve of J can always be approximated using a first-order high-pass filter in the range of 1–200 Hz.
Therefore, the transfer function of
is designed as follows:
where
represents the gain coefficient of
, and
denotes the cutoff frequency of
.
In order to approximate the virtual impedance expression
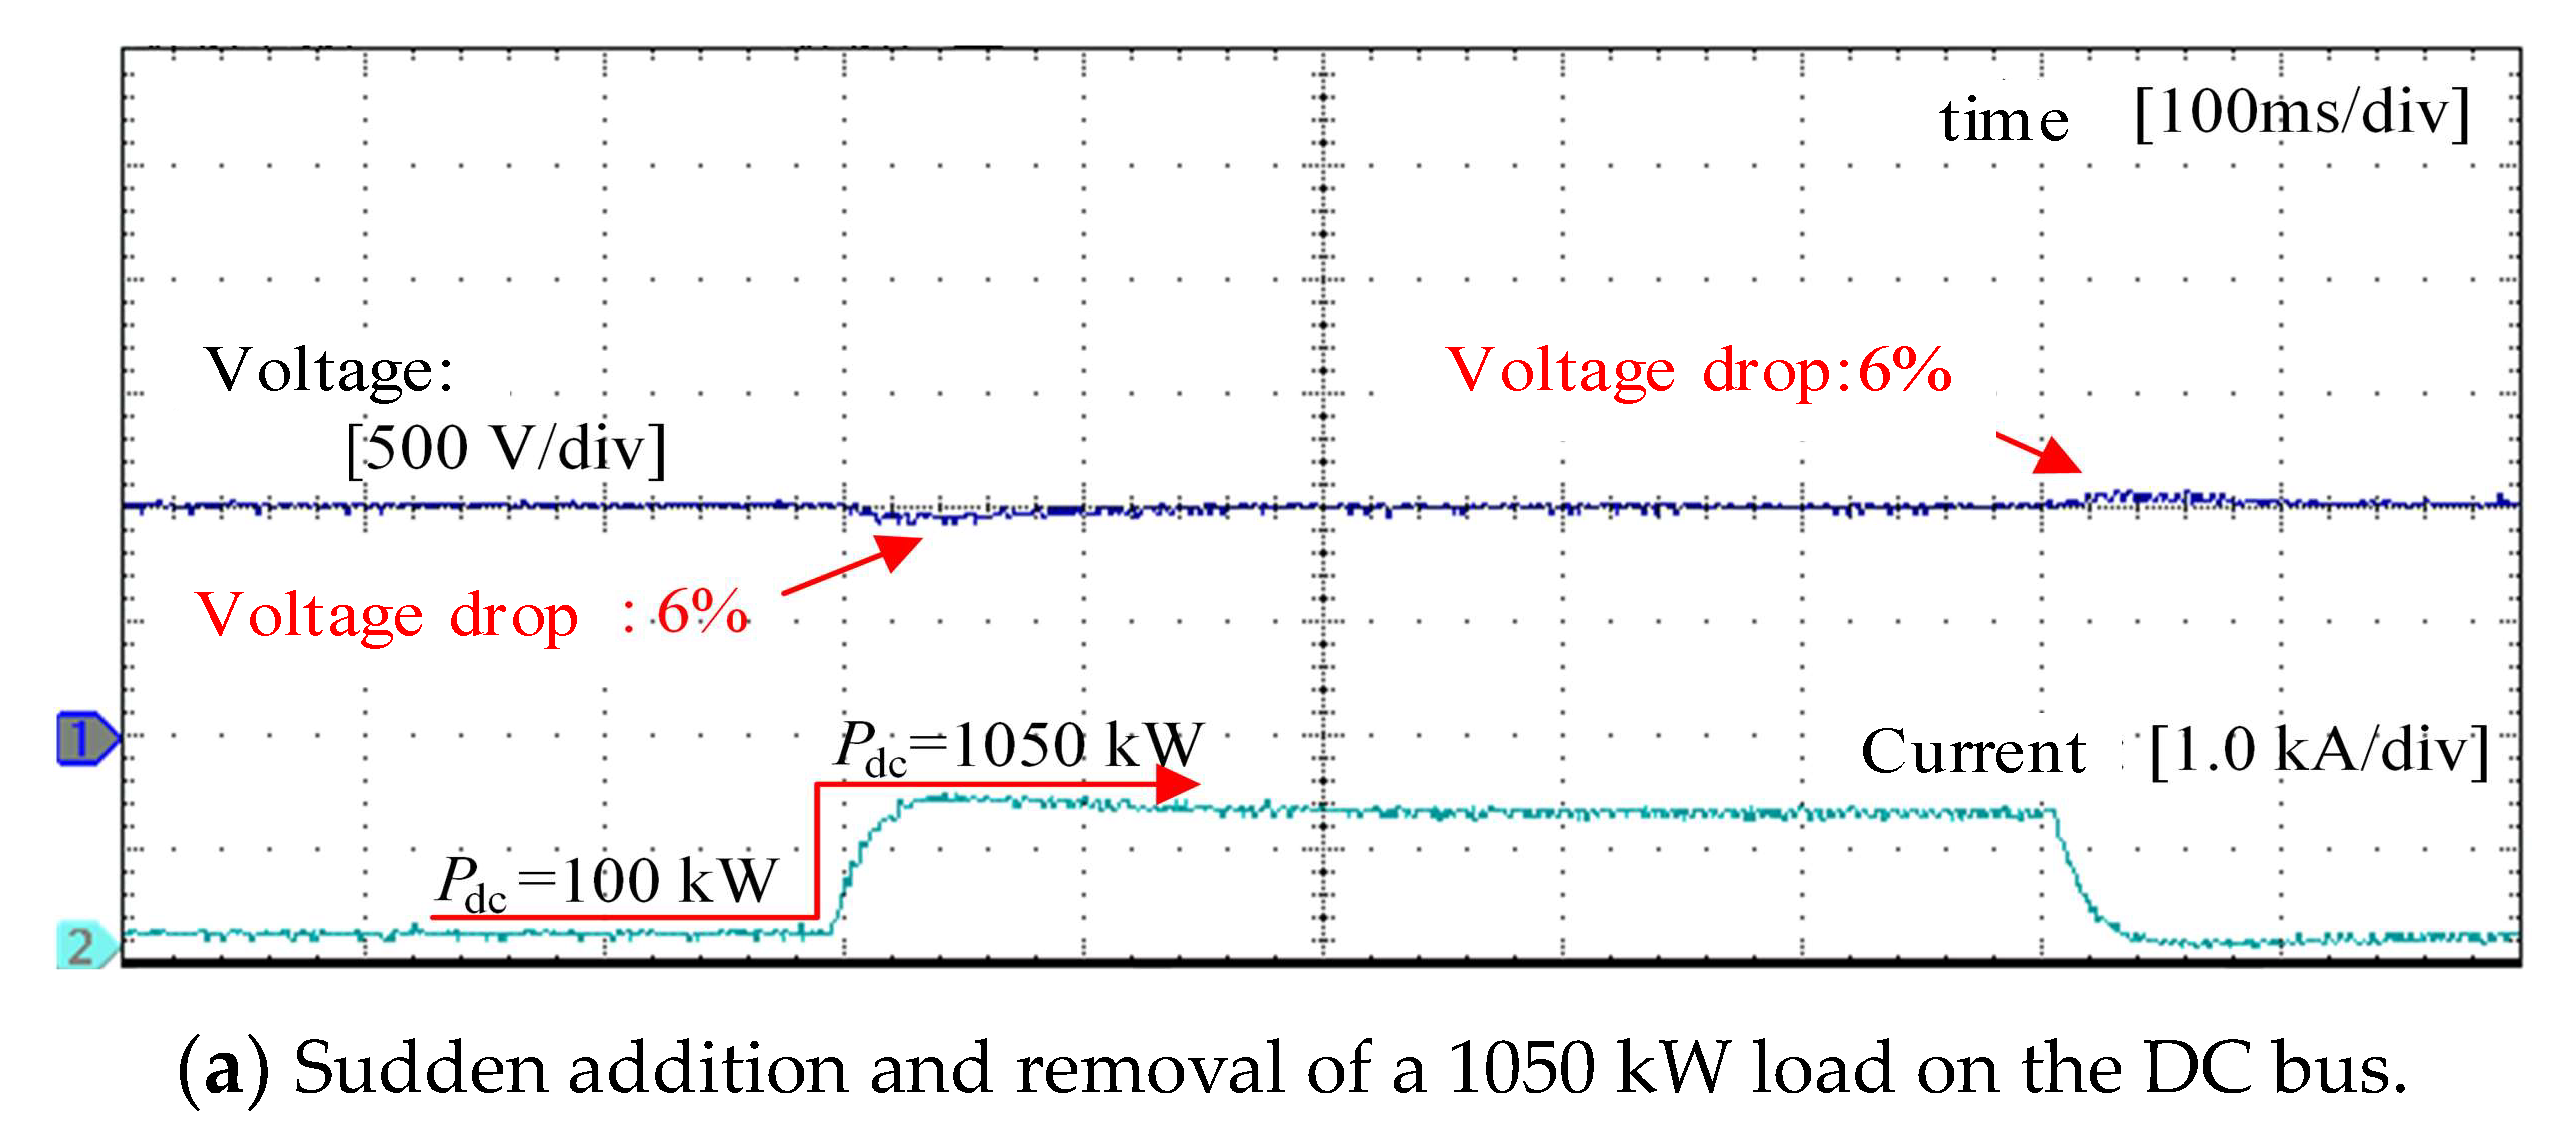
as a fixed value in the range of 1–200 Hz for impedance reshaping, the cutoff frequency (
) of
is set to the value when the DC bus power (
) is equal to 1050 kW.
corresponds to a cutoff frequency of 200 Hz. At this point, adjusting the gain coefficient
allows us to obtain virtual impedances
with different amplitudes, as shown in
Figure 8.
From
Figure 8, it can be seen that in the frequency range from 1 Hz to 200 Hz, the amplitude curve of the virtual impedance
does not change with the frequency. Therefore, different amplitudes of
can be obtained by adjusting
.
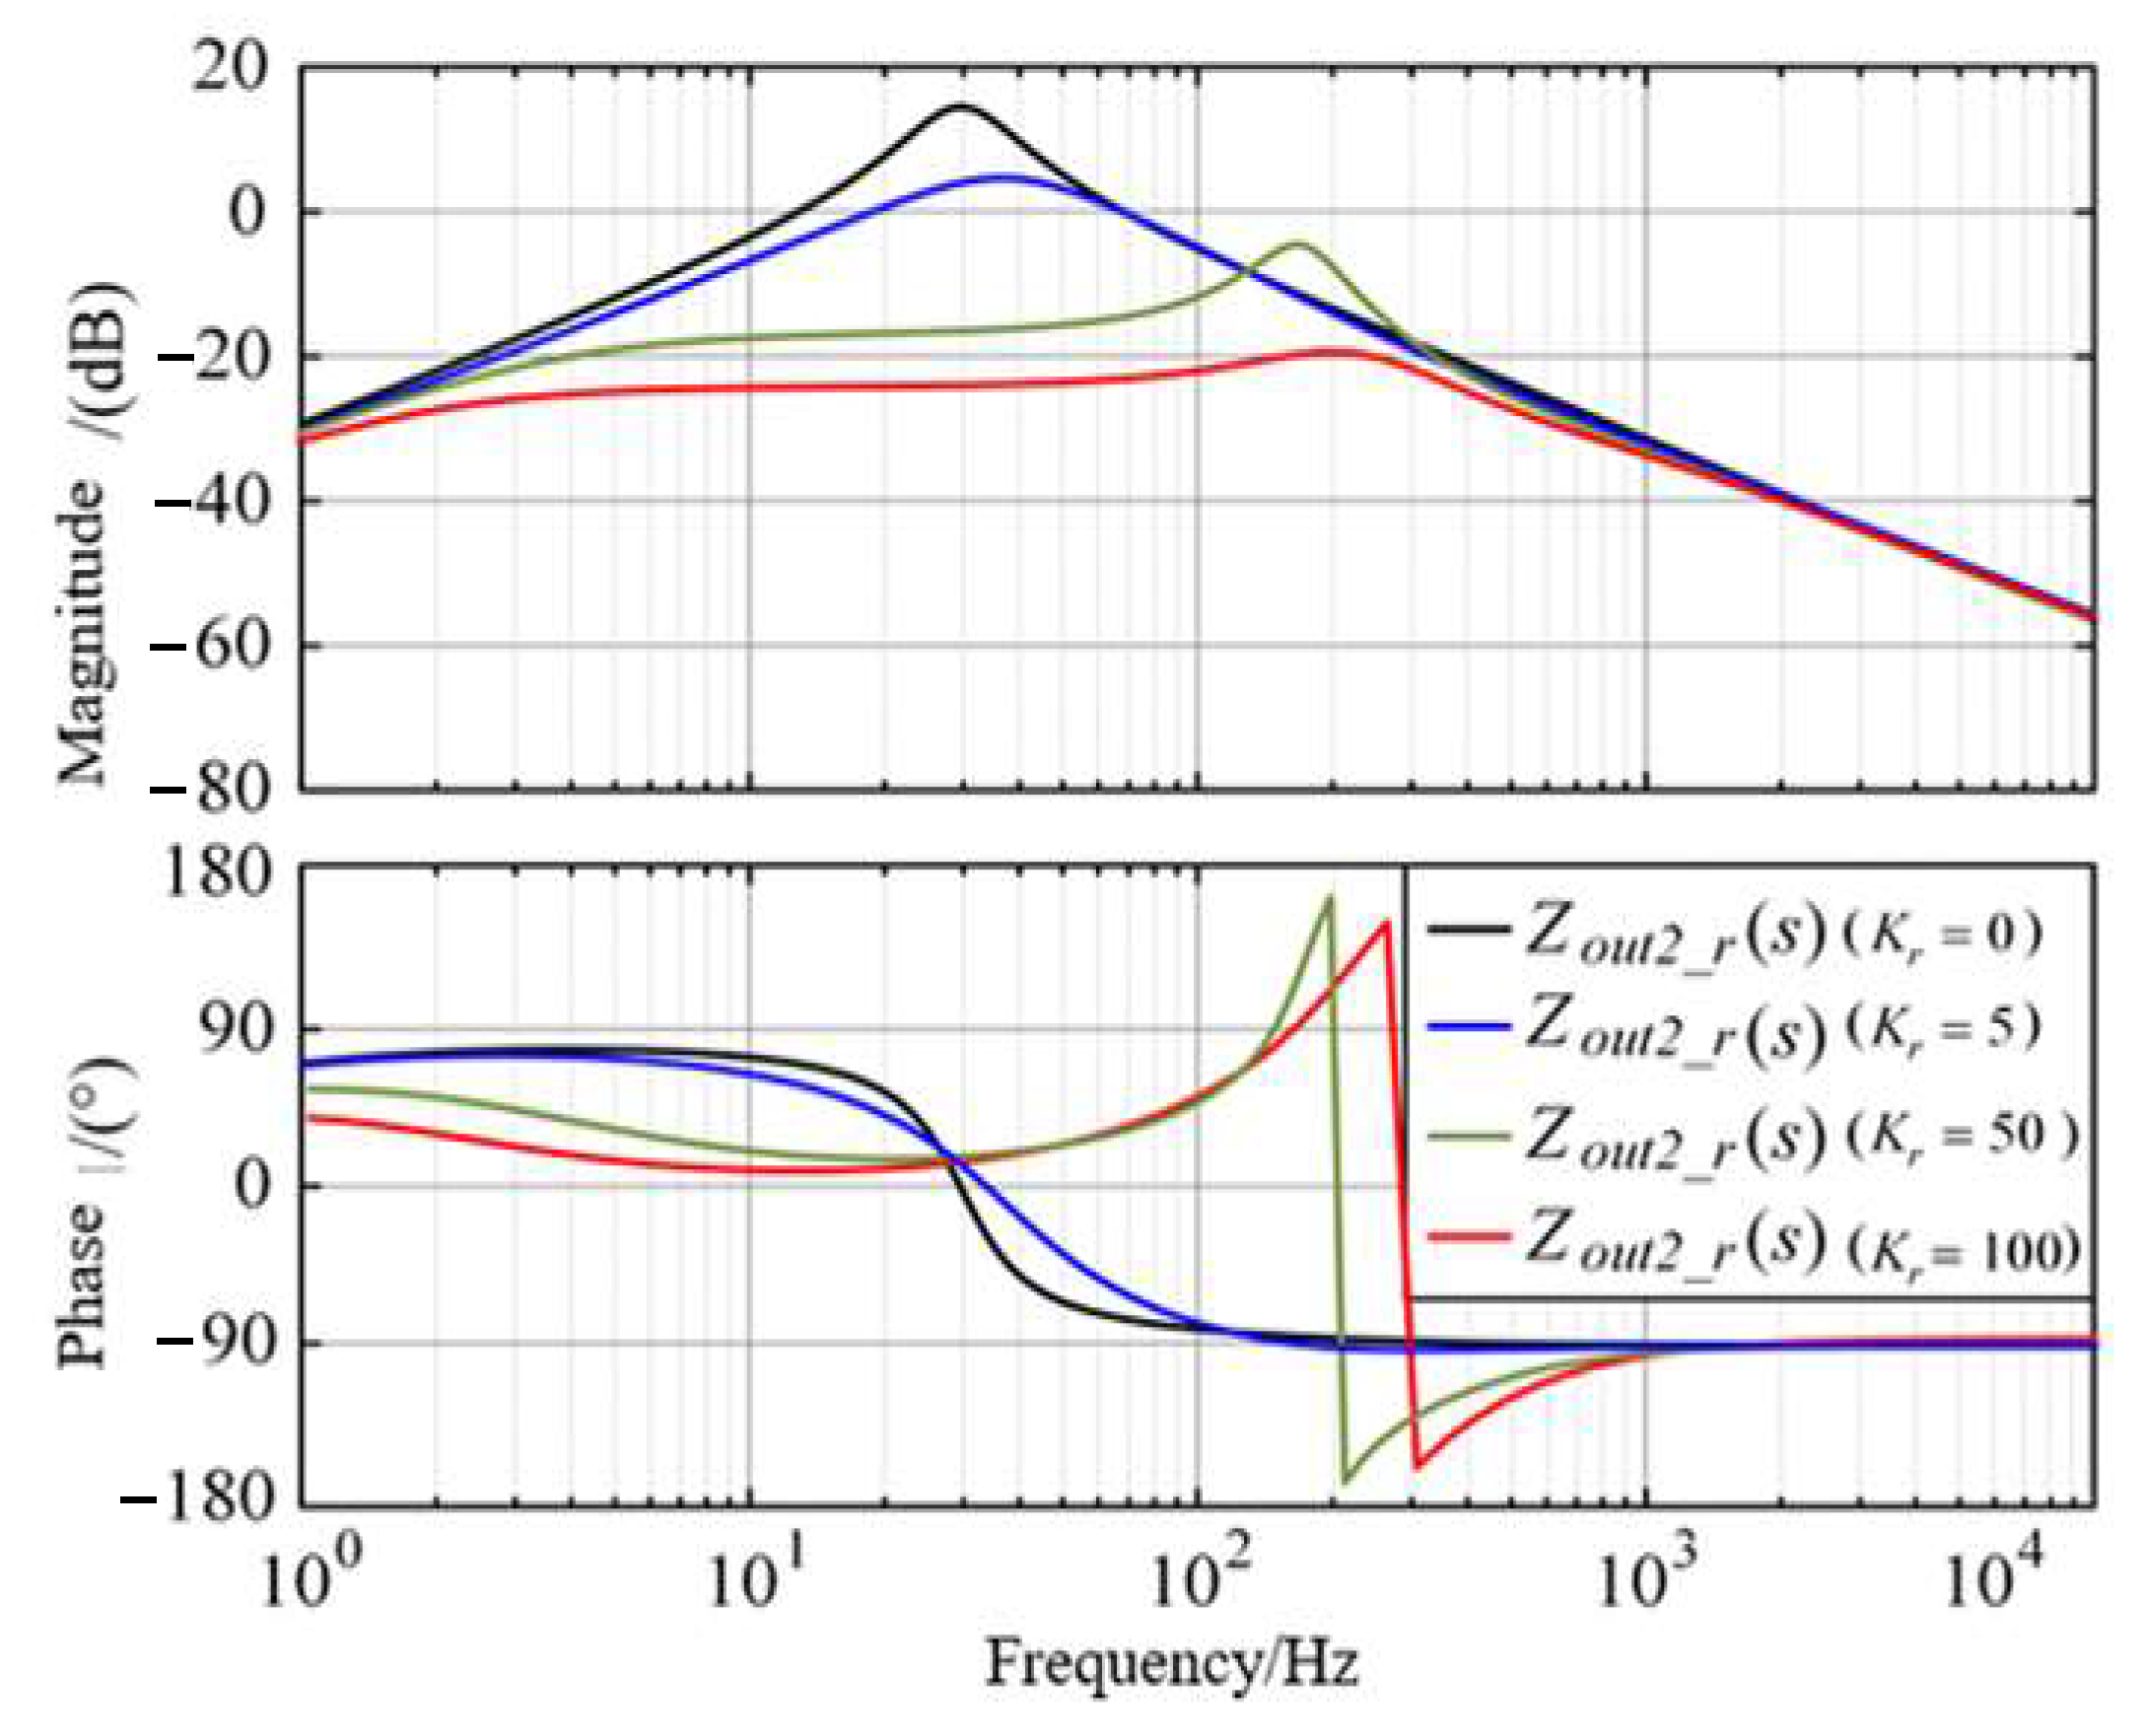
The Bode plot in
Figure 9 illustrates the variation in the reshaped output impedance
of the lithium battery energy storage unit with different values of
when
is set to 1050 kW.
From
Figure 9, it can be observed that the amplitude of
decreases with the increase in the gain coefficient
of the impedance adjuster
, indicating that the impedance adjuster
can adjust the output impedance of the lithium battery energy storage unit.
The value of
is adjusted further to tune the amplitude curve of the reshaped equivalent output impedance
of the power source side, as shown in
Figure 10.
It can be observed that the amplitude curve of the reshaped equivalent output impedance of the power source side decreases with the increase in the gain coefficient of the impedance adjuster in the frequency range of 2–40 Hz.
A Nyquist plot of
as a function of
after impedance reshaping is shown in
Figure 11. From the graph, it can be observed that when
= 0, the impedance adjuster
has no effect. At this point, the Nyquist curve of the system
surrounds the point (−1, j0), indicating system instability. As the gain of the impedance adjuster
gradually increases, the Nyquist curve of
gradually moves away from the point (−1, j0), enhancing the stability margin of the system and improving the anti-interference capability of the DC bus voltage.
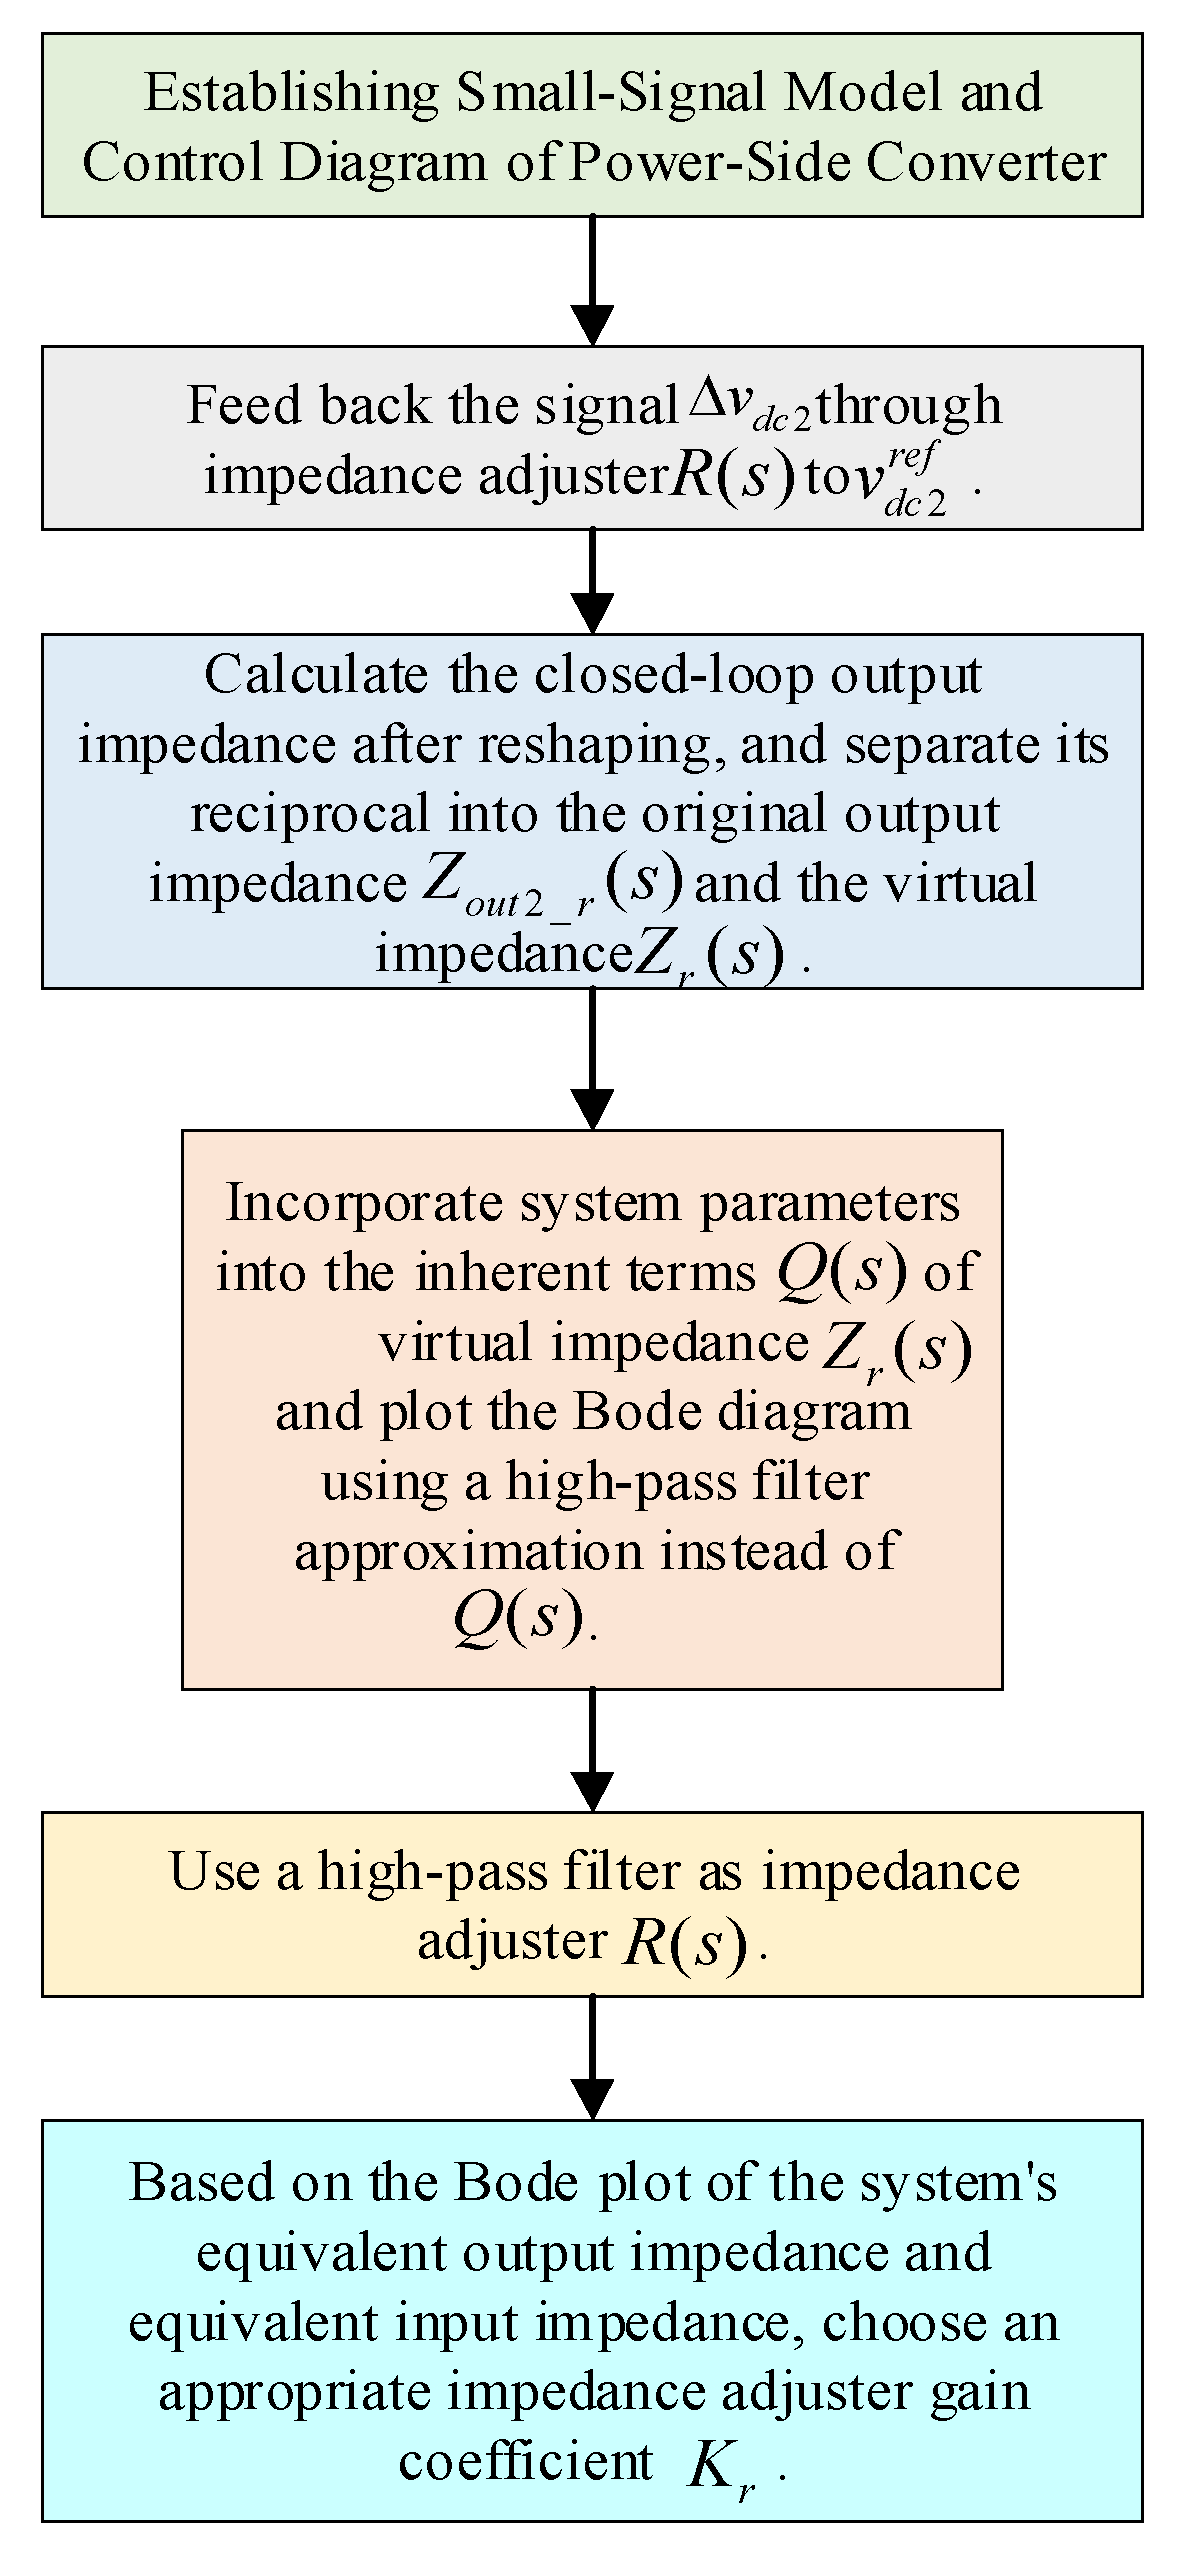
Therefore, the impedance reshaping control optimization method based on bus voltage feedback can reshape the amplitude curve of the equivalent output impedance on the power side of the DC microgrid in hybrid propulsion tugboats. A step-by-step diagram of the impedance reshaping method based on bus voltage feedback can be obtained through organization, as shown in
Figure 12.


