Article

A Corrosion- and Repair-Based Reliability Framework for Offshore Platforms

by
Mehdi Hajinezhadian
and
Behrouz Behnam
*
School of Civil and Environmental Engineering, Amirkabir University of Technology, Tehran 15875-4413, Iran
*
Author to whom correspondence should be addressed.
J. Mar. Sci. Eng. 2024, 12(3), 504; https://doi.org/10.3390/jmse12030504
Submission received: 12 January 2024 / Revised: 15 February 2024 / Accepted: 11 March 2024 / Published: 18 March 2024
(This article belongs to the Section Ocean Engineering)

Abstract

:
Offshore platforms are important infrastructures that often face severe environmental conditions, such as corrosion, throughout their lifetime. This can continuously decrease their structural robustness. Despite the availability of many anti-corrosion strategies, there is still a need for a sound management scheme that can systematically address the lifetime operation of offshore platforms under corrosion. To address this, the work here proposes a corrosion- and repair-based reliability framework for the lifetime operation of offshore platforms. A fixed offshore platform is designed based on current design codes for severe environmental conditions in a given return period, and the effect of corrosion on the structure’s serviceability is modeled. The results show that the extent of the corrosion depth and damage in different years highly affects the ability of a repair to restore a damaged element to its original design strength. The results also show that the residual reliability of the structural members under the splash zone becomes almost zero after the first 10 years of the operation period, implying that these members require quick repair strategies. This study establishes a management program for fixed offshore platforms subjected to long-term corrosion by performing reliability analyses on the components of the platforms and evaluating the maintenance of the components in the splash zone. In the absence of commonly accepted contemporary industry practice standards, this study proposes a corrosion growth model based on API-RP-2A, DNV, and NORSOK standards that can effectively evaluate code-based structural designs. The framework developed here can help offshore platform owners in their decision-making process for corrosion-based safety analysis.

1. Introduction

Offshore platforms are utilized for the extraction of oil and gas, but they encounter severe corrosion issues throughout their lifespan, which can decrease their structural strength [1] and increase the risk of a complete failure [2]. Despite the availability of various anti-corrosion strategies, managing corrosion remains a challenge due to the lack of a comprehensive management scheme, such as inadequate anti-corrosion measures, corrosion monitoring methods, and maintenance actions [3,4]. Furthermore, the residual strength and repair capability of corroded members are critical for the safety, reparability, and requalification of the platforms [5,6]. However, few studies have investigated the structural reliability of offshore platforms considering the corrosion, inspection, and repair of components [6]. Hence, it is necessary to strike a balance between cost-effective maintenance schemes and structural safety.
Previous research has explored various aspects of corrosion and its impact on offshore platforms. Corroded tubular members are more susceptible to failure under repeated loads of wind, current, and waves, which can reduce the thickness of the members and lead to a decrease in the structural bearing capacity [7,8]. For instance, Zve et al. [9] investigated the effect of corrosion on the maintenance optimization of an offshore platform. Melchers [10] highlighted the role of corrosion in offshore platforms at different service times. Bao et al. [11] analyzed the impact of zonal corrosion on the global response and reliability index of a platform, taking into account the corrosion loss in the atmospheric and immersed zones for a specific exposure period. Zhang et al. [12] explored the effect of probabilistic approaches on the structural reliability of a fixed offshore platform under corrosion in the immersed zone. Soares et al. [13] proposed the Weibull probabilistic distribution model for the characterization of zonal corrosion in offshore structures. Paik et al. [14] calibrated the parameters of the Weibull corrosion model with data measured by a specific marine structure and for a specific return period of 10 years. Bai et al. [15] determined the corrosion influence of different zones on an offshore platform. Ricles [16] and Ostapenko et al. [17] evaluated the residual strength of tubular members damaged by corrosion and showed that corroded tubular members are more prone to the initiation of failure. Du et al. [18] proposed a method for mooring lines considering the influence of marine corrosion conditions. The results indicated that the corrosion of mooring lines has a significant impact on the fatigue capacity. Wang et al. [19] proposed a novel concept that combines an offshore platform with a wave energy converter. Their study focused on the impact of wave and wind loads on the dynamic response characteristics of the offshore structure under various environmental load cases. Hajinezhadian and Behnam [20] addressed the design optimization of offshore platforms and demonstrated that code-based designs are not always optimal from a lifetime perspective.
From a different perspective, in the reliability analysis of offshore platforms, considering the gradual deterioration due to the accumulation of damage is vital as it can increase the failure risk. Therefore, assuming annual deterioration as independent, if not fully applied, will lead to an error in estimating the probability of failure [21,22,23,24]. The annual independence of damage is examined in the current study.
Based on the above studies, it can be concluded that the effect of corrosion on the structural reliability of jacket-type structures is an important research topic. In this context, this study aims to propose a probabilistic-based framework for the optimization of repair strategies in offshore platforms. It establishes a management approach for long-term corrosion by performing reliability analyses on the components. In the absence of commonly accepted contemporary industry practice standards, this study proposes a corrosion growth model based on API-RP-2A, DNV, and NORSOK standards that can effectively evaluate code-based structural designs.
To achieve this, in this study, a fixed offshore platform is designed according to API-RP-2A [25], and random time domain analysis is performed to evaluate its dynamic responses. The time histories of water surface elevation are generated from standardized wave spectrums. The time histories of loads and the structural responses are then calculated using water surface elevations. The results, including the time history of loads, are introduced as random variables for each element, and the required distributions are obtained using Easy-Fit software (v5.6) [26]. Then, using MATLAB software and available reliability analysis methods, the planned and annual reliability indexes of elements are calculated. The remaining reliability of the structure is determined based on the difference between the annual reliability of the structure during its service time and the annual target reliability and updating process based on the remaining reliability. When the remaining reliability approaches zero, the repairs are initiated. The results are modified by repairing the members until the full capacity of the corroded members is restored. The reliability index of each tubular member is determined based on the first-order reliability method (FORM) and performance functions of compression and tension, where the most likely failure mode is identified. The local buckling of structural members is considered in this study, and the members under compression and tension are checked. A Monte Carlo simulation (MCS) is used to verify the FORM as the limit state function and the FORM is linearized by the Taylor series.
Here, analysis is performed for different loading scenarios, including wave, current, and wind, e.g., forces are applied to the safe structure, and reliability indexes are estimated for offshore structure members. Then, in addition to these loadings, the local buckling caused by the corrosion is also taken into account and structural reliability is estimated in the damaged state. In this study, the structural response is evaluated using SACS [27], where corrosion is modeled by reducing the wall thickness of the members according to their position in the various corrosion zones over time. Different time-varying corrosion models are used to simulate corrosion situations based on corrosion characteristics and the measured results. The reliability of the structure in this study, expressed through the probability of failure, is evaluated for the structural components as a function of the exposure period.

2. Methodology

This paper analyzes a marine structure under environmental conditions and evaluates its probability of failure (PoF) using analytical methods [28]. The reliability analysis accounts for the effect of corrosion on maintenance over the service time, as shown in Figure 1 and explained below.

2.1. Environmental Conditions

The forces acting on a marine structure may include sea currents, wind, and waves, which may be time-dependent or uniform. The wave period, wind speed, and currents are related to the wave height. The wind forces are usually uniform and affect the upper part of the platform (i.e., deck) [29]. The current forces are also usually uniform and affect the underwater parts of the platform (i.e., jacket) [29,30]. The long-term variation in a wave climate can be represented by generic distributions or scatter diagrams for the parameters of sea states, such as significant wave height ( H s ) and mean zero-up period ( T z ) for all directions [30]. According to DNV [30,31,32], the maximum individual wave height in a random sea state can be given by Equation (1).
F H m a x h m a x = h s t z [ F H m a x H s T z h m a x h s t z ] . f H s , T z h s , t z . d h s d t z
where F H m a x is the mean annual frequency of exceedance of the wave height ( H m a x ) and f T z , H s t z , h s is the joint probability density function for the H S and the T z . Here, F H m a x H s T z h m a x h s t z is the distribution of the largest wave’s height in a storm sea state.
The maximum instantaneous wind speed is assumed to follow the Gumbel distribution [33], which has the cumulative distribution function given by Equation (2), where V is the wind velocity and μ and σ are its mean and standard deviation, respectively.
F V = exp exp K V L ; a n d   K = 1 0.78 σ   &   L = μ 0.45 σ
where the K (scale parameter) and L (location parameter) are characteristic values of the Gumbel distribution function. K and L can be calculated using μ and σ of the maximum instantaneous V, which are extracted from the numerical weather data for a specific return period at the target location.
Equation (3) expresses the relationship between the return period (T, years) and the cumulative distribution function [33,34]. Equation (4) is received from Equations (2) and (3).
F V =   1 1 T
V ( t ) = ( 1 K ) ln [ ln F V 1 ] + L
The current-induced force is obtained by combining the velocity component of the current with the wave-induced drag force. Sea currents impose a uniform flow on the underwater parts of the structure. The velocity of sea currents decreases linearly to the seabed [32]; here, the maximum current velocities can be estimated from vessel measurements near the site [35].

2.2. Reliability Analysis

The performance function or limit state function [36,37] defines the failure of a structure as the boundary between an acceptable and unacceptable performance. To evaluate the reliability or probability of failure, a specific performance function and the related load and resistance variables are needed. The performance function is generally expressed by Equation (5), where R is resistance, L is loading, and g gives the relationship between R and L and the basic random variables
G R , L = R L
The strength and loads of a structure vary randomly; hence, there is always a probability of failure ( P f ). The P f is defined based on FORM and using Equation (6) where G is less than zero or R is less than L. The FORM is used in structural analysis to compute the reliability index (β) which is defined as the shortest distance from the origin to the failure line. To determine the reliability index, the random variables are converted to dimensionless formats [38].
P f = P ( R L 0 )
It is initially assumed that every variable has a normal distribution and that the probability distribution is determined by its mean and standard deviation. Rackwitz and Fiessler (R_F algorithm) proposed a method to estimate the reliability index as shown in Figure 2. The R_F algorithm computes the performance β of a system described by a function of statistically independent random variables [39].
In Figure 2, U i represents a normally distributed independent random variable. U i * = α i * β,     μ U i means the value of the basic random variable, and σ U i is the standard deviation of the basic random variable. The mean values of the basic random variables can be used as initial values for the design points. The notations U * and U * are used, respectively, for the design point in the regular coordinates and in the reduced coordinates. μ U N means the equivalent normal distribution; σ U N is the standard deviation of the equivalent normal distribution. The loop in Figure 2 is iterated to determine a reliable β until it converges to a desired value (∆β ≤ 0.005) [20,40]. The reliability index of the i-th member, β , which is uniquely related to the probability of failure, can be expressed as Equation (7) [32,39].
β = φ 1 ( P f ) = φ 1 ( p ( G R , L 0 ) )
where φ the standard cumulative distribution is function and P f is the probability of failure of the i-th member.
As stated earlier, to validate the reliability index obtained from the FORM, the MCS is employed which is based on generating a sequence of random numerical values for the probability distribution of each statistical variable. By defining a counting function j for the limit state function, integration is performed over the failure function of the structure. This function takes a value of 1 in the failure regions and 0 in the intact regions 1 [38], as given in Equations (8)–(11).
J X = 0                               G x > 0         1                                 G x 0          
Based on the definition of the counting function
P f = G x 0 f x 1 x n x 1 , , x n d x 1 d x n 1 N i = 1 N J X i
Based on Equation (9), the probability of failure is equal to the ratio of the number of samples located in the failure area to the total number of simulated random samples (N), similar to the relationship expressed in Equation (10).
P f ^   N u m b e r   o f   t i m e s   t h a t   G ( x ) 0 N
The standard deviation of failure probability is determined using Equation (11).
S = P f ^ ( 1 P f ^ ) N
It is worth noting that the accumulation of damage reduces the remaining strength of the structural members or its overall capacity which can increase the failure risk. The cumulative PoF over t years can be expressed using Equation (12) [20].
P f t = 1 k = 1 t [ 1 P f a ( k ) ]
where P f a k is the annual PoF in year k. Although maximum annual storms can be considered independent, the accumulation of damage in the structure and its deterioration are not so; hence, this assumption does not fully apply, and the approximation of the P o F in Equation (12) is conservative. If Z is the number of mutual damage modes considered in the dynamic analysis, then each damage mode can be defined by the level of corrosion damage in a set of elements. Hence, the P f a in year t can be expressed via Equation (13) [20].
P f a t = [ P f a , 0 ] [ P z d t ] + i = 1 Z [ P f a , i ] [ P d i t ]
where P f a , i is the annual conditional failure probability concerning damage state i, P f a , 0 is the annual conditional failure probability concerning the absence of damage, and P d i ( t ) is the probability of occurrence of damage state i in year t. In Equation (14), P z d t refers to the probability of no damage in year t.
P z d t = i = 1 Z [ 1 P d i ( t ) ]
Finally, the annual reliability index ( β a ) for design lifetime is calculated using Equation (15) [20].
β a = φ 1 1 P f a ( t )
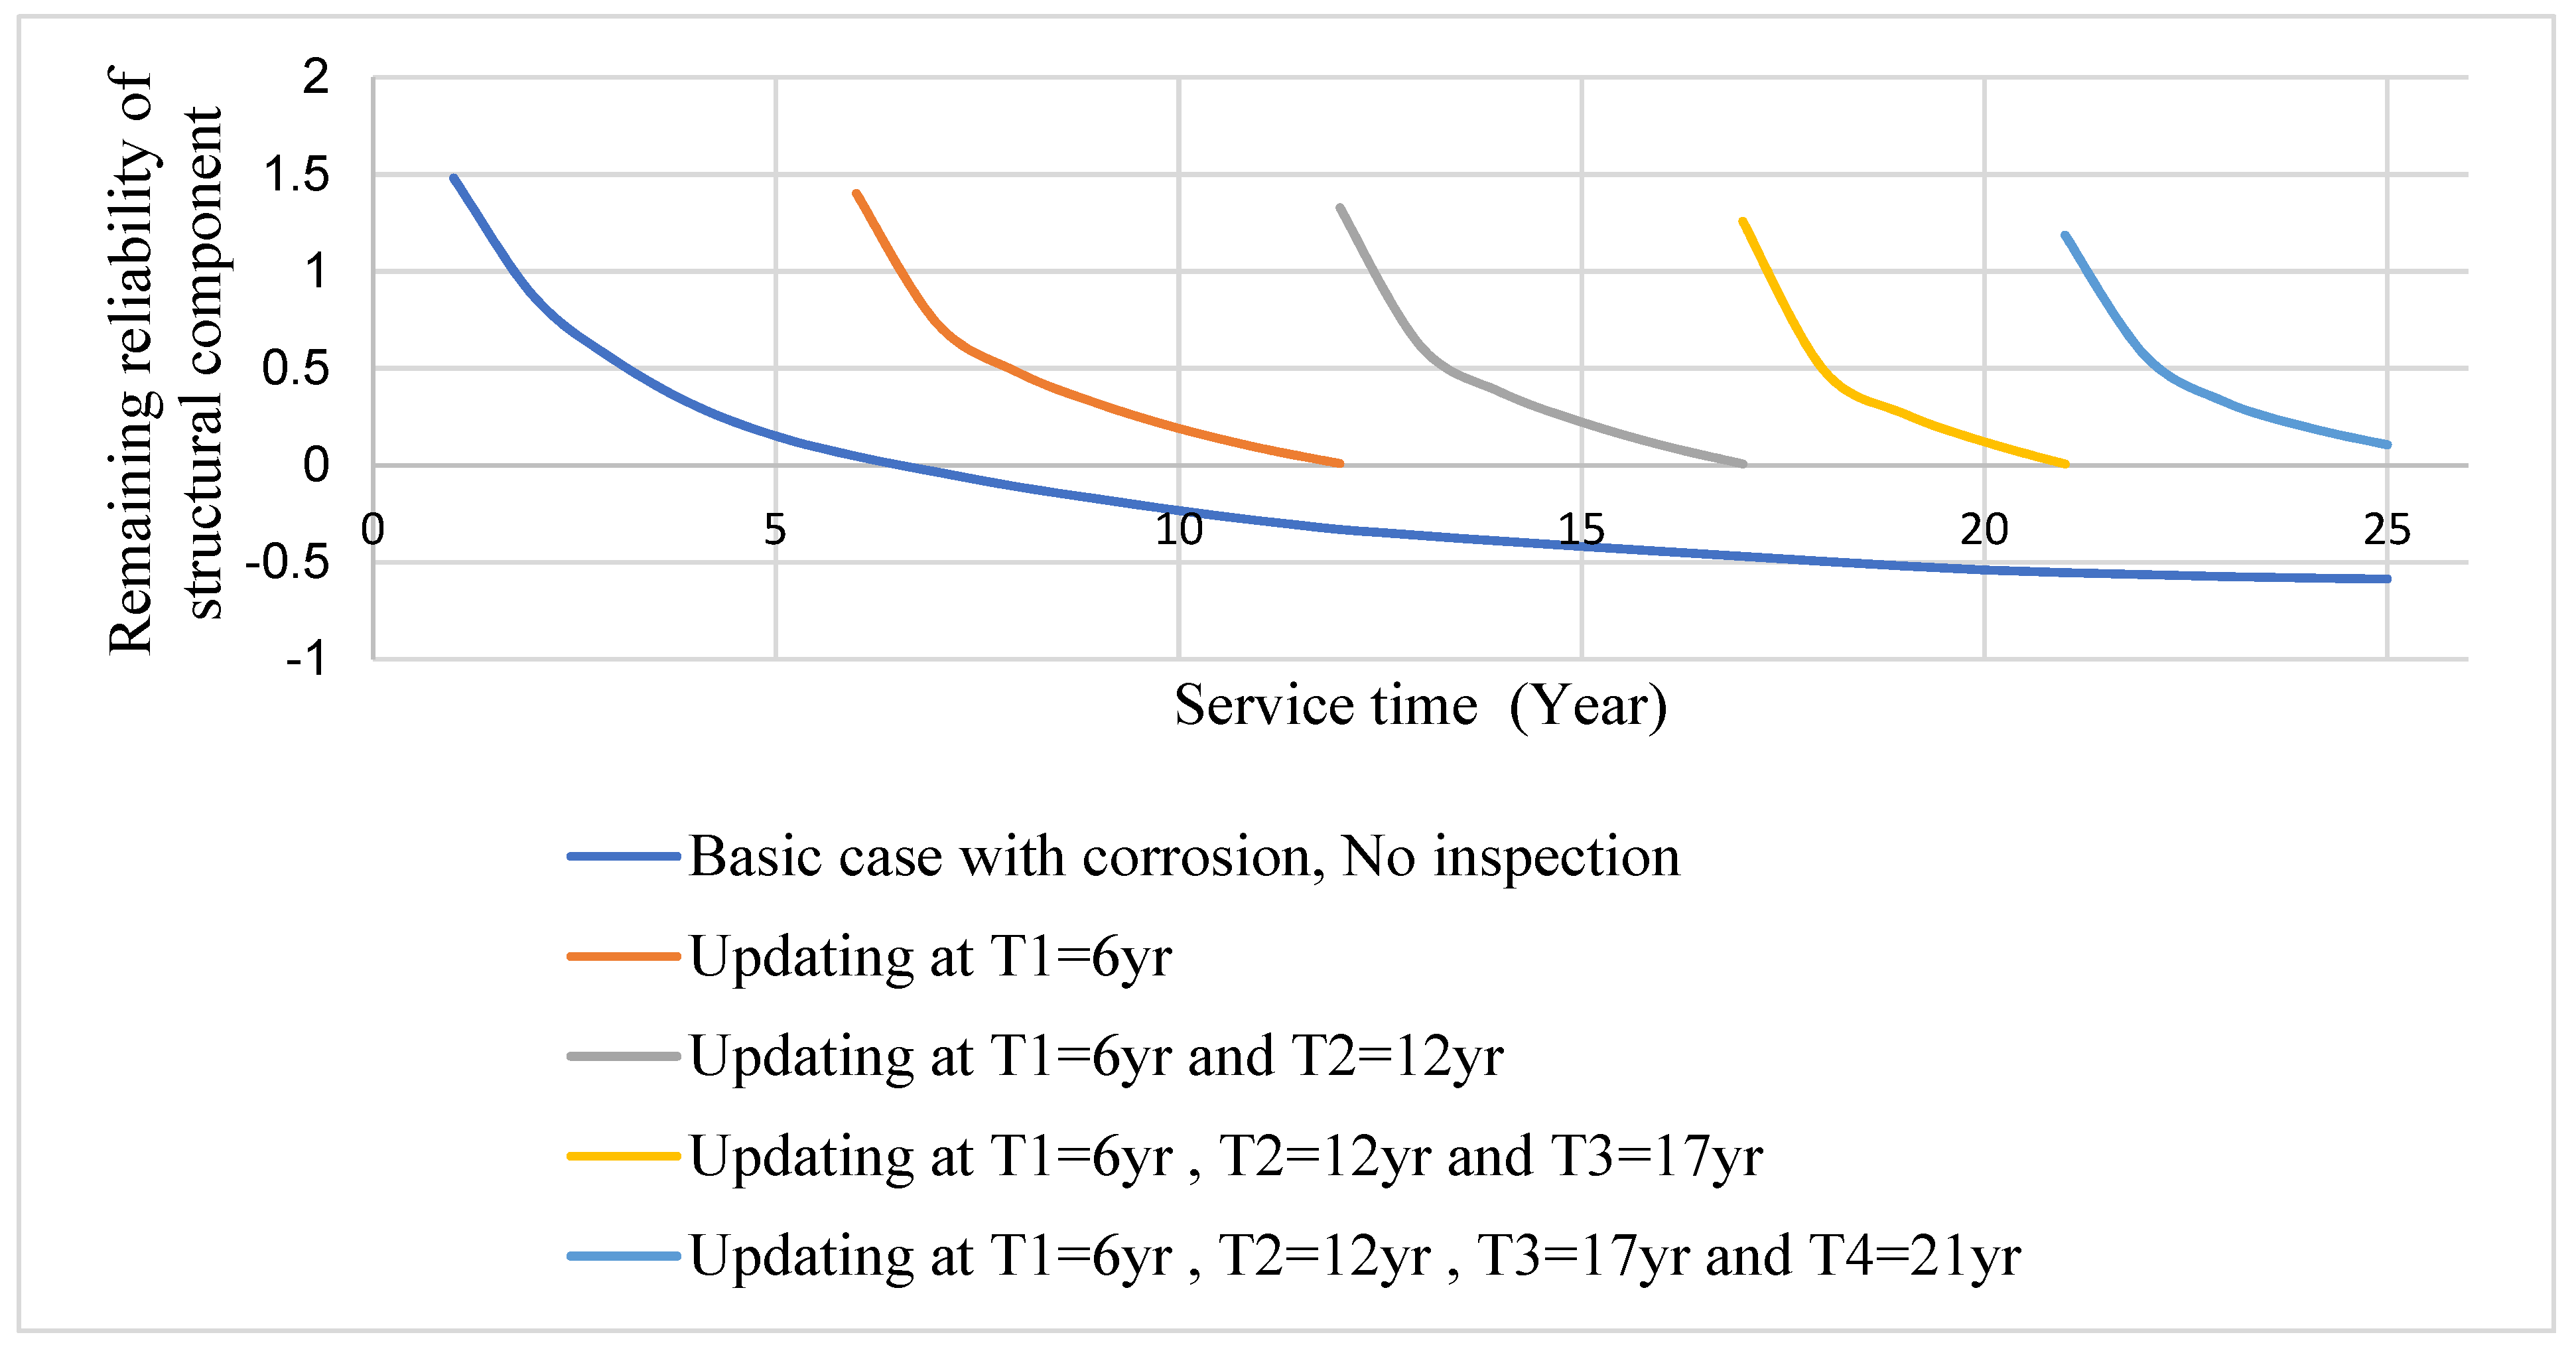
Target reliability is the minimum level of reliability that the offshore should maintain during its service time. It depends on the consequences and types of failure events that may occur. Target reliability can be calibrated using well-established cases with adequate safety. If not, previous studies based on the consequence and failure class can be used. The remaining reliability of structural components is the difference between the annual reliability and the annual target reliability [40]. The annual reliability of the i-th element (Rt) in service time t is the reliability index obtained by subtracting the PoF in two consecutive years. The minimum annual target reliability of the i-th element (RT) is the reliability index from the annual PoF. The remaining reliability of the i-th element (Rrem) is given by Equation (16).
R r e m = R t R T
when R r e m approaches zero, P f increases. In this situation, any action, as well as decreasing loads on the structure or increasing the strength of the structure, can be used to improve the R r e m .
Reliability updating is a method to improve the accuracy of the reliability assessment of structures by incorporating additional information from inspections, measurements, or tests. Reliability updating can help optimize the maintenance of offshore structures by reducing uncertainties and identifying critical components. Different approaches to reliability updating exist. The choice of approach depends on the type and amount of additional information available and the structural details considered. The PoF of a specific element can be updated using additional information such as response measurement and damage detection. These can be modeled as events or variables [41]. The updated PoF ( P f u p ) can be calculated using the conditional probability in Equation (17).
P f u p = P [ G 0 E ] = P [ G 0     E ] P [ E ]
where E is the possible result from the inspection which is discussed in the following section. It should be noted that Equation (17) is a general updating formula that can be applied to the inspected elements. G is the safety margin (the boundary limit function). Otherwise, the inspection information from inspected elements is applied to the uninspected elements updating. The information can also be used to update the basic variables. This kind of updating PoF can be calculated by replacing the updated random variables in the new safety margin [41].

2.3. Effect of Corrosion

Corrosion reduces the ultimate strength of offshore platforms, but it is not a separate limit state [5,8]. Most corrosion theories are based on general rules for short-term corrosion under ideal conditions. They do not provide practical information on how corrosion affects structural resistance under specific conditions [42]. Thus, predicting future structural performance requires a reliable degradation model. The model should account for the uncertainty in the corrosion factor as a random variable in the reliability analysis.

Probabilistic Weibull Corrosion Model

The corrosion rate of steel varies depending on the location of the platform [43,44]. Corrosion can be classified into three zones: the subsoil zone, the submerged zone, and the splash zone [5]. The subsoil zone is the part of the platform that is buried in the seabed. The submerged zone is the part that is always underwater. The splash zone is exposed to seawater splashing and air. The splash zone has the highest corrosion rate, followed by the submerged zone and the subsoil zone. The data from the previous studies on offshore platforms show that the corrosion depth of steel components in the splash zone increases slowly at first, then faster in the middle, and then slower again at the end [45]. This means that the corrosion rate is not constant over time. However, when no data are available, previous studies have assumed that the corrosion rate is linear over time [14,15,45]. Paik et al. [14] divided the corrosion process into two sections (the noncorrosive section, t ∈ [0,Tt0], and the corrosion section, t ∈ [Tt0,TLS]). Here, the corrosion rate is defined using Equation (18).
R t = 0                                                                                                                                                                                 0 t T t 0     D   γ ϑ [ ( t T t 0 ϑ ) γ 1 ] ×   e x p [ ( t T t 0 ϑ ) γ ]           T t 0 t T L S
The time-related variation in corrosion thickness is defined using Equation (19).
D t = 0                                                                                                             0 t T t 0     D × 1 e x p [ ( t T t 0 ϑ ) γ ]           T t 0 t T L S
where D(t) is the corrosion thickness at time t, and D is the ultimate corrosion. Tt0 shows the corrosion starting time, and TLS refers to the lifetime design of the platform; ϑ and γ are, respectively, the scaling and shape parameters [15].

2.4. Reliability Index of Tubular Member’s

The corroded elements are evaluated as undamaged elements with reduced thickness. The failure probability of the structure is calculated based on the failure criterion [
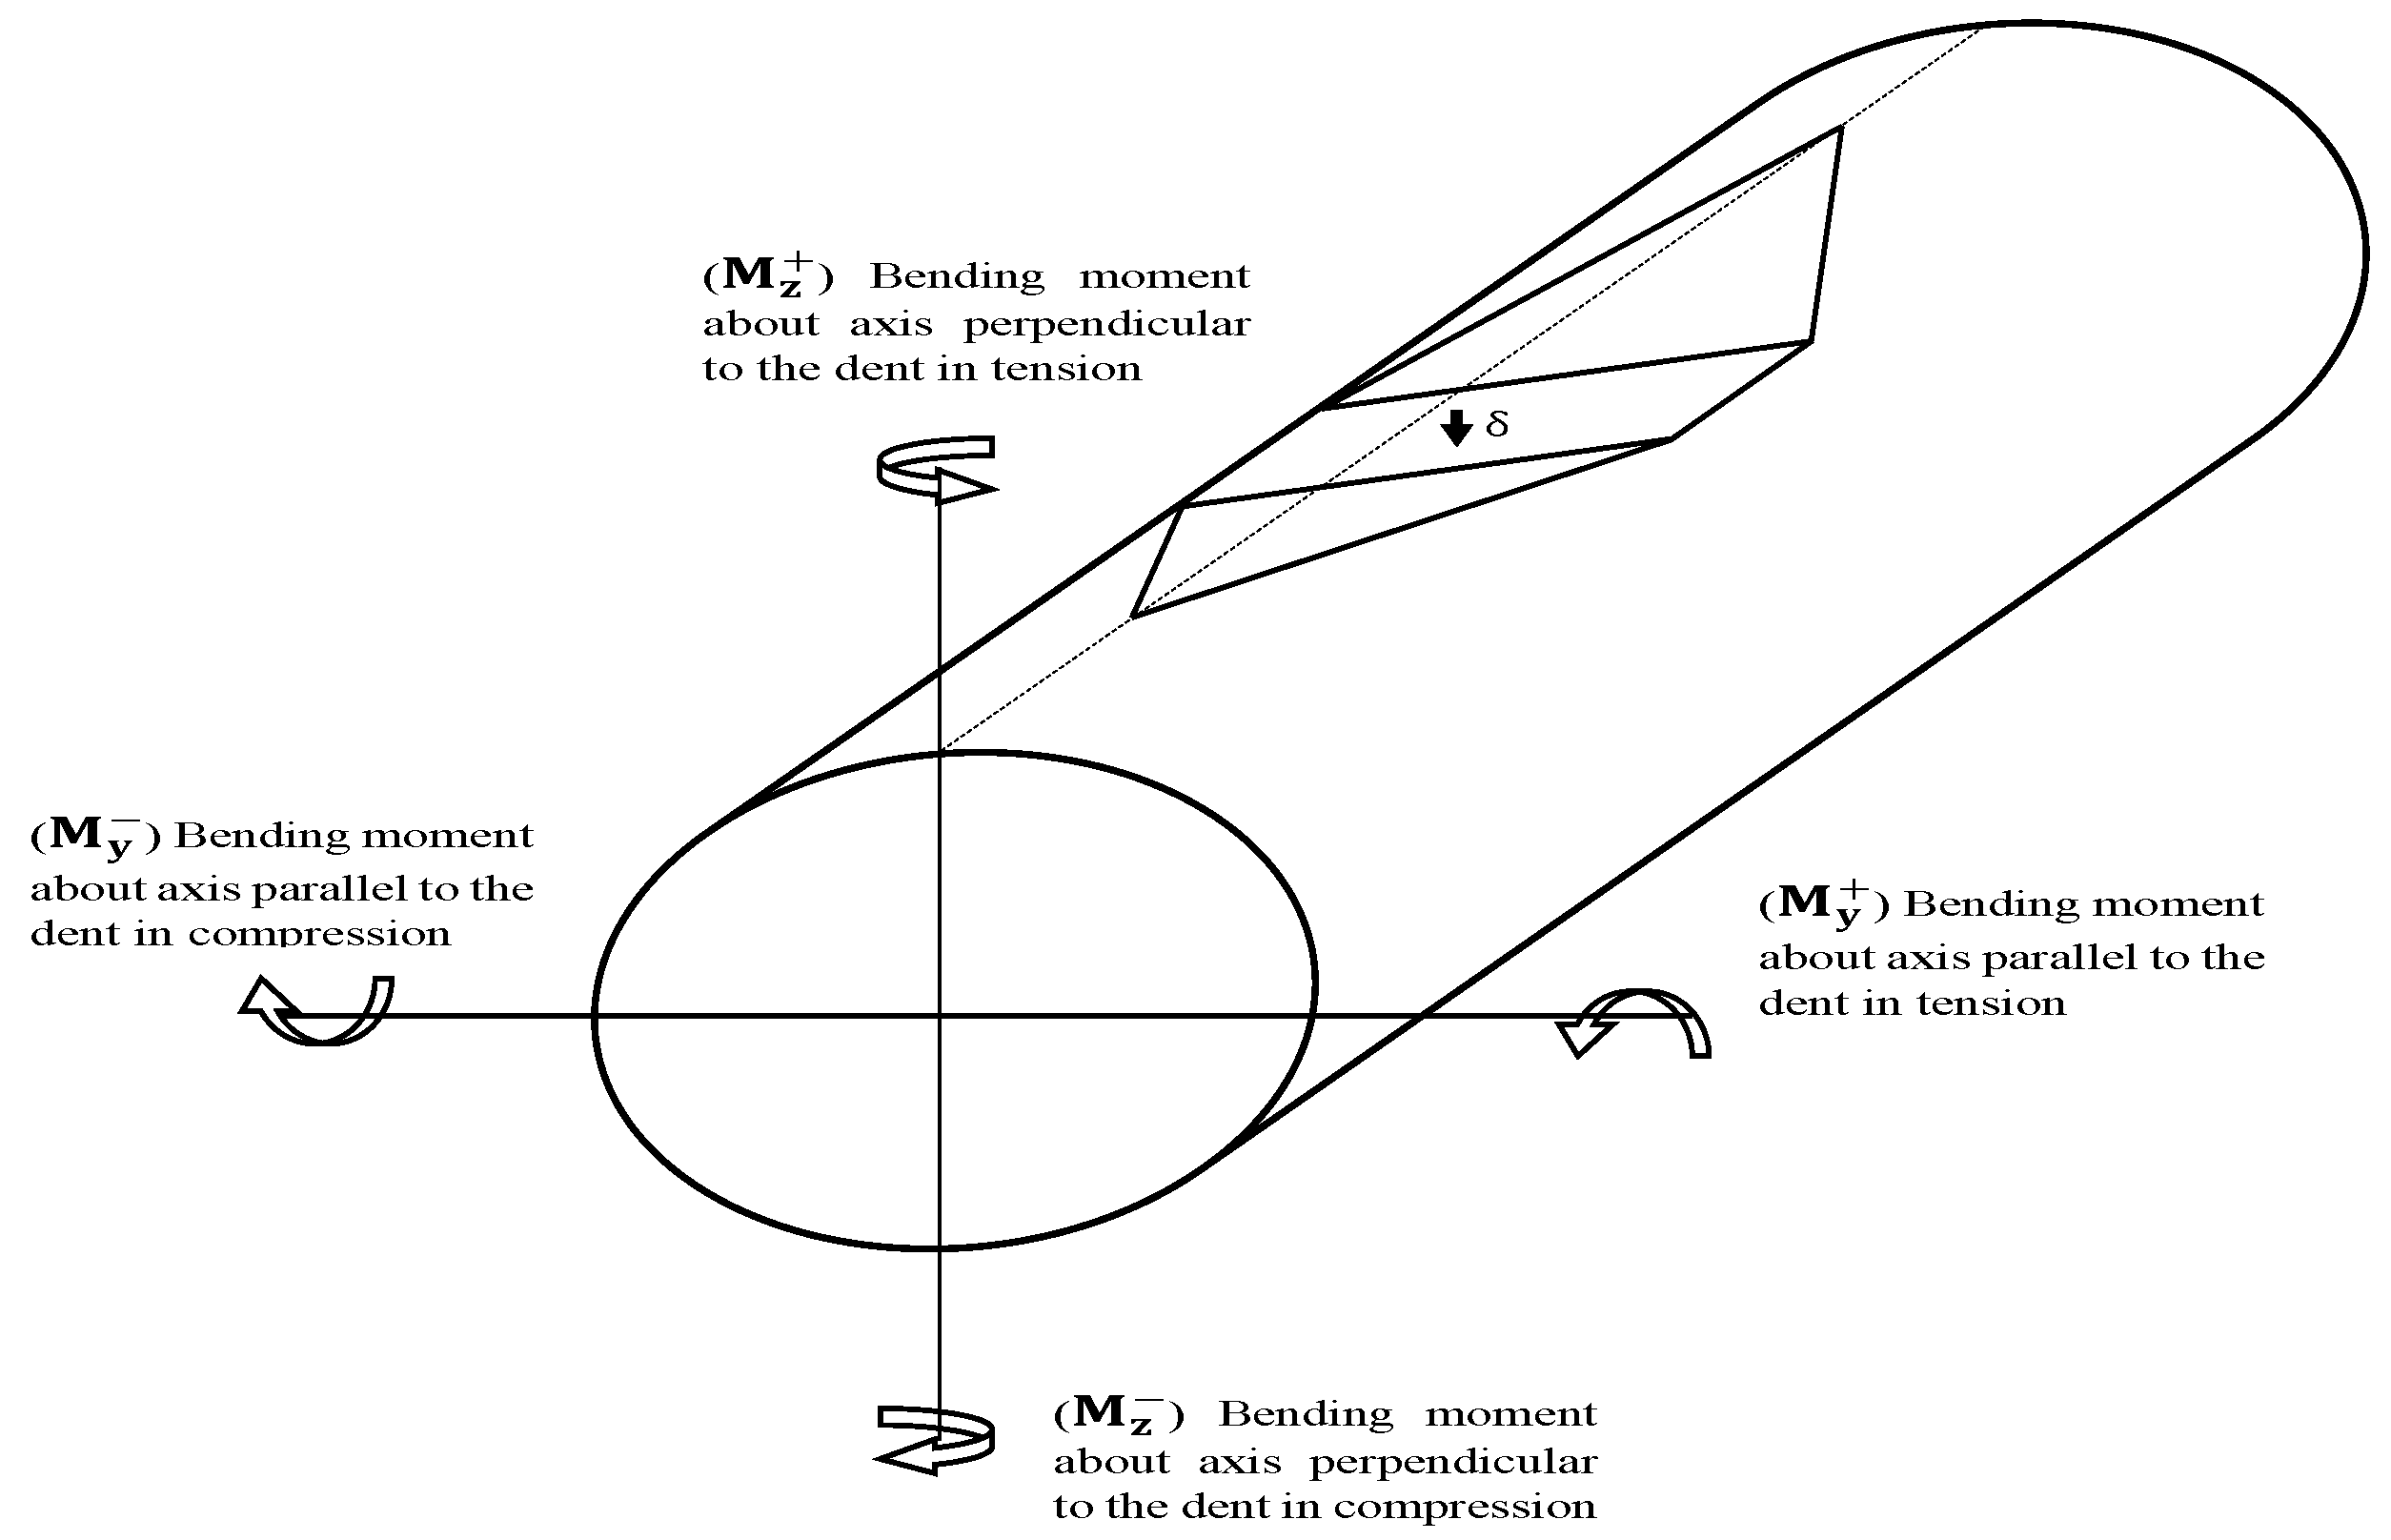
46]. The structural element is a failure index under the combined effect of axial force and bending moment in two directions. The buckling of structural members is checked for both compression and tension states using two performance functions. The dented tubular elements are assessed for axial tension and compression loads, as well as combined axial and bending loads. The limit state function for the dented tubular members under combined axial tension and bending is given by Equation (20). The limit state function for the dented tubular members under combined axial compression and bending is given by Equation (21) [46,47].
G = 1 [ N S d N d e n t , t ,   R d + M y ,   S d M d e n t , R d 2 + M z ,   S d M R d 2 ]
G = 1 N S d N d e n t , c , R d + C m y M y , S d 1 N S d N E , d e n t M d e n t , R d 2 3 δ D + C m z M z , S d 1 N S d N E M R d 2
where N d e n t , t , R d ,   N d e n t , c , R d ,     N S d ,   M d e n t , R d , and MRd are the axial force tension capacity of the dented section, the axial force compression capacity of the dented section, the axial force on the dented section, the bending capacity of the dented section, and the design bending capacity of undamaged sections, respectively. M y , S d , and M z , S d , are the design bending moment about an axis parallel to the dent (y-axis) and the bending moment about an axis perpendicular to the dent (z-axis), respectively (see Figure 3). δ , and D, are the equivalent dent depth and the tube diameter, respectively. Cm is the co-existence coefficient of the maximum moment with secondary moments, NE is the Euler loading moments, and N E , d e n t is Euler buckling strength of the dented section, for buckling in line with the dent.

2.5. Repair of Tubular Members

The damaged members need to be fixed so that they can resume their designed function for the expected operation time. There are various repair methods for offshore tubular members but these are classified into two main types: replacing/renewing or strengthening [47,48], depending on how severe and extensive the damage is. The owners of the offshore platform and the design engineers decide on the suitable repair method based on the damage severity, repair cost, etc.

Reliability Updating through Repair

The accuracy of estimating the thickness change affects the reliability of assessing corrosion damage. The structures’ reliability is not necessarily improved by an inspection, but it allows for taking corrective actions. It is presumed that the material parameters and initial corrosion size have the same distribution, but are not statistically related. The failure event may need to be changed after repair, as explained later. If corrosion is found, measured, and fixed, the material’s statistical properties are expected to have the same size, but not statistically depend on each other. The repaired members’ ultimate strength should be assessed using a reasonable engineering method. Rather than detailed analyses, the resistance of a fully grouted tubular in combined tension and bending may be evaluated by Equation (22), ignoring the grout effect, or by Equation (23) if the tension’s maximum stress is small compared to the bending component’s [47].
( N S d N t ,   R d ) 1.75 + M y ,   S d M R d 2 + M z ,   S d M R d 2 1
    M s d M g , R d = W t r   .     f b g γ M
where M s d ,   M g , R d ,   W t r ,   a n d   f b g are the design bending moment for the grouted section, the design bending resistance of the grouted member, the elastic section modulus of the transformation, and the characteristic bending strength of the grouted member, respectively. The resistance of fully grouted tubular members under combined axial compression and bending is assessed to satisfy Equation (24):
N s d N c g , R d + T 1   M s d M g , R d + T 2 ( M s d M g , R d ) 2     1
where N s d ,     N c g , R d , M s d , and M g , R d are the design axial force on the grouted section compression positive, the design axial compression resistance of the grouted member, the design bending moment for the grouted section, and the design bending resistance of the grouted member, respectively. Detailed information can be found in NORSOK [47].

3. Structural Model

A sample offshore platform located in the Persian Gulf is investigated here. The jacket has four tilted bases with slopes of 1:6 and 1:7 and weighs 1600.0 T. It is designed for a water depth of about 65 m. The jacket has four legs in a 2 × 2 grid. The dimensions are 14 × 24 m at the top and 33 × 35 m at the midline. The leg members above the seabed are considered and the jacket is fixed at the seabed [20,49]. The deck has a four-story building and weighs 2000 T. The weight is applied as 500 T on each joint along the z-axis. Table 1 summarizes the material properties of the jacket and deck. Table 2 gives the dimensions of the members. The jacket has five stories with diamond braces and X-braces between floors (see Figure 4). Figure 4 also shows the height codes of the platform relative to the lowest astronomical tide (LAT); here, the splash zone is from EL (−) 3.20 m to EL (+) 4.80 m. The proposed method is tested for the jacket structure with 108 members, as shown in Figure 5.
Here, the gravity and environmental load conditions are considered in the design process. In practice, the design of the offshore platform structure is determined for a specific return period (e.g., 100 years).
In this study, the mean annual occurrence of significant wave height is directly extracted from metocean data at the platform location. Using Equation (1) and data from the Glenn Report [32], the results for the Persian Gulf platform location are presented in Figure 6. This figure is used to predict the maximum wave height (Hs) in the region [31]. From a probabilistic perspective, Figure 6 shows that very high wave heights may occur in this area, but with a low probability of occurrence. It also shows the relationship of log F H m a x h m a x and H s .
Table 3 gives the scale and location parameters (K & L), which can be determined using the mean values (μ) and standard deviations (σ) of the maximum wind speed (V). These values are extracted from numerical weather data covering a 100-year period at the specified location in the Persian Gulf. The extreme wind speed results are summarized in Table 4. Based on records obtained from a buoy near the offshore platform location, the maximum speed of sea currents is measured. The design’s sea current speed is selected using site-specific statistics. Moreover, the presented wave hazard curve allows for estimating the probability of occurrence for specific return periods; the values of Hs and TP are then summarized in Table 4.
The maximum water depth at the offshore platform is taken as the LAT level from the seabed plus values of mean highest high water (MHHW) and 100-year storm surge, as given in Table 4. Marine growth increases the structure weight, hydrodynamic drag, added mass, and surface roughness. The effect of marine growth is based on Table 5. The sea current, wind, and waves are assumed to be in the same direction for all states. This simplifies the design load case DLC 1.2 in IEC 61400-3 [20,48] and gives conservative load results. The wave forces on the jacket and the marine growth are calculated using Morison’s equation [49,50]. The model uncertainty of Morison’s equation is considered by varying the drag (CD) and inertia (CM) coefficients in the dynamic analysis. The coefficients are 0.7 and 1.8, respectively, in the Persian Gulf. The jacket design follows API-RP-2A and uses the extreme mean wind at 10 m above the still water level [49,50]. Table 6 summarizes the dead and live loads.

3.1. Corrosive Depths of Tubular Components

It is assumed that the reduction in the cross-section’s brace wall thickness and the chords is uniform [41]. The corrosion rate of a steel element is modeled by a reduction factor to the thickness, which varies over time. Since no report is available on the corrosion of offshore platforms in the Persian Gulf, this paper uses the corrosion data of the No. 8 China offshore platform [45]. Equation (25) and Table 7 show how to calculate the corrosive depth in different zones based on the tubular parameters [39,42].
D ( t ) = 0.05 t                                                                                                                           S u b s o i l   z o n e 10 1 exp t 20.9153 1.8052                                                                                           0.0516 t                                                                                         S u b m e r g e d   z o n e           S p l a s h   z o n e
Table 7 shows that the corrosion is fast at first, then slows down, because the corrosion mass protects the steel surface. The platform has three zones: the subsoil, submerged, and splash zones. The zonal corrosion model shows that the corrosion depth is smallest in the subsoil and submerged zones, and larger in the splash zone. The Paik model predicts higher corrosion depths than the zonal model for the service period. The annual corrosion problem is to minimize the total structural mass loss under various constraints, as given by Equation (26).
L o s s   m a s s = k = 1 N i ρ A k ( x ) L K
where x represents the vector of jacket member dimensions, i.e., diameter and thickness, A is the vector of crosssection area, L represents the length of each member, and N i represents the total number of members, which is 108 here.

3.2. Dynamic Response and Reassessment of Tubular Member’s Reliability Index

To determine the statistical parameters related to the axial force and bending moment of offshore platform members, the structure is analyzed in the presence of random wave force. To this end, the structure is dynamically analyzed using the time history method, which models the sea platform response as a function of time [20,51,52,53,54,55].
The modal analysis is first performed to extract dynamic characteristics. Given the complexity of the structure, the matrix condensation method is applied to reduce the stiffness and mass matrices of the model. The added mass is automatically generated by SACS and depends on the member’s size and proximity to the free surface. Next, the entrapped mass is calculated for the designated members. The program accounts for hydrodynamic effects due to marine growth, as well as the impact of steel corrosion during the structure’s lifetime. Corrosion is modeled using a uniform thickness loss for each member. The wave response module is utilized in random wave mode to analyze the dynamic response of the structure, considering its three-dimensional model and dynamic characteristics.
In the second stage, time-domain solutions are required. For random time-domain simulation, a specific wave spectrum is first selected, and the water surface profile is then generated. If the wave height excitation is expressed in the form of spectral density, it becomes necessary to transform this design spectrum into an ensemble of representative time histories. Considering the geographical conditions of the Persian Gulf, this study employs Stokes’s fifth wave theory and the Pierson–Moskowitz spectrum to characterize the sea elevation process for simulating random waves. In the random wave procedure, the Pierson–Moskowitz spectrum is specified with a time duration of 1800.0 s. The wave spectrum is divided into separate strips, each with a center frequency corresponding to one of the possible wave components. These strips are then combined so that each lumped strip contains at least the minimum portion of the allowed spectrum. Accordingly, the amplitude spectrum is calculated, and the surface profile is generated. The effects of a steady horizontal current are included in the random wave analysis. Input data related to the spectrum, including significant wave height and peak period, are provided, and the resulting surfaces of the random wave simulations are produced.
After making surface elevations, time histories of the applied hydrodynamic loads are produced. Time histories of the structure response are achieved using the numerical time-domain integration. To this end, the random wave module is used and structural responses are calculated at each 0.25 s interval; the outputs include the bending moment in the y and z directions ( M y & M z ) and the axial force ( F X ) where they are introduced as random variables for each member. Supplementary Materials gives the time history of M Y , M Z , and F X for Member # 5, as well as the wave spectrum, the water surface elevation, the total hydrodynamic force, the modal coordinates, the modal velocities, the modal accelerations, and the generalized forces.
In the fourth stage, the probability distribution function of the random variables is determined. The Easy-Fit software (v5.6) is employed to analyze the data of the random variables and choose the best distribution for them. Five different distribution functions are considered for each variable: Uniform, Exponential, Normal, Log-Normal, and Weibull. Then, the best probability distribution for each variable is selected and scored based on a comparison of the data distribution function via the Chi-square test [56,57,58,59]. Table 8 shows the parameters considered for the different PDFs of each random variable.
In the fifth stage, the failure mode is determined, which is defined by two performance functions, compression and tension. Here, the diameter and length of the elements are deterministic, while the other variables are random. In the sixth stage, the reliability index for each member is calculated using MATLAB and FORM via two performance functions, where the lowest value is taken as the critical reliability index. The critical annual reliability index for each member is then computed over the lifetime. Then, the MCS method is used to verify the FORM.
In the seventh stage, the remaining reliability of the member is determined based on the difference between the annual reliability of the structure during its service time and the annual target reliability. The structural reliability for offshore platforms has been estimated and compared with the target reliability suggested by DNV in many previous studies. Here, the minimum annual target reliability (RT) is 2.32 [20], which depends on the type of consequence of failure and class of failure (see Equation (16)).
In the eighth stage, the updating process and repairing of the members are determined when it starts and when the remaining reliability becomes zero (see Equation (17)). On the other hand, when the remaining reliability approaches zero, the repairs are initiated. The results are modified by repairing the members until the full capacity of the corroded members is restored. In the ninth stage, the repairing process of the member is determined. In this study, it is presumed that the damaged elements were repaired with a grouted sleeve (see [61,62,63]). In general, when R r e m > 0, the platform does not need any repair, because it still has enough load-bearing capacity to perform its function. Moreover, there are no widely accepted industry norms, standards, or guidelines that specify when to fix the damaged tubular elements, as the potential consequences range from a minor dent to a significant deformation. Therefore, a repair criterion based on the remaining structure reliability is suggested, using the exceedance diagrams of the damage features along with the remaining structure reliability acceptance criteria. The FORM can also effectively estimate the behavior of the repaired element with D/t ratios of 46 or less. The parametric studies show that grout repair can restore an element to its original strength if the corrosion or dent depth is less than about 0.15D [62,63].
At the final stage, the updated reliability index for each repaired member is determined. Since each member is individually affected by constant corrosion, it is necessary to monitor the changes in axial forces and bending moments during the inspection period and under the applied loads. The new random history of the axial forces and bending moments is used to re-evaluate the new probabilistic parameters and the probability distribution function and to calculate a new reliability index. Finally, the updated reliability index for each repaired tubular member is obtained.

4. Reliability Prediction Results and Discussion

Based on Equation (26) and the parameters of the tubular members, the total weight estimation of corrosive components in different areas of the platform is shown in Figure 7, which presents the considered the weight errors and their impact on reliability.
Although the proposed model shows a significant difference in the corrosion rate of different parts, the total amount of mass loss due to corrosion in all members calculated by the zonal corrosion model (25.8 T) is close to that by the Paik model (24.4 T) if the service lifetime is less than 17 years. However, for a service period of more than 17 years, the predicted steel loss rates show a large scatter.
The most prominent feature of the proposed time-variant zonal corrosion model is to capture the potential switch of weak location and resulting failure path of corroded jacket offshore platforms, although the proposed model needs further calibration by more reliable in-field-measured data.
Given the absence of reports on the corrosion of a similar platform in the region, this study trusts reliable in-field data from the China offshore platform. A zonal time-variant corrosion model is developed to evaluate the remaining reliability of members within a jacket, using both the measured data and theoretical methods.
Table 9 and Table 10 show the results of the FORM for Member # 5 when it is under pressure and tension.
The limit state function depends more on the variable M Y than on the others because the design point is farthest from the mean value when M Y is the largest. Offshore platforms have multiple degrees of freedom and can vibrate in different ways. The structure is analyzed for the worst-case scenario (a 100-year event). Table 11 shows the first 10 vibration periods and the reliability index for each mode. The reliability index is the smallest for the first mode and the largest for the sixth mode. The vibration period increases as the element deforms, but this does not affect the reliability index.
The results in Table 12 show that the first mode is enough for calculations because the other modes do not change much. Figure 8 shows how the reliability index affects the members based on the limit state functions in Equations (20) and (21). This helps us to discover which failure mode is more likely to occur. It is also worth noting that, in reliability analysis, depending on the loading conditions, a component might be subjected to a sequence of tension and compression. Therefore, it is necessary to consider both conditions and determine a separate reliability index. The minimum reliability index is then considered as the critical reliability index for the examined component.
Figure 9 shows the verification carried out between the MSC and FORM. As seen, the reliability index obtained from the MCS is close to the indices derived from the FORM. The indices obtained from the FROM can be considered member health indices. Additionally, it is evident that most of the minimum reliability indices pertain to members located near the splash zone.
The plate thickness determines the geometric function of the tubular members; hence, the corrosion-induced reduction in the pipe wall thickness changes the subsequent reliability results. This effect is studied here. Figure 10 and Figure 11 show the reliability analysis results of the elements over the service time. Supplementary Materials contains the full details of all elements. The reliability index declines considerably every year, so only inspections and repairs can improve it. While repairs are common in the offshore platform industry during service time, Figure 10 and Figure 11 do not account for the repair effect, which is discussed in the next sections. Figure 10 and Figure 11 show that the reliability index is fast at first, but then slows down as the corrosion mass protects the steel surface.
The method described above requires the repair process to maintain the reliability of an element at a certain level. Figure 12 and Figure 13 show the remaining reliability analysis results of two selected members with repair, based on the limit state function in Equations (20)–(24). Supplementary Materials gives the results of all the members.
Figure 12 and Figure 13 indicate that inspection is essential when the remaining reliability is close to zero and, thus, the PoF is high. They also prove how the inspection intervals affect the remaining reliability of the structural component when corrosion is taken into account for inspection and repair. The inspection effect is smaller for larger initial corrosion sizes after repairing the tubular members. The repair plan for the elements depends on the local environmental conditions and the corrosion protection system. These figures also reveal that the reliability index decreases differently in the splash zones, which may relate to different corrosion limits and the higher corrosion value in these zones. This means that members in the splash zones require more frequent remedial actions, such as every 10 years or less.
The above figures demonstrate how reliable data on corrosion behavior are important for estimating the failure of structural elements as well as their reliability. Such data are crucial for predicting how the time-dependent failure risk evolves. As there is no information available on failure consequences for corrosion-resistant platforms, this section presents the classification of structural damage levels to describe the respective performance states in the range 1–4, as given in Table 13, where four damage levels are included: catastrophic, critical, moderate, and minor consequences. Furthermore, the failure effects on the crew members can be generated into four performance states of physical discomfort effect, work efficiency degradation, slight effect, and exposure limitation, health harm or loss of lives. The failure loss induced by the effect of crew members on the platforms should also include the cost of injuries and deferred production loss. The failure of facilities can lead to the leaking of petroleum and or the eruption of natural gas.

5. Conclusions

This study aimed to find the annual reliability index for offshore-type structures with corrosion and repair effects. The design values for different key factors of the annual corrosion hazard were determined by following the recommended industry practices and guidelines. Structural hazards depend on extreme environmental events and structural corrosion, which are managed by using suitable design criteria, repair and maintenance, quality assurance, and engineering process control. These measures are briefly explained here, with a focus on a quantitative design method for a lifetime approach. Here, the corrosion rate in the long term was used to define a constant annual thickness reduction rate due to corrosion over the lifetime. The marine growth effect over the lifetime was taken into account, which will increase the element thickness and the load in some members. Under the joint influence of the long-term offshore platform operating load, corrosion factors, and wave load, the tubular element damage accumulates continuously during the lifetime.
The structure elements’ corrosion growth predictions were probabilistically modeled. A fixed offshore platform was designed based on the API-RP2A-WSD, DNV, and NORSOK standards. Loads with a 100-year return period were dynamically analyzed over time. A model that used a failure index based on the jacket tubular members’ strength under axial force interaction and flexural anchor in two directions was improved by changing the members’ repair by the FORM model. The design provisions’ outcomes were used to set up the reliability analysis and repair assessment for this offshore system. All the tubular elements’ boundary limit functions were considered. The corrosion consequences’ severity was assessed by structural damage and repair using an extensive time history dynamic analysis of corrosion scenarios yearly and over the service time.
The reliability index’s dependence on key random variables was calculated with repair and corrosion effects in mind. The following conclusions are drawn from the results of the performance of tubular elements with dent and corrosion damage and their repair.
  • As the remaining reliability approaches zero, the chance of failure increases. In this case, any action that reduces the stress on the structure or makes the structure stronger can enhance the remaining reliability.
  • The remaining reliability depends on how much the annual reliability of the structure during its use differs from the annual desired reliability.
  • When tubular elements with corrosion are under load, their strength drops a lot because of local buckling in the corroded part. This local buckling happens because the wall thickness of the element is smaller in the corroded area.
  • The reliability model can accurately estimate how the specimens with dents that are not fixed will act. Grouted sleeve repair can restore the original strength of tubular elements that are damaged by corrosion.
  • The results show that the corrosion depth and degree of damage in different years severely affect the ability of the damaged elements to recover their original design strength after repair. Hence, how well a repair can bring back the initial strength of a tubular element that is corroded depends on how deep the corrosion is and how much the corrosion has affected it over the years.
  • Compared to other zones, such as submerge and subsoil, the splash zone tubular members play a crucial role. The results indicate that the remaining reliability of structural components becomes nearly zero after the first 10 years in the splash zone. This highlights the urgency for swift repairs.
  • One of the most critical aspects in the lifetime design of offshore platforms is to explain the dynamic behavior under the forces generated by sea wave interactions. Additionally, studying wave hazards and the probability of wave occurrences is a complex task. In this vein, the hazard curve presented (referring to Figure 6) calculates the probability of wave occurrence for specific return periods throughout the platform’s lifetime. Moreover, we must consider the potential occurrence of specific events based on geographical factors.
  • While the corrosion of the splash zone can be modeled using the Weibull model, other areas can be modeled linearly. Although the proposed model shows distinct differences in the corrosion rates across various regions, the overall mass reduction due to corrosion is similar between the two models for a service life of less than 17 years. The most significant difference between the two models lies in the ability of the model to identify locations of severely weakened elements resulting from intense corrosion, where structural failure may initiate. Therefore, to achieve a reliable reliability index for each structural element, the model should be calibrated when trustworthy field-measured data become available.
Here, the connections between members were modeled as rigid where no fatigue or impact was considered. Furthermore, no hydrostatic pressure was considered. Overall, this methodology here can measure the corrosion in offshore platforms in terms of numbers. The jacket offshore structures have many parts, so grouping them can make the calculations easier. Future studies can find the best reliability level of the jacket, which can help offshore platform owners make better decisions about corrosion-based safety analysis.

Supplementary Materials

The following supporting information can be downloaded at: https://www.mdpi.com/article/10.3390/jmse12030504/s1.

Author Contributions

Methodology, M.H.; Investigation, M.H.; Writing—original draft, M.H.; Writing—review & editing, B.B.; Supervision, B.B.; Project administration, B.B. All authors have read and agreed to the published version of the manuscript.

Funding

This research received no external funding.

Institutional Review Board Statement

Not applicable.

Informed Consent Statement

Not applicable.

Data Availability Statement

The results and data of the study here are available from the authors upon reasonable request.

Conflicts of Interest

The authors declare no conflict of interest.

References

  1. Puskar, F.; Spong, R.; Ku, A.; Gilbert, R.; Choi, Y. Assessment of fixed offshore platform performance in Hurricane Ivan. In Proceedings of the Offshore Technology Conference, Houston, TX, USA, 1–4 May 2006. [Google Scholar]
  2. Valamanesh, V.; Myers, T.; Arwade, R. Multivariate Analysis of Extreme Metocean Conditions for Offshore Wind Turbines. Struct. Saf. 2015, 55, 60–69. [Google Scholar] [CrossRef]
  3. Leon, D.-D.; Alfredo, H. Development of a cost-benefit model for the management of structural risk on oil facilities in Mexico. Comput. Struct. Eng. Int. J. 2002, 2, 19–23. [Google Scholar]
  4. HSE. Key Programme 3: Asset Integrity Programme; Health and Safety Executive: Bootle, UK, 2007. [Google Scholar]
  5. Melchers, R.E. The effect of corrosion on the structural reliability of steel offshore structures. Corros. Sci. 2005, 47, 2391–2410. [Google Scholar] [CrossRef]
  6. GL-IV-7-2; Rules for the Certification and Construction, Industrial Services, Offshore Substations, Structural Design. Germanischer Lloyd SE: Hamburg, Germany, 2013.
  7. Liu, Q.; Wei, K. Structural Reliability Analysis of Offshore Wind Turbine Jacket Considering Environmental Corrosion. Acta Energy Sol. Sin. 2021, 42, 394–400. [Google Scholar]
  8. Guo, H.; Wei, H.; Liu, Y.; Yang, D.; Wang, Z.; Tian, J. Experimental Study on Fatigue Performance of Q690 High-Strength Steel under Marine Corrosion Environment. China Civ. Eng. J. 2021, 54, 37–45. [Google Scholar]
  9. Zve, S.E.; Loukogeorgaki, E.; Angelides, D. Effect of Zoning Corrosion on the Life-Time Structural Reliability of a Jacket Offshore Structure. In Proceedings of the ISOPE 2015, International Offshore and Polar Engineering Conference, Big Island, HI, USA, 21–26 June 2015. [Google Scholar]
  10. Melchers, R.E. Structural Reliability Analysis and Prediction, 2nd ed.; John Wiley & Sons: Chichester, UK, 1999. [Google Scholar]
  11. Bao, X.X.; Wang, J.R.; Li, H.J. A Safety Assessment Method on Aging Offshore Platforms with Damages. In Proceedings of the 19th International Offshore and Polar Engineering Conference, Osaka, Japan, 21–26 June 2009; Volume 4, pp. 612–616. [Google Scholar]
  12. Zhang, M.Q.; Beer, M.Q.; Quek, S.T.; Choo, Y.S. Comparison of uncertainty models in reliability analysis of offshore structures under marine corrosion. Struct. Saf. 2010, 32, 425–432. [Google Scholar] [CrossRef]
  13. Soares, C.G.; Garbatov, Y. Reliability of Maintained Ship Hull Girders Subjected to Corrosion and Fatigue. Struct. Saf. 1998, 20, 201–219. [Google Scholar] [CrossRef]
  14. Paik, J.K.; Kim, S.K.; Sang, K.L. Probabilistic Corrosion Rate Estimation Model for Longitudinal Strength Members of Bulk Carriers. Ocean Eng. 1998, 25, 837–860. [Google Scholar] [CrossRef]
  15. Bai, Y.; Kim, Y.H.; Yan, H.B.; Song, X.F.; Jiang, H. Reassessment of the Jacket Structure Due to Uniform Corrosion Damage. Ship Offshore Struct. 2016, 11, 105–112. [Google Scholar] [CrossRef]
  16. Ricles, J.M.; Bruin, W.M.; Sooi, T.K.; Hebor, M.F.; Schonwetter, P.C. Residual strength assessment and repair of damaged offshore tubular. In Proceedings of the 27th OTC, Houston, TX, USA, 1–4 May 1995. [Google Scholar]
  17. Ostapenko, A.; Wood, B.; Chowdhury, A.; Hebor, M. Residual Strength of Damaged and Deteriorated Tubular Members in Offshore Structures; ATLSS Report No. 93-03; Lehigh University: Bethlehem, PA, USA, 1993. [Google Scholar]
  18. Du, J.; Wang, H.; Song, X.; Wang, S.; Wang, J.; Chang, A. Fatigue Damage Assessment of Mooring Lines Under the Effect of Wave Climate Change and Marine Corrosion. Ocean Eng. 2020, 206, 107303. [Google Scholar] [CrossRef]
  19. Wang, Y.; Shi, W.; Wan, L.; Michailides, C.; Kim, H.; Li, X. WEC Shape Effect on the Motion Response and Power Performance of a Combined Wind-Wave Energy Converter. Ocean Eng. 2022, 250, 111038. [Google Scholar] [CrossRef]
  20. Hajinezhadian, M.; Behnam, B. A probabilistic approach to lifetime design of offshore platforms. J. Sci. Rep. 2023, 13, 7101. [Google Scholar] [CrossRef] [PubMed]
  21. Wang, R.; Shenoi, R.A. Experimental and numerical study on ultimate strength of steel tubular members with pitting corrosion damage. Mar. Struct. 2019, 64, 124–137. [Google Scholar] [CrossRef]
  22. Talaeitaba, S.B.; Halabian, M.; Torki, M.E. Nonlinear behavior of FRP-reinforced concrete-filled double-skin tubular columns using finite element analysis. Thin-Walled Struct. 2015, 95, 389–407. [Google Scholar] [CrossRef]
  23. Buchanan, C.; Real, E.; Gardner, L. Testing, simulation and design of cold-formed stainless steel CHS columns. Thin-Walled Struct. 2018, 130, 297–312. [Google Scholar] [CrossRef]
  24. Karampour, H. Effect of proximity of imperfections on buckle interaction in deep subsea pipelines. Mar. Struct. 2018, 59, 444–457. [Google Scholar] [CrossRef]
  25. American Petroleum Institute (API). API Recommended Practice 2A-WSD: Planning, Designing, and Constructing Fixed Offshore Platforms—Working Stress Design, 21st ed.; American Petroleum Institute: Washington, DC, USA, 2010. [Google Scholar]
  26. Schittkowski, K. EASY-FIT: A software system for data fitting in dynamical systems. Struct. Multidiscip. Optim. 2002, 23, 153–169. [Google Scholar] [CrossRef]
  27. SACS User Manual, “Section Seastate”; Engineering Dynamics Inc.: Metairie, LA, USA, 2001.
  28. Izadparast, A. Reliability-Performance Based Design of Jacket Platform for Seastate Loadings. Master’s Thesis, University of Tehran, Tehran, Iran, 2006. [Google Scholar]
  29. Fayyazi, A.; Aghakouchak, A. Calculation of probable extreme wave height during the lifetime of offshore platforms in the Persian Gulf. Mar. Eng. 2014, 9, 83–91. [Google Scholar]
  30. Winterstein, S.R.; Haver, S. A Method for Estimating Long Term Extremes by a Short Term Analyisis; SMTC-067-2008; SNAME Maritime Convention: Houston, TX, USA, 2008. [Google Scholar]
  31. DNV-RP-C205; Environmental Conditions and Environmental Loads, Recommended Practice. DNV GL: Oslo, Norway, 2010.
  32. Glenn Report. Report on Meteo-Oceanographic Conditions Affecting Design and Operation; South-Pars Phase 1 Offshore Platform Complex; Persian Gulf. 1997.
  33. Lee, B.H.; Ahn, D.-J.; Kim, H.-G.; Ha, Y.-C. An Estimation of Extreme Wind Speeds Using National Wind Map. Wind Eng. Inst. Korea 2010, 14, 29–38. [Google Scholar]
  34. Park, J.S.; Kang, K.; Kang, H.-S.; Kim, Y.-H. Projection of the future wave climate changes over the Western North Pacific. J. Korean Soc. Coast. Ocean. Eng. 2013, 25, 267–275. [Google Scholar] [CrossRef]
  35. Ayyub, B.M.; Assakkaf, I.; Atua, K.; Engle, A.; Hess, P.; Karaszewski, Z.; Kihl, D.; Melton, W.; Sielsk, R.A.; Siev, M.; et al. Reliability-Based Design of Ship Structures: Current Practice and Emerging Technologies. 1998. Available online: https://onlinelibrary.wiley.com/doi/abs/10.1111/j.1559-3584.2002.tb00124.x (accessed on 1 May 2001).
  36. Sorensen, J.; Baravalle, M.; Kohler, J. Calibration of existing semi-probabilistic design codes. In Proceedings of the 13th International Conference on Applications of Statistics and Probability in Civil Engineering, ICASP13, Seoul, Republic of Korea, 26–30 May 2019. [Google Scholar]
  37. Haldar, A.; Mahadevan, S. Probability, Reliability, and Statistical Methods in Engineering Design; Wiley and Sons Inc.: New York, NY, USA, 2000. [Google Scholar]
  38. Nowak, A.S.; Collins, K.R. Reliability of Structures; CRC Press: Boca Raton, FL, USA, 2012. [Google Scholar]
  39. Mansour, A.; Jan, H.; Chen, Y.N.; Harding, S.J. Implementation of Reliability Methods to Marine Structures. Trans. Soc. Nav. Archit. Mar. Eng. 1984, 92, 11–19. [Google Scholar]
  40. DNV (Det Norske Veritas). Structural Reliability Analysis of Marine Structures; Classification Note no. 30.6; DNV (Det Norske Veritas): Hovik, Norway, 1992. [Google Scholar]
  41. Madsen, H.O. Model Updating in Reliability Theory. In Proceedings of the ICASP5, Vancouver, BC, Canada, 17–21 June 1987. [Google Scholar]
  42. Tomashev, N.D. Theory of Corrosion and Protection of Metals; The MacMillan Co.: New York, NY, USA, 1996. [Google Scholar]
  43. Southwell, C.R.; Bultman, J.D.; Hummer, C.W., Jr. Estimating of Service period of Steel in Seawater. In Seawater Corrosion Handbook; Schumacher, M., Ed.; Noyes Data Corporation: Park Ridge, NJ, USA, 1979. [Google Scholar]
  44. Xu, X.P.; Huang, D.S.; Li, J.Z. The Corrosion Assessment of Bohai No. 8 Offshore Platform. China Ocean Eng. 2001, 16, 39–42. [Google Scholar]
  45. Melchers, R.E. Probabilistic model for marine corrosion of steel for structural reliability assessment. J. Strict. Eng. 2003, 129, 1484–1493. [Google Scholar] [CrossRef]
  46. Gao, Z.; Saha, N.L.J.; Moan, T.; Amdahl, J. Dynamic analysis of offshore fixed wind turbines under wind and wave loads using alternative computer codes. In Proceedings of the TORQUE 2010 Conference, FORTH, Heraklion, Crete, Greece, 2 June 2010. [Google Scholar]
  47. N-004:2013; Design of Steel Structures against Accidental Actions. Norsok Standard: Oslo, Norway, 2004; Volume 2, pp. 24–72.
  48. Harwood, R.G.; Shuttleworth, E.P. Grouted and Mechanical Strengthening Repair of Tubular Steel Offshore Structures; Offshore Technology Report OTH 88 283; Department of Energy: London, UK, 1988. [Google Scholar]
  49. Abdel Raheem, S.E. Nonlinear behavior of steel fixed offshore platform under environmental loads. Ships Offshore Struct. 2016, 11, 1–15. [Google Scholar]
  50. 61400-3; Wind Turbines, Part 3: Design Requirements for Offshore Wind Turbines. IEC International Standard: Geneva, Switzerland, 2009.
  51. Torgeir, M.; Wenbin, D.; Zhen, G. Fatigue reliability analysis of the jacket support structure for offshore wind turbine considering the effect of corrosion and inspection. Reliab. Eng. Syst. Saf. 2012, 106, 11–27. [Google Scholar]
  52. Chew, K.-H.; Tai, K.; Ng, E.; Muskulus, M. Analytical gradient-based optimization of offshore wind turbine substructures under fatigue and extreme loads. Mar. Struct. 2016, 47, 23–41. [Google Scholar] [CrossRef]
  53. Karamchandani, A.; Dalane, J.I.; Bjerager, P. Systems reliability approach to fatigue of structures. J. Struct. Eng. 1992, 118, 684–700. [Google Scholar] [CrossRef]
  54. Ricles, J.M.; Bruin, W.M. Evaluation of analysis methods for response prediction of dent-damaged tubular steel bracing members. In Proceedings of the Offshore Technology Conference, Houston, TX, USA, 5 May 1998. [Google Scholar]
  55. Marshall, P.W.; Gates, W.E.; Anagnostopoulos, S.W. Inelastic dynamic analysis of tubular offshore structures. In Proceedings of the Offshore Technology Conference, Houston, TX, USA, 1–4 May 1977. [Google Scholar]
  56. Najafian, G. Application of system identification techniques in efficient modeling of offshore structural response. Part I: Model development. Appl. Ocean Res. 2007, 29, 1–16. [Google Scholar] [CrossRef]
  57. Det Norske Veritas. Environmental Conditions and Environmental Loads; Det Norske Veritas: Høvik, Norway, 2000. [Google Scholar]
  58. Mazaheri, S.; Ghaderi, Z. Shallow water wave characteristics the Persian Gulf. J. Coast. Res. 2011, 64, 572–575. [Google Scholar]
  59. Cochran, W.G. The Chi-square Test of Goodness of Fit. Ann. Math. Stat. 1952, 23, 315–345. [Google Scholar] [CrossRef]
  60. JPM Code. Joint Committee on Structural Safety. 2001. Available online: www.jcss.ethz.ch (accessed on 1 May 2001).
  61. Golafshani, A.; Bagheri, V.; Ebrahimian, H.; Holmas, T. Incremental wave analysis and its application to performance-based assessment of jacket platforms. J. Constr. Steel Res. 2011, 67, 1649–1657. [Google Scholar] [CrossRef]
  62. Al-Kheer, A.A.; El-Hami, A.; Kharmanda, M.G.; Mouazen, A.M. Reliability-based design for soil tillage machines. J. Terramech. 2011, 48, 57–64. [Google Scholar] [CrossRef]
  63. Kharmanda, G.; Ibrahim, M.H.; Al-Kheer, A.A.; Guerin, F.; El-Hami, A. Reliability-based design optimization of shank chisel plow using optimum safety factor strategy. J. Comput. Electron. Agric. 2014, 109, 162–171. [Google Scholar] [CrossRef]
Figure 1. Organization of the study planned here.
Jmse 12 00504 g001
Figure 2. The process of estimating the reliability index (β).
Jmse 12 00504 g002
Figure 3. Definition of axes for dented section [47].
Jmse 12 00504 g003
Figure 4. Sketch of primary jacket offshore platform model.
Jmse 12 00504 g004
Figure 5. Two-dimensional view of the jacket elements selected for the reliability analysis.
Jmse 12 00504 g005
Figure 6. Wave hazard curve in the Persian Gulf for each estimated return period.
Jmse 12 00504 g006
Figure 7. Comparison of the mass loss of the offshore jacket using two different corrosion models.
Jmse 12 00504 g007
Figure 8. The effect of tensile and compressive performances on the reliability index of members.
Jmse 12 00504 g008
Figure 9. Comparison of MCS and FORM on the reliability index of structural members.
Jmse 12 00504 g009
Figure 10. Comparison of variation in reliability index (β) of structural members over service time for splash zone in damage state (leg members and horizontal bracings).
Jmse 12 00504 g010
Figure 11. Comparison of variation in reliability index (β) of structural members over service time for splash zone in damage state (vertical bracing members).
Jmse 12 00504 g011
Figure 12. Effect of inspection updating on remaining reliability of members ( R r e m over service time for splash zone in damage state (Member # 1).
Jmse 12 00504 g012
Figure 13. Effect of inspection updating on remaining reliability of members ( R r e m over service time for splash zone in damage state (Member # 2).
Jmse 12 00504 g013
Table 1. The steel characteristics.
Elastic ModulusPoisson’s ModulusSteel DensityYield Strength
2 × 10⁵ MPa0.37860 kg/m3345 MPa
Table 2. The dimensions of the elements.
DescriptionNumber of ElementsDiameter (mm)Thickness (mm)
Legs29-34-57-79-22-27-51-73-17-20-45-67-2-5-9-13140045
36-41-63-85145045
105-106-107-108150050
Vertical Bracing3-4-18-19-7-8-43-44-11-12-65-66-15-16-87-8850022
23-24-25-26-47-48-49-50-69-70-71-72-90-91-92-9350026
30-31-32-33-53-54-55-56-75-76-77-78-95-96-97-9860022
37-38-39-40-59-60-61-62-81-82-83-84-100-101-102-10355025
Horizontal Bracing1-6-10-14-21-46-68-8955028
28-52-74-9475040
35-58-80-9980042
42-64-86-10475045
Table 3. Scale and location parameters to calculate extreme instantaneous wind velocity.
DescriptionValue
Scale parameter, K0.311
Location parameter, L22.1
Table 4. Design load parameters used in the SACS model for a 100-year storm.
Description [Unit]Value
Extreme storm wave height (HS) [m]12.2
Extreme storm wave period (TP) [s]11.0
Extreme storm current velocity [m/s]0.5 m above the seabed0.71
1.0 m above seabed0.78
At mid-water depth1.28
Surface current1.28
Extreme wind velocity 10 m above LAT, 1 min mean [m/s]36.7
LAT above seabed [m]63.0
MHHW above LAT [m]1.7
Storm Surge (100 yrs.) [m]0.3
Total still water depth (SWL) [m]65.0
Table 5. Characteristics of marine growth.
Thickness (mm)Minimum Elevation (m)Maximum Elevation (m)Special Weight (gr/cm3)
75 radialEL (+) 2.0EL (−) 6.01.4
75 mm decrease to 50 mm radialEL (−) 6.0Seabed
Table 6. Summary of the dead and live loads on deck.
DescriptionItemized LoadsValue (kN)
Dead loadsArchitectural, electrical, fire and safety, instrumentation, mechanical, piping, etc.14,400
Live loadsOpen area, laydown area, muster area, building area, drilling, production, etc. 5200
Table 7. Corrosive depth in different corrosion zones.
Time-in-Service (Year)Splash (mm)Submerge (mm)Subsoil (mm)
10.000.000.000.00
20.1430.1030.10.02
30.280.1520.150.04
40.490.2060.20.12
50.7110.2510.250.23
60.9960.310.30.37
71.3120.3620.350.53
81.6170.4130.40.69
91.950.4650.450.85
102.320.5160.50.99
112.620.570.551.13
1230.6190.61.25
133.370.6750.651.35
143.840.7220.71.42
154.120.7790.751.49
164.60.820.81.53
174.990.870.851.56
185.330.920.91.59
195.590.970.951.60
206111.61
216.271.071.051.62
226.651.131.11.62
236.891.181.151.62
247.221.231.21.63
257.7261.31.251.63
Table 8. Basic random variables [57,58,59,60].
Random VariableDistribution Chi-Square TestAverage Values Coefficient of Variation (CoV)
Modulus of elasticity, ENormal-2.1 × 10⁵ MPa25%
Steel yield stress, σ y Log-Normal-356 MPa10%
Thickness, t (mm)Normal-280.04
Axial force, F X Weibull0.04491The average values and CoV of each member are dynamically analyzed and determined in the presence of wave forces
The bending moment around axis Y, M Y Log-Normal0.11139
The bending moment around axis Z, M Z Weibull0.04491
Table 9. The FORM for Member # 5 under compressive performance.
Random VariableThe Final Design Point in the Standard SpaceThe Design Point in the Main SpaceThe Partial Derivative
F X 0.0189445.36420.0045
M y 4.89525.8953 × 1041.1925
M z 2.8953 × 10−4496.22517.3323 × 10−5
E−0.39453.8953 × 108−0.09986
σ y −0.38332.0953 × 105−0.07985
Table 10. The FORM for Member # 5 under tension performance.
Random VariableThe Final Design Point in the Standard SpaceThe Design Point in the Main SpaceThe Partial Derivative
F X 3.8125 × 10−4425.06119.6125 × 10−5
M y 4.81224.1158 × 1041.1738
M z 3.8153 × 10−4511.32419.0115 × 10−5
E−0.51123.6489 × 108−0.1129
σ y −0.47111.9987 × 105−0.09321
Table 11. Evaluation of reliability index for Member # 5 in different vibration modes.
Mode Number123456789
Period (s)9.688.356.615.124.973.833.713.012.81
Reliability index (β)5.229.939.3410.347.1510.998.608.3010.56
Table 12. Evaluation of reliability index for Member #5 in vibration cumulative modes.
Cumulative Modes 123456789
Reliability index (β)5.225.235.225.195.185.185.185.185.18
Table 13. Description of platform failure consequences.
Consequence
Annual Reliability Index ( β a )Level of ConsequenceInconvenience or Physical DiscomfortInterference with Operations, Work Efficiency DegradationSuspension of Operations, Loss of Assets, Threat to Structural Integrity, Failure of Facilities, Health HarmLoss, Pollution, Deferred Production, Compromised Structural Integrity, Leaking of Oil and or Eruption Natural Gas
3.72 β a < 4.44Minor Jmse 12 00504 i001
3.09 β a < 3.72ModerateJmse 12 00504 i002
2.32 β a < 3.09CriticalJmse 12 00504 i003
β a < 2.32CatastrophicJmse 12 00504 i004
Disclaimer/Publisher’s Note: The statements, opinions and data contained in all publications are solely those of the individual author(s) and contributor(s) and not of MDPI and/or the editor(s). MDPI and/or the editor(s) disclaim responsibility for any injury to people or property resulting from any ideas, methods, instructions or products referred to in the content.

