Article

Experimental Study on the Effect of Wind on Armor Stone Stability

Department of Civil & Environmental Engineering, Myongji University, Yongin 17058, Republic of Korea
*
Author to whom correspondence should be addressed.
J. Mar. Sci. Eng. 2024, 12(3), 499; https://doi.org/10.3390/jmse12030499
Submission received: 27 February 2024 / Revised: 15 March 2024 / Accepted: 16 March 2024 / Published: 18 March 2024
(This article belongs to the Special Issue Design of Harbour and Coastal Structures)

Abstract

:
Wind is a significant factor influencing the stability of breakwater armor stones. However, few existing studies have considered the effects of wind on these structures. In this study, two-dimensional laboratory experiments were conducted to examine the effect of wind on the stability of breakwater armor stones. The stability factor ( K D ) of the armor stone, fluid velocity, runup, and rundown were observed under the action of waves and winds. A wind turbine was installed in front of the physical model of the breakwater to generate extreme wind conditions of 5.5 and 12 m/s. The results showed that K D decreased by 42.18% at 5.5 m/s and 57.82% at 12 m/s compared with that without wind. The maximum runup and rundown heights increased with wind velocity, following a Rayleigh distribution. The fluid velocity distribution conformed to a normal distribution, with the mean velocity directed offshore. Many studies have suggested that runup, rundown, and fluid velocity are the main factors affecting the stability of breakwater armor stones. The analysis revealed that wind affects these factors and lowers the stability coefficient. These wind-induced hydrodynamic changes suggest the need for a detailed hydrodynamic review of wind-wave conditions.

1. Introduction

Wind plays a crucial role in the planning and design of coastal structures, with recent designs increasingly incorporating considerations not only for the wave pressure but also for the effect of wind [1]. However, breakwater armor stone failure is currently analyzed without considering the effect of wind. Studies on breakwater armor stones are limited and primarily rely on experimental analysis and field observations that exclusively consider waves [2]. In particular, methods and data that include wind effects have not been presented [3]. Wind wave characteristics are reflected in the wave spectrum. However, there is a notable gap in knowledge regarding the direct effect of wind on breakwater armor stones. The stability of breakwater armor stones is mainly evaluated using mathematical methods such as Hudson’s equation [4] and van der Meer’s formulae [5], which consider only waves. High waves are usually accompanied by strong winds, and strong runup, rundown, and overtopping occur on rubble-mound structures [6,7]. Hence, runup height is one of the most important physical factors in the design of coastal structures, such as breakwater height and revetments [8,9].
Analytical studies under wind wave conditions have been recently conducted to address the increasing need to consider wind effects. Yamashiro et al. [10] conducted wave overtopping experiments to investigate the similarity between the experimental wind velocity and the actual value on a coast. The wave-overtopping experiments were performed using approximately one year of observational data. The results indicated that the experimental wind velocity was most accurate when 1/3 of the actual wind velocity was used. Yamashiro et al. [11] also conducted an experiment on the effect of parapets on water spray and the reduction of overtopping waves under strong wind conditions. The experimental results showed that a parapet of approximately 1 m could reduce wave overtopping by up to 30–40% under strong wind conditions. Shim and Kim [12] analyzed revetment overtopping under the condition of wind–wave coexistence. It was suggested that as the wind velocity increased, the maximum overtopping could increase by approximately 5–12%. Sous et al. [13] conducted a study on the interaction of wave breaking points and change in skewness under wind wave conditions and suggested that wind conditions are physically important factors. Therefore, studies on the effects of wind and waves are being actively conducted (e.g., [14,15]); however, studies on the stability analysis of armor stone breakwaters are lacking.
The loss of armor stones owing to high waves is one of the most important failure modes in the design and analysis of rubble-mound breakwaters. The hydrodynamic stability of breakwater armor stones has been the focus of numerous studies [4,5,16,17]. The stability analysis of armor stones is based on the results of laboratory experiments; however, in most cases, the effect of wind has not been considered. Many studies have suggested the need for a review of the changes in the hydrodynamic characteristics due to wind.
In this study, the direct effect of wind on the stability of breakwater armor stones (tetrapod-type) was analyzed. To investigate the effect of wind on the armor stones, winds of various velocities were generated in front of a breakwater. The wave spectrum was established using offshore wave-height data. The wave spectrum generated by extreme wind conditions resembles the Bretschneider–Mitsuyasu spectrum [18]. Therefore, the interaction between the waves and the offshore wind was considered using the Bretschneider–Mitsuyasu spectrum. The damage wave height and Hudson’s stability factor ( K D ) under wind velocity conditions were analyzed. In addition, the fluid velocity, runup, and rundown were analyzed to study the effects of the changes in the stability coefficient on the hydrodynamics. The results revealed that the runup, rundown, and fluid velocity are important factors affecting the tetrapod (TTP) stability. This study emphasizes the need to consider the influence of wind when analyzing the stability of breakwater armor stones.

2. Experiment

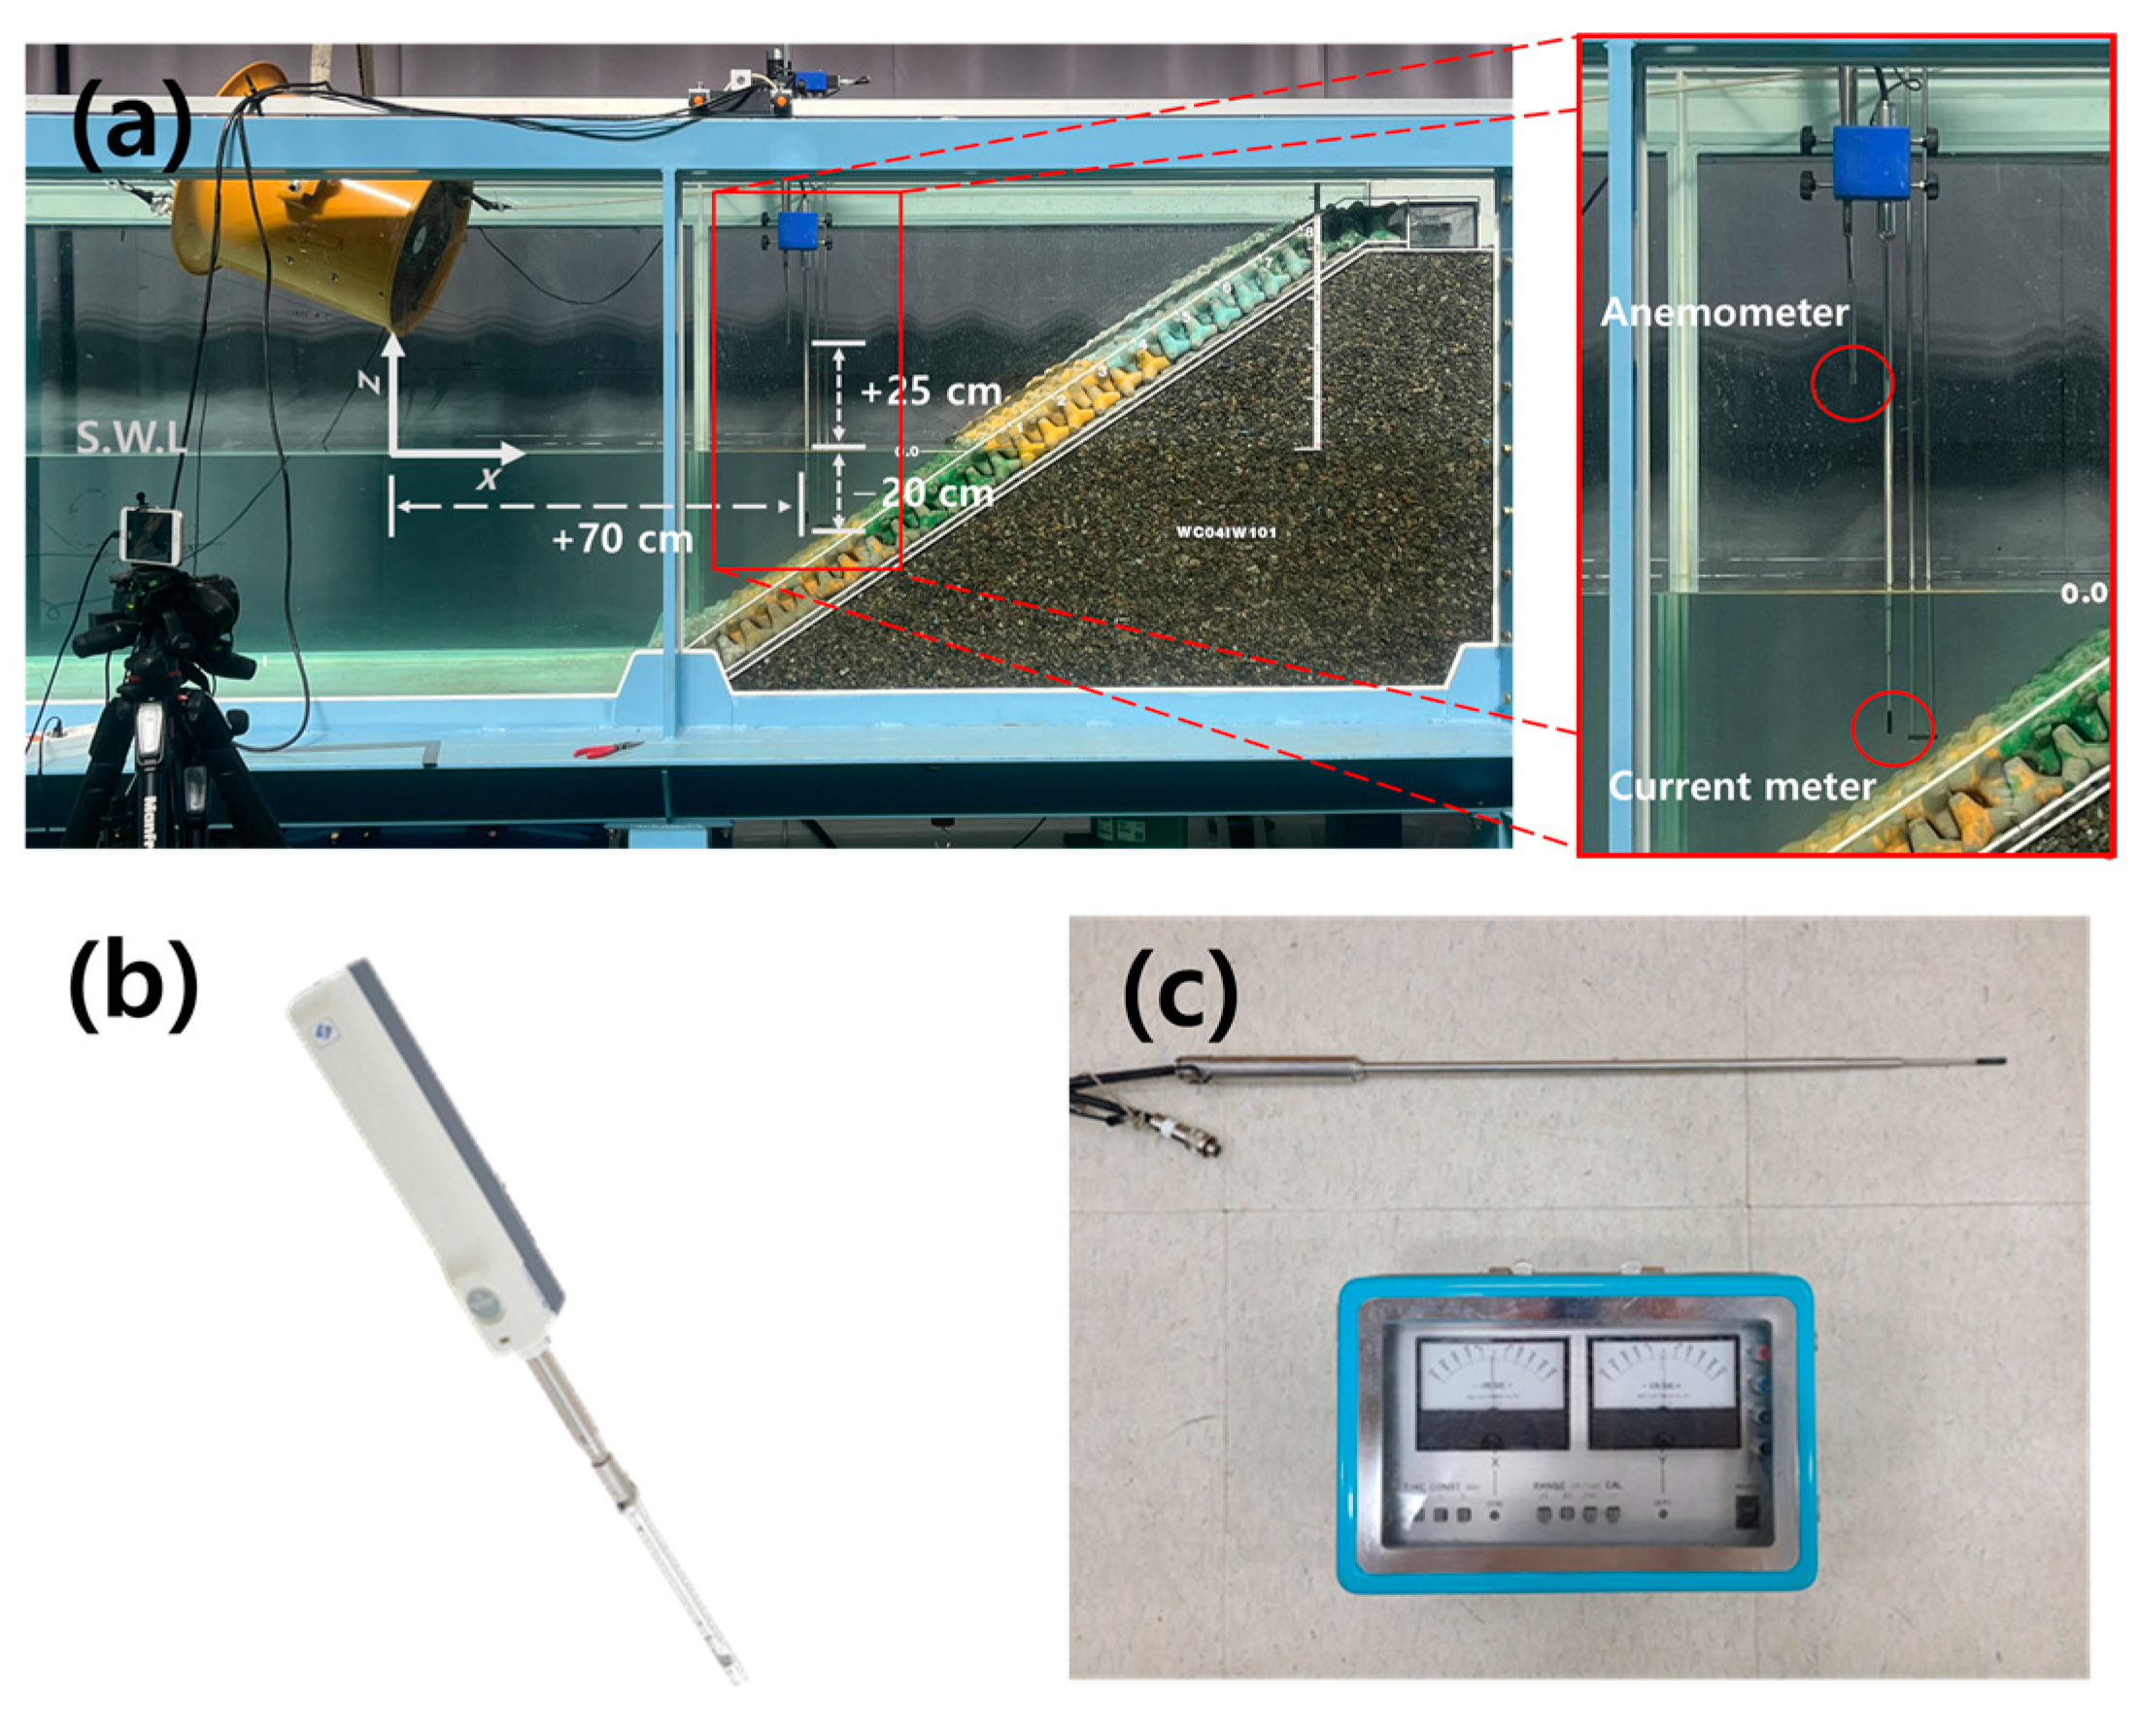
2.1. Laboratory Experiment Setup

The laboratory experiments were conducted in the wave channel at the Korea Institute of Ocean Science and Technology. Figure 1 shows the wave flume (L: 37 m, W: 0.8 m, and H: 1.45 m) used in the laboratory experiment. The water depth in front of the physical breakwater model was 0.5 m, and seven wave gauges were used. The wave gauges, along with various other sensors (current gauges and anemometers), were installed in front of the physical model to measure the hydrodynamic characteristics under the coexistence of waves and wind. The windmaker was installed 0.5 m from the breakwater front as horizontally as possible (16° from the horizontal) at the still water level (S.W.L) of (+)25 cm. The windmaker angle was confirmed by double-checking the measurement values with a ruler and protractor application. This height did not interfere with the wave height of H m 0 = 15 cm. Small normal stresses may occur due to the angle of the windmaker, which can also affect the hydrostatic pressure of the water. However, considering that the density difference between water and air is 1000 times, the normal stress of wind is not expected to have a significant impact. The wind velocity conditions were adjusted using windmakers with diameters of 400 mm and 500 mm installed at the same location. Additionally, a camera was installed on the breakwater side to record and analyze the runup, rundown, and TTP damage.
The slope of the physical model was 1:1.5, and the total height of the breakwater was 1.02 m, which is a non-overtopping condition. The TTP model was mounted on two rows. The scale ratio used in the laboratory experiment was 1:50 based on the similarity between the Froude number ( F r ). The mass and volume of the TTP model were 160 g and 70 c m 3 , respectively, corresponding to 20 ton and 8.77 m 3 of the prototype. The nominal diameter ( D n ) of the TTP used in the experiment is about 4 cm. The core was composed of rubble stones with an average mass of 1 g, and a 10 g of tripod was placed on the core.
Figure 2 shows the current meter and anemometer used in the experiment. An electromagnetic current meter was installed in front of the physical model (windmaker location in terms of the S.W.L location coordinates: x = +70 cm, z = −20 cm) to measure the fluid characteristics in the onshore (+) and offshore directions (−). Based on the preliminary test, it was decided to install an electromagnetic current meter with S.W.L of (−) 20 cm in all experiments. A hot-wire anemometer can measure wind velocities in the range of 0.05–30 m/s. It was installed at the S.W.L of (+) 25 cm, where there was no interference with the wave height.

2.2. Wave and Wind Conditions

The experimental irregular wave was generated using the Bretschneider–Mitsuyasu (BM) spectrum. The BM spectrum is a function proposed by Bretschneider [19] and modified with the coefficients proposed by Mitsuyasu [20]. The BM spectral equation is as follows:
S f = 0.205 H s 2 T s 4 f 5 [ 0.75 T s f 4 ] ,
where S ( f ) is the wave-spectrum density function, f is the frequency, H s is the significant wave height, and T s is the significant wave period.
Table 1 shows the wave conditions during the experiment. The target wave height ranged from 7 to 15 cm at 1 cm intervals. The measured wave height represents the values obtained at WG4~6 of the wave channel described in Section 2.1 above. Input wave height data was determined by comparing the target and measured values. Although there is a slight variation in the period T p depending on the wave height conditions, the difference is not significant. Therefore, for simplicity in explanation, the period is referred to as the target period T p = 1.45 s. The experiment was performed only on irregular waves. Regular wave was decided to be difficult to conduct long-term experiments due to the beating effects of the incident and reflected waves.
The wind conditions are listed in Table 2. The model wind velocities ( V m ) were 0, 5.5, and 12 m/s measured at x = +70 cm, z = +25 cm (using the coordinates in Figure 2). By converting the values to the prototype wind velocity ( V p ) using the Froude number, the velocities were calculated as 0, 38.9, and 84.8 m/s. In the case of Typhoon Hinnamnor, which occurred on the Korean Peninsula in September 2022, the maximum average wind velocity per minute was 72 m/s, and the average wind velocity per 10 min was 54 m/s. Hinnamnor was a powerful typhoon that caused extensive damage, such as breakwater destruction and overtopping, in the southern part of the Korean Peninsula (Jeju Island and Pohang). The model wind velocity condition of 5.5 m/s represents a medium-sized typhoon; typhoons of this wind velocity occur yearly on the Korean Peninsula. The model wind velocity of 12 m/s is higher than that of Typhoon Hinnamnor. Typhoons of this wind velocity under extreme conditions are classified as super-strong typhoons [21]. When the model wind velocity is converted using the Froude scale, it is decided that the wind velocity is greater than that of an actual typhoon occurring on the Korean Peninsula. This wind velocity seems excessively high.
Importantly, it is worth noting that there is no agreement on the scaling law for wind velocity under conditions where wind and waves coexist. Inagaki et al. [22] showed that wind-driven wave overtopping experiments did not follow the Froude number, suggesting that additional studies are required to determine the dynamic scaling that should be applied to wind-induced lift-up effects. Yamashiro et al. [10] found through wind wave experiments (scale 1/45) that using the Froude number posed a risk of over-scaling the wind velocity and recommended using a ratio of 1:3 when scaling the wind velocity. As a result, they used the Froude scale for conditions such as breakwaters and wave heights but recommended using a value of 1/3 for wind velocity because there was a problem of over-scaling. Using the scale suggested by Yamashiro et al. [10], the prototype wind velocities were calculated at V p = 0, 16.5, and 36 m/s. Wind-induced runup and overtopping experiments are related to various laws, including Froude’s law for fluid dynamics, Weber’s law for water sprays, and Reynold’s law for wind forcing. However, it is not possible to combine similar laws; moreover, this topic is outside the scope of this study. Therefore, the scale of the wind velocity was assumed to be 1:3 based on the results of Yamashiro et al. [10] and Inagaki et al. [22]. The experimental wave height was 7–15 cm (varied in ascending order with 1 cm intervals), and non-breaking wave conditions were used. The wave period was 1.45 s. For each condition, 500 waves were generated, and the duration of the experiment for each case was 11 min 45 s.

2.3. Breakwater Armor Stone Damage

The stability of the breakwater armor stones was analyzed according to the stability factor ( K D ) obtained from Hudson’s equation [4]. The stability coefficient K D is a parameter associated with the weight of the armor stone; it corresponds to the wave height initiating the damage and serves as a measure of stability under varying wave conditions. Because it is possible to simply examine the weight and stability of the armor stones, they have been widely used in the analysis of many hydrodynamic experiments (e.g., [23,24]). Hudson’s equation for calculating the stability factor ( K D ) is as follows:
K D = γ s H s i 3 W S 1 3 cot θ ,
where γ s is the specific weight of the armor stone, H s i is the wave height at which the damage initiates, W is the weight of the armor stone, S is the specific gravity of the armor stone, and θ is the breakwater front angle. The most important variable for calculating the stability factor of the armor stones is H s i .
The TTP damage used to determine the initial damage wave height was defined under the following conditions: (1) when continuous rocking occurred, and (2) when the TTP deviated from its original position by more than the TTP diameter ( D n = 4 cm) [25]. The experiment was conducted by varying wave height from 7 cm to 15 cm in ascending order at 1 cm intervals. To detect H s i correctly, the experiment was conducted up to a wave height that was at least 2 cm higher than the wave height at which the damage occurred for the first time.

2.4. Wind Velocity Field

Figure 3 shows the wind velocity field. Figure 3a shows the set of measurement points for measuring the wind velocity field. In total, 26 measurement points (intervals of 5–15 cm) were used in the wind velocity field analysis. After marking the measurement points with a dot on the side of the wave channel, their locations were identified and measured using the TTP location and a ruler. The average wind velocity data, measured twice for 30 s at each point, was used. The wind velocity field was generated via linear interpolation through 26 points of data. Figure 3b shows the wind velocity field at V m = 5.5 m/s. Wind velocities in the range of 4.5 to 5.5 m/s were observed across the entire surface of the breakwater. Figure 3c shows the wind velocity field at V m = 12 m/s. Wind velocities of 11–12 m/s were generated across the entire breakwater surface. After obtaining the wind velocity field data, a stability analysis was performed.

3. Results and Discussion

3.1. Hudson Stability Factor ( K D )

Table 3 summarizes the TTP damage under each wind and wave condition. When V m = 0 m/s, the TTP started to rock at H m 0 = 12.1 cm and exhibited loss from H m 0 = 13.0 cm. Similarly, the TTP started rocking at H m 0 = 10.3 cm for V m = 5.5 m/s and H m 0 = 9.1 cm for V m = 12 m/s. H s i was determined to be 12.1, 10.3, and 9.1 cm for the model wind velocities ( V m ) of 0, 5.5, and 12 m/s, respectively. By calculating K D according to the wind velocity, the values were 7.79 for V m = 0 m/s, 4.86 for V m = 5.5 m/s, and 3.25 for V m = 12 m/s.
The stability factor was determined under windless conditions. The value of K D = 7.79 at V m = 0 m/s, calculated using Hudson’s equation, is consistent with K D = 7 to 8, which is the stability coefficient of TTP known from many previous experiments [26,27,28]. However, the higher the wind velocity, the lower the stability coefficient of the existing TTP. As the wind velocity increased, initial damage occurred at low wave heights. The reduction rate is the rate of decrease in the stability coefficient for each wind velocity condition based on the stability coefficient K D at V m = 0 m/s. The stability coefficient K D decreased by 37.16% at V m = 5.5 m/s and by 58.28% at V m = 12 m/s.
Figure 4 shows the runup and rundown photos at the time of TTP loss. The TTP loss coincided with the rundown following the runup. At V m = 0 m/s, minimal water spray was observed during the runup; however, the water spray increased at stronger wind velocities. Inagaki [22] showed, through wind tunnel experiments, that the excess rates of overtopping waves and water spray are much larger than those calculated using conventional methods when considering wind. Considering the amount of water sprayed, it was determined that the wind acted as a shear force on the water surface and influenced the increase in the runup. After the runup, a rundown occurred. At this time, the rundown overlapped with the incident wave, and a strong breaking wave occurred. These powerful breaking waves have a significant effect on the breakwater slope, leading to TTP loss. It was inferred that the shear force due to the wind velocity affected the runup and rundown, and the TTP loss appears to have occurred because of the strong hydrodynamic changes at this time. At H m 0 = 13.0 cm, rocking and loss were observed under all wind velocity conditions, with a tendency toward increased loss. Therefore, hydrodynamic analysis was conducted for H m 0 = 13.0 cm.

3.2. Hydrodynamics

3.2.1. Wave Spectrum

Figure 5 shows the change in the wave spectrum (in front of the breakwater) for each experimental wind velocity. This is the spectrum at H m 0 = 13.0 cm when the loss and rocking of the breakwater armor stone begin to increase. As the wind velocity increased, lower-frequency waves in the range of 0 to 0.4 Hz showed higher spectral densities. This is consistent with the result of González-Escrivá [29], where the wind intensity was positively correlated with an increase in the spectrum within the low-frequency region.
The wave spectra exhibited different characteristics for each of the three sections. This means that the higher the wind velocity, the greater the number of waves with high energy, which is similar to the result reported by González-Escrivá [29]. In the 0.4 to 1.0 Hz range, the spectra for the various wind velocities were almost identical. Beyond 1 Hz, where the wave energy was small, no variation according to the wind velocity was found.

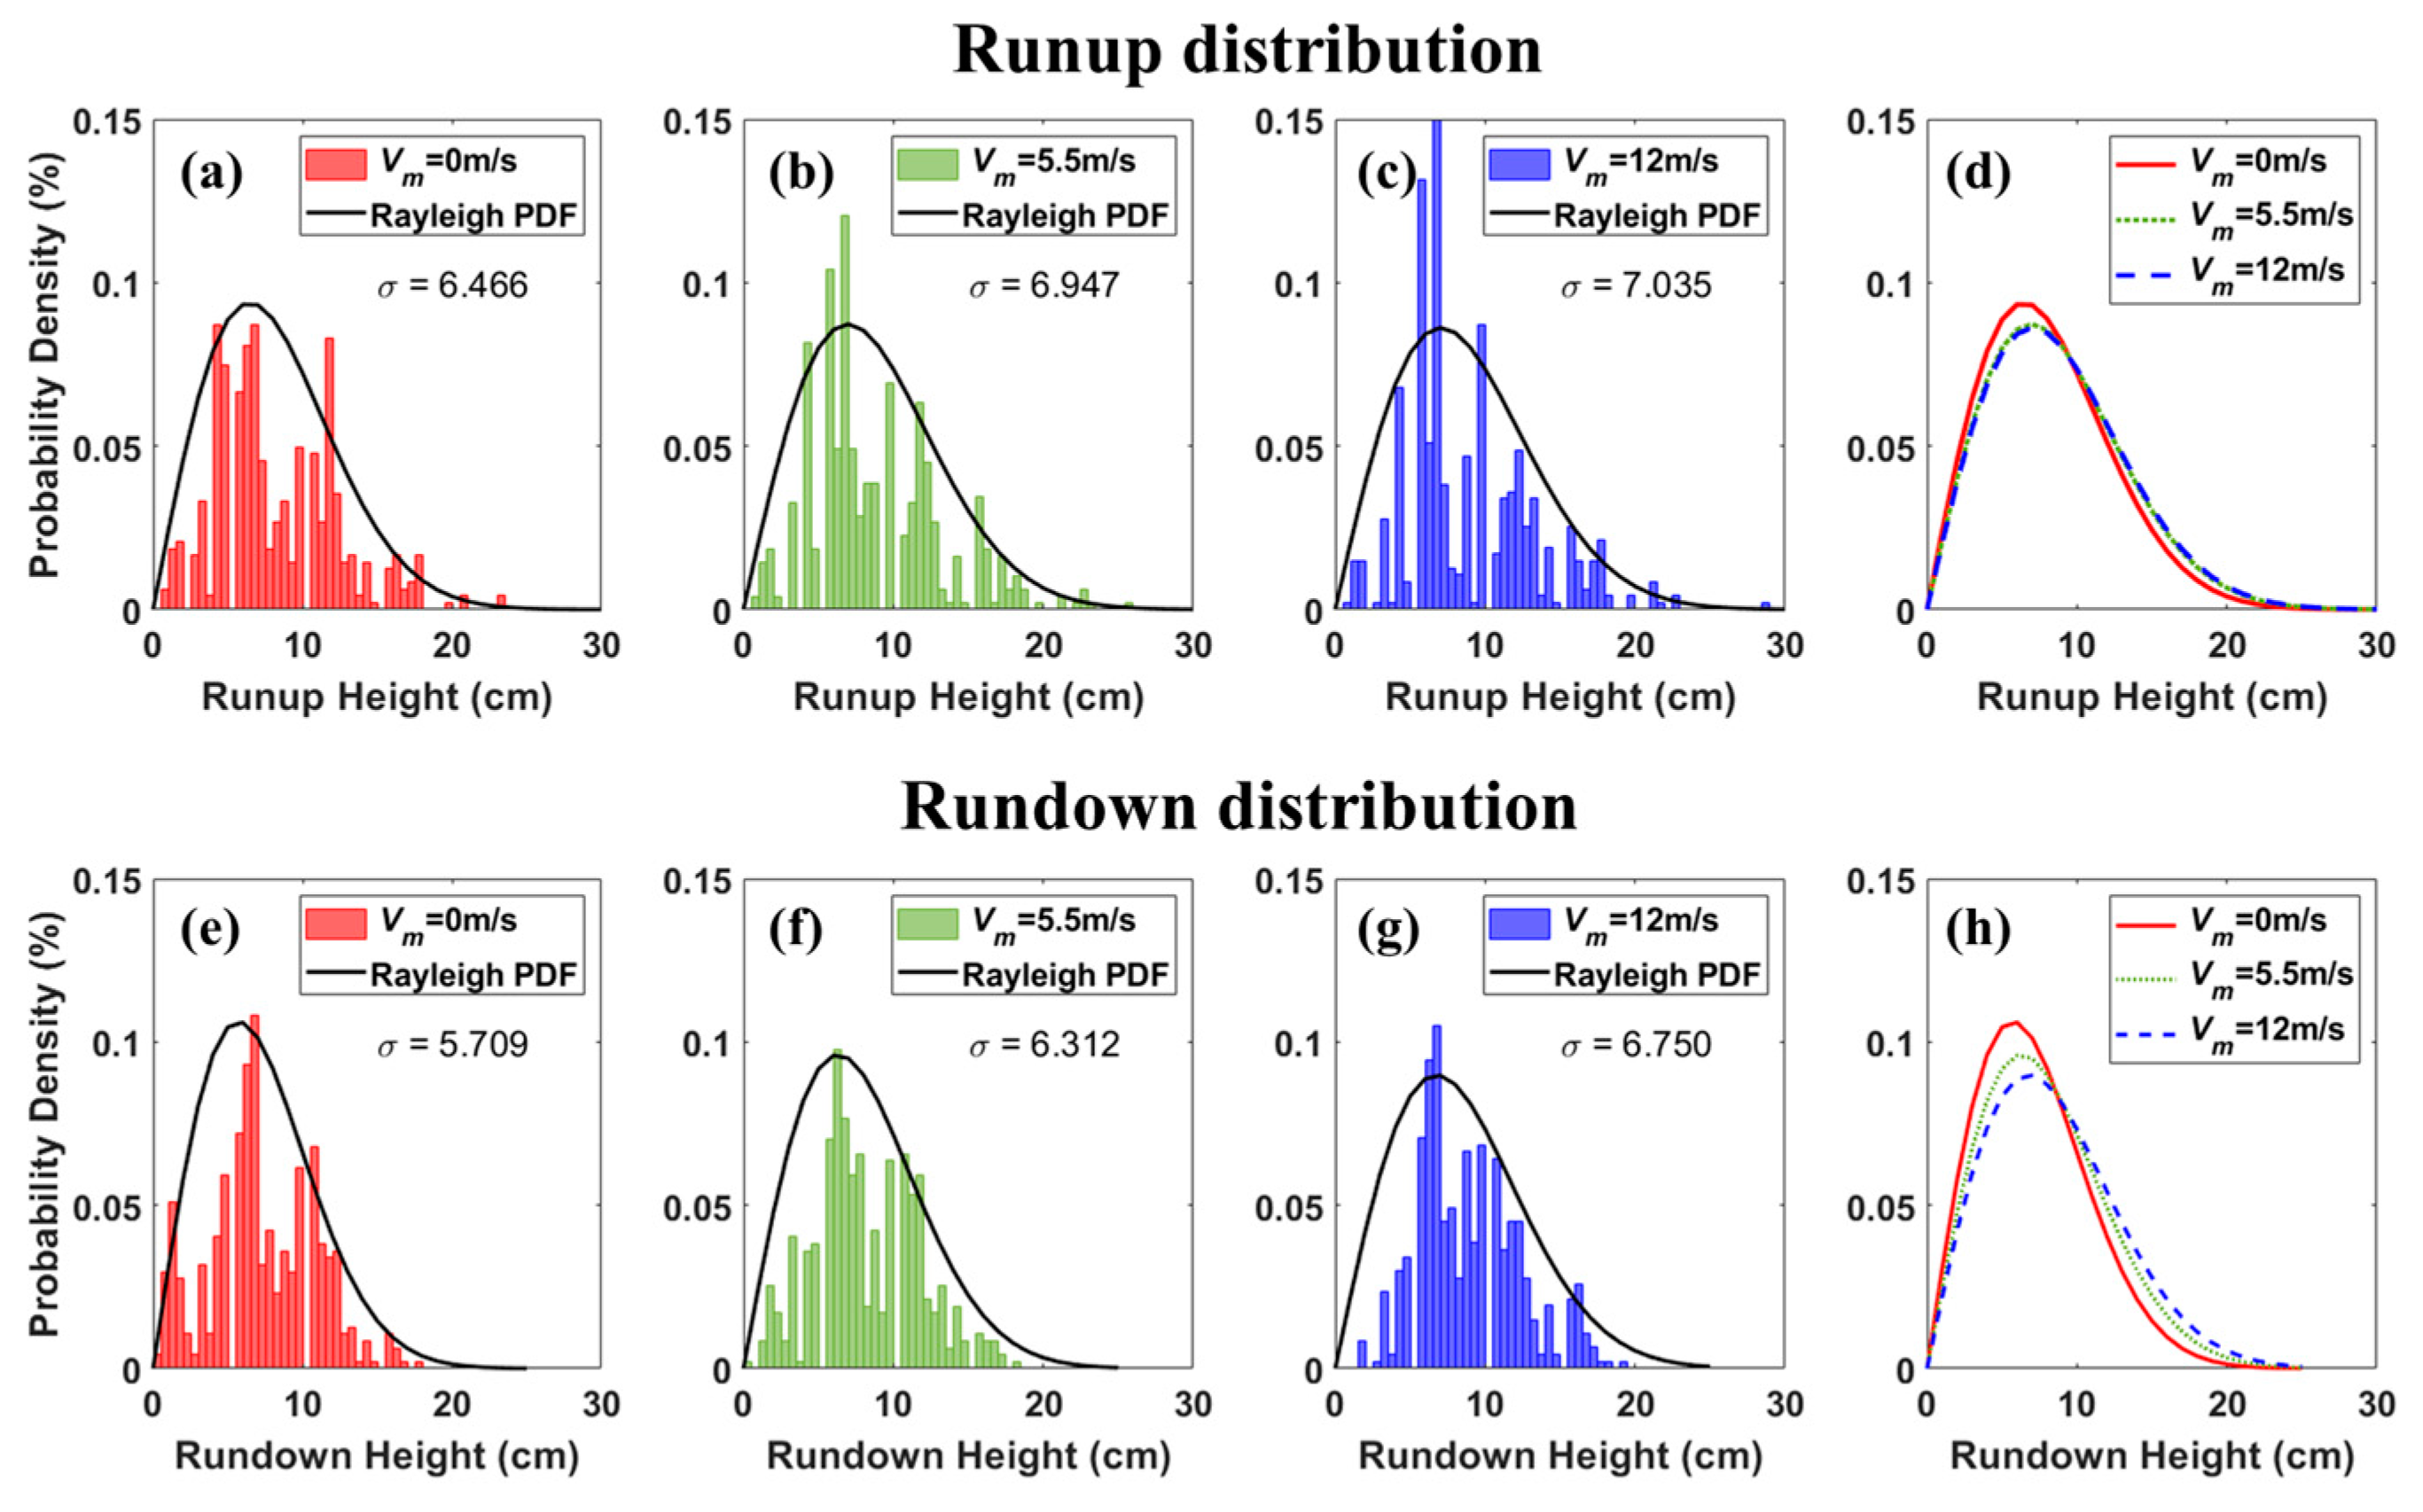
3.2.2. Wave Runup and Rundown

The force acting on the breakwater slope can be divided into the wave pressure acting perpendicular to the slope, runup, rundown, and shear force [30]. These forces acting on the slope influence the fluid forces, such as the drag and buoyancy of the TTP, and may affect the stability. The changes in the wave pressure owing to the runup and rundown accelerate the loss of the TTP [31]. Therefore, we analyzed the effect of wind velocity on these hydrodynamic changes.
Figure 6 shows the time series of the runup, rundown, and fluid velocities at H m 0 = 13.0 cm and T p = 1.45 s. The runup and rundown were assessed by dividing the side-view images into frames and analyzing the vertical height from the S.W.L. A positive value (+) represents the runup height, and a negative value (−) represents the rundown height. The fluid velocity was measured using an electromagnetic current meter in front of the breakwater, where the (+) value is the fluid velocity in the onshore direction and the (−) value is the fluid velocity in the offshore direction. R is the rocking point, and L is the loss point.
At V m = 0 m/s, the TTP loss occurred approximately 450 s after the start of the experiment. At V m = 5.5 and 12 m/s, the TTP loss occurred at approximately 150 to 180 s. At this point, the loss was accompanied by significant hydrodynamic changes. Table 4 presents the runup, rundown, and fluid velocities that occurred at the time of TTP loss. R u represents the runup, R d represents the rundown, V m represents the fluid velocity in the onshore direction, and U o f f represents the fluid velocity in the offshore direction. R u increased by 27.79% and 18.88% at V m = 5.5 and 12 m/s, respectively, and R d increased by 10.75% under both conditions. Increasing runup is a major factor that has a significant influence on the design of breakwaters exposed to wave attacks [32]. U o n decreased by 8.02% at V m = 5.5 m/s and increased by 5% at V m = 12 m/s. The most significant change occurred in the fluid velocity in the offshore direction. U o f f increased by 22.11% and 26.51% at V m = 5.5 and 12 m/s, respectively. Changes in the fluid velocity in front of a breakwater covered with a porous material could have a significant effect by generating strong turbulence owing to the mixing process [33].
Table 5 lists the runup and rundown heights for each wind velocity. R u , m a x represents the maximum runup height, R u , 2 % is the average runup height of the top 2%, R u , s is the average runup height of the top 33%, and R u , a v g is the overall average runup height. R m a x , R 2 % , R s , and R a v g were analyzed to compare the various statistical characteristics of the runup [34,35]. R m a x increased by 9.5% at V m = 5.5 m/s and by 23% at V m = 12 m/s compared with the corresponding result at V m = 0 m/s.
Ward et al. [15] showed that runup and overtopping slightly increased at a wind velocity of 6 m/s, but the maximum runup could increase by more than 20% as the wind velocity increased to 12 m/s. The results of this study showed that the maximum runup increased by about 23% at V m = 12 m/s, which was quite similar to Ward et al. [15] results. Additionally, R u , 2 % increased by 11.9% at V m = 5.5 m/s and by 14.7% at V m = 12 m/s. R u , s and R u , a v g also tended to increase as the wind velocity increased. The probability that a large runup of 10 cm or more occurred increased as the wind velocity became stronger: 31.5% at V m = 0 m/s, 32.8% at V m = 5.5 m/s, and 32.9% at V m = 12 m/s. Wind shear stress can affect wave overtopping and runup by acting on the wave profile at the wall [14,36].
The rundown heights R d , m a x , R d , 2 % , R d , s , and R d , a v g were calculated. R d , m a x increased by 3.2% at V m = 5.5 m/s and by 9.4% at V m = 12 m/s compared with the value at V m = 0 m/s. The maximum rundowns at V m = 0 and 12 m/s differed by approximately 1.7 cm. The difference in the runup height was noticeable at high runups, such as R u . m a x and R u , 2 % . However, the rundown showed the greatest difference in R d , a v g , which increased by 13.6% at V m = 5.5 m/s and by 23.4% at V m = 12 m/s. The probability of occurrence of a large rundown of 10 cm or more increased as the wind velocity became stronger: 23.3% at V m = 0 m/s, 31.1% at V m = 5.5 m/s, and 33.2% at V m = 12 m/s.
Figure 7 shows the runup and rundown histograms for various wind velocities. Figure 7a–d present the runup histogram and fitted Rayleigh distribution for each wind velocity condition. Denissenko et al. [37] and Nielsen and Hanslow [38] suggested that the probability distribution of runup follows a Rayleigh distribution. Therefore, the runup height data are represented as histograms and analyzed by fitting them to the Rayleigh distribution. In the Rayleigh distribution, σ is a scale parameter that determines the kurtosis of the probability distribution. A larger σ widens and flattens the distribution, whereas a smaller σ narrows and sharpens it. In other words, an increase in σ leads to an increase in the variance of the distribution, and a decrease leads to a decrease in variance. σ increased as the wind velocity became stronger: 6.466 at V m = 0 m/s, 6.947 at 5.5 m/s, and 7.035 at 12 m/s. As the wind velocity increased, the probability of a runup of less than 10 cm decreased, whereas that of a runup of more than 10 cm increased.
Figure 7e–h shows the rundown histogram and probability distribution according to the wind velocity. Rundown was defined as a negative vertical height from the S.W.L; however, it was expressed as an absolute value for easier comparison. Similar to the runup, the rundown was analyzed using a histogram and Rayleigh distribution. The change in the rundown was more obvious than that in the runup. There was no significant difference in the probability distribution of the runup between V m = 5.5 m/s and 12 m/s. However, as the wind velocity increased, the probability of a rundown exceeding 10 cm increased significantly. The scale parameter (σ) of the Rayleigh distribution was 5.709 at V m = 0 m/s, 6.312 at V m = 5.5 m/s, and 6.750 at V m = 12 m/s. These values highlight the effect of wind on the characteristics of the rundown phenomenon.
The need to consider the influence of wind arises from the phenomena of increased runup and rundown at strong wind velocities. The increase in the rundown is particularly noteworthy. Existing experiments on wind-induced hydrodynamic changes have primarily focused on the runup and overtopping [11,12,22,39]. However, it is important to analyze both the runup and rundown to assess the stability of breakwater armor stones. This is because the current generated via the rundown can pull the armor stones offshore, leading to damage [40]. In the experiments, the TTP loss mainly occurred under a large rundown, and water escaped in the offshore direction. This is consistent with the results of Aniel-Quiroga et al. [40], who observed that during a rundown, the flow dragged down the armor units at several places. Movements induced by runup, rundown, and rolling impacts increase the risk of armor stone loss or rocking, consequently reducing the stability coefficient [41,42].
Many studies have demonstrated the impact of wind on run-up and wave overtopping, emphasizing the need to consider wind forcing (e.g., [10,15,22,29]). However, the effect of hydrodynamic change due to wind forcing on armor stone stability is not specifically presented. The experimental results showed that the runup and rundown tended to increase with wind velocity. In addition, the stability of the armor stone decreased with increasing wind velocity. While not discussed in this study, wind velocity likely had a notable effect on runup and rundown, as well as associated up-washing and down-washing velocities. When runup occurs, the armor stone is submerged in water, and during rundown, it is exposed to the air. The pressure difference that occurs along with the strong flow is believed to be a major mechanism significantly affecting the stability of the armor stone. Therefore, future research should include an analysis of pressure changes during runup and rundown. This result suggests that it is necessary to consider the influence of wind on the armor stone stability and that there is a risk of overestimating the TTP stability if the influence of wind is not considered.

3.2.3. Fluid Velocity

Figure 8 presents the fluid velocity probability distribution according to the wind velocity. By presenting the fluid velocity as a probability density, a normal distribution was obtained. Hajivalie and Yeganeh-Bakhtiary [43] proposed that clockwise flow dominated at the top portion of the front of a sloping breakwater, whereas anticlockwise flow dominated at the bottom. These findings aligned with the insights provided by Sumer and Fredsoe [44] regarding the causes of scour in sloping breakwaters. Consequently, the normal distribution of the fluid velocity in front of the breakwater is attributed to the periodic current in the specific direction.
The graph shows that the outflow velocity tended to increase as the wind velocity increased. The probability of occurrence of fluid velocity decreased in the onshore direction, whereas that of the outflow velocity increased in the offshore direction. Because the probability followed a normal distribution, the average value was close to zero in all three cases, and the standard deviation increased as the wind velocity increased.
Table 6 summarizes the maximum and minimum fluid velocity and the amount of data for various wind velocities. As the wind velocity increased, the maximum fluid velocity in the offshore direction increased. In the case of (+) fluid velocity in the onshore direction, the results for V m = 0 m/s and 5.5 m/s did not show a large difference, but a difference of approximately 6.7% was observed at 12 m/s. In the case of (-) fluid velocity in the offshore direction, the fluid velocity tended to increase as the wind velocity increased. The maximum offshore fluid velocities were 92.2 cm/s at V m = 0 m/s, 95.5 cm/s at 5.5 m/s, and 99.2 cm/s at 12 m/s. The maximum offshore fluid velocity increased by 3.6% at 5.5 m/s and by 7.6% at 12 m/s. However, the difference in fluid velocity by wind velocity was not large compared to runup and down.
Each dataset contained 35,250 fluid velocity data. At V m = 0 m/s, 614 data were 50 cm/s or more in the offshore direction, which constituted 1.74% of the total data. The corresponding numbers at V m = 5.5 m/s and V m = 12 m/s were 875 (2.48%) and 912 (2.59%), respectively. In addition, the total outflow velocity in the (−) direction increased as the wind velocity increased. The shear force, owing to the increase in fluid velocity, is a very important factor affecting the drag and lift forces, which directly affect the TTP loss [45,46]. As the wind velocity increased, the fluid velocity of the outflow in the (−) direction (toward the offshore) also increased.
A high fluid velocity in the offshore direction generates a strong tractive force and is a major factor in transporting materials offshore [47]. Additionally, wind has a significant effect on the increase in hydrodynamic phenomena, such as runup, rundown, and fluid velocity [3]. Armor stone loss usually occurs under strong winds and high waves; however, the design codes in most countries do not include these factors (e.g., [48,49]). Experimental investigations using wind and wave flumes have been reported in the 1990s [22,39,50], but there is no consensus regarding the effects of wind on the runup, rundown, fluid velocity, and armor stone stability. The stability coefficient of the TTP, as determined from existing laboratory experiments, typically ranges from 7 to 8, which is consistent with the findings of this experiment for V m = 0 m/s [27,28]. As wind velocity increases, the stability coefficient decreases, accompanied by heightened hydrodynamic changes. Strong runup and rundown occur owing to wind velocity, and the resulting increase in fluid velocity was shown to drag down the armor stone, accelerating the loss. Wind causes various hydrodynamic changes and is believed to have a significant impact on TTP stability. However, the scale problem of comparing experimental results with real scale remains. In future studies, it will be important to compare real-scale results with experiments performed under wind wave conditions to establish appropriate scaling laws.

3.2.4. Effect of Wave Period on TTP Damage

To analyze the change in TTP damage according to the wave period, an additional experiment with T p = 2.33 s was performed. Table 7 shows the target and measured values of the experimental wave condition. The TTP damage pattern and timing under both long- and short-period conditions were recorded, and the data were analyzed. The wave height conditions were set to be almost the same as the conditions at T p = 1.45 s. For T p = 2.33 s, the analysis was performed under the wind velocities of 0 and 5.5 m/s.
Table 8 presents the damage patterns (rocking and loss) of the TTP based on changes in the period. When T p = 2.33 s, one TTP loss occurred at H m 0 = 14.9 cm for both V m = 0 and 5.5 m/s. Additionally, rocking started at H m 0 = 13.0 cm for V m = 0 m/s and at H m 0 = 11.9 cm for V m = 5.5 m/s. Consequently, for a period of 2.33 s, the stability coefficient K D was 9.58 at V m = 0 m/s and 7.35 at V m = 5.5 m/s. With an increase in wind velocity from 0 m/s to 5.5 m/s, K D decreased by approximately 23%. Importantly, even for a long wave period, the K D value decreased as the wind velocity increased. At T p = 2.33 s, ground subsidence damage occurred over a wide area. In contrast to the result at T p = 1.45 s, less rocking or loss was observed, but there was overall subsidence, and the TTP interlocking was weakened.

4. Summary and Conclusions

A stability test of the breakwater armor stone under various wave and wind conditions was conducted. From the results of the stability analysis according to the wind velocity, it was confirmed that the stability factor K D decreased as the wind velocity increased. was 7.79 for V m = 0 m/s, 4.86 for V m = 5.5 m/s, and 3.25 for V m = 12 m/s. The stability coefficient at V m = 0 m/s coincided with the well-known values of K D = 7–8 [26,27,28]. However, it decreased by 37.61% and 58.28% at V m = 5 m/s and V m = 12 m/s, respectively.
The probability distribution of the runup tended to follow a Rayleigh distribution [37,38]. The higher the wind velocity, the higher the runup, and the runup was found to have a mild probability distribution. The scale parameter ( σ ) of the Rayleigh distribution was 6.468 for V m = 0 m/s, 6.947 for V m = 5.5 m/s, and 7.035 for V m = 12 m/s. The runup heights of R u , m a x , R u , 2 % , R u , s , and R u , a v g also increased with the wind velocity. R m a x increased by 9.5% at V m = 5.5 m/s and by 23% at 12 m/s compared with the value at V m = 0 m/s. Similar to the runup, the probability of a high rundown increased as the wind velocity increased. The scale parameter σ of the rundown was 5.709 for V m = 0 m/s, 6.312 for V m = 5.5 m/s, and 6.750 for V m = 12 m/s. The values of R d , m a x , R d , 2 % , R d , s , and R d , a v g increased; R d , m a x increased by 3.2% and 9.4% at V m = 5 m/s and V m = 12 m/s, respectively, compared with the value at V m = 0 m/s.
In the fluid velocity distribution, the fluid velocities in the onshore (+) and offshore (−) directions were analyzed. As the wind velocity increased, the fluid velocity in the direction of the outflow to the offshore tended to increase. The maximum fluid velocity in the offshore direction increased by 3.6% at V m = 5.5 m/s and 7.6% for V m = 12 m/s. The maximum fluid velocities at V m = 0 m/s and V m = 5.5 m/s in the onshore direction did not show a significant difference, but the value at V m = 12 m/s was higher by 6.7% than that at V m = 0 m/s. As the wind velocity increased, the outflow velocity in the offshore direction also increased.
Runup, rundown, and fluid velocity are important factors that affect TTP stability [45,46,47]. As the wind velocity increased, the runup and rundown tended to increase. It was determined that the increase in runup and rundown increased the size and range of the wave pressure on the breakwater slope, which affected the stability of the tetrapod. In addition, the shear force of the breakwater slope increases owing to the increase in the outflow velocity, which directly affects the TTP loss. Although not extensively addressed in this study, it has been confirmed that as wind velocity increases, the occurrence of water spray and overtopping phenomena becomes more pronounced. Overtopping may also cause significant damage to the hinterland and induce hydrodynamic changes, warranting a more detailed investigation. Additionally, it is deemed necessary to analyze the pressure difference that occurs during upwashing and downwashing. These results suggest that it is necessary to consider the influence of wind when analyzing the stability of breakwater armor stones. However, given the absence of universally accepted guidelines for scaling wind and waves, the comparison between real-scale and experimental findings becomes challenging. Therefore, it is essential that future studies juxtapose real-scale results with experiments performed under wind wave conditions to establish appropriate scaling laws.

Author Contributions

Conceptualization, Y.-M.K., J.-H.L. and H.-D.Y.; methodology, Y.-M.K., J.-H.L. and H.-D.Y.; validation, Y.-M.K., J.-H.L. and H.-D.Y.; formal analysis, Y.-M.K. and J.-H.L.; investigation, Y.-M.K. and J.-H.L.; writing—original draft preparation, Y.-M.K. and H.-D.Y.; writing—review and editing, Y.-M.K. and H.-D.Y.; visualization, Y.-M.K.; supervision, H.-D.Y.; project administration, Y.-M.K. and H.-D.Y.; funding acquisition, H.-D.Y. All authors have read and agreed to the published version of the manuscript.

Funding

This work was supported by a National Research Foundation of Korea (NRF) grant funded by the Korean Government (MSIT) (No. 2022R1A2C1009446). This research was also supported by the Korea Institute of Marine Science and Technology Promotion (KIMST), which was funded by the Ministry of Oceans and Fisheries.

Institutional Review Board Statement

Not applicable.

Informed Consent Statement

Not applicable.

Data Availability Statement

Data is contained within the article.

Acknowledgments

The authors thank researchers at the Korea Institute of Ocean Science and Technology (KIOST) for their assistance in the experiments and valuable discussions.

Conflicts of Interest

The authors declare no conflicts of interest.

References

  1. Patterson, J.; Ford, G. The damaging impacts of hurricanes upon coastal structures. In Proceedings of the ASEE Southeast Section Conference, Marietta, GA, USA, 5–7 April 2009. [Google Scholar]
  2. Fukuda, N.; Uno, T.; Irie, I. Field observations of wave overtopping of wave absorbing revetment. Coast. Eng. Jpn. 1974, 17, 117–128. [Google Scholar] [CrossRef]
  3. Medina, J.R. Wind effects on runup and breakwater crest design. In Proceedings of the 26th International Conference on Coastal Engineering, Copenhagen, Denmark, 22–26 June 1998; pp. 1068–1081. [Google Scholar] [CrossRef]
  4. Hudson, R.Y. Laboratory investigation of rubble-mound breakwaters. J. Waterw. Harb. Div. 1959, 85, 93–121. [Google Scholar] [CrossRef]
  5. Van der Meer, J.W. Stability of breakwater armour layers—Design formulae. J. Coast. Eng. 1987, 11, 219–239. [Google Scholar] [CrossRef]
  6. Hashida, M.; Matsunaga, N.; Irie, I. Landward transport of spray generated from a wave absorbing sea wall. In Proceedings of the International Conference on Coastal Engineering, Orlando, FL, USA, 2–6 September 1996; pp. 1022–1033. [Google Scholar] [CrossRef]
  7. Carrasco, A.R.; Reis, M.T.; Neves, M.G.; Ferreira, O.; Matias, A.; Almeida, S. Overtopping hazard on a rubble mound breakwater. J. Coast. Res. 2014, 70, 247–252. [Google Scholar] [CrossRef]
  8. Diwedar, A.I. Investigating the effect of wave parameters on wave runup. Alex. Eng. J. 2016, 55, 627–633. [Google Scholar] [CrossRef]
  9. Hughes, S.A. Estimation of wave run-up on smooth, impermeable slopes using the wave momentum flux parameter. J. Coast. Eng. 2004, 51, 1085–1104. [Google Scholar] [CrossRef]
  10. Yamashiro, M.; Yoshida, A.; Hashimoto, H.; Kurushima, N.; Irie, I. Conversion of the wind velocity in wave-overtopping experiment into the wind velocity of the real coast. Proc. Civ. Eng. Ocean 2004, 20, 653–658. [Google Scholar] [CrossRef]
  11. Yamashiro, M.; Yoshida, A.; Yoshioka, T.; Hashimoto, H.; Moriya, Y. Effect of wind to wave-overtopping and water spray on non wave-overtopping type seawall in deepwater. Proc. Civ. Eng. Ocean 2005, 21, 611–616. [Google Scholar] [CrossRef]
  12. Shim, G.-T.; Kim, G.-H. Review of hydraulic characteristics of the entire revetment in a coexistence of waves and wind. J. Korean Soc. Coast. Ocean Eng. 2020, 32, 575–586. [Google Scholar] [CrossRef]
  13. Sous, D.; Forsberg, P.L.; Touboul, J.; Nogueira, G.G. Laboratory experiments of surf zone dynamics under on- and offshore wind conditions. Coast. Eng. 2021, 163, 103797. [Google Scholar] [CrossRef]
  14. de Waal, J.P.; Tönjes, P.; van der Meer, J.W. Wave overtopping of vertical structures including wind effect. In Proceedings of the 25th International Conference on Coastal Engineering, ASCE, Orlando, FL, USA, 2–6 September 1996. [Google Scholar] [CrossRef]
  15. Ward, D.L.; Wibner, C.G.; Zhang, J. Runup on coastal revetments under the influence of onshore wind. J. Coast. Res. 1998, 14, 1325–1333. [Google Scholar]
  16. Mares-Nasarre, P.; Molines, J.; Gómez-Martín, M.E.; Medina, J.R. Hydraulic stability of cube-armored mound breakwaters in depth-limited breaking wave conditions. Ocean Eng. 2022, 259, 111845. [Google Scholar] [CrossRef]
  17. Van der Meer, J.W. Rock Slopes and Gravel Beaches under Wave Attack. Ph.D. Thesis, Technical University of Delft, Delft, The Netherlands, 2020. [Google Scholar]
  18. Kobune, K.; Sasaki, H.; Hashimoto, N. Characteristics of ocean waves off cape Nojima in the North Western Pacific, measured with a discus buoy. Coastal Eng. Jpn. 1988, 30, 45–62. [Google Scholar] [CrossRef]
  19. Bretschneider, C. Significant waves and wave spectrum. In Ocean Ocean Industry; Gulf Publishing Company: Houston, TX, USA, 1968; pp. 40–46. Available online: https://cir.nii.ac.jp/crid/1574231875266506752 (accessed on 15 March 2024).
  20. Mitsuyasu, H. On the growth of wind-generated waves (2)—Spectral shape of wind waves at finite fetch. In Proceedings of the 17th Japanese Conference on Coastal Engineering, Kyoto, Japan, 16–21 October 1970; pp. 1–7. Available online: https://cir.nii.ac.jp/crid/1573105975214720000 (accessed on 15 March 2024).
  21. Korea Meteorological Administration (KMA). Korean Peninsula TYPHOON analysis Report 2020. National Typhoon Center Technical Note, Daejeon–si, Republic of Korea, 11-1360000-001533-10. Available online: https://www.kma.go.kr/download_01/typhoon/typeffect_2020.pdf (accessed on 15 March 2024).
  22. Inagaki, N.; Shibayama, T.; Nakamura, R.; Ishibashi, K.; Esteban, M. Experimental investigation into the effects of strong winds on the transport of overtopping water mass over a vertical seawall. Coast. Eng. J. 2023, 1–15. [Google Scholar] [CrossRef]
  23. Lee, J.S.; Suh, K.-D. Development of stability formulas for rock armor and tetrapod using multigene genetic programming. J. Waterw. Port Coast. Ocean Eng. 2020, 146, 04019027. [Google Scholar] [CrossRef]
  24. Lee, D.-S.; Oh, S.-H.; Cho, B.-S. Experimental investigation on the change in tetrapod stability coefficient according to the difference in specific gravity. J. Korean Soc. Coast. Ocean Eng. 2016, 28, 124–131. [Google Scholar] [CrossRef]
  25. Suh, K.-D.; Kim, M.; Kim, S.-W. Comparison of calculation methods of cumulative damage to breakwater armor layer. J. Waterw. Port Coast. Ocean Eng. 2012, 139, 277–285. [Google Scholar] [CrossRef]
  26. Kim, Y.-T.; Lee, J.-I. Hydraulic experiment on the stable weight and coverage of Tetrapods mounted on the head of an inclined breakwater: Non-crushing wave conditions. J. Korean Soc. Coast. Ocean Eng. 2017, 29, 389–398. [Google Scholar] [CrossRef]
  27. Ministry of Oceans and Fisheries (MOF). Design Standards for Harbor and Fishery Port 2017, Sejong–si, Republic of Korea, 11-1192000-000184-14 (KDS 64 00 00). Available online: https://www.mof.go.kr/search/selectTotalList.do?menuSeq=955 (accessed on 15 March 2024).
  28. USACE. Coastal Engineering Manual; U.S. Army Coastal Engineering Research Center, U.S. Army Engineer Waterways Experiment Station: Vicksburg, MI, USA, 2005. [Google Scholar]
  29. González-Escrivá, J.A. The role of wind in wave runup and overtopping of coastal structures. Coast. Eng. 2006, 5, 4766–4778. [Google Scholar] [CrossRef]
  30. Suh, K.D.; Park, W.S. Wave reflection from perforated-wall caisson breakwaters. Coast. Eng. 1995, 26, 177–193. [Google Scholar] [CrossRef]
  31. Pedersen, J. Wave Forces and Overtopping on Crown Walls of Rubble Mound Breakwaters: An Experimental Study. Ph.D. Thesis, Hydraulic & Coastal Engineering Lab, Dept. of Civil Engineering, University of Aalborg, Aalborg, Denmark, 1996. [Google Scholar]
  32. Shankar, N.J.; Jayaratne, M.P.R. Wave run-up and overtopping on smooth and rough slopes of coastal structures. Ocean Eng. 2003, 30, 221–238. [Google Scholar] [CrossRef]
  33. Sakakiyama, T.; Liu, P.L.-F. Laboratory experiments for wave motions and turbulence flow in front of a breakwater. Coast. Eng. 2001, 44, 117–139. [Google Scholar] [CrossRef]
  34. Sundar, V.; Ragu, V. Dynamic pressures and run-up on semicircular breakwaters due to random waves. Ocean Eng. 1998, 25, 221–241. [Google Scholar] [CrossRef]
  35. Oh, S.-H.; Kwon, O.-S. Comparison of Wave Runup Formula Used in Domestic and Foreign Countries; Korean Society of Coastal and Ocean Engineers: Seoul, Republic of Korea, 2009; Volume 18, pp. 176–179. [Google Scholar]
  36. Di Leo, A.; Dentale, F.; Buccino, M.; Tuozzo, S.; Carratelli, E.P. Numerical analysis of wind effect on wave overtopping on a vertical seawall. Water 2022, 14, 3891. [Google Scholar] [CrossRef]
  37. Denissenko, P.; Didenkulova, I.; Rodin, A.; Listak, M.; Pelinovsky, E. Experimental statistics of long wave runup on a plane beach. J. Coast. Res. 2013, 65, 195–200. [Google Scholar] [CrossRef]
  38. Nielsen, P.; Hanslow, D.J. Wave runup distributions on natural beaches. J. Coast. Res. 1991, 7, 1139–1152. [Google Scholar]
  39. Ward, D.L.; Wibner, C.G.; Zhang, J.; Edge, B. Wind effects on runup and overtopping. In Proceedings of the 24th International Conference on Coastal Engineering, Kobe, Japan, 23–28 October 1994; pp. 1687–1699. [Google Scholar] [CrossRef]
  40. Aniel-Quiroga, I.; Vidal, C.; Lara, J.L.; González, M.; Sainz, A. Stability of rubble-mound breakwaters under tsunami first impact and overflow based on laboratory experiments. Coast. Eng. 2018, 135, 39–54. [Google Scholar] [CrossRef]
  41. Latham, J.P. Degradation model for rock armour in coastal engineering. Q. J. Eng. Geol. Hydrogeol. 1991, 24, 101–188. [Google Scholar] [CrossRef]
  42. Ehsani, M.; Moghim, M.N.; Shafieefar, M. An experimental study on the hydraulic stability of Icelandic-Type berm breakwaters. Coast. Eng. 2020, 156, 103599. [Google Scholar] [CrossRef]
  43. Hajivalie, F.; Yeganeh-Bakhtiary, A. Numerical study of breakwater steepness effect on the hydrodynamics of standing waves and steady streaming. J. Coast. Res. 2009, 56, 514–518. [Google Scholar]
  44. Sumer, B.M.; Fredsøe, J. Experimental study of 2D scour and its production at a rubble-mound breakwater. Coast. Eng. 2000, 40, 59–87. [Google Scholar] [CrossRef]
  45. Kim, K.H.; Park, J.H.; Ma, H.S. Applicability evaluation of tetrapod debris barrier—A case of Honggyeri area in Sanchung county. J. Korean Soc. Environ. Restor. Technol. 2012, 15, 119–132. [Google Scholar] [CrossRef]
  46. Morison, J.R.; Johnson, J.W.; Schaaf, S.A. The force exerted by surface waves on piles. J. Petrol. Technol. 1950, 2, 149–154. [Google Scholar] [CrossRef]
  47. Cho, Y.J. Numerical analysis of the beach stabilization effect of an asymmetric ripple mat. J. Korean Soc. Coast. Ocean Eng. 2019, 31, 209–220. [Google Scholar] [CrossRef]
  48. Goda, Y.; Kishira, Y.; Kamiyama, Y. Laboratory investigation on the overtopping rate of seawalls by irregular waves. Port Harb. Res. Inst. 1975, 14, 4. [Google Scholar]
  49. USACE. Shore Protection Manual; U.S. Army Coastal Engineering Research Center, U.S. Army Engineer Waterways Experiment Station: Vicksburg, MI, USA, 1984. [Google Scholar]
  50. Douglass, S.L. Influence of wind on breaking waves. J. Waterw. Port Coast. Ocean Eng. 1990, 116, 651–663. [Google Scholar] [CrossRef]
Figure 1. Laboratory experiment and cross-sectional view of the experimental setup for breakwater armor stone stability according to wind velocity.
Jmse 12 00499 g001
Figure 2. Current meter and anemometer used in the experiment. (a): Location of installation of measuring instrument; (b) Hot-wire anemometer; (c) Wave height and current meter gauges located at S.W.L of −20 cm.
Jmse 12 00499 g002
Figure 3. Wind velocity field generation results. (a) Reference point. Measurement points were selected at intervals of 5 to 15 cm; (b) Wind velocities under a wind field of 5.5 m/s; (c) Wind velocities under a wind field of 12 m/s.
Jmse 12 00499 g003
Figure 4. Photo of runup and rundown when TTP loss occurs. Left: runup and water spray at different wind velocities; Right: rundown and wave breaking.
Jmse 12 00499 g004
Figure 5. Changes in wave spectrum according to wind velocity in front of the breakwater (red: V m = 0 m/s, green: V m = 5.5 m/s, and blue: V m = 12 m/s).
Jmse 12 00499 g005
Figure 6. Hydrodynamic time series data via wind velocity ( H m 0 = 13.0 cm, T p = 1.45 s). R represents the rocking point, and L represents the loss point. Regarding the runup and rundown, the (+) value represents the runup, and the (−) value represents the rundown. Regarding the fluid velocity, the (+) value represents the onshore direction, and the (−) value represents the offshore direction (red: V m = 0 m/s, green: V m = 5.5 m/s, and blue: V m = 12 m/s).
Jmse 12 00499 g006
Figure 7. Wave runup and rundown histograms according to wind velocity. (ac) Runup histograms according to wind velocity; (d) Comparison of runup probability distribution fitted with Rayleigh distribution according to wind velocity; (eg) Rundown histogram according to wind velocity; (h) Comparison of rundown probability distribution fitted with Rayleigh distribution according to wind velocity.
Jmse 12 00499 g007
Figure 8. Probability density function of wave velocity for (a) V m = 0 m/s, (b) V m = 5.5 m/s, and (c) V m = 12 m/s; (d) Comparison of probability densities for various wind velocities.
Jmse 12 00499 g008
Table 1. Wave conditions used in the experiment (target: experiment target wave height and period, measured data: wave height and period measured at WG4~6).
TargetMeasured Data
T s (s) T p (s) H s (cm) H m 0 (cm) T p (s)
1.411.4577.31.52
88.21.52
99.11.57
1010.31.54
1111.41.63
1212.11.41
1313.01.41
1414.21.55
1515.31.55
Table 2. Model and prototype wind velocities ( V m : model wind velocity, V p : prototype wind velocity).
V m (m/s) V p (m/s)
[Froude Scale]
V p (m/s)
[10]
000
5.538.916.5
1284.836
Table 3. Results of stability factor ( K D ). R : Rocking TTP cumulative number, L : Loss TTP cumulative number. The values within round brackets represent the reduction rate compared with K D under the condition of V m = 0 m/s.
Wave   Height   H m 0 (cm)Wind Velocity (m/s) K D
05.512
7.3---1.68
8.22.37
9.1 R : 1, L : 03.25
10.3 R : 4, L : 0 R : 4, L : 04.86
11.4 R : 5, L : 0 R : 5, L : 16.50
12.1 R : 1, L : 0 R : 6, L : 1 R : 7, L : 17.79
13.0 R : 1, L : 1 R : 8, L : 2 R : 9, L : 29.58
14.2 R : 2, L : 2 R : 8, L : 4 R : 9, L : 412.54
15.3 R : 6, L : 3 15.59
Calculated K D 7.79
(-)
4.86
(−37.61)
3.25
(−58.28)
Table 4. Hydrodynamic values at the time of TTP loss ( R u : runup height, R d : rundown height, U o n : fluid velocity in onshore direction, and U o f f : fluid velocity in offshore direction). R d and U o f f have negative values, but absolute values are used for convenience in comparison.
V m (m/s) R u (cm) R d (cm) U o n (cm/s) U o f f (cm/s)
019.97
(-)
15.53
(-)
74.85
(-)
78.21
(-)
5.525.52
(27.79%)
17.20
(10.75%)
68.85
(−8.02%)
95.50
(22.11)
1223.74
(18.88%)
17.20
(10.75%)
78.59
(5.00%)
98.94
(26.51%)
Table 5. Changes in wave runup and rundown under different wind velocity conditions. R u denotes the runup, and R d denotes the rundown. The values in the round brackets are the increase in the runup (rundown) height compared with the value at V m = 0 m/s. Square brackets contain the percentage values based on the number of data intervals (max: maximum height, 2%: average height of the top 2%, s: average height of the top 33%, and avg: total average height).
Runup
height
V m (m/s)Number of runup height data R u , m a x (cm) R u , 2 % (cm) R u , s (cm) R u , a v g (cm)
~5 cm5~10 cm10~15 cm15~20 cm~20 cm
0126
[26.1%]
204
[42.3%]
118
[24.5%]
30
[6.2%]
4
[0.8%]
23.30
(-)
19.20
(-)
13.09
(-)
8.18
(-)
5.585
[17.3%]
244
[49.8%]
106
[21.6%]
47
[9.6%]
8
[1.6%]
25.52
(9.5%)
21.49
(11.9%)
13.91
(6.3%)
8.80
(7.6%)
1266
[14.0%]
250
[53.1%]
104
[22.1%]
43
[9.1%]
8
[1.7%]
28.84
(23.8%)
22.02
(14.7%)
14.08
(7.6%)
8.93
(9.2%)
Rundown
height
V m (m/s)Rundown height data number R d , m a x (cm) R d , 2 % (cm) R d , s (cm) R d , a v g (cm)
~5 cm5~10 cm10~15 cm15~20 cm~20 cm
0127
[26.9%]
235
[49.8%]
100
[21.2%]
10
[2.1%]
0
[0%]
17.75
(-)
15.30
(-)
8.88
(-)
7.23
(-)
5.583
[17.7%]
241
[51.3%]
130
[27.7%]
16
[3.4%]
0
[0%]
18.31
(3.2%)
16.09
(5.2%)
9.98
(12.4%)
8.21
(13.6%)
1248
[10.3%]
264
[56.5%]
122
[26.1%]
33
[7.1%]
0
[0%]
19.41
(9.4%)
16.64
(8.8%)
10.54
(18.7%)
8.92
(23.4%)
Table 6. Number and probability of data by fluid velocity ((−): offshore direction and (+): onshore direction).
V m (m/s)Fluid Velocity (cm/s) Data NumberMax
(cm/s)
Min
(cm/s)
~−75−75~−50−50~−25−25~00~2525~5050~75~75
060
(0.17%)
554
(1.57%)
3435
(9.74%)
12862
(36.49%)
13518
(38.35%)
4236
(12.02%)
570
(1.62%)
15
(0.04%)
90.9−92.2
5.5144
(0.41%)
731
(2.07%)
4000
(11.35%)
13384
(37.97%)
12673
(35.95%)
3845
(10.91%)
470
(1.33%)
3
(0.01%)
89.3−95.5
12147
(0.42%)
765
(2.17%)
3862
(10.96%)
13343
(37.85%)
12567
(35.65%)
3919
(11.12%)
612
(1.74%)
35
(0.10%)
97.0−99.2
Table 7. Long-period wave conditions used in the experiment (target: experiment target wave height and period, measured data: wave height and period measured at WG4~6).
TargetMeasured Data
T s (s) T p (s) H s (cm) H m 0 (cm) T p (s)
2.262.3377.12.41
88.12.21
99.12.64
1010.12.41
1111.32.21
1211.92.64
1313.02.41
1413.92.64
1514.92.48
Table 8. Change in TTP stability coefficient K D due to long-period conditions.
Measured DataWind Velocity
H m 0 (cm) T p (s) V m = 0 m/s V m = 5.5 m/s
7.12.41--
8.12.21
9.12.64
10.12.41
11.32.21
11.92.64 R : 2, L : 0
13.02.41 R : 2, L : 0 R : 4, L : 0
13.92.64 R : 4, L : 0 R : 7, L : 0
14.92.48 R : 5, L : 1 R : 7, L : 1
Calculate   K D 9.587.35
Disclaimer/Publisher’s Note: The statements, opinions and data contained in all publications are solely those of the individual author(s) and contributor(s) and not of MDPI and/or the editor(s). MDPI and/or the editor(s) disclaim responsibility for any injury to people or property resulting from any ideas, methods, instructions or products referred to in the content.

