1. Introduction
As global trade accelerates, emission reduction from shipping is urgently needed. From 2012 to 2018, sulfur emissions from shipping increased from 10.8 million tons to 11.4 million tons, accounting for 13% of global sulfur emissions [
1,
2]. The International Maritime Organization (IMO) announced that if left unchecked, sulfur emissions from the sea would increase by 140% in 2012, which would hinder the achievement of environmental sustainability goals [
3,
4,
5]. At the end of 2020, the IMO issued short-term emission reduction recommendations for ships, which set out requirements in terms of both technical energy efficiency indicators and operational SO
x and NO
x intensity rating mechanisms, of which the global eco-designed bulk cargo newbuilding orders for the period of 2000–2020 are shown in
Figure 1.
At the same time, the shipping industry was ordered to adapt to stricter emission reduction regulations, which can facilitate the optimization of ship speed, the use of alternative fuels, and the accelerated application of technology in the shipping industry [
6,
7]. However, from a commercial aspect, the effect of increasingly stringent standards on the competitiveness of new and old ships cannot be underestimated. Therefore, ships must stand the test of the future, especially the designs of environmentally friendly ships [
8,
9]. To reduce SO
X and NO
X emissions, major shipping companies such as Maersk, COSCO, and MSC have acted to cope with increasingly stringent emission-control policies. For example, Maersk is gradually replacing traditional fuel with methanol and biofuels (
maersk.com.cn/sustainability/reports-and-resources, accessed on 8 January 2024). Furthermore, as of 30 December 2019, COSCO has fully completed the conversion of high-sulfur oil to low-sulfur oil (
lines.coscoshipping.com/home/About/socialResponsibility/sustainabilityReport, accessed on 8 January 2024). By limiting the upper sulfur content of marine fuel and gradually installing an exhaust gas purification system, MSC reduced sulfur emissions by 86% in 2020 compared to 2019 (
msccargo.cn/en/sustainability, accessed on 8 January 2024). The measures taken by major shipping companies in response to the ECAs are listed in
Table 1. In summary, choosing an environmentally friendly ship design is crucial for reducing pollution emissions. The most available clean fuel is liquefied natural gas (LNG), and available environmental methods include SO
x Scrubber, electronic engines, and shore-to-ship electricity [
2,
10].
It is worth noting that the most relevant research on the effectiveness of the MARPOL Annex mainly focuses on ship engineering and operational management [
11,
12,
13,
14,
15]. In particular, Zhang et al. discussed the disposal of garbage by the IMO in international transportation, which promoted better governance of shipping pollution and a reduction of marine emissions [
16]. In addition, Lion et al. and Sakib et al. also explored pollution from ship activities [
17,
18]. However, pollutants caused by ship navigations are caused by different fuel sources [
19]. In particular, Halff et al. argued that the IMO has paradoxically slowed the rapid transition of the shipping market from traditional marine fuels to other fuels [
20]. Beyond that, Kokosalakis et al. obtained the same result from cross-sectional analysis [
21]. Meanwhile, Peng et al. estimated the detection efficiency and theoretical pollution diffusion of ship fuels at Yantian Port [
22]. On this basis, Theocharis et al. evaluated the feasibility of the North Sea route for seasonal operations of finished oil tankers using alternative fuels under IMO restrictions [
23].
Meanwhile, some scholars have considered the environmental effects of new shipbuilding orders from the perspectives of ship design, ship performance, and ship emissions [
24,
25,
26,
27]. As reported by the IPCC, Lindstad et al. discussed the probabilities of maximizing cargo-carrying capacity at the lowest shipbuilding costs to test the potential reductions by combining ship design and alternative power [
28]. In particular, Li et al. investigated the economic and emission assessments in the Yangtze River inland waterway networks to propose the fuel consumption calculation formulas for LNG-fueled ships [
29]. In addition, Fan et al. involved data preprocessing, sample size, model type, operating condition, and feature type in quantitatively predicting new-energy ship fuel consumption [
30]. To our knowledge, most of the current research on shipbuilding is centered on ship emissions, ship fuel consumption, and ship pollution, but no scholars have been involved in considering the impact of ECA on new-energy shipbuilding from a macro perspective.
However, the above-mentioned scholars used regression models to conduct empirical analyses to examine whether ECA could improve the marine environment and how ship efficiency affects emissions. Based on annual shipbuilding data, the synthetic control method is used to quantify the effect of ECA on environmentally friendly ship construction. This study aims to provide recommendations for policymakers by examining the effects of ECA policy on environmentally friendly ship orders. The novelty of our research can be summarized as follows. Starting from the most recent data, the effects of ECAs on ship construction via the synthetic control method is quantified, which allows for the analysis of individual countries and further explores the effects of ECA policies in different countries. Next, the robustness of the synthetic control method via a placebo test and the difference-in-difference method is validated. In addition, the effects of ECAs are explored from the perspectives of shipowners and shipbuilders using textual analysis methods. Finally, our findings can explore the diversity of shipbuilding policies, as well as provide managerial and practical insights for the shipbuilding industry.
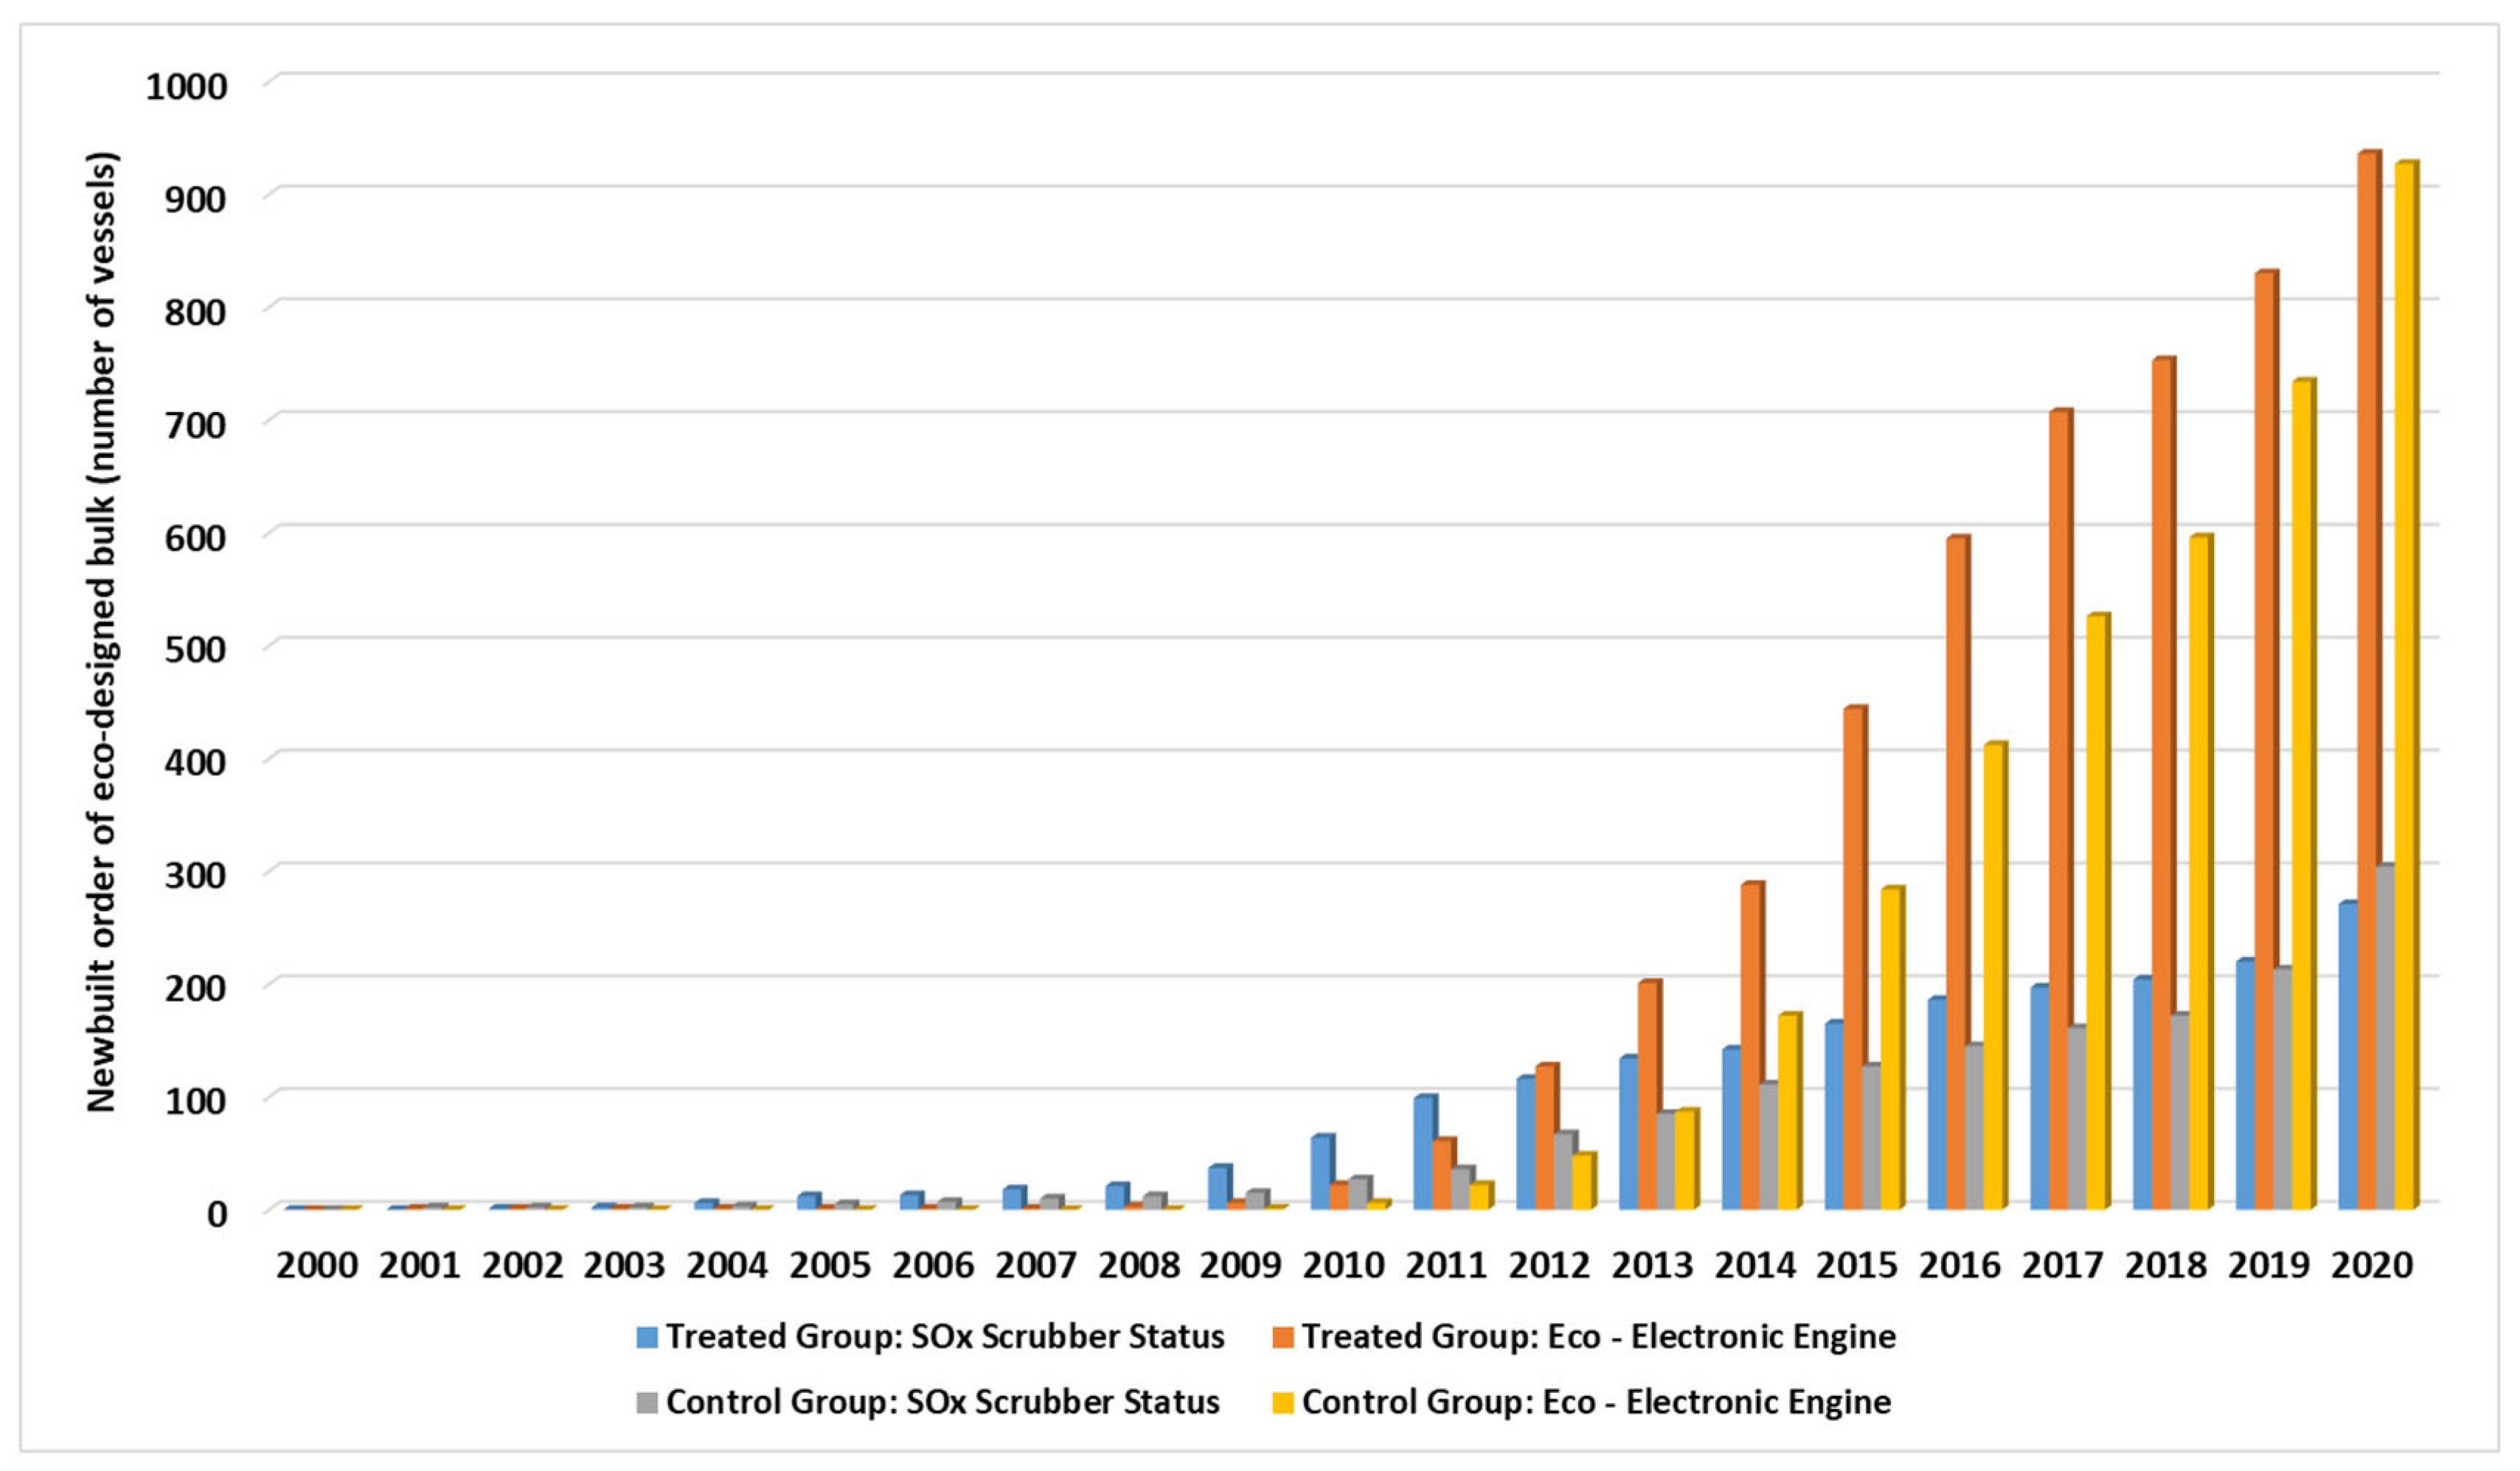
In this research, the impacts of emission-control areas on the shipbuilding industry are quantitatively evaluated. However, this research focuses on low-sulfur-emitting ships and ships powered by electricity, while other new energy sources, such as methanol, ammonia, and other new energy sources, are not taken into account due to the small sample size and insufficient laws. This paper compares the proportion of environmentally friendly ships by type, period, and building country via Clarkson’s annual reports, as shown in
Figure 2. Notice that the main reason for choosing bulk carriers is that they constitute the largest new orders for eco-designed ships and bear the burden of most of the global seaborne trade. New orders for environmentally friendly ships rose rapidly after the ECA policy came into effect in 2010. If ECA policies do not work for the shipbuilding industry, orders for eco-designed ships will be almost the same as in other years.
The rest of our study is organized as follows.
Section 2 presents the main methodology. We provide the original data and investigate the empirical results in
Section 3. Finally, conclusions and managerial insights are given in
Section 4.
2. Methodology
To explore whether a special policy will lead to a certain result, some scholars adopted the synthetic control method to address this issue [
31,
32]. The basic idea is to build a “counterfactual” control unit based on the available data and objectives, construct a virtual control unit by assigning different weights to a linear combination of several control groups similar to the treatment groups, and then compare the differences between the objectives and the control unit after the policy has been implemented, therefore evaluating the policy performance. Compared with other econometric methods, the advantage of the synthetic control method is the ability to assess the performance of individual countries and add the analysis of spatial variability to better derive the spatial–temporal effects of policies. On this basis, the implementation of ECA is considered to be a quasi-natural experiment, where the areas with and without implemented ECA are defined as experimental groups and control groups to ensure the optimal weight of linear combination in the control group through predictive variables. In addition, before implementing ECA, counterfactual composite control variables with similar characteristics are nested into the experimental group, and the impact of ECAs is discussed by comparing differences in new orders for ship construction.
In this study, it is supposed that the regions i
1, 2,
,
1 in the period t
[1,
] are collected, where
(1
) is the setting time of emission-control areas. We define
as the order of bulk in the
i region at the
t period, which is impacted by emission-control areas. Hence, when t
[1, T
0], there is
. After setting the emission-control area (
),
is the effect of emission-control areas. For the regions without any emission-control area,
is a known value, whereas
is unknown where it needs to be synthesized. However, for the regions with emission-control areas,
is an unknown value, whereas
is known. According to previous studies, the data with the following equation is estimated to calculate the orders of ships in the
i region at the
t period as follows [
1,
31,
33]:
where
is the fixed-time effect,
is a 1
F-dimensional unknown vector of parameter,
is a 1
F-dimensional vector of unobserved regional fixed effect, and
indicates the error term. Beyond that,
represents a F
1-dimensional vector of control variables that is not influenced by the implementation of emission-control areas, whereas
means a F
1 vector of unobservable regional fixed effect. Under this structure, if the
i region sets emission-control areas and the rest of the regions without setting emission-control areas, an F
1-dimensional vector of weights
is designed to ensure
and
. Hence, the specific value of each vector
represents a potential combination of synthetic control, i.e., a specific weight for J regions. For each control group, the value of the variable is weighted to be obtained as follows:
From the above, there exists
, which makes
and
if
; thus
Under normal conditions, if the period before the policy is longer than the time range for the implementation of emission-control areas, then the mean value:
Next, in the implementation period of the emission-control area, this study regards
as the value of unbiased estimation
; thus, the estimated value of policy effect is
and the average value of the policy effect is
, where t
[
T0,
T]. We define
as an F
1-dimensional vector that results in linear combination before the policy implementation, e.g.,
. Thus, if
and
, the variable value is just a certain period before the policy implementation (e.g.,
); otherwise,
. Furthermore, we define X
1 as an F
1-dimensional vector, which represents the data combination of control variables before the implementation policy, and X
2 as an F
J matrix, which reports the data combination of control variables. Thus, the optimal vector of weights
minimizes the distance:
where
can be regarded as an F
F symmetric and positive semidefinite matrix.
3. Empirical Results and Discussion
3.1. Data Source
Due to the requirements of the synthetic control methods, the time period before the policy intervention should be retained for a long period to make the degree-of-order curves between the actual group and the synthetic group fit [
34]. Therefore, due to the absence of emission-control areas in our research before 2010, the monthly order data used for eco-designed ships from January 2000 to December 2020 are provided by the Clarkson Shipping Intelligence Network (
https://sin.clarksons.net, accessed on 21 September 2021). In particular, the monthly order data for eco-designed ships from 20 regions (Argentina, Australia, Bangladesh, Brazil, Cyprus, India, Indonesia, Japan, Malaysia, Monaco, Philippines, Singapore, Thailand, UAE, and Vietnam) include the installation of SOx scrubbers and the design of eco-electronic engines, where five regions (China, The Netherlands, Republic of Korea, the UK, and the USA) have set emission-control areas as shown in
Figure 3. Intuitively, after the gradual implementation of the ECA policy in 2010, the number of orders for environmentally friendly ships in both the treatment and control countries has increased significantly. This suggests that the treatment and control groups remain the same in terms of changes in the main variable of environmentally friendly ships, and those in the control group can simulate the changes in the orders of the countries in the treatment group better in the synthetic control method.
Since there are significant fluctuations in the monthly order data of eco-designed ships, it is not possible to visually display the differences between the actual group and the synthetic group. Hence, the cumulative order data of eco-designed ships is considered to display a stable trend. In addition, the reason these data are used is that some regions in the collected samples do not have new shipbuilding orders in the early stage, which can make it difficult to obtain the synthetic control subject through the weight of the control group; thus, these data are not employed. Here, as shown in
Table 2, four predictive factors (oil consumption, GDP growth rate, goods import growth rate, and goods export growth rate) are considered to obtain the synthetic group.
3.2. Empirical Results
In this study, it is believed that all treatment groups use the default starting period to set emission-control areas. Because of the different regions setting emission-control areas at different time points, the treatment group is not analyzed as a mixed target according to existing research but instead constructs a synthetic group for different regions separately. Therefore, the effect of setting emission-control areas is measured by the difference between the monthly data of new shipbuilding orders in the treatment group and synthesis group. Taking the People’s Republic of China as an example, the implementation time of emission-control areas was in 2015 and 2020, respectively. Therefore, this study introduces four predictive factors from 2000 to 2020 (oil consumption, GDP growth rate, good import growth rate, and good export growth rate) to fit the synthetic control variables. Next, the implementation influence of emission-control areas in China is reflected by the differences in shipbuilding orders between China and its synthetic group after 2015, with the weight-selection criterion minimizing the mean-square error of shipbuilding orders in the period prior to the implementation of emission-control areas. Stata 16 software was used in this study to perform synthetic control method regression on the collected data. Furthermore, the weight of synthetic control groups corresponding to all treatment groups is shown in
Table 3.
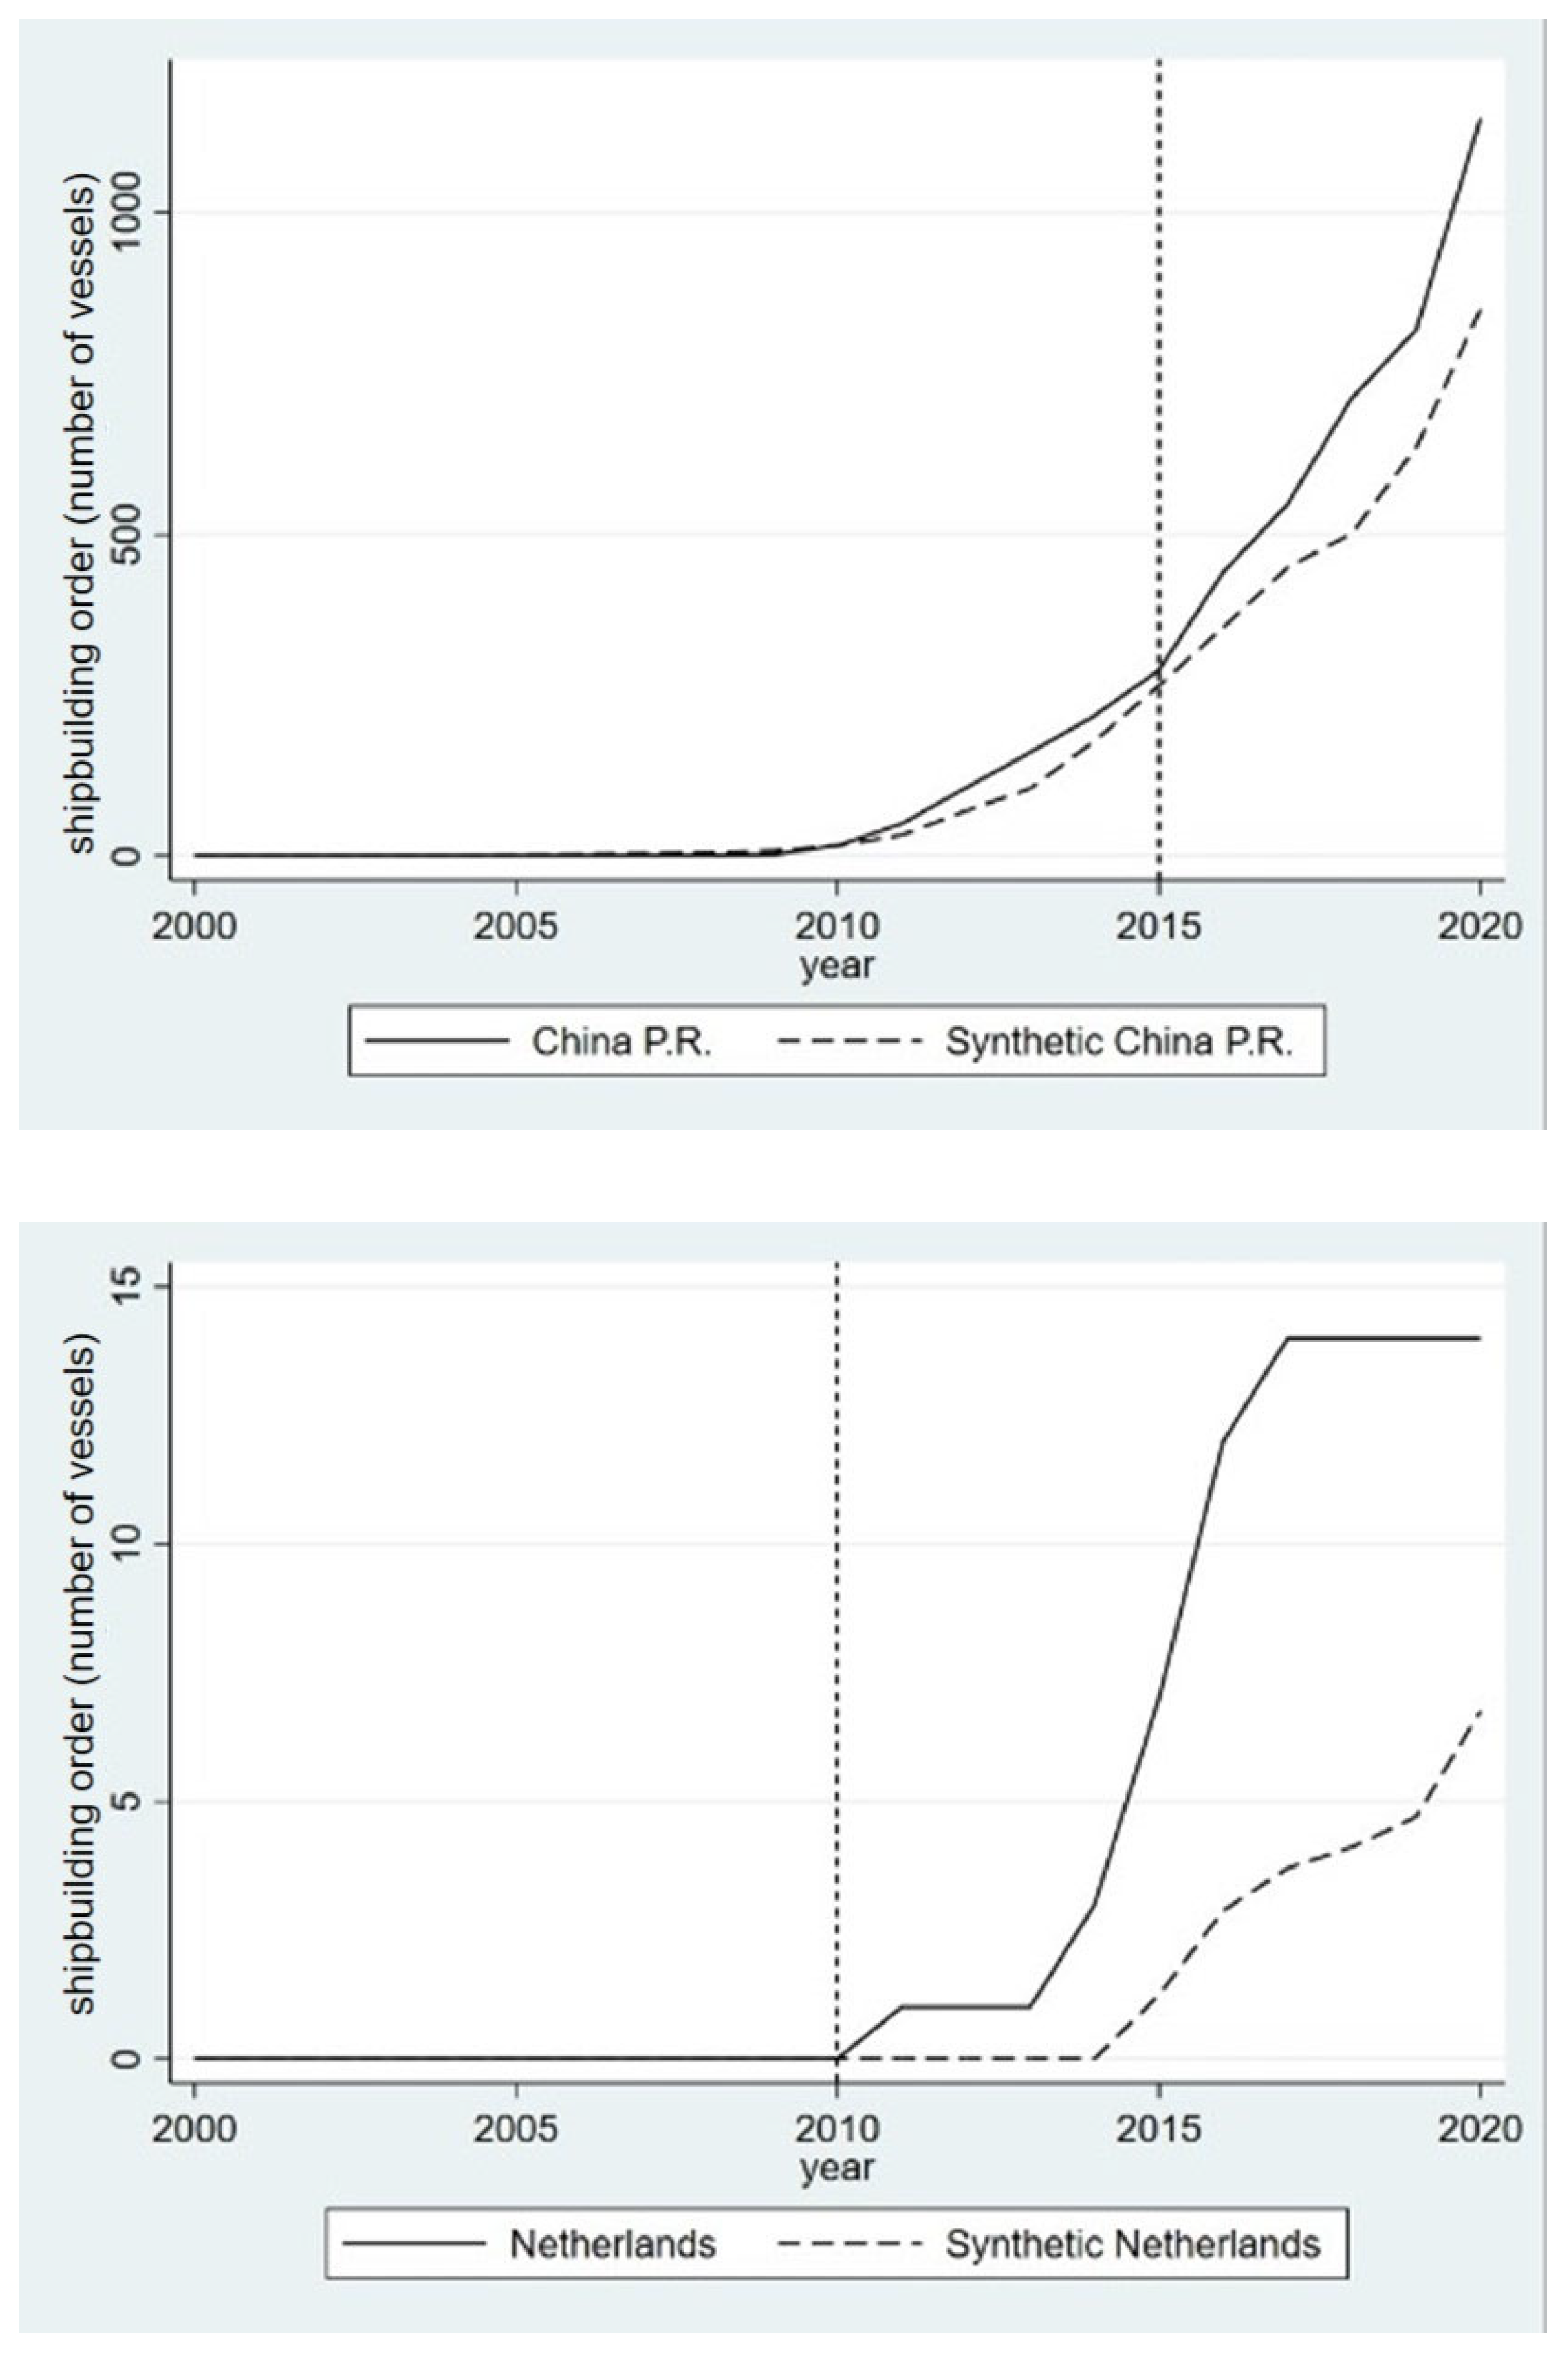
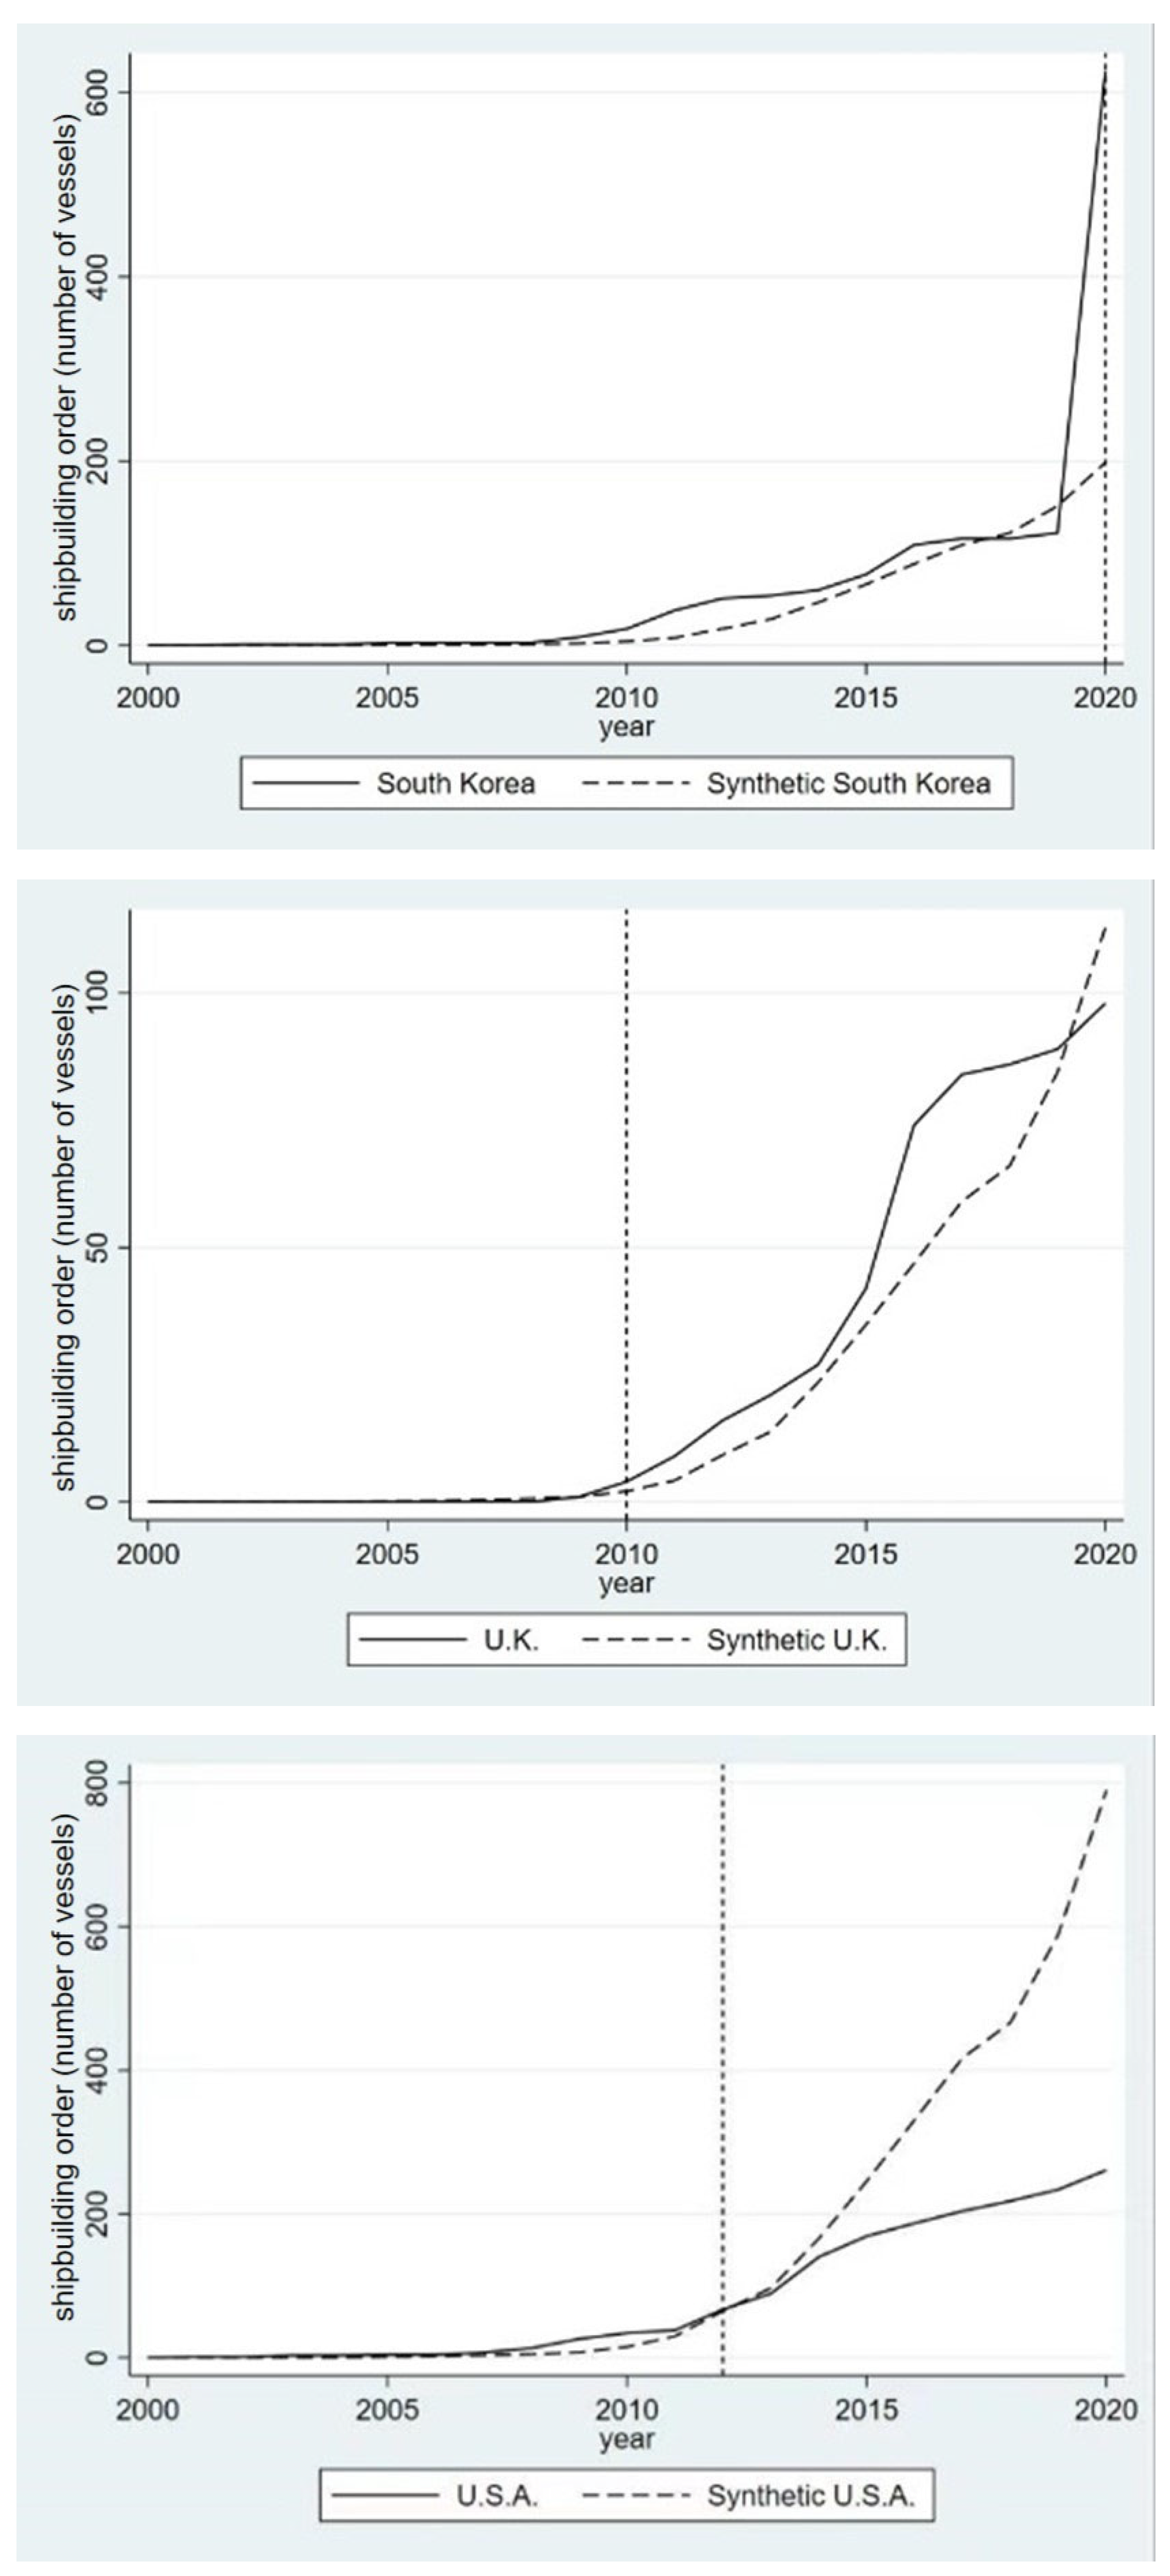
From 2000 to 2020, the shipbuilding orders for eco-designed ships in the treatment group and corresponding synthesis group are shown in
Figure 4, where the position of the vertical dashed line means the starting year of implementing emission-control areas in the region. Hence, the left side of the dashed line shows that the shipbuilding orders of eco-designed ships are very close to those of the synthetic group; otherwise, it gradually deviates on the right side of the dashed line. For example, China has implemented an emission-control area since 2015, where the shipbuilding orders for eco-designed ships from the actual and synthetic groups were very close before 2015. However, after the implementation of emission-control areas, the synthetic shipbuilding orders for eco-designed ships in China have been significantly lower than the actual order, where the gap between the above is the implementation effect of emission-control areas.
The results indicate that after the implementation of emission-control areas, the actual cumulative shipbuilding orders for eco-designed ships have significantly increased, while the synthetic cumulative shipbuilding orders are still steadily increasing, resulting in a huge gap. This also indicates that the implementation of emission-control areas has a positive impact on the shipbuilding orders of eco-designed ships and can promote the improvement of the marine environment. In addition, there are some special phenomena: (1) After 2010, the shipbuilding orders for eco-designed ships from China and Republic of Korea became more significant, which mainly contributed to the implementation of emission-control areas in Europe and North America. Since the beginning of international trade, shipbuilding orders have maintained a rapid growth trend to satisfy the needs of Europe and North America. Although China and Republic of Korea have not implemented emission-control areas, the rapid shipbuilding orders for eco-designed ships from the other regions have effectively promoted the improvement of the marine environment. (2) In 2020, due to the COVID-19 epidemic, the orders of the treatment group (The Netherlands, the UK, and the USA) for eco-designed ships declined significantly. Shipping companies must pay attention to the liquidity crisis in the shipping industry and the potential adverse effects of a short-term decrease in the orders for eco-designed ships. In particular, they must pay special attention to the direction of macroeconomic policy, seize opportunities for domestic demand-oriented reception, and try to replenish working capital as much as possible to overcome the crisis smoothly.
Additionally, as shown in
Figure 4, there is a significant gap between the two curves. During 2010, the shipbuilding orders for eco-designed ships in the Netherlands and the UK increased rapidly, which may be the main reason. It is worth noting that the shipbuilding orders for eco-designed ships show a geometric doubling trend not only in The Netherlands and the UK but also in China, Republic of Korea, and the USA. This is mainly because of the development trend of world economic integration. Therefore, this not only helps to promote domestic order but also accelerates in other regions, which is beneficial for the global marine ecological environment.
However, since the early implementation of emission-control areas in North America and Europe, shipbuilding orders for eco-designed ships have been decreasing every year. In particular, with the slowdown in economic development and the adjustment of industrial layout, the growth of orders in the United States is not significant, even with the implementation of emission-control areas. In contrast, there has been a significant increase in annual orders from China and Republic of Korea, mainly due to the huge potential market. Please note that in 2020, the shipbuilding orders for eco-designed ships from China were the second-largest increase since the expansion of emission-control areas.
3.3. Robustness Test
From the above analysis, it can be seen that there are significant differences in the actual orders of eco-designed ships between the treatment group and the synthesis group. Hence, is this gap caused by the implementation of emission-control areas, or is it a coincidence? To assess the importance of our assumptions, two methods are used to test the robustness of the results.
3.3.1. Placebo Test
In this study, it is observed that the implementation of emission-control areas increased the shipbuilding orders for eco-designed ships. To further discuss the effectiveness and robustness of the variables based on the shipbuilding orders for eco-designed ships, the placebo test is first used to analyze the impact on the variables before the intervention, the basic idea of which is to utilize the same method for the regions where emission control is implemented, i.e., the test divides the pre-intervention period into an initial training period and a subsequent validation period. Therefore, in this study, the data from the starting date to the implementation of emission-control areas can be divided into initial training periods, whereas the data from the implementation of emission-control areas to December 2020 is divided into validation periods (
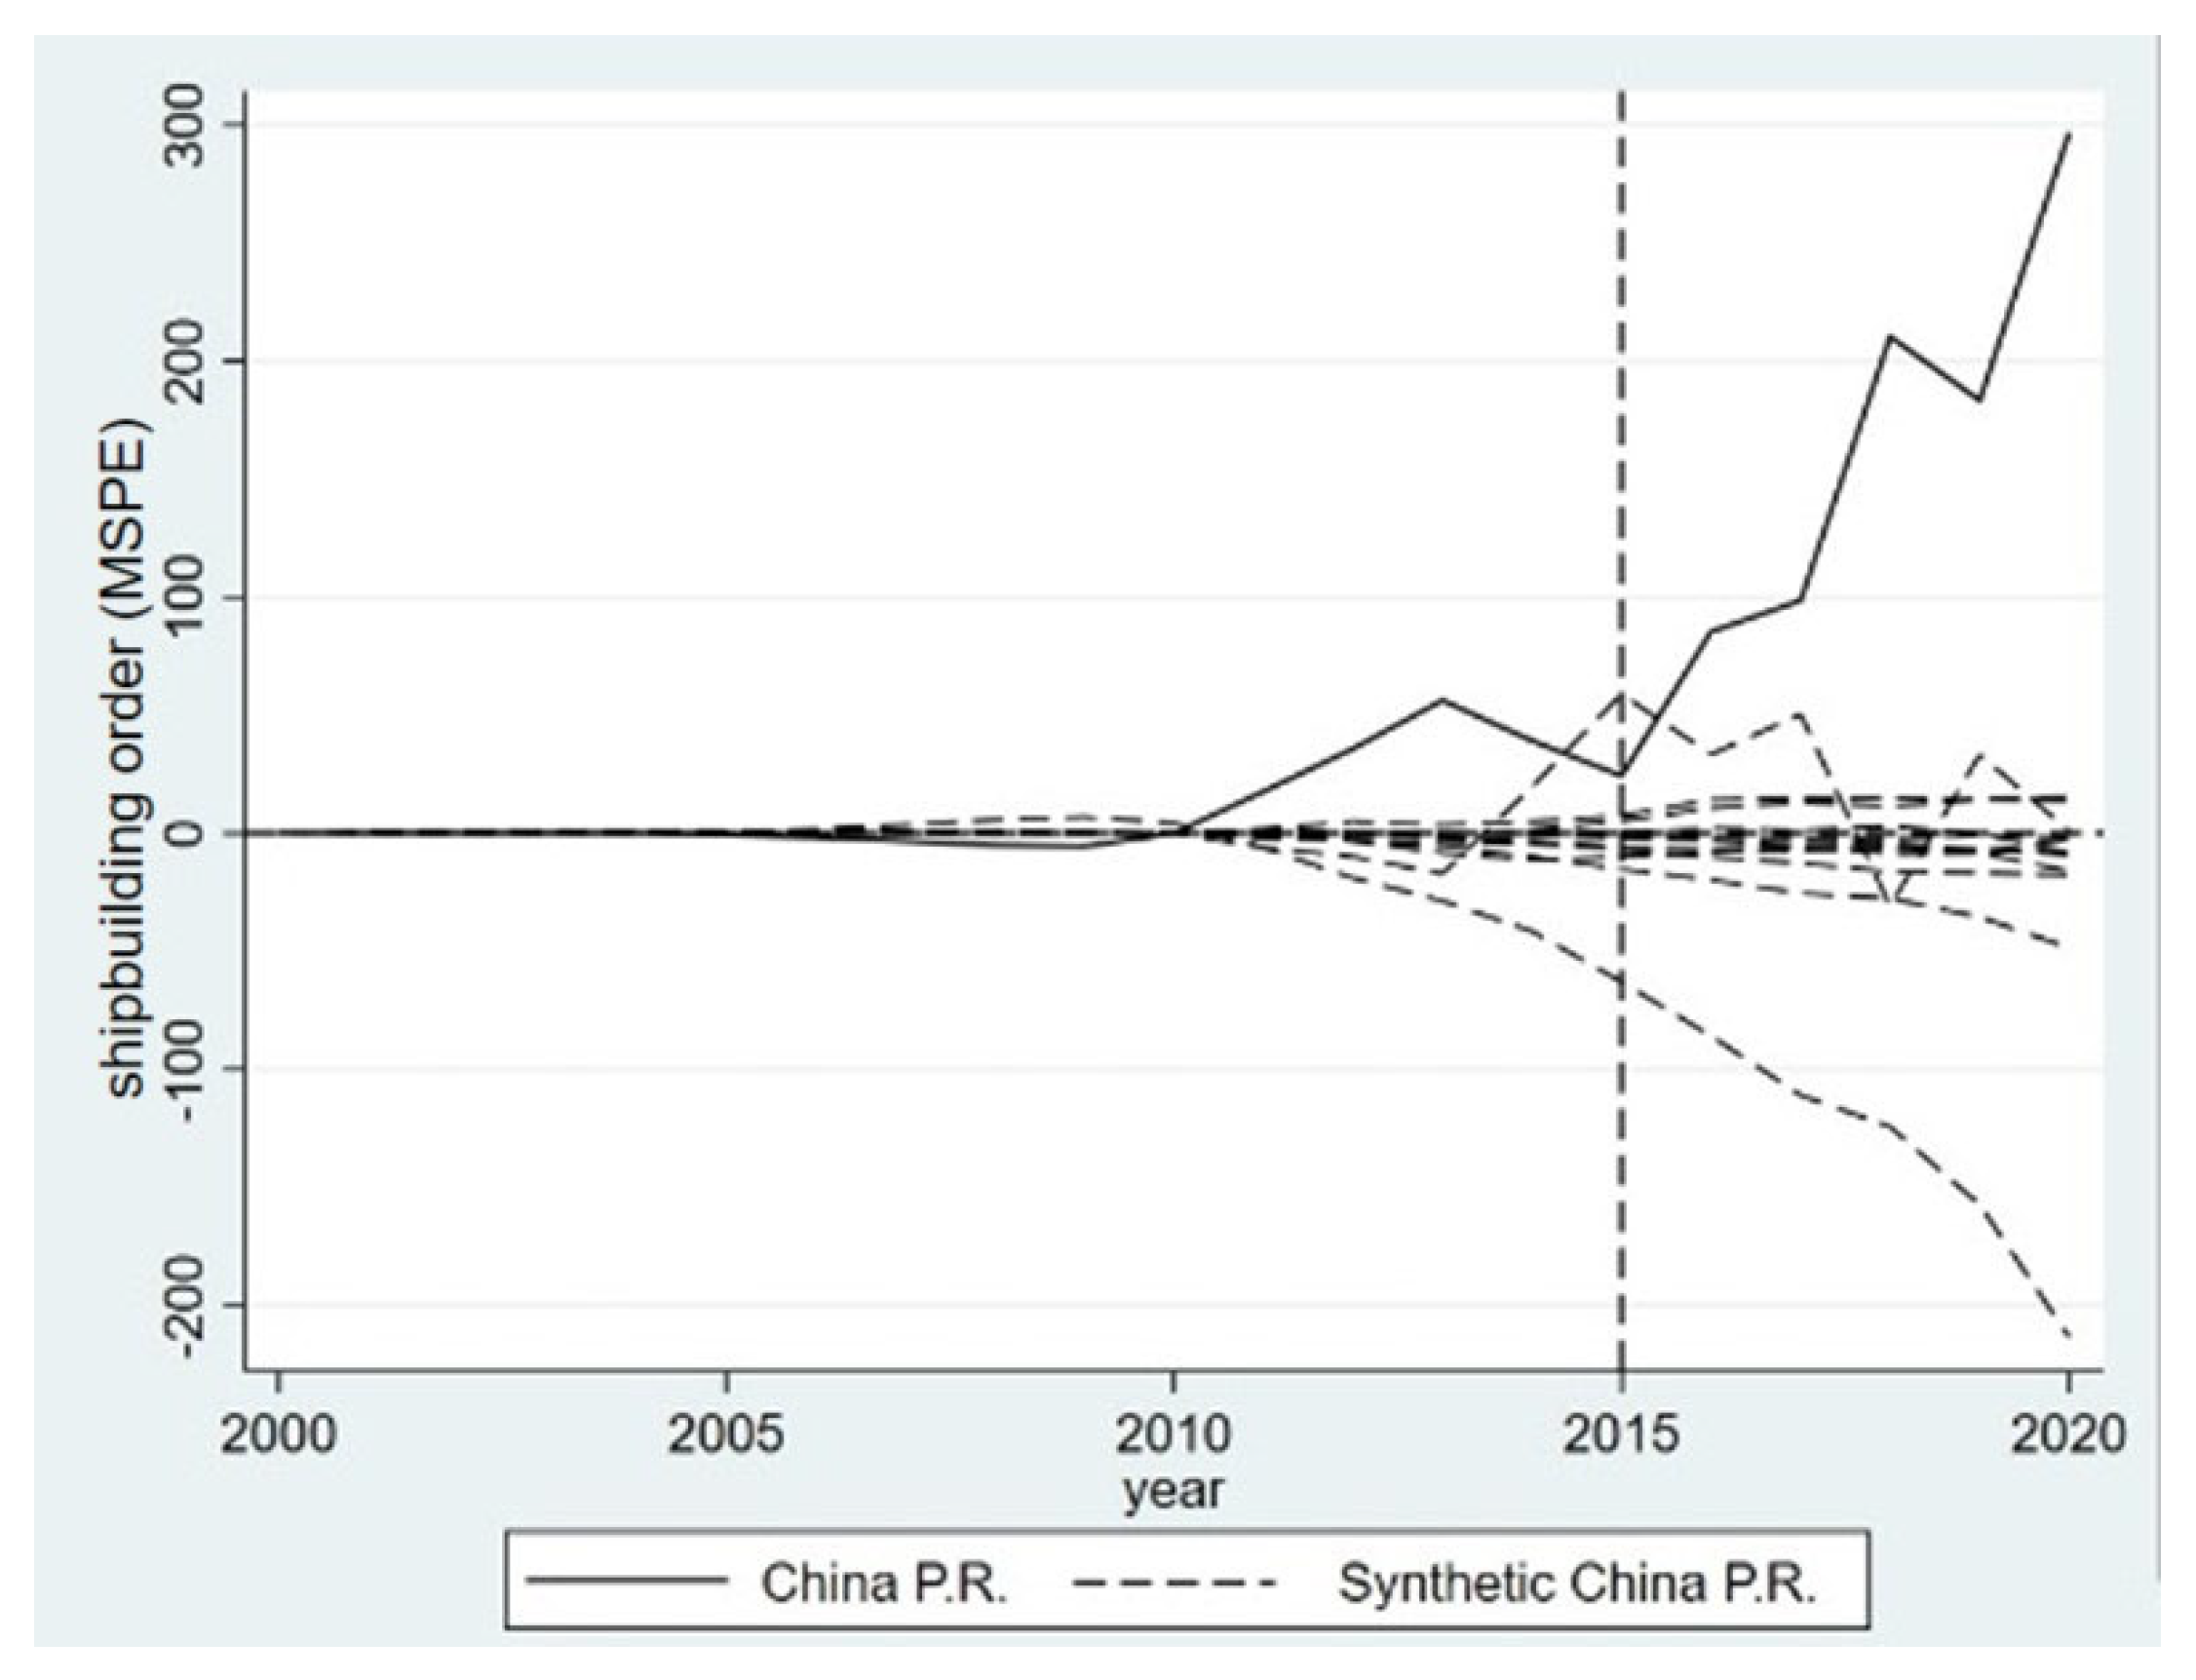
Figure 5).
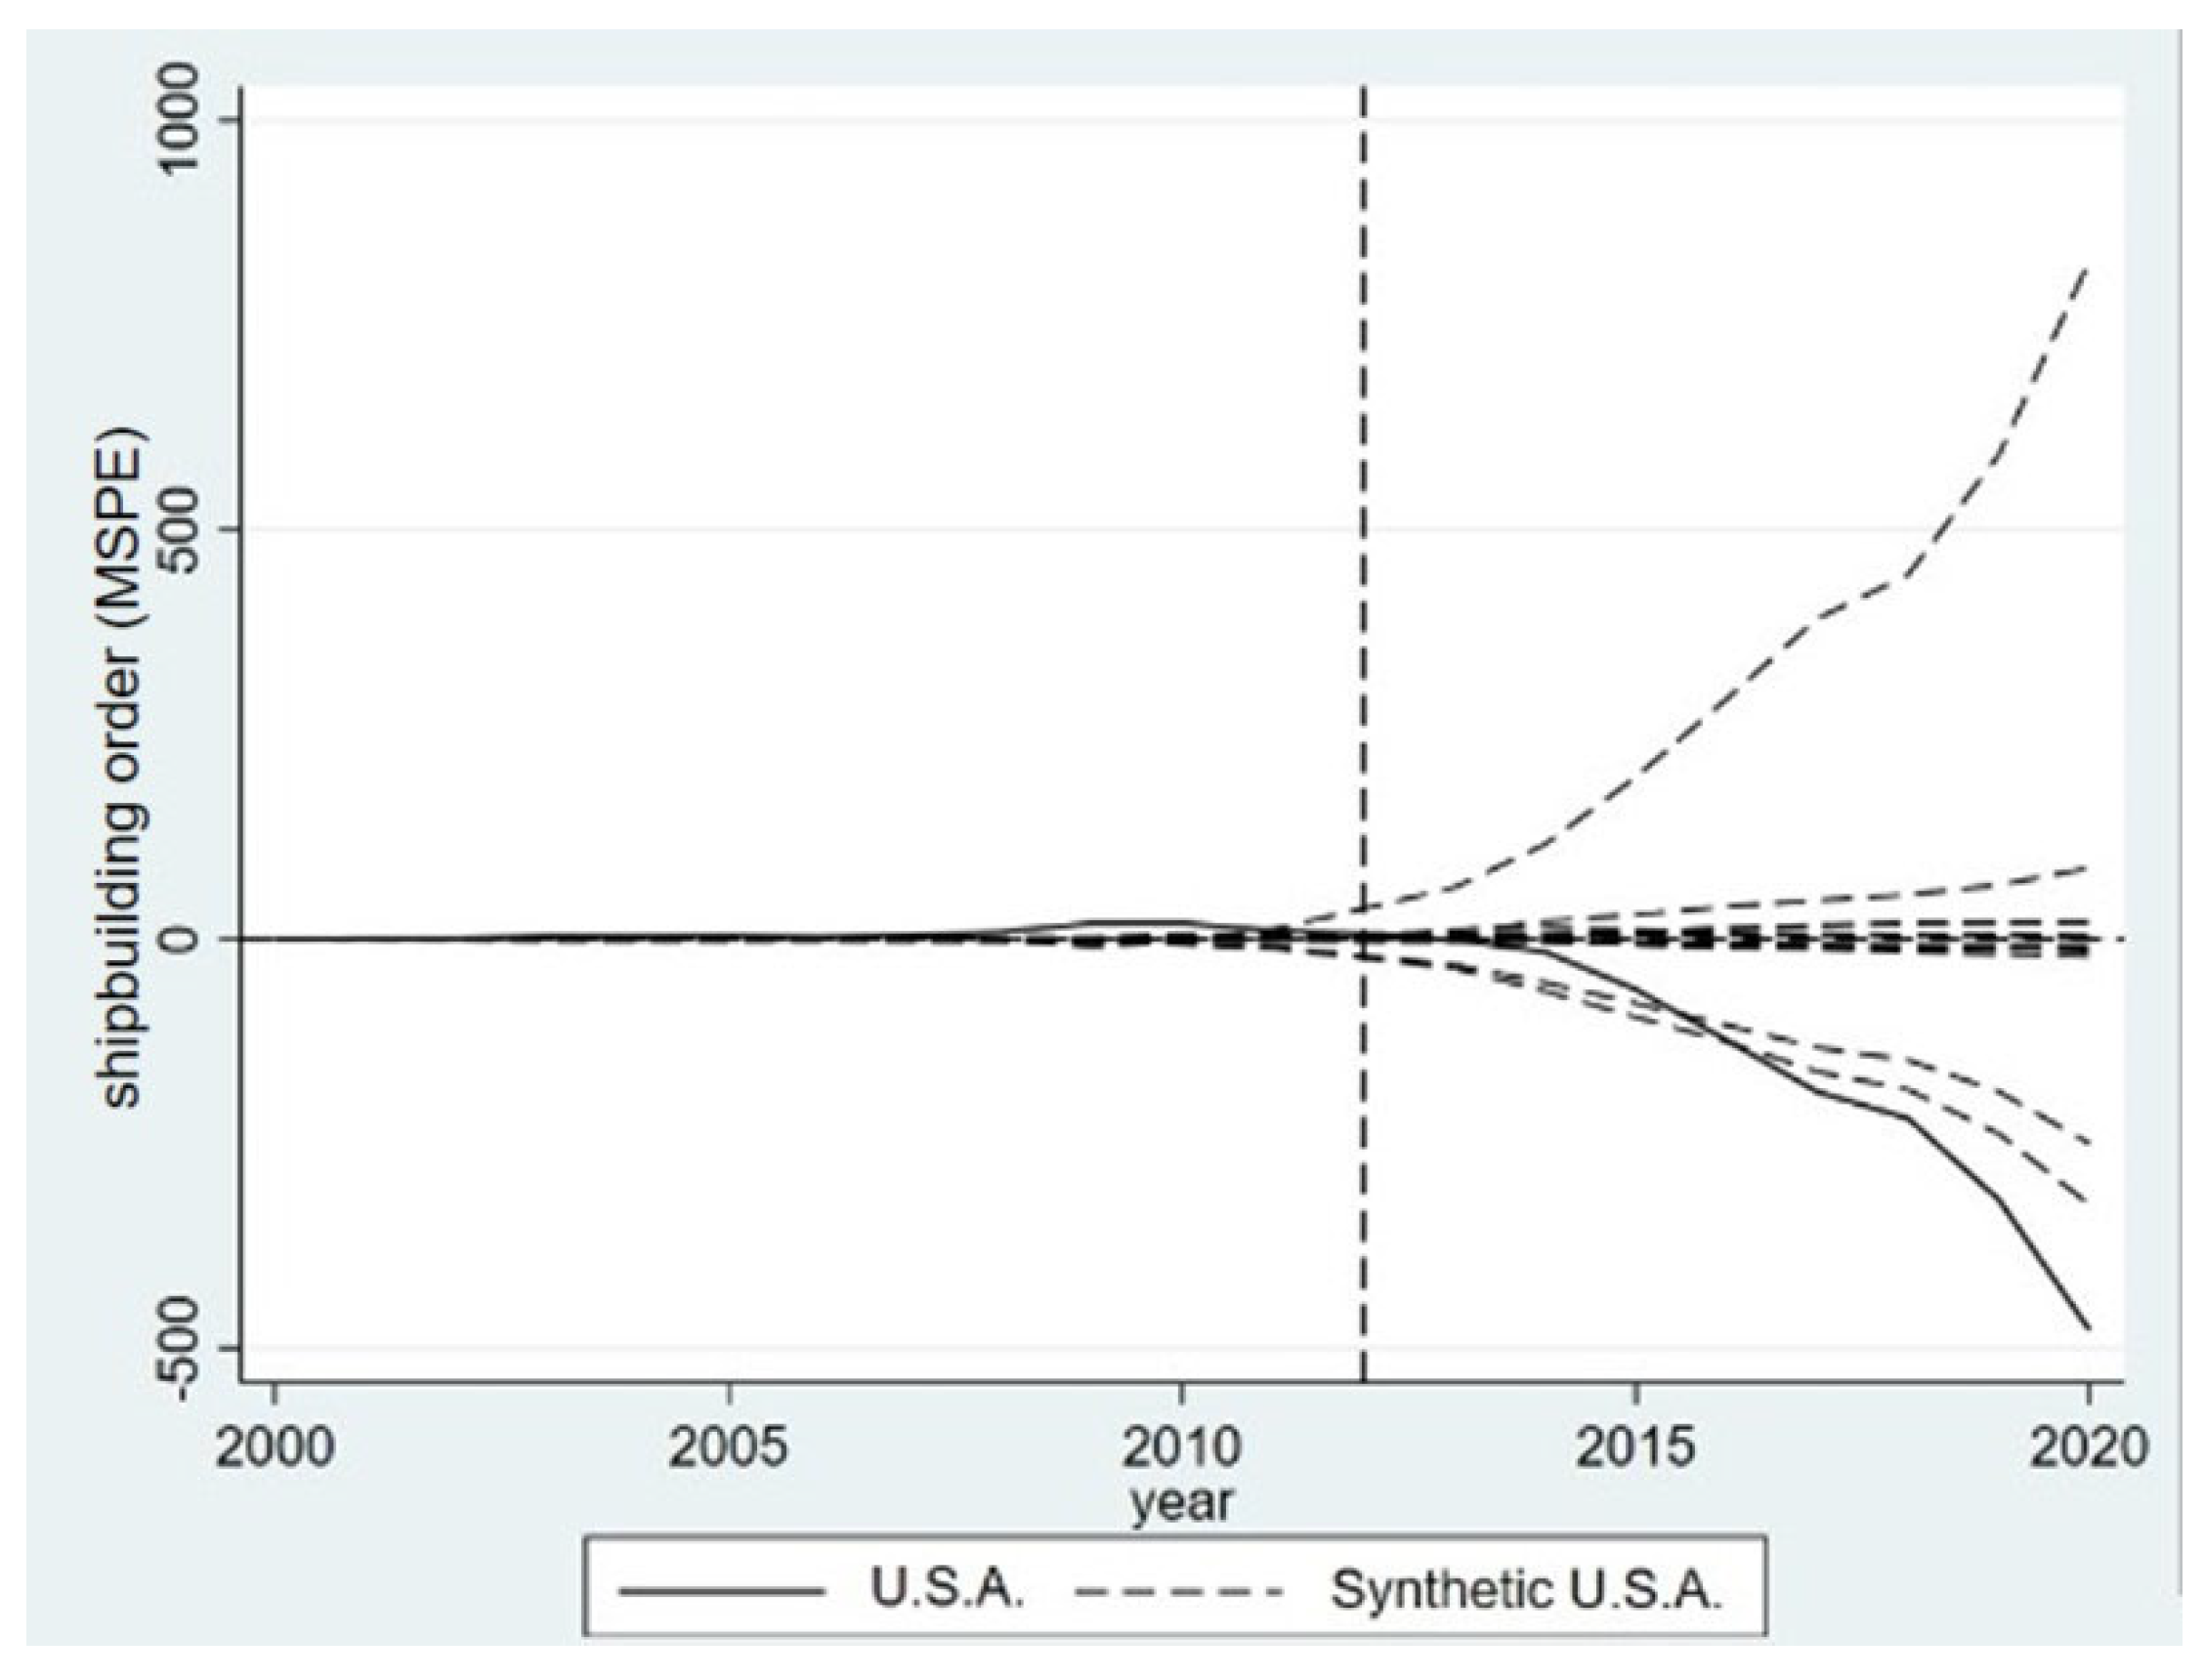
As shown in
Figure 5, we present the placebo test results for estimating the impact of pseudo-interventions from the date of implementation of emission-control areas in each region. Here, the solid lines mean the difference between the five regions and their synthetic effect, whereas the solid lines represent the differences in the cumulative shipbuilding orders for eco-designed ships. Obviously, it can be seen that the MSPE (mean-square pure error) fluctuation between the treatment and control group countries before the policy occurred is insignificant, indicating that the treatment and control groups had similar development trends before the policy occurred, which ensures the placebo test is effective in validating the robustness of the results of the synthetic control method. Intuitively speaking, the curves of the treatment group and synthesis group show a similar trend and a stable trend before and after the expected pseudo-intervention in China and Republic of Korea. In addition, the results of the two exclusion regions correspond to the incomplete synthesis group in
Figure 4.
Furthermore, the current gap between China and Republic of Korea is significantly larger than the two regions that did not implement the ECA policy. Taking China as an example, the curve is significantly higher than zero, indicating that the shipbuilding orders for eco-designed ships in 2015 were already higher than in the aforementioned years. On the other hand, it can be seen that Republic of Korea’s efficiency in 2020 was significantly higher than that of other countries, meaning a significant increase in the shipbuilding orders for eco-designed ships from Republic of Korea after the implementation. However, the treatment effects after the implementation in the Netherlands, UK, and USA are not very significant. Although the treatment effect in the UK was greater in 2010 than in the control groups, it was lower after 2018 than in the control groups, which says that the implementation initially had a certain promoting effect on the shipbuilding orders for eco-designed ships but gradually disappeared.
3.3.2. Difference-in-Differences Test
Although the synthetic control method and difference-in-differences method are frequently used in comparative studies, the previous method introduces the variable presence that cannot be observed to influence the results over time in the latter method. Next, this study explores the effect of emission-control areas on the shipbuilding orders for eco-designed ships through the difference-in-differences method and then compares the outcome with that of the synthetic control method.
As shown in
Table 4, the implementation of emission-control areas has had a positive impact on the shipbuilding orders for eco-designed ships in China, The Netherlands, Republic of Korea, the UK, and the USA. It is worth noting that for the difference-in-difference test, the implementation of emission-control areas has increased the shipbuilding orders for eco-designed ships in China, The Netherlands, Republic of Korea, the UK, and the USA by 3475, 23, 243, 1381, and 842, respectively, which is consistent with the verification results of robustness using the synthetic control method. However, due to the difference-in-differences method in testing, comparability is required between the treatment groups and control groups before the implementation of emission-control areas. Hence, it is difficult to observe the control group with the same related factors as the treatment group. On the other hand, the synthetic control method provides a better comparison of the treatment group using the weighted average of the control groups. Intuitively speaking, during the period before the implementation of emission-control areas, the trend of the shipbuilding orders for eco-designed ships from synthetic control methods is almost identical. On this basis, the estimation of the synthetic control method is more reasonable, which also provides monthly data to evaluate the impact of implementing emission-control areas.
4. Conclusions
To promote the sustainable development of the marine environment, IMO has adopted various policies. This research adopts a synthetic control method to quantitatively analyze the implementation effect of emission-control areas on the shipbuilding orders for eco-designed ships and further examine the robustness through the placebo test and difference-in-difference test. From the outcome, the implementation of emission-control areas has greatly increased the shipbuilding orders for eco-designed ships. Meanwhile, the shipbuilding orders for eco-designed ships from 2010 to 2020 in China, The Netherlands, Republic of Korea, the UK, and the USA increased by 3401, 81, 234, 549, and −1435, respectively. Compared with the absence of emission-control areas, the shipbuilding orders for eco-designed ships increased by 32%, 20%, 41%, 66%, and −83%. Except for the United States, the implementation effect is significantly improved.
Although the implementations of emission-control areas have positive impacts on the shipbuilding orders for eco-designed ships, governments have considered issuing guidance on supply guarantees and joint supervision of low-sulfur fuel oil, promoting the coordination and linkage mechanism of LNG clean-energy applications as a strengthening of the infrastructure construction of shore-to-ship power. Because the price of low-sulfur fuel oil is significantly higher than that of high-sulfur fuel oil, governments charge environmental tax on high-sulfur fuel oil and provide a certain number of subsidies for clean energy used by ships to reduce the investment. Beyond that, with a certain range, maritime authorities expand and upgrade the emission-control areas to increase shipbuilding orders for eco-designed ships. In particular, governments have expanded the scope of emission-control areas to cover key seaports and promote their transformation to reduce sulfur-oxide emissions. Expanding the scope of emission-control areas has motivated shipping companies to increase the orders of eco-designed ships, which is lower than the long-term investment of desulfurization transformation.
This study has some limitations. In this model, the implementation of emission-control areas on the shipbuilding orders for eco-designed ships is investigated. This may have a negative effect on other types of ships. In addition, relevant factors are not considered, which may drive the orders of eco-designed ships and have different impacts on the results. In terms of sample selections, five countries are selected to analyze the implementation of emission-control areas, where the sulfur limitation implemented by the IMO since 2010 is still a very short period of implementation, so the complete dataset has not been obtained yet. Finally, an additional limitation is that the aggregated data ignore detailed micro-insights into ships (tonnage, cost), which are necessary for the discussion of the impact of emission-control areas on shipbuilding orders for eco-designed ships.


