Article

Evolution of Scour Length around Circular Piles Subjected to Irregular Waves Due to Climate Change

by
Iván F. Arjona-Catzim
1,
Karina Ocaña-E. de los Monteros
2,
Jaime M. Horta-Rangel
1,*,
Dora L. Ávila-Arzani
2,
Juan B. Hernández-Zaragoza
1,
Teresa López-Lara
1 and
Eduardo Rojas-González
1
1
Division of Research and Graduate Studies, Faculty of Engineering, Autonomous University of Queretaro, Cerro de las Campanas SN, Col. Las Campanas, Queretaro 76010, Mexico
2
Coordination of Port and Coastal Engineering, Mexican Institute of Transportation (IMT), Queretaro 76703, Mexico
*
Author to whom correspondence should be addressed.
J. Mar. Sci. Eng. 2023, 11(9), 1727; https://doi.org/10.3390/jmse11091727
Submission received: 17 July 2023 / Revised: 25 August 2023 / Accepted: 29 August 2023 / Published: 1 September 2023

Abstract

:
Scour is a phenomenon that affects structures deployed in rivers or seas, favoring the transport of sediments around their foundations, which can expose their structural stability. This work aimed to develop a physical model of a mobile bottom to determine the scour-hole extensions around a group of four vertical piles of circular sections subjected to irregular waves. For this purpose, a beach profile and a typical slope were constructed and subjected to 24 h of storm waves, divided into 12 h intervals in the prototype. Additionally, three wave periods were studied according to the Mexican Institute of Transportation wave data and three scenarios of a rise in sea level. The data suggest that the length of the scour hole was greater in the piles in the front for all cases, which may be reflected in a reduction in scour protection costs. The results obtained for the extent of the scour hole suggest a setting of less than four times the pile diameter in most cases. Finally, it is inferred that a rise in sea level by itself is not a decisive factor in the increase in the values obtained; therefore, it is necessary to consider the variations in wave heights and wave periods associated with such increases.

1. Introduction

Due to the nature of the environment to which an offshore marine structure is exposed, the sediment around its foundation undergoes increased hydrodynamic loads, resulting in the process of scour [1].
Scour is a phenomenon that occurs around the foundations of structures located in rivers or seas, which, when interacting with the flow of the medium, favor the transport of sediments, representing a hazard for their stability [2], which are the horseshoe vortices, and the lee–wake is the primary governing mechanism. However, in certain types of erosion, such as downstream scour in a stationary bed, these two vortices usually do not form [3]. The area on the floor where this phenomenon occurs is known as the scour hole. Its shape and dimensions depend on both the wave characteristics and the shape of the structure, as well as the type of material in the bed. It is measured from the center of the pile around which the maximum scour depth occurs to the point where the bed level returns to zero [4]. Therefore, the prediction of the evolution of the scour phenomenon is essential in the design of marine structures [5].
The phenomenon of local scour around monopiles resulting from the combination of wave and current implies the interaction between the fluid, structure, and sediment, which adds further complexity compared to conditions where only the current or wave is present [6,7]. There are some equations in design manuals that allow the estimation of the depth and extent of scour; however, most of the equations for local scour are empirical. In addition, it has been found that the values estimated for scour using standard design equations can be substantially exceeded [8].
In order to evaluate the advance of scour in the area near the piles and, in addition, to observe the movement of water and sediment around them, some researchers have used 3D laser scanning devices [9], photogrammetry with a 70% image overlap [10], and numerical models [11], obtaining differences of up to 2 mm. However, from an economic point of view, their implementation is not always profitable.
In contrast, advances have been made in the real-time detection of structural damage in vibrating systems. Since scour modifies the dynamic response of the structure, the implementation of methodologies based on eigen perturbations becomes feasible. The basis of eigen perturbation theory is based on the idea that faults and anomalies in the system become evident through modifications in the arrangement of the data in terms of covariance. This methodology has been extensively investigated in recent times to detect structural problems in scour bridges, wind turbines, and other structures [12,13,14,15].
Moreover, due to the growing global interest in reducing fossil energy consumption, the implementation of offshore wind farms has increased, mainly using Monopile, Tripod, and Jack-up structures [16,17]. This brings about challenges for the design of these structures, since scour is related to the reduction in the lateral resistance of the structures [18], which directly affects the regular operation of these wind turbines [19,20].
The alignment of the piles relative to the wave and the current direction holds significant significance in the occurrence of the scouring phenomenon. In the scenario of a tripod-type structure subjected to both influences, it has been ascertained that the maximum scouring depth is observed in the central pile across all orientations investigated. However, this maximum scouring depth is encountered in the lateral piles when the structure is positioned at a right angle with respect to the wave direction [21]. In laboratory experiments, achieving Froude similarity in all parameters between the model and prototype is often difficult due to scaling effects. For example, sediment does not scale in proportion to geometric size, resulting in differences in bed roughness between the model and prototype, which affects scour evolution. This can lead to an increase in sediment suspension or sediment settling at a higher velocity, influencing the interaction between the flow and the bed and generating scour patterns different from those of the prototype [22,23].
Another factor that can influence the scour phenomenon when working with groups of piles is their spacing. Generally, it is considered that scour has a group effect for spacings smaller than three times the pile diameter, while for larger spacings, it behaves independently [24]. In addition, the critical pile inclination is reached when the angle formed between the longitudinal axis of the pile and the horizontal plane is 90°, that is, when the pile is in vertical orientation [25,26].
Furthermore, scour protection has an essential role in the design and maintenance of marine structures since scour avoidance helps to maintain the dynamic structure behavior by preventing modifications in its fundamental period [21,27,28,29]. The most widely used type of protection is rip-rap due to the availability of materials and its relatively low cost. In addition, it is possible to find other methods such as artificial reefs, concrete matrices, and soil–cement bagging, among others. The feasibility of each will depend on the conditions associated with both the environment and the structure to be protected [30].
On other hand, the impacts of a rise in sea level induced by climate change on coastal infrastructure constructions are of utmost importance, particularly in coastal and port areas. Thus, it is crucial to prioritize this phenomenon’s technical and economic assessment [31]. In the Gulf of Mexico, estimates of an average rise in sea level range from 1.79 mm/year in Alvarado, Veracruz, to 9.16 mm/year in Cd. Madero, Tamaulipas [32,33,34]. However, it is essential to consider that the data series used for these estimations do not correspond to the same periods.
Considering the above, uncertainty arises regarding the possible impact of a rise in sea level, mainly due to climate change, on the scour phenomenon. This paper aimed to determine the minimum and maximum scour extent around a group of four vertical piles of circular sections subjected to waves. In addition, an analysis of the influence of the variation in the wave period for the same depth was performed. On the other hand, the values of the theoretical maximum scour extent, calculated through the maximum scour depth, and the one measured in the model were compared. Finally, a comparison was made between the results obtained for three different depths and three wave periods for each level.

2. Materials and Methods

A mobile bed model experiment was conducted in a wave flume at the facilities of the Maritime and Environmental Hydraulics Laboratory, affiliated with the Mexican Institute of Transportation. The wave flume, depicted in Figure 1, has an internal width of 4.60 m and an effective length of 24.20 m.
Both incident and reflected wave heights were measured using resistive-type sensors spaced 60.00 cm apart and coupled to elevators used for the calibration of the measurements (Figure 2). Due to the channel dimensions, it was necessary to use a distorted scale with distortion ∆ = 5. Therefore, the scales implemented were EX = 1:240 and EY = 1:48, where EX corresponds to the scale with respect to the longitudinal axis of the flume and EY to the scale with respect to the vertical.

2.1. Flume Preparation

The reference slope was selected based on the bathymetric information obtained by Ocaña-Espinosa de los M. [35]. This slope had a horizontal extension of 14.50 m, measured between the concrete slope and the lowest point of the sloping beach. Sand with a mean diameter (Ds) equal to 0.16 mm was used for its construction. The reference levels were marked on each side of the flume with the help of topographic equipment, verifying that they were square. Finally, the slope and reference profile were formed once the previous steps was completed.
Concerning the maximum water depth, it is possible to reach a level of 0.80 m, measured from the bottom of the flume, in the vicinity of the blade of the wave generator; therefore, the first depth had to be 0.18 m below it to consider the two subsequent increments and leave a margin of 0.05 m. In order to measure incident and reflected waves, two resistive-type sensors were placed at 2.60 m (Sensor 1) and 3.20 m (Sensor 2) from the lowest point of the profile.
The piles were placed at 1.45 m from the sloping beach and 1.15 m from Sensor 1; in this way, it was possible to know the wave data present during the modeling (Figure 3). The piles were placed at an initial depth (d) of 12.5 cm, equivalent to 6.00 m in the prototype.

2.2. Test Program

The study was carried out in nine experimental tests. These trials were divided by taking into account the wave period (T) and the rise in sea level as a consequence of climate change (ICC). Additionally, two stages were considered in each experimental series, with the aim of representing the characteristics of the estimated storm surge in the study area indicated in [35]. The first stage, with a duration of 12 h in the prototype, considers wave heights of 2.00 m, while the second stage, with the same duration, considers wave heights of 4.00 m. Table 1 presents each of the tests and their associated variables. The storm surge, indicated above, was determined using a numerical model developed in MIke 21 software. Input data were obtained from measurements taken by directional wave-measuring buoys, considering the wave pattern documented during 2019 in the study area. The outcomes derived from the numerical simulations, conducted with various orientations, were employed to determine the significant wave heights and their corresponding periods, accounting for the projected rise in sea level in the region. The values corresponding to the Keulegan–Carpenter number were KC = 6.08, 7.49, and 9.23. As indicated in the literature, this is the parameter that governs the scour behavior around a pile [21].
The physical model was carried out using random waves. This is induced by using a wave generator located at one end of the flume, as shown in Figure 1. This generator is controlled by a software (Figure 4) that employs the Bretschneider energy-frequency spectrum S(f) to model the wave characteristics, utilizing the peak frequency and significant wave height as input parameters. These parameters are then used to generate the wave signal, which is subsequently fed to the wave generator [36]. This is written as
S f = 5 H S 2 16 f 0 1 f f 0 5 e x p 5 4 f f 0 4
where Hs is the significant wave height and f0 is the peak frequency. In several investigations it has been proven that this spectrum is appropriate for the existing wave conditions in the study area, being successfully used in the design, remodeling, and adaptation of marine structures [37,38].
Based on the collected data, it was ensured that the significant wave height closely matched the specified values mentioned earlier. In order to validate this correspondence between the input data and the resulting incident wave heights, additional tests were conducted.

2.3. Scour Length Measurement

Figure 5 shows the locations of Piles A, B, C, and D, these had an outside diameter of 0.023 m and were driven vertically into the soil. After each test, a photographic record was taken by placing a reference measurement for the subsequent image processing. The photographs were taken with a GoPro Hero 11 camera with horizontal and vertical resolution of 72 ppi, which equals 0.0353 cm per pixel. The scour diameters were measured using the IC Measure 2.0.0.286 software, since it allows calibrating the measurements from a known length in the image.
Furthermore, the reference value of four diameters (4D) was adopted as the maximum theoretical extent of scour. It is important to note that this value remains constant across all cases, as the diameter of each pile was consistent in all conducted tests. Nonetheless, including this value aids in the description of the obtained results. In addition, the values of the scour hole associated with the maximum scour depth were calculated as shown in (2).
L e x t = D 2 + S m a x cot
where Lext is the maximum extent of the scour hole, D is the diameter of the pile, Smax is the maximum scour depth, and is the angle of internal friction of the sediment [30].

3. Results and Discussion

3.1. Test Program

Based on the tests performed for the determination of the input values necessary to produce the 2.00 m and 4.00 m wave heights using the Bretschneider spectrum, the results shown in Table 2 were obtained.
Due to the randomness of the generated wave, a maximum difference of 10% with respect to the target wave heights was established. A total of 2048 readings were recorded with a time interval of Δt = 0.05 s for each case. The differences between the heights measured in the model against the target height, for 2.00 m, ranged from 2.00% to 9.00%, while for 4.00 m, the values obtained ranged from 0.00% to 4.75%. It is important to consider that due to the nonlinearity in the waves, very different values can be obtained with slight variations in the input data.

3.2. Scour Depth and Scour Extension

The scour depth results obtained from the physical model for each of the piles in all tests are shown in Table 3. The data suggest a reduction in scour depth as the wave period increases.
As mentioned above, the extent of the scour hole is measured from the center of the pile and extends to any point on its boundary where the depth of the bed is zero with respect to its initial position. Thus, the maximum scour extent can be defined as the greatest length, in the horizontal direction, measured from the center of the pile to the furthest point on the scour hole’s perimeter. Conversely, the minimum scour extent would be defined by the shortest distance between the center of the pile and the scour hole’s contour. From the image processing, the scour extensions were obtained for each pile associated with each test indicated in Table 1. Figure 6a–c show the results of tests E01 to E03, respectively, measured from the center of the piles. The bold solid lines represent the extent of the scour hole, while the rest of the lines represent the ripples formed in the sand. The graphic scale is at 1:240 in meters.
As observed, the scour holes exhibited a greater extent for the front piles (A and B) in comparison to the back piles (C and D). However, it is worth noting that this pattern was not consistent for Piles A–D in the case of E02, as the scour values for Pile D surpassed those of Pile A; this may be due to the presence of ripples in the bed, generating turbulence in the flow, which facilitates sediment transport, thus increasing the extent of the scour hole. Furthermore, the scour holes displayed a tendency towards eccentricity in relation to the center of the piles. While this may be due to the nature of the vortices generated around the pile, it may also be the effect of the asymmetry in the flow caused by the change in bed roughness due to the formation of ripples. To provide a comprehensive analysis of the recorded data, minimum, maximum, and average values were determined and are presented in Table 4, Table 5 and Table 6. Additionally, the results for each category are expressed in terms of the equivalent length based on the diameter of the piles (D).
Across all instances, the recorded minimum values fell below the reference value of 4D. However, the maximum results obtained from tests E01 and E02 surpassed this threshold by 8.03% and 25.00%, respectively. Notably, the average scour lengths remained below the aforementioned reference, with test E01 yielding values of up to 3 5/8 D, test E02 reaching 3 6/7 D, and test E03 exhibiting a maximum length of 3 1/2 D. Moreover, it is evident that the values for Piles A and B consistently exceeded those of Piles C and D, except in the case of test E02.
Figure 7a–c present the outcomes of tests E04 to E06, respectively, with measurements taken from the center of the piles and an ICC value of 2.00 m.
Similarly, it can be observed that the scour holes in Piles A and B exhibited greater extents compared to those in Piles C and D across tests E04 to E06. Furthermore, as noted previously, there is a notable disparity in the values obtained for the 12.16 s period, with the test where eccentricity in relation to the center of the piles is more pronounced. Table 7, Table 8 and Table 9 provide a comprehensive representation of the maximum, minimum, and average measurements corresponding to Figure 7, along with their corresponding equivalences in diameters.
In this series of analyses, it is evident that, with the exception of Piles A and B in case E05, all obtained values remain below four times the diameter of the piles. However, for these specific instances, the reference threshold was surpassed by 37.50% and 10.71%, respectively. Once again, we observe that the front piles exhibit higher values compared to the back piles. Generally, there is a decrease in the obtained results in relation to tests E01 to E03, except for the specific test associated with the 12.16 s period. Finally, Figure 8a–c illustrates the outcomes of tests E07 to E09, respectively, with measurements taken from the center of the piles and an ICC value of 4.00 m.
Similar to the previous cases, it is evident that the extent of the scour hole around piles A and B is more pronounced compared to piles C and D. Furthermore, as the wave period increases, a more consistent pattern is observed among the recorded results. Additionally, a decrease in eccentricity and a more circular contour of the scour holes are noted. Table 10, Table 11 and Table 12 present the maximum, minimum, and mean values associated with Figure 8, along with their respective equivalences relative to the diameter of the piles.
Reviewing the data, we notice that none of the values exceed the value of four diameters, with 3 5/8 D being the closest value to such a reference. Similarly, it is observed that the maximum values recorded increased as the wave period increased, which suggests a correlation between these factors, being congruent with what is indicated in the literature.
In Figure 9, Figure 10 and Figure 11, we can find the relationship between the maximum scour extent calculated from (2) considering the maximum scour depth values presented in Table 3 against the values obtained from the model. Each figure is grouped by wave periods, so it can be seen how the change in depth affects the extent of the scour hole. This comparison is made only with the maximum extent in order to have congruence between the contrasted values. As can be seen, in general, as the depth increases, the maximum extent of the scour hole decreases.
On the other hand, the variation in the extent of scour was analyzed by grouping the experiments according to their ICC. In this way, it was possible to observe the variation in the results as the wave period varied (Figure 12, Figure 13 and Figure 14). The data show that there is an increase in the maximum scour extent as the abscissae increase. However, atypical readings are observed in experiment E05, as shown in Figure 10.
According to the results shown above, it is observed that, overall, the extent of the scour hole was greater for Piles A and B since they were exposed to the incident wave. This corresponds with what was reported in [39], where it is indicated that the intensity of the horseshoe vortices is proportional to the wave heights close to the structure, considering that once impacted, these reduce their amplitude in the interaction zone. On the other hand, when analyzing the results concerning the period, that is, grouping E01, E04 and E07; E02, E05, and E08; and E03, E06 and E09, it was observed that the extent of the scour hole decreased as the ICC level increased. This makes sense when considering how the wave interacts with the seabed, having less influence as the depth increases [40].
The findings indicate that, under constant depth conditions, the scour extent tends to increase as the wave period increases. The variations in the shape of the scour hole are mainly due to the value of the Keulegan–Carpenter number, since for values lower than 8, the maximum scour depth is expected to occur at the sides of the pile, whereas for higher values, the greatest depth is at the back of the pile [41,42]. This relationship can be attributed to the fact that, for a fixed wave height, an increase in the period corresponds to an increase in the wavelength. Consequently, the wave interacts with the soil surrounding the piles for a longer duration, leading to a greater scour extent.
As emphasized earlier, the incorporation of scour-protection measures is crucial. Consequently, it becomes necessary to establish the outcomes based on the diameter of the pile, as it represents a significant parameter in pile design. The results indicate that the scour extents fall within the range of 1 1/2 D to 4 3/7 D, aligning with the findings reported in previous studies [28,30]. These studies documented the values for scour-protection extent of up to 11 D, as obtained from physical models.
Finally, it can be inferred that the increase in sea level by itself does not represent a decisive factor in the increase in the extent of the scour hole; however, it is necessary to consider other factors associated with this phenomenon, such as the increase in significant heights and wave periods; therefore, complementary studies that consider the above would be necessary.

4. Conclusions

A physical model for determining the extent of the scour hole around a group of circular section piles was developed. The following conclusions are established from the results obtained:
(1)
It was observed that the largest scour hole extension was recorded in the tests corresponding to the period of 12.16 s, both for ICC equal to 0.00 m and 2.00 m.
(2)
A lower eccentricity with respect to the center of the piles was recorded in tests E07 to E09 compared to the previous tests. Additionally, its shape was more regular, increasing its extension as the wave period increased.
(3)
In general, higher values are expected in Piles A and B. This can serve as a reference to properly design scour protection, protecting each pile to the expected extent, which could have a positive economic impact. This was true for all ICC values and periods studied.
(4)
The results obtained for the values of the extent of the scour hole suggest a setting of less than four times the pile diameter, which is suitable according to the literature consulted.
(5)
The ICC likely did not have a negative effect on the extent of the scour hole. Therefore, it is necessary to carry out complementary studies considering the increase in wave heights and their periods to establish their relationship with the scour phenomenon.
(6)
Finally, it is recommended that a complementary analysis be carried out through other methodologies that allow the evaluation of the behavior of scour development in real time, such as monitoring through eigen perturbations, and to evaluate the scour behavior at different sea level increments.

Author Contributions

I.F.A.-C., K.O.-E.d.l.M., J.M.H.-R., D.L.Á.-A., J.B.H.-Z., T.L.-L. and E.R.-G. authors contributed equally to this work in conceptualization, methodology, validation, formal analysis, investigation, data curation, writing—original draft, and writing—review & editing. All authors have read and agreed to the published version of the manuscript.

Funding

This research received no external funding.

Institutional Review Board Statement

Not applicable.

Informed Consent Statement

Not applicable.

Data Availability Statement

Not applicable.

Acknowledgments

The first author is grateful to CONACYT for the scholarship grant, scholarship number 889513, the Autonomous University of Queretaro and the Mexican Institute of Transportation for allowing this research to be carried out at their facilities. To engineers Cindy Casas and Karla Virrueta for their collaboration. These were very useful in improving the quality of the manuscript.

Conflicts of Interest

The authors declare no conflict of interest.

References

  1. Hartvig, P.A.; Thomsen, J.M.; Frigaard, P.; Andersen, T.L. Experimental study of the development of scour and backfilling. Coast. Eng. J. 2010, 52, 157–194. [Google Scholar]
  2. Song, Y.; Xu, Y.; Ismail, H.; Liu, X. Scour Modeling Based on Immersed Boundary Method: A Pathway to Practical Use of Three-Dimensional Scour Models. Coast. Eng. 2022, 171, 104037. [Google Scholar] [CrossRef]
  3. Sumer, B.M.; Petersen, T.U.; Locatelli, L.; Fredsøe, J.; Musumeici, R.; Foti, E. Backfilling of a scour hole around a pile in waves and current. J. Waterw. Port. Coast. Ocean. Eng. 2013, 139, 9–23. [Google Scholar]
  4. Coastal Engineering Research Center. Shore Protection Manual; U.S. Army Corps of Engineers: Washington, DC, USA, 1973; 750p. [Google Scholar]
  5. Corvaro, S.; Crivellini, A.; Marini, F.; Cimarelli, A.; Capitanelli, L.; Mancinelli, A. Experimental and Numerical Analysis of the Hydrodynamics around a Vertical Cylinder in Waves. JMSE 2019, 7, 453. [Google Scholar] [CrossRef]
  6. Yang, Q.; Yu, P.; Liu, Y.; Liu, H.; Zhang, P.; Wang, Q. Scour characteristics of an offshore umbrella suction anchor foundation under the combined actions of waves and currents. Ocean Eng. 2020, 202, 106701. [Google Scholar]
  7. Qi, W.; Gao, F. Equilibrium scour depth at offshore monopile foundation in combined waves and current. Sci. China Technol. Sci. 2014, 57, 1030–1039. [Google Scholar]
  8. Li, Z.; Dai, G.; Du, S.; Ouyang, H.; Hu, T.; Liu, H.; Li, Z. Local Scour Depth Prediction of Offshore Wind Power Monopile Foundation Based on GMDH Method. JMSE 2023, 11, 753. [Google Scholar] [CrossRef]
  9. Tafarojnoruz, A.; Gaudio, R.; Calomino, F. Evaluation of Flow-Altering Countermeasures against Bridge Pier Scour. J. Hydraul. Eng. 2012, 138, 297–305. [Google Scholar] [CrossRef]
  10. Kadono, T.; Kato, S.; Okazaki, S.; Matsui, T.; Kajitani, Y.; Ishizuka, M.; Yoshida, H. Effects of Dynamical Change in Water Level on Local Scouring around Bridge Piers Based on In-Situ Experiments. Water 2021, 13, 3015. [Google Scholar] [CrossRef]
  11. Dodaro, G.; Tafarojnoruz, A.; Sciortino, G.; Adduce, C.; Calomino, F.; Gaudio, R. Modified Einstein Sediment Transport Method to Simulate the Local Scour Evolution Downstream of a Rigid Bed. J. Hydraul. Eng. 2016, 142, 04016041. [Google Scholar] [CrossRef]
  12. Bhowmik, B.; Tripura, T.; Hazra, B.; Pakrashi, V. First-Order Eigen-Perturbation Techniques for Real-Time Damage Detection of Vibrating Systems: Theory and Applications. Appl. Mech. Rev. 2019, 71, 060801. [Google Scholar] [CrossRef]
  13. Bhowmik, B.; Tripura, T.; Hazra, B.; Pakrashi, V. Real Time Structural Modal Identification Using Recursive Canonical Correlation Analysis and Application towards Online Structural Damage Detection. J. Sound Vib. 2020, 468, 115101. [Google Scholar] [CrossRef]
  14. Micu, E.A.; Khan, M.A.; Bhowmik, B.; Florez, M.C.; Obrien, E.; Bowe, C.; Pakrashi, V. Scour Repair of Bridges Through Vibration Monitoring and Related Challenges. In Proceedings of the 1st Conference of the European Association on Quality Control of Bridges and Structures, Padua, Italy, 29 August–1 September 2021; Pellegrino, C., Faleschini, F., Zanini, M.A., Matos, J.C., Casas, J.R., Strauss, A., Eds.; Lecture Notes in Civil Engineering; Springer International Publishing: Cham, Switzerland, 2022; Volume 200, pp. 499–508. ISBN 978-3-030-91876-7. [Google Scholar]
  15. Mucchielli, P.; Bhowmik, B.; Ghosh, B.; Pakrashi, V. Real-Time Accurate Detection of Wind Turbine Downtime—An Irish Perspective. Renew. Energy 2021, 179, 1969–1989. [Google Scholar] [CrossRef]
  16. Shen, J.; Ge, C.; Zhan, Y.; Ye, Z.; Zhang, Q.; Chen, J. Numerical Study on Lateral Response of Offshore Monopile in Sand under Local Scouring Conditions. JMSE 2023, 11, 183. [Google Scholar] [CrossRef]
  17. Lancaster, O.; Cossu, R.; Heatherington, C.; Hunter, S.; Baldock, T.E. Field Observations of Scour Behavior around an Oscillating Water Column Wave Energy Converter. JMSE 2022, 10, 320. [Google Scholar] [CrossRef]
  18. Vuong, T.-H.-N.; Wu, T.-R.; Huang, Y.-X.; Hsu, T.-W. Numerical Analysis of Local Scour of the Offshore Wind Turbines in Taiwan. JMSE 2023, 11, 936. [Google Scholar] [CrossRef]
  19. Liu, Q.; Wang, Z.; Zhang, N.; Zhao, H.; Liu, L.; Huang, K.; Chen, X. Local Scour Mechanism of Offshore Wind Power Pile Foundation Based on CFD-DEM. JMSE 2022, 10, 1724. [Google Scholar] [CrossRef]
  20. Lin, Y.; Lin, C. Scour effects on lateral behavior of pile groups in sands 2020. Ocean. Eng. 2020, 208, 107420. [Google Scholar]
  21. Hu, R.; Wang, X.; Liu, H.; Lu, Y. Experimental Study of Local Scour around Tripod Foundation in Combined Collinear Waves-Current Conditions. JMSE 2021, 9, 1373. [Google Scholar] [CrossRef]
  22. Sutherland, J.; Whitehouse, R.J.S. Scale Effects in the Physical Modelling of Seabed Scour; Technical Report; HR Wallingford: Oxford, UK, 1998. [Google Scholar]
  23. Frostick, L.E.; McLelland, S.J.; Mercer, T.G. Users Guide to Physical Modelling and Experimentation: Experience of the HYDRALAB Network; CRC Press: Los Angeles, CA, USA, 2019. [Google Scholar]
  24. Liang, D.; Gotoh, H.; Scott, N.; Tang, H. Experimental Study of Local Scour around Twin Piles in Oscillatory Flows. J. Waterway, Port, Coastal, Ocean Eng. 2013, 139, 404–412. [Google Scholar] [CrossRef]
  25. Karimi, N.; Heidarnejad, M.; Masjedi, A. Scour depth at inclined bridge piers along a straight path: A laboratory study. Eng. Sci. Technol. Int. J. 2017, 20, 1302–1307. [Google Scholar]
  26. Alemi, M.; Pego, J. Maia, Numerical simulation of the turbulent flow around a complex bridge pier on the scoured bed. Eur. J. Mech. B/Fluids 2019, 76, 316–331. [Google Scholar] [CrossRef]
  27. Welzel, M.; Schendel, A.; Hildebrandt, A.; Schlurmann, T. Scour development around a jacket structure in combined waves and current conditions compared to monopile foundations. Coast. Eng. 2019, 152, 103515. [Google Scholar]
  28. Fazeres-Ferradosa, T.; Chambel, J.; Taveira-Pinto, F.; Rosa-Santos, P.; Taveira-Pinto, F.V.C.; Giannini, G.; Haerens, P. Scour Protections for Offshore Foundations of Marine Energy Harvesting Technologies: A Review. JMSE 2021, 9, 297. [Google Scholar] [CrossRef]
  29. Prendergast, L.J.; Gavin, K.; Doherty, P. An investigation into the effect of scour on the natural frequency of an offshore wind turbine. Ocean Eng. 2015, 101, 1–11. [Google Scholar]
  30. Matutano, C.; Negro, V.; López-Gutiérrez, J.-S.; Esteban, M.D. Scour Prediction and Scour Protections in Offshore Wind Farms. Renew. Energy 2013, 57, 358–365. [Google Scholar] [CrossRef]
  31. Intergovernmental Panel on Climate Change, IPCC. Cambio Climático 2007: Informe de Síntesis; Contribución de Los Grupos de Trabajo I, II y III al Cuarto Informe de Evaluación Del Grupo Intergubernamental de Expertos Sobre El Cambio Climático; IPCC: Ginebra, Suiza, 2008. [Google Scholar]
  32. Intergovernmental Panel on Climate Change, IPCC. Climate Change and Its Impacts in the near and Long Term under Diferent Scenarios; IPCC: Geneva, Switzerland, 2007. [Google Scholar]
  33. Cecilia, C. Cambio y Variabilidad Climaticos: Dos Estudios de Caso En Mexico. Ph.D. Thesis, Universidad Nacional Autónoma de México, México D.F., México, 2003. [Google Scholar]
  34. Instituto Nacional de Ecología. Guía Metodológica para la Evaluación de la Vulnerabilidad ante Cambio Climático; INE/PNUD: México City, México, 2012. [Google Scholar]
  35. Karina, O.-E.d.l.M. Impacto del Incremento del Nivel del mar por Cambio Climático en el Diseño de Rompeola; Publicación técnica No. 704; IMT (Instituto Mexicano del Transporte): Querétaro, México, 2022.
  36. Marghany, M. Quantum Description of Sea Surface. In Synthetic Aperture Radar Imaging Mechanism for Oil Spills; Elsevier: Amsterdam, The Netherlands, 2020; pp. 93–110. ISBN 978-0-12-818111-9. [Google Scholar]
  37. Adriana, P.; Dora, Á.; Cindy, C.; Manuel, M. Desarrollo de una Metodología para el Dimensionamiento de Deflectores de Oleaje para Rompeolas de Talud; Publicación técnica No. 655; IMT (Instituto Mexicano del Transporte): Querétaro, México, 2021.
  38. Juan, F.; Cindy, C.; Dora, Á. Investigación Experimental del Porcentaje de Vacíos de Elementos de la Capa Coraza de los Rompeolas; Publicación técnica No. 700; IMT (Instituto Mexicano del Transporte): Querétaro, México, 2022.
  39. Cho, Y.-J. Scour Controlling Effect of Hybrid Mono-Pile as a Substructure of Offshore Wind Turbine: A Numerical Study. JMSE 2020, 8, 637. [Google Scholar] [CrossRef]
  40. Negro, V.; López-Gutiérrez, J.-S.; Esteban, M.D.; Matutano, C. Uncertainties in the Design of Support Structures and Foundations for Offshore Wind Turbines. Renew. Energy 2014, 63, 125–132. [Google Scholar] [CrossRef]
  41. Corvaro, S.; Marini, F.; Mancinelli, A.; Lorenzoni, C.; Brocchini, M. Hydro- and Morpho-Dynamics Induced by a Vertical Slender Pile under Regular and Random Waves. J. Waterway, Port, Coastal, Ocean Eng. 2018, 144, 04018018. [Google Scholar] [CrossRef]
  42. Sumer, B.M.; Fredsøe, J. The Mechanics of Scour in the Marine Environment; World Scientific: River Edge, NJ, USA, 2002; Volume 17, pp. 1–552. [Google Scholar]
Figure 1. (a) Plan view of large wave-flume dimensions and sand slope definition and (b) cross-section A–A’, dimensions in cm.
Jmse 11 01727 g001
Figure 2. Resistive-type sensors used to measure incident and reflected wave heights.
Jmse 11 01727 g002
Figure 3. (a) Plan view and (b) cross-section of the placement of the structure and wave sensors based on the sloping part of the beach profile.
Jmse 11 01727 g003
Figure 4. Software employed to generate, transmit and analyze the waves during the tests.
Jmse 11 01727 g004
Figure 5. Location of the piles concerning the direction of the incident wave.
Jmse 11 01727 g005
Figure 6. Scour extensions for tests: (a) E01, with ICC = 0.00 m and T = 9.04 s; (b) E02, with ICC = 0.00 m and T = 12.16 s; and (c) E03, with ICC = 0.00 m and T = 15.57 s.
Jmse 11 01727 g006
Figure 7. Scour extension for tests: (a) E01, with ICC = 2.00 m and T = 9.04 s; (b) E02, with ICC = 2.00 m and T = 12.16 s; and (c) E03, with ICC = 2.00 m and T = 15.57 s.
Jmse 11 01727 g007
Figure 8. Scour extensions for tests: (a) E01, with ICC = 4.00 m and T = 9.04 s; (b) E02, with ICC = 4.00 m and T = 12.16 s; and (c) E03, with ICC = 4.00 m and T = 15.57 s.
Jmse 11 01727 g008
Figure 9. Maximum scour extensions observed vs. maximum scour extensions predicted for tests E01, E04, and E07, with T = 9.04 s. R2 = 0.925.
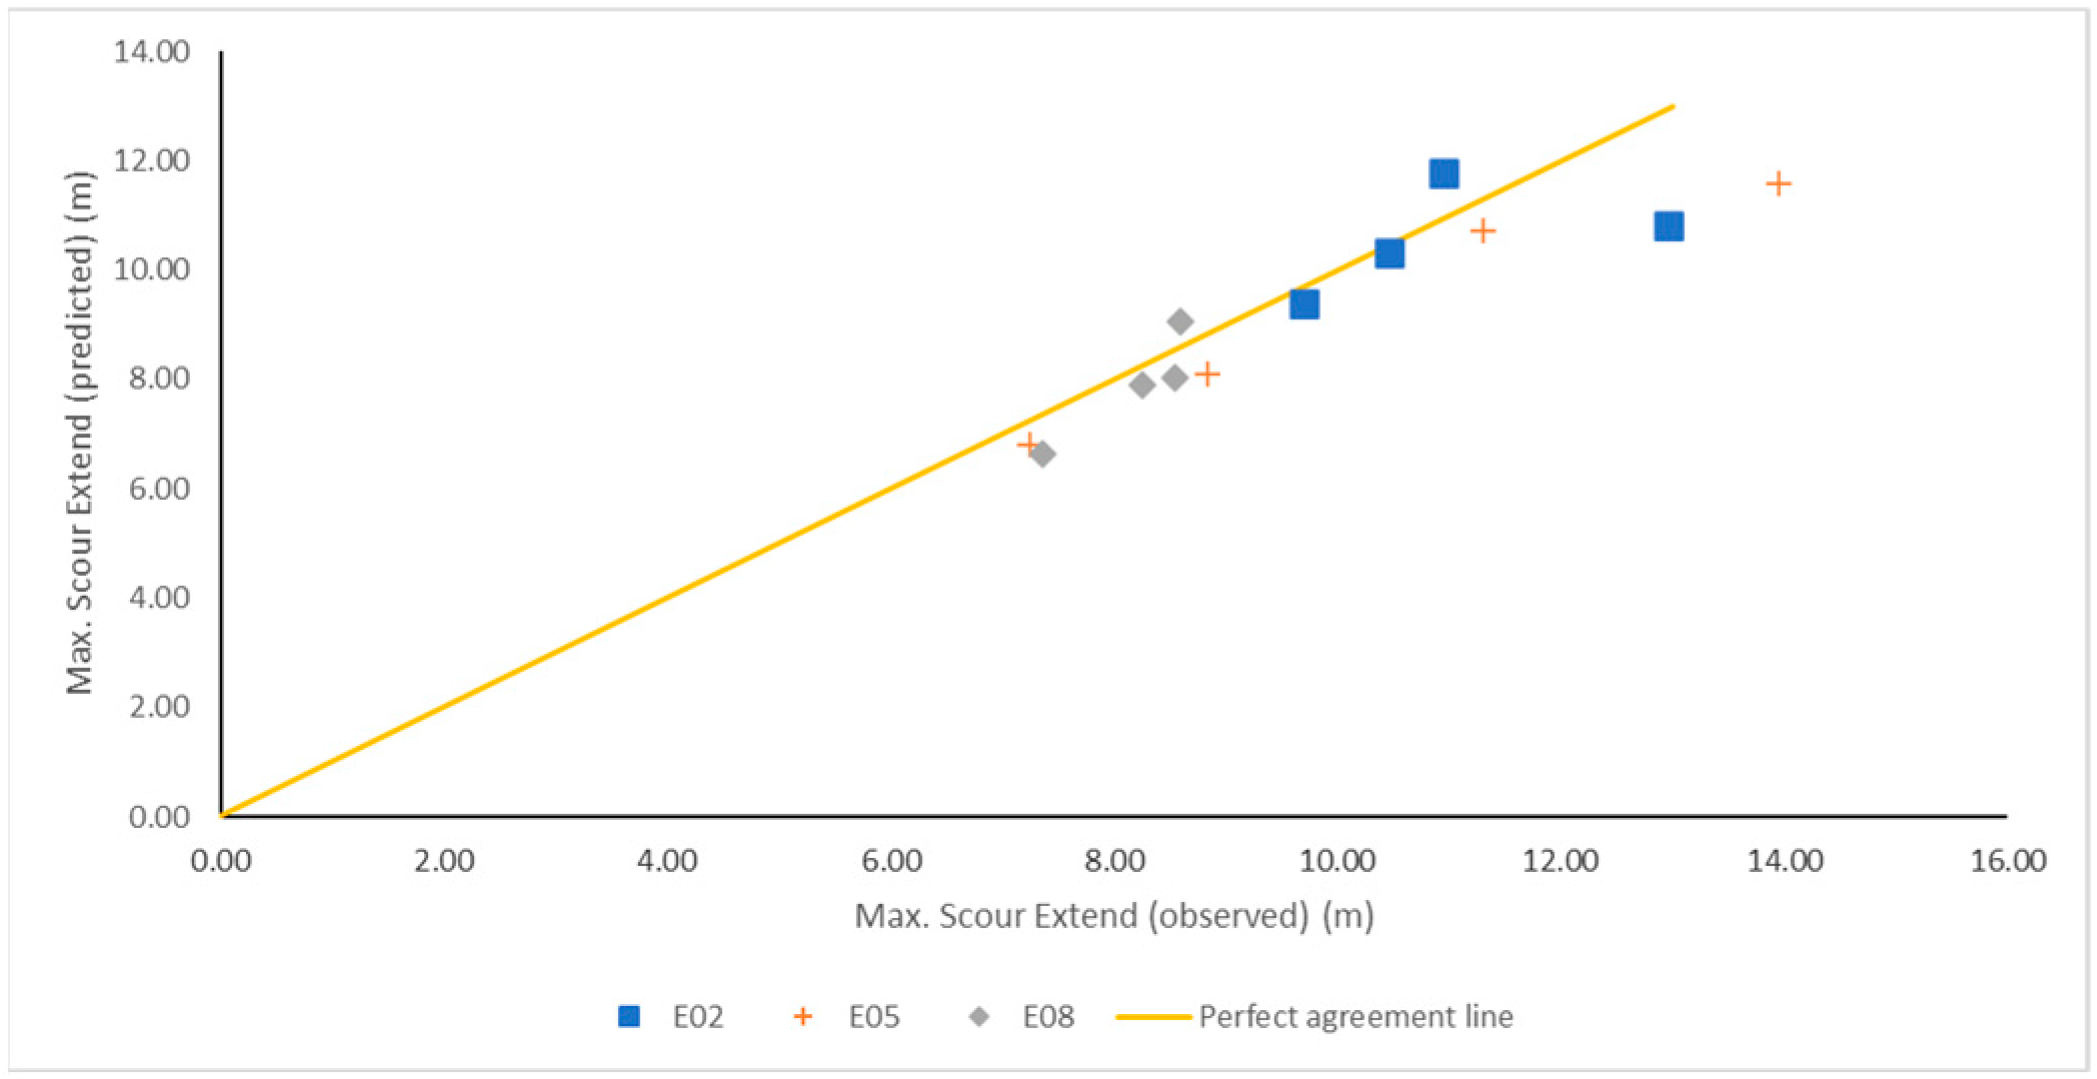
Jmse 11 01727 g009
Figure 10. Maximum scour extensions observed vs. maximum scour extensions predicted for tests E02, E05, and E08, with T = 12.16 s. R2 = 0.821.
Jmse 11 01727 g010
Figure 11. Maximum scour extensions observed vs. maximum scour extensions predicted for tests E03, E06, and E09, with T = 15.57 s. R2 = 0.848.
Jmse 11 01727 g011
Figure 12. Maximum scour extensions for tests E01, E02, and E03, ICC = 0.00.
Jmse 11 01727 g012
Figure 13. Maximum scour extensions for tests E04, E05, and E06, ICC = 2.00.
Jmse 11 01727 g013
Figure 14. Maximum scour extensions for tests E07, E08, and E09, ICC = 4.00.
Jmse 11 01727 g014
Table 1. Considerations for testing according to the programmed experimental schedule.
EssayT (s)Wave Height (m)ICC 1 (m)
0–12 h12–24 h
E019.042.004.000.00
E0212.162.004.000.00
E0315.572.004.000.00
E049.042.004.002.00
E0512.162.004.002.00
E0815.572.004.002.00
E079.042.004.004.00
E0812.162.004.004.00
E0915.572.004.004.00
1 ICC, rise in sea level due to climate change.
Table 2. Determination of the input data needed to generate the design wave heights for each essay.
EssayFrequency Model (Hz)Inlet Hs (cm)Hs Prototype (m)Inlet Hs (cm)Hs Prototype (m)
E011.30443.852.187.804.16
E021.75553.402.127.004.00
E032.24743.602.157.104.01
E041.30443.802.078.304.11
E051.75553.592.167.214.19
E082.24743.152.046.894.08
E071.30443.62.117.404.06
E081.75553.152.097.074.13
E092.24743.202.187.004.07
Table 3. Maximum scour depth for each of the tests.
EssayMaximum Scour Depth (m)
Pile APile BPile CPile D
E014.555.654.263.76
E025.333.944.494.77
E034.084.083.192.94
E043.383.071.592.69
E055.204.722.453.20
E083.382.602.552.00
E072.252.891.361.76
E083.083.753.172.36
E093.812.802.553.56
Table 4. Maximum, minimum, and mean scour extent around each pile, associated with experiment E01, measured from the center of the pile and their equivalent diameters.
E01Min. (m) (D)Max. (m) (D)Mean (m) (D)
Pile A7.132 4/510.974 2/78.963 1/2
Pile B7.61311.064 1/39.283 5/8
Pile C6.362 1/29.553 3/47.903
Pile D5.712 1/49.553 3/47.523
Table 5. Maximum, minimum, and mean scour extent around each pile, associated with experiment E02, measured from the center of the pile and their equivalent diameters.
E02Min. (m) (D)Max. (m) (D)Mean (m) (D)
Pile A5.23210.944 2/77.913
Pile B6.552 4/79.703 4/57.793
Pile C6.722 5/810.4648.083 1/6
Pile D6.772 2/312.9659.833 6/7
Table 6. Maximum, minimum, and mean scour extent around each pile, associated with experiment E03, measured from the center of the pile and their equivalent diameters.
E03Min. (m) (D)Max. (m) (D)Mean (m) (D)
Pile A8.543 1/39.893 7/88.963 1/2
Pile B7.322 6/79.913 7/88.733 2/5
Pile C6.222 3/78.953 1/27.372 8/9
Pile D5.522 1/67.943 1/96.792 2/3
Table 7. Maximum, minimum, and mean scour extent around each pile, associated with experiment E04, measured from the center of the pile and their equivalent diameters.
E04Min. (m) (D)Max (m) (D)Mean (m) (D)
Pile A5.762 1/47.6836.622 3/5
Pile B6.102 2/58.093 1/66.852 2/3
Pile C4.8725.542 1/65.282
Pile D4.8727.302 6/76.172 2/5
Table 8. Maximum, minimum, and mean scour extent around each pile, associated with experiment E05, measured from the center of the pile and their equivalent diameters.
E05Min. (m) (D)Max. (m) (D)Mean (m) (D)
Pile A5.28213.945 1/28.853 1/2
Pile B6.502 1/211.304 3/78.543 1/3
Pile C4.491 3/47.252 5/66.032 1/3
Pile D4.271 2/38.833 1/26.262 4/9
Table 9. Maximum, minimum, and mean scour extent around each pile, associated with experiment E06, measured from the center of the pile and their equivalent diameters.
E06Min. (m) (D)Max. (m) (D)Mean (m) (D)
Pile A5.982 1/38.543 1/37.162 4/5
Pile B5.0927.993 1/86.362 1/2
Pile C5.812 1/47.252 5/66.382 1/2
Pile D4.321 2/35.982 1/35.362
Table 10. Maximum, minimum, and mean scour extent around each pile, associated with experiment E07, measured from the center of the pile and their equivalent diameters.
E07Min. (m) (D)Max. (m) (D)Mean (m) (D)
Pile A5.452 1/87.5436.502 1/2
Pile B6.702 5/88.043 1/77.382 8/9
Pile C3.841 1/24.9424.431 3/4
Pile D3.911 1/25.452 1/84.841 8/9
Table 11. Maximum, minimum, and mean scour extent around each pile, associated with experiment E08, measured from the center of the pile and their equivalent diameters.
E08Min. (m) (D)Max. (m) (D)Mean (m) (D)
Pile A6.462 1/28.263 2/97.152 4/5
Pile B7.4638.593 1/37.973 1/8
Pile C6.412 1/28.543 1/37.262 5/6
Pile D6.342 1/27.372 8/96.932 5/7
Table 12. Maximum, minimum, and mean scour extent around each pile, associated with experiment E09, measured from the center of the pile and their equivalent diameters.
E09Min. (m) (D)Max. (m) (D)Mean (m) (D)
Pile A5.882 1/39.263 5/87.603
Pile B6.912 5/78.983 1/27.983 1/8
Pile C5.882 1/37.032 3/46.272 4/9
Pile D6.412 1/28.953 1/27.813
Disclaimer/Publisher’s Note: The statements, opinions and data contained in all publications are solely those of the individual author(s) and contributor(s) and not of MDPI and/or the editor(s). MDPI and/or the editor(s) disclaim responsibility for any injury to people or property resulting from any ideas, methods, instructions or products referred to in the content.

