1. Introduction
Over the past few decades, the investigation of scour around bridge piers and abutments has gained considerable importance in the coastal environment. The scour phenomenon refers to the erosion or removal of sediment particles from the seabed around a structure’s foundations, caused by the flowing streams [
1]. The formation of scour at the abutments or piers results in structural failure and instability issues for the bridge structure, especially when exposed to the combined effects of waves and currents [
2,
3]. The superimposition of waves on currents increases turbulence and erosion, leading to wider and deeper scour holes at the abutment. To ensure the resilience of vertical wall abutments against environmental forces, it is vital to comprehend the scour mechanism in the combined effects of waves and currents. Therefore, it is essential to understand scour depth around abutments to design and maintain structural stability effectively.
Numerous experimental investigations have been carried out to explore the scour phenomenon at different abutments under steady currents conditions [
4,
5,
6,
7,
8]. Laursen and Toch [
4] laid the groundwork for understanding local scour at abutments. However, their work did not provide the flow field behavior at abutments. In subsequent research, Kwan [
5] advanced this understanding by conducting measurements of the three-dimensional (3D) flow field around abutments. Kwan and Melville [
7] expanded the research and found important information about flow behavior around the abutments. They discovered two types of swirling movements called vortices (1) primary vortex and (2) secondary vortex. They observed that the primary vortex and its downward flow were the dominant flow structures around abutments, while the secondary vortex rotated opposite to the primary vortex [
9]. Dey and Barbhuiya [
8] performed an experimental study to examine scour at different abutment shapes with different sediment sizes. Their findings also revealed that the scour depth increases as the sediment size and abutment length increase. Oliveto and Hager [
10] introduced an extensive dataset on bridge pier and abutment scour and proposed an empirical formulation for scour. This empirical formulation assumed a logarithmic relationship between time and scour depth. Fael et al. [
11] performed experiments on sand and pumice bed materials around vertical wall abutments, measuring scour dimensions (depth, length, width, and volume) under clear water and live bed conditions. They found that sand yielded slightly larger scour dimensions compared to pumice, given the same flow conditions and median sediment size. Furthermore, Ballio et al. [
12] examined the impact of the obstruction ratio (abutment length to channel width) on abutment scour depth. They observed that the obstruction ratio reduces the temporal evolution of abutment scour depth. Recently, Abdelaziz and Lim [
13] performed an experimental study to examine equilibrium scour hole size at setback abutments with varying aspect ratios. Their findings highlighted the significant impact of abutment aspect ratios on scour characteristics such as equilibrium scour depth, and scour width. They also observed that increasing the abutment width leads to a reduction in both the equilibrium scour depth and scour hole width.
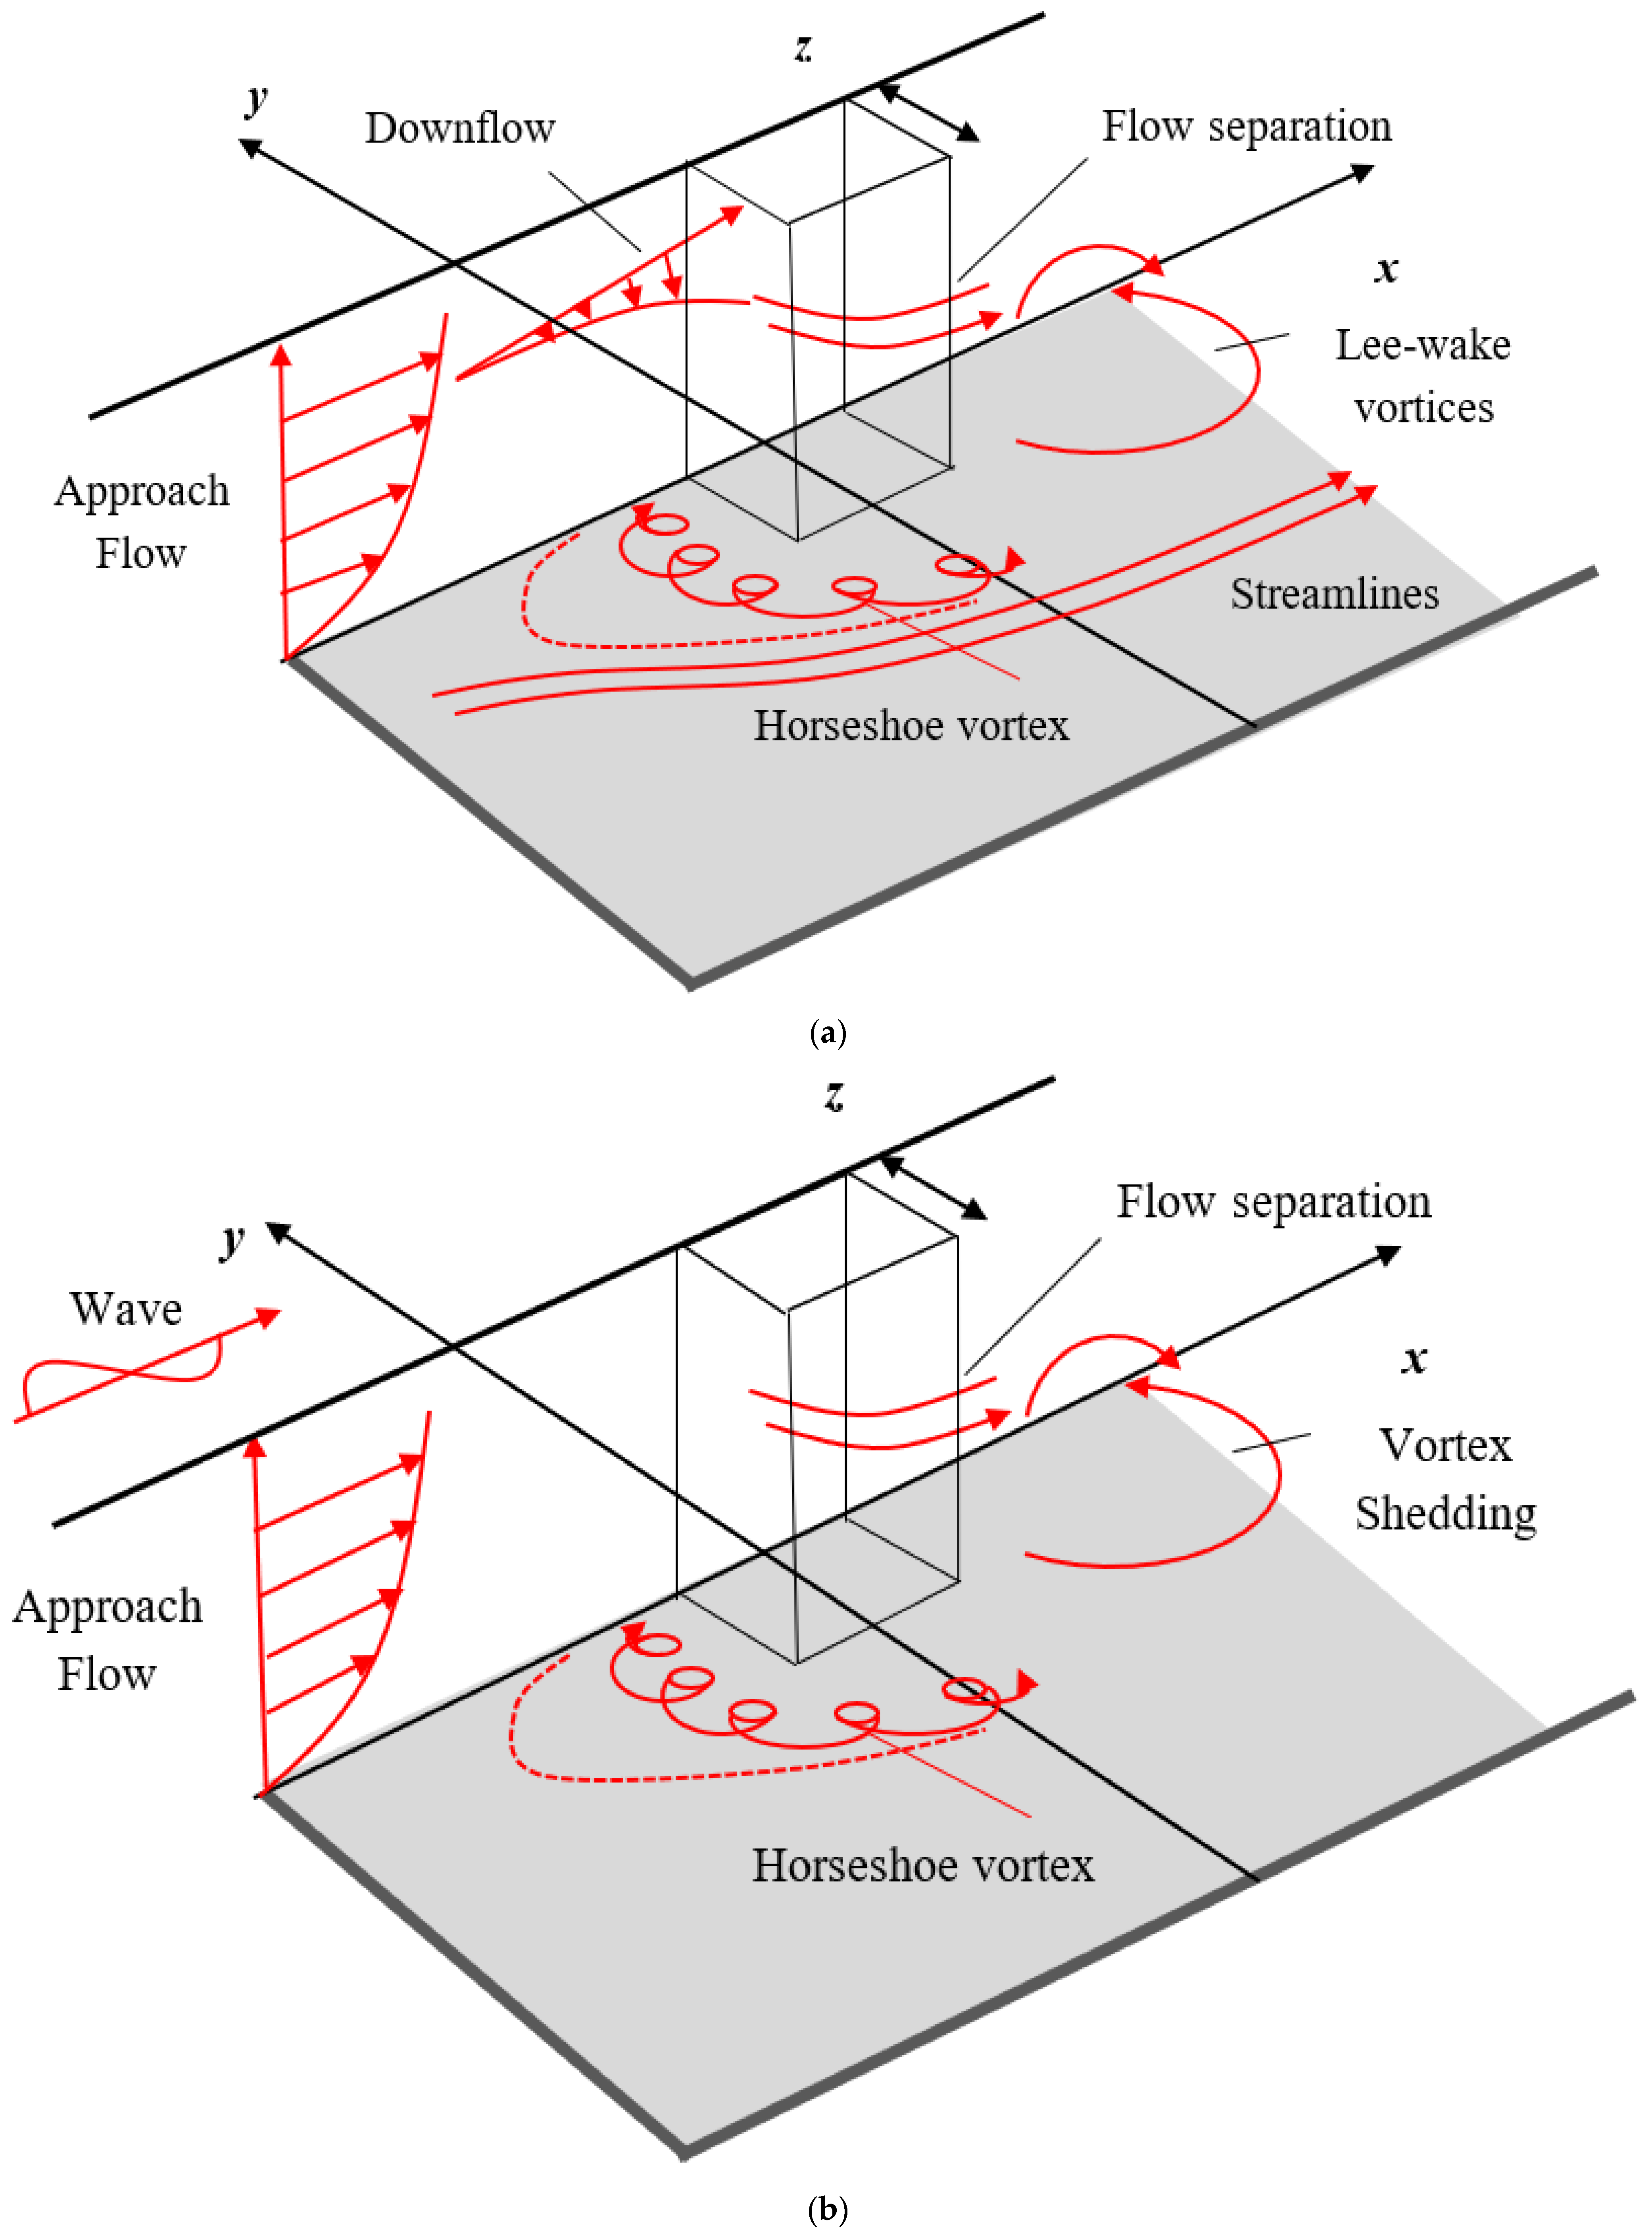
The interaction of the approaching flow with the vertical wall abutment results in the development of a complex vortex system that results in the formation of a scour hole around the abutment. The downflow, horseshoe vortex (HSV), lee-wake vortices, and streamline contraction affect the vortex system under a steady current [
14,
15]. However, HSV and vortex shedding are more dominant flow structures that cause the development of scour holes in the case of combined wave–current flows [
16,
17]. A schematic diagram of the vertical wall abutment scour mechanism in steady current and combined wave–current flows is shown in
Figure 1.
In combined effect of waves and currents, the approaching flow interacts with the abutment, complicating the flow hydrodynamics and generating complex vortices. Soulsby [
18] reported that when both waves and currents act together, the waves’ phase speed and wavelength become altered due to the influence of the currents, resulting in wave refraction. Additionally, the interaction between the waves and currents in the wave boundary layer increases bed shear stress, forming wave-developed currents [
19,
20,
21]. These wave-developed currents are the cause of suspending sediment particles from the seabed in the water [
22]. The development of horseshoe vortices (HSV) and lee-wake vortices are the main contributing factor for the development of scour holes around the abutment [
12,
13,
14,
15,
16,
17]. The combination of waves and currents causes additional scouring around the abutment, generating vortices and localized turbulence, intensifying the scouring process. The dynamic and complex scour patterns emerge from the interplay between waves and currents, impacting the scour hole formation.
Whitehouse [
23] and Sumer and Fredsøe [
17] investigated the pile scour and reported that the scour development around the pile is mainly influenced by two factors: (1) relative flow velocity (
Ucw) and (2) Keulegan–Carpenter (
KC) number. The Keulegan–Carpenter (
KC) number is a non-dimensional parameter that characterizes the significance of drag forces relative to inertia forces when considering bluff objects subjected to oscillatory fluid flow. The equations representing
KC and
Ucw in the combined wave–current scenario are given as Equations (1) and (2), respectively.
where
L is the abutment length,
Uw is the orbital velocity of wave near the bed,
Uc is the approaching current velocity,
T is the wave period.
Numerous experimental studies have investigated the steady current [
24,
25,
26,
27] and combined wave- and current-induced pile scour mechanism [
23,
28,
29,
30,
31,
32,
33,
34,
35,
36,
37,
38]. However, fewer experimental studies have focused on the local scour around abutments in the presence of the combined effects of waves and currents [
39]. Recently, numerical techniques have made significant progress in simulating complex scour problems in the combined effect of waves and currents with great precision, eliminating the need for model scaling [
40,
41,
42,
43]. Gautam et al. [
42] conducted CFD modeling to investigate the effect of
KC number on circular pile scour under varying
Ucw parameters. Dutta et al. [
43] examined the effect of aspect ratios on rectangular pile scour under combined wave–current flow. Kumar and Afzal [
39] performed the experimental investigation and numerical simulations for combined wave–current induced vertical wall abutment scour. Recently, Zhang et al. [
44] introduced a net-like mat as a countermeasure technique to mitigate local scour around piles. The results demonstrate that the use of the net-like mat effectively reduces local velocity and dissipates vortex formation within the scour pits.
The majority of the research discussed above has primarily concentrated on studying the equilibrium abutment scour depth in the presence of a steady current. However, there is a lack of studies that explore abutment scour with different aspect ratios under combined wave–current flow conditions. This knowledge gap prompted the authors to conduct the present numerical investigation. Therefore, this study focuses on understanding the scouring process around vertical wall abutments with varying aspect ratios. The present research considers both steady current and combined waves and currents to examine abutment scour. The main objective is to investigate how the scour phenomenon behaves in combined wave–current flows for an aspect ratio (B/L, where B is the length in the flow direction, and L is the abutment length transverse to the flow direction) and relative flow velocity (Ucw) parameters. According to the authors’ knowledge, this study is the first of its kind that utilizes a three-dimensional, semi-coupled model to examine combined waves and current flow induced scour at vertical wall abutments with varying aspect ratios.
2. Numerical Model
The present study employs a novel 3D numerical model, REEF3D [
45,
46], to estimate combined wave–current-induced scour at vertical wall abutments with varying aspect ratios. The open-source code, REEF3D, is a semi-coupled three-phase numerical model designed explicitly with remarkable free-surface-capturing capabilities. This numerical model effectively solves the incompressible fluid Reynolds-averaged Navier–Stokes (RANS) equations and the continuity equations given in Equations (3) and (4).
where
U represents the time-averaged velocity,
ρ = fluid mass density,
P = pressure, and
= eddy viscosity.
The standard
k-ω turbulence model [
47] determines the eddy viscosity required for turbulence modeling. To handle the pressure gradient term in the Reynolds-averaged Navier–Stokes (RANS) equations, the projection method [
48] is used that requires explicit time treatment of the Navier–Stokes equation for incompressible fluid. By initially neglecting the pressure gradient, an intermediate velocity field is computed using the transient RANS equation, although it does not fully satisfy the continuity equation. Subsequently, the pressure gradient is considered to calculate the velocity at the next time step (
n + 1), ensuring divergence-free properties through convection. The present numerical model incorporates an efficient solution for the Poisson equation by integrating a Jacobi-preconditioned BiCGStab solver [
49] that operates in full parallelization. The proposed approach exhibits promising results for achieving accurate and reliable simulations in computational fluid dynamics research and engineering applications.
In the present study, an advanced finite difference approach is adopted to compute the spatial derivatives of the RANS equation. The mesh in the domain is generated using the Cartesian grid system approach. The fifth-order weighted essentially non-oscillatory (WENO) scheme [
50] is utilized to discretize the convective component of the RANS equations. The third-order Runge-Kutta method of Total Variation Diminishing (TVD) [
51] is employed for time discretization, ensuring higher-order temporal precision. The Courant Friedrichs-Lewy (CFL) number is kept below 1 to ensure stability of numerical model [
52].
The occurrence of erosion and deposition at abutment is determined by analyzing the movement of sediment particles. To achieve this, the flow patterns generated by the hydrodynamic model in REEF3D are utilized. The morphological changes in the bed elevation can be computed using the Exner equation, represented by Equation (5).
where
zb denotes the bed elevation,
n represents the sediment porosity,
qb,x, and
qb,y are the bed load transport rate in
x and
y directions, respectively. At the same time,
Ds and
E are the sediment deposition and entrainment rates, respectively.
Sediment transport can be classified into two main categories: bedload transport and suspended load transport [
53]. The representation of bed shear stress and sediment transport in a dimensionless form can be found in Equations (6)–(8).
where
ρs is the density of sediment,
di is the sediment particle diameter,
is the non-dimensional bed load transport rate,
and
are the non-dimensional shear stress and non-dimensional critical shear stress, respectively. The formulation of bed load transport proposed by van Rijn [
54] is utilized and can be represented as in Equation (9).
Further, the suspended sediment transport is calculated using the advection-diffusion equation [
55], given in Equation (10).
where,
denotes the terminal fall velocity, and
= turbulent diffusion coefficient, considered as eddy viscosity.
The turbulent Schmidt number as (
ScT), is defined as the ratio of the eddy viscosity (
νt) to the sediment diffusivity (
Ds) in a turbulent flow, given in Equation (11).
The turbulent Schmidt number (
ScT) is a dimensionless parameter that plays a crucial role in sediment transport studies, particularly in the modeling of sediment dispersion and diffusion in turbulent flows. The Schmidt number (
ScT) is typically falls within the range of 10
−2–10
2 depending on factors like temperature in air and water, respectively. However, due to the inherent variability of environmental turbulent flows, there is no universally fixed value for
ScT. Hence, by analogy between momentum and mass transport,
ScT is often assumed as a first approximation to be equal to unity [
56]. Therefore, the turbulent Schmidt number (
ScT) was set equal to 1 in the present study.
As Kovacs and Parker [
57] proposed, a modification factor is incorporated into the critical shear stress of the sediment bed. This adjustment accounts for the presence of non-horizontal slopes within scour holes. To further enhance the numerical model’s accuracy, the Sandslide algorithm is utilized. This algorithm reduces bed shear stress during the scouring process and prevents excess downstream sediment transport, particularly when the bed slope surpasses the angle of repose (
φ). For a comprehensive understanding of the numerical CFD model (REEF3D), encompassing both morphological and hydrodynamic modeling, readers can refer to the detailed explanation provided by Kumar and Afzal [
39].
2.1. Numerical Wave Tank
The present study utilizes a reduced-size Numerical Wave Tank (NWT) to examine the effect of aspect ratio on combined wave–current-induced vertical wall abutment scour. Previous numerical studies have shown that using a reduced-size NWT yields identical results as full-sized NWT simulations, while significantly reducing computational cost and time. Therefore, the present study used the reduced-sized NWT of dimensions 3.0 m in length, 0.5 m in width, and 0.7 m in height. Compared to physical modeling, the reduced-size NWT offers time and cost efficiency advantages. The second-order Stokes waves with Dirichlet boundary conditions were implemented to model the waves at the inlet of the tank. Accurate wave generation and interference are ensured by reducing wave reflection at the output boundary. For this purpose, the Active Wave Absorption (AWA) condition was utilized. The vertical wall abutment scour with varying aspect ratios was modeled by adopting these methodologies. Ensuring the reduced size NWT’s effectiveness by preventing wave reflection and using the AWA condition helps us obtain reliable and accurate results for present research.
2.2. Model Validation
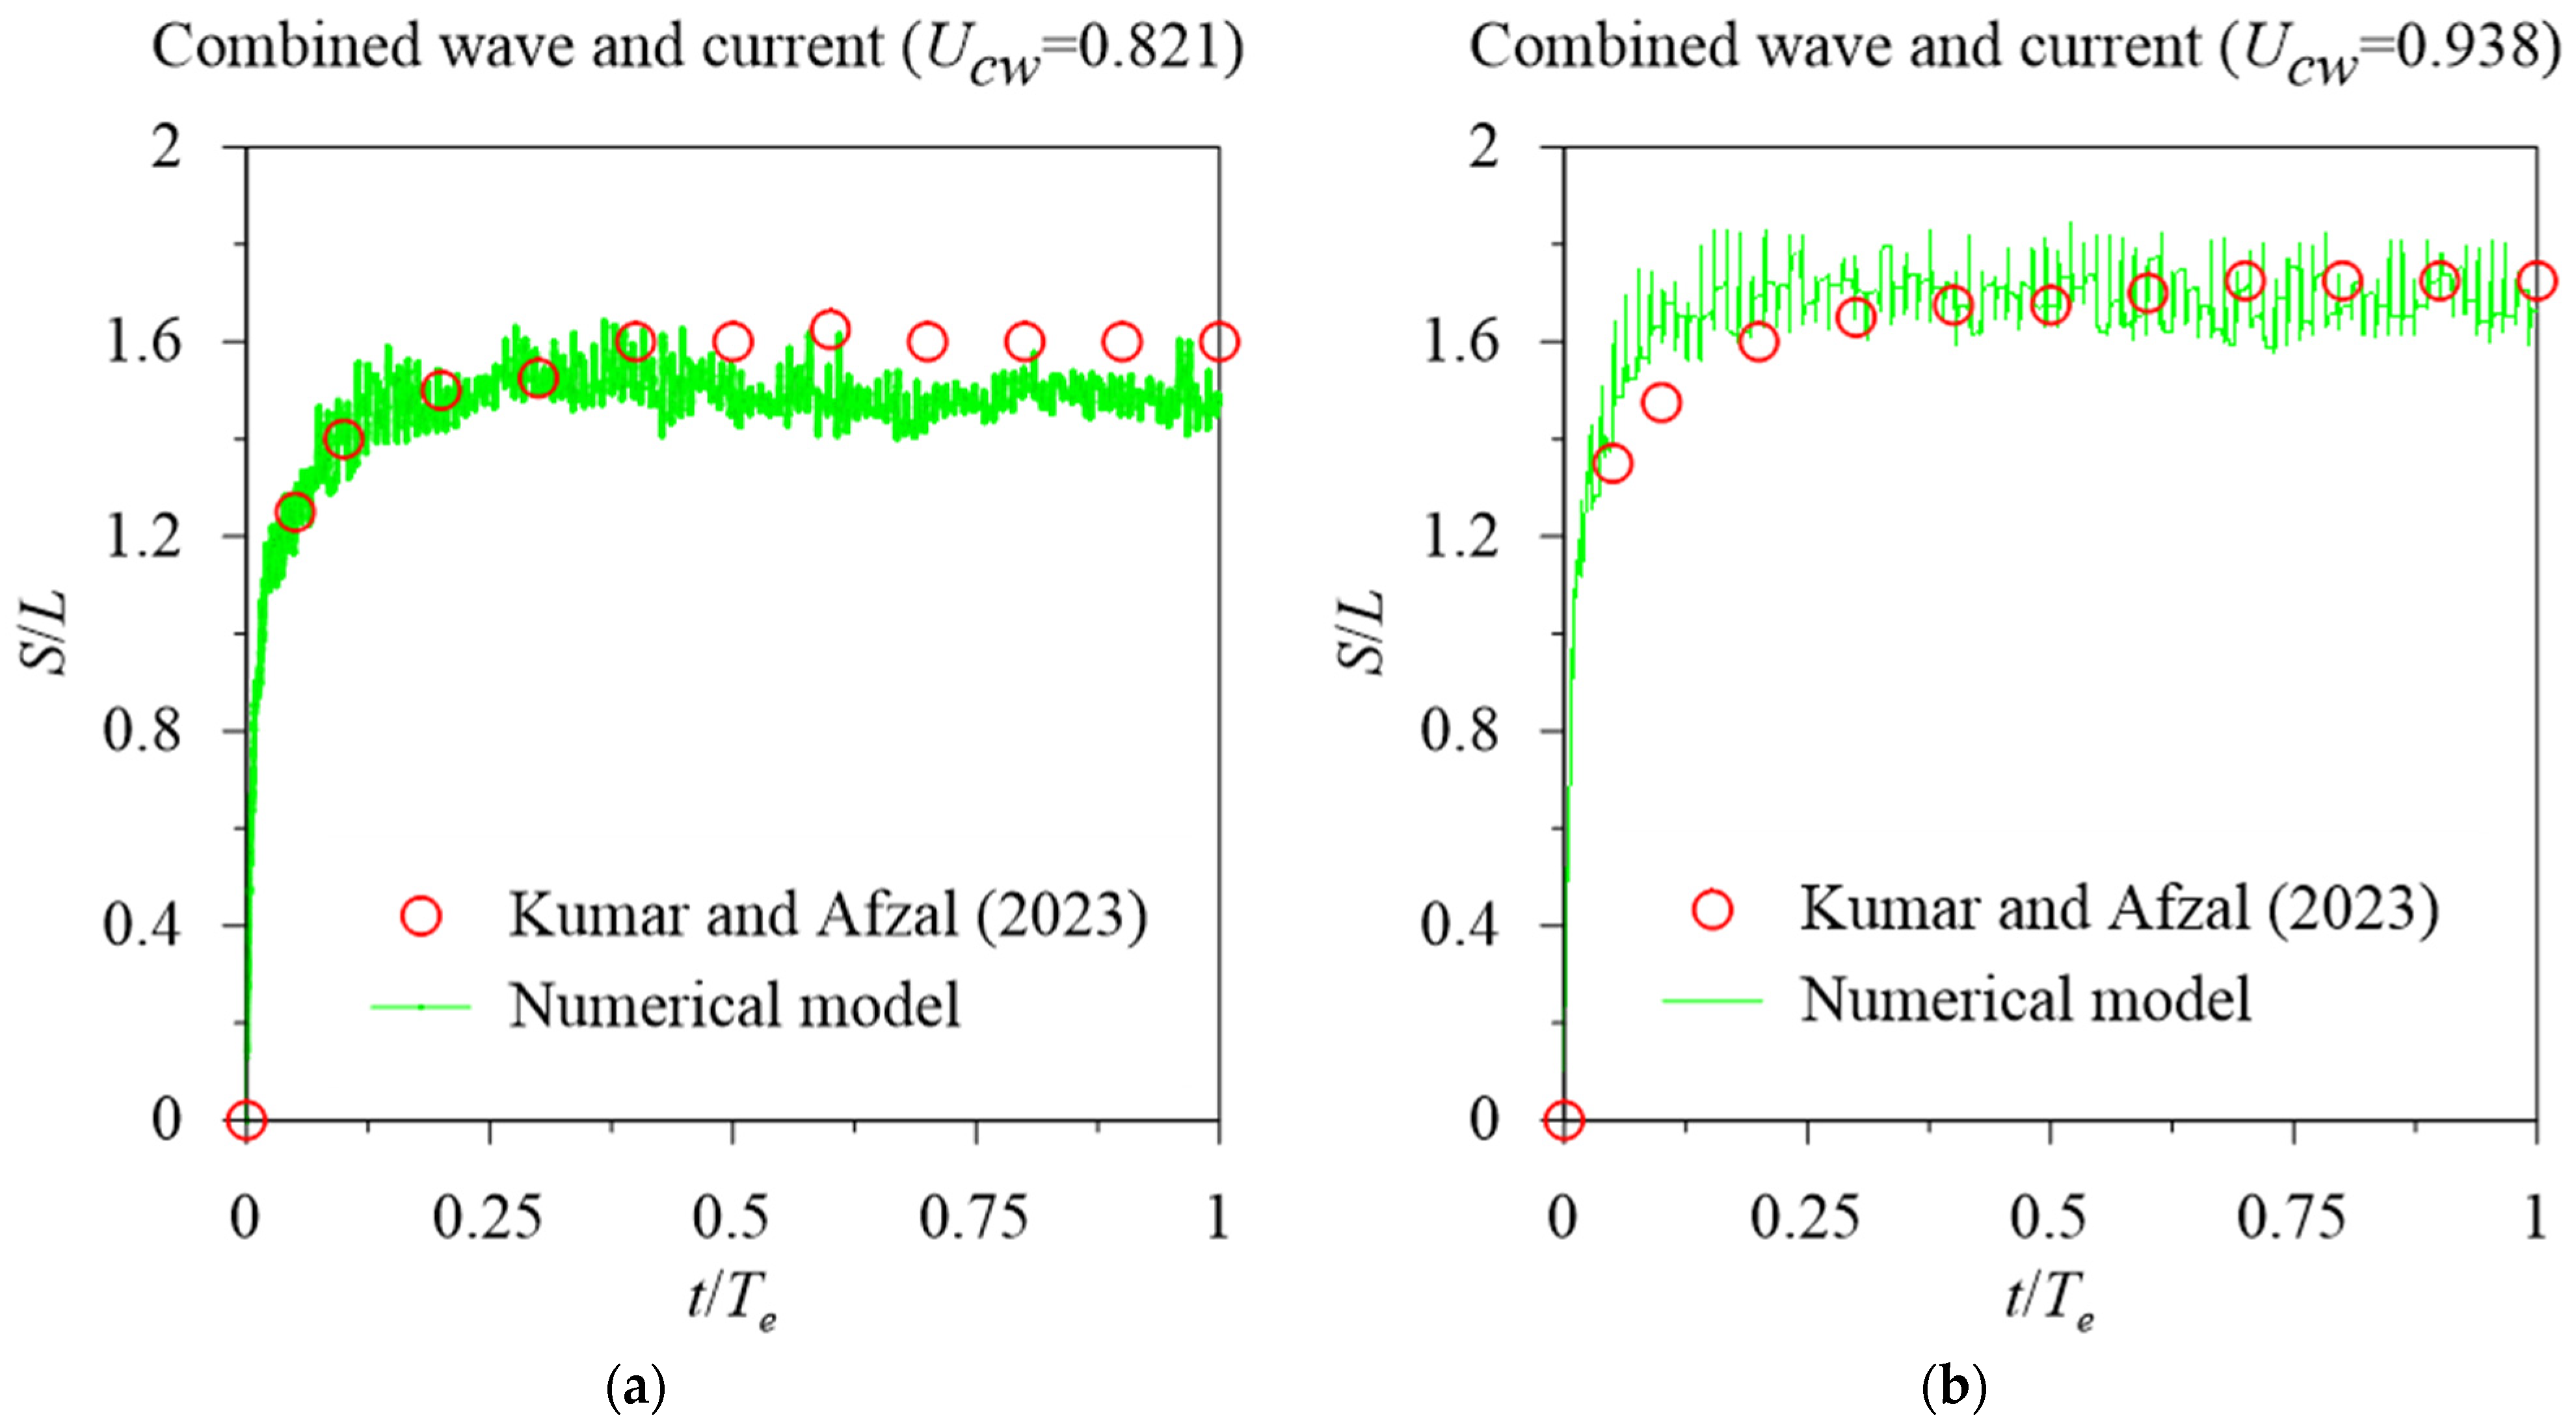
The present study uses a unique wave–current-flow-based sediment transport module of REEF3D to analyze scour phenomenon around vertical wall abutments with varying aspect ratios. To ensure the reliability of the numerical model, an extensive validation process is conducted under various flow conditions, including steady flow and combined wave–current flow. The numerical model results were compared with the experimental findings by Kumar and Afzal [
39] concerning abutment scour under steady current as well as in combined effect of waves and current condition, shown in
Figure 2, where
S/
L is the non-dimensional scour depth,
t is the instantaneous time, and
Te is the total time required to achieve equilibrium scour depth.
Figure 2a shows the comparison of numerical simulation results with experimental observations of Kumar and Afzal [
39] for the time development of combined wave–current-induced abutment scour for
Ucw = 0.821. The normalized abutment scour depth obtained through the numerical investigations was 1.475, demonstrating a close agreement with the experimental observation of 1.6. This level of congruence between the experimental and numerical observations strongly suggests the precision and reliability of the numerical approach.
Similarly,
Figure 2b compares numerical simulation results with the experimental observations of Kumar and Afzal [
39] for the time development combined wave–current-induced abutment scour for
Ucw = 0.938. The normalized abutment scour depth (
S/
L) obtained from the numerical investigations under combined wave–current flows (
Ucw = 0.938) was 1.66, which closely matched the experimental observation of 1.725 reported by Kumar and Afzal [
39]. Further, to strengthen the validation study, the numerical model results of the time development of abutment scour depth is also compared with the experimental results of Kumar and Afzal [
39] in steady current, as shown in
Figure 2c. The numerical outcomes exhibited a favorable correspondence with the experimental findings, revealing a normalized abutment scour depth of 1.705 in comparison to the experimental measurement of 1.75.
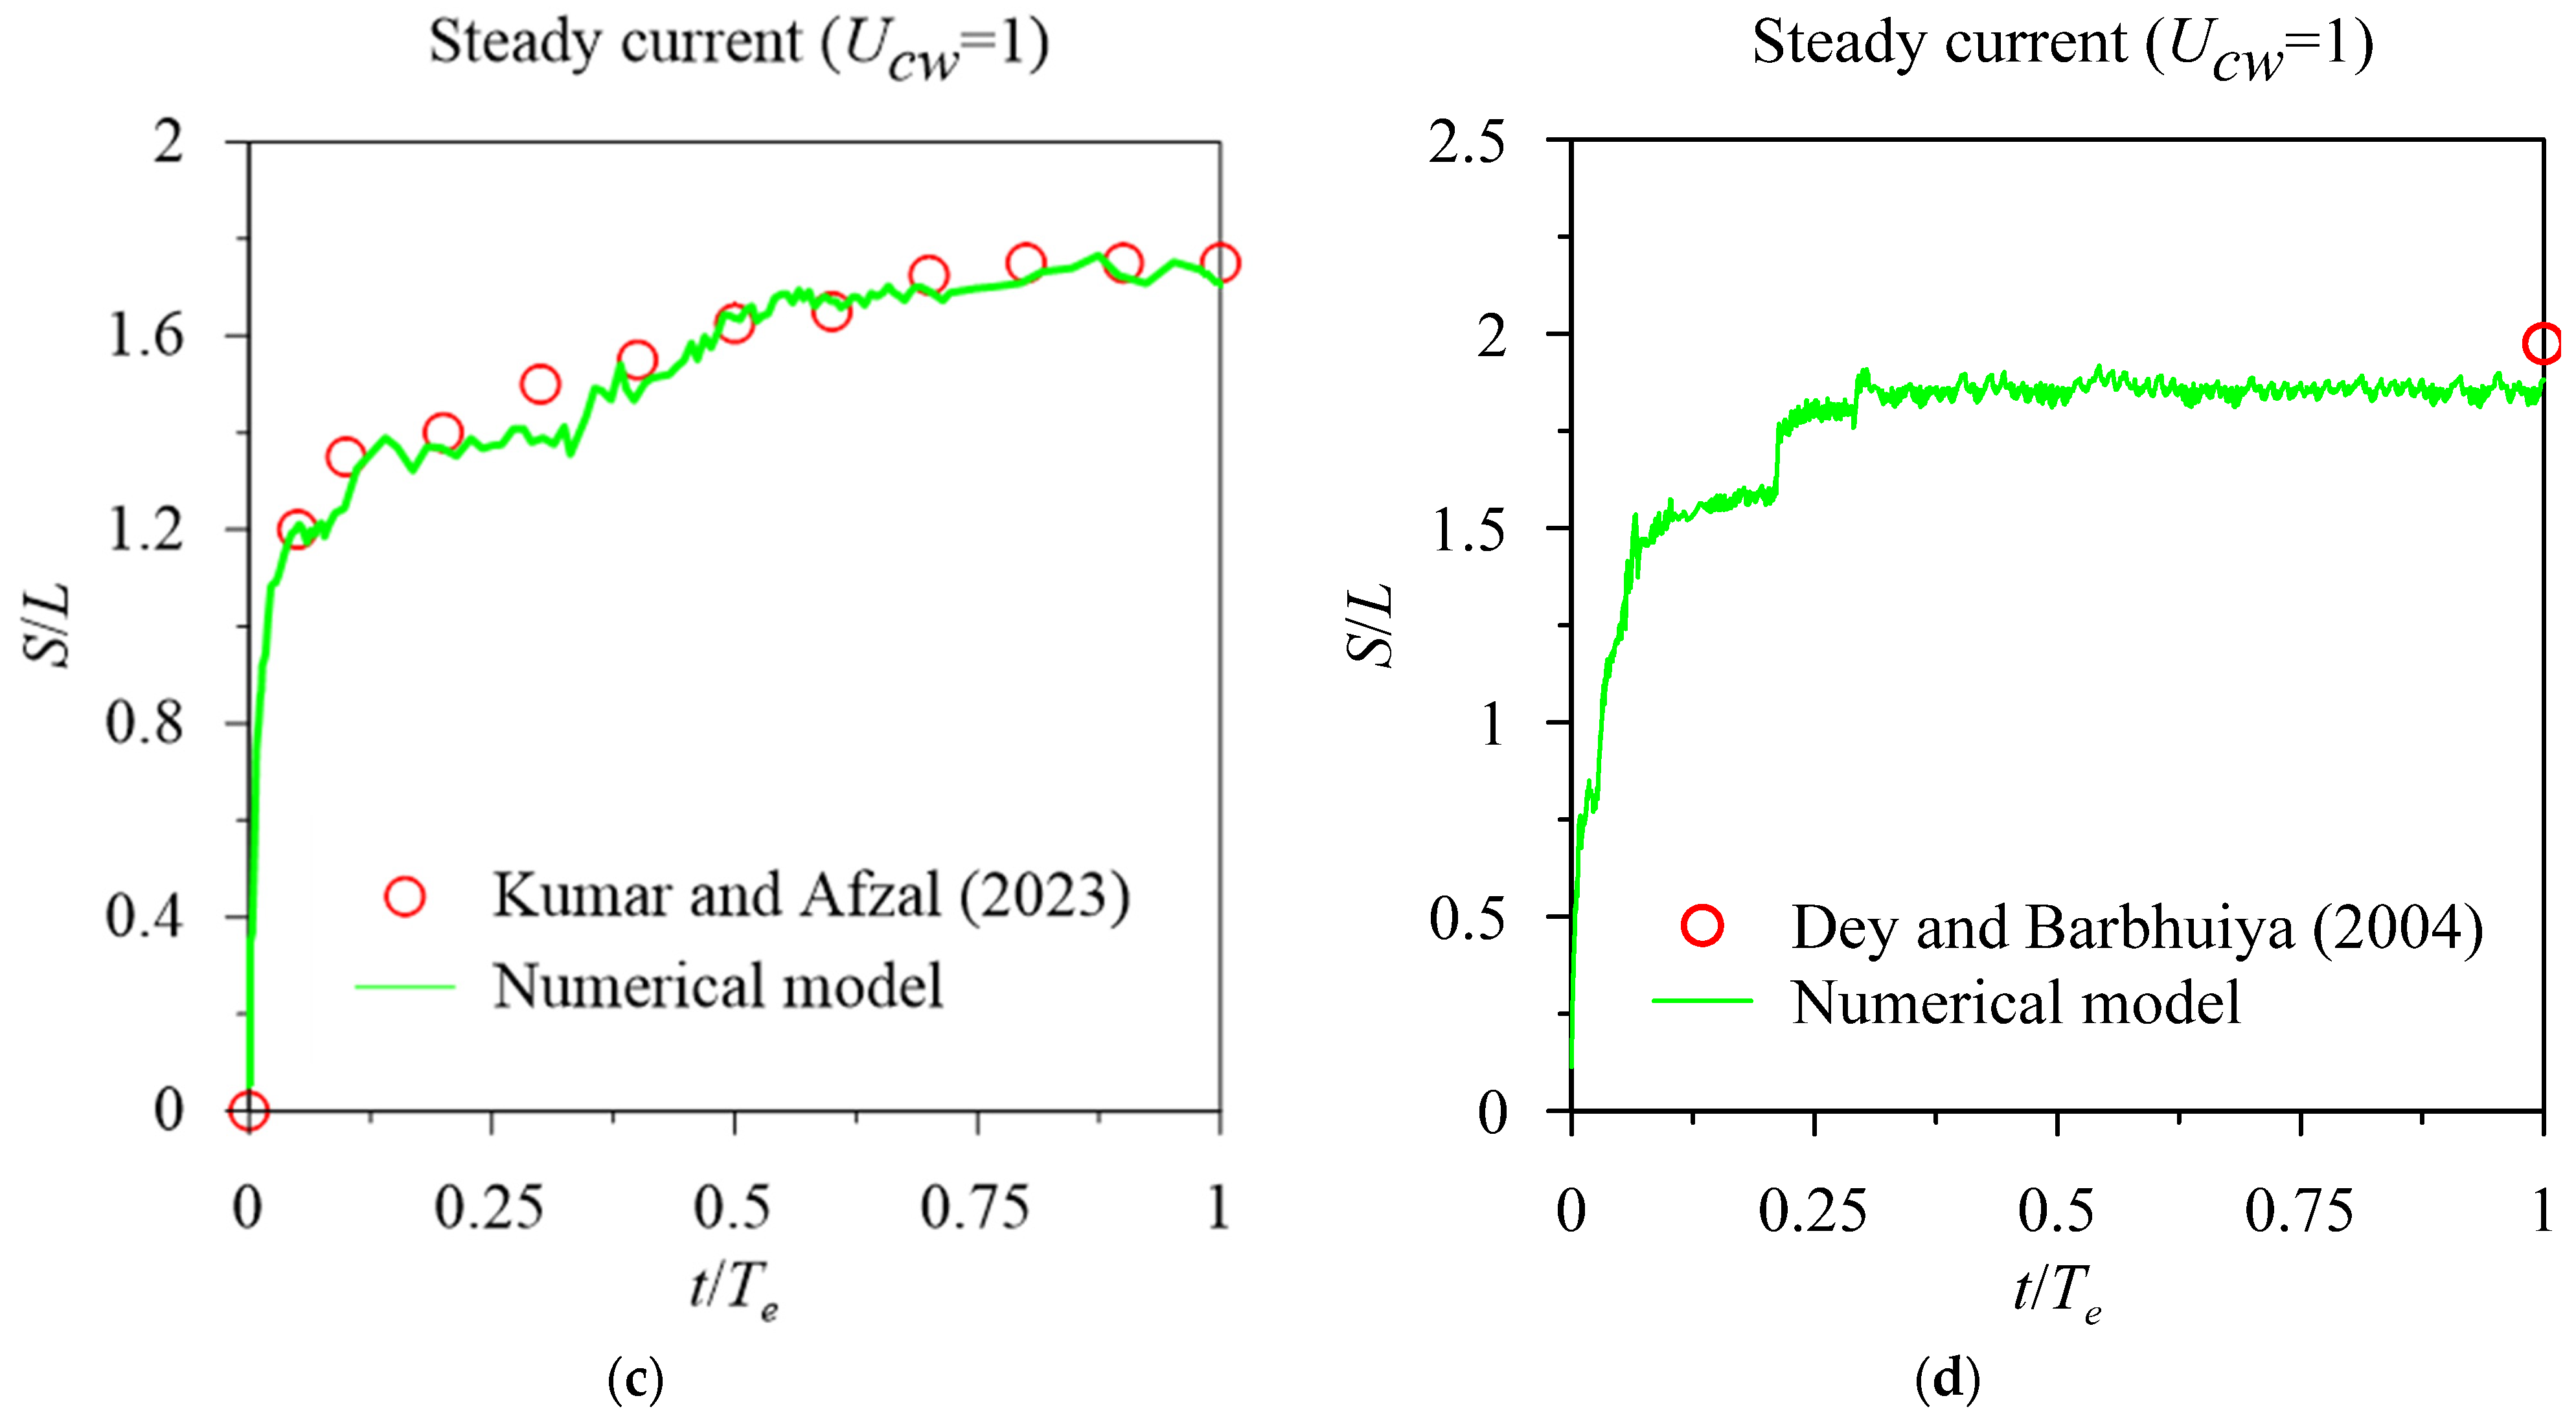
Additionally, the numerical model was also validated with the experimental findings on abutment scour under steady currents reported by Dey and Barbhuiya [
8]. The comparison revealed a strong concordance between the model’s predictions and the experimental data. Specifically, the model predicted a normalized abutment scour depth of 1.9, while the experimental results displayed a depth of 1.975, as illustrated in
Figure 2d. These validation outcomes show the reliability of the numerical model in accurately estimating abutment scour depth. The experimental results of Kumar and Afzal [
39] and [
8] along with numerical model results of abutment scour depth performed in the present study are summarized in
Table 1, where WC represents the combined wave–current conditions, C represents the steady current case,
H is the wave height,
Lw is the wavelength, and
S/
L is the non-dimensional scour depth.
The numerical model validation shows that the present numerical model is capable of consistently producing accurate, precise, and reliable results for abutment scour, both in steady currents and under the combined influence of waves and currents. This makes it a valuable tool for conducting further analyses.
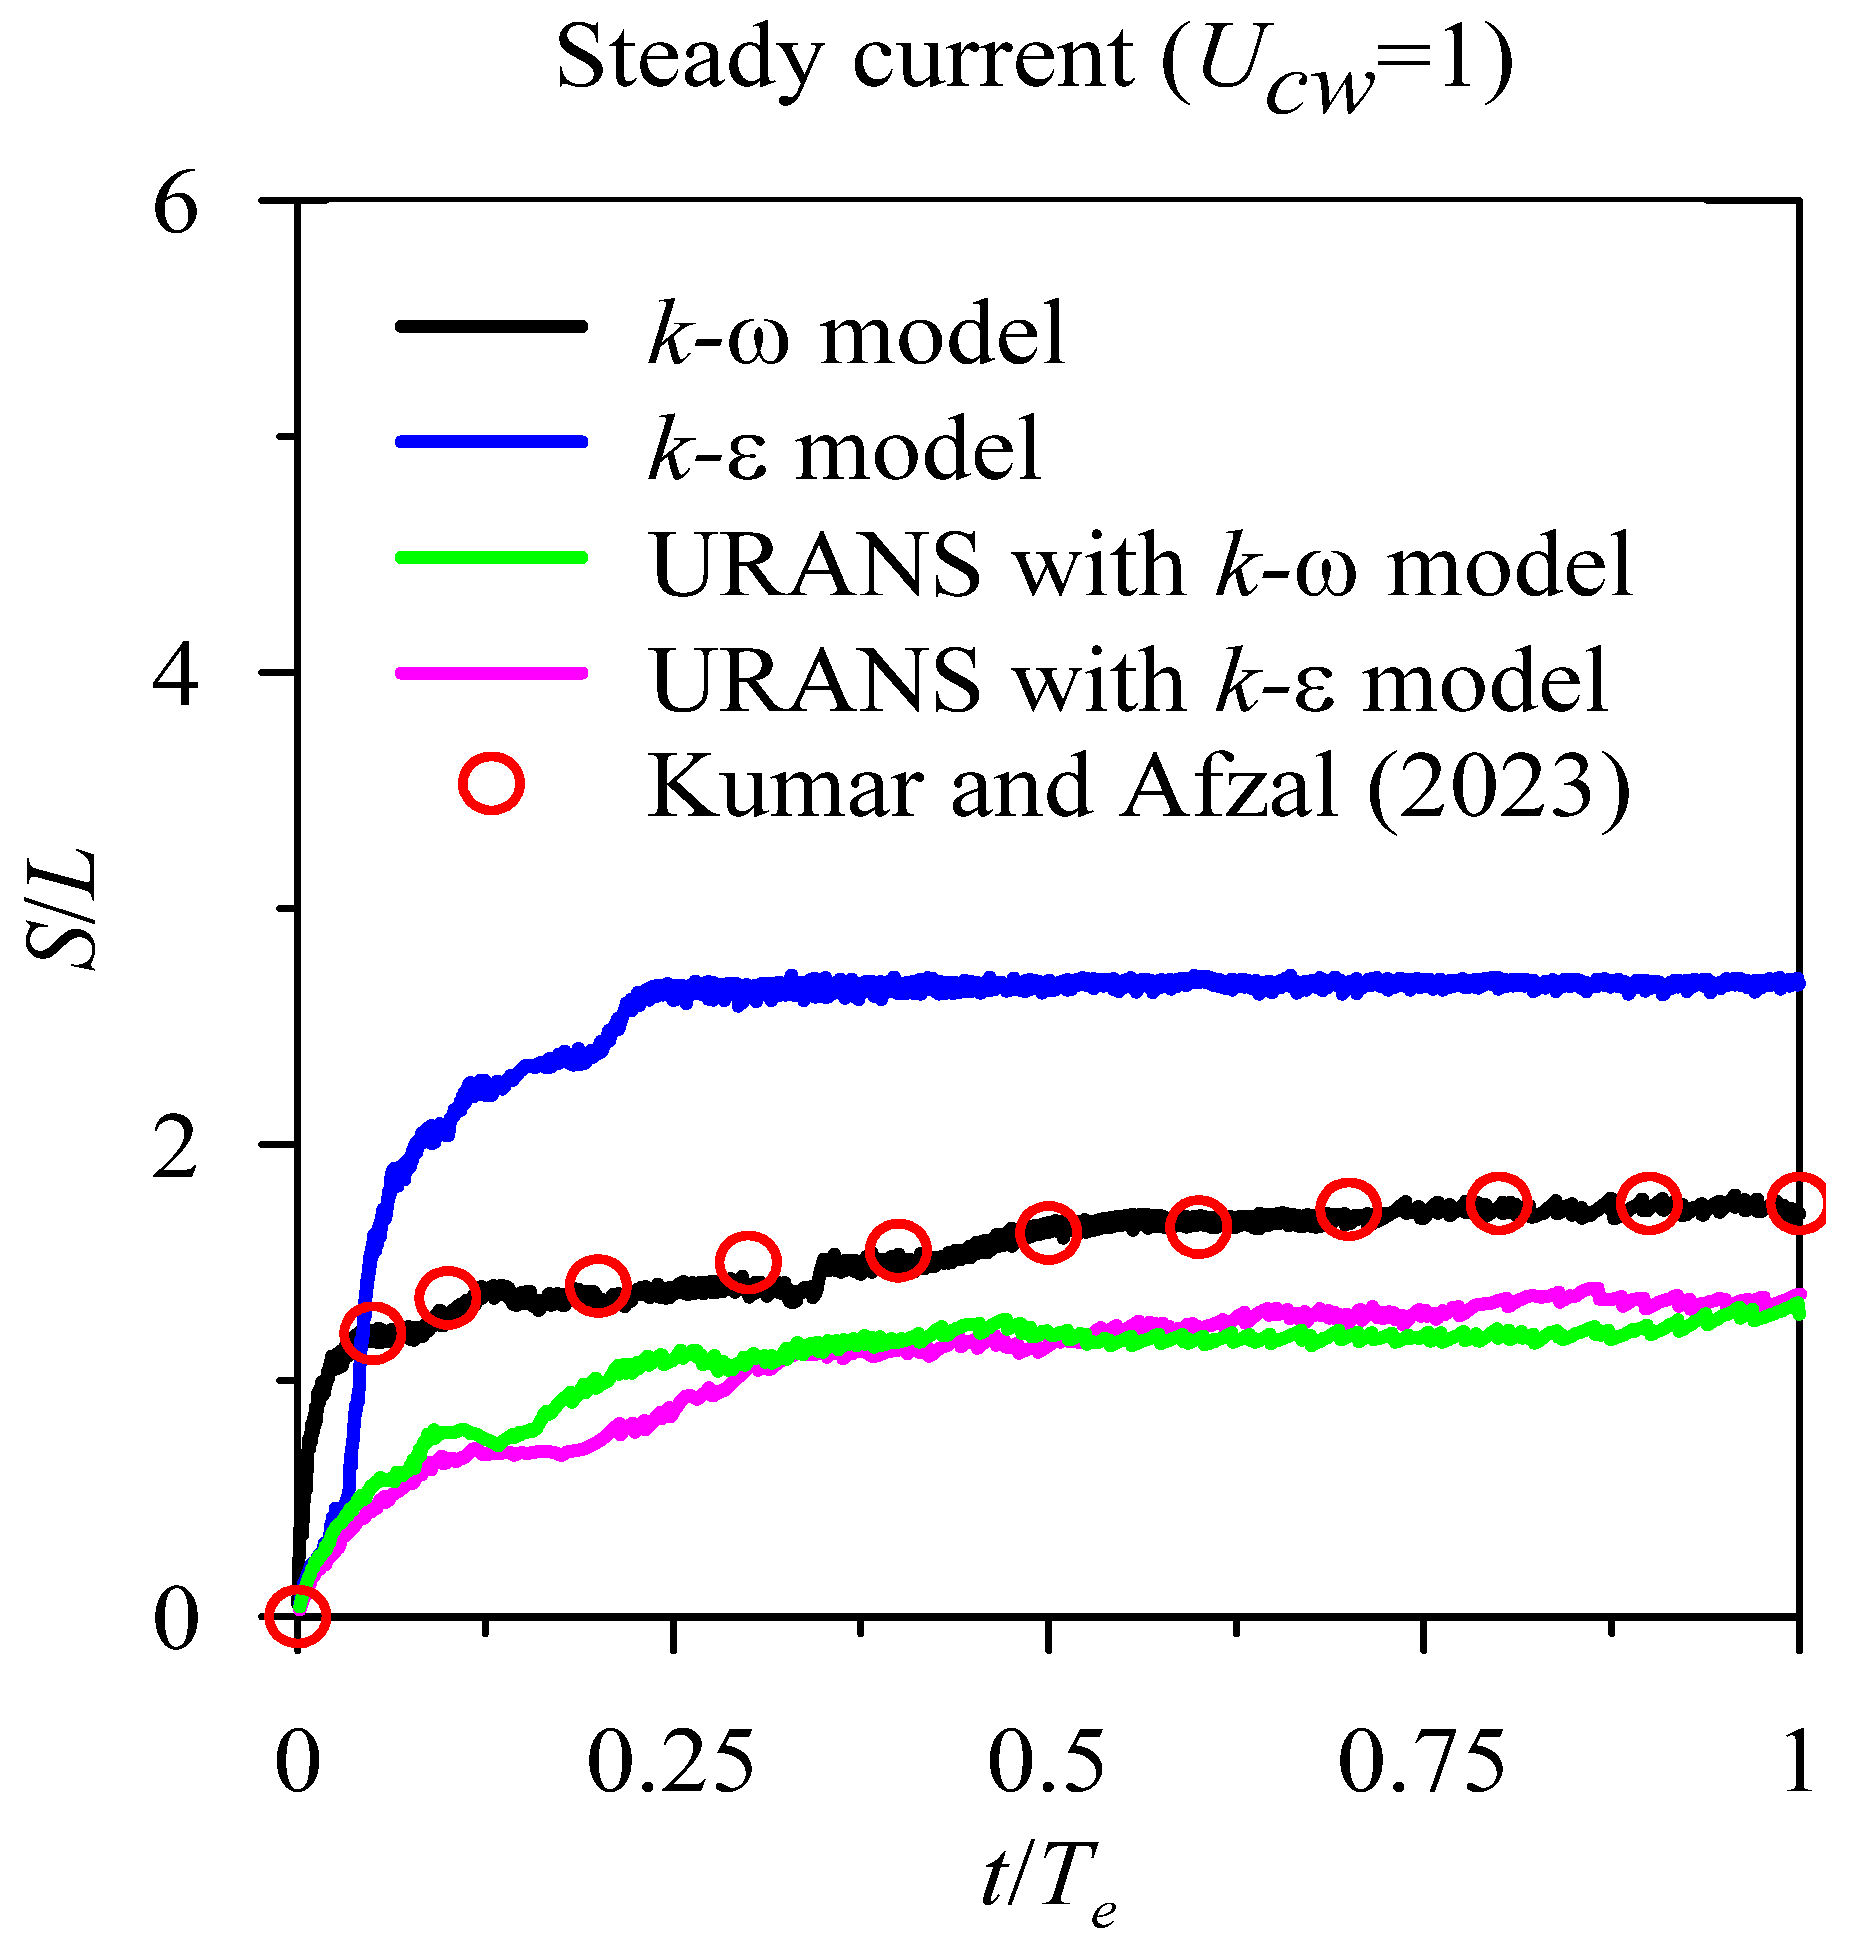
In the present study, the temporal evolution of scour depth prediction using various turbulence models is shown in
Figure 3. The present study aimed to evaluate the temporal evolution of scour depths and their alignment with experimental observations. It is evident that the
k-ω outperforms the
k-ε turbulence model in predicting abutment scour depth over time. In contrast, the
k-ε turbulence model overestimates the scour depth when compared to the experimental dataset of abutment scour depth under steady current Kumar and Afzal [
39]. Furthermore, the Unsteady Reynolds-Averaged Navier–Stokes (URANS) approach was also examined with both
k-ε and
k-ω turbulence models. However, both URANS turbulence models underestimate the temporal abutment scour depth compared to experimental findings. Durbin [
58] reported that the
k-ω turbulence model performs better than the
k-ε turbulence models, especially in modeling scour depth near wall boundaries. Therefore, the present study utilizes the
k-ω turbulence model for predicting abutment scour depth under combined wave–current flows with various aspect ratios.
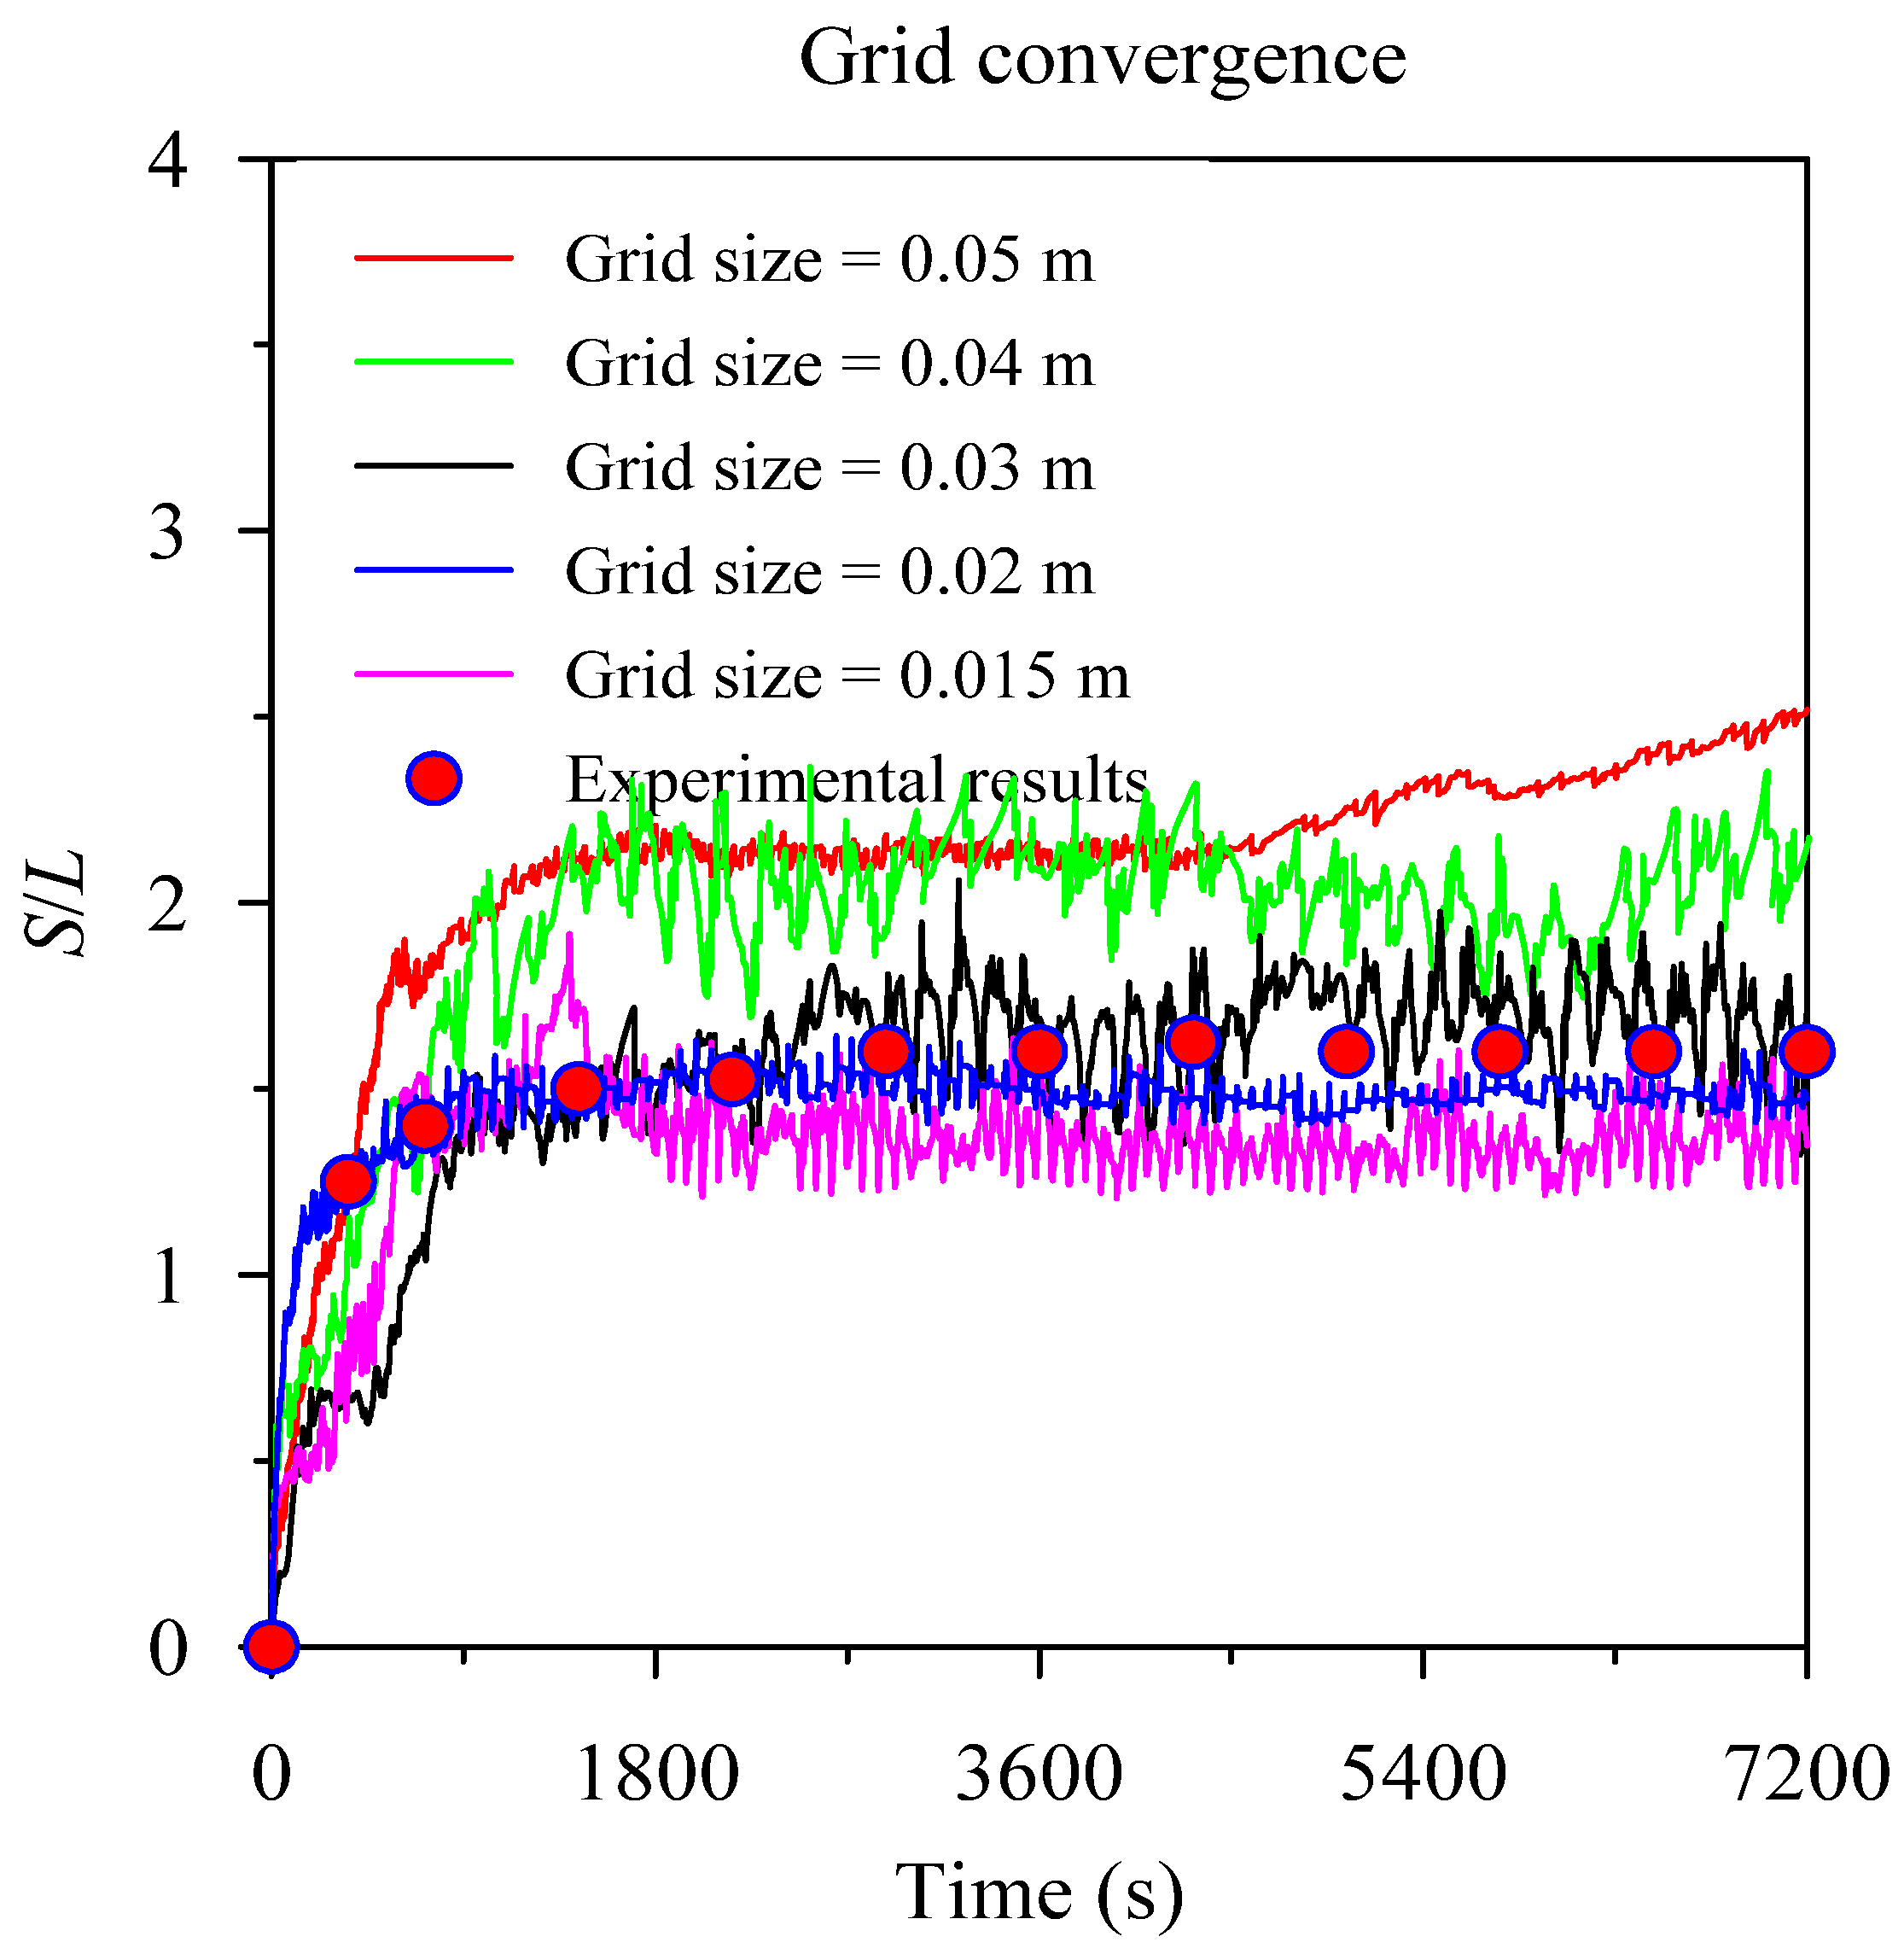
Figure 4 presents the grid convergence study of numerical model’s predictions for time development of abutment scour depth. The discrete red points show the experimental observations of abutment scour for
Ucw = 0.821, reported by Kumar and Afzal [
39]. The smooth line represents the numerical results of abutment scour using different grid sizes (5, 4, 3, 2, and 1.5 cm). The numerical simulations with coarser grid sizes of 5 and 4 cm show significant differences compared to the experimental dataset. As the grid size was refined, the accuracy of predicting the abutment scour depth changes over time improved. The grid size of 2 cm was identified as the optimal choice for achieving accurate results. Reducing the grid size further to 1.5 cm did not show the noticeable change in the time development of scour depth. Therefore, the present study utilizes a grid size of 2 cm to examine the effect of aspect ratio on vertical wall abutment scour under combined effect of waves and current.
3. Results and Discussion
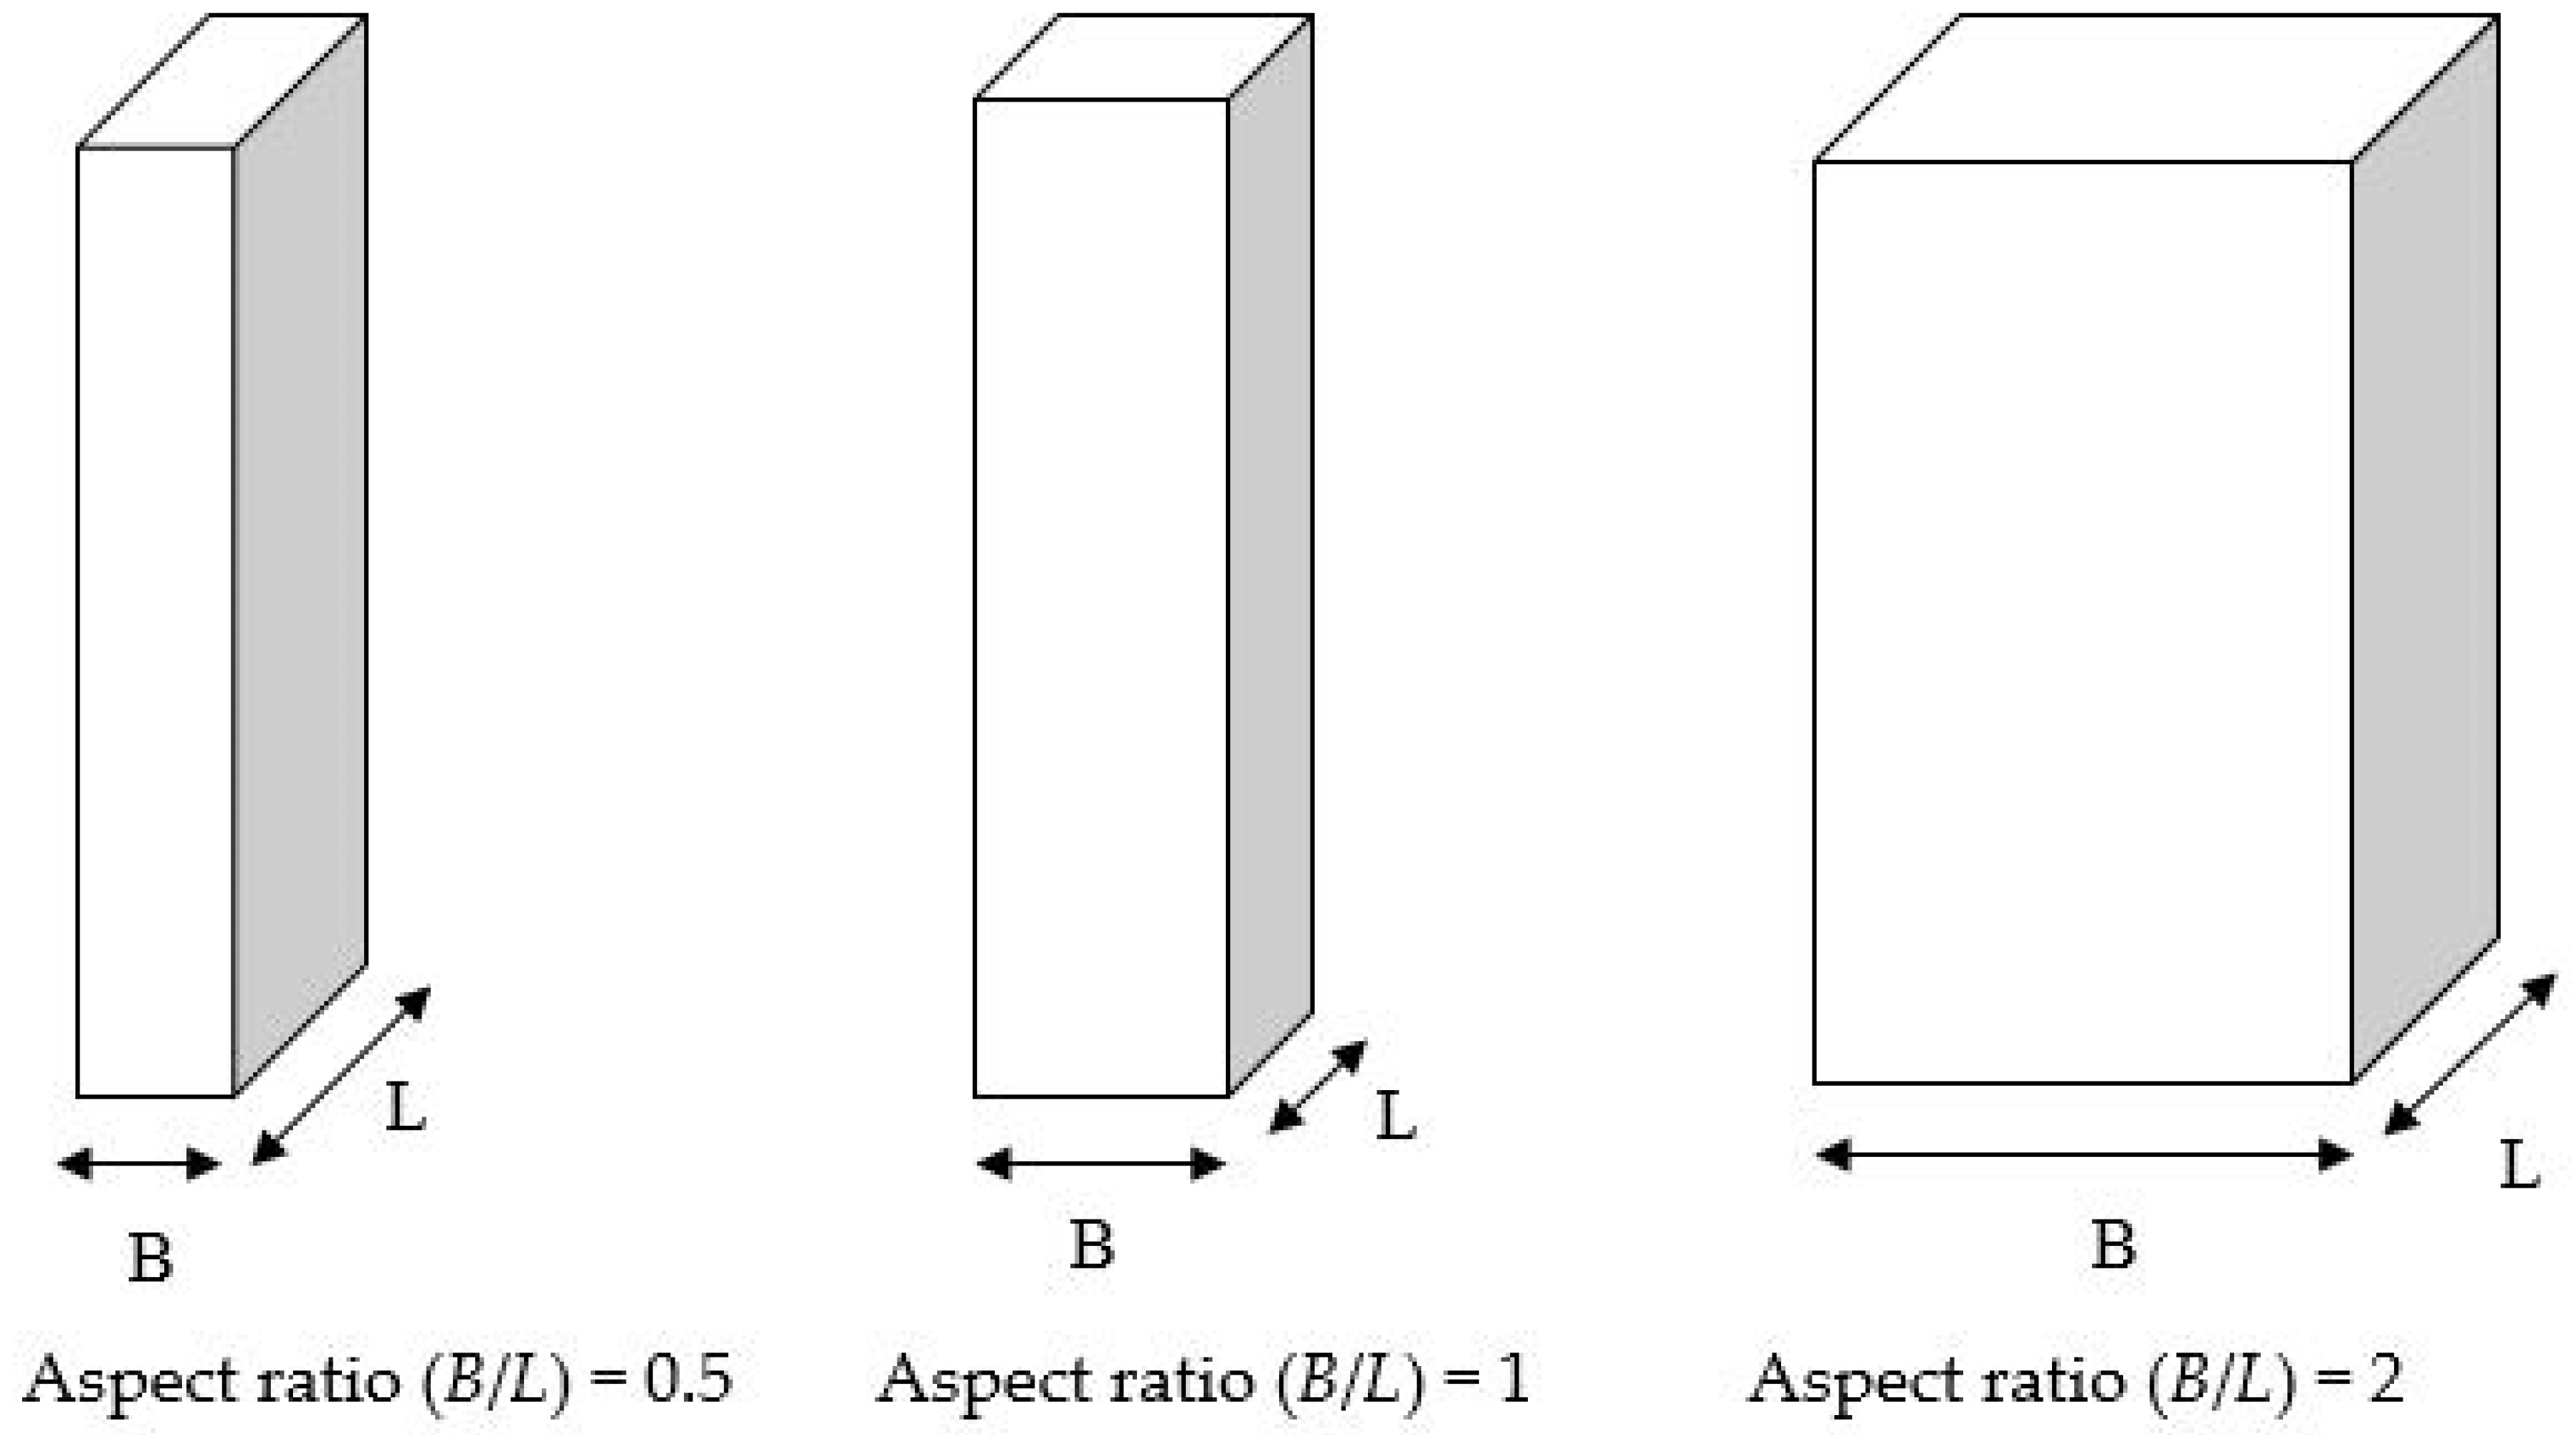
The REEF3D numerical model was employed to examine the scour phenomena around vertical wall abutments with varying aspect ratios (
B/
L) under both current-only and combined effect of waves and current. Three different
Ucw values (0.821, 0.938, and 1) were employed for the numerical simulations, along with three different aspect ratios (i.e., 0.5,1, and 2). A schematic diagram depicting vertical wall abutments with varying aspect ratios (
B/
L) is shown in
Figure 5.
Table 2 presents sediment characteristics used in the numerical simulations to examine the effect of vertical wall abutment aspect ratio on equilibrium scour depth. The median sediment size (
d50) is considered of 0.23 mm. The void ratio (
e) of 0.70 highlights the presence of substantial pore space relative to solid particles, holding significance for compaction and permeability analyses. The relative density (
S) of 2.65 signifies a relatively dense sediment. Furthermore, the angle of repose (
ϕ) was considered at 30°, providing valuable insights into the natural stability of the sediment on slopes.
Table 3 presents the fluid properties and flow characteristics used in numerical simulations of the present study. The numerical experiments were performed using the fluid density (
ρ) of 997 kg/m
3, with a kinematic viscosity (
ν) set at 10
−6 m
2/s. A flow velocity (
Uc) of 0.2387 m/s and a corresponding flow depth (
h) of 0.2 m were employed throughout the investigation. Similar to the study performed for numerical model development and validation by Blocken and Gualtieri [
59], the Reynolds number (
Re =
Uch/
ν) was calculated to be 47,740, indicating a turbulent flow regime. Furthermore, the calculated Froude number (
Fr =
Uc/(
gh)
0.5) was determined to be 0.170, signifying the presence of subcritical flow conditions in open channels.
Using a high-performance computing facility, nine numerical simulations were conducted. Now, the scour depth is normalized using the width of the abutment to achieve normalized scour depth (
S/
B) for better visualization and interpretation of the results. Every simulation utilized 20 CPU cores and was executed over a simulation time period (
Te) of 2 h (7200 s) to obtain equilibrium scour conditions at abutments. The normalized abutment scour depth observed for different aspect ratios under different wave–current conditions is summarized in
Table 4.
3.1. Combined Wave–Current-Induced Scour for Ucw = 0.821
The interaction of waves and current substantially impacts the mechanism of abutment scour. The numerical simulations were carried out under combined effect of waves and current, with specific wave parameters of wavelength of 1.21 m, wave height of 0.02 m, and wave period of 1 s. For all the numerical simulations, the flow velocity was fixed 0.2387 m/s. Therefore, the Ucw and KC number were obtained 0.821 and 1.272, respectively. The abutment length was held constant at 0.04 m, while the abutment width was systematically varied: 0.02 m, 0.04 m, and 0.08 m, in order to achieve aspect ratios (B/L) of 0.5, 1, and 2, respectively. In the present combined wave–current conditions, the wave parameters, ak and H/L, are 0.0518 and 0.0165, respectively. The Shields parameter (θ) is calculated 0.0226, which is less than the critical Shields parameter (θcr) value of 0.045, indicating the clear water scour regime.
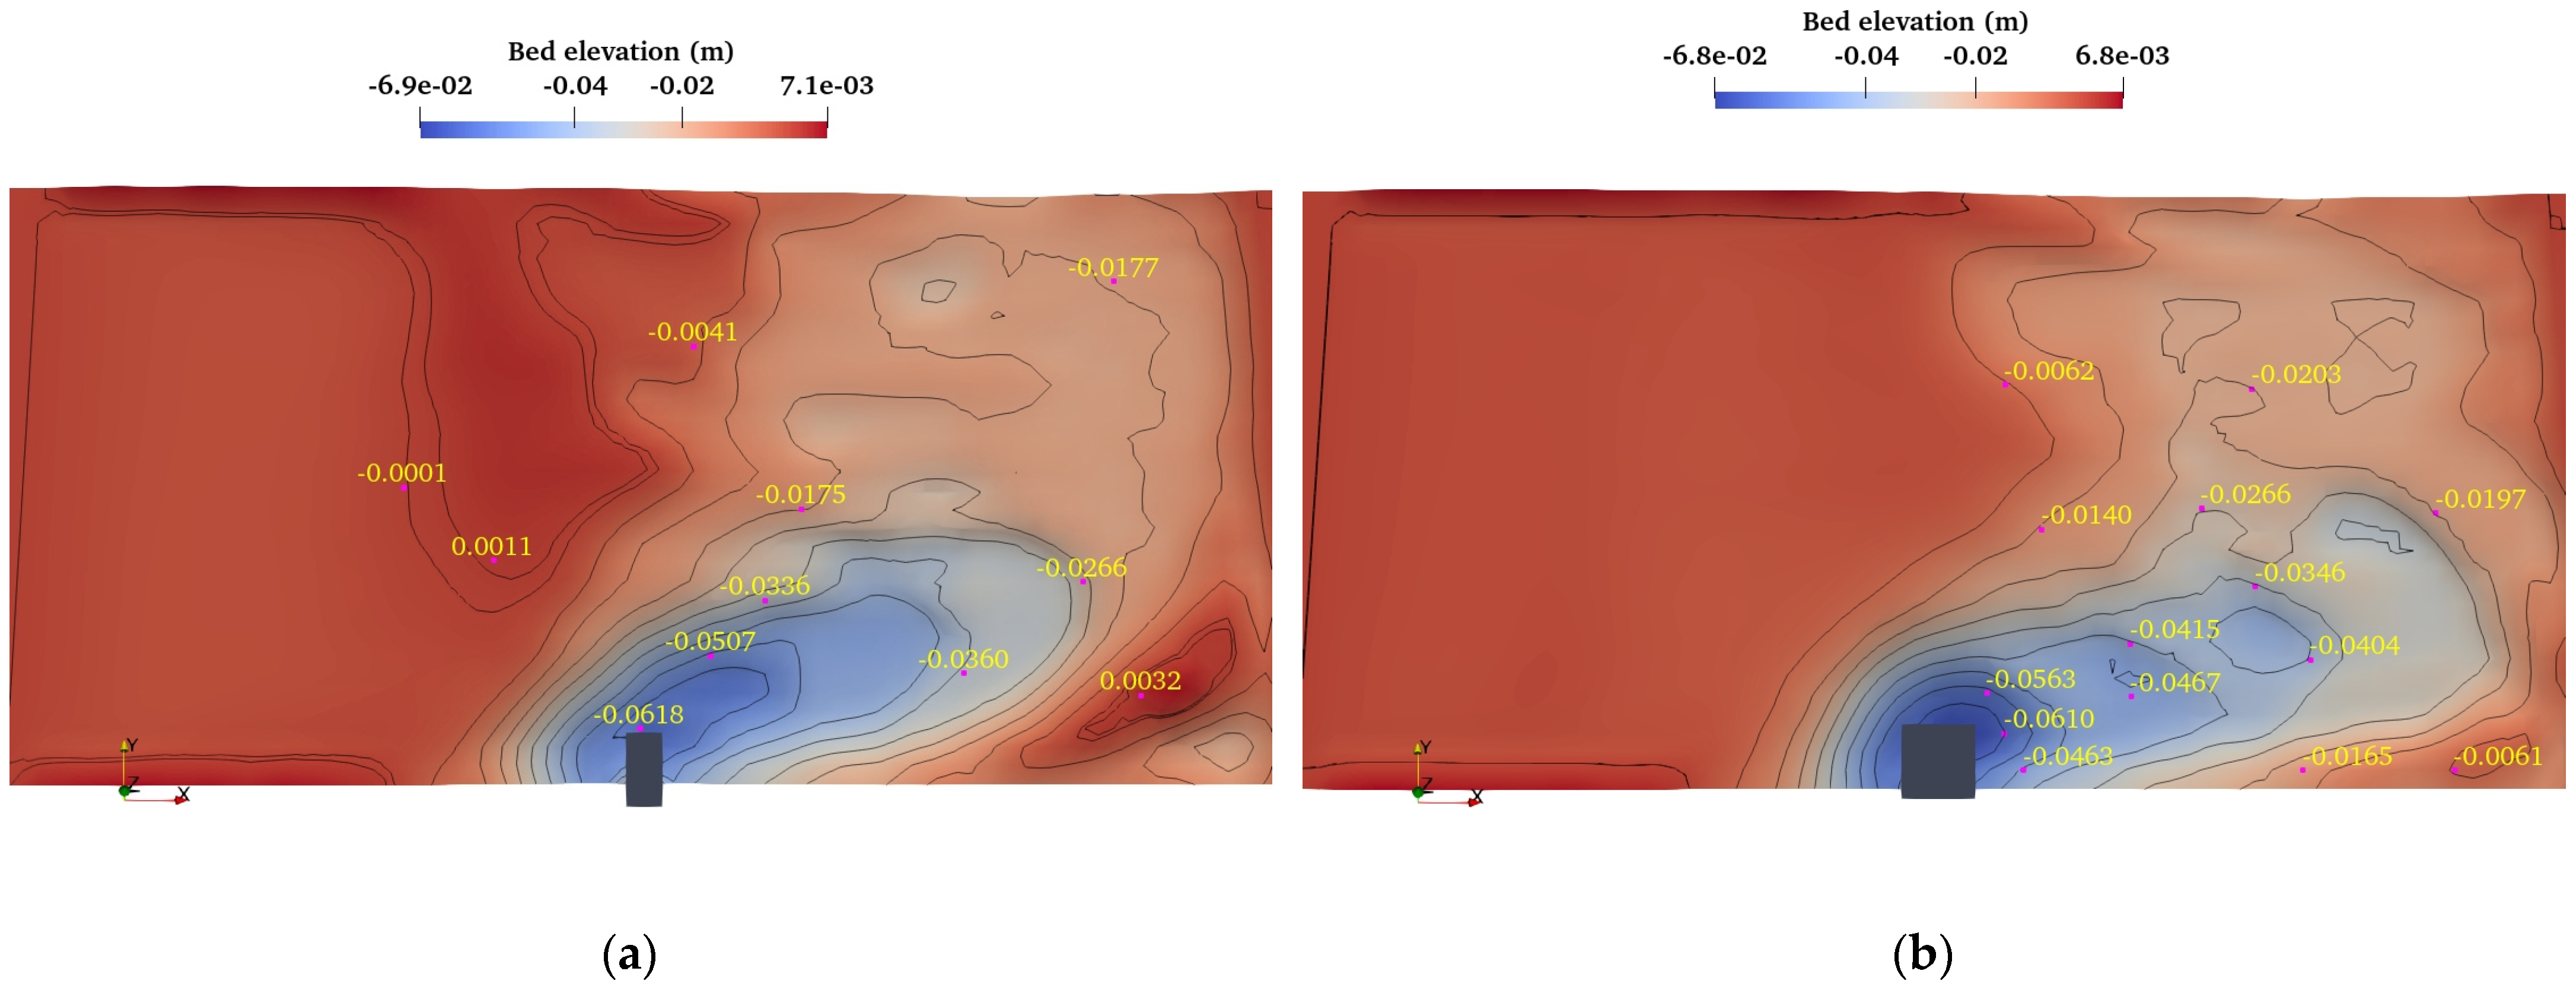
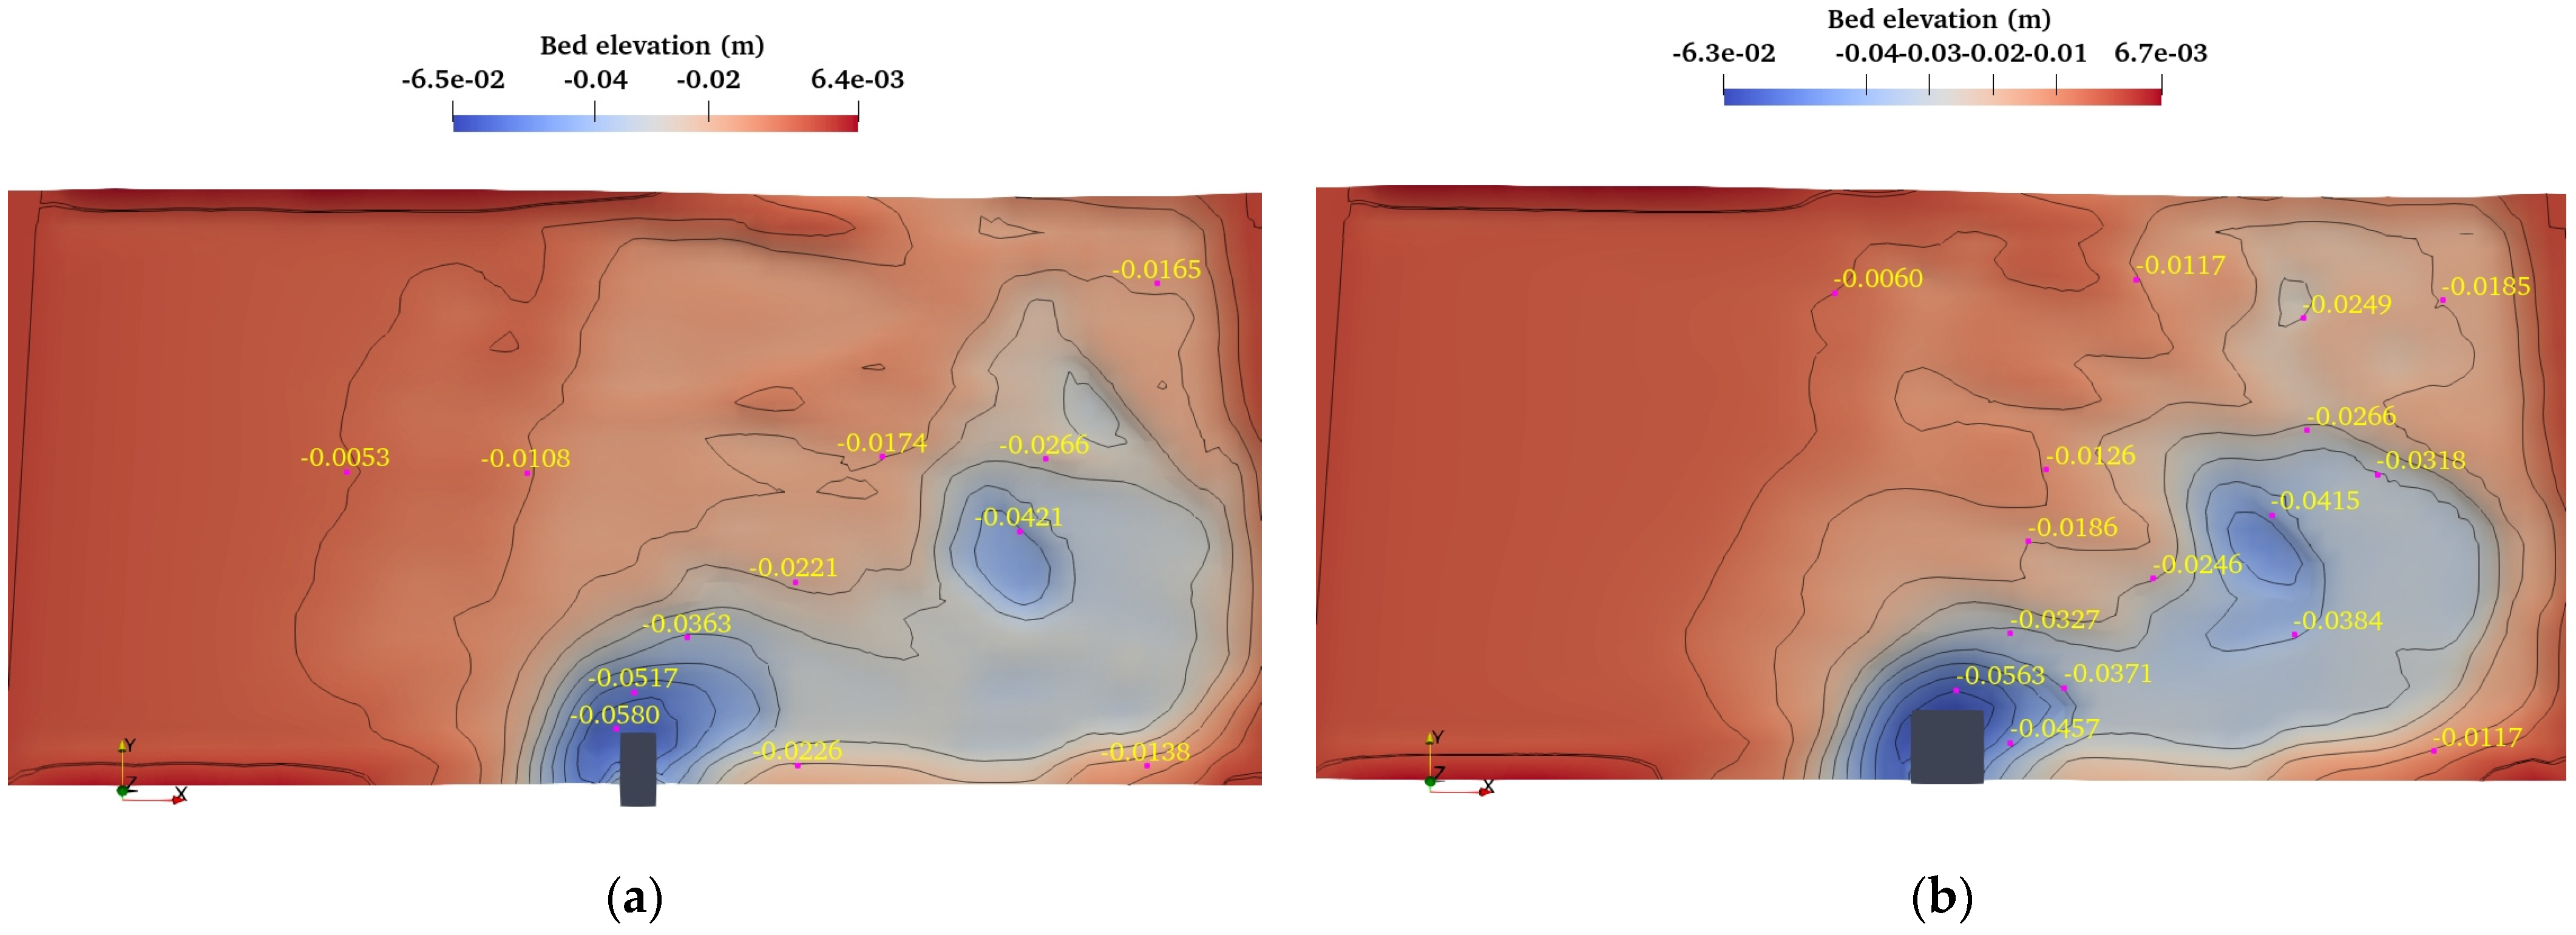
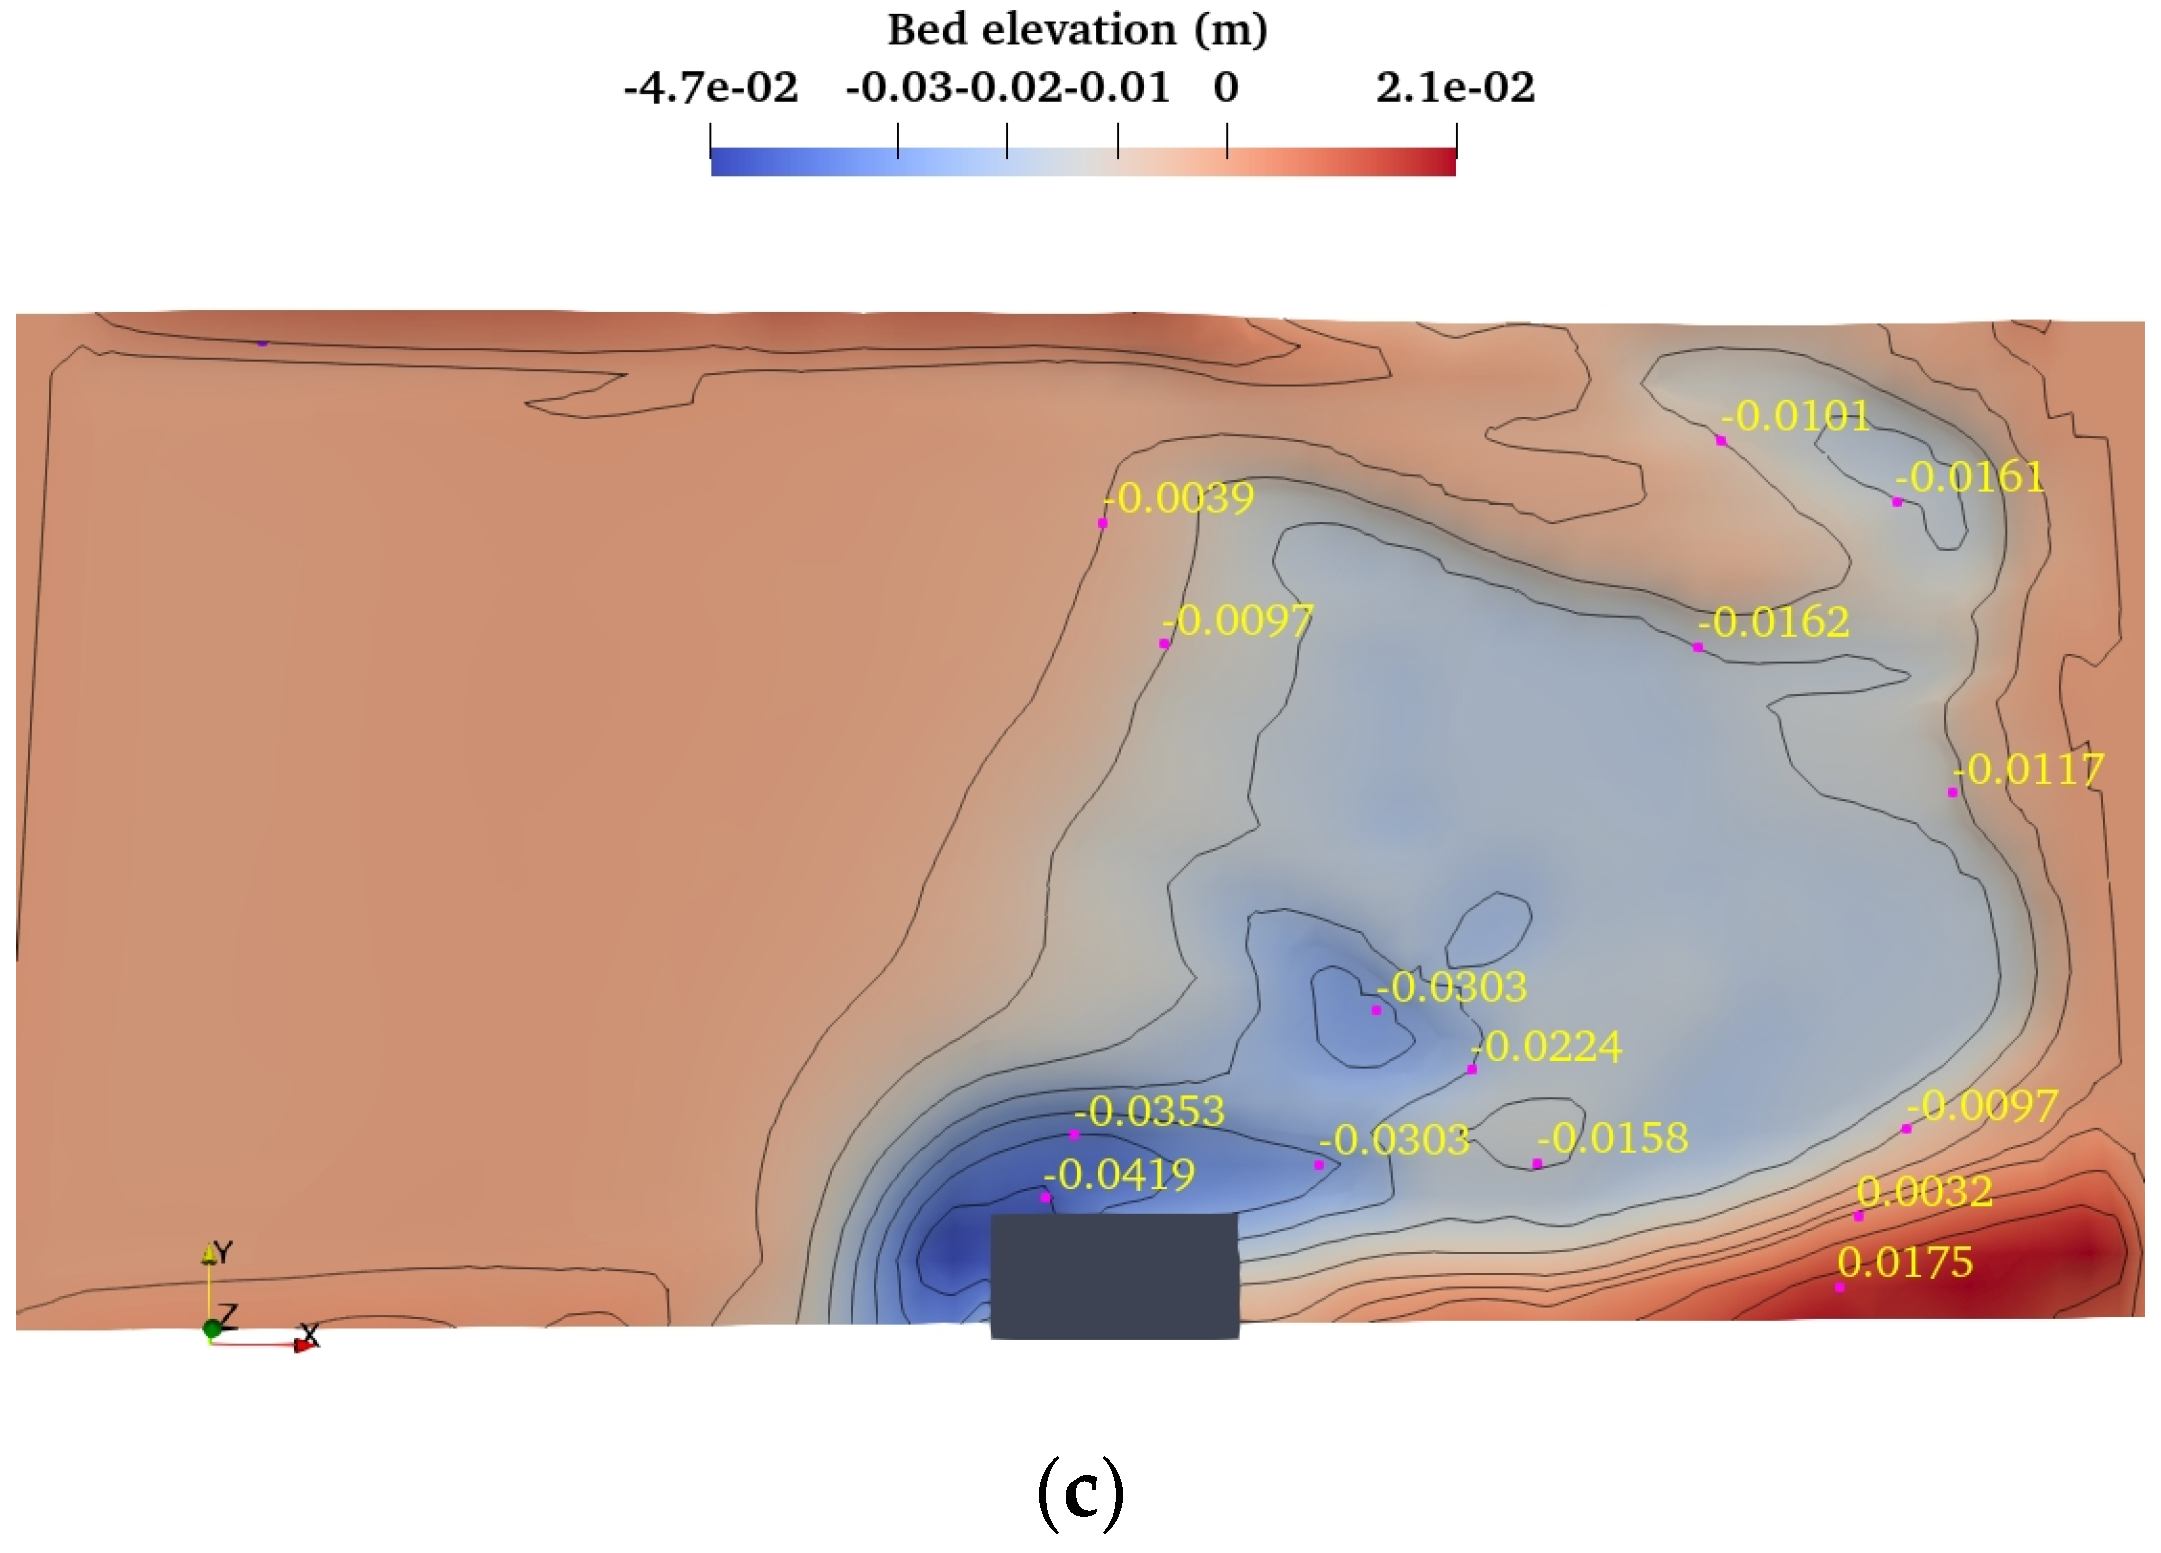
Figure 6 represents the bed topography contour of scour around the vertical wall abutment with varying aspect ratios under combined waves with strong current (
Ucw = 0.821). The areas shaded in blue (displaying negative values) correspond to sediment erosion, whereas the regions highlighted in red (reflecting positive values) indicate sediment deposition. The formation of a strong HSV upstream leads to formation of scour hole on the upstream side of abutments, while downstream of the abutments, sediment is deposited. The deepest visible contour lines, corresponding to varying aspect ratios of 0.5, 1, and 2, exhibit values of −0.0653 m, −0.0610 m, and −0.0519 m, respectively. The maximum scour (shown in
Figure 6a) occurs around the front edge of the abutment with an aspect ratio of 0.5. On the other hand, the least amount of scour (depicted in
Figure 6c) occurs for an aspect ratio of 2. The increase in abutment width decreases the scour for a fixed value of abutment length in combined effect of waves and current (
Ucw = 0.821). The abutment length with a sharp edge at the upstream can generate more turbulence, increasing the sediment transport rate downstream of the abutment. This process leads to the development of more pronounced and distinct ripples on the sediment bed (
Figure 6a). Furthermore, it is also noticeable that the eroded sediment is deposited downstream of the abutment due to the shading effect developed by the abutment.
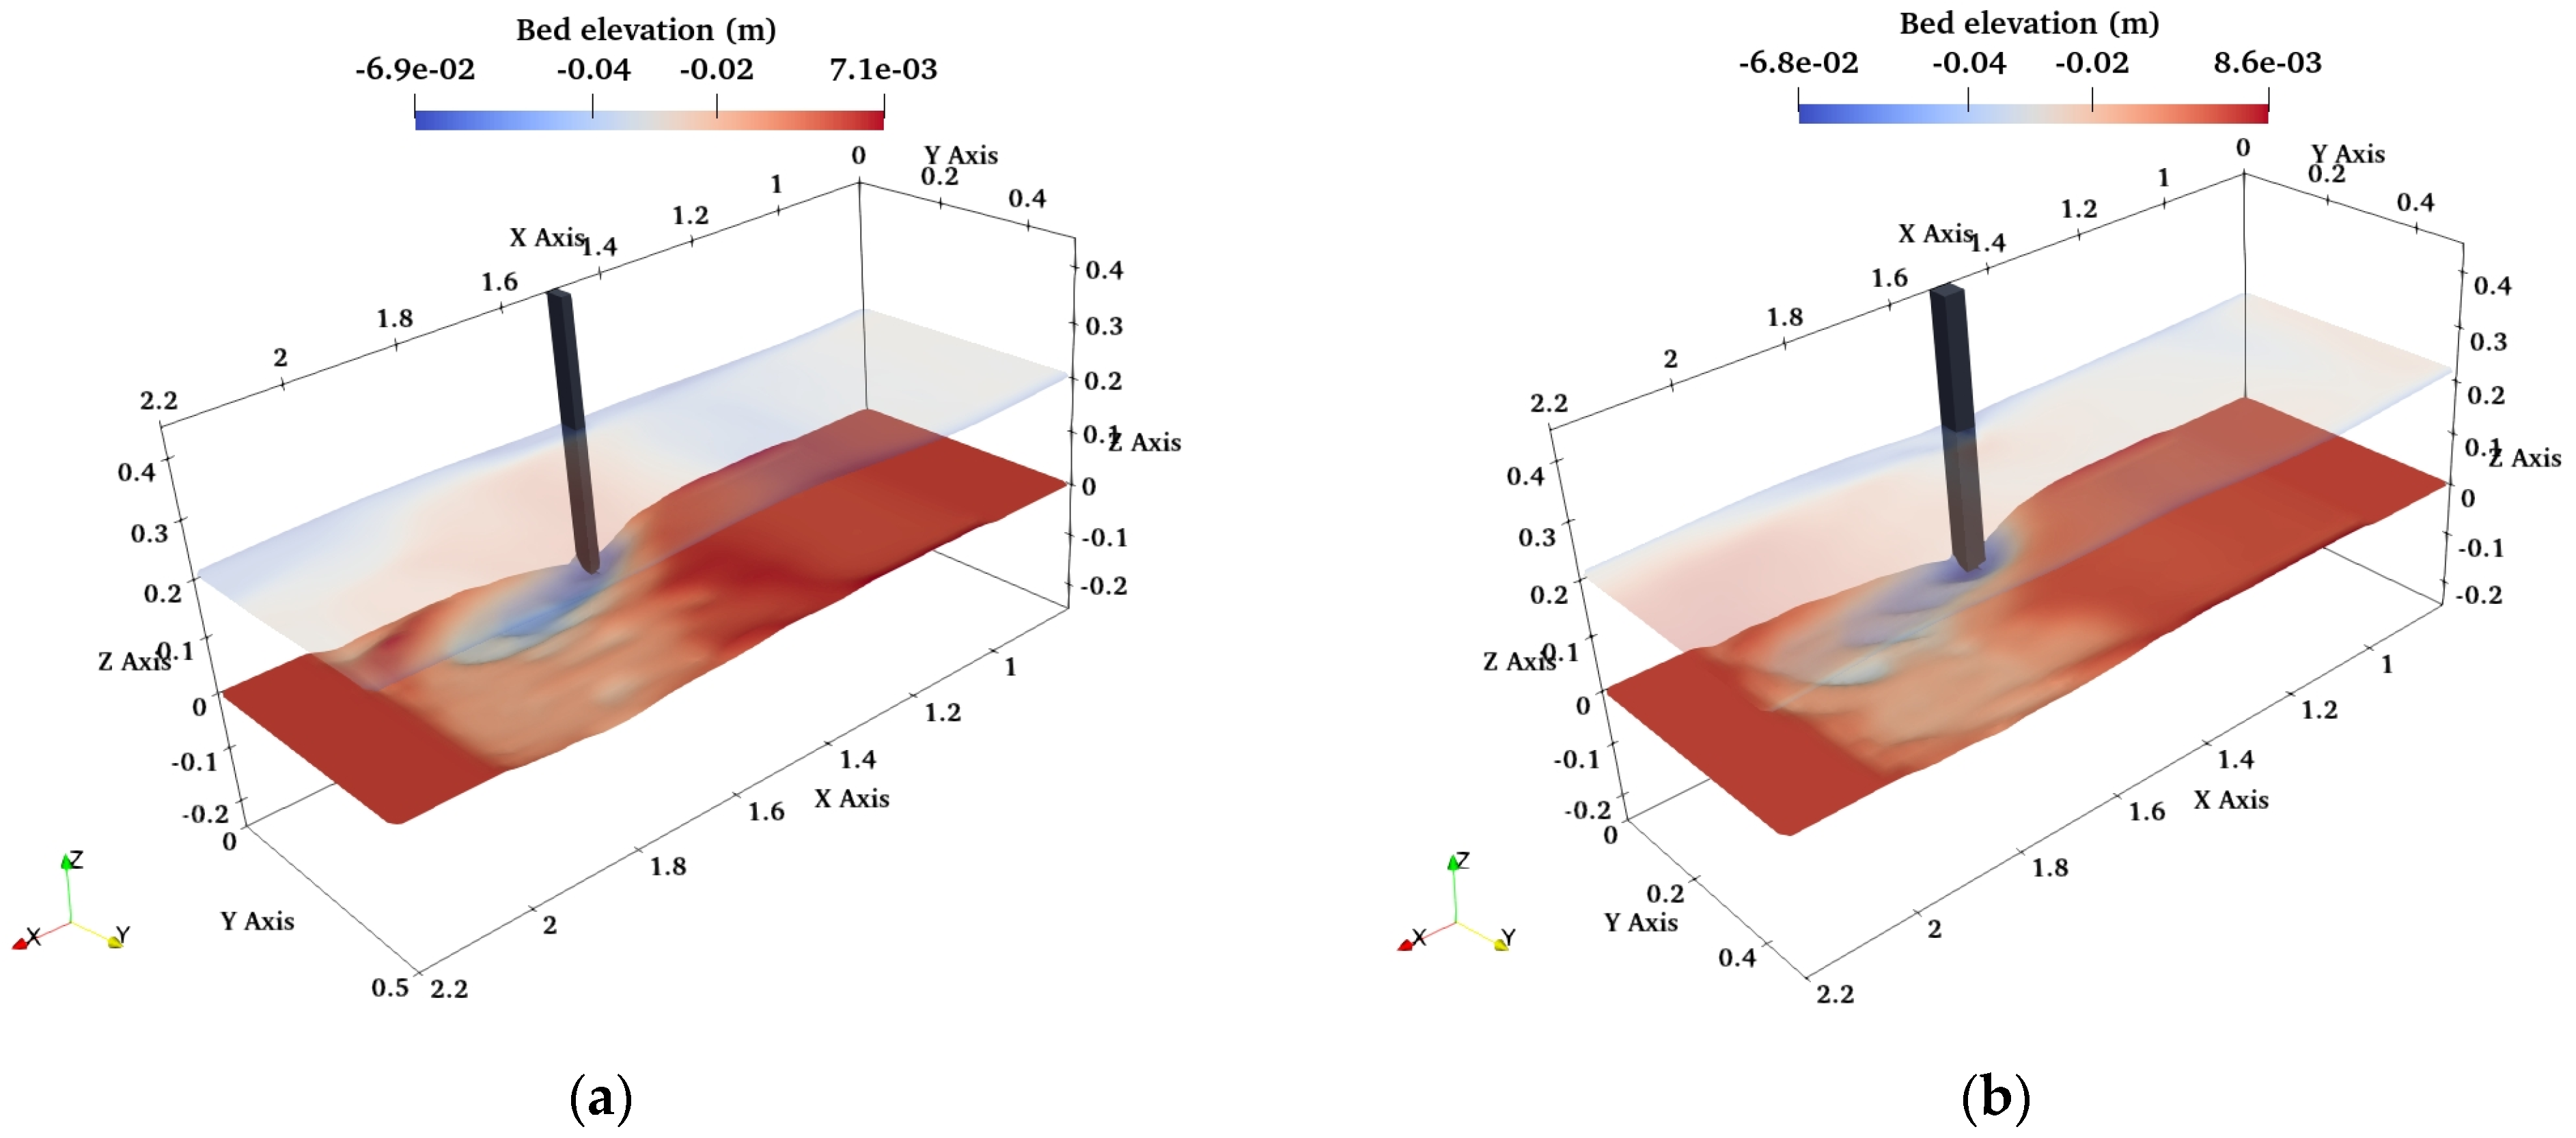
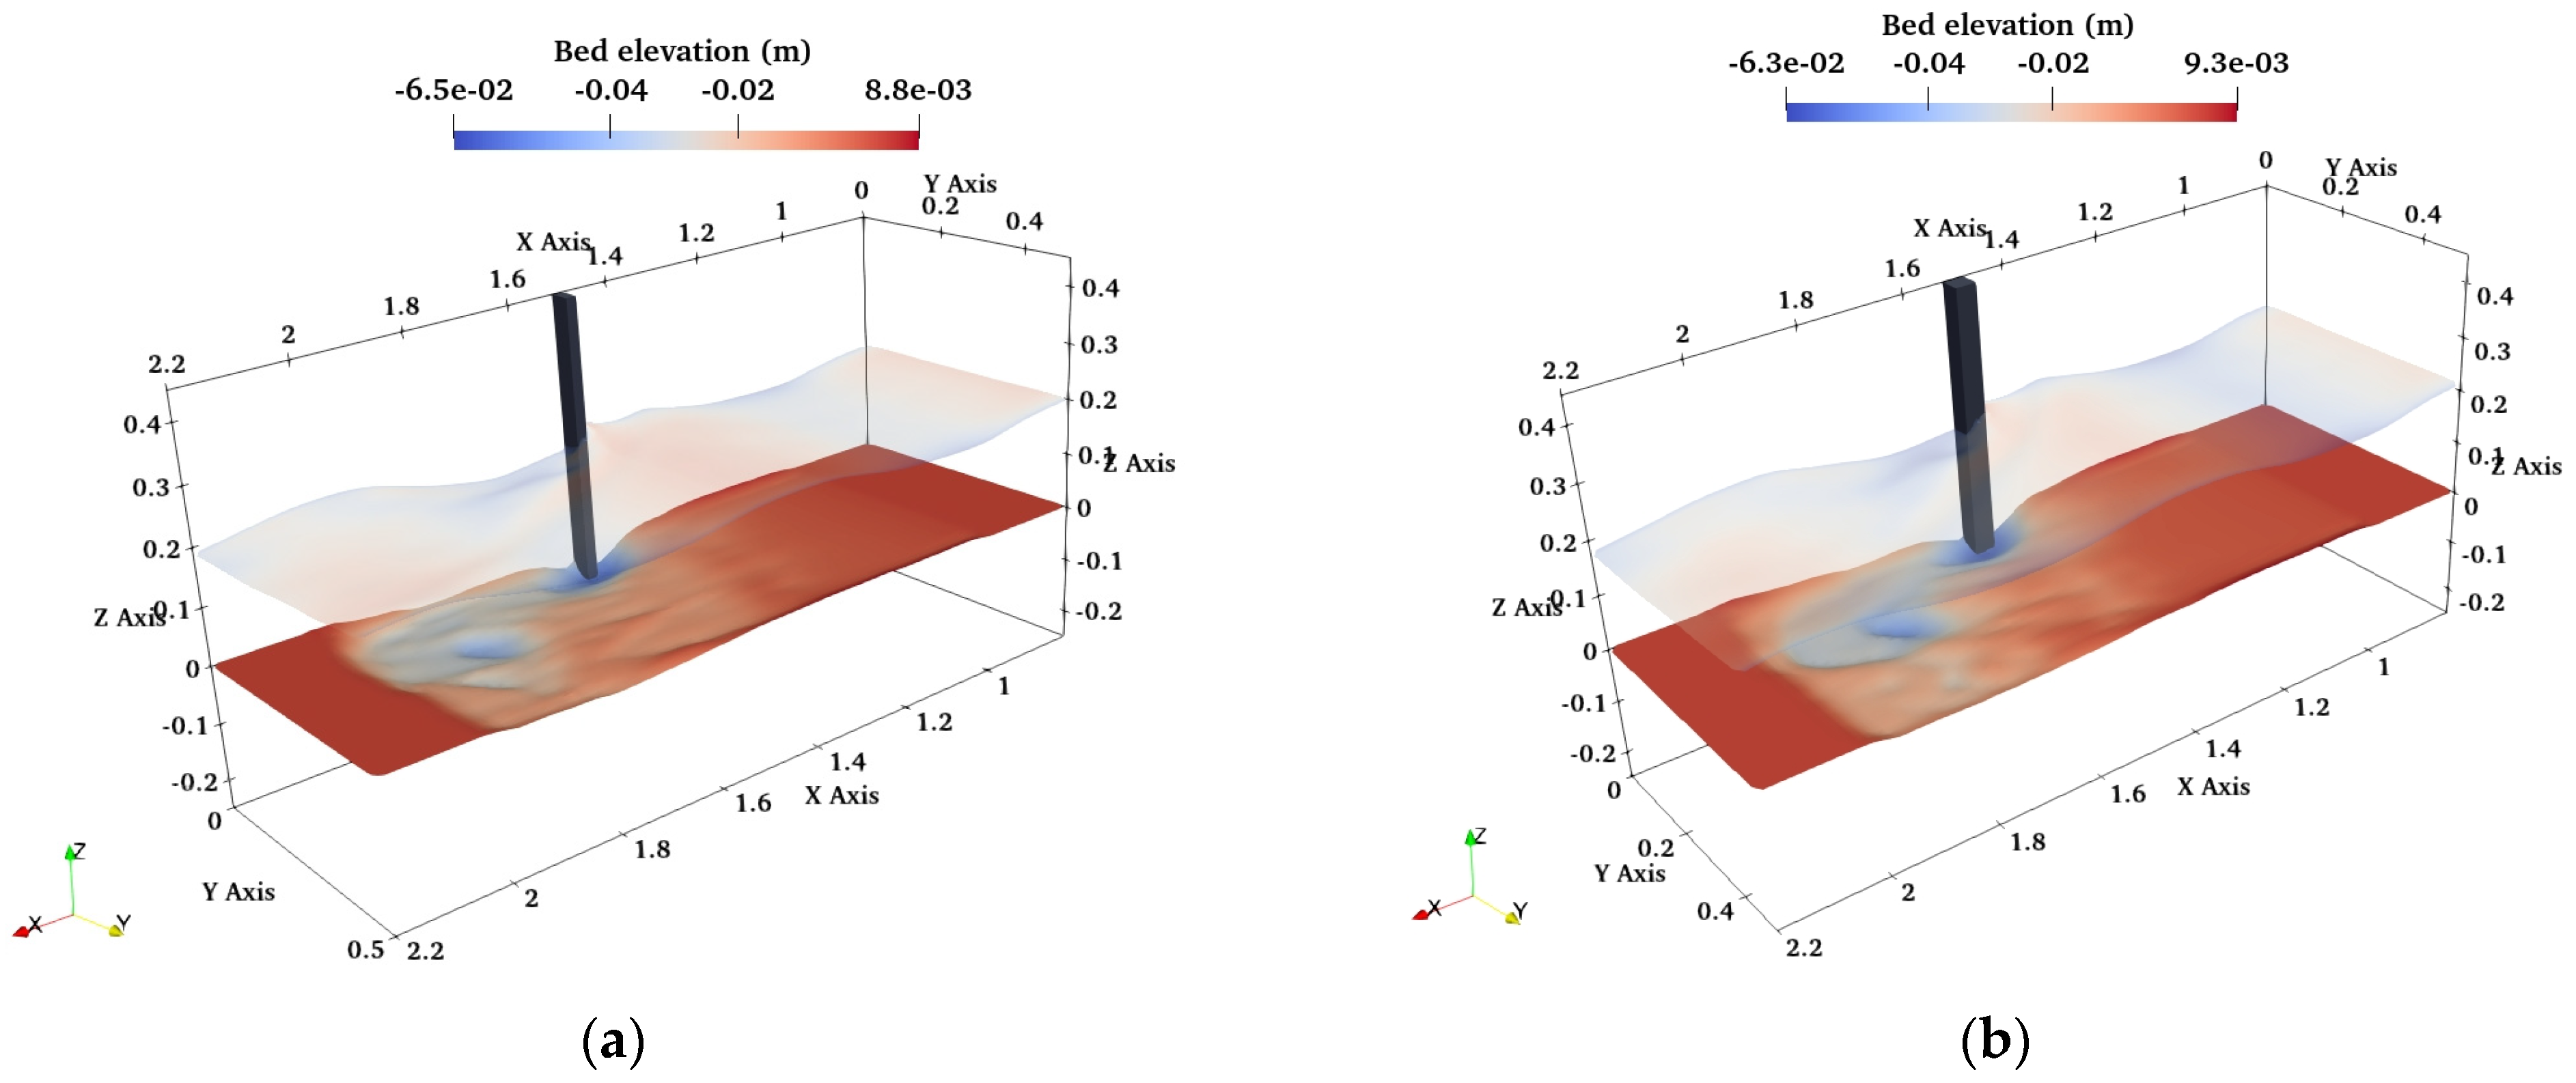
Figure 7 illustrates the 3D visualization of the free surface and sediment bed around vertical wall abutment with various aspect ratios under combined influence of wave–current flows (
Ucw = 0.821). The utilization of the Level Set Method (LSM) in the present numerical model enhances the accurate tracking of free surface and sediment bed. The maximum scour hole can be observed for vertical wall abutment with an aspect ratio of 0.5 (
Figure 7a). However, the minimum scour hole can be observed for vertical wall abutment with an aspect ratio of 2 (
Figure 7c). The extent of scour hole becomes narrower as the abutment width increases (
Figure 7a–c). The sharp edge in the vertical wall abutment, with an aspect ratio of 0.5, generates more turbulence in the flow, resulting in larger, and wider scour hole formation.
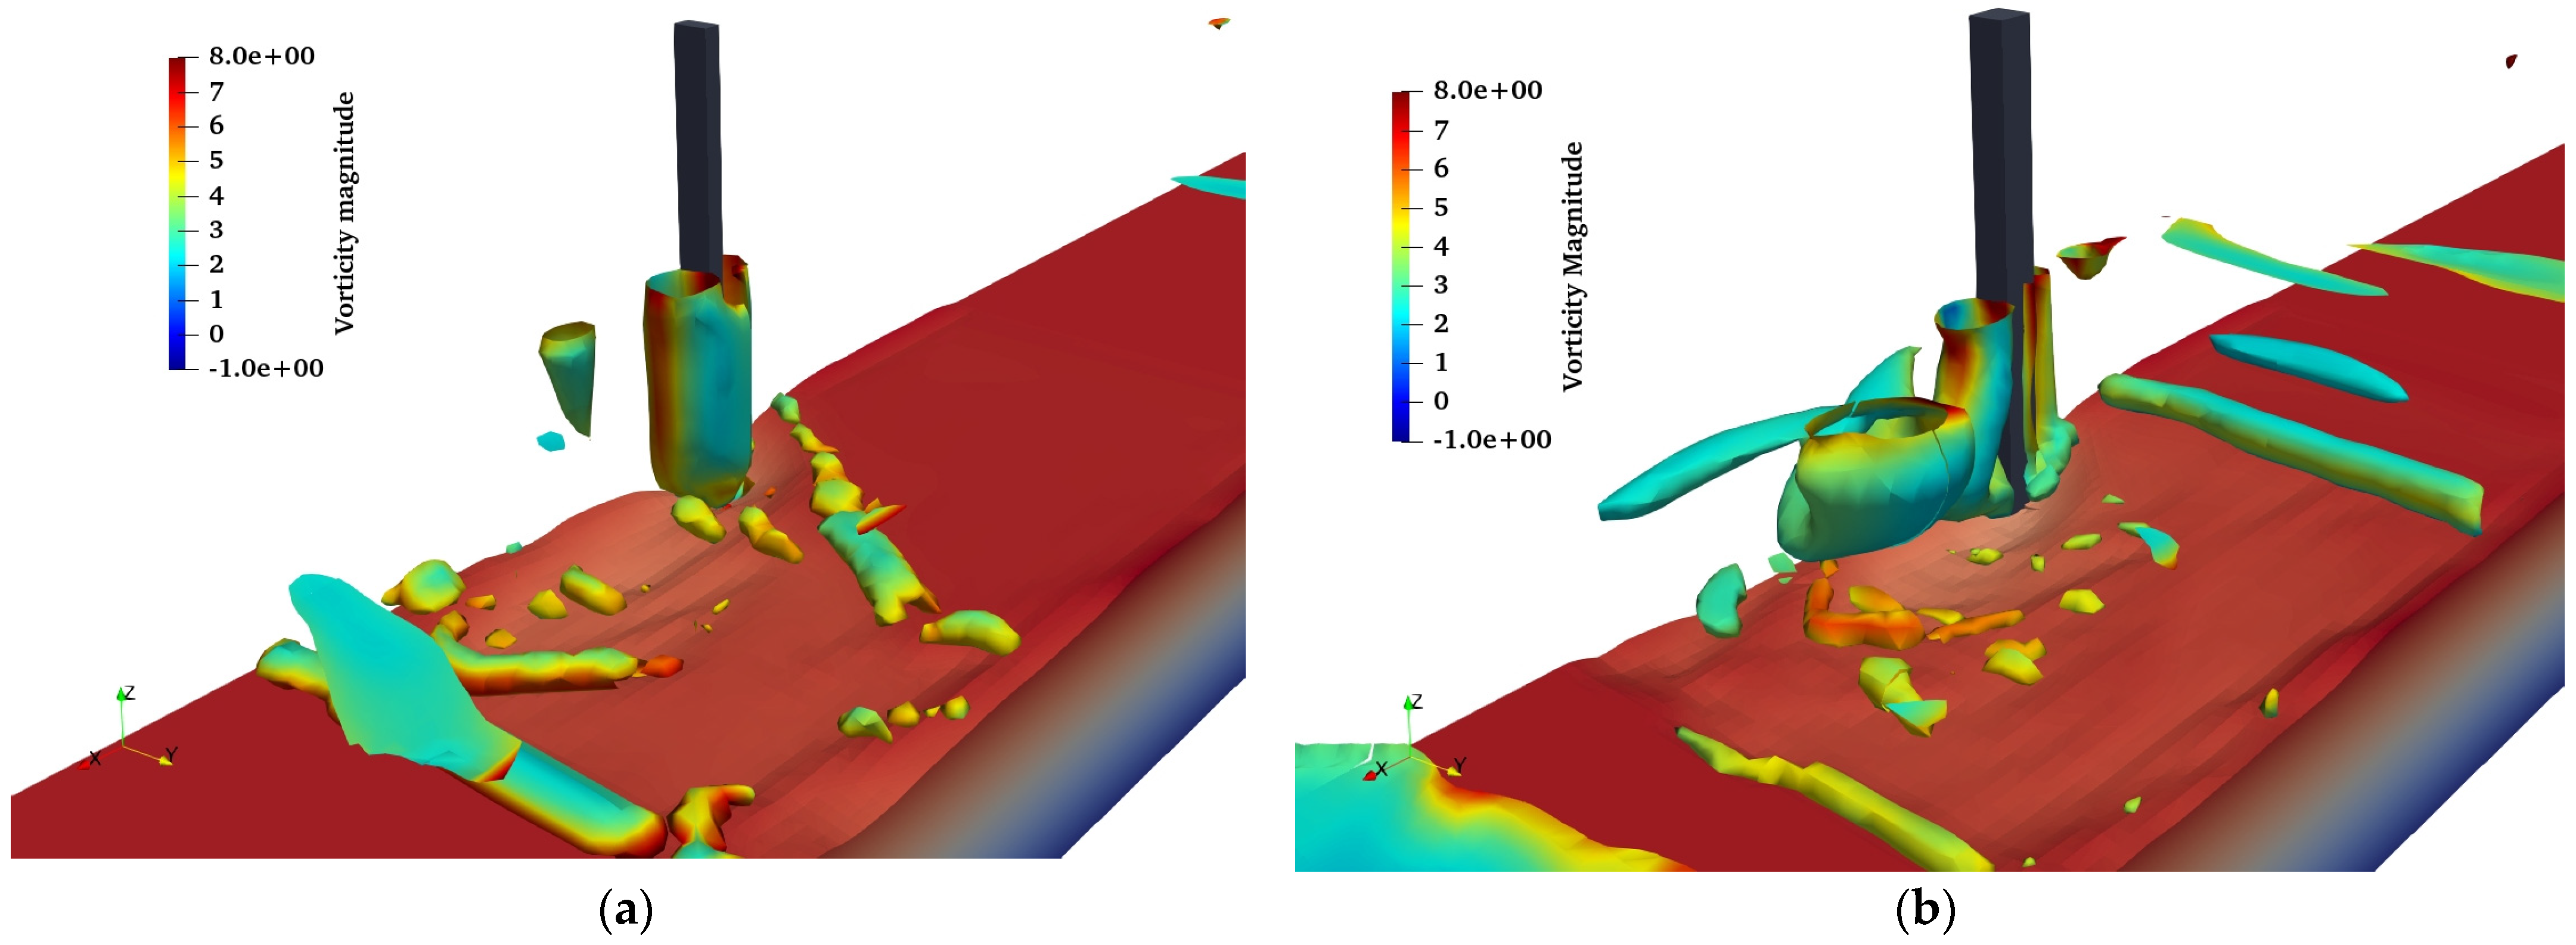
Figure 8 represents the vortical flow structures for different aspect ratios of vertical wall abutments under combined effect of waves and current (
Ucw = 0.821). The flow separation from the tip of the abutment leads to the development of small, tube-like vortices. These vortices become larger as they move downstream and weaken as they distance themselves from their starting point, eventually reattaching to the vertical wall. The strong vortices near the front edge of the obstruction are a result of the separated shear layer of the flow that starts from the upstream nose of the abutment. The separated shear layer causes strong friction forces on the bed due to the high vertical vorticity, contributing to the development of local scour. The stronger vortices can be noted around the abutment with an aspect ratio of 0.5 (
Figure 8a), leading to a deeper scour formation. On the other hand, vertical wall abutments with an aspect ratio of 2 (shown in
Figure 8c) exhibit milder and more scattered vortices, leading to the formation of smaller scour depth [
60].
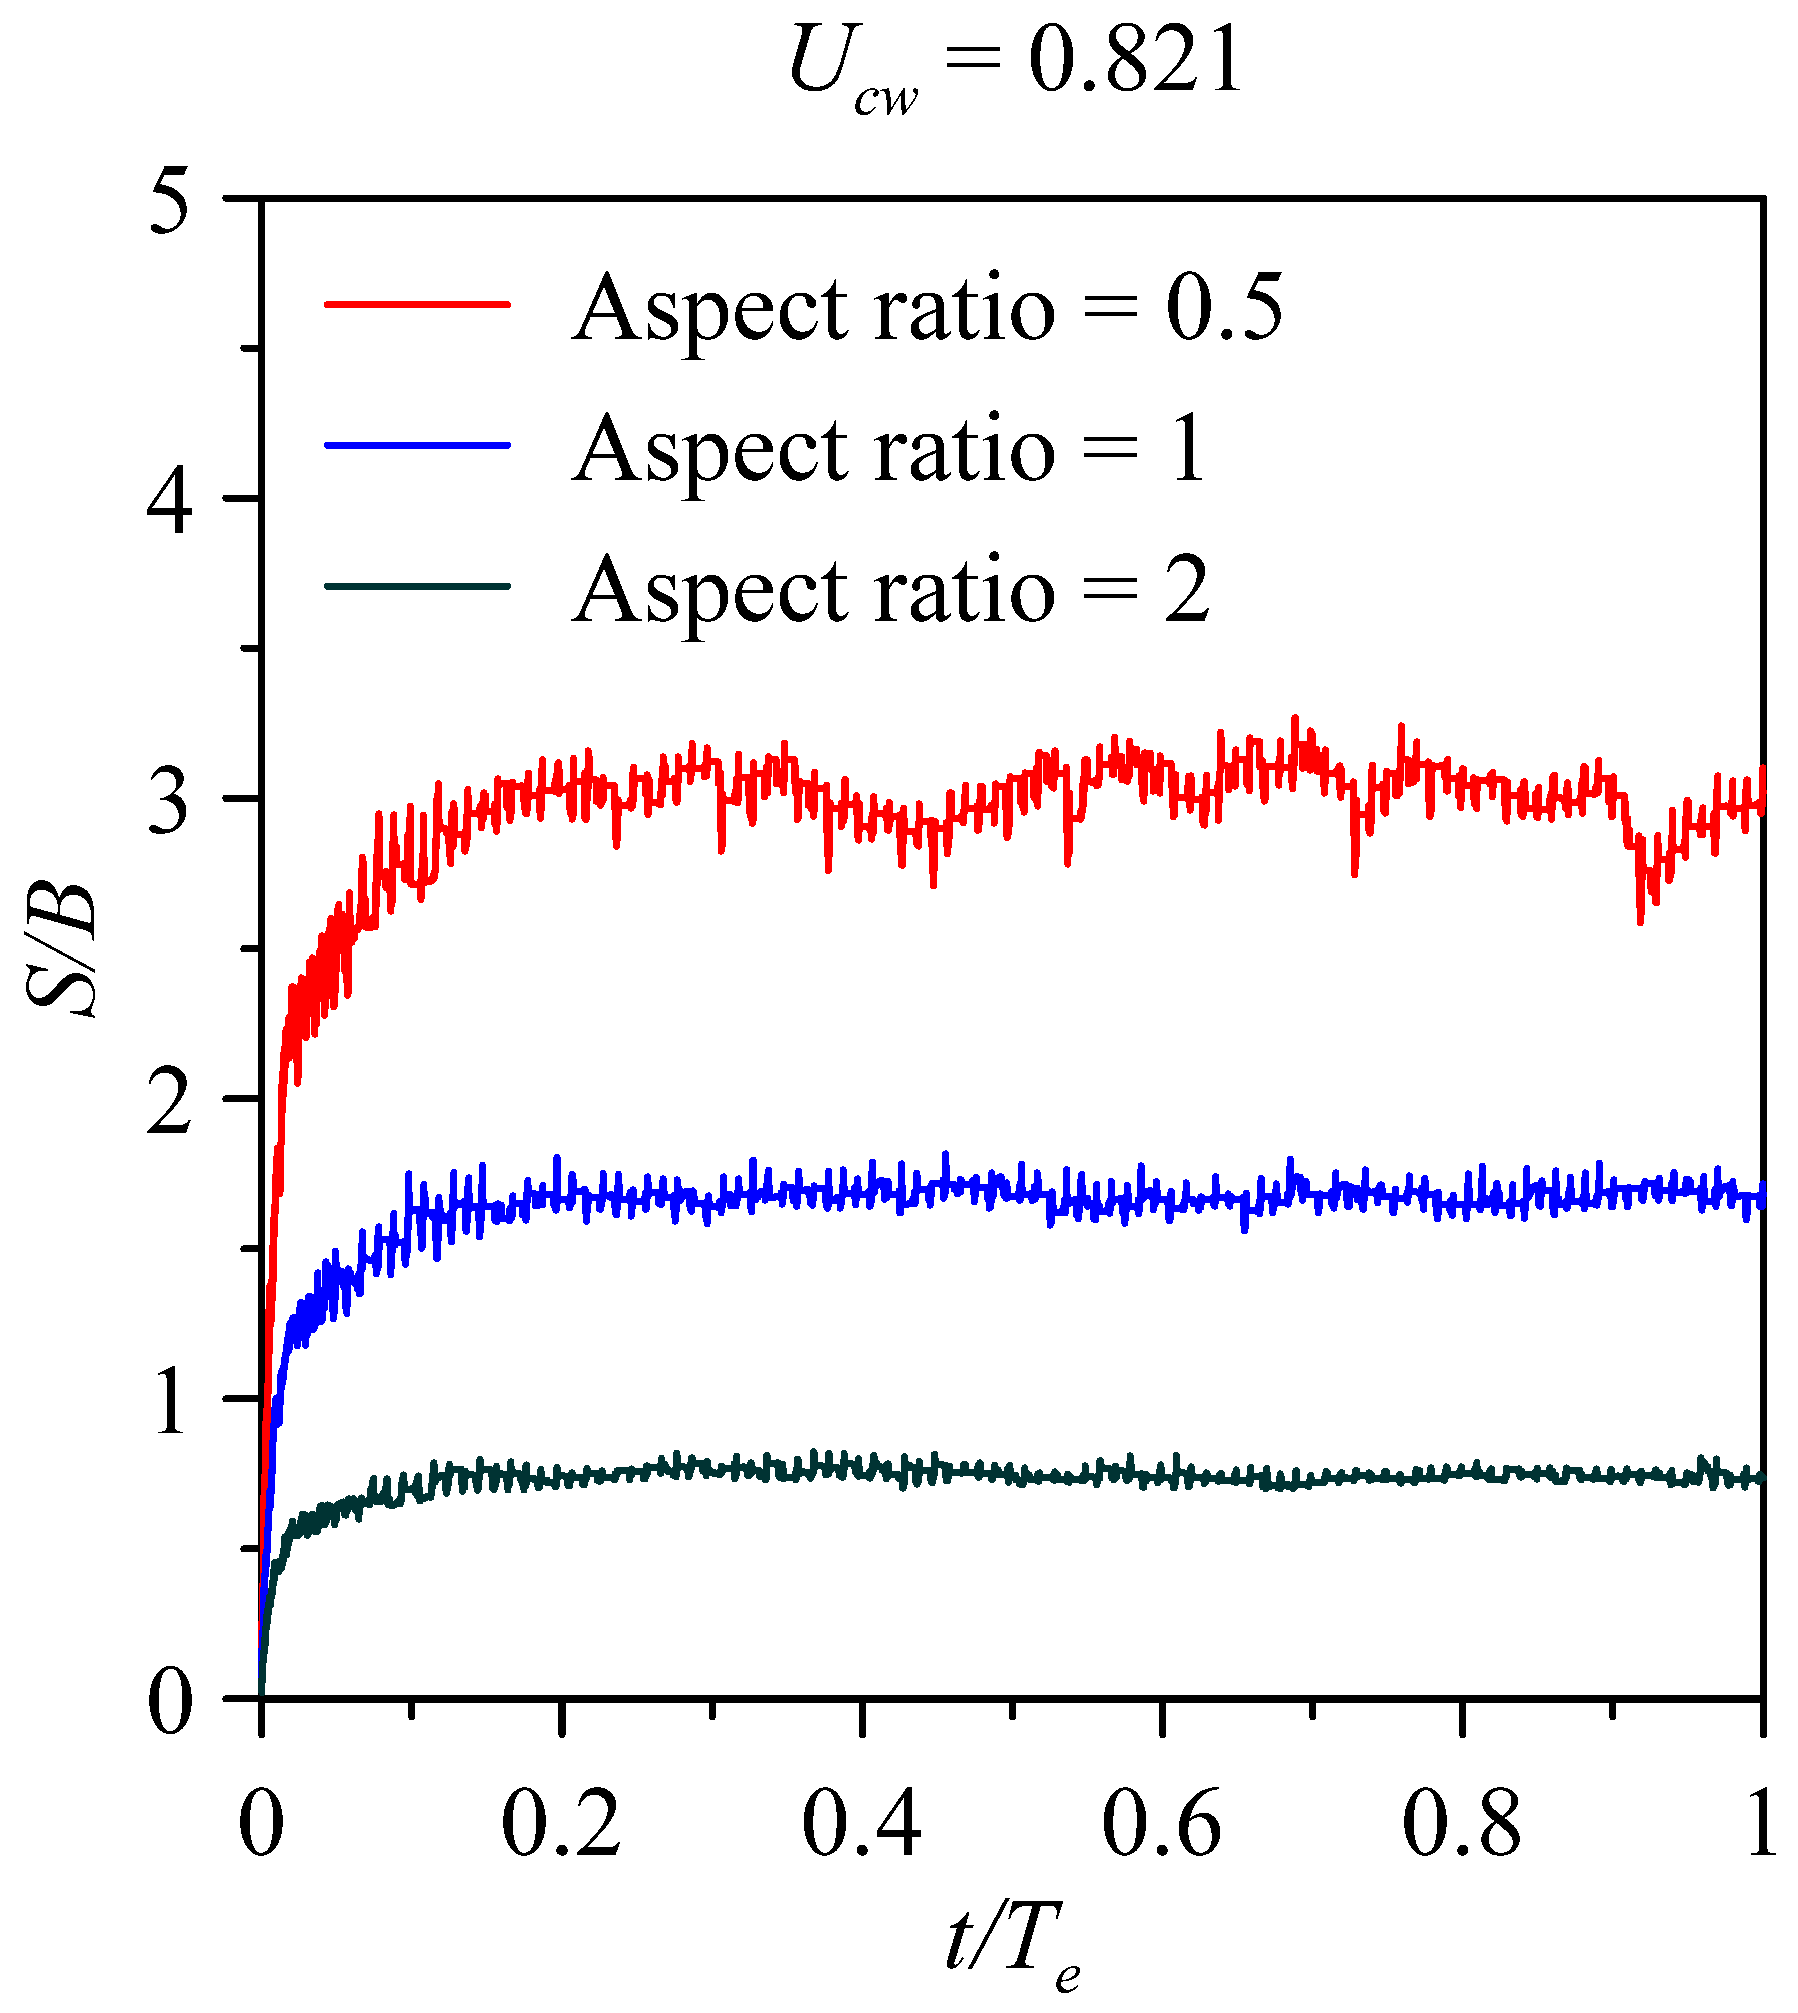
Figure 9 represents the time development of normalized scour depth (
S/
B) for
Ucw = 0.821. The equilibrium scour depth was achieved in all cases of the aspect ratios, with maximum normalized scour depth occurring at an aspect ratio of 0.5 and a value of 3.02. Increasing the aspect ratio resulted in rapid changes in
S/
B values. The normalized scour depth of 1.70 and 0.73 was observed for the aspect ratios of 1 and 2, respectively. The results suggest that an increase in aspect ratio decreases the equilibrium scour depth under a fixed
Ucw of 0.821, and the
KC number equals to 1.272.
3.2. Combined Waves and Current Induced Scour with Ucw = 0.938
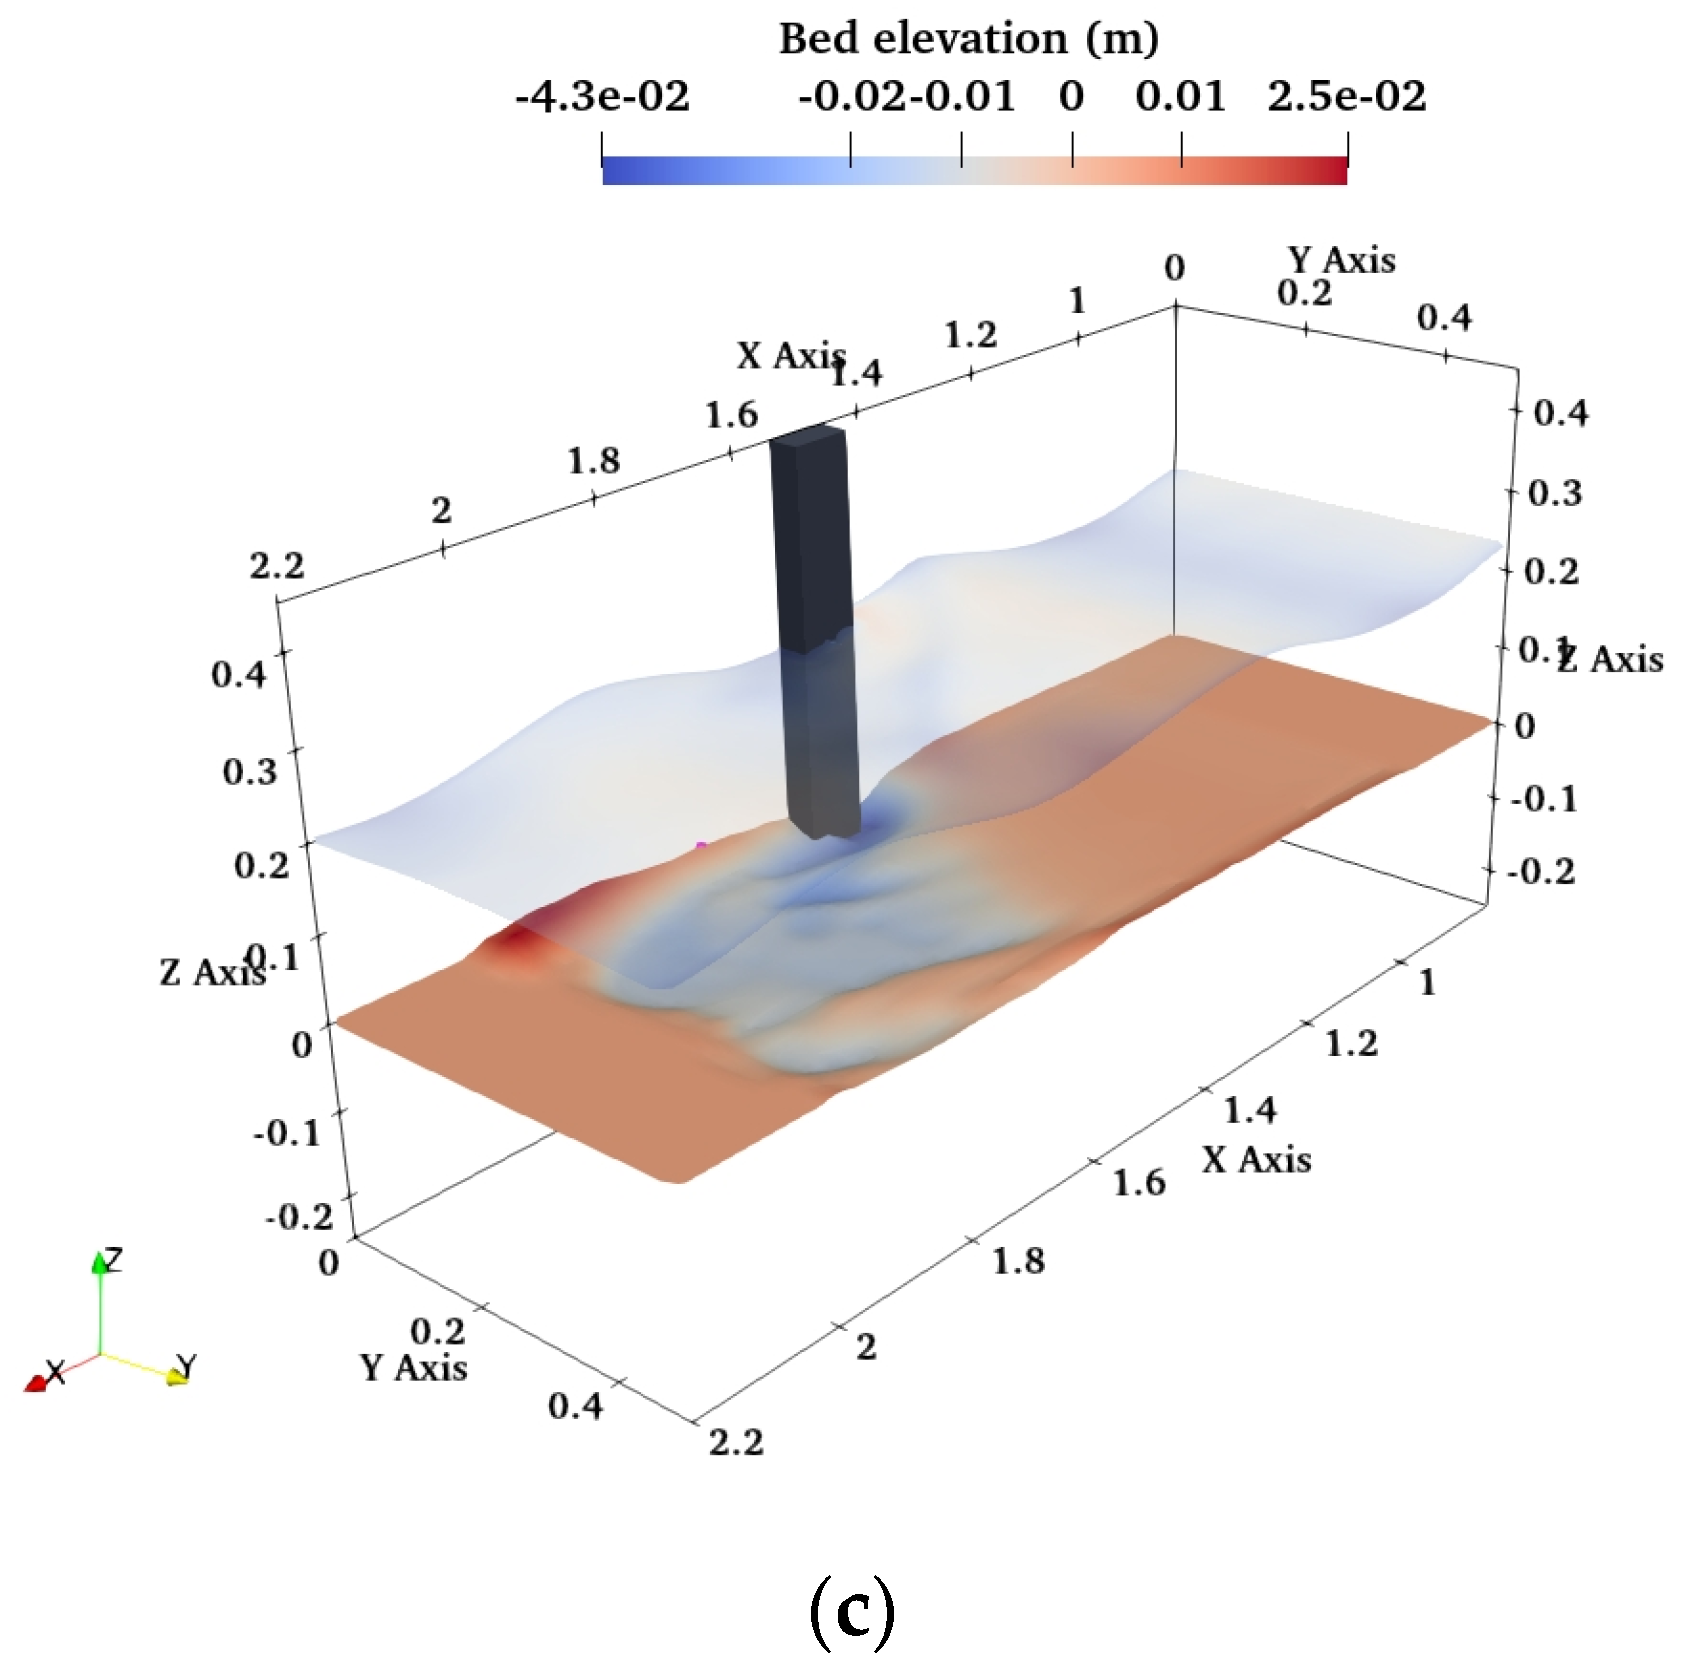
As discussed earlier, the interaction of waves and currents substantially affects the mechanism of abutment scour. The numerical simulations were carried out under combined effect of waves and currents, with wave parameters of wavelength of 0.388 m, wave height of 0.032 m, and wave period of 0.5 s. For all the numerical simulations, the flow velocity was fixed at 0.2387 m/s. Therefore, the Ucw and KC number were determined to be 0.938 and 0.198, respectively. The abutment length was kept constant at 0.04 m, while the abutment width was systematically varied: 0.02 m, 0.04 m, and 0.08 m, in order to achieve aspect ratios (B/L) of 0.5, 1, and 2, respectively. In the present combined wave–current condition, the wave parameters, ak and H/L, are 0.258 and 0.082, respectively. The Shields parameter (θ) was calculated to be 0.086, which is greater than the critical Shields parameter (θcr) value of 0.045, indicating the live bed scour regime.
Figure 10 represents the bed topography contour of scour around the vertical wall abutment with varying aspect ratios under combined waves with strong current (
Ucw = 0.938). The areas shaded in blue (displaying negative values) correspond to sediment erosion, whereas the regions highlighted in red (reflecting positive values) indicate sediment deposition. The formation of a strong HSV upstream leads to formation of scour hole upstream side of abutments, while in downstream, the sediment is deposited. The deepest visible contour lines, corresponding to varying aspect ratios of 0.5, 1, and 2, exhibit values of −0.0653 m, −0.0610 m, and −0.0519 m, respectively. The maximum scour (shown in
Figure 10a) occurs around the front edge of the abutment with an aspect ratio of 0.5. On the other hand, the least amount of scour (depicted in
Figure 10c) occurs for an aspect ratio of 2. The increase in abutment width decreases the scour for a fixed value of abutment length in combined wave–current flow (
Ucw = 0.938). The findings suggest that when the abutment has a sharp edge and a longer length and shorter width, it tends to create greater turbulence in the flow. This increased turbulence, in turn, leads to a higher rate of sediment transport downstream of the abutment. In simpler terms, the combination of a sharp-edged, longer abutment disrupts the flow more, causing more sediment to be carried downstream. This process leads to the development of deeper and more distinct ripples on the sediment bed (
Figure 10a). Furthermore, it is also noticeable that the eroded sediment is deposited downstream of the abutment due to the shading effect developed by the abutment.
Figure 11 illustrates the 3D visualization of the free surface and sediment bed around vertical wall abutment with various aspect ratios under combined influence of wave–current flows (
Ucw = 0.938). The utilization of the Level Set Method (LSM) in the present numerical model enhances the accurate tracking of free surface and sediment bed. The maximum scour hole can be observed for vertical wall abutment with an aspect ratio of 0.5 (shown in
Figure 11a). However, the minimum scour hole can be observed for vertical wall abutment with an aspect ratio of 2 (shown in
Figure 11c). The extent of scour hole becomes narrower as the abutment width increases (
Figure 11a–c). The sharp edge of abutment with an aspect ratio of 0.5 generates more turbulence in the flow, resulting in a larger and wider scour hole formation.
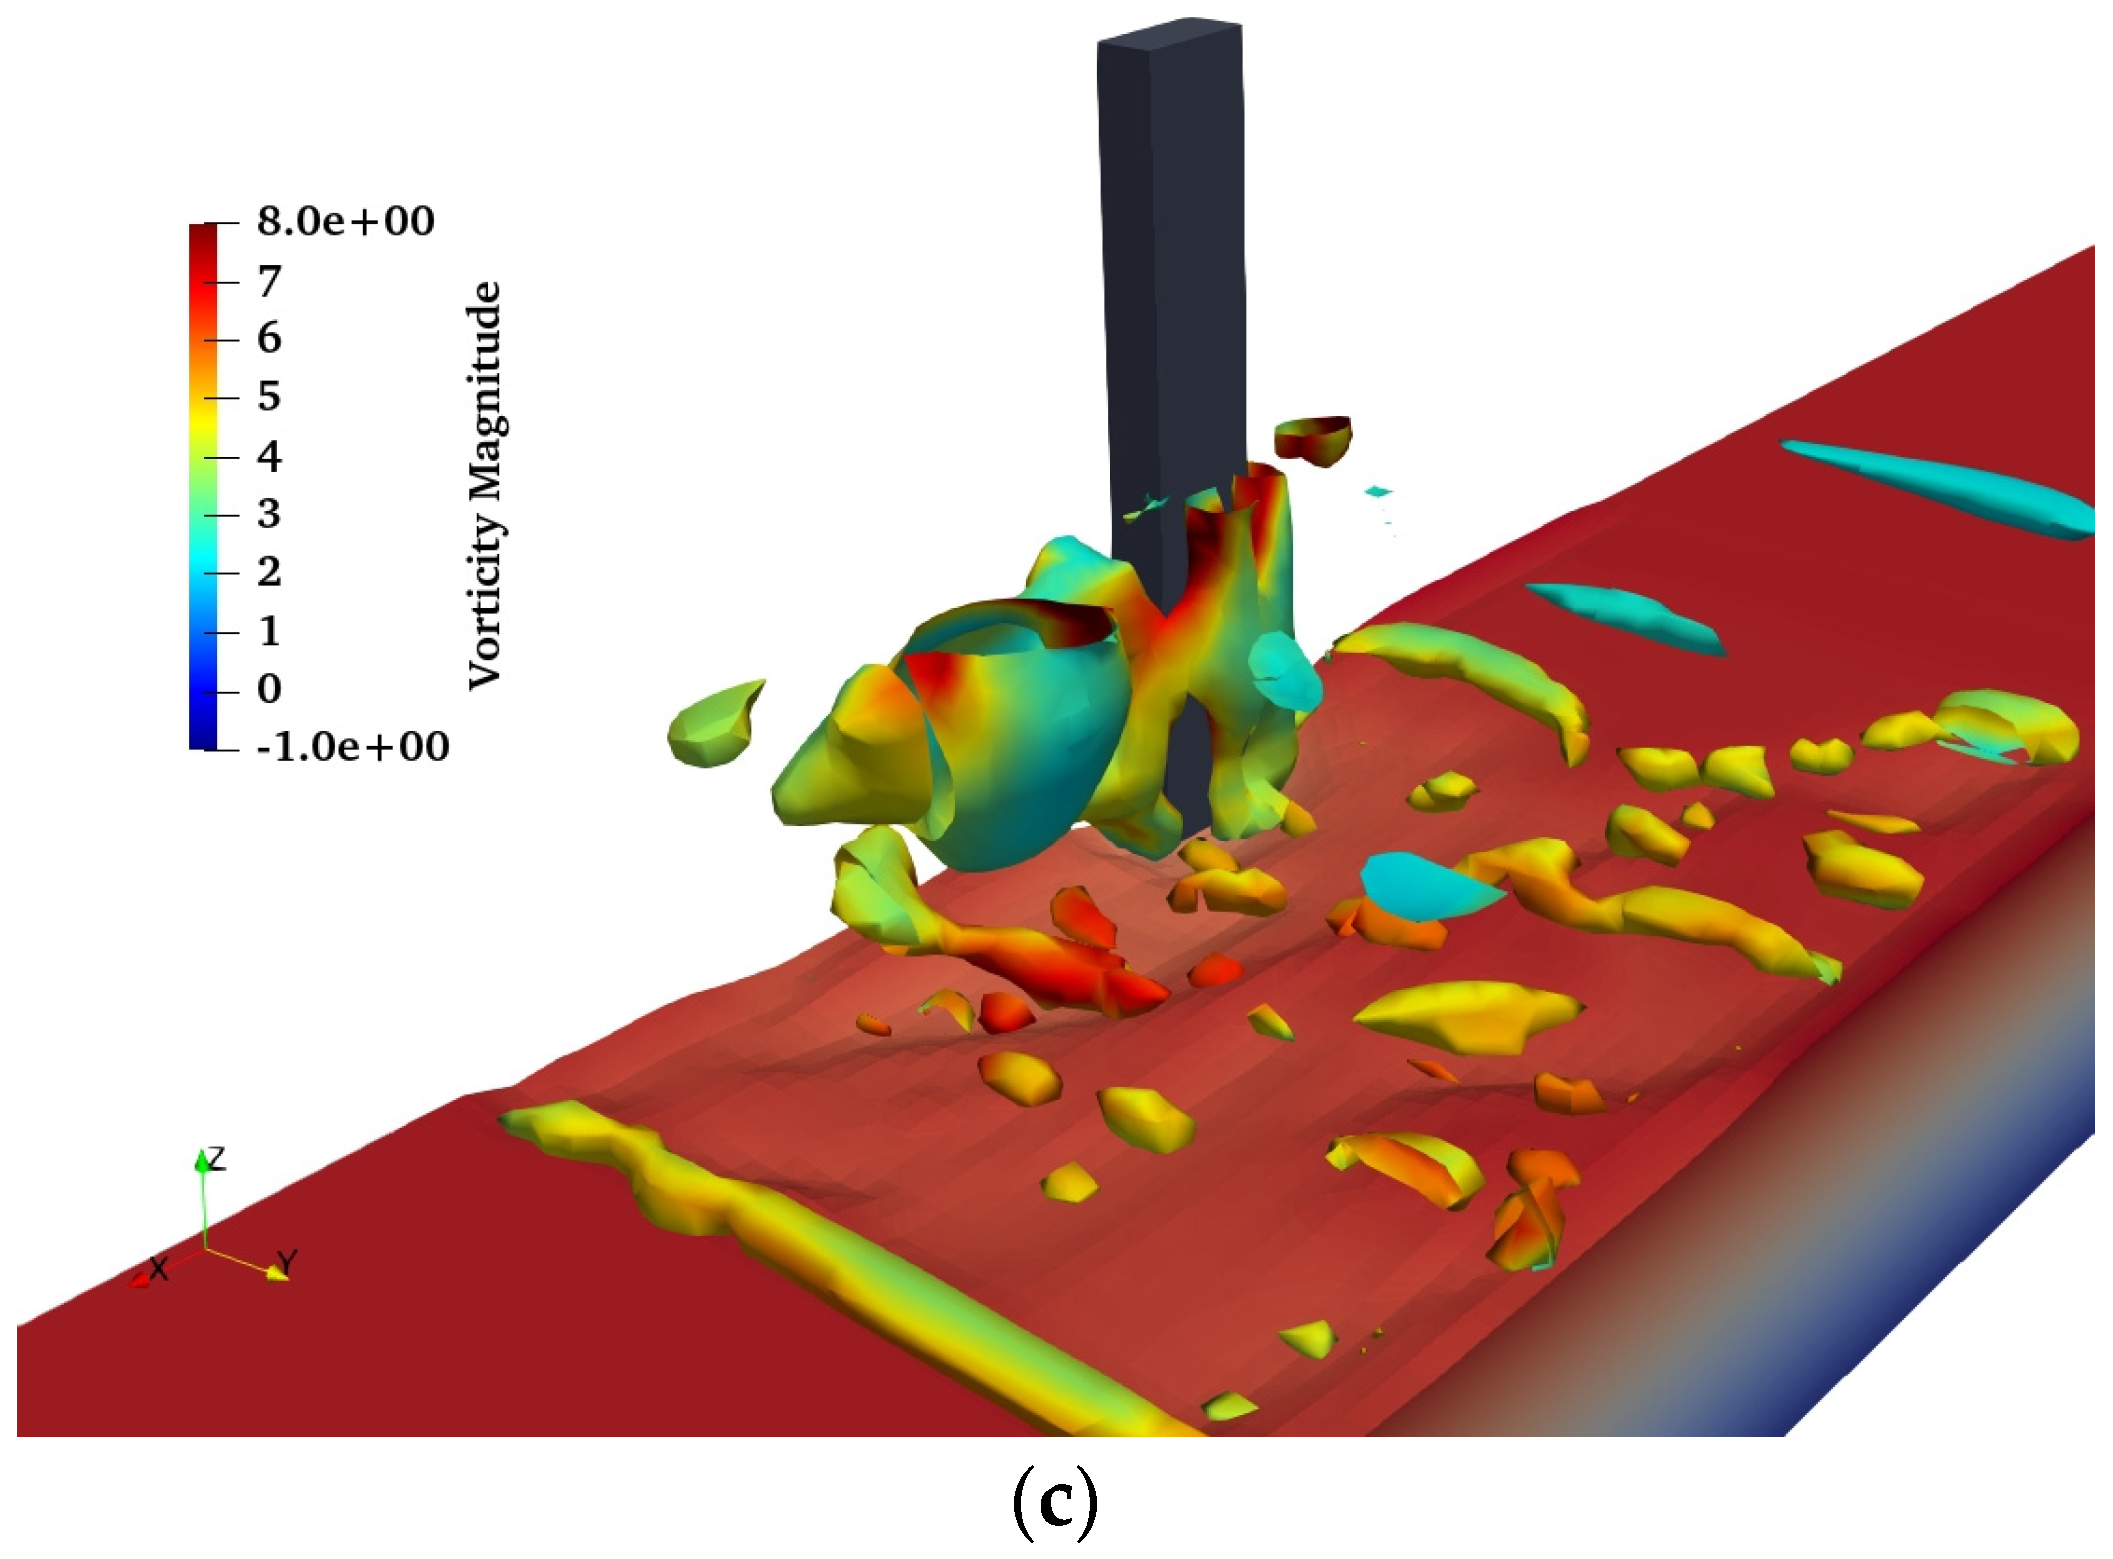
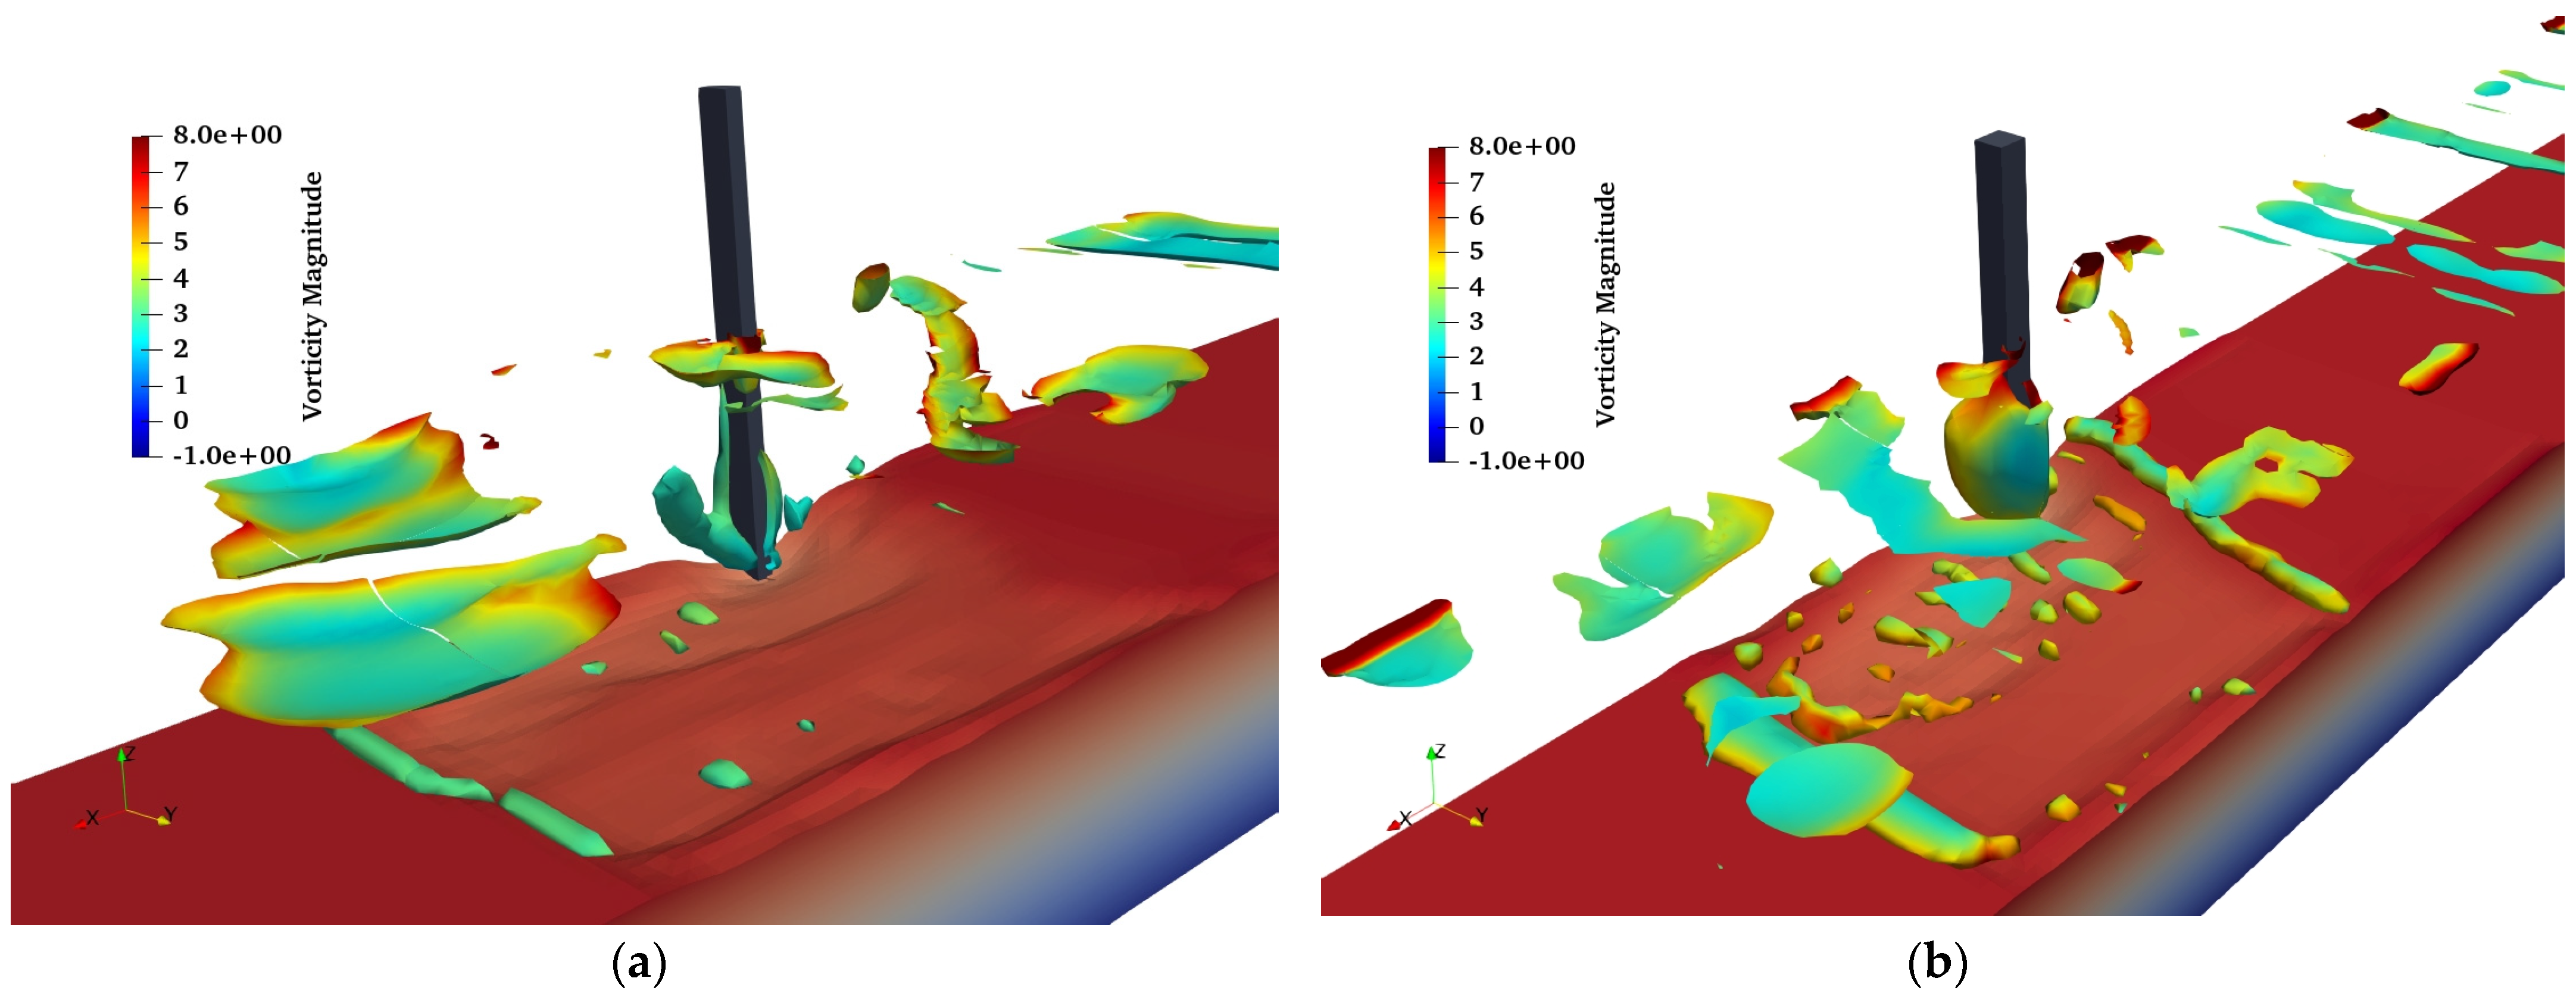
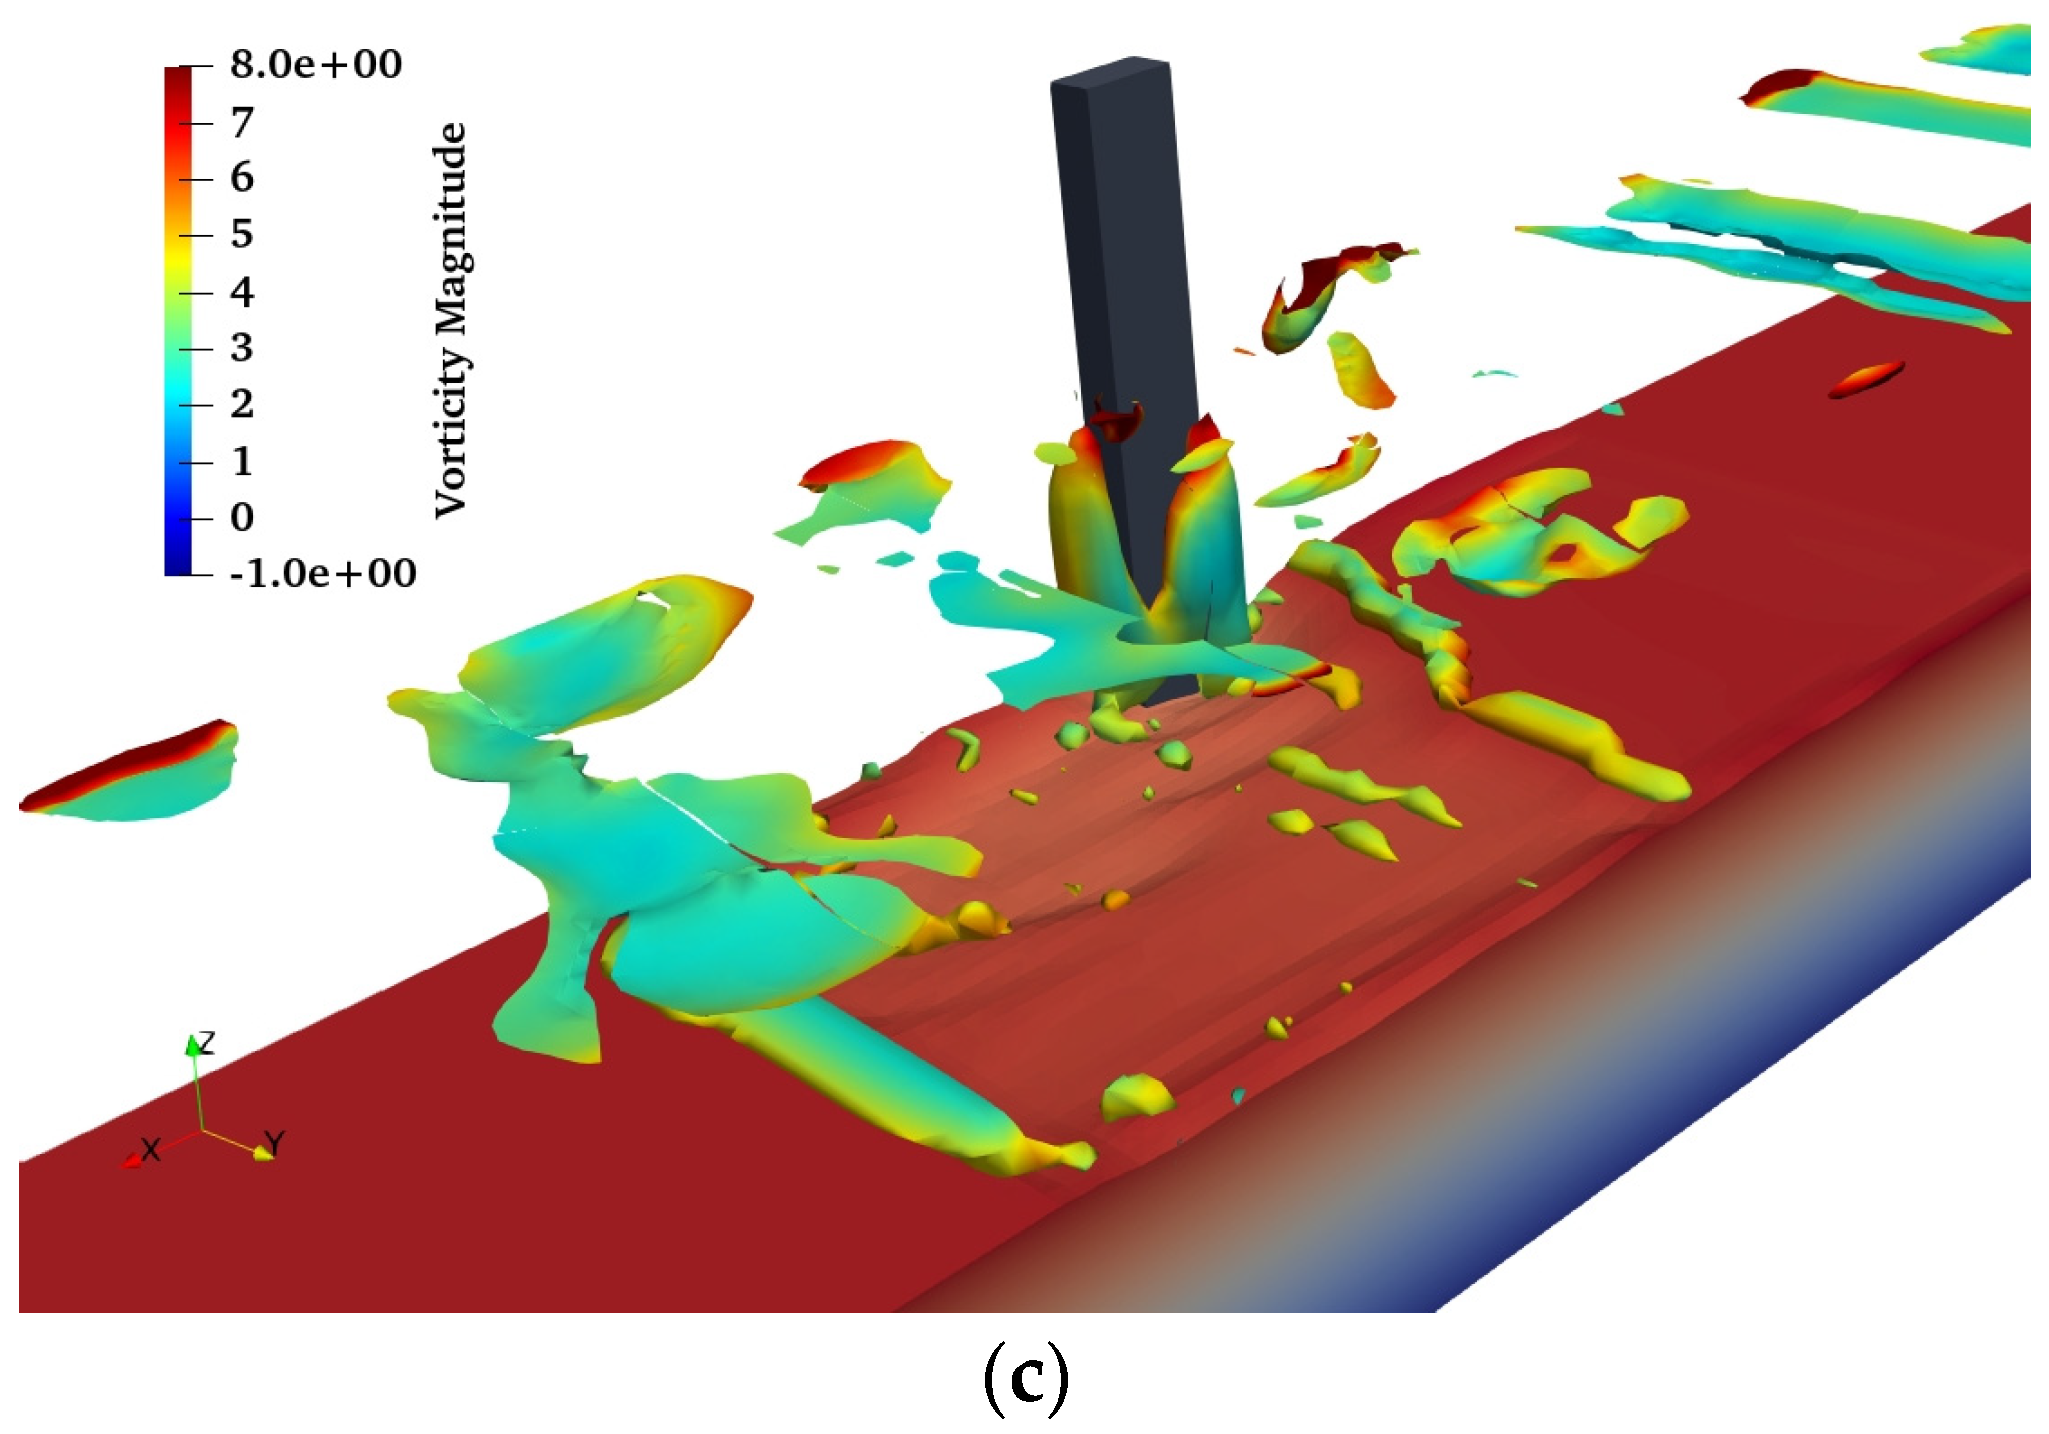
Figure 12 represents the vortical flow structures for different aspect ratios (
B/
L) of vertical wall abutments under the combined effect of waves and current (
Ucw = 0.938). The flow separation from the tip of the abutment leads to the development of small, tube-like vortices. These vortices become larger as they move downstream and weaken as they distance themselves from their starting point, eventually reattaching to the vertical wall. The strong vortices near the obstruction’s front edge result from the separated shear layer of flow that starts from the upstream nose of the abutment. The separated shear layer causes strong friction forces on the bed due to the high vertical vorticity, contributing to the development of local scour. The stronger vortices can be noted around a vertical wall abutment with an aspect ratio of 0.5 (shown in
Figure 12a), resulting in the development of larger scour depth. On the other hand, vertical wall abutments with an aspect ratio of 2 (shown in
Figure 12c) exhibit milder and more scattered vortices, leading to the formation of smaller scour depth [
60].
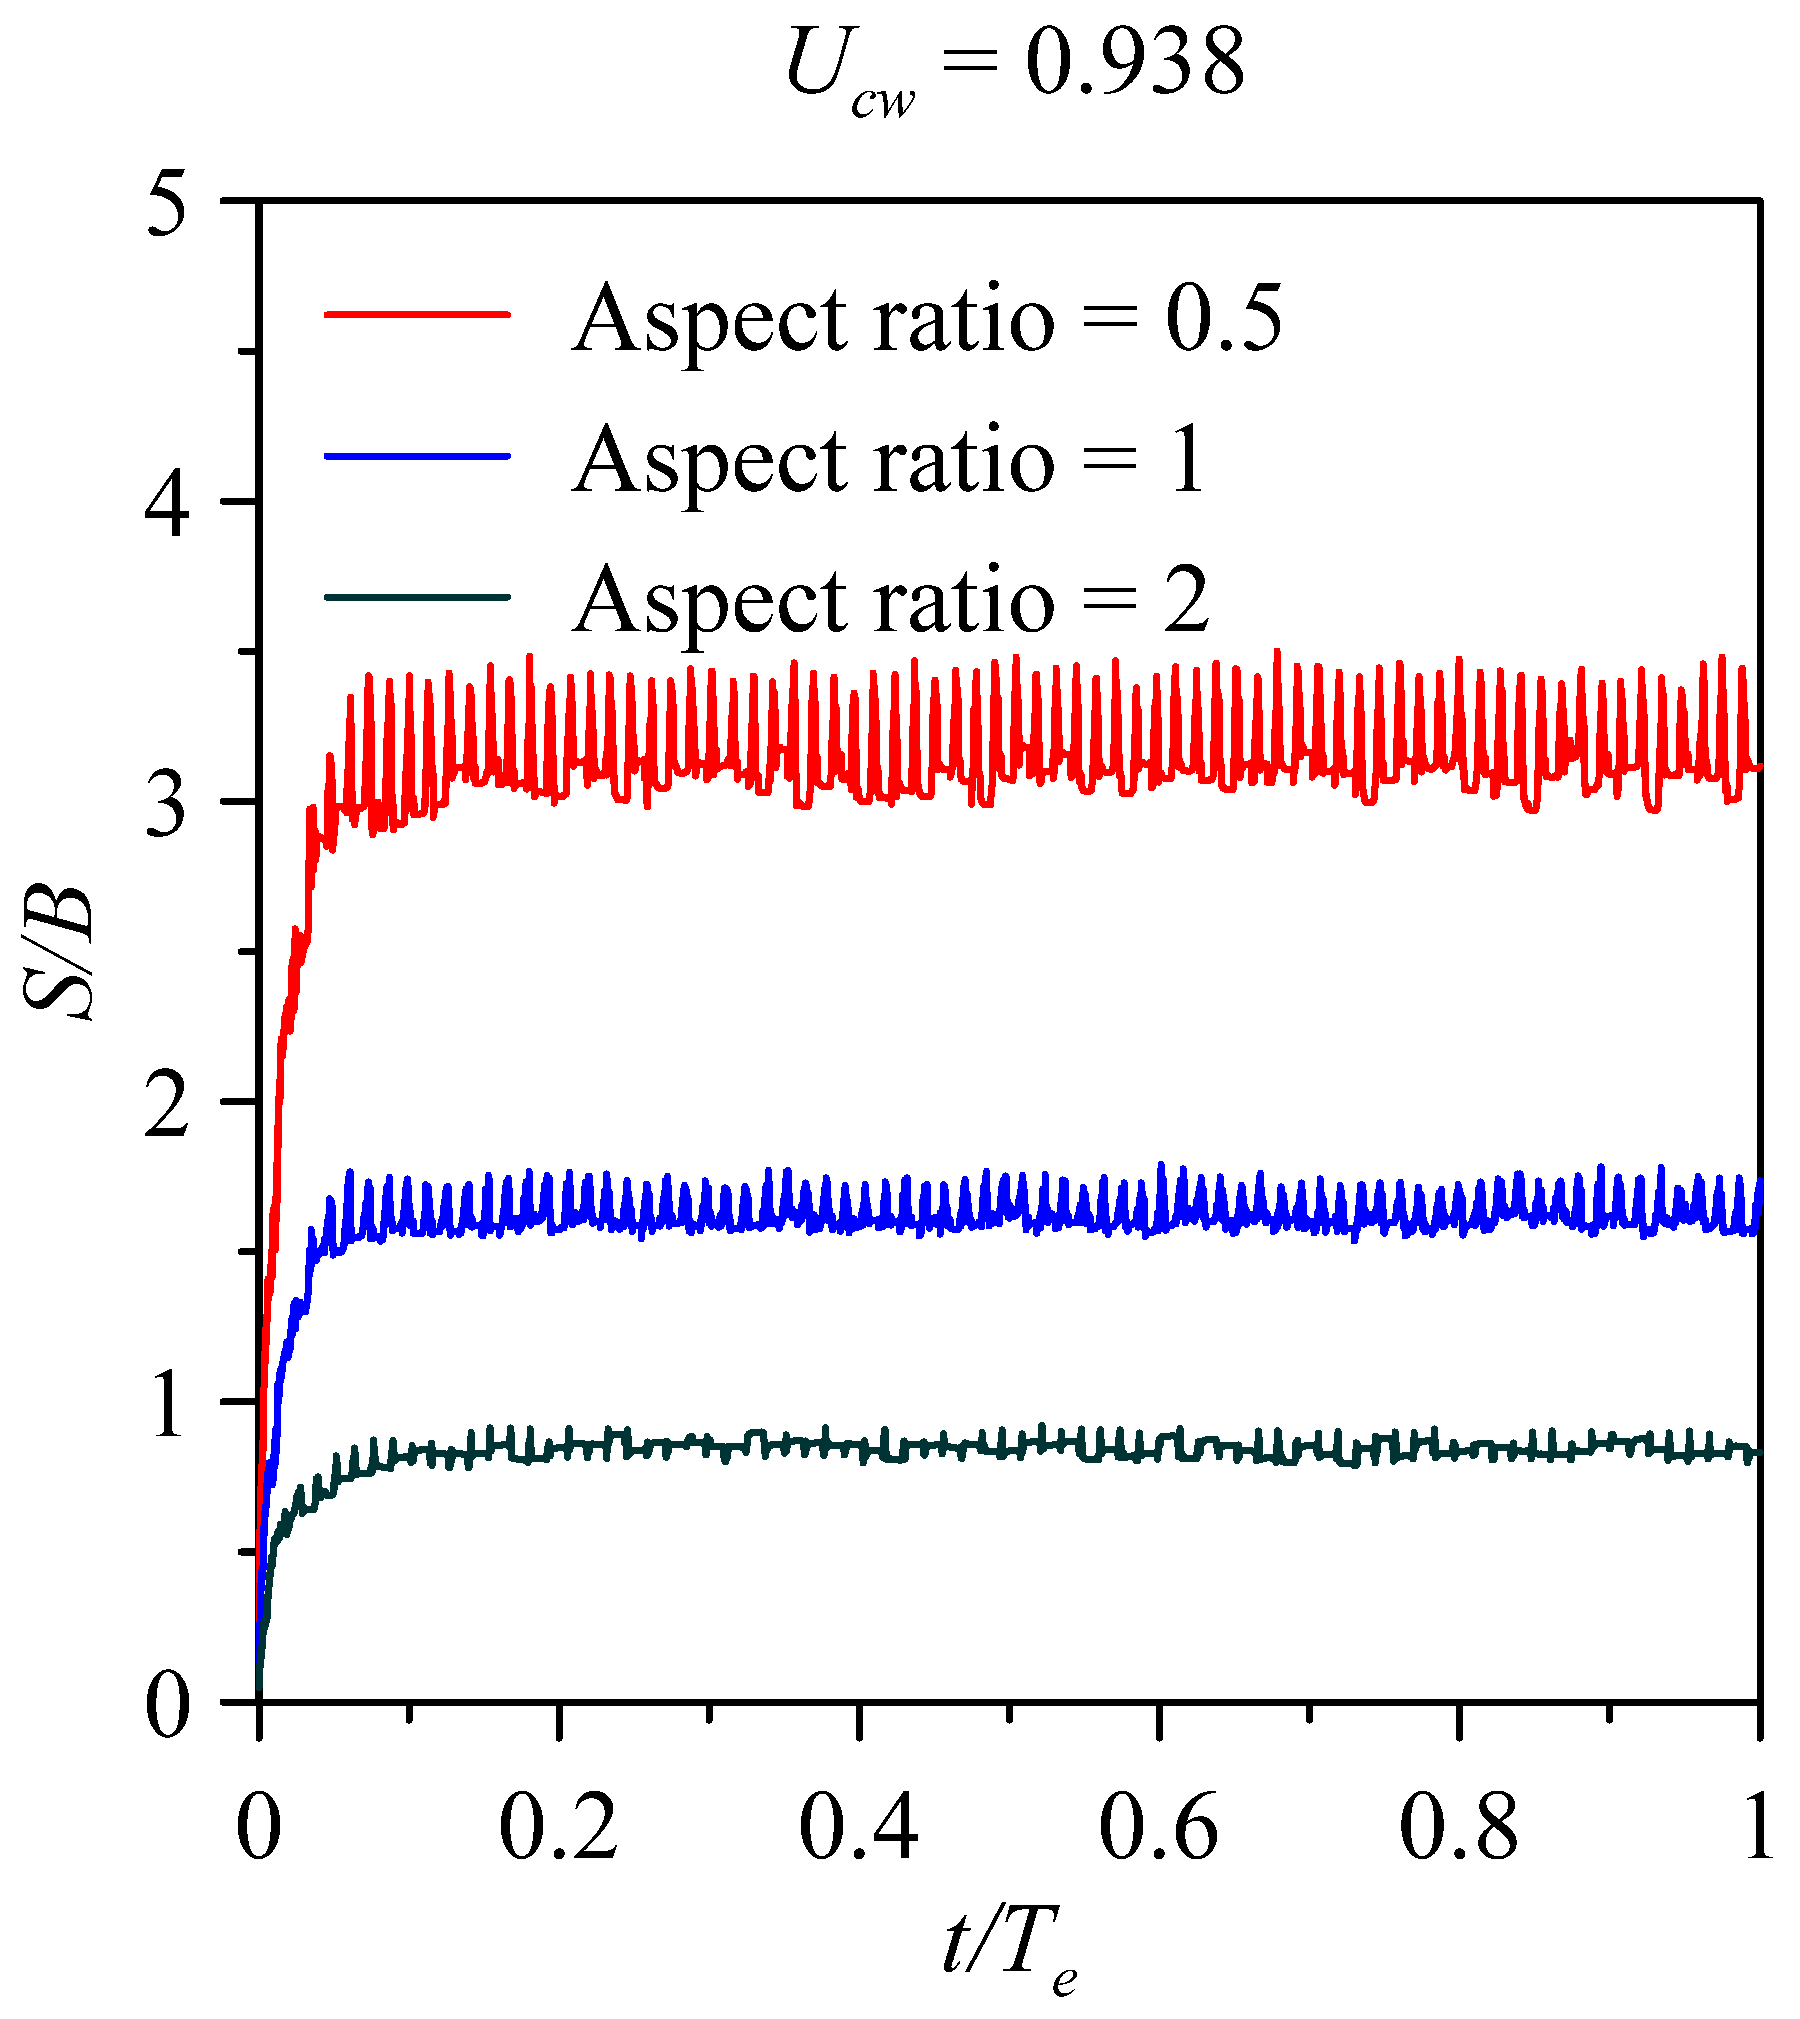
Figure 13 represents the time development of normalized scour depth (
S/
B) for
Ucw = 0.938. The equilibrium scour depth was achieved for all the aspect ratios for
Ucw = 0.938, with the maximum normalized scour depth occurring at an aspect ratio of 0.5 and a value of 3.11. Increasing the aspect ratio results in rapid changes in scour depth. Similarly, the normalized scour depths of 1.73 and 0.83 were observed for the aspect ratios of 1 and 2, respectively. The results indicate that an increase in aspect ratio decreases the equilibrium scour depth under a fixed value of
Ucw = 0.821. It can also be observed that a gentle increase in
S/
B value is observed with an increase in the
Ucw parameter.
3.3. Steady Current Induced Scour (Ucw = 1)
The interaction of steady currents with vertical wall abutments develops a complex flow system. The complex flow system includes the development of vortices, eddies, and separation zones that affect the abutment scour mechanism. The numerical simulations were carried out under steady currents, with an approach flow velocity of 0.2387 m/s. The abutment length was fixed constant at 0.04 m, while the abutment width was systematically varied: 0.02 m, 0.04 m, and 0.08 m, to achieve aspect ratios (B/L) of 0.5, 1, and 2, respectively. In a steady current, the Shields parameter (θ) was calculated to be 0.036, which is less than the critical Shields parameter (θcr) value of 0.045, indicating the clear water scour regime.
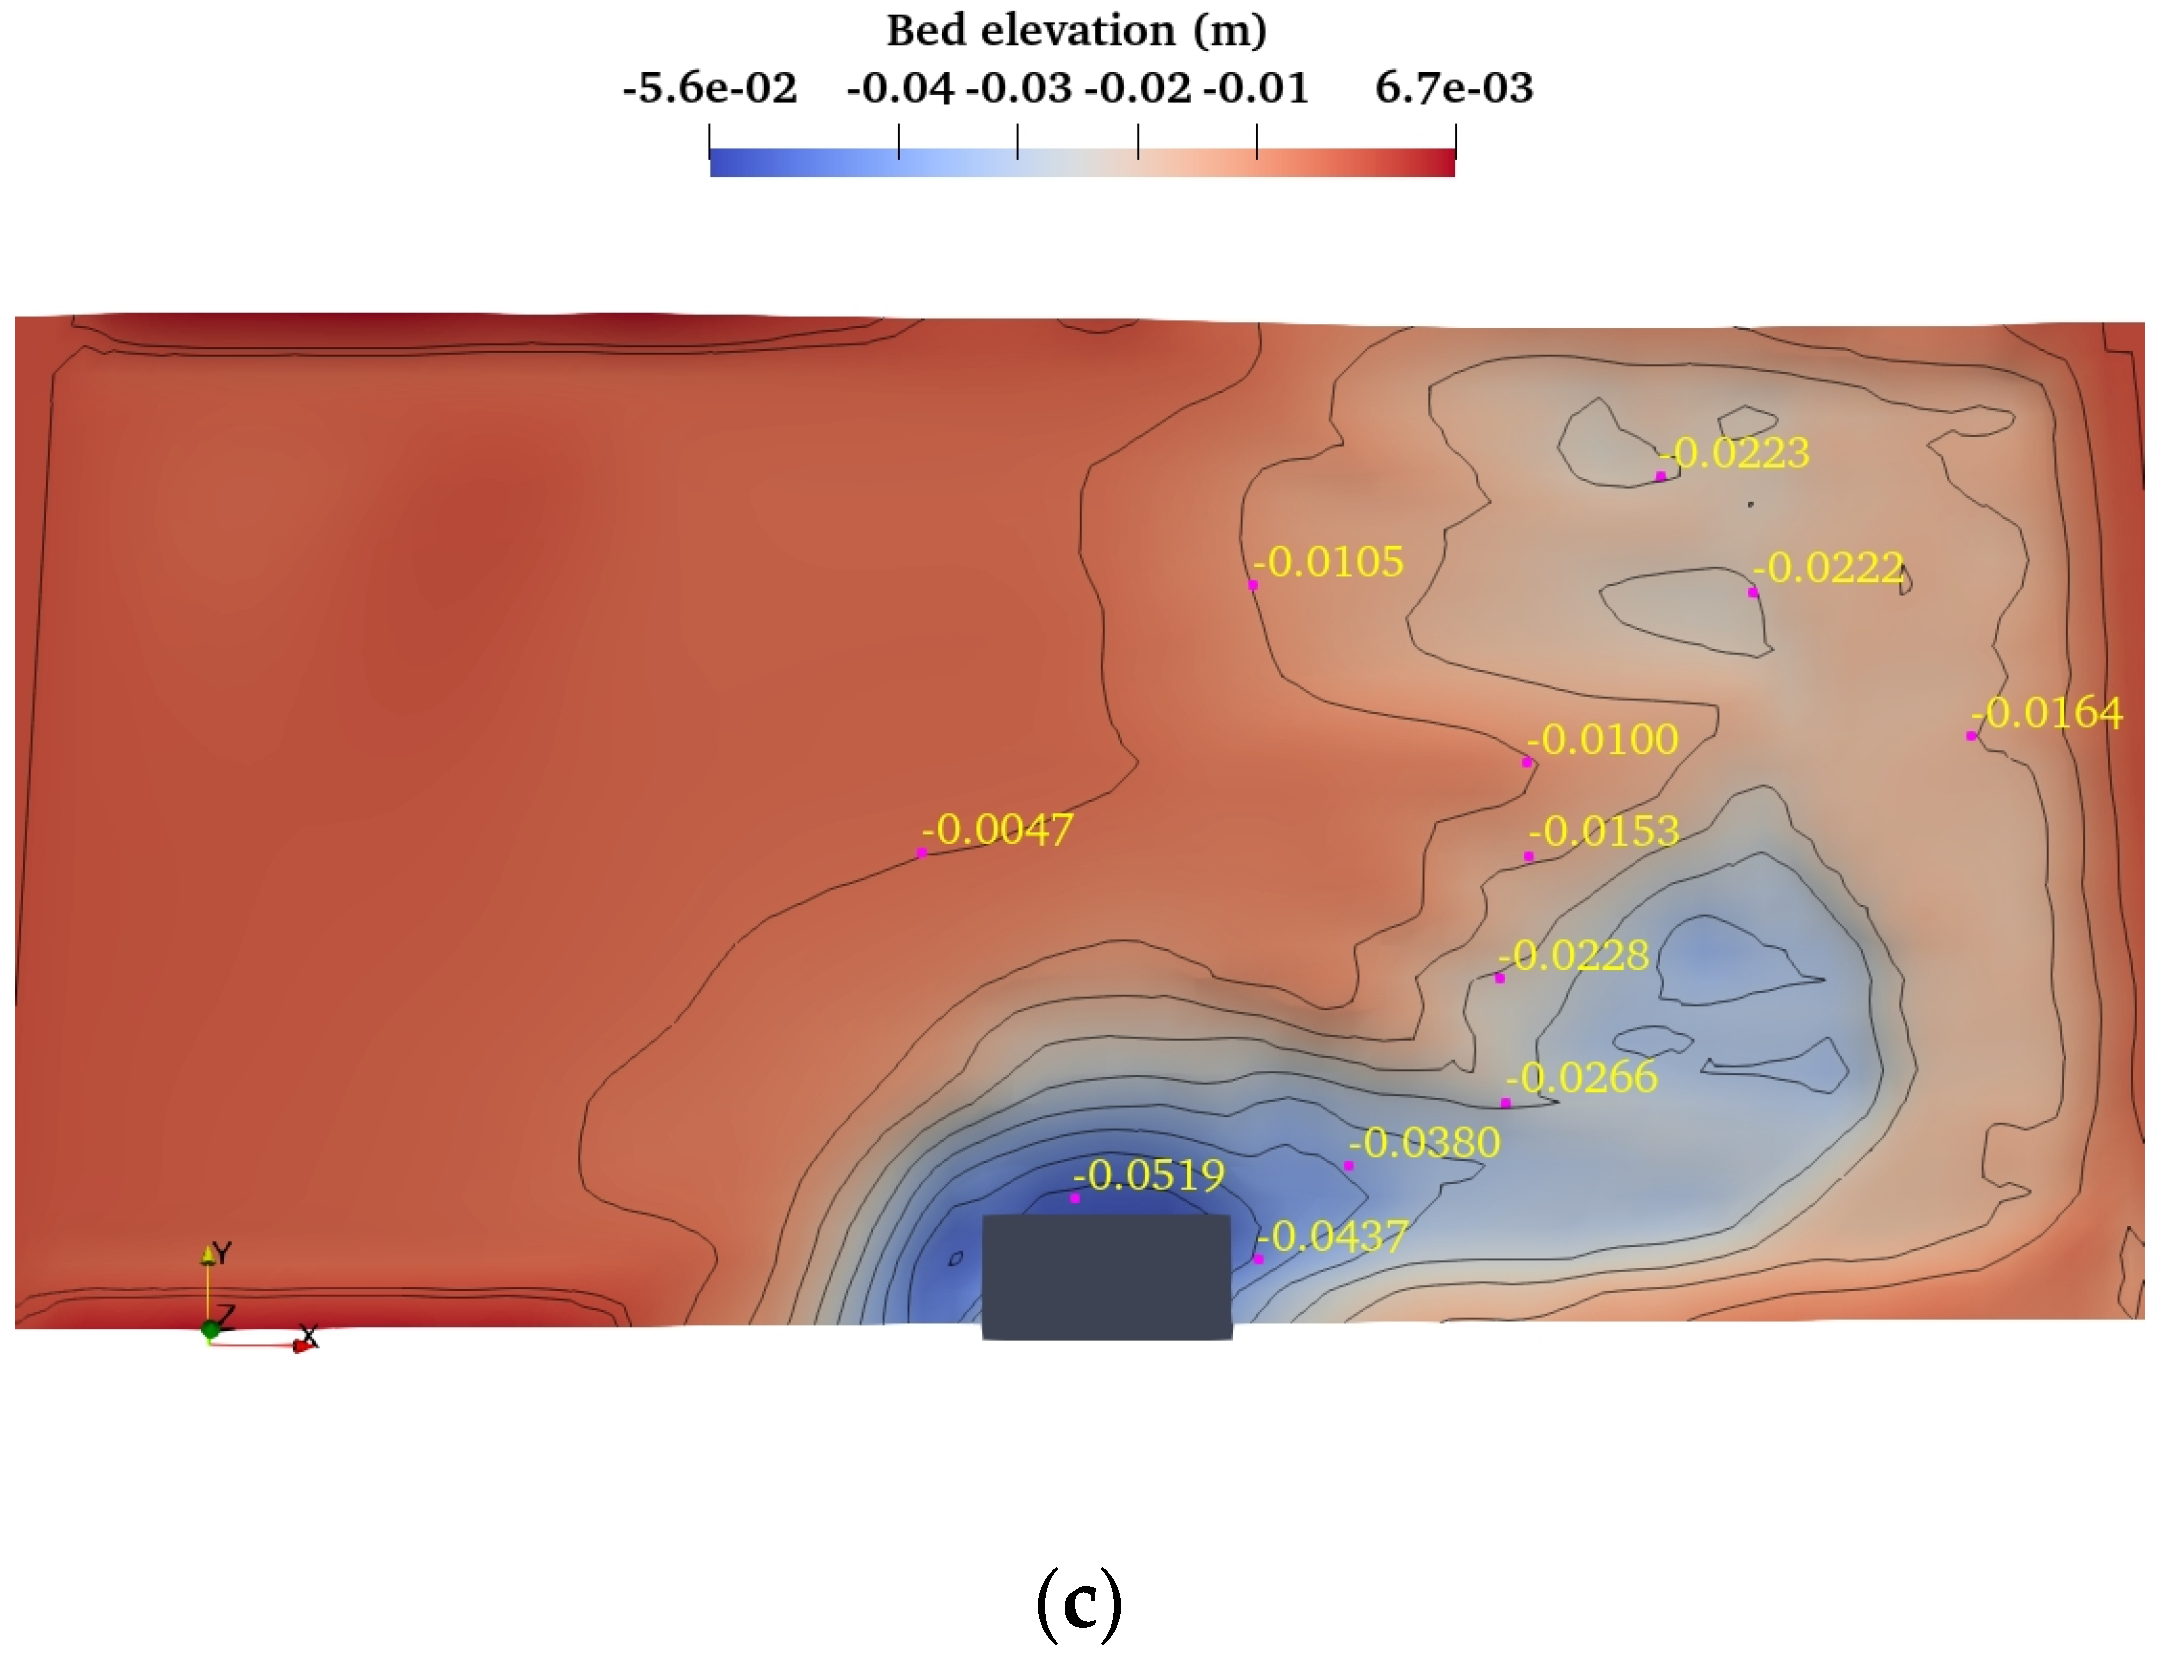
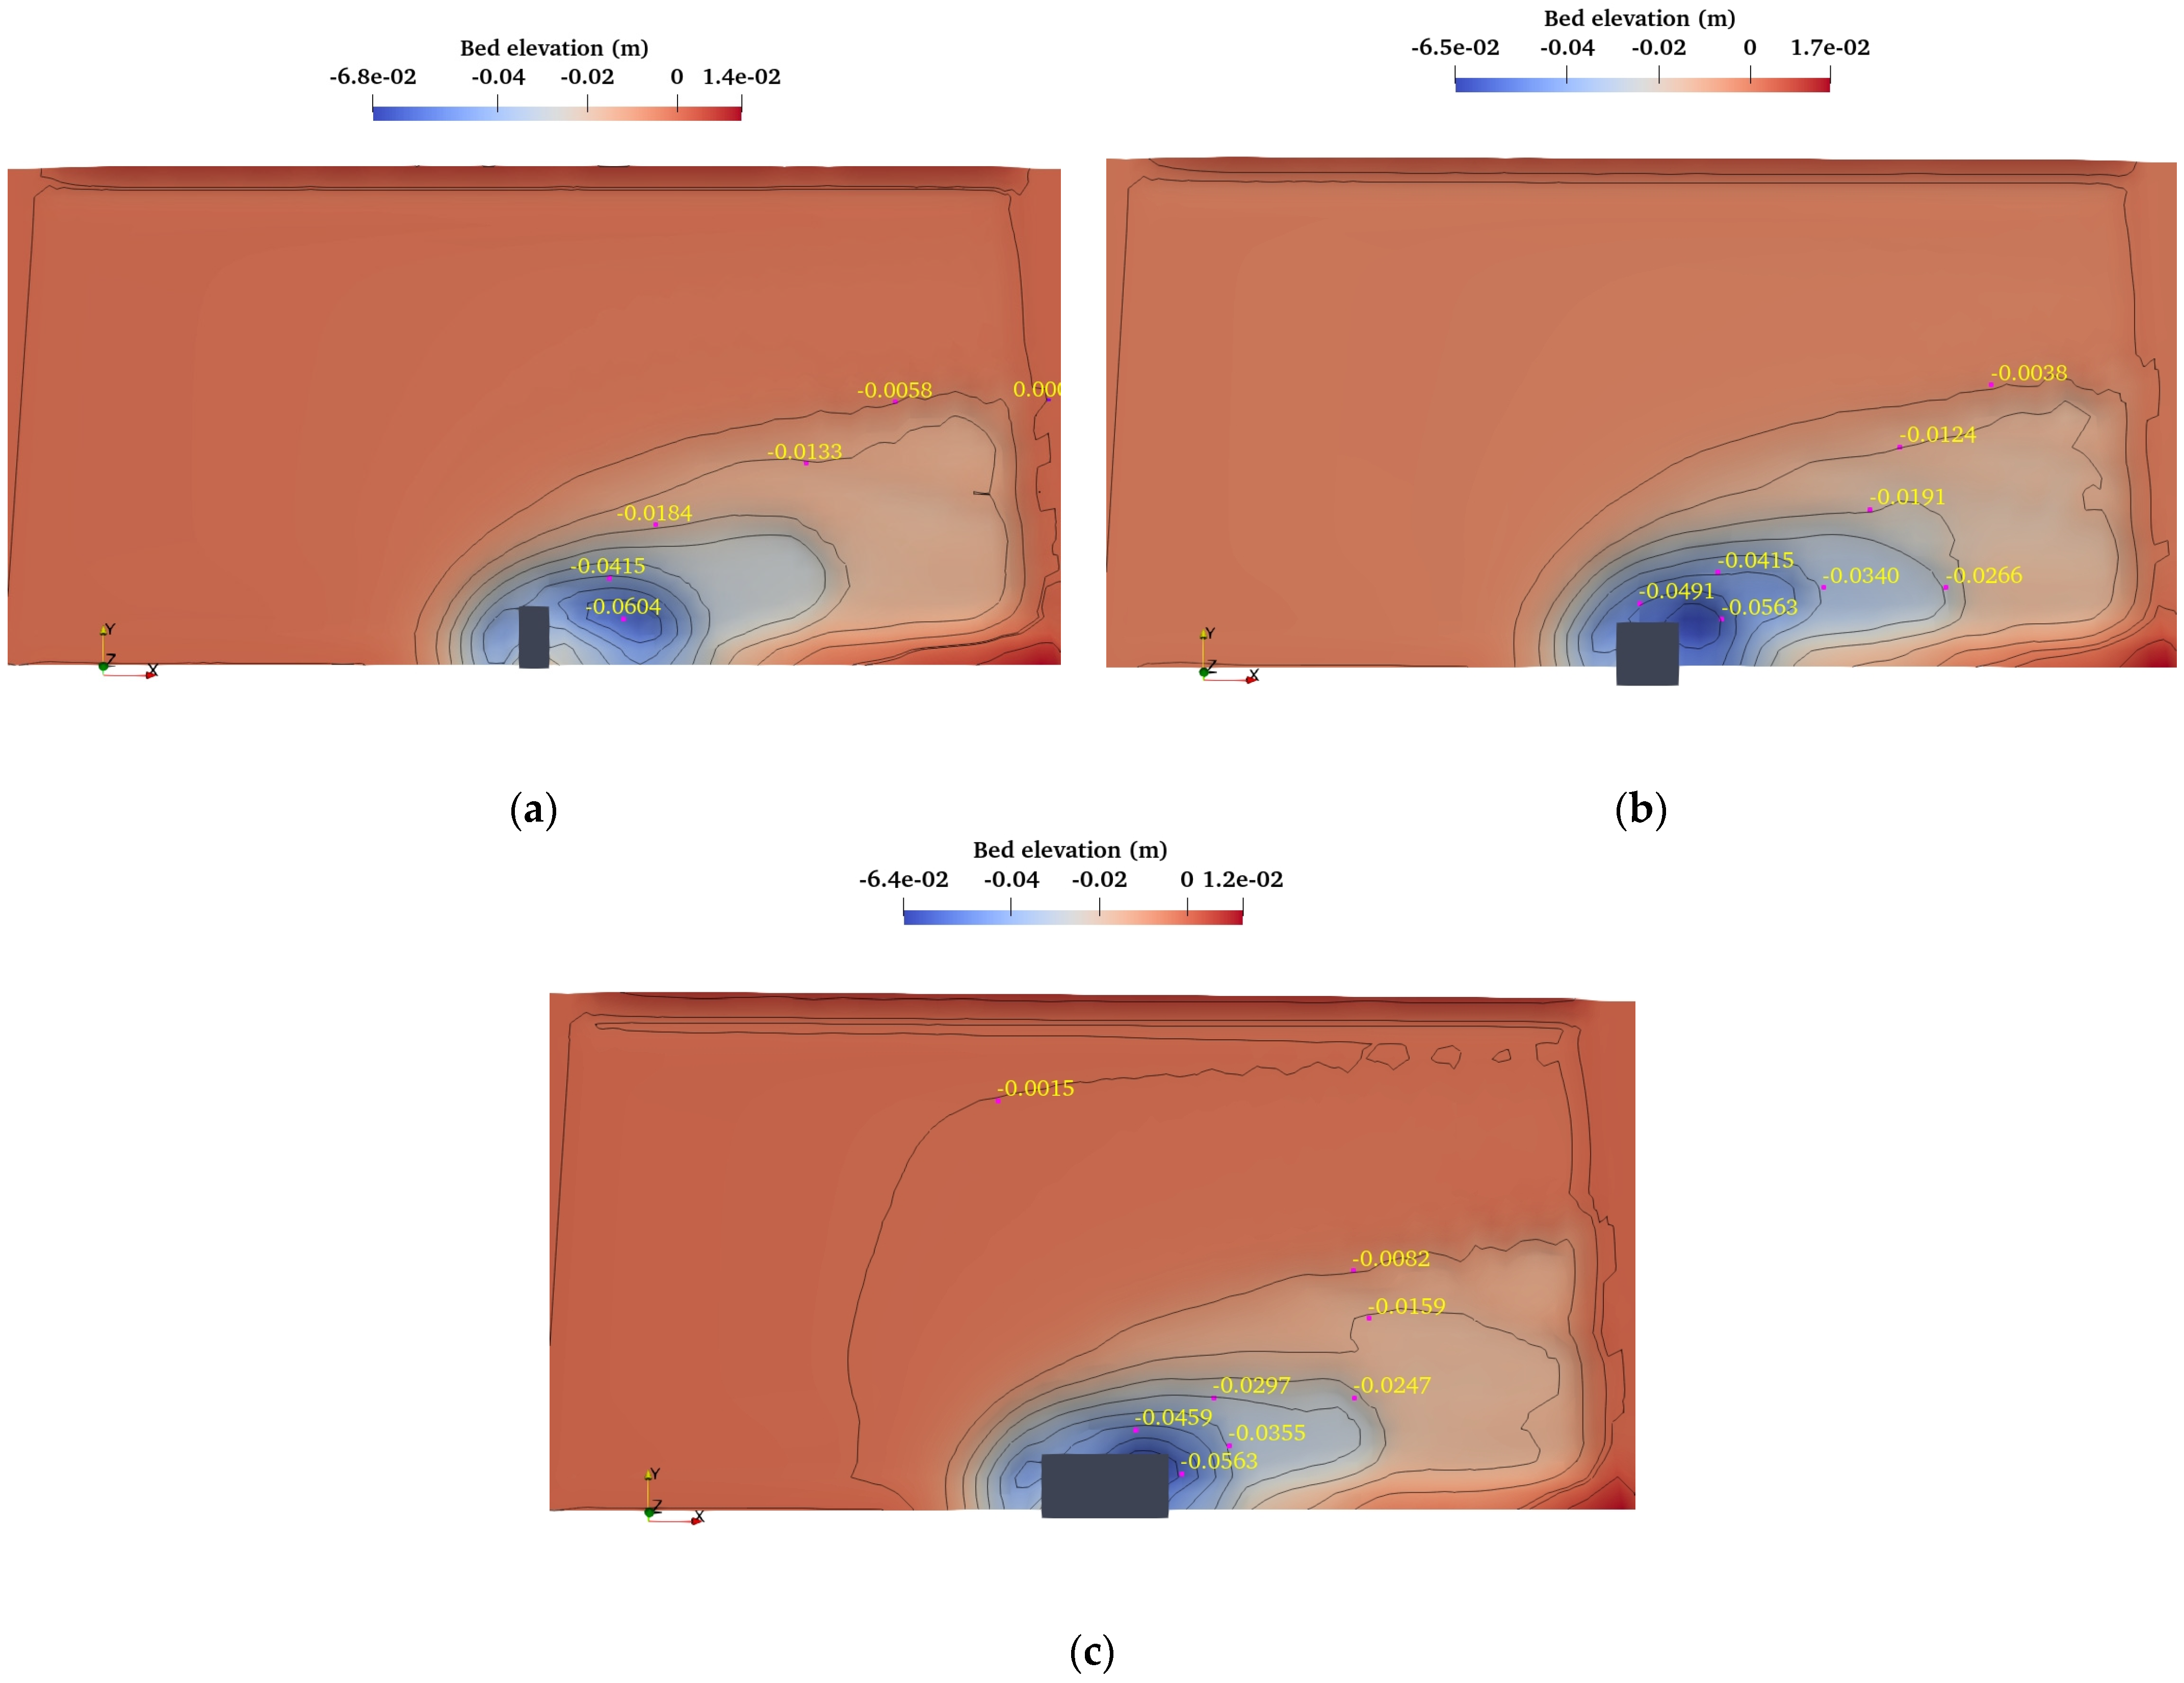
Figure 14 represents the bed topography contour of scour around the vertical wall abutment with varying aspect ratios under steady current. The areas shaded in blue (displaying negative values) correspond to sediment erosion, whereas the regions highlighted in red (reflecting positive values) indicate sediment deposition. The formation of a strong HSV upstream leads to scour hole formation on the upstream side of the abutments, while in downstream the sediment is deposited. The deepest visible contour lines, corresponding to varying aspect ratios of 0.5, 1, and 2, exhibiting values of −0.0653 m, −0.0610 m, and −0.0519 m, respectively. The maximum scour (shown in
Figure 14a) occurs around the front edge of the abutment with an aspect ratio of 0.5. On the other hand, the least amount of scour (depicted in
Figure 14c) occurs for an aspect ratio of 2. The increase in abutment width decreases the scour for a fixed value of abutment length in a steady current. The result suggests that the abutment length with a sharp edge can generate more turbulence, increasing the sediment transport rate downstream of the abutment. This process leads to the development of more deeper and distinct ripples on the sediment bed (
Figure 14a). Furthermore, it is also noticeable that the eroded sediment is deposited downstream of the abutment due to the shading effect developed by the abutment.
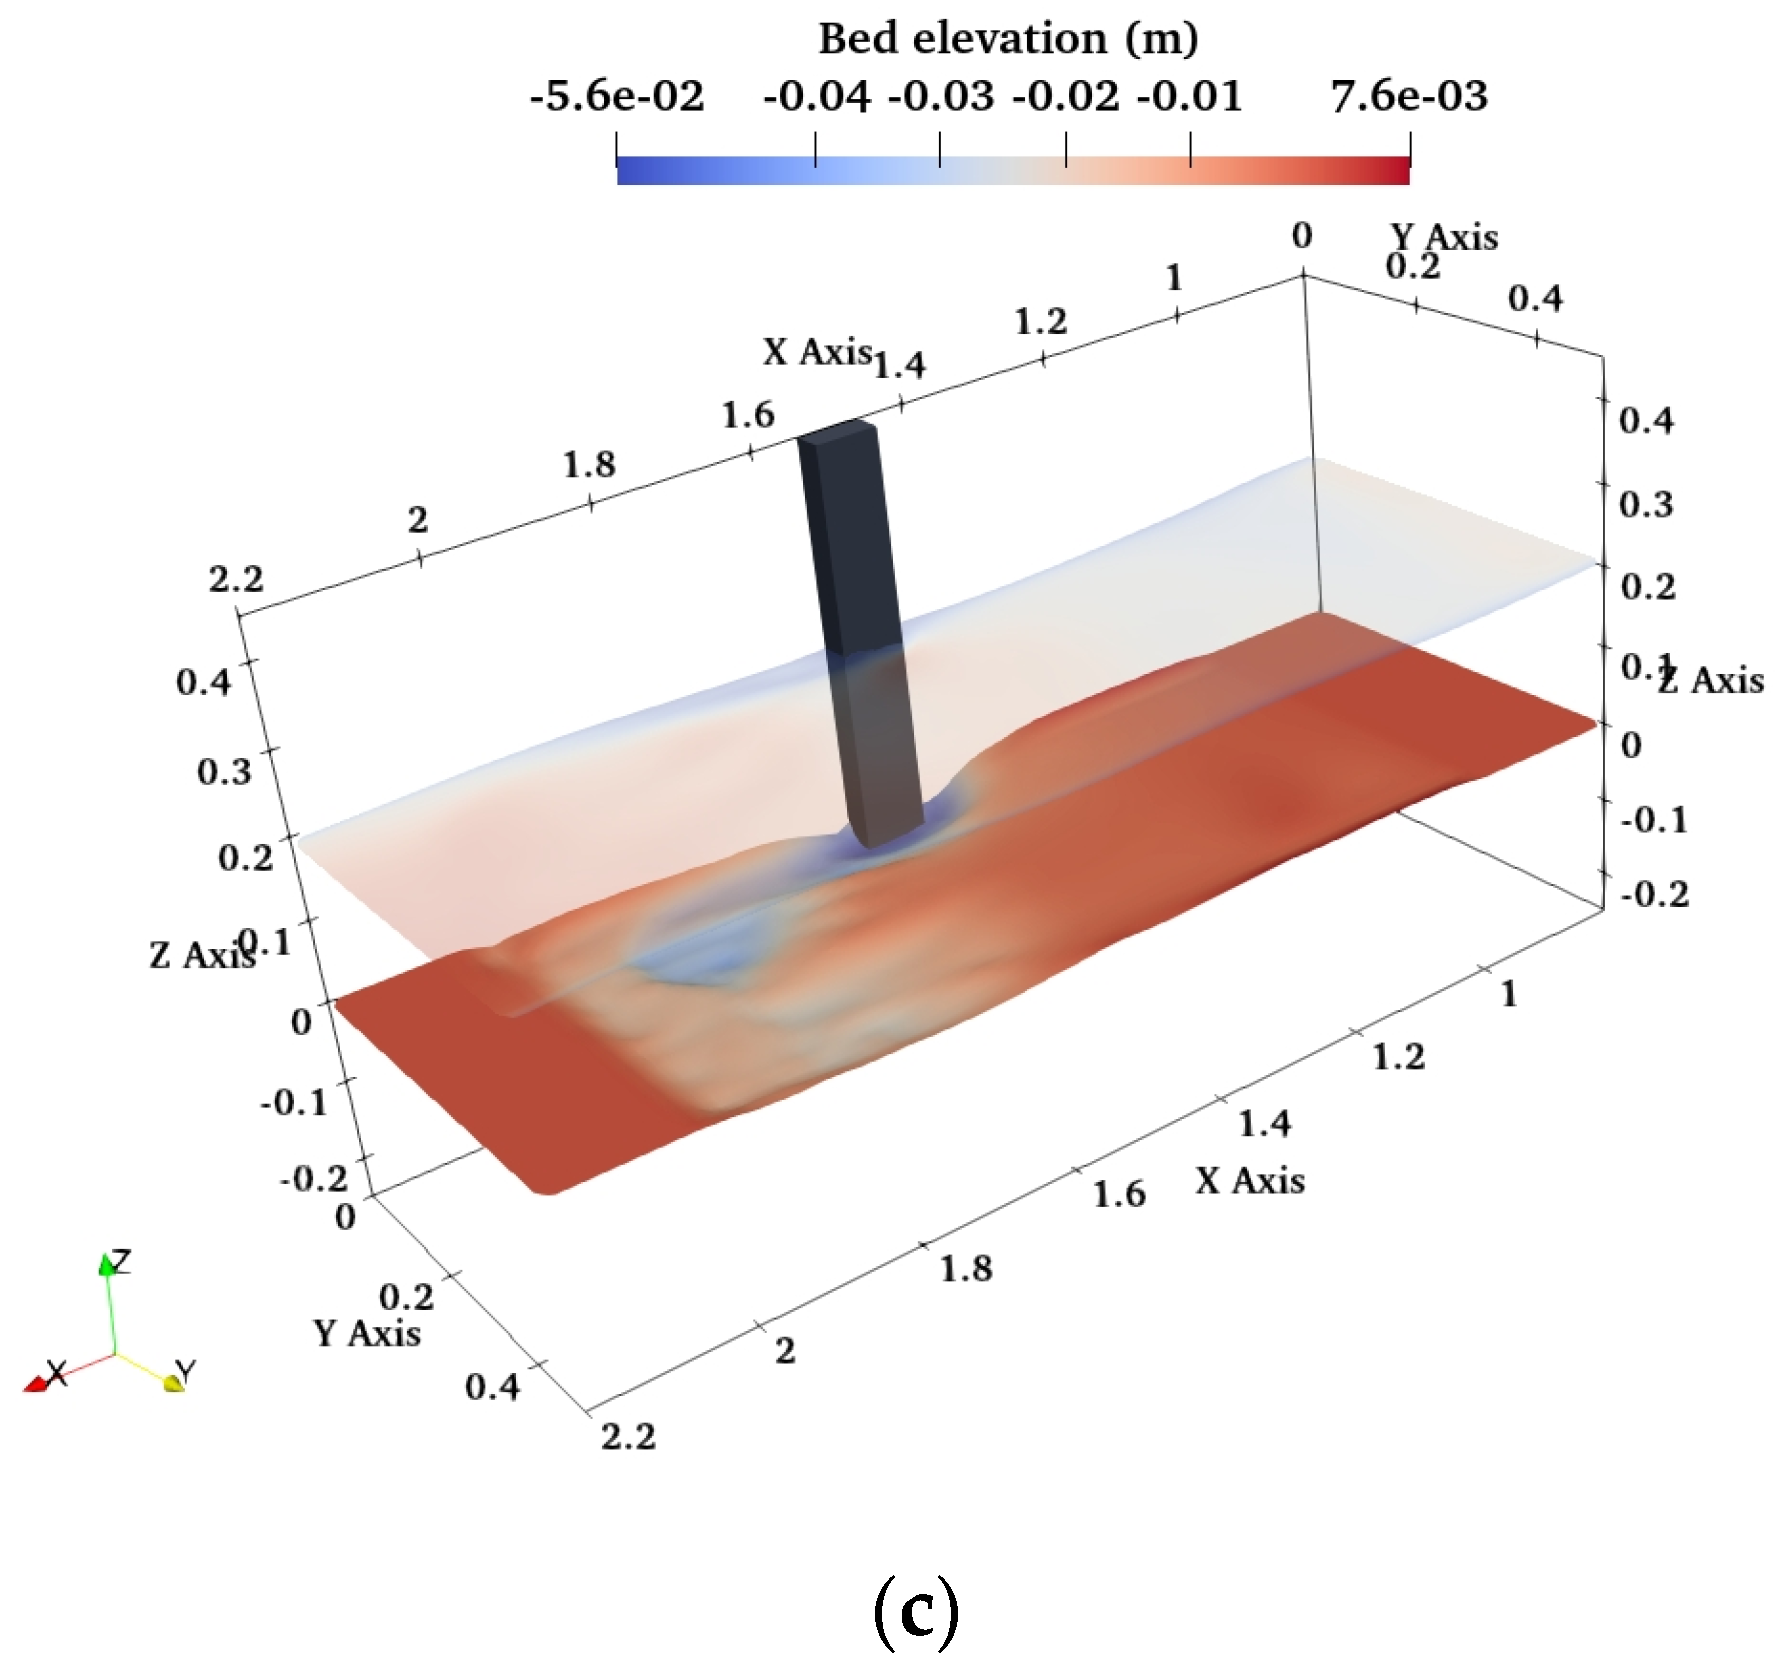
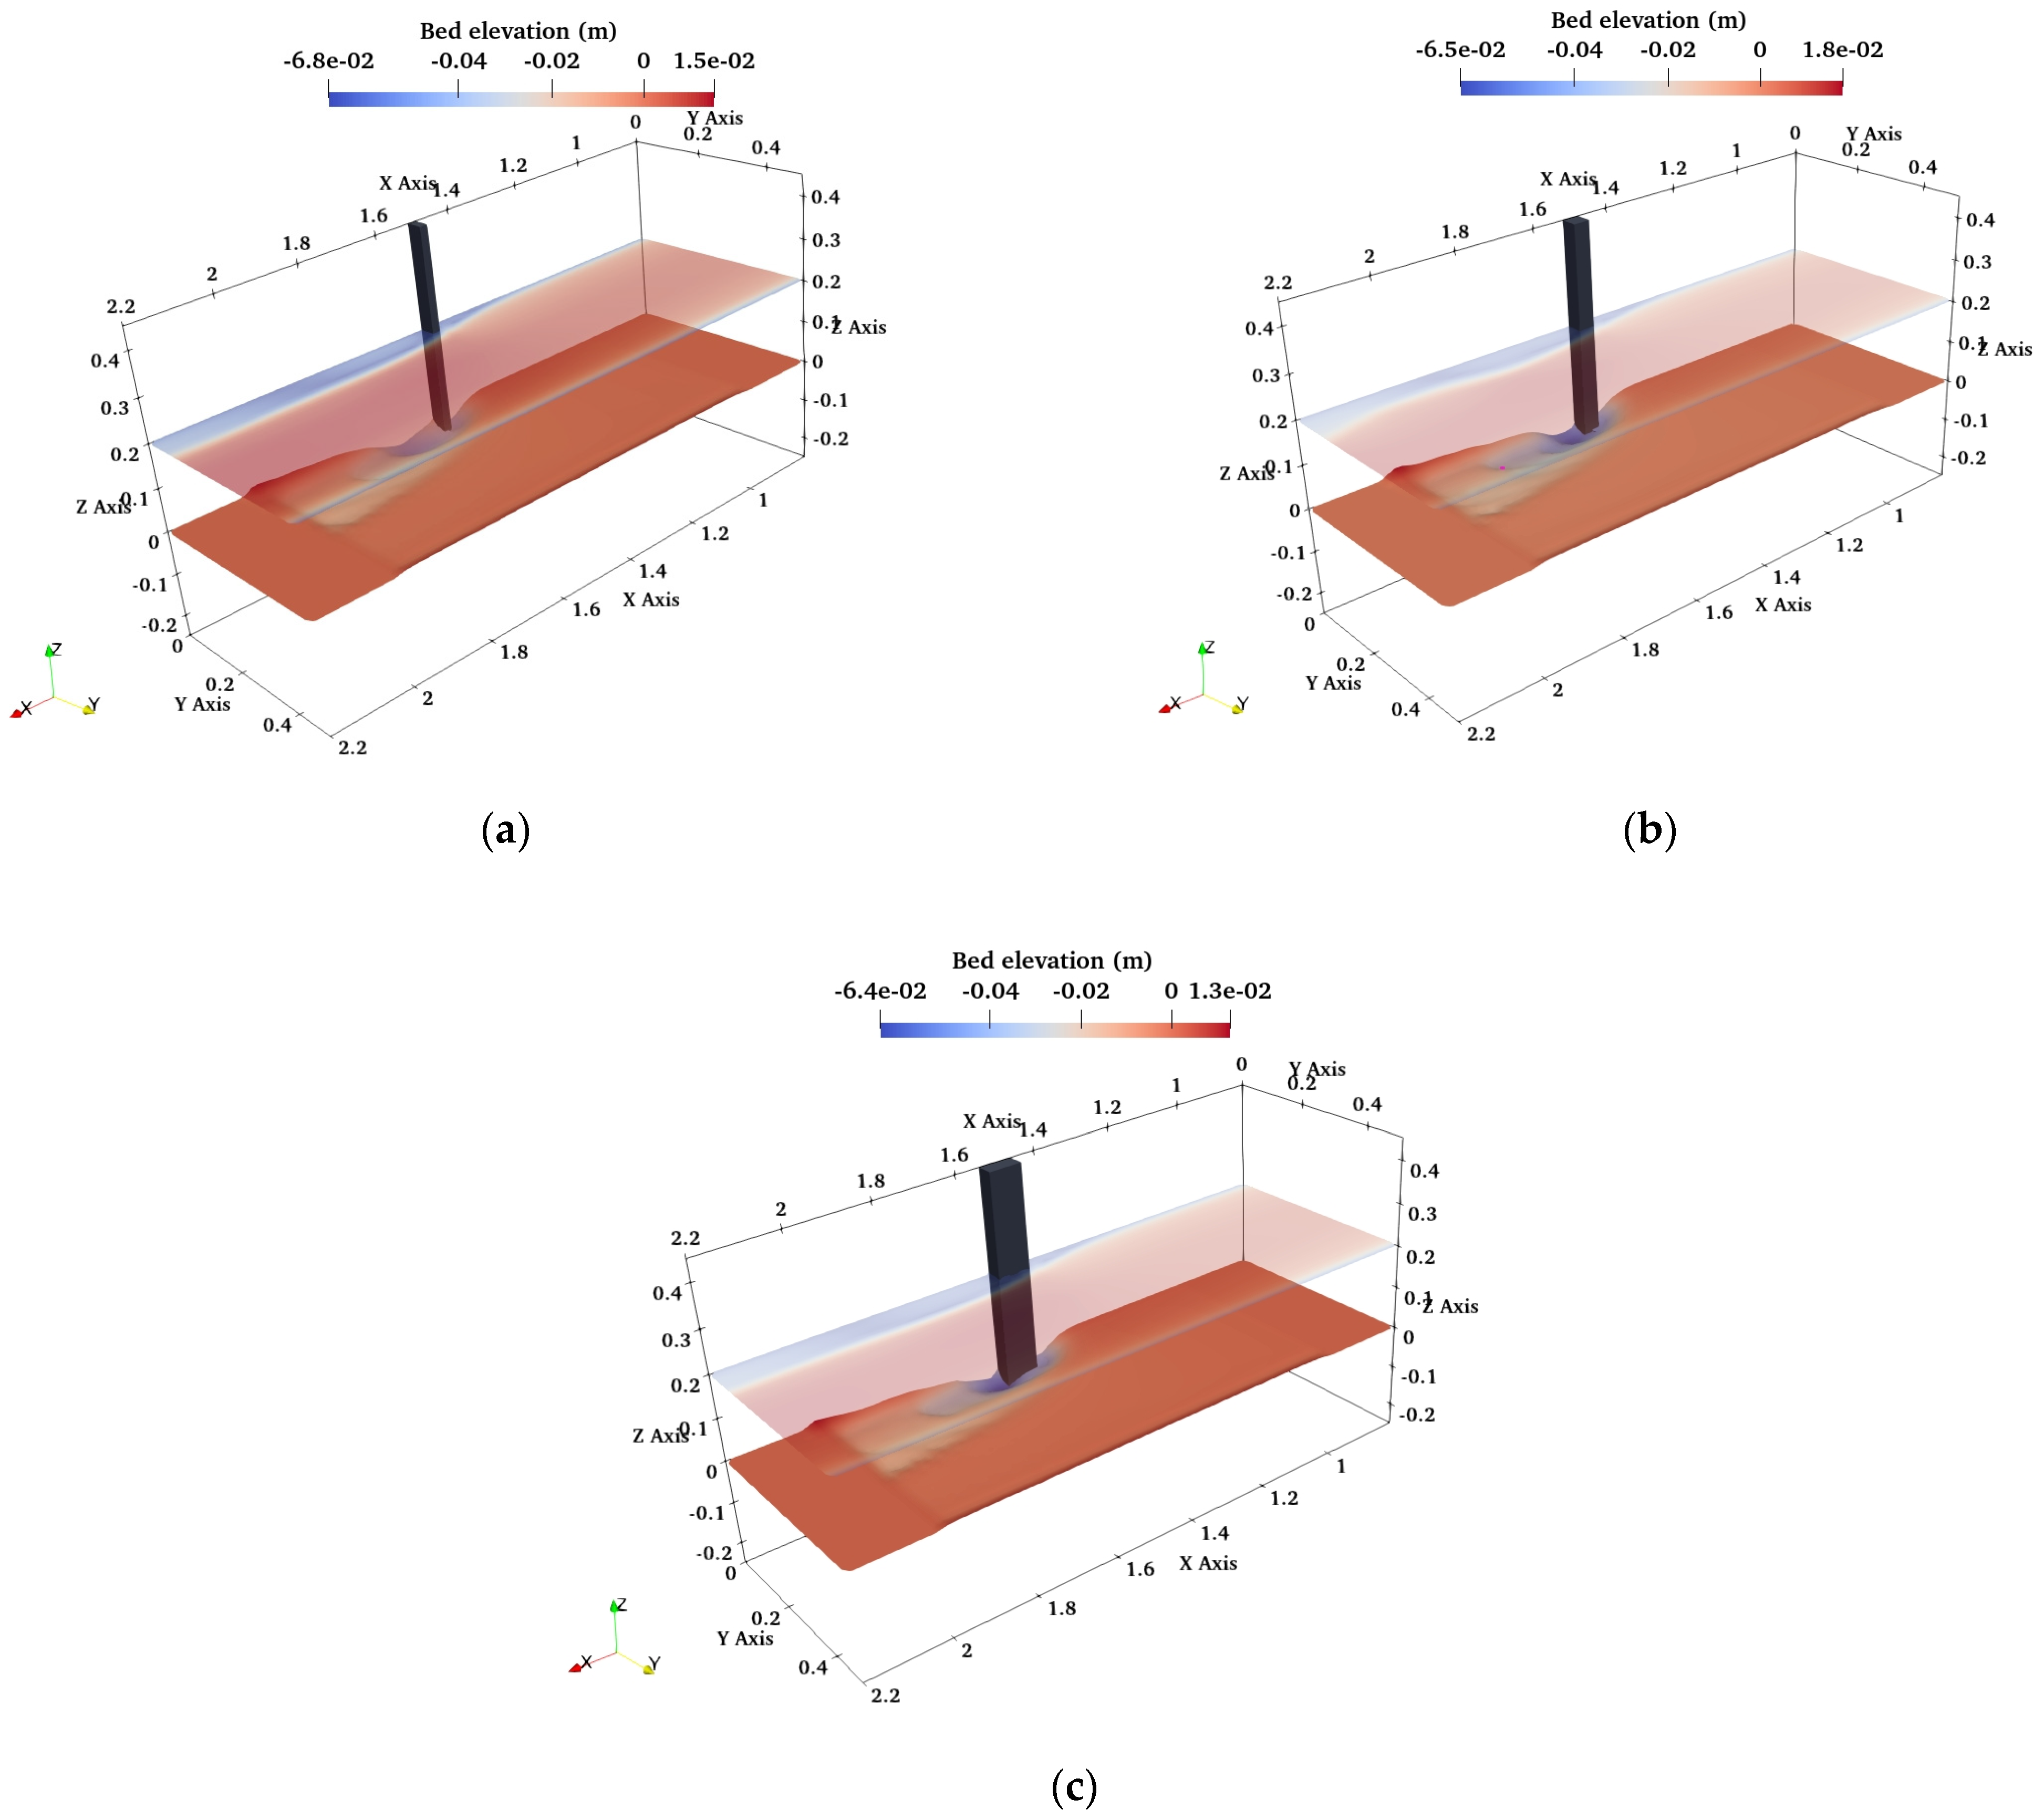
Figure 15 illustrates the 3D visualization of the free surface and sediment bed around vertical wall abutment with various aspect ratios under steady current (
Ucw = 0.821). The utilization of the Level Set Method (LSM) in the present numerical model enhances the accurate tracking of free surface and sediment bed. The maximum scour hole can be observed for vertical wall abutment with an aspect ratio of 0.5 (shown in
Figure 15a). However, the minimum scour hole can be observed for vertical wall abutment with an aspect ratio of 2 (
Figure 15c). The extent of scour hole becomes narrower as the abutment width increases, as seen in
Figure 15a–c. The sharp edge of the abutment, with an aspect ratio of 0.5, generates more turbulence in the flow, resulting in larger and wider scour hole formation.
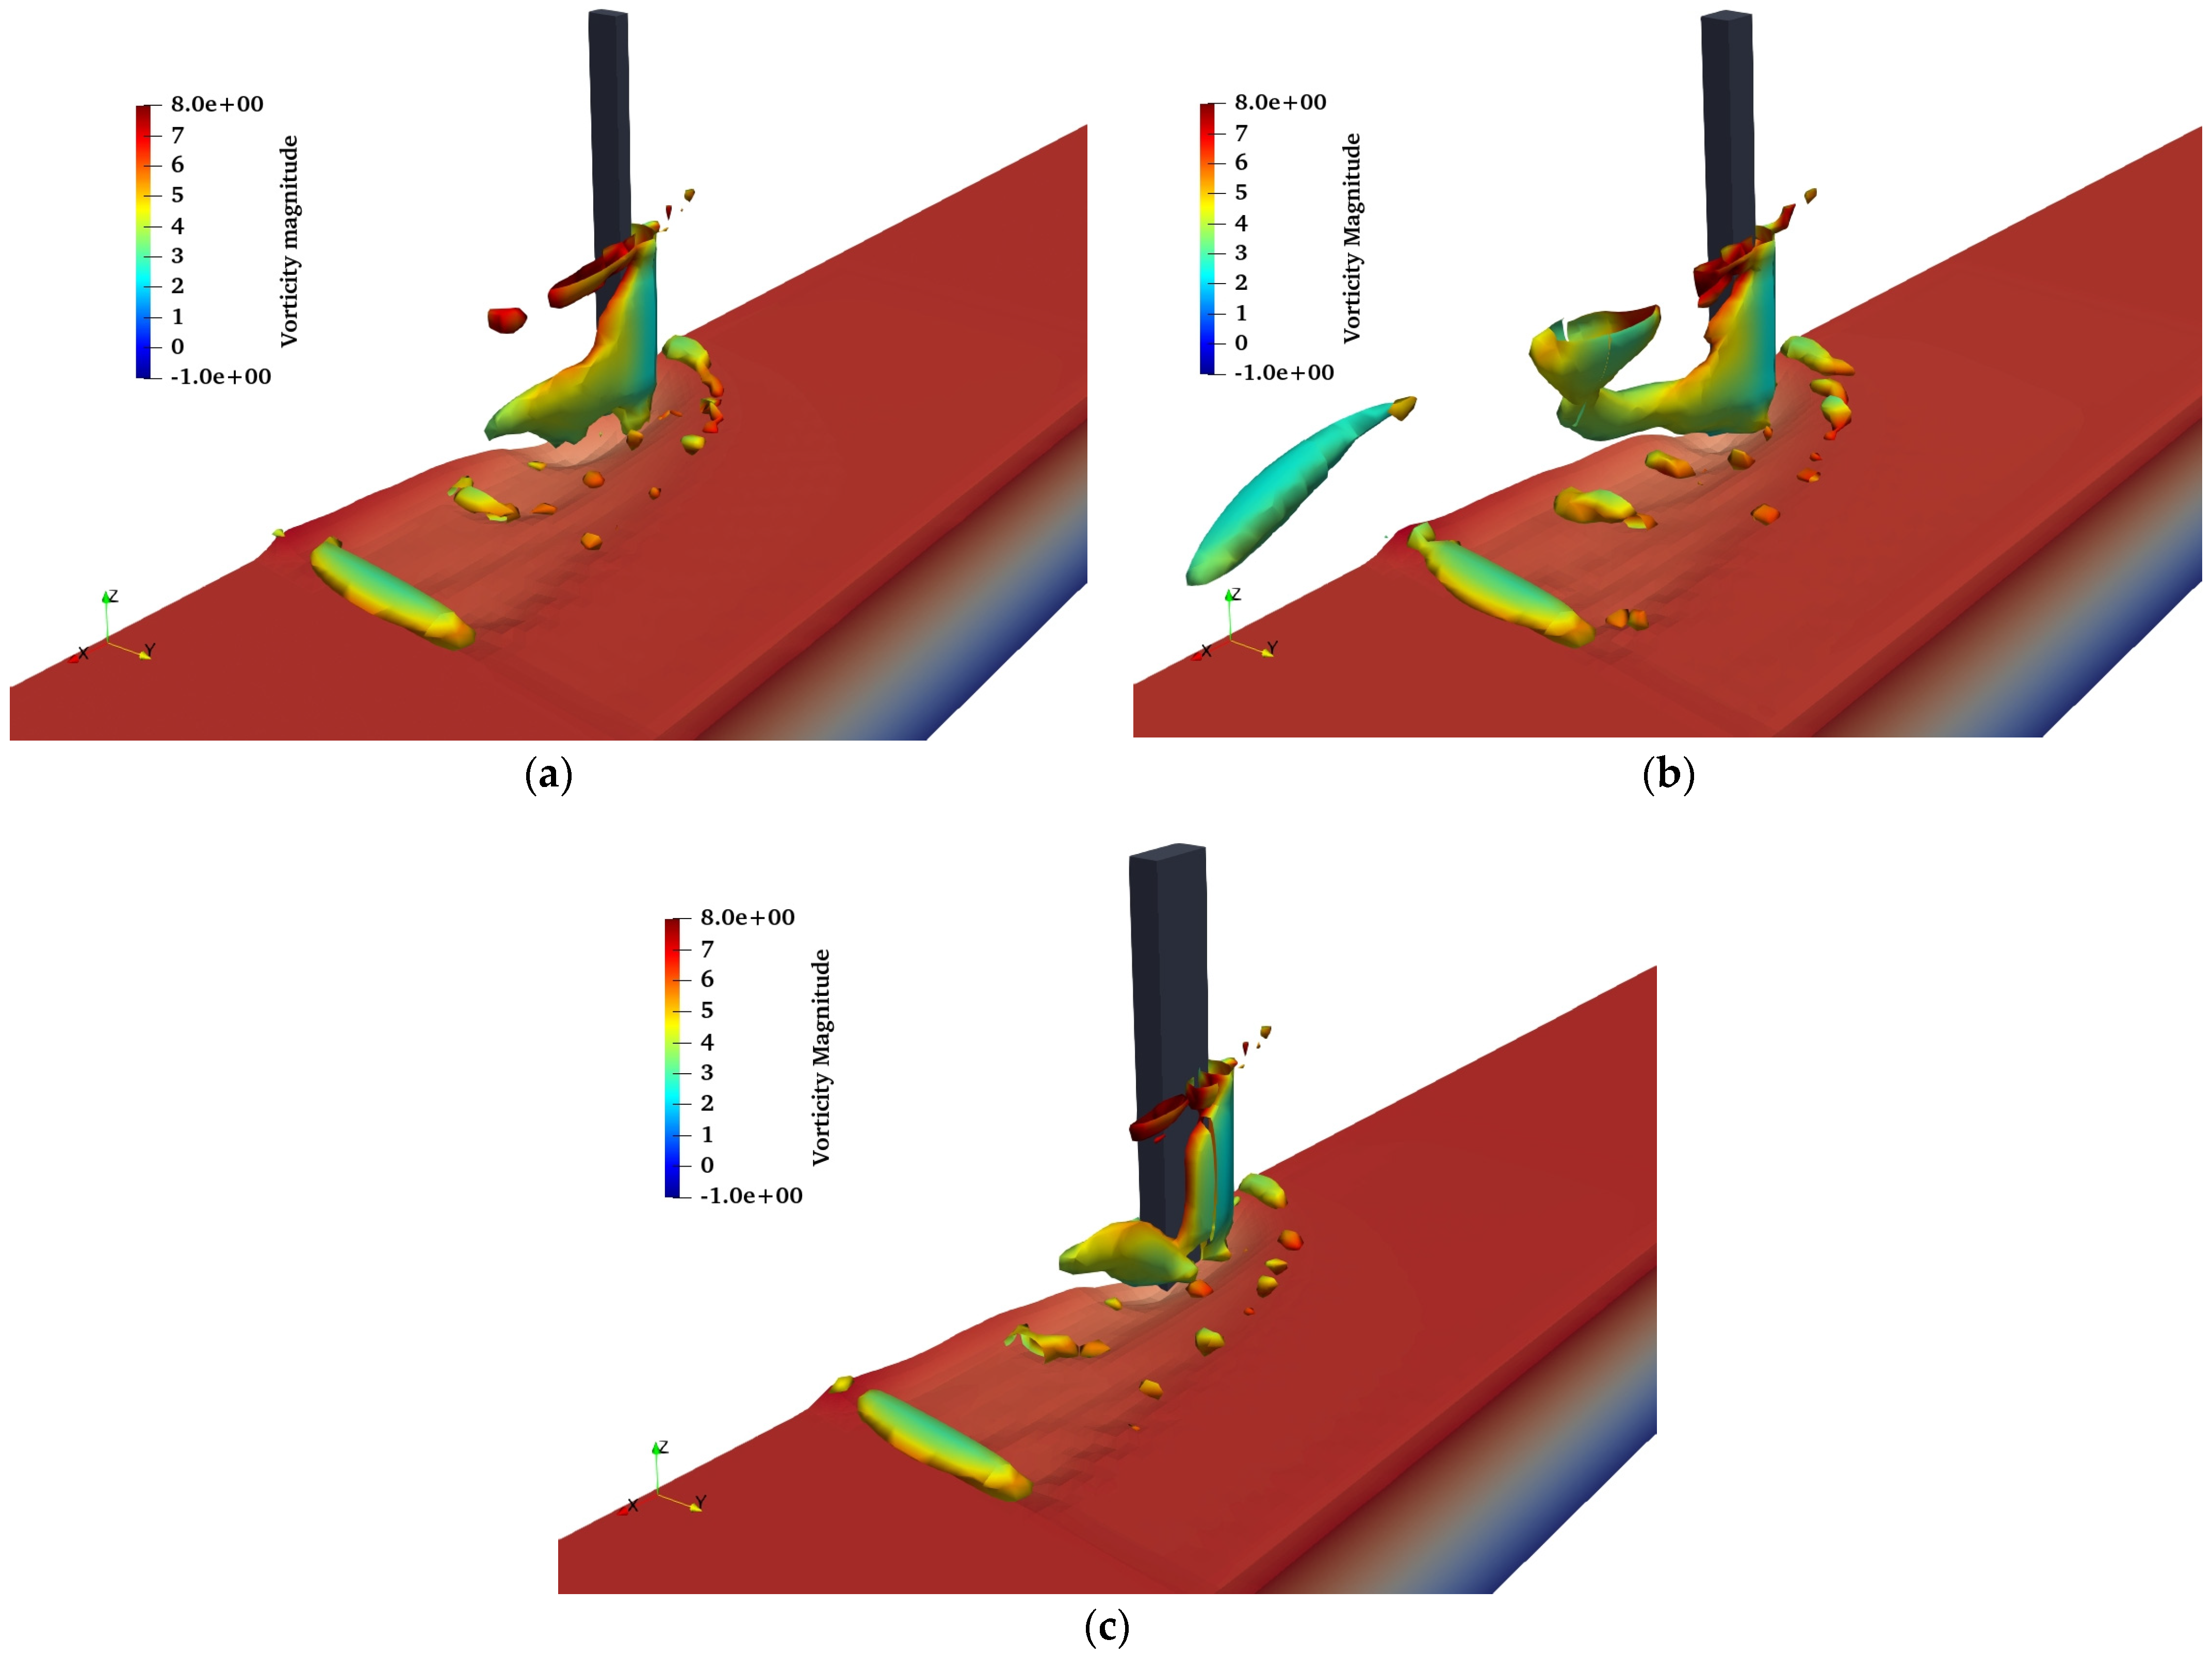
Figure 16 represents the vortical flow structures for different aspect ratios (
B:
L) of vertical wall abutments under steady current. It can be observed that the flow separation from the tip of the abutment leads to the development of small tube-like vortices. These vortices become larger as they move downstream and weaken as they distance themselves from their starting point, eventually reattaching to the vertical wall. The strong vortices near the obstruction’s front edge result from the separated shear layer of flow that starts from the upstream nose of the vertical wall abutment. The separated shear layer causes strong friction forces on the bed due to the high vertical vorticity, contributing to the development of local scour. Stronger vortices can be noted around a vertical wall abutment with an aspect ratio of 0.5 (shown in
Figure 16a), resulting in a larger scour depth. On the other hand, vertical wall abutments with an aspect ratio of 2 (shown in
Figure 16c) exhibit milder and more scattered vortices, leading to the formation of smaller scour depth [
60].
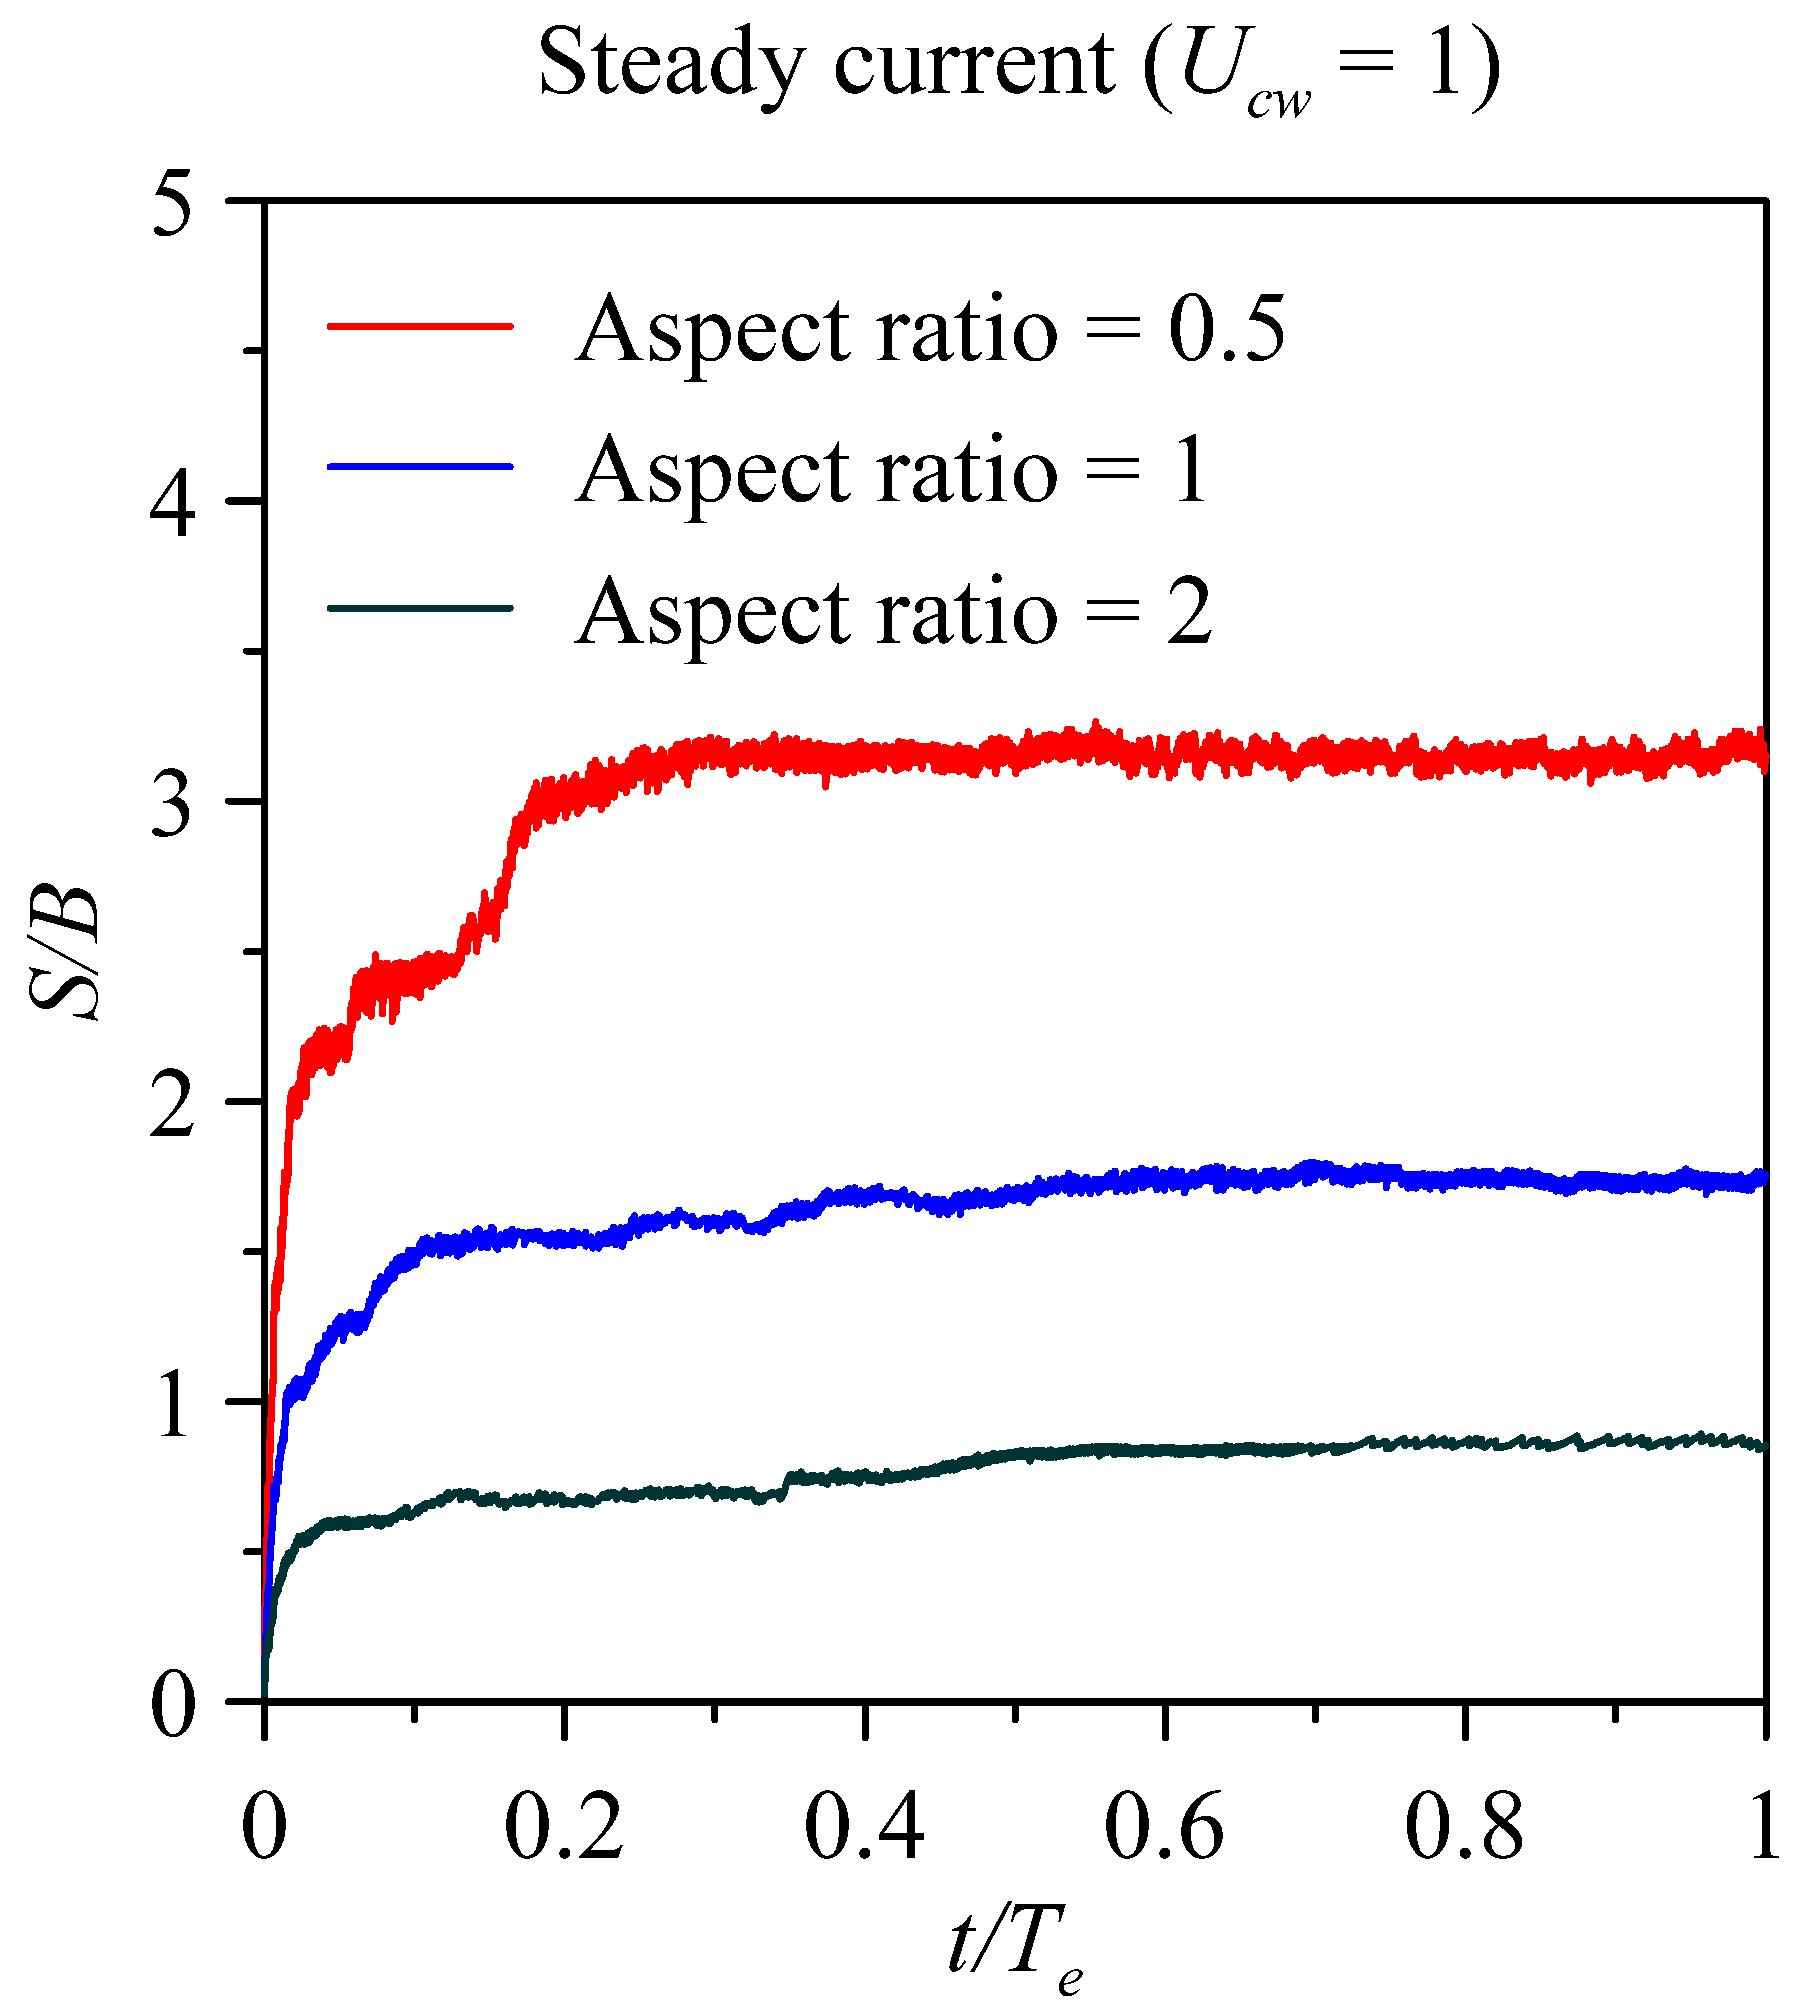
Figure 17 represents the time development of normalized scour depth (
S/
B) under steady current. The equilibrium scour depth was achieved for all the aspect ratios, with the maximum normalized scour depth occurring at an aspect ratio of 0.5 and a value of 3.15. Increasing the aspect ratio results in rapid changes in scour depth. The normalized scour depth values of 1.75 and 0.85 were observed for the aspect ratios of 1 and 2, respectively. The increase in aspect ratio decreases the equilibrium scour depth under a steady current. It can also be observed that a gentle increase in
S/
B values was observed with an increase in the
Ucw parameter.
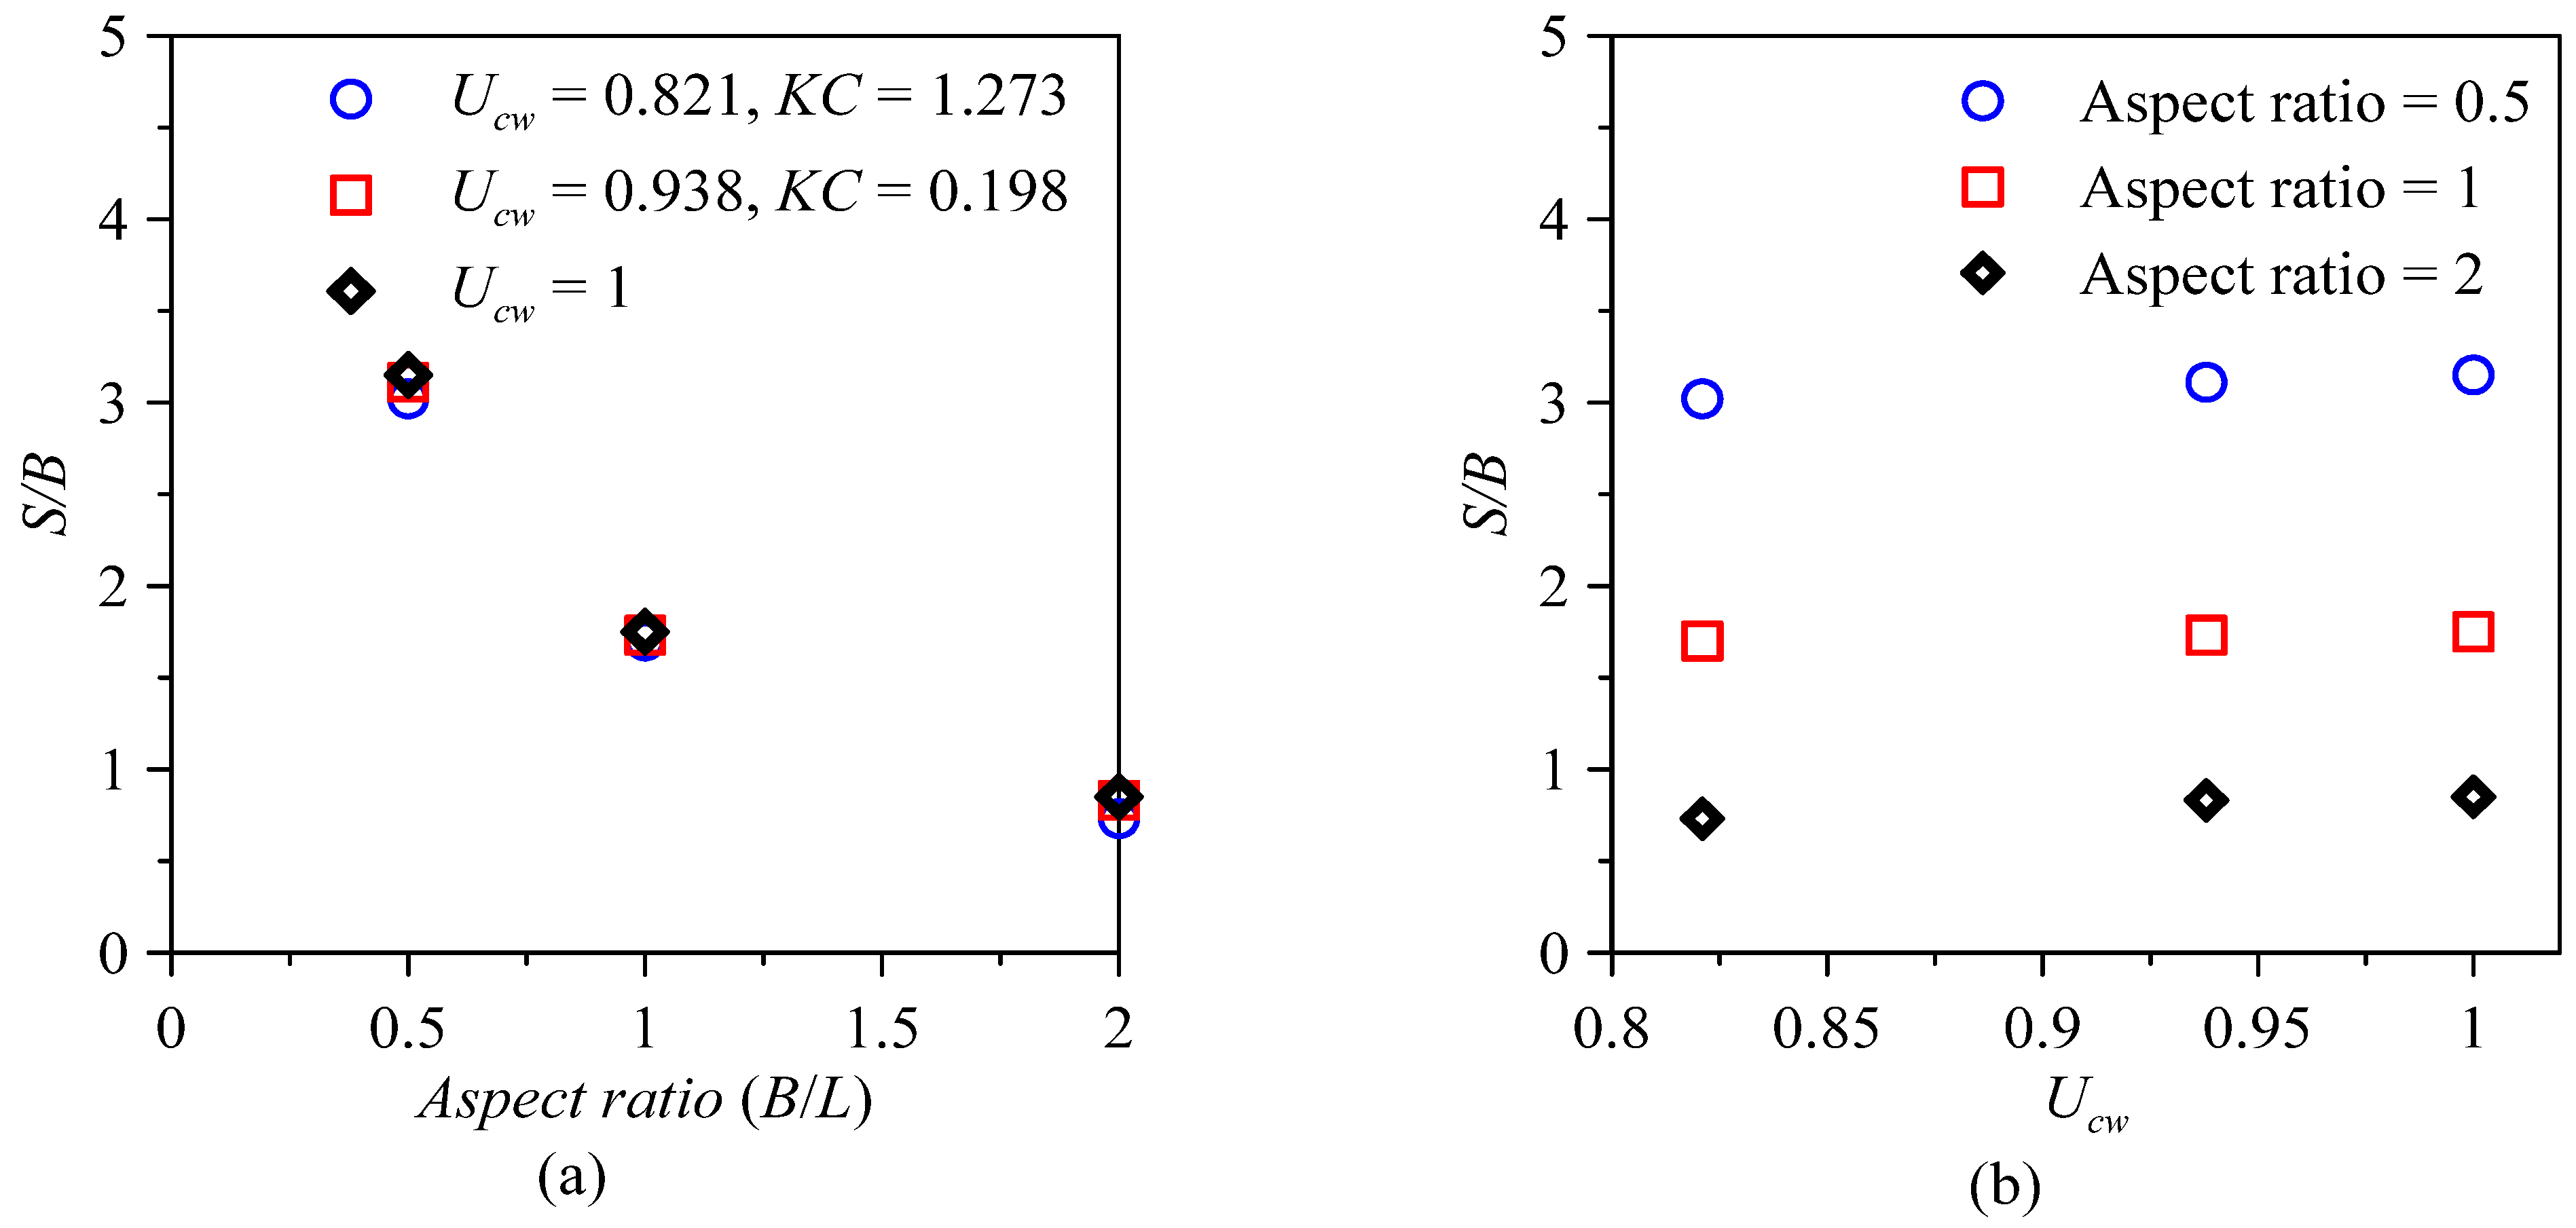
Figure 18a shows the variation of
S/
B value with the different aspect ratios 0.5, 1, and 2. The result indicates that the increase in aspect ratio decreases the
S/
B value. A rapid decrease can be observed in the
S/
B parameter as the aspect ratio increases from 0.5 to 1. However, a mild decrease can be observed in the
S/
B parameter as the aspect ratio increases from 1 to 2. Similarly,
Figure 18b shows the variation of
S/
B with the
Ucw parameter (0.821, 0.938, and 1). The result suggests that the increase in the
Ucw parameter increases the
S/
B values. The maximum normalized scour depth (
S/
B) was observed in the case of a steady current, which is similar to the findings of Sumer and Fredsoe [
17].
The observed trend of decreasing equilibrium scour depth with increasing aspect ratio (B/L) for both steady current and combined wave–current flows in the present study can be attributed to several key physical mechanisms. As the aspect ratio increases, alterations in flow patterns occur, with longer abutments in the flow direction inducing flow acceleration along the abutment face and deceleration downstream. This variation in flow velocity profiles generates turbulence in the scour zone, intensifying sediment resuspension and transport. Longer abutments also tend to trap sediments along the abutment face and in the scour hole, reducing their downstream transport. Additionally, secondary flow patterns and the interaction between waves and currents further enhance turbulence and sediment mobility. Collectively, these factors contribute to the consistent decrease in equilibrium scour depth observed in the present study. This finding highlights the importance of considering abutment aspect ratios in scour studies, shedding light on the complex interplay between flow conditions and abutment geometry in bridge scour phenomena.
The present study has investigated the scour around vertical wall abutment of varying aspect ratios (B/L) under the combined wave–current flows. It can be observed that the vertical wall abutment with aspect ratios of 0.5 are susceptible to deeper scour depths due to increased turbulence and the formation of robust primary vortex structures, emphasizing the need for enhanced protective measures and thoughtful design choices in such scenarios. Conversely, vertical wall abutments with higher aspect ratios exhibit reduced scour potential, offering potential cost savings in engineering projects. The innovative use of the Level Set Method for the precise tracking of free surfaces and sediment beds sets the present study apart and serves as a basis for improved modeling approaches in scour prediction. The present study enhances the understanding of scour phenomena around vertical wall abutments under combined wave–current flows and provides a foundation for more resilient and cost-effective abutment designs and protection strategies in the future.
4. Conclusions
The present study has employed numerical simulations to examine the scour mechanism at vertical wall abutments with varying aspect ratios in the combined effect of waves and currents. To explore the scour phenomenon at vertical wall abutments, an open-source code (REEF3D) was utilized. REEF3D operates in a fully three-dimensional manner, allowing it to simulate the intricate dynamics of scouring effectively. The developed numerical model incorporates the LSM to represent the free surface and sediment bed realistically. To ensure the reliability and accuracy of the numerical model, numerical results were tested against the experimental observations of combined wave–current-induced abutment scour. The model’s predictions closely matched the time development of abutment scour depths observations, showcasing a noteworthy level of agreement.
Further, the validated model was utilized to examine the effect of aspect ratios of vertical wall abutments under different
Ucw parameters. In the present study, the results suggest that the increase in aspect ratio decreases the
S/
B values. Analysis indicated that the
S/
B values increases with the increase in the
Ucw parameter, irrespective of the
KC number. The increase in the
Ucw parameter increases the
S/
B values mainly due to the formation of strong HSV and lee wake vortices around the abutment. These findings are verified through vorticity magnitude plots that show the vortical flow structures. The maximum normalized abutment scour depth can be observed in the case of steady currents, which is similar to the results reported by Kumar and Afzal [
39] and Sumer and Fredsoe [
17]. These findings can prove valuable in designing hydraulic structures in the strong current-dominated combined wave-current flow.


