

Impact of Spatial Segmentation on the Assessment of Coastal Vulnerability—Insights and Practical Recommendations

 , and
, and
Abstract
:1. Introduction
2. Materials and Methods
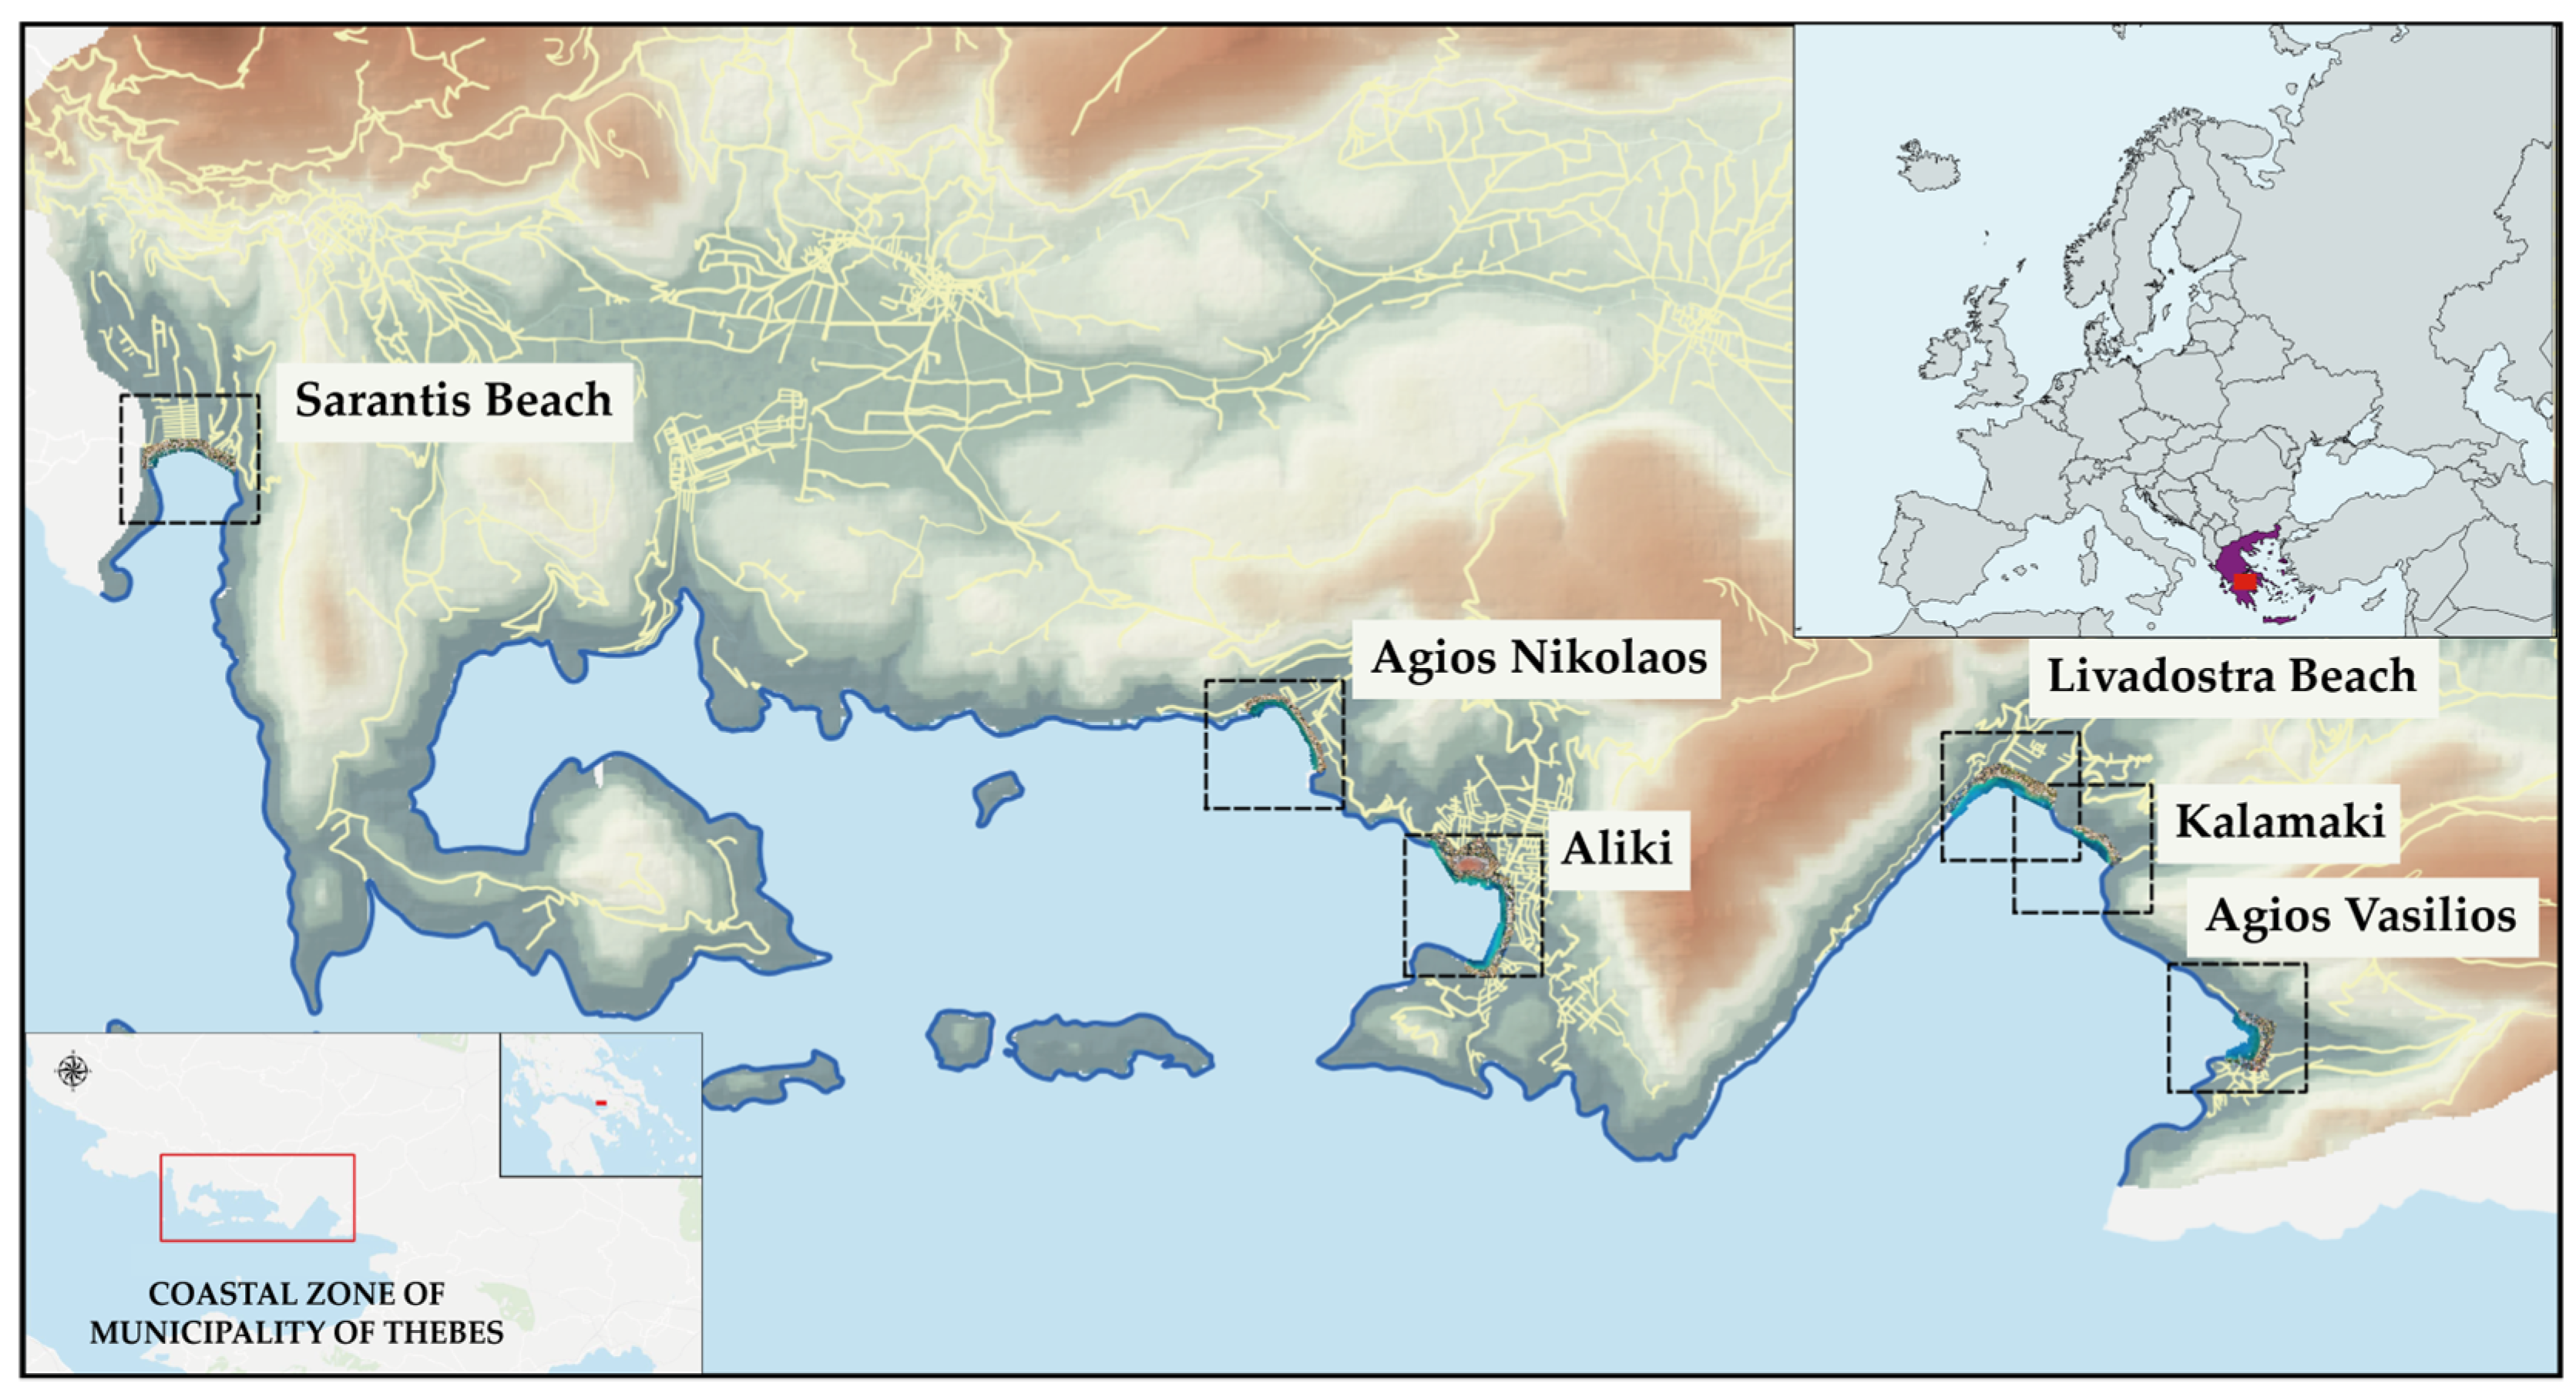
2.1. Study Area
2.2. Research Methodology
2.2.1. Vulnerability Framework
- The geomorphology (a) was subdivided into three distinct parameters: seabed sediment thickness, beach sediment, and distance from major faults, coded as P1, P2, and P3, respectively.
- The coastal slope (c) was subdivided into two parameters: land slope and marine slope, coded as P5 and P6, respectively.
- The mean wave height (e) was modified to incorporate the mean significant wave height, represented by the parameter P10. This parameter provides an indication of the mean annual wave conditions within the study area. Additionally, the extreme wave height was accounted for and coded as P11. Both parameters fall under the category of wave characteristics.
- The sea level variations (f) were subdivided into two parameters: mean range of astronomical tide (P8) and storm surge (P9).
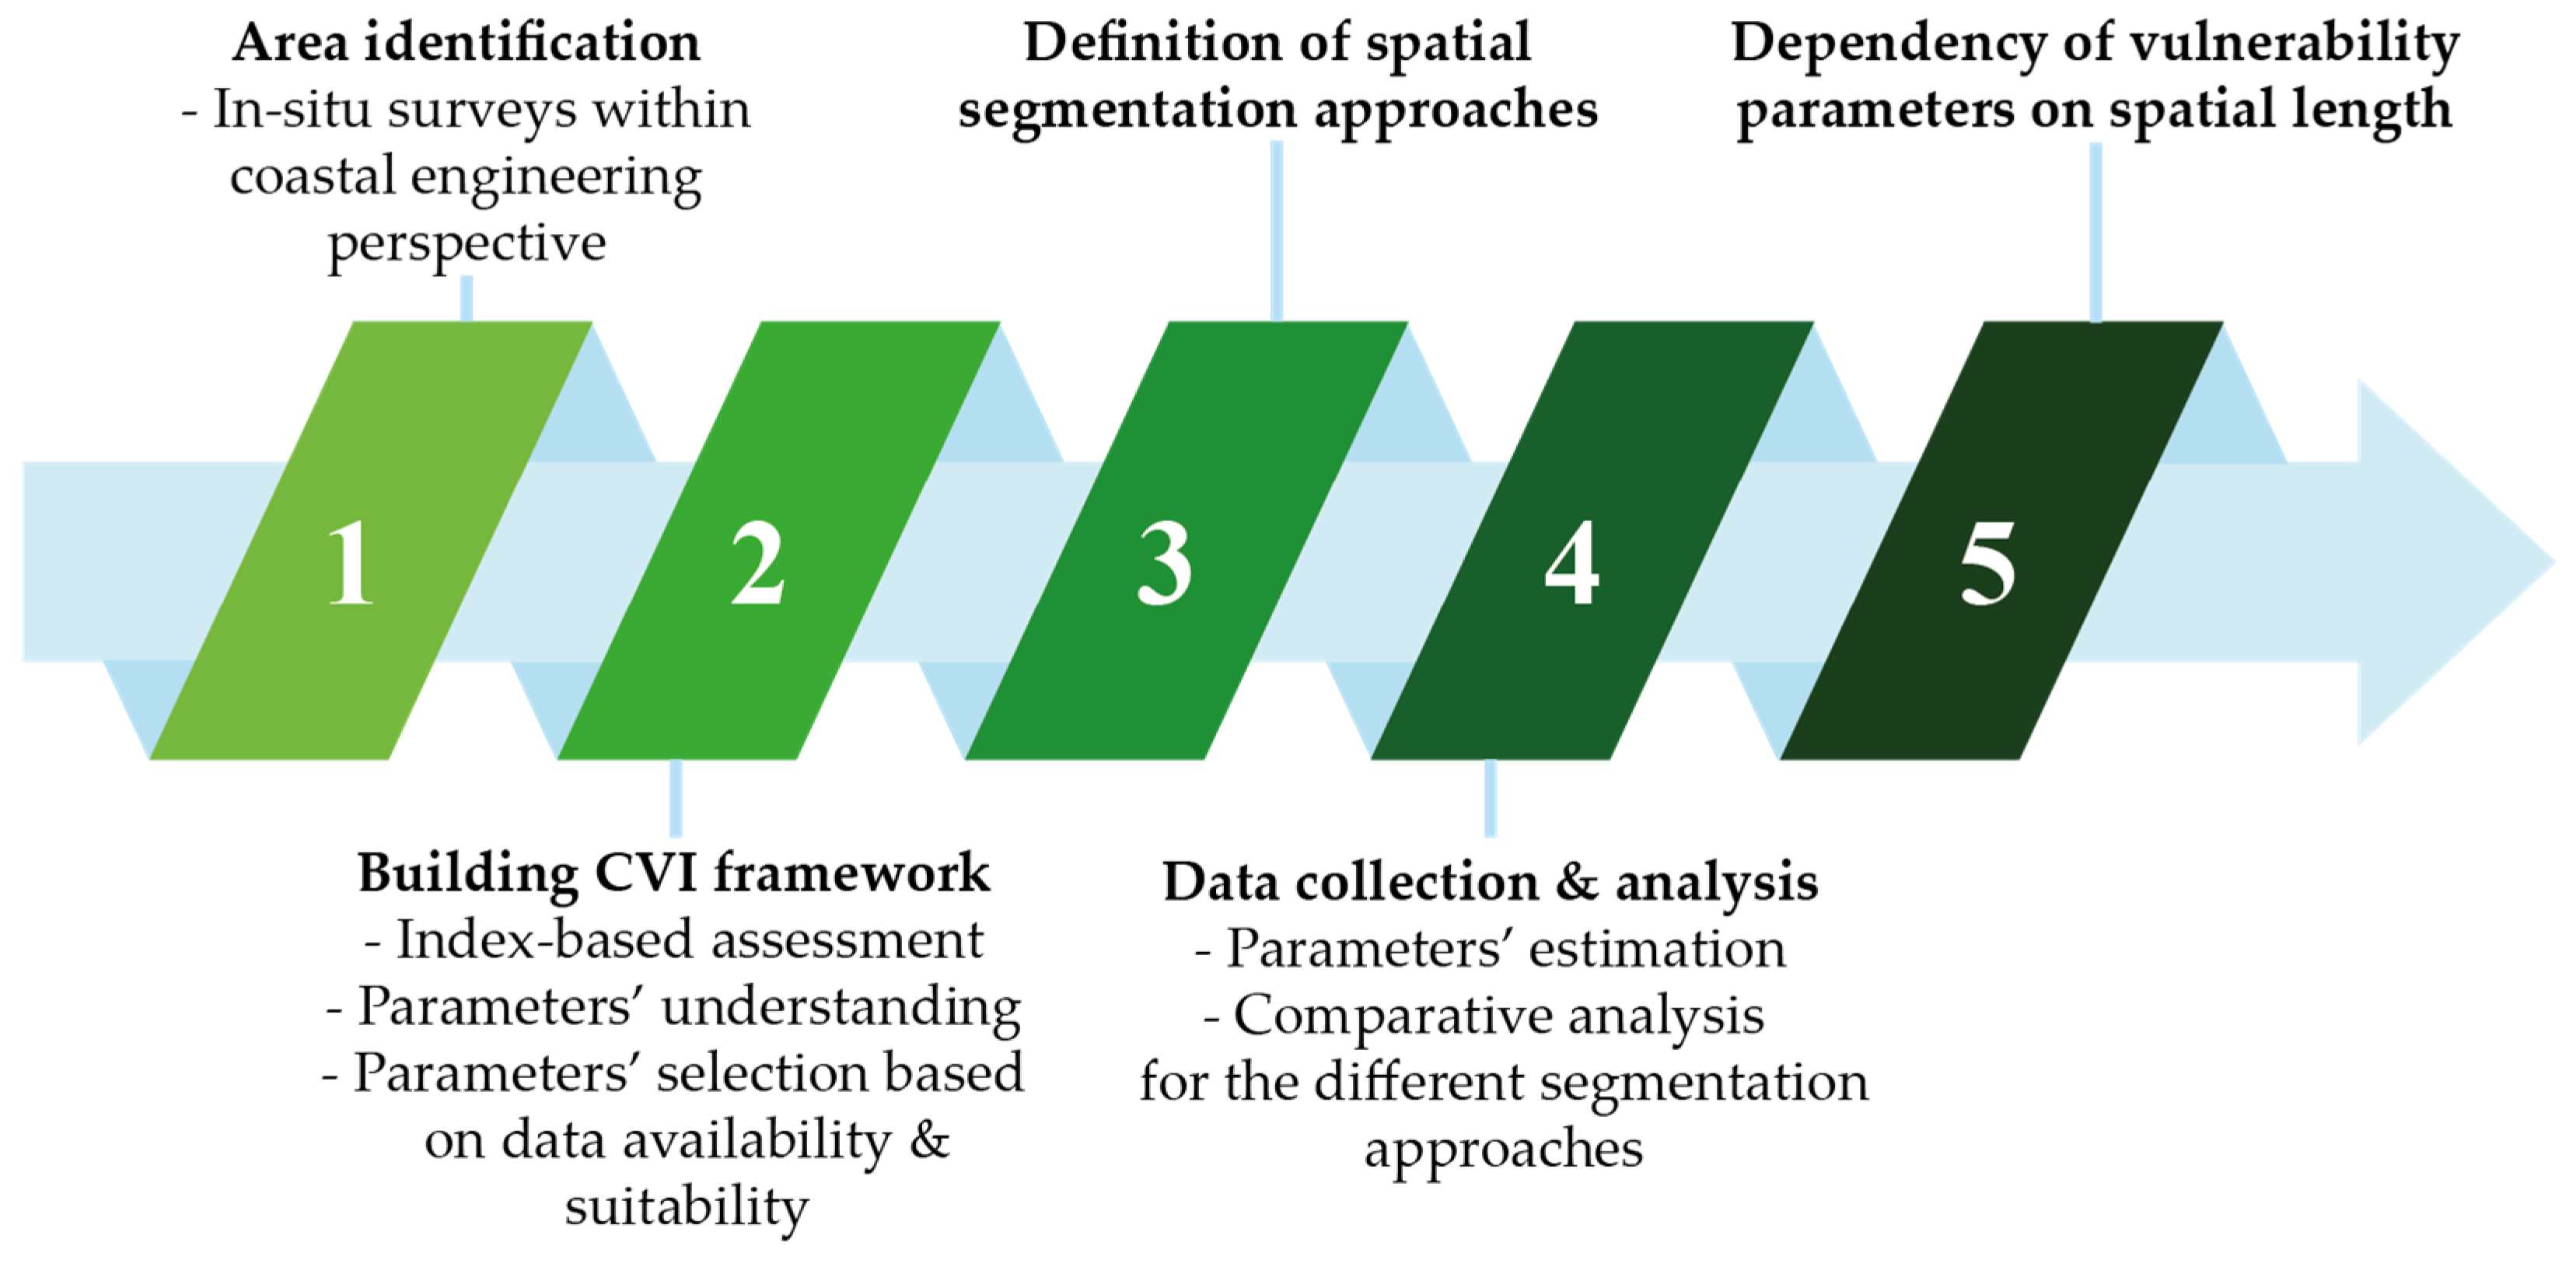
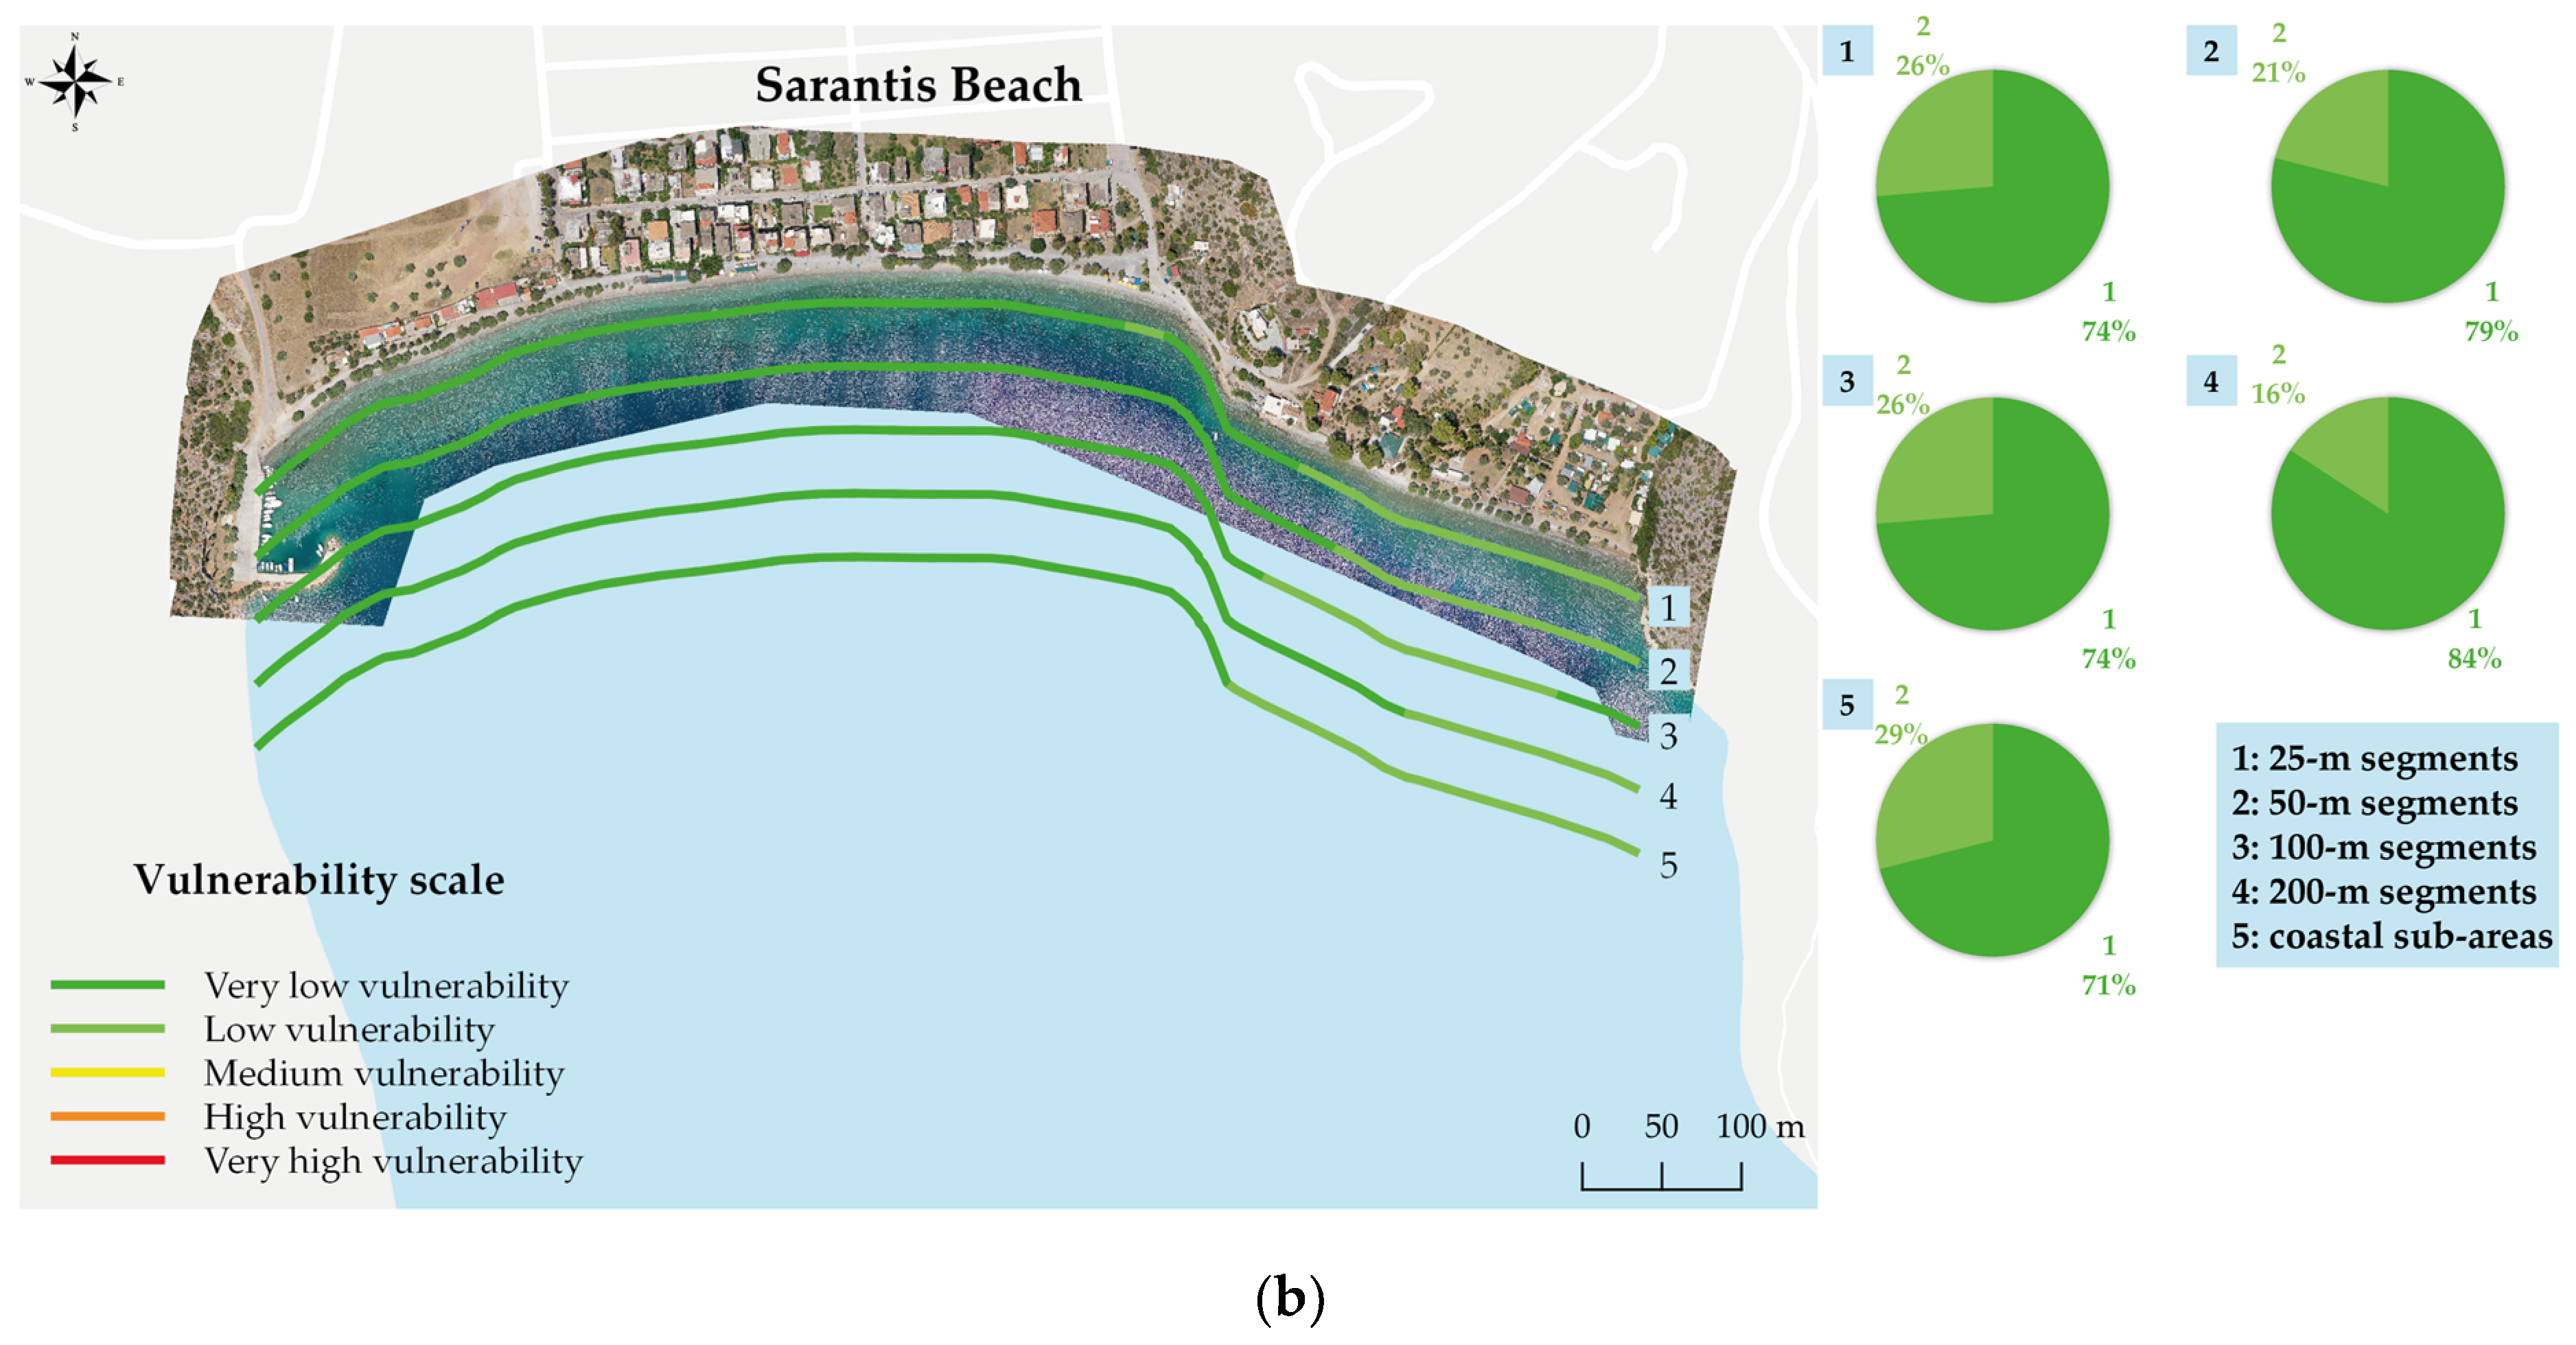
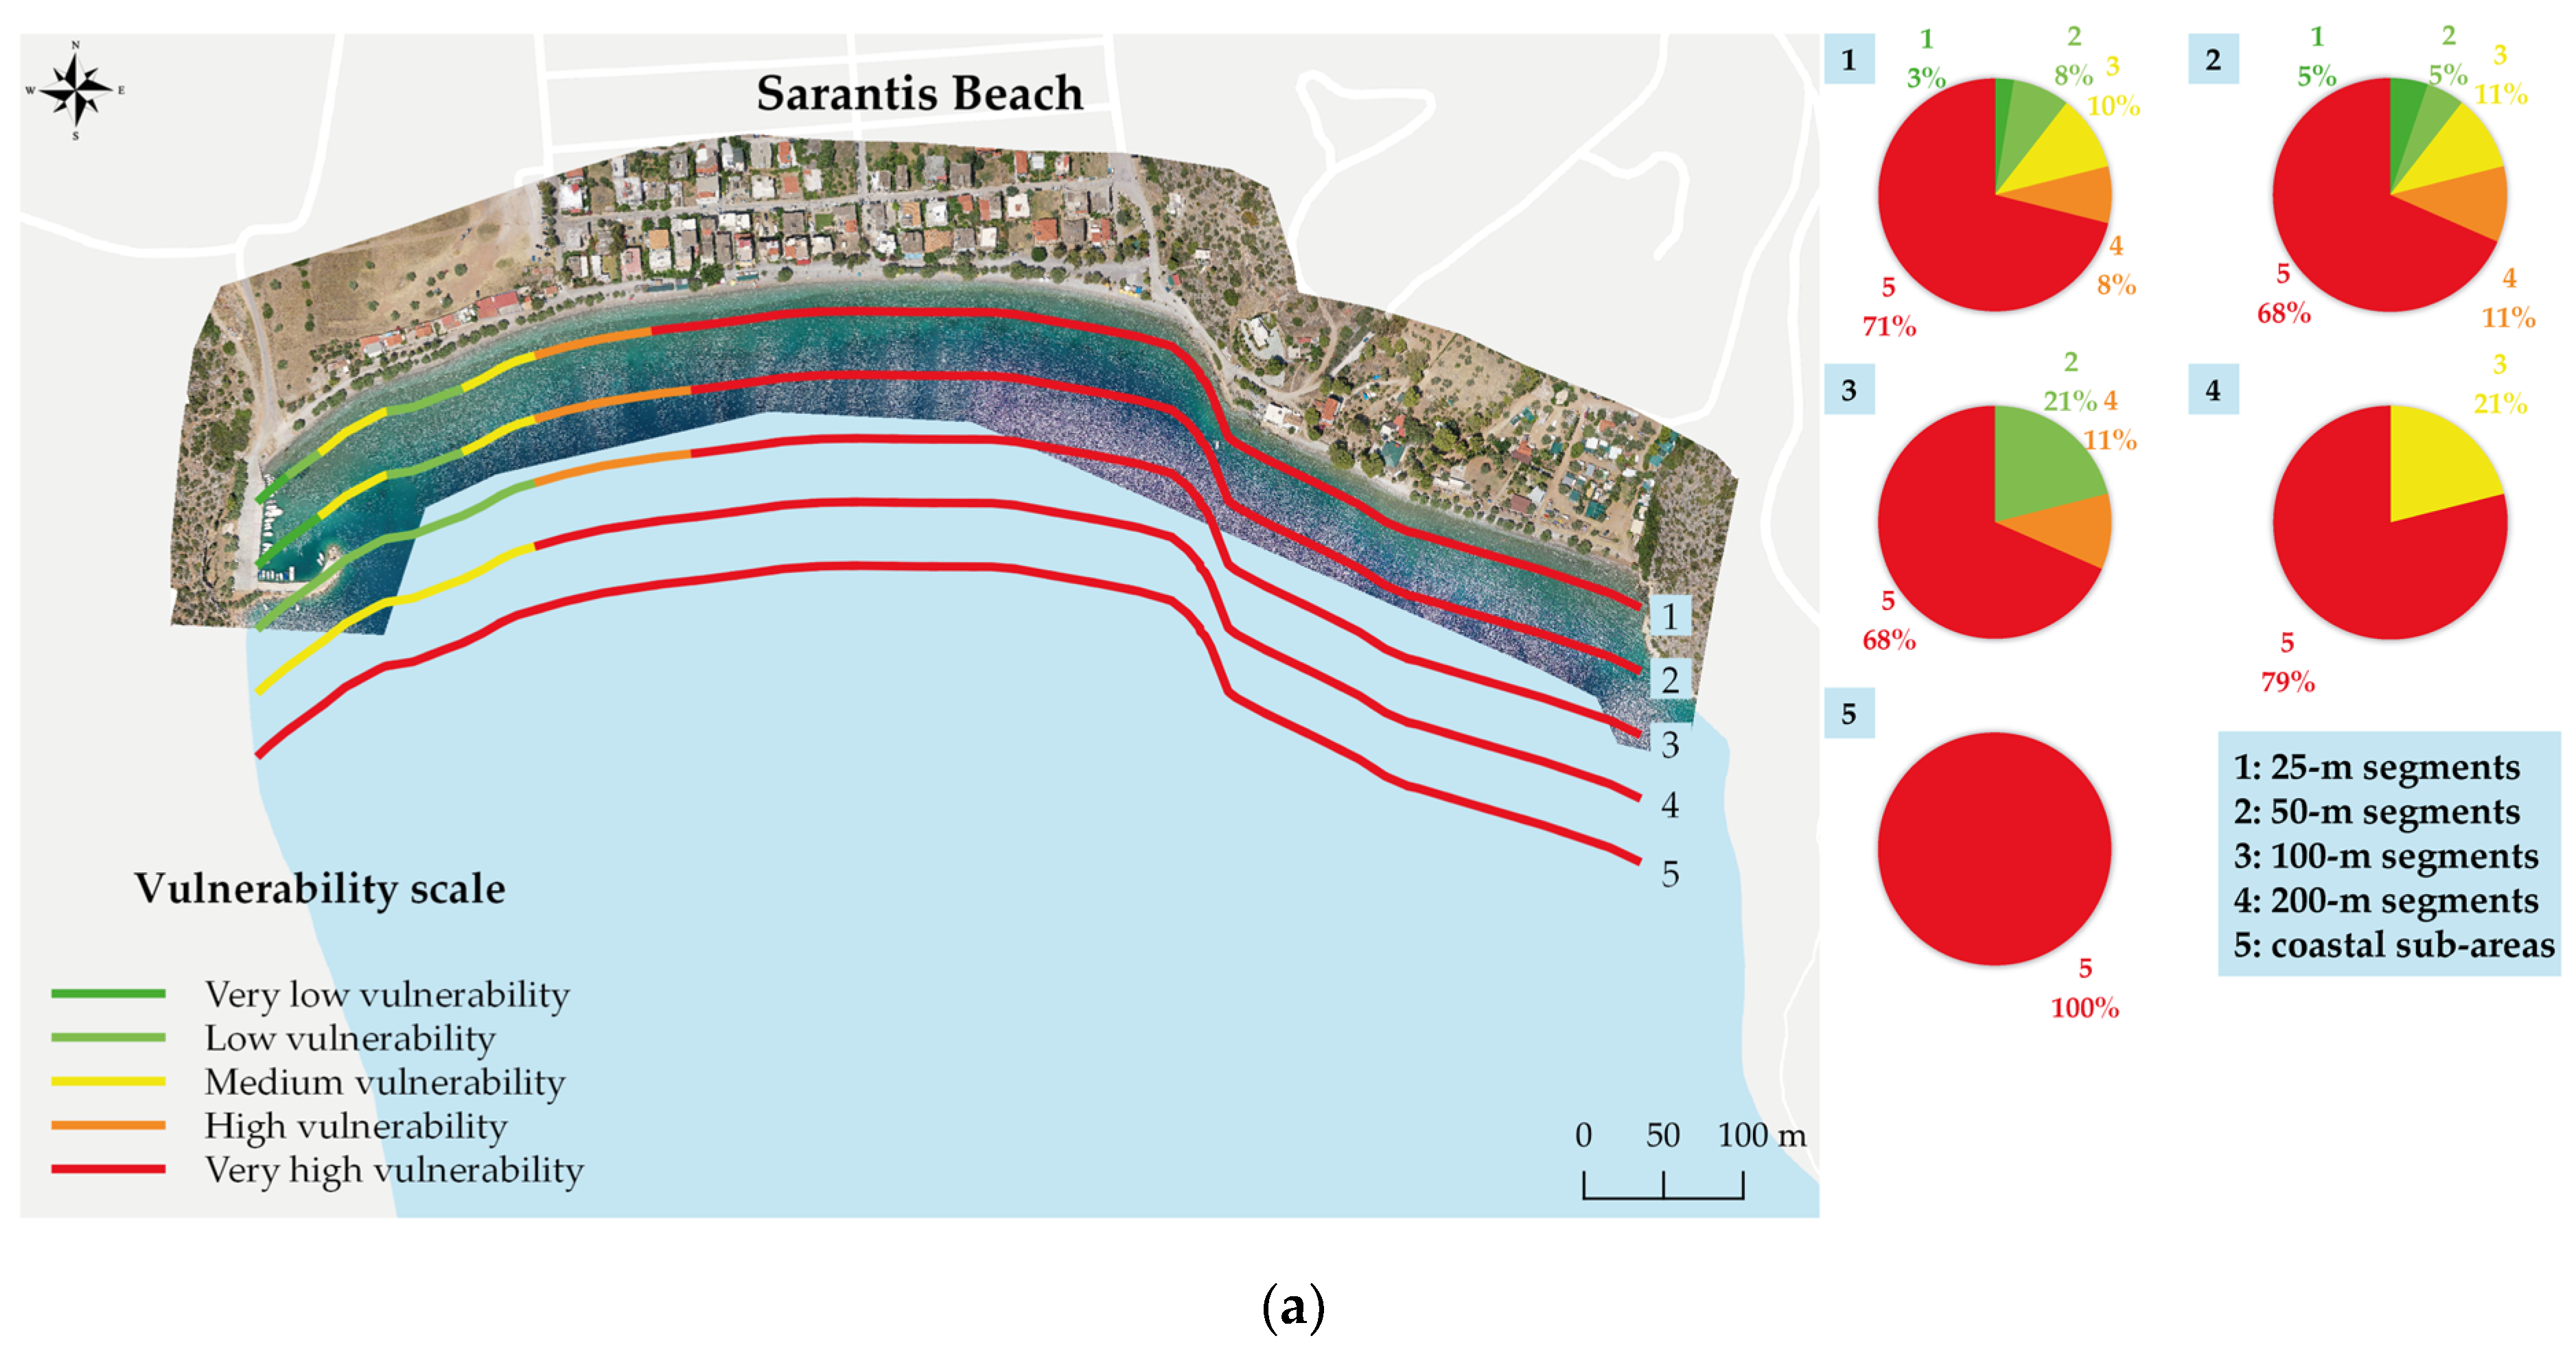
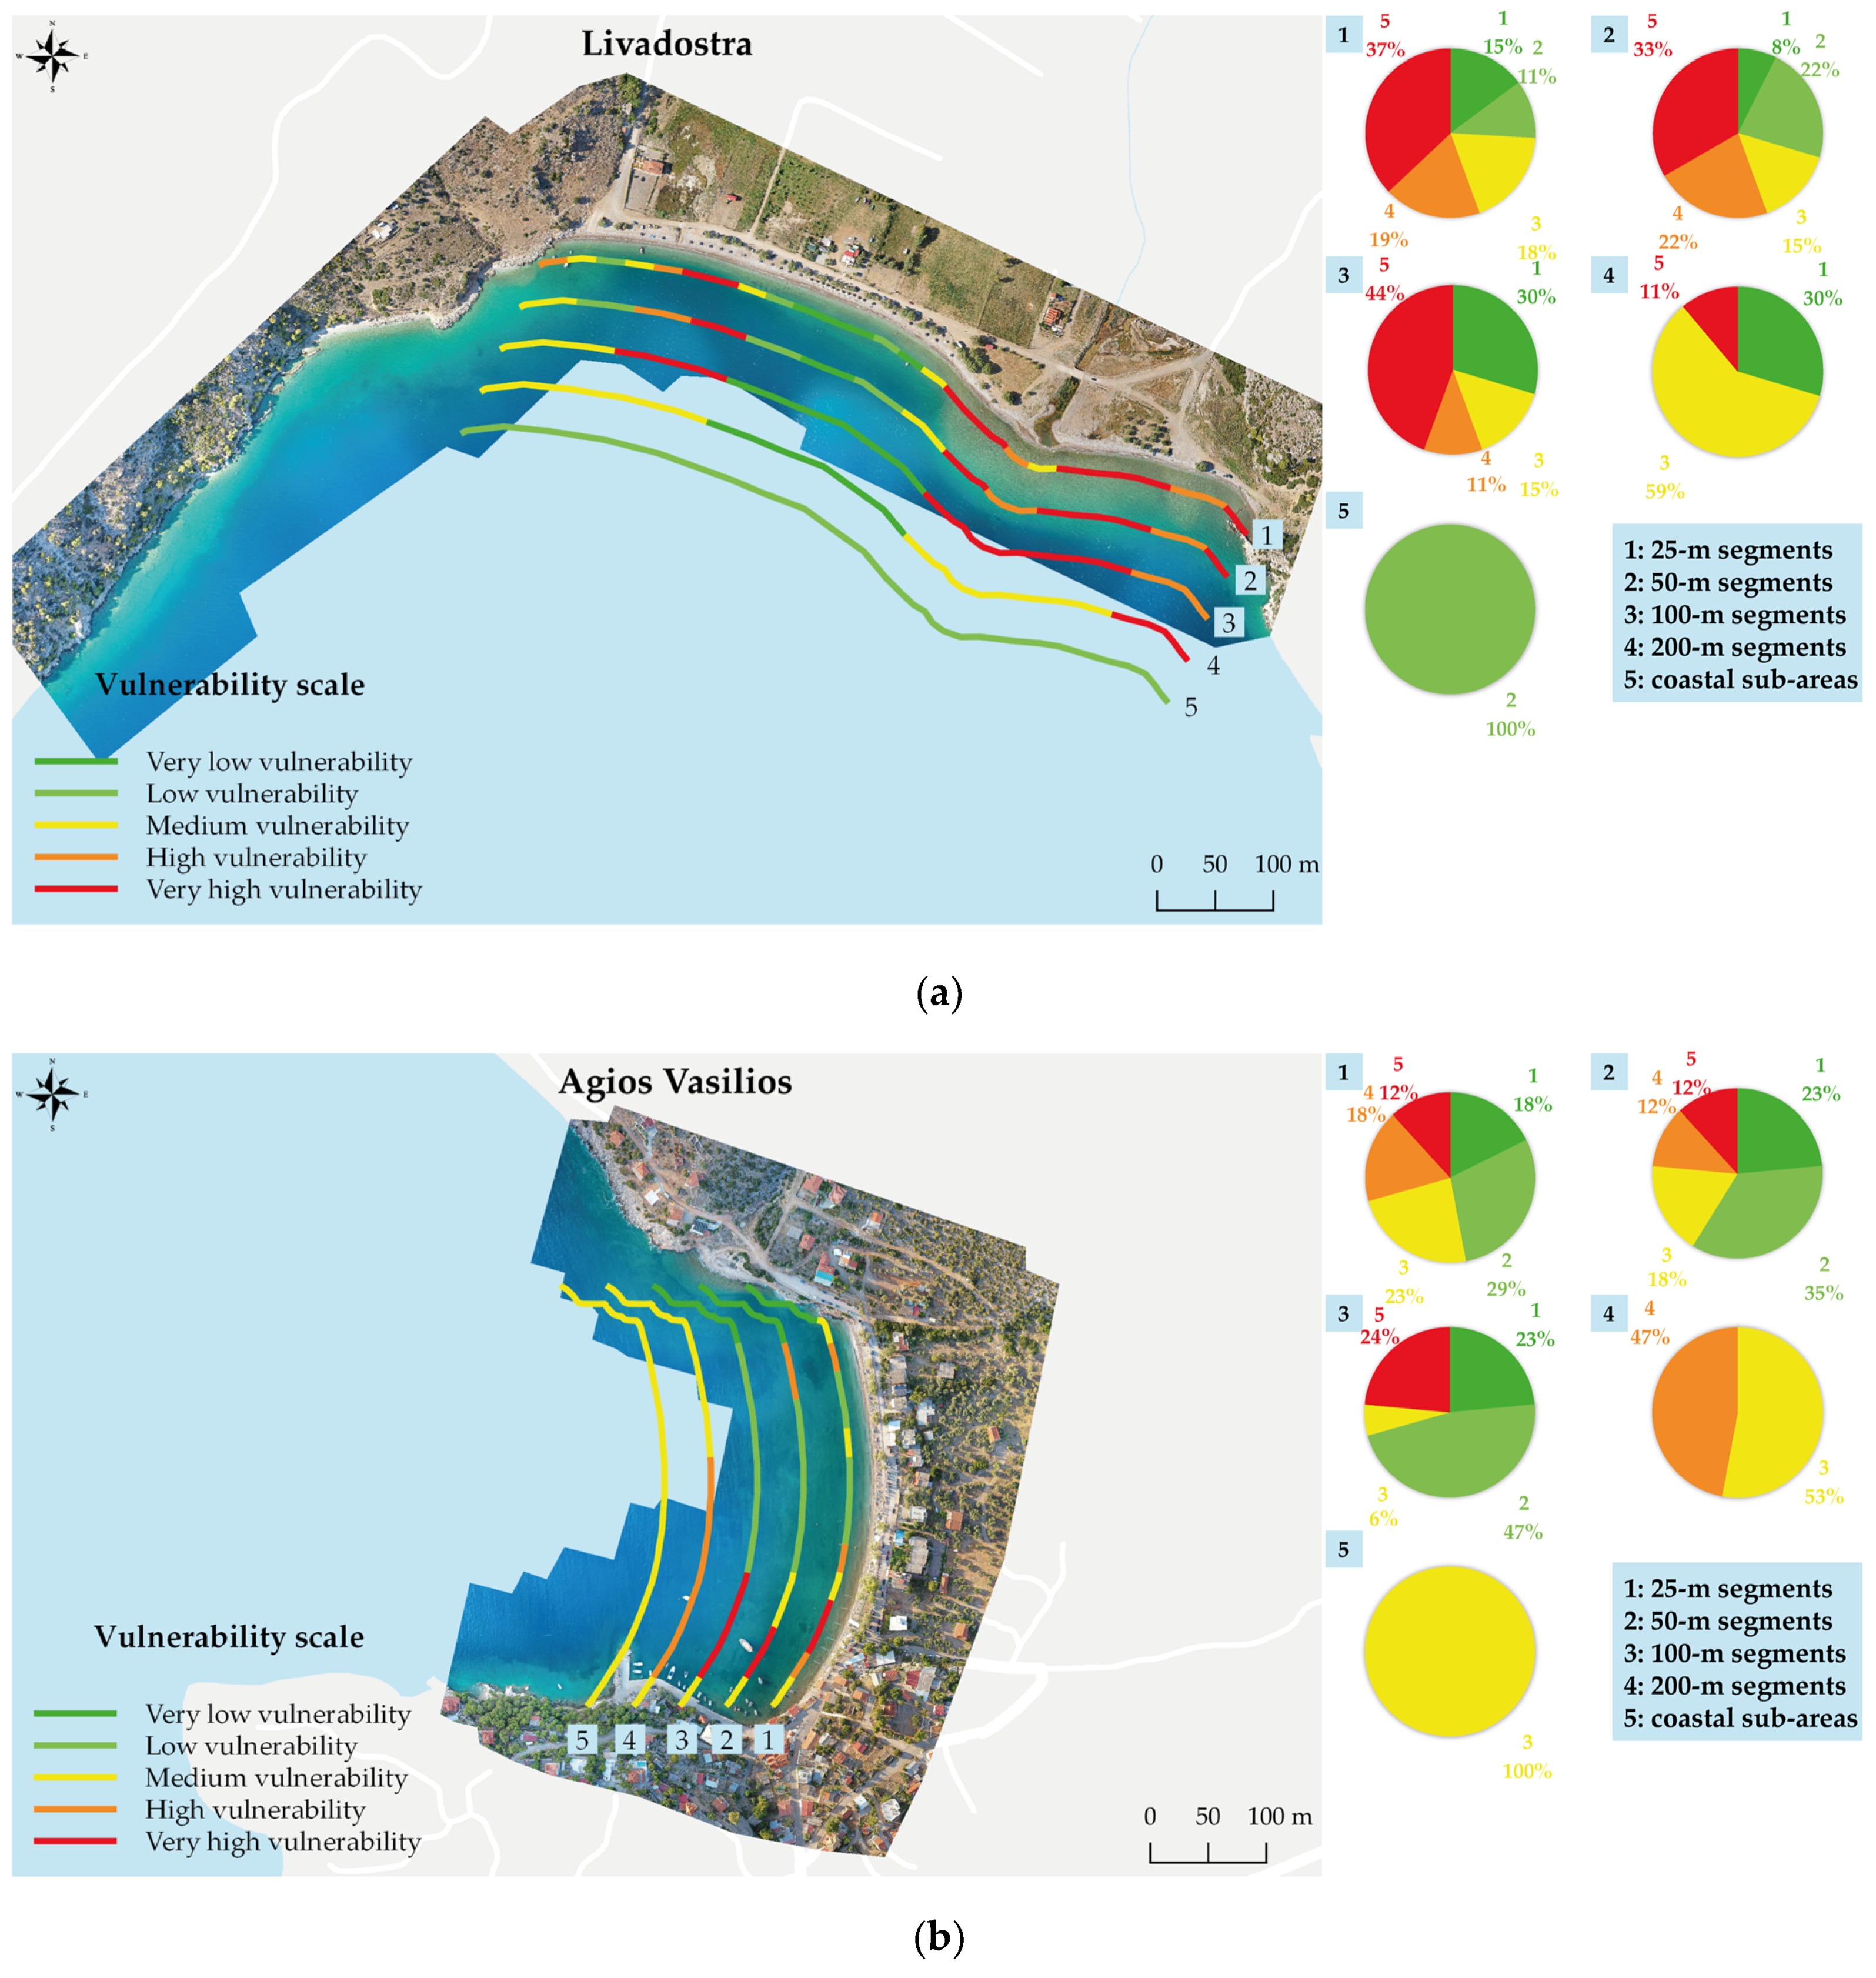
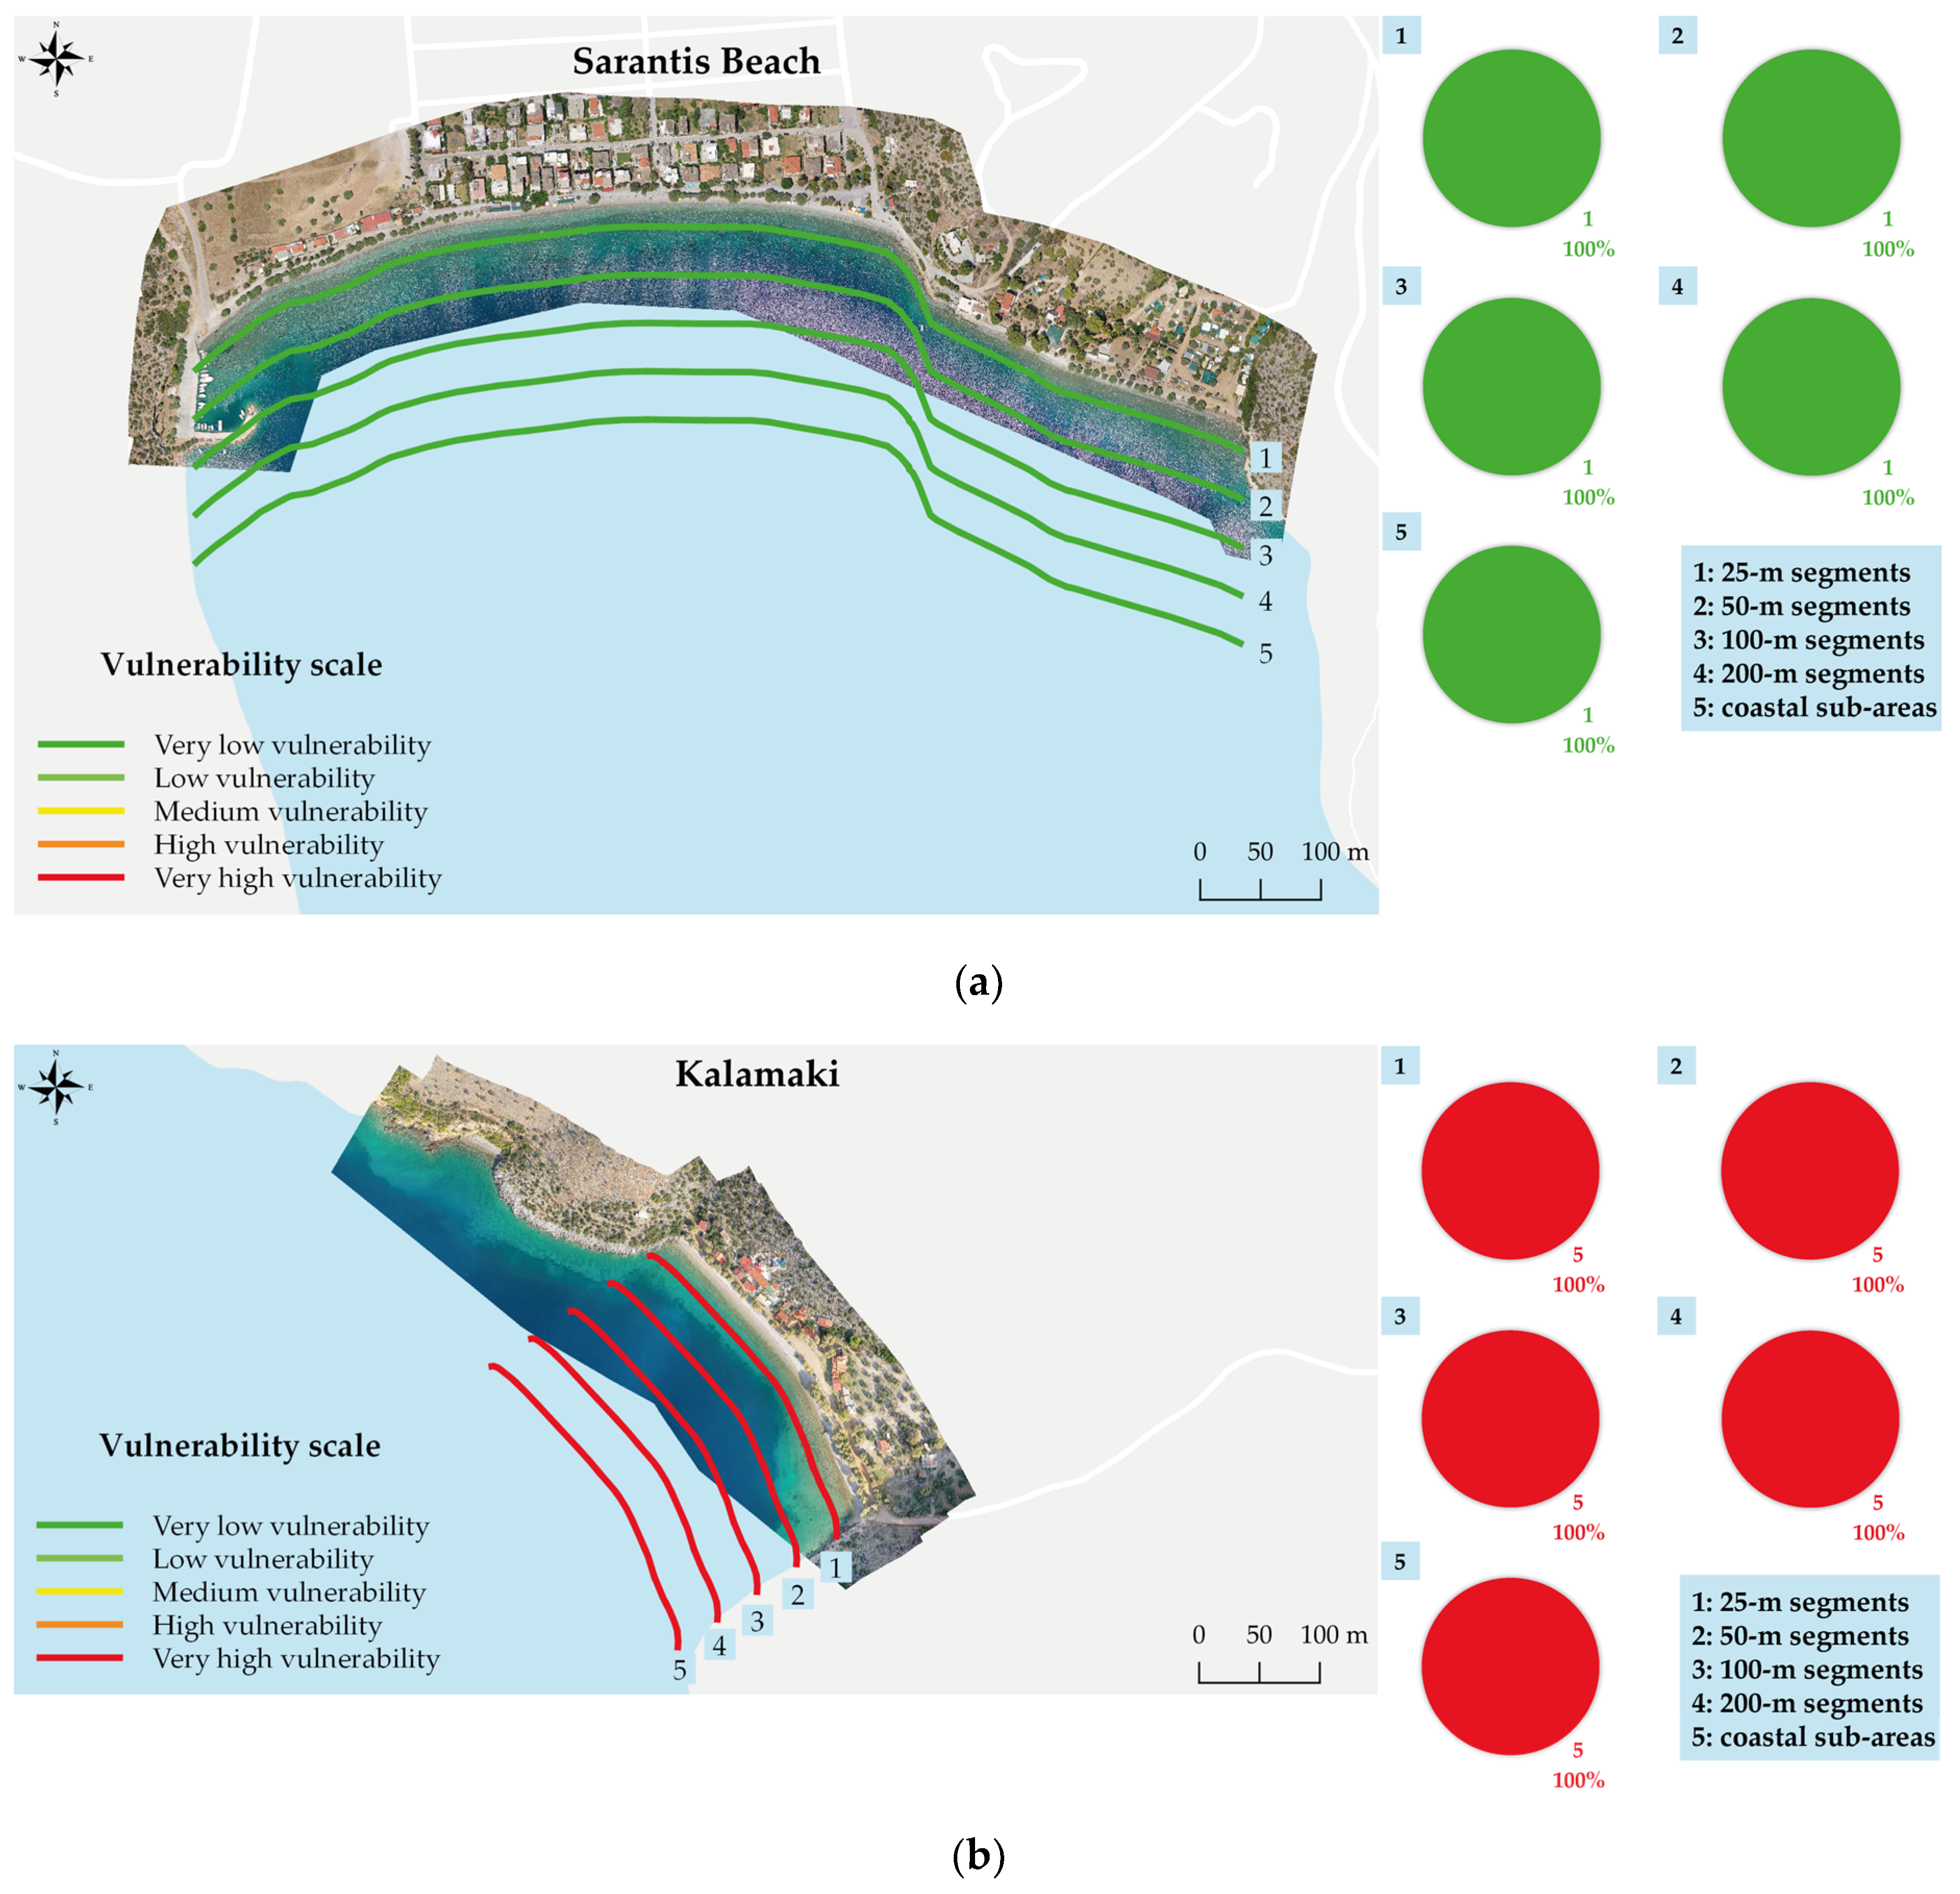
2.2.2. Spatial Segmentation Approaches
- Dividing each coastal area into 25 m segments
- Dividing each coastal area into 50 m segments
- Dividing each coastal area into 100 m segments
- Dividing each coastal area into 200 m segments
- Dividing each coastal area into sub-areas based on significant and noticeable variations observed along the coastal area (e.g., presence of human activities and morphological features, a process typically undertaken in coastal engineering studies, leading to division into independent littoral cells) (Figure 3).
2.2.3. Estimation of Vulnerability Parameters

| Parameter | Method | Current Vulnerability | Future Vulnerability | Change between the Coastal Areas |
|---|---|---|---|---|
| P1: Seabed sediment thickness | Digitization/rasterization of the results of [38] with GIS tools | ● | ● |  |
| P2: Beach sediment | In situ inspections conducted by the research team members, including visual inspection and evaluation, as well as collection of sample materials for further assessment | ● | ● | |
| P3: Distance from major faults | Open-data sources (https://zenodo.org/record/4897894 (accessed on 28 April 2023)) and GIS tools | ● | ● | |
| P4: Shoreline evolution | Use of DSAS methodology [39] by analyzing aerial imagery acquired by both the Hellenic Military Geographical Service (HMGS) for three different years, 1945, 1969, and 1992, and the UAV flights conducted in the year 2021. | ● | ● | |
| P5: Land slope | Generation of DEMs by the orthophotos provided by the Hellenic Cadastre. | ● | ● | |
| P6: Marine slope | Digitization of the bathymetrical data acquired by the database “Corine Land Cover (CLC)-Copernicus Land Monitoring Service” (https://land.copernicus.eu/ (accessed on 28 April 2023)). | ● | ● | |
| P7: Sea level rise due to climate change | Use of the metocean database Copernicus Climate Data Store (https://cds.climate.copernicus.eu/) by using the product: “Water level change time series for the European coast from 1977 to 2100 derived from climate projections” (https://cds.climate.copernicus.eu/cdsapp#!/dataset/sis-water-level-change-timeseries (accessed on 24 April 2023)). | - | ● | - |
| P8: Mean range of the astronomical tide | Use of data from the sea level recorder (tide gauge) at the Port of Posidonia acquired by the Hellenic Navy Hydrographic Service (HNHS) | - | - | - |
| P9: Storm surge | Calculation based on the formulation of [40] | ● | ● | |
| P10: Significant wave height | Extraction at a nearshore depth of 10 m utilizing wind measurements from HNMS (http://www.emy.gr/emy/en/index_html? (accessed on 6 April 2023)) and performing numerical modeling of wave propagation | ● | ● | |
| P11: Extreme significant wave height | Extraction at a nearshore depth of 10 m utilizing wind data with a 50-year return period [41] and performing numerical modeling of wave propagation. | ● | ● | |
| P12: Cross-shore profile erosion | Based on the formulation of [42] | ● | ● | |
| P13: Beach width | Photointerpretation of the orthophotos | ● | ● | |
| P14: Distance from vegetation | Photointerpretation of the orthophotos | ● | ● | |
”denote the integration of the parameter into the current and/or future vulnerability assessment and whether the values are changing between the coastal areas, respectively. On the contrary, the symbol “-“ denotes that the specific parameter was not considered in the current and/or future vulnerability assessment, and its value was the same for all coastal areas.3. Results and Discussion
3.1. Overview of Obtained Vulnerability Parameters
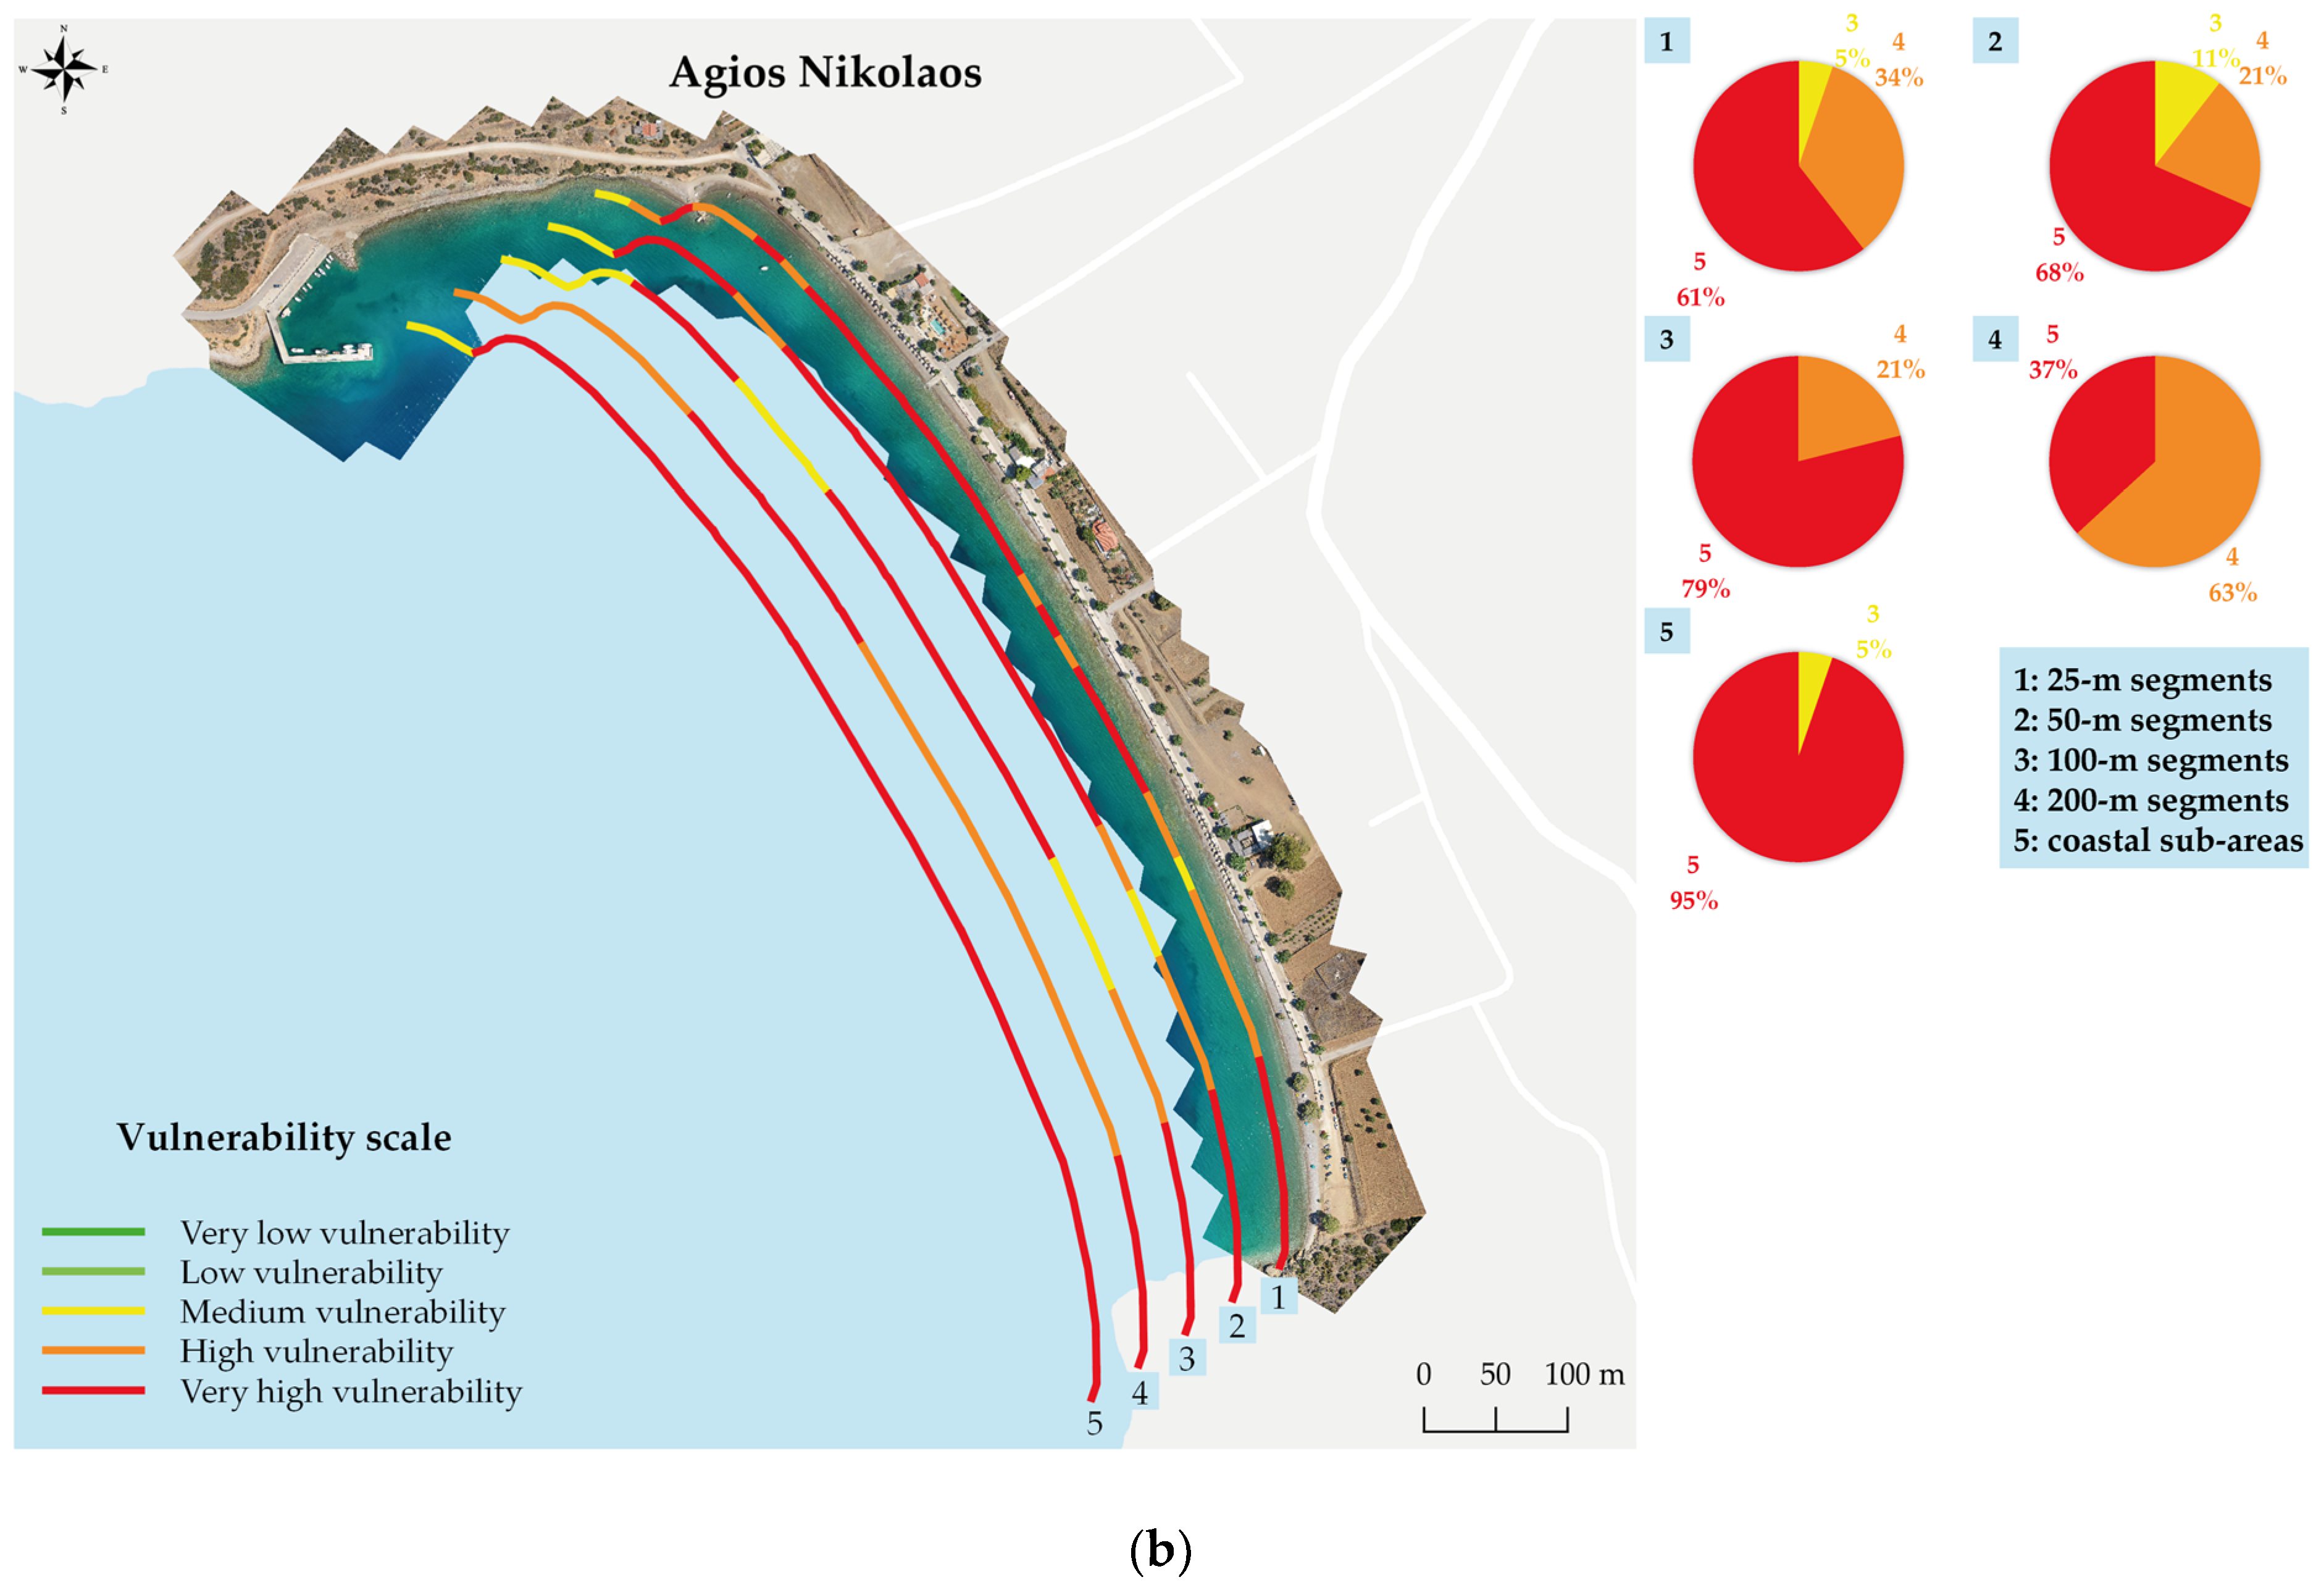
3.2. Comparative Analysis of the CVI Values for the Different Segmentation Approaches
3.3. Dependency of Vulnerability Parameters on the Spatial Segmentation Length
4. Conclusions
Author Contributions
Funding
Institutional Review Board Statement
Data Availability Statement
Conflicts of Interest
References
- Wright, L.D.; Syvitski, J.P.M.; Nichols, C.R. Coastal Complexity and Predictions of Change. In Tomorrow’s Coasts: Complex and Impermanent; Wright, L.D., Nichols, C.R., Eds.; Springer International Publishing: Cham, Switzerland, 2019; pp. 3–23. [Google Scholar]
- Bukvic, A.; Rohat, G.; Apotsos, A.; de Sherbinin, A. A Systematic Review of Coastal Vulnerability Mapping. Sustainability 2020, 12, 2822. [Google Scholar] [CrossRef]
- Djouder, F.; Boutiba, M. Vulnerability Assessment of Coastal Areas to Sea Level Rise from the Physical and Socioeconomic Parameters: Case of the Gulf Coast of Bejaia, Algeria. Arab. J. Geosci. 2017, 10, 299. [Google Scholar] [CrossRef]
- de Brito, M.M.; Evers, M.; Höllermann, B. Prioritization of Flood Vulnerability, Coping Capacity and Exposure Indicators through the Delphi Technique: A Case Study in Taquari-Antas Basin, Brazil. Int. J. Disaster Risk Reduct. 2017, 24, 119–128. [Google Scholar] [CrossRef]
- IPCC. Climate Change 2022: Impacts, Adaptation and Vulnerability. In Contribution of Working Group II to the Sixth Assessment Report of the Intergovernmental Panel on Climate Change; Cambridge University Press: Cambridge, UK; New York, NY, USA, 2022. [Google Scholar]
- Bevacqua, A.; Yu, D.; Zhang, Y. Coastal Vulnerability: Evolving Concepts in Understanding Vulnerable People and Places. Environ. Sci. Policy 2018, 82, 19–29. [Google Scholar] [CrossRef]
- Gornitz, V.M.; Daniels, R.C.; White, T.W.; Birdwell, K.R. The Development of a Coastal Risk Assessment Database: Vulnerability to Sea-Level Rise in the U.S. Southeast. J. Coast. Res. 1994, 327–338. Available online: https://www.jstor.org/stable/25735608 (accessed on 1 August 2023).
- Vandarakis, D.; Panagiotopoulos, I.P.; Loukaidi, V.; Hatiris, G.-A.; Drakopoulou, P.; Kikaki, A.; Gad, F.-K.; Petrakis, S.; Malliouri, D.I.; Chatzinaki, M.; et al. Assessment of the Coastal Vulnerability to the Ongoing Sea Level Rise for the Exquisite Rhodes Island (SE Aegean Sea, Greece). Water 2021, 13, 2169. [Google Scholar] [CrossRef]
- Pantusa, D.; D’Alessandro, F.; Frega, F.; Francone, A.; Tomasicchio, G.R. Improvement of a Coastal Vulnerability Index and its Application Along the Calabria Coastline, Italy. Sci. Rep. 2022, 12, 21959. [Google Scholar] [CrossRef]
- Kantamaneni, K.; Gallagher, A.; Du, X. Assessing and Mapping Regional Coastal Vulnerability for Port Environments and Coastal Cities. J. Coast. Conserv. 2019, 23, 59–70. [Google Scholar] [CrossRef]
- Tragaki, A.; Gallousi, C.; Karymbalis, E. Coastal Hazard Vulnerability Assessment Based on Geomorphic, Oceanographic and Demographic Parameters: The Case of the Peloponnese (Southern Greece). Land 2018, 7, 56. [Google Scholar] [CrossRef]
- Pramanik, M.K.; Dash, P.; Behal, D. Improving Outcomes for Socioeconomic Variables with Coastal Vulnerability Index under Significant Sea-level rise: An Approach from Mumbai Coasts. Environ. Dev. Sustain. 2021, 23, 13819–13853. [Google Scholar] [CrossRef]
- El-Hattab, M. Improving Coastal Vulnerability Index of the Nile Delta Coastal Zone, Egypt. J. Earth Sci. Clim. Chang. 2015, 6, 293. [Google Scholar] [CrossRef]
- de Serio, F.; Armenio, E.; Mossa, M.; Petrillo, A.F. How to Define Priorities in Coastal Vulnerability Assessment. Geosciences 2018, 8, 415. [Google Scholar] [CrossRef]
- Bellezza Quater, P.; Grimaccia, F.; Masini, A. Airborne Unmanned Monitoring System for Coastal Erosion Assessment. In Engineering Geology for Society and Territory—Volume 4; Springer International Publishing: Cham, Switzerland, 2014; pp. 115–120. [Google Scholar]
- Warnken, J.; Mosadeghi, R. Challenges of Implementing Integrated Coastal Zone Management into Local Planning Policies, a Case Study of Queensland, Australia. Mar. Policy 2018, 91, 75–84. [Google Scholar] [CrossRef]
- Harvey, N.; Clouston, E.; Carvalho, P. Improving Coastal Vulnerability Assessment Methodologies for Integrated Coastal Zone Management: An Approach from South Australia. Aust. Geogr. Stud. 1999, 37, 50–69. [Google Scholar] [CrossRef]
- Farhan, A.R.; Lim, S. Improving Vulnerability Assessment towards Integrated Coastal Zone Management (ICZM): A Case Study of Small Islands in Indonesia. J. Coast. Conserv. 2013, 17, 351–367. [Google Scholar] [CrossRef]
- Falaleeva, M.; O’Mahony, C.; Gray, S.; Desmond, M.; Gault, J.; Cummins, V. Towards Climate Adaptation and Coastal Governance in Ireland: Integrated Architecture for Effective Management? Mar. Policy 2011, 35, 784–793. [Google Scholar] [CrossRef]
- O’Mahony, C.; O’Hagan, A.M.; Meaney, E. A Review of Beach Bye-Law Usage in Supporting Coastal Management in Ireland. Coast. Manag. 2012, 40, 461–483. [Google Scholar] [CrossRef]
- O’Hagan, A.M.; Ballinger, R.C. Implementing Integrated Coastal Zone Management in a National Policy Vacuum: Local Case Studies from Ireland. Ocean Coast. Manag. 2010, 53, 750–759. [Google Scholar] [CrossRef]
- Ružić, I.; Dugonjić Jovančević, S.; Benac, Č.; Krvavica, N. Assessment of the Coastal Vulnerability Index in an Area of Complex Geological Conditions on the Krk Island, Northeast Adriatic Sea. Geosciences 2019, 9, 219. [Google Scholar] [CrossRef]
- Bryan, J.B.; Christopher, E.; Susan, L.C. Erosion Hazard Vulnerability of US Coastal Counties. J. Coast. Res. 2005, 2005, 932–942. [Google Scholar] [CrossRef]
- Tanim, A.H.; Goharian, E.; Moradkhani, H. Integrated Socio-environmental Vulnerability Assessment of Coastal Hazards Using Data-driven and Multi-criteria Analysis Approaches. Sci. Rep. 2022, 12, 11625. [Google Scholar] [CrossRef] [PubMed]
- LHW. Sustainable Development Plan and Integrated Coastal Zone Management for the Municipality of Thiva through Consideration of Coastal Vulnerability and Potential Effects of Climate Change—Stage A; Laboratory of Harbour Works, National Technical University of Athens: Athens, Greece, 2021. [Google Scholar]
- Adger, W.N. Vulnerability. Glob. Environ. Chang. 2006, 16, 268–281. [Google Scholar] [CrossRef]
- Armenio, E.; Mossa, M.; Petrillo, A.F. Coastal Vulnerability Analysis to Support Strategies for Tackling COVID-19 Infection. Ocean Coast. Manag. 2021, 211, 105731. [Google Scholar] [CrossRef] [PubMed]
- Noor, N.M.; Abdul Maulud, K.N. Coastal Vulnerability: A Brief Review on Integrated Assessment in Southeast Asia. J. Mar. Sci. Eng. 2022, 10, 595. [Google Scholar] [CrossRef]
- Thieler, E.R.; Hammar-Klose, E.S. National Assessment of Coastal Vulnerability to Sea-Level Rise: Preliminary Results for the U.S. Atlantic Coast; U.S. Geological Survey: Woods Hole, MA, USA, 1999.
- Le Cozannet, G.; Garcin, M.; Bulteau, T.; Mirgon, C.; Yates, M.L.; Méndez, M.; Baills, A.; Idier, D.; Oliveros, C. An AHP-derived Method for Mapping the Physical Vulnerability of Coastal Areas at Regional Scales. Nat. Hazards Earth Syst. Sci. 2013, 13, 1209–1227. [Google Scholar] [CrossRef]
- Husnayaen; Rimba, A.B.; Osawa, T.; Parwata, I.N.S.; As-syakur, A.R.; Kasim, F.; Astarini, I.A. Physical Assessment of Coastal Vulnerability under Enhanced Land Subsidence in Semarang, Indonesia, Using Multi-sensor Satellite Data. Adv. Space Res. 2018, 61, 2159–2179. [Google Scholar] [CrossRef]
- Arkema, K.K.; Guannel, G.; Verutes, G.; Wood, S.A.; Guerry, A.; Ruckelshaus, M.; Kareiva, P.; Lacayo, M.; Silver, J.M. Coastal Habitats Shield People and Property from Sea-level Rise and Storms. Nat. Clim. Chang. 2013, 3, 913–918. [Google Scholar] [CrossRef]
- Lu, J.; Zhang, Y.; Shi, H.; Lv, X. Coastal Vulnerability Modelling and Social Vulnerability Assessment under Anthropogenic Impacts. Front. Mar. Sci. 2022, 9, 1015781. [Google Scholar] [CrossRef]
- Vanzomeren, C.; Acevedo, D. A Review of Coastal Vulnerability Assessments: Definitions, Components, and Variables Environmental Laboratory A Review of Coastal Vulnerability Assessments: Definitions, Components, and Variables; Environmental Laboratory: Vicksburg, MS, USA, 2019. [Google Scholar]
- IPCC. Climate change 2014—Impacts, Adaptation and Vulnerability—Part A: Global and Sectoral Aspects, Working Group II Contribution to the Fifth Assessment Report of the Intergovernmental Panel on Climate Change; Cambridge University Press: Cambridge, UK; New York, NY, USA, 2014. [Google Scholar]
- Envirometrics. Regional Climate Change Adaptation Framework for the Region of Sterea Ellada; Envirometrics: Athens, Greece, 2018. [Google Scholar]
- Parthasarathy, K.S.S.; Deka, P.C. Remote Sensing and GIS Application in Assessment of Coastal Vulnerability and Shoreline Changes: A Review. ISH J. Hydraul. Eng. 2021, 27, 588–600. [Google Scholar] [CrossRef]
- Watkins, S.E.; Whittaker, A.C.; Bell, R.E.; McNeill, L.C.; Gawthorpe, R.L.; Brooke, S.A.S.; Nixon, C.W. Are Landscapes Buffered to High-frequency Climate Change? A Comparison of Sediment Fluxes and Depositional Volumes in the Corinth Rift, Central Greece, over the Past 130 k.y. GSA Bull. 2018, 131, 372–388. [Google Scholar] [CrossRef]
- Himmelstoss, E.A.; Henderson, R.E.; Kratzmann, M.G.; Farris, A.S. Digital Shoreline Analysis System (DSAS) Version 5.0 User Guide; 2018–1179; U.S. Geological Survey: Reston, VA, USA, 2018.
- Dean, R.G.; Dalrymple, R.A. Water Wave Mechanics for Engineers and Scientists, 1st ed.; World Scientific: Singapore, 1991; Volume 2, p. 368. [Google Scholar]
- Malakatas, N.N. EN 1991—Climatic Actions & Elaboration of Maps for Climatic Actions in Greece. In Proceedings of the Elaboration of Maps for Climatic and Seismic Actions for Structural Design in the Balkan Region, Zagreb, Croatia, 27–28 October 1991. [Google Scholar]
- Dean, R.G. Equilibrium Beach Profiles: Characteristics and Applications. J. Coast. Res. 1991, 7, 53–84. [Google Scholar]
- Luhmann, T.; Robson, S.; Kyle, S.; Boehm, J. Close-Range Photogrammetry and 3D Imaging; De Gruyter: Berlin, Germany, 2014. [Google Scholar]
- Aber, J.S.; Marzolff, I.; Ries, J.B.; Aber, S.E.W. Chapter 3—Principles of Photogrammetry. In Small-Format Aerial Photography and UAS Imagery, 2nd ed.; Aber, J.S., Marzolff, I., Ries, J.B., Aber, S.E.W., Eds.; Academic Press: Cambridge, MA, USA, 2019; pp. 19–38. [Google Scholar]
- Benoit, M.; Marcos, F.; Becq, F. Development of a Third Generation Shallow-Water Wave Model with Unstructured Spatial Meshing. In Proceedings of the 25th International Conference on Coastal Engineering, Orlando, FL, USA, 2–6 September 1996. [Google Scholar]
- Depountis, N.; Apostolopoulos, D.; Boumpoulis, V.; Christodoulou, D.; Dimas, A.; Fakiris, E.; Leftheriotis, G.; Menegatos, A.; Nikolakopoulos, K.; Papatheodorou, G.; et al. Coastal Erosion Identification and Monitoring in the Patras Gulf (Greece) Using Multi-Discipline Approaches. J. Mar. Sci. Eng. 2023, 11, 654. [Google Scholar] [CrossRef]
- Smith, J. Wind Wave Generation in Restricted Fetches. Coast. Eng. Technical Note CERC 91-2; US Army Corps Eng. Waterw. Exp. Station: Vicksburg, MS, USA, 1991. [Google Scholar]
- Kraus, N.C.; Larson, M.; Wise, R.A. Depth of Closure in Beach-Fill Design, Coastal Engineering Technical Note II-40; Army Corps Eng. Waterw. Exp. Station: Vicksburg, MS, USA, 1998. [Google Scholar]
- Tsaimou, C.N.; Papadimitriou, A.; Chalastani, V.Ι.; Sartampakos, P.; Chondros, M.; Tsoukala, V.K. Coastal Vulnerability Assessment of the Coastal Zone of the Municipality of Thebes. Zenodo 2023. [Google Scholar] [CrossRef]
- Soulsby, R.L.; Smallman, J.V. A Direct Method of Calculating Bottom Orbital Velocity under Waves. In Technical Report No SR 76; Wallingford: Oxfordshire, UK, 1986. [Google Scholar]
- Papadimitriou, A.; Panagopoulos, L.; Chondros, M.; Tsoukala, V. A Wave Input-Reduction Method Incorporating Initiation of Sediment Motion. J. Mar. Sci. Eng. 2020, 8, 597. [Google Scholar] [CrossRef]
- Chen, W.L.; Muller, P.; Grabowski, R.C.; Dodd, N. Green Nourishment: An Innovative Nature-Based Solution for Coastal Erosion. Front. Mar. Sci. 2022, 8, 2054. [Google Scholar] [CrossRef]
- Ariffin, E.H.; Mathew, M.J.; Roslee, A.; Ismailluddin, A.; Yun, L.S.; Putra, A.B.; Yusof, K.M.K.K.; Menhat, M.; Ismail, I.; Shamsul, H.A.; et al. A multi-hazards coastal vulnerability index of the east coast of Peninsular Malaysia. Int. J. Disaster Risk Reduct. 2023, 84, 103484. [Google Scholar] [CrossRef]
- Tsaimou, C.; Sartabakos, P.; Tsoukala, V. UAV-based remote sensing practices for assessing coastal vulnerability. In Proceedings of the 39th IAHR World Congress, Granada, Spain, 19–24 June 2022. [Google Scholar]
- UNEP/MAP/PAP. Guidelines for the Preparation of National ICZM Strategies required by the Integrated Coastal Zone Management (ICZM) Protocol for the Mediterranean; Priority Actions Programme: Split, Croatia, 2015. [Google Scholar]
- McKenna, J.; Cooper, A.; O’Hagan, A.M. Managing by principle: A critical analysis of the European principles of Integrated Coastal Zone Management (ICZM). Mar. Policy 2008, 32, 941–955. [Google Scholar] [CrossRef]


| No. | Area | Coastline Length (km) | Coordinates (Greek Geodetic Reference System ‘87) | |||
|---|---|---|---|---|---|---|
| Xstart | Ystart | Xend | Yend | |||
| 1 | Sarantis Beach | 0.95 | 402326.71 | 4232300.36 | 403191.77 | 4232230.19 |
| 2 | Agios Nikolaos | 0.95 | 414343.93 | 4229713.78 | 414771.27 | 4228987.44 |
| 3 | Aliki | 1.88 | 416021.01 | 4228236.71 | 416391.63 | 4226897.95 |
| 4 | Livadostra Beach | 0.68 | 421858.52 | 4228822.67 | 422558.56 | 4228608.21 |
| 5 | Kalamaki | 0.30 | 423067.67 | 4228238.64 | 423207.57 | 4227997.23 |
| 6 | Agios Vasilios | 0.43 | 424768.13 | 4226240.16 | 424695.80 | 4225888.08 |
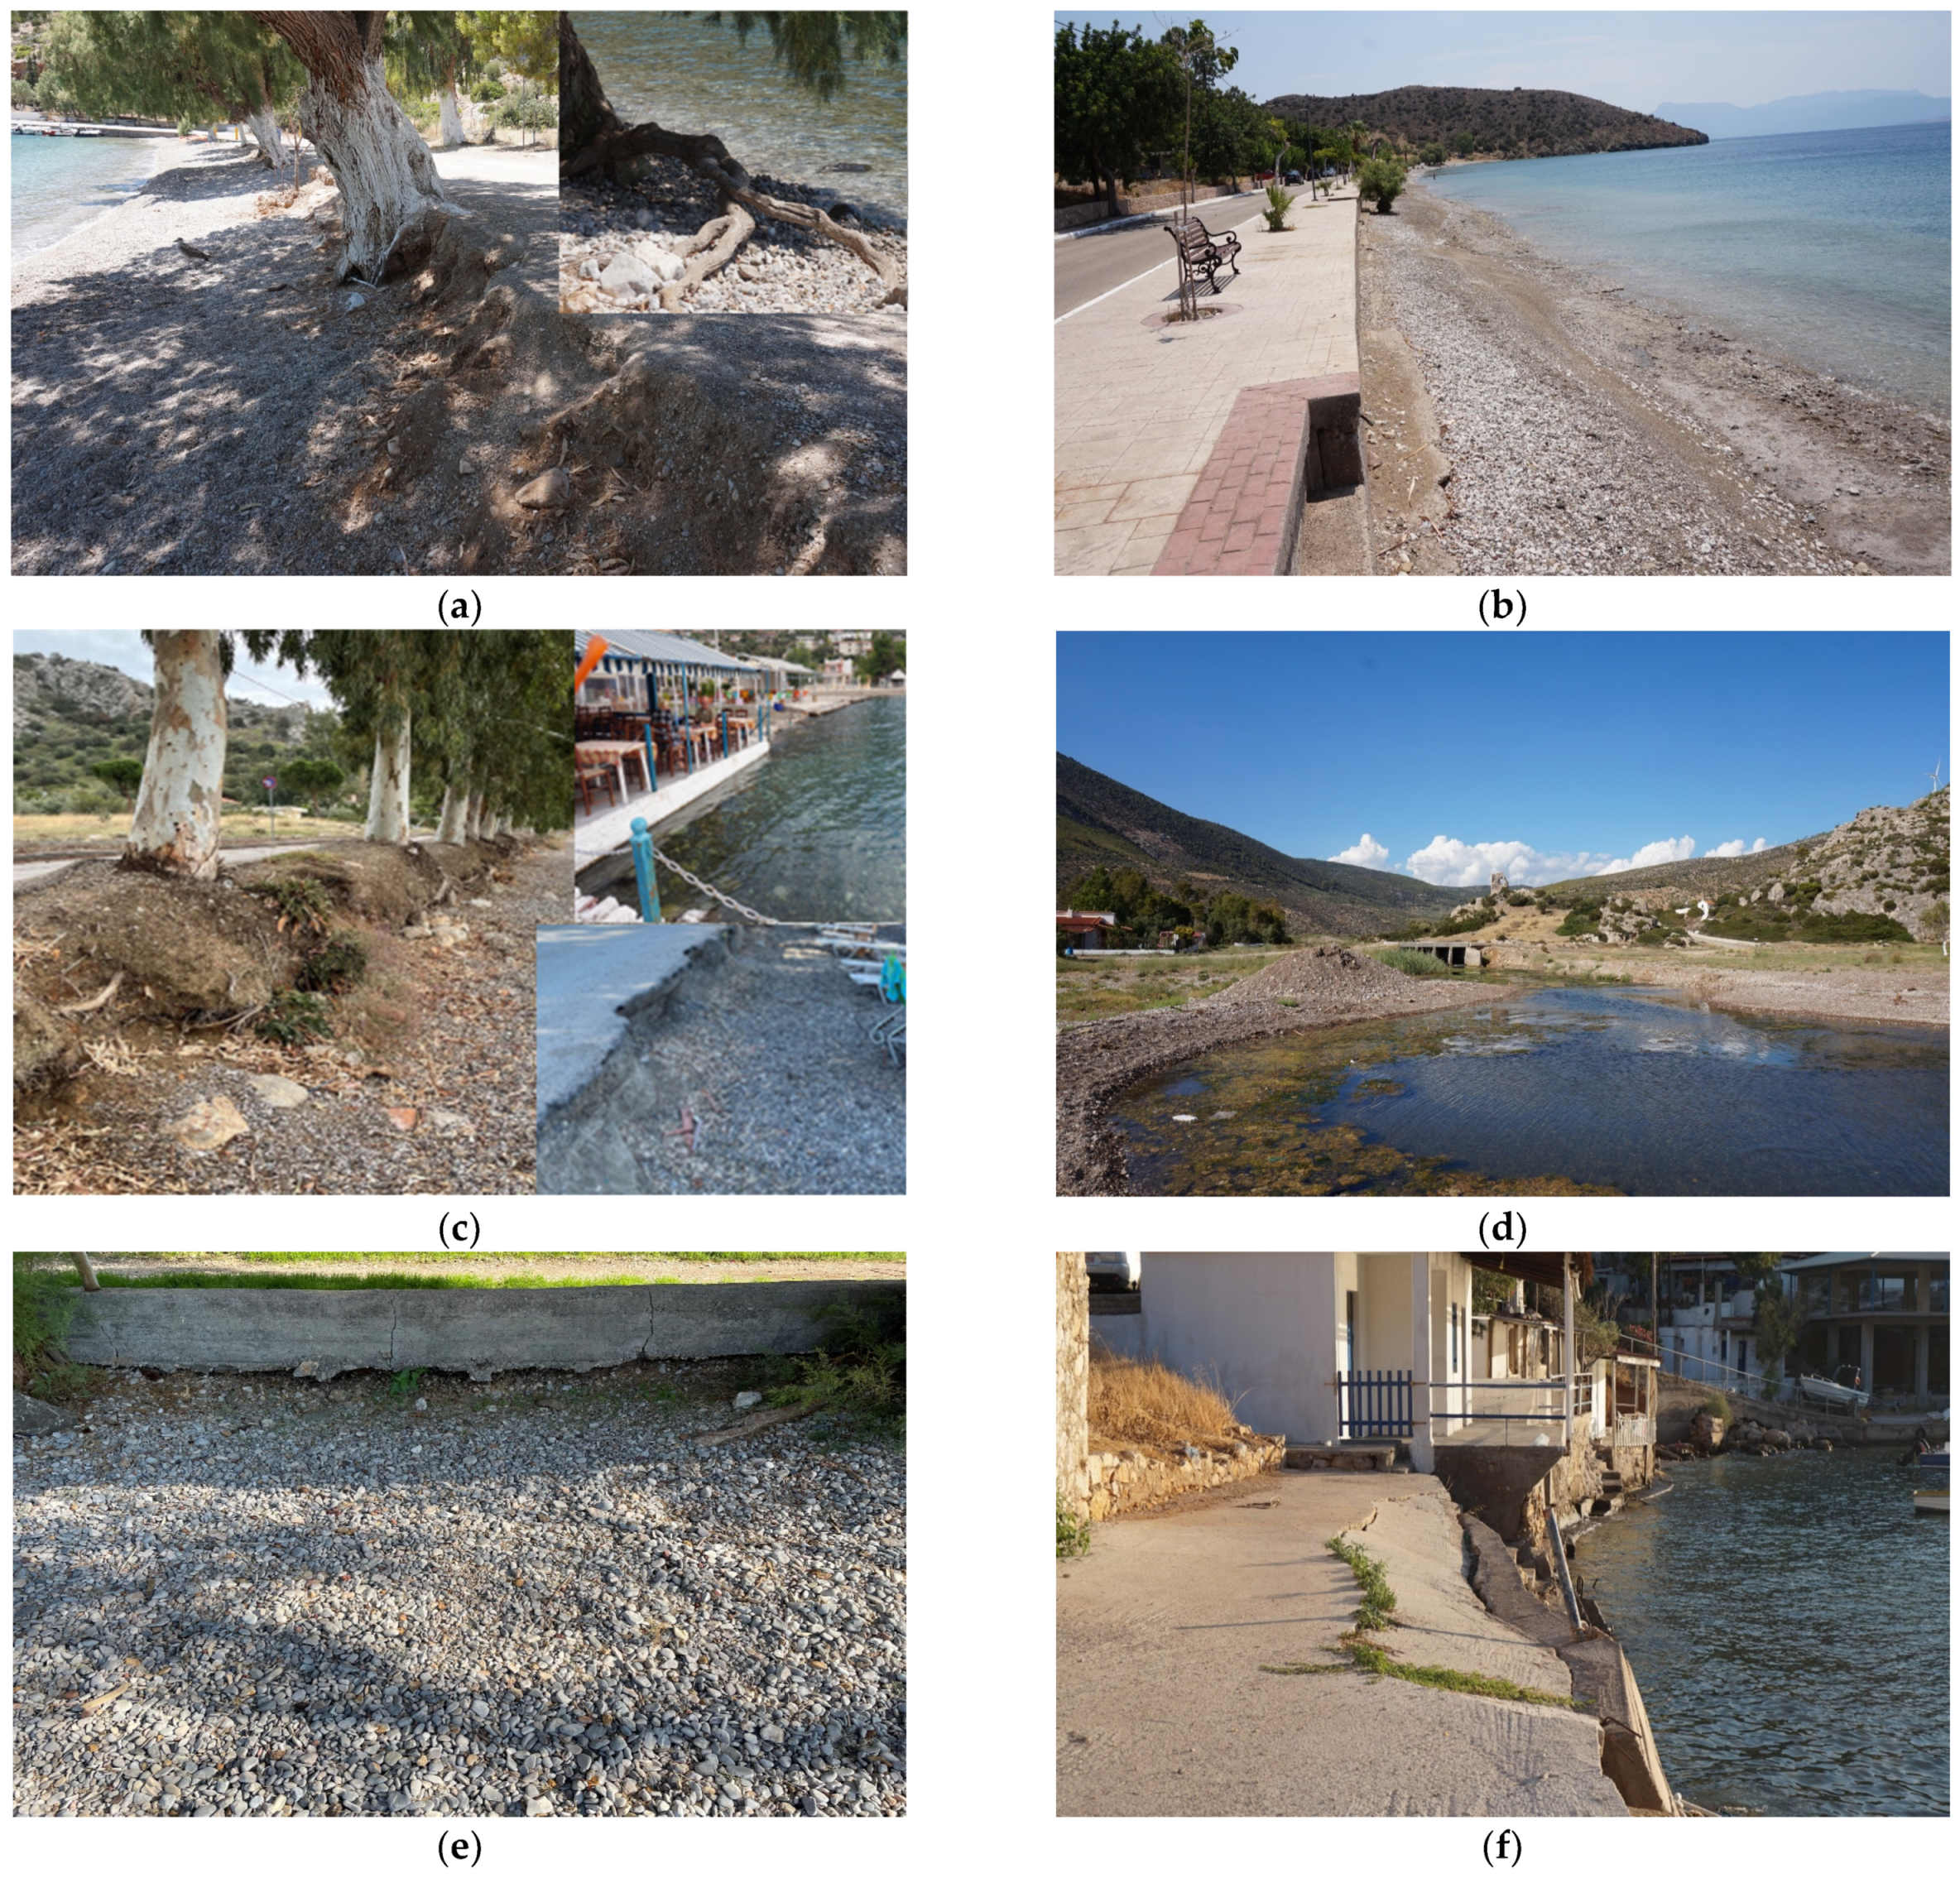
| No. | Area | Infrastructure | Main Wave Direction | Identified Threats |
|---|---|---|---|---|
| 1 | Sarantis Beach | Fishing and leisure harbor | S-SW | Beach erosion and unbound pavement partial failure (Figure 2a) |
| 2 | Agios Nikolaos | Fishing and leisure harbor | S-SW | Erosion possibly occurring via reflection phenomena due to the construction of a vertical retaining wall of the pedestrian pavement and road (Figure 2b) |
| 3 | Aliki | Fishing and leisure harbor | W | Beach erosion and asphalt pavement partial failure. Expansion of food service establishments onshore along a large part of the beach limiting the beach width (Figure 2c) |
| 4 | Livadostra Beach | Absent | S-SW-SE | Absence of Stravopotamos River outfall works (Figure 2d) |
| 5 | Kalamaki | Absent | S-SW | Partial failure of the retaining wall of the unbound pavement (Figure 2e) |
| 6 | Agios Vasilios | Fishing and leisure harbor | SW | Significant scouring and subsequent partial collapse of the vertical waterfront wall (Figure 2f) |
| No. | Parameter | Units | Description |
|---|---|---|---|
| P1 | Seabed sediment thickness | m | The degree of erodibility of the soil formations considering the geological substratum of the coastal areas |
| P2 | Beach sediment | - | The different types of sediment depending on the resistance of the coastal landforms to erosion, i.e., erodibility |
| P3 | Distance from major faults | m | The proximity to major faults in case of an earthquake incident that may have adverse impacts |
| P4 | Shoreline evolution | m/yr | The hazard of erosion in a coastal area |
| P5 | Land slope | % | The coastal land morphology |
| P6 | Marine slope | % | The coastal marine morphology |
| P7 | Sea level rise due to climate change | m | The coastal inundation due to the impacts of climate change and sea level increase |
| P8 | Mean range of the astronomical tide | cm | The sea level trend due to astronomical phenomena |
| P9 | Storm surge | cm | The local sea level rise due to extreme weather events |
| P10 | Significant wave height | m | The significant wave height representing the mean wave conditions in the study area |
| P11 | Extreme significant wave height | m | The wave height generated from extreme wind speeds potentially leading to coastal flooding and intense erosion phenomena |
| P12 | Cross-shore profile erosion | m | The risk of shoreline retreat due to the combined occurrence of extreme waves and sea level rise in the case of extreme weather events |
| P13 | Beach width | m | The free width between the coastline and the physical (e.g., vegetation, presence of rocks, etc.) or man-made obstacles (e.g., coastal road, vertical waterfront, housing, etc.) |
| P14 | Distance from vegetation | m | The proximity to vegetation increasing the risk of altering the natural landscape |
| Parameters | Vulnerability Score | Percentage along the Coastal Area (%) | |||||
|---|---|---|---|---|---|---|---|
| Sarantis Beach | Agios Nikolaos | Aliki | Livadostra Beach | Kalamaki | Agios Vasilios | ||
| P1: Seabed sediment thickness | 1 | 100 | 0 | 0 | 0 | 0 | 0 |
| 2 | 0 | 0 | 0 | 0 | 0 | 100 | |
| 3 | 0 | 0 | 0 | 0 | 0 | 0 | |
| 4 | 0 | 100 | 100 | 100 | 100 | 0 | |
| 5 | 0 | 0 | 0 | 0 | 0 | 0 | |
| P2: Beach sediment | 1 | 13 | 0 | 11 | 0 | 0 | 18 |
| 2 | 0 | 0 | 0 | 0 | 0 | 6 | |
| 3 | 63 | 100 | 36 | 100 | 100 | 76 | |
| 4 | 24 | 0 | 0 | 0 | 0 | 0 | |
| 5 | 0 | 0 | 53 | 0 | 0 | 0 | |
| P3: Distance from major faults | 1 | 100 | 5 | 0 | 0 | 0 | 0 |
| 2 | 0 | 69 | 24 | 0 | 0 | 0 | |
| 3 | 0 | 21 | 37 | 0 | 0 | 0 | |
| 4 | 0 | 5 | 39 | 0 | 0 | 76 | |
| 5 | 0 | 0 | 0 | 100 | 100 | 24 | |
| P4: Shoreline evolution | 1 | 63 | 21 | 36 | 48 | 34 | 18 |
| 2 | 8 | 42 | 12 | 0 | 8 | 0 | |
| 3 | 8 | 32 | 11 | 11 | 25 | 0 | |
| 4 | 10 | 5 | 22 | 8 | 33 | 12 | |
| 5 | 11 | 0 | 19 | 33 | 0 | 70 | |
| P5: Land slope | 1 | 21 | 3 | 25 | 15 | 33 | 18 |
| 2 | 21 | 3 | 12 | 11 | 59 | 29 | |
| 3 | 26 | 0 | 23 | 18 | 0 | 23 | |
| 4 | 21 | 18 | 23 | 19 | 0 | 18 | |
| 5 | 11 | 76 | 17 | 37 | 8 | 12 | |
| P6: Marine slope | 1 | 82 | 0 | 0 | 22 | 25 | 6 |
| 2 | 18 | 8 | 8 | 26 | 17 | 94 | |
| 3 | 0 | 24 | 28 | 45 | 58 | 0 | |
| 4 | 0 | 16 | 35 | 7 | 0 | 0 | |
| 5 | 0 | 52 | 29 | 0 | 0 | 0 | |
| P9: Storm surge | 1 | 100 | 0 | 0 | 0 | 0 | 0 |
| 2 | 0 | 0 | 17 | 0 | 100 | 100 | |
| 3 | 0 | 0 | 54 | 100 | 0 | 0 | |
| 4 | 0 | 89 | 0 | 0 | 0 | 0 | |
| 5 | 0 | 11 | 29 | 0 | 0 | 0 | |
| P10: Significant wave height | 1 | 32 | 0 | 27 | 0 | 0 | 53 |
| 2 | 39 | 0 | 31 | 0 | 0 | 47 | |
| 3 | 29 | 0 | 16 | 74 | 8 | 0 | |
| 4 | 0 | 74 | 5 | 26 | 92 | 0 | |
| 5 | 0 | 26 | 21 | 0 | 0 | 0 | |
| P11: Extr. signif. wave height | 1 | 3 | 0 | 54 | 0 | 0 | 29 |
| 2 | 8 | 34 | 17 | 0 | 67 | 59 | |
| 3 | 10 | 66 | 4 | 11 | 25 | 12 | |
| 4 | 8 | 0 | 25 | 59 | 8 | 0 | |
| 5 | 71 | 0 | 0 | 30 | 0 | 0 | |
| P12: Cross-shore prof. erosion | 1 | 42 | 0 | 54 | 0 | 0 | 0 |
| 2 | 50 | 0 | 17 | 0 | 0 | 6 | |
| 3 | 8 | 0 | 4 | 11 | 17 | 82 | |
| 4 | 0 | 8 | 25 | 59 | 83 | 12 | |
| 5 | 0 | 92 | 0 | 30 | 0 | 0 | |
| P13: Beach width | 1 | 8 | 29 | 15 | 59 | 59 | 29 |
| 2 | 16 | 47 | 29 | 22 | 33 | 47 | |
| 3 | 39 | 19 | 16 | 11 | 8 | 12 | |
| 4 | 26 | 5 | 23 | 4 | 0 | 6 | |
| 5 | 11 | 0 | 17 | 4 | 0 | 6 | |
| P14: Distance from vegetation | 1 | 0 | 13 | 40 | 8 | 0 | 0 |
| 2 | 8 | 37 | 21 | 59 | 0 | 24 | |
| 3 | 13 | 16 | 11 | 15 | 58 | 35 | |
| 4 | 34 | 24 | 19 | 7 | 42 | 29 | |
| 5 | 45 | 10 | 9 | 11 | 0 | 12 | |
| Coastal Vulnerability Index | 1 | 82 | 0 | 7 | 0 | 0 | 18 |
| 2 | 18 | 0 | 23 | 22 | 33 | 76 | |
| 3 | 0 | 24 | 29 | 44 | 50 | 6 | |
| 4 | 0 | 26 | 29 | 15 | 17 | 0 | |
| 5 | 0 | 50 | 12 | 19 | 0 | 0 | |
| Parameters | Units | Statistics | 25-m | 50-m | 100-m | 200-m | Sub-Areas |
|---|---|---|---|---|---|---|---|
| P3: Distance from major faults | m | μx | 7125.87 | 7118.93 | 7119.78 | 7119.75 | 7120.71 |
| σχ | 148.35 | 151.26 | 151.37 | 146.44 | 85.82 | ||
| CV | 2.08 | 2.12 | 2.13 | 2.06 | 1.21 | ||
| SR | −44.38 | −43.55 | −43.62 | −45.46 | −80.46 | ||
| P11: Ext. signif. wave height | m | μx | 1.98 | 1.96 | 1.93 | 2.02 | 2.05 |
| σχ | 0.48 | 0.49 | 0.49 | 0.45 | 0.28 | ||
| CV | 24.19 | 25.13 | 25.41 | 22.16 | 13.75 | ||
| SR | −0.65 | −0.60 | −0.97 | −1.67 | −5.05 |
Disclaimer/Publisher’s Note: The statements, opinions and data contained in all publications are solely those of the individual author(s) and contributor(s) and not of MDPI and/or the editor(s). MDPI and/or the editor(s) disclaim responsibility for any injury to people or property resulting from any ideas, methods, instructions or products referred to in the content. |
© 2023 by the authors. Licensee MDPI, Basel, Switzerland. This article is an open access article distributed under the terms and conditions of the Creative Commons Attribution (CC BY) license (https://creativecommons.org/licenses/by/4.0/).
Share and Cite
Tsaimou, C.N.; Papadimitriou, A.; Chalastani, V.Ι.; Sartampakos, P.; Chondros, M.; Tsoukala, V.K. Impact of Spatial Segmentation on the Assessment of Coastal Vulnerability—Insights and Practical Recommendations. J. Mar. Sci. Eng. 2023, 11, 1675. https://doi.org/10.3390/jmse11091675
Tsaimou CN, Papadimitriou A, Chalastani VΙ, Sartampakos P, Chondros M, Tsoukala VK. Impact of Spatial Segmentation on the Assessment of Coastal Vulnerability—Insights and Practical Recommendations. Journal of Marine Science and Engineering. 2023; 11(9):1675. https://doi.org/10.3390/jmse11091675
Chicago/Turabian StyleTsaimou, Christina N., Andreas Papadimitriou, Vasiliki Ι. Chalastani, Panagiotis Sartampakos, Michalis Chondros, and Vasiliki K. Tsoukala. 2023. "Impact of Spatial Segmentation on the Assessment of Coastal Vulnerability—Insights and Practical Recommendations" Journal of Marine Science and Engineering 11, no. 9: 1675. https://doi.org/10.3390/jmse11091675