2. The Literature Review
Collision risk identification is one of the hot issues in the maritime research field. To enhance navigational safety, many scholars have been researching how to accurately quantify the collision risk between ships or in a specific water area. In terms of the research scope, collision risk identification research can be divided into two categories, which are microscopic collision risk, which is to quantify the collision risk between ships, and macroscopic collision risk, which is to quantify the collision risk of a specific water area. The two kinds of collision risk have different uses in the maritime field. Both collision risks are researched extensively by maritime scholars.
The microscopic collision risk refers to the collision risk between two ships or multi ships. It is usually used as a safety criterion in collision avoidance or relevant decision-making. Generally, the methods of modeling microscopic collision risk can be divided into three categories, which are the analytic method, fuzzy method, and machine learning method. The analytic method is to model the microscopic collision risk by analytic expression. At an early stage, Kearon [
5] proposed an analytic expression to calculate the collision risk index, namely, the microscopic collision risk. In this analytic expression, two crucial parameters in collision avoidance, Distance to the closest point of approach (DCPA) and Time to the closest point of approach (TCPA), were used. Since then, some scholars have improved or proposed analytical expressions of microscopic collision risk based on other parameters [
6,
7,
8,
9,
10]. The advantage of the analytical method is that it can simply and clearly quantify the relationship between the collision risk and the input variables, which is convenient to use and has strong objectivity. However, the input variables considered in this method are limited, and a lot of models only involve DCPA and TCPA variables, which is slightly insufficient in representing collision risk. To overcome the limitation of the analytic method, some scholars began to model the microscopic collision risk by the theory of fuzzy mathematics, including fuzzy inference and fuzzy comprehensive assessment. Most of the early studies on microcosmic collision risk calculation by fuzzy inference only included DCPA and TCPA as input variables [
11]. Gradually, scholars began to involve more influencing factors [
12] or combined this method with other approaches, such as ship domain [
13] and neural network [
14]. Although the fuzzy method can overcome the disadvantage of the analytic method in considering factors to some extent, it also has drawbacks. It is limited in strong subjectivity because the fuzzy method should rely on the knowledge of an expert. There were also some scholars modeling microscopic collision risk with a machine learning approach, mainly by the neural network. As a black box, the neural network cannot model microscopic collision risk directly but needs to rely on the sample training data derived from other microscopic collision risk models. Earlier studies mostly used DCPA and TCPA as network inputs [
15]. Considering the computing efficiency, some scholars began to use the raw data of the ship’s movement as input variables [
16]. The advantage of the neural network method is that it can establish the nonlinear mapping relationship between the input variable and the output variable and obtain the result of the collision risk quickly. However, as a black box to simulate the human brain, the mechanism has not been clarified, so it is difficult to clearly explain this nonlinear mapping relationship.
The macroscopic collision risk refers to the collision risk in a specific water area, and it is normally used in maritime surveillance. As the water area near the port is the busiest and the most crowded water area, many scholars pay attention to the study of collision risk in port waters. At an early stage, Fujii and Shiobara [
17] and Macduff [
18] proposed a framework to identify the collision risk in the water area, which multiplied the geometric collision numbers or probability with causation collision probability. The framework was widely used in regional collision risk identification by probability means [
19,
20,
21]. Under the framework, a famous model proposed by the International Association of Lighthouse Authorities (IALA) is the International Association of Lighthouse Authorities Waterways Risk Assessment Program (IWRAP) model [
22]. Silveiria et al. [
23] developed an algorithm to assess the relative importance and risk profile of routes associated with ports and proposed a method to identify the collision risk by estimating future distances between ships off the coast of Portugal. Zhen et al. [
24] proposed a novel framework to identify and analyze the collision risk of the west coastal waters of Sweden. The collision risk near the port area can be obtained in an analytic way using DCPA and TCPA. To reduce the collision probability in Istanbul Strait, which is busy with the crossing traffic from port to port and passing traffic, Korçak and Balas [
25] defined the hot spots for encounters and calculated the collision probability between ships. Breithaupt et al. [
26] plotted the ship routes between ports along the Atlantic coast of the United States, which can indicate the distribution of collision risk in the waters to some extent. Li et al. [
27] proposed an integrated method for regional collision risk analysis. The random forest was used to integrate the accident risk model and non-accident critical events risk model. Lan et al. [
28] proposed a data-driven method integrating association rule mining, complex network, and random forest to explore the correlation among collision risk factors. Via this method, the critical factor can be found and used to assess the severity of collision accidents.
Although the studies on macroscopic collision risk were extensively carried out, there was little research on collision risk in anchorage. Burmeister et al. [
29] utilized the famous IWRAP model and improved it to MKII to assess the collision risk between the underway ship and the anchored ship in the anchorage. However, the influencing factors of collision risk were not considered sufficiently, and the model was limited in real-time collision risk identification. Weng and Xue [
30] evaluated the ship collision frequency in port fairways. Through some case studies in Singapore Strait, they found the hot spots of different dangerous encountering types. Debnath and Chin [
31] utilized a binomial logistic model to determine the relationship between the anchorage collision risk and various characteristics by the Navigation Traffic Conflict Technique proposed by them [
32]. This method can be used to identify the anchorage collision risk, but the model relatively relied on expert judgment. Liu et al. [
33] proposed an anchorage collision risk model. This model assessed the collision risk in anchorage by calculating the collision risk between any two ships within anchorage and the safe room in anchorage for navigation. However, this model was limited in expressing the impact of the complication of maritime traffic.
Compared with the study of macroscopic collision risk, the study of microscopic collision risk was more extensive. These microscopic collision risk studies mainly focused on the microscopic factors that affect the collision risk between ships, such as the relative motion parameters of ships. Therefore, they had a wide range of applications in the actual collision avoidance of ships and were helpful as a safety criterion to assist the decision-making of collision avoidance. However, because it was limited to the relative motion between ships and took little consideration of the overall influencing factors of collision risk, it was difficult to be directly applied to evaluate the macroscopic collision risk of the water area, and it was difficult to assess the overall collision risk of the special water area, such as the collision risk of anchorage. At present, the studies of macroscopic collision risk mainly focus on some open waters or straits and pay less attention to special navigational waters, such as anchorage. Although some scholars have researched the collision risk of anchorage, there were still some limitations in these works, such as a lack of consideration of the characteristics of anchorage and difficulty in obtaining instantaneous anchorage collision risk. More importantly, under the increasingly complicated ship traffic, no matter the macroscopic collision risk study or the anchorage collision risk study, complexity was not considered as a factor affecting the possibility of ship collision, and the consideration of safety criterion was insufficient, so it was difficult to identify the potential collision risks in anchorage accurately.
3. The Anchorage Collision Risk Model
The anchorage collision risks modeled in this paper refer to the global risk levels of ship collision within the scope of the anchorage and its adjacent waters. For identifying the anchorage collision risks more efficiently under the complicated traffic situations nowadays, the anchorage collision risk model was established in three aspects in this paper, which are collision risk in microscopic, macroscopic, and spatial complexity, respectively.
The microscopic collision risk refers to the collision risk objectively existing between two ships in the anchorage waters due to their relative motion. As a ship can exist in anchorage either in an underway state or anchored state, there are three different situations for a pair of two ships in the anchorage, which are two underway ships, one underway ship, one anchored ship, and two anchored ships. Since anchored ships have no sailing speed, they were considered fixed objects in this paper. For the three situations mentioned above, the microscopic collision risk between two ships can be calculated as follows.
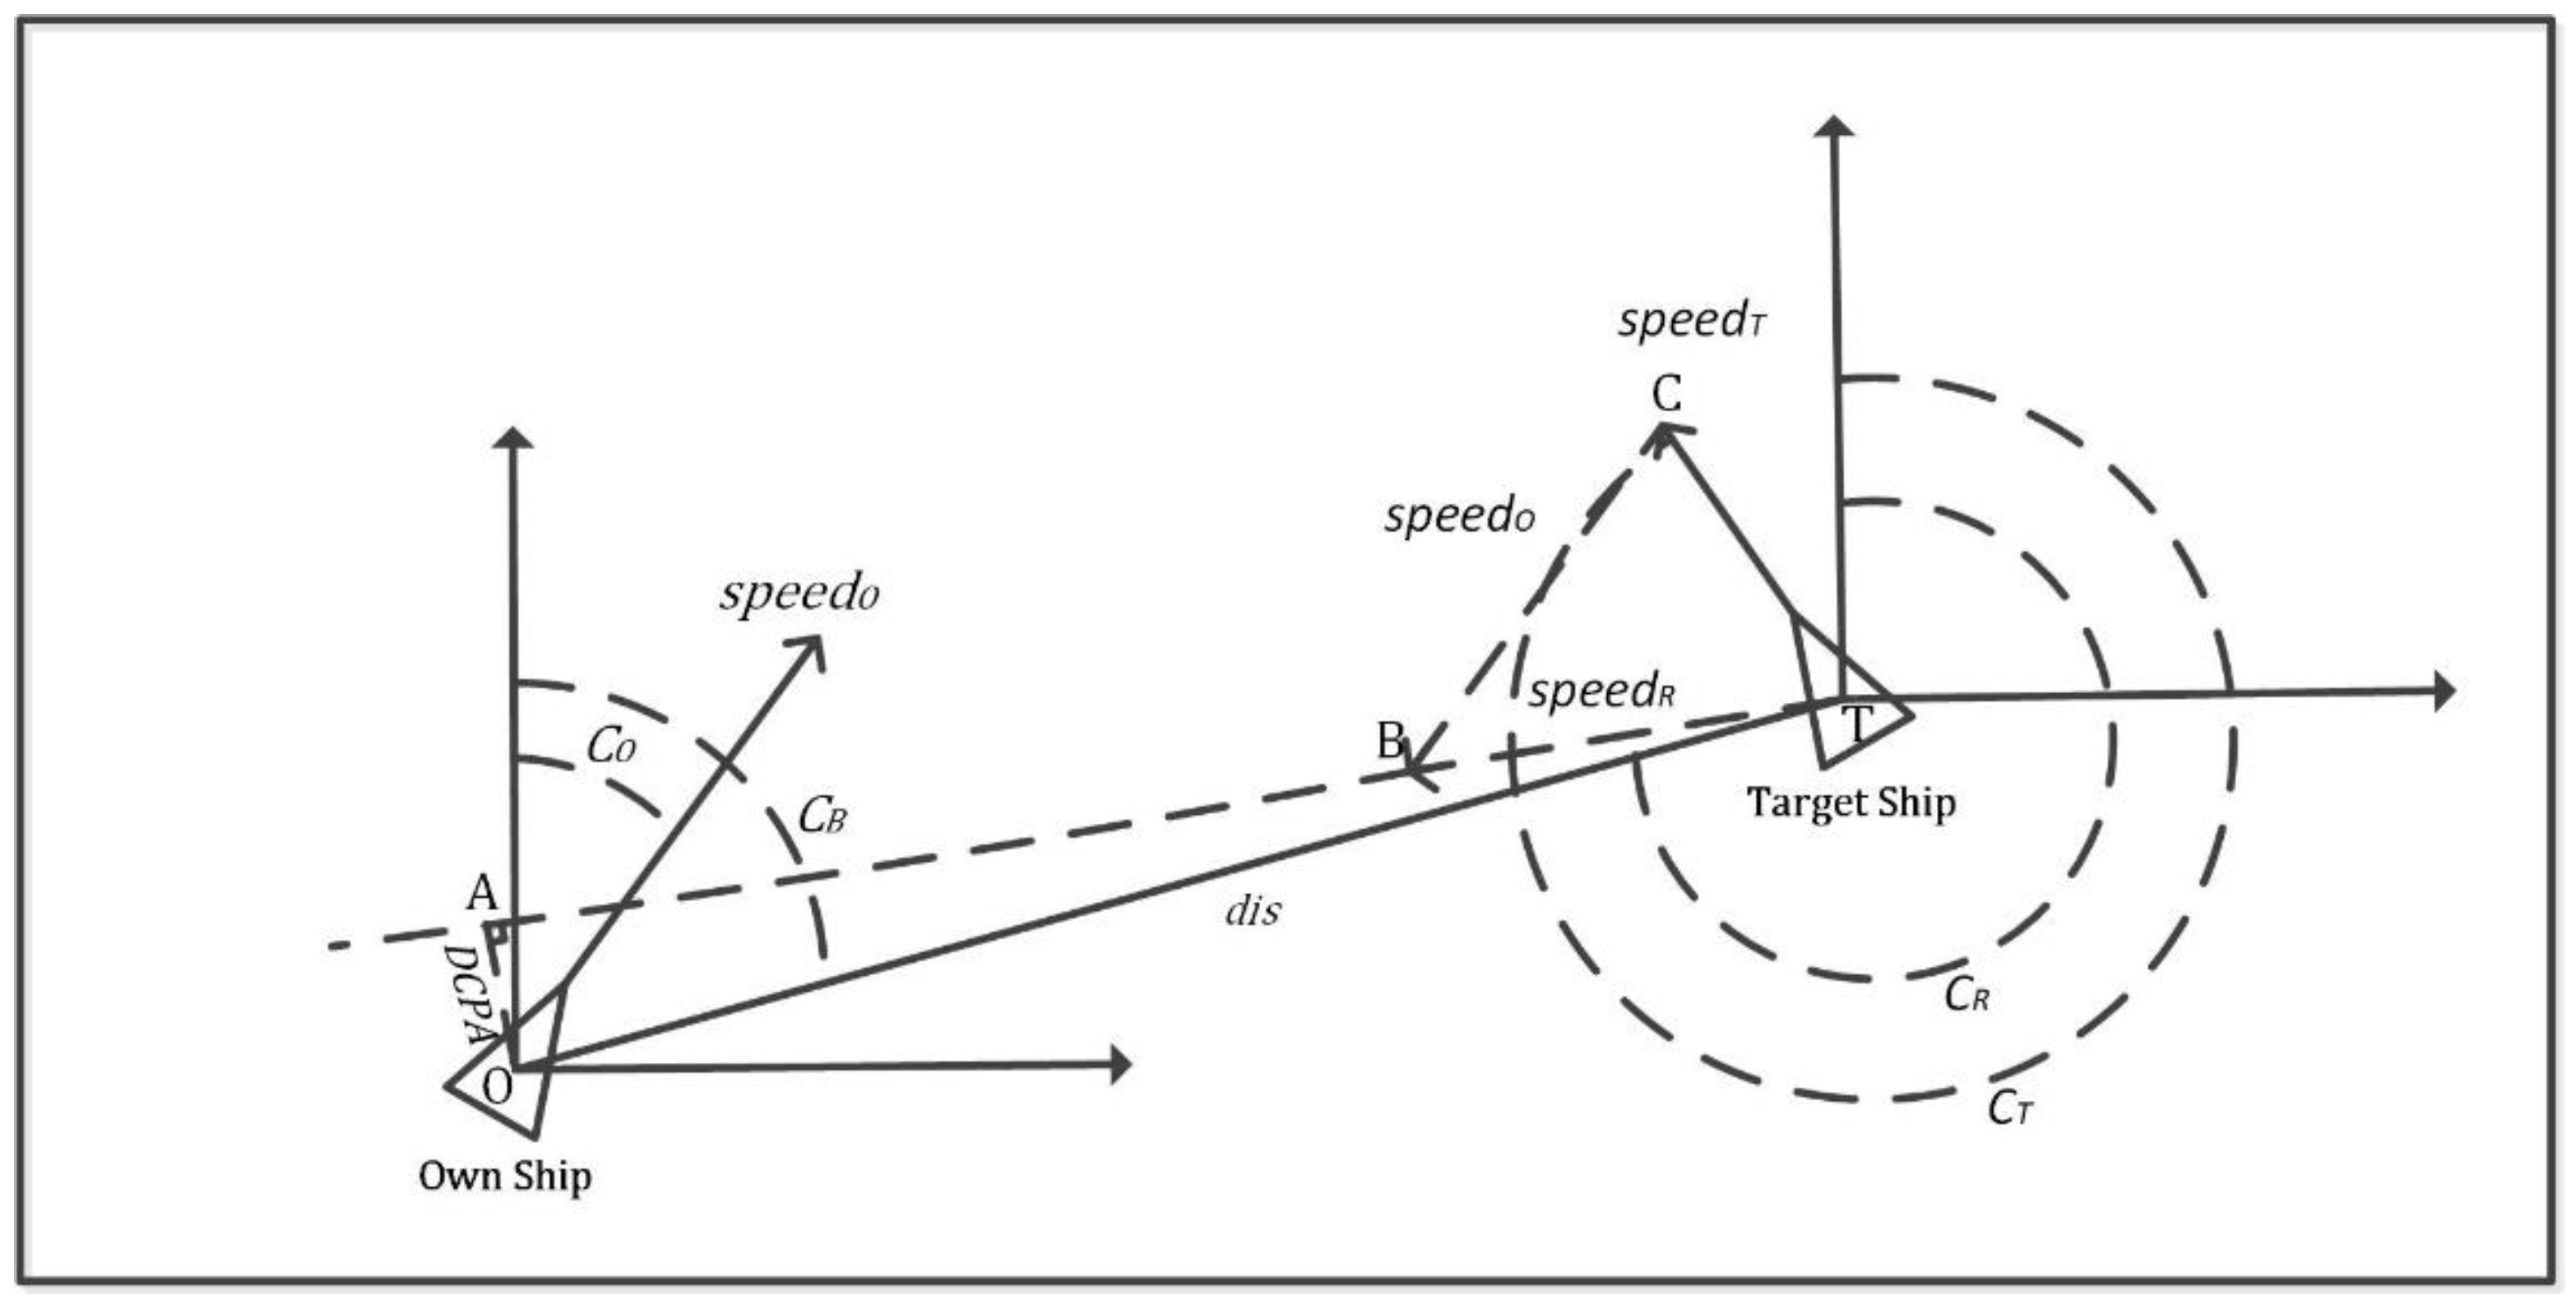
For two underway ships, the method to calculate the microscopic collision risk between them is the same as the calculation of the collision risk between two ships in open water, which is obtained in an analytic way. For them, one ship is considered as its own ship, and the other ship is considered as a target ship. Then, the relative motion relationship between these two ships can be established in a Cartesian coordinate system, as shown in
Figure 1.
Using the theory of analytic geometry, the two crucial collision risk parameters, DCPA and TCPA, can be obtained in the coordinate system as follows:
where
refers to the distance in space between two ships.
refers to the bearing of the target ship relative to its own ship, which can be obtained by the arctangent trigonometric function according to the coordinates of the two ships.
refers to the speed of the target ship relative to the own ship, which can be calculated by the speed and course information of the two ships.
refers to the course of the target ships relative to the own ship, which can be calculated based on
.
After obtaining the
DCPA and
TCPA between two ships, referred to the analytic expression of collision risk index proposed by Kearon [
5] which considered
DCPA and
TCPA, and the negative exponential function used in Zhen [
24] when established the relationship between collision risk and
DCPA/
TCPA, the microscopic collision risk between two ships in anchorage can be expressed as follows:
where
and
are the parameters in a negative exponential function, which can be obtained by setting two extreme scenarios between
DCPA and collision risk and between
TCPA and collision risk.
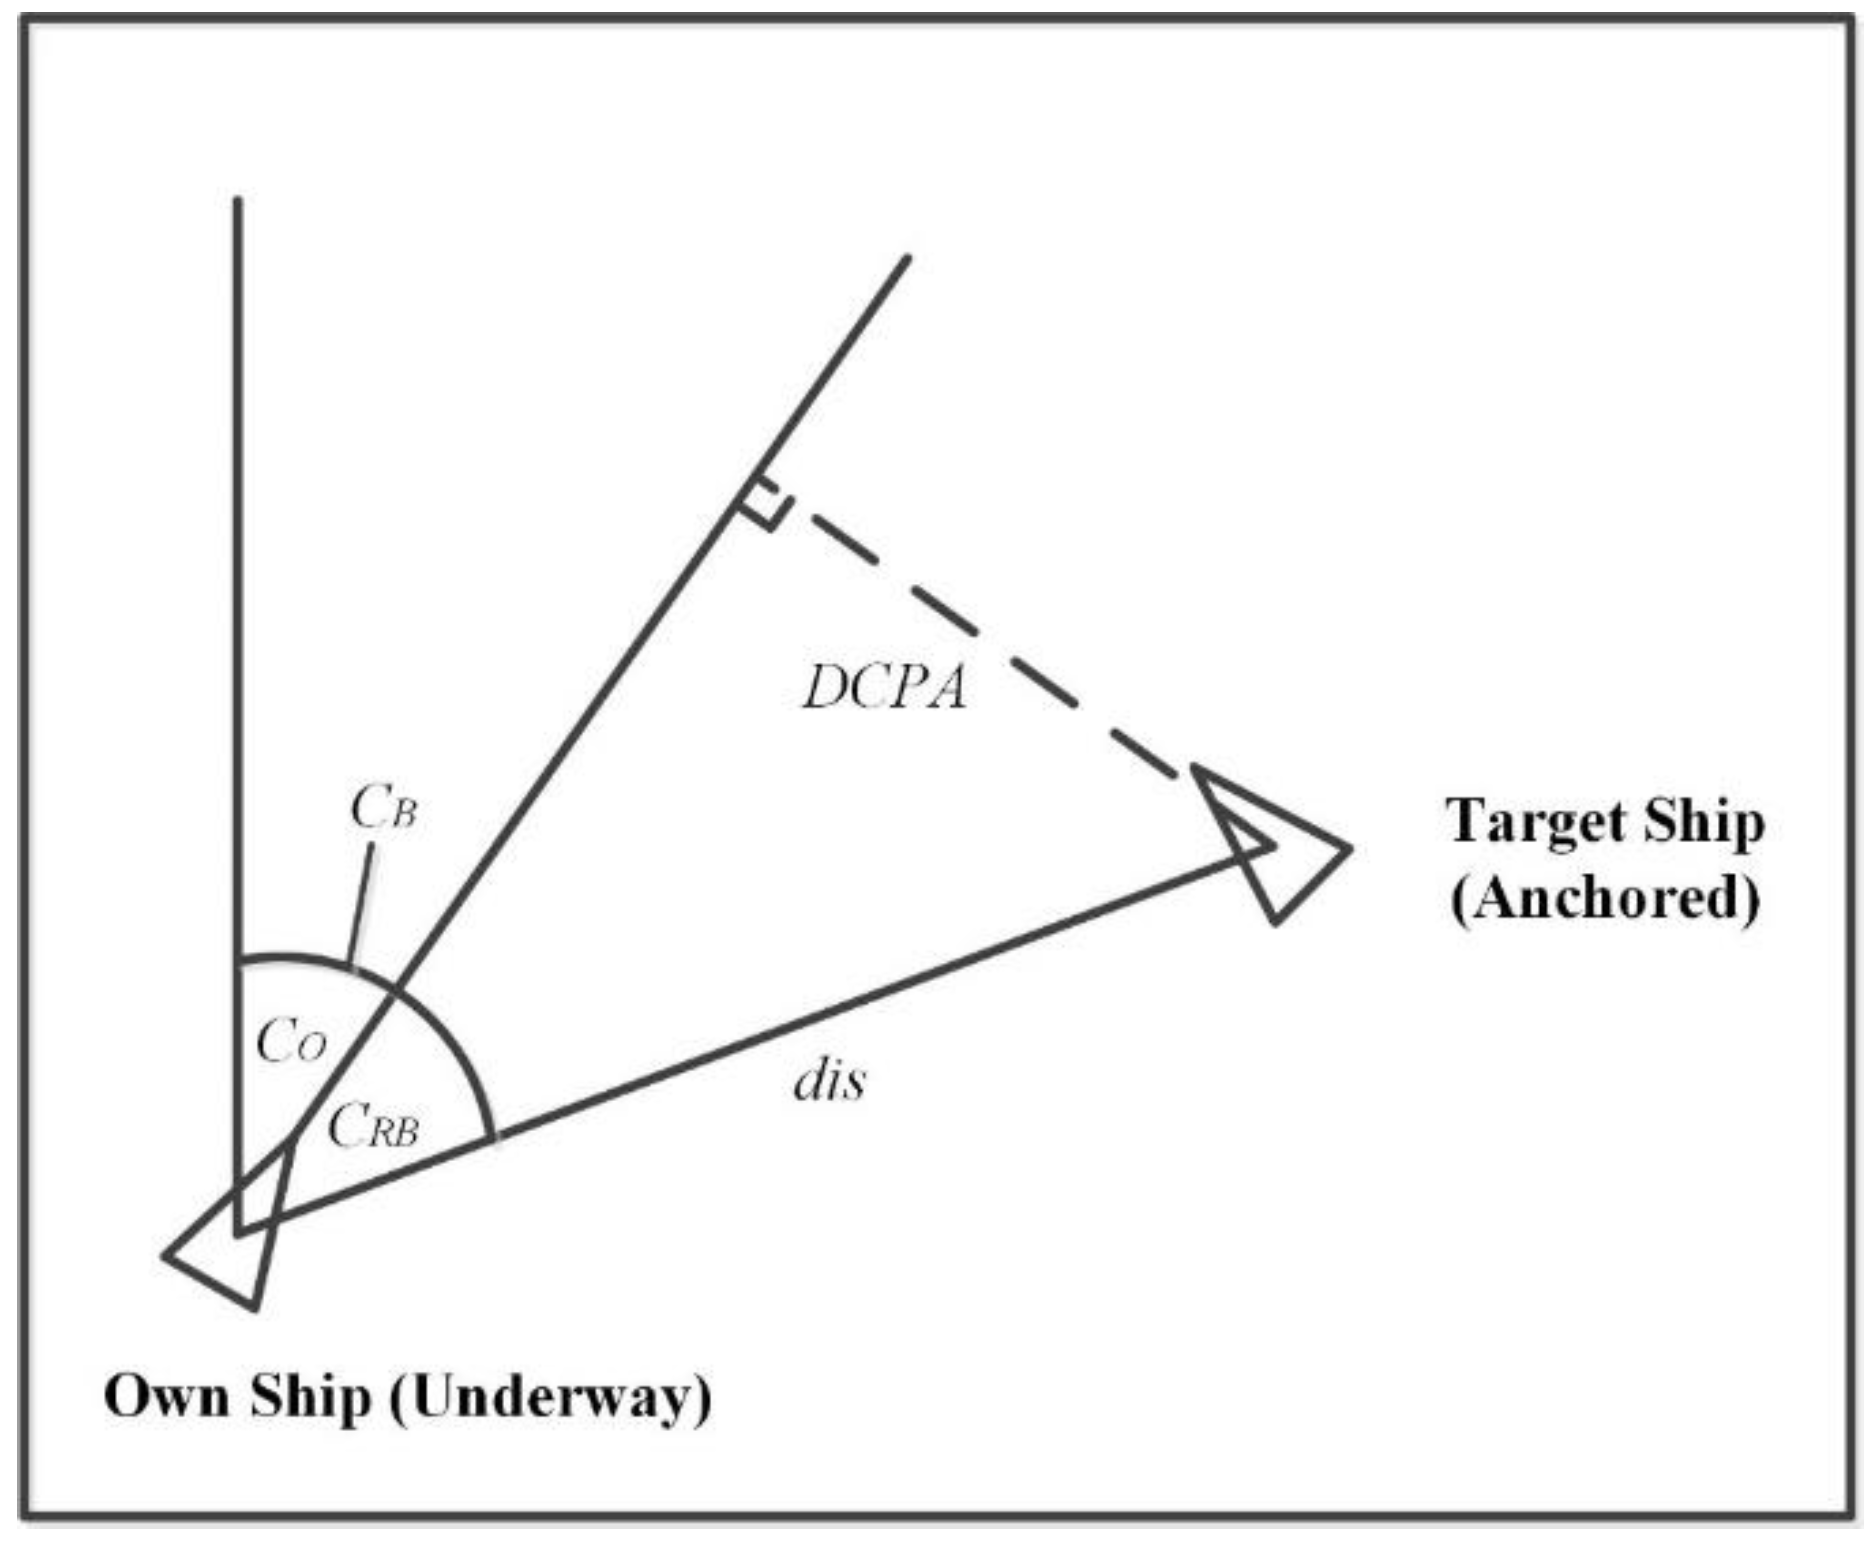
For an underway ship and an anchored ship, the calculation of the microscopic collision risk is similar to that of two underway ships. The only difference is that one ship was considered a fixed object with no speed. In other words, the relative motion between the two ships can be seemed as the relative motion of the underway ship relative to a fixed object, as shown in
Figure 2.
Therefore, the two crucial collision risk parameters,
DCPA and
TCPA, can be calculated as follows:
where
refers to the bearing of the target ship relative to the own ship, which can be obtained via Equation (9).
Similarly, after obtaining DCPA and TCPA, the microscopic collision risk between them can be obtained via Equations (7) and (8). For two anchored ships, as an anchored ship was considered a fixed object, the relative motion between them does not exist. Therefore, the microscopic collision risk between them does not exist. After identifying the microscopic collision risk between two ships in the three situations mentioned above, for the entire anchorage, the global microscopic collision risk can be obtained by average processing.
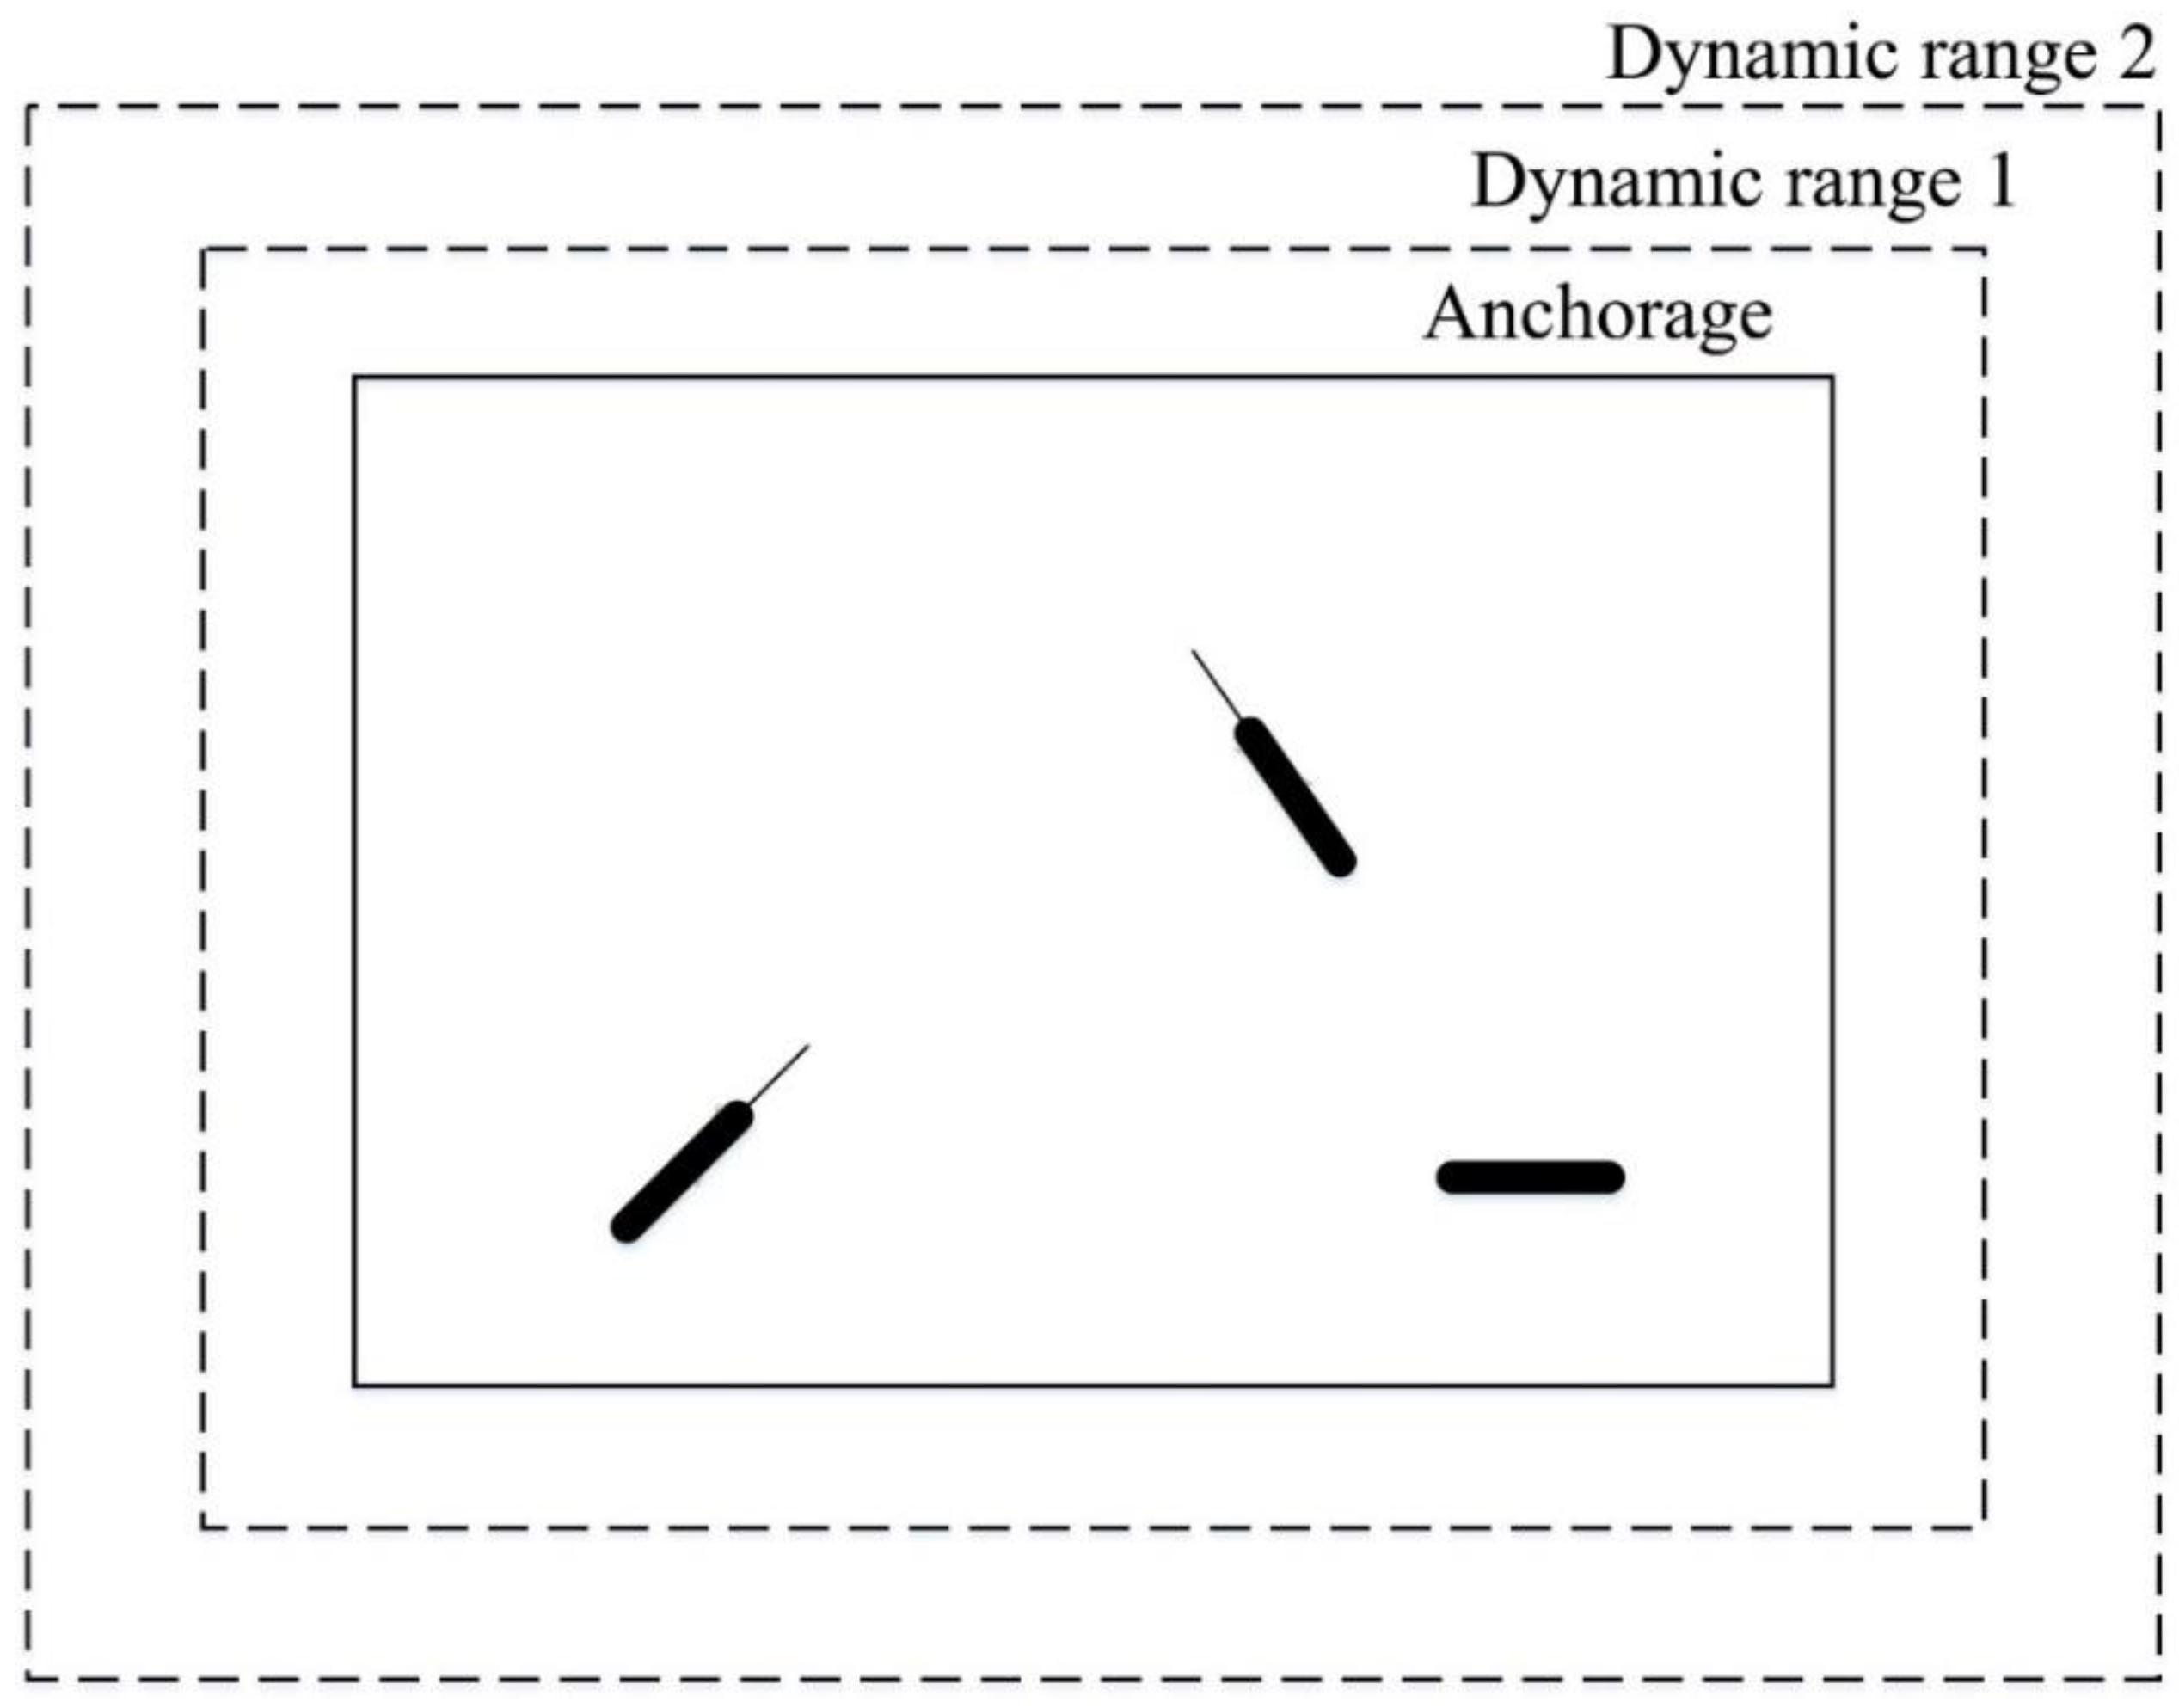
The macroscopic collision risk of anchorage is calculated by considering the characteristics of the anchorage itself and from the perspective of the safe navigable waters in the anchorage and its adjacent waters so as to evaluate the overall collision risk of the anchorage that ships sailing to or through the waters. For a ship sailing to or through the waters, the smaller the safe navigable waters, the more difficult it is to conduct collision avoidance maneuvers, and, thus, the higher the possibility of a collision accident. Therefore, the key to calculating macroscopic collision risk is to identify the size of safe navigable waters.
To identify the size of safe navigable waters, the first step is to determine the scope of the studied waters. Considering that the macroscopic collision risk of anchorage is for ships sailing to or through the waters, this study’s area includes not only the anchorage area but also the area around the anchorage area. This paper extended the anchorage outward according to the average ship domain scale of the ships in the anchorage, as shown in
Figure 3. The extended range is a variable dynamic range and will vary depending on the size and number of ships within the anchorage.
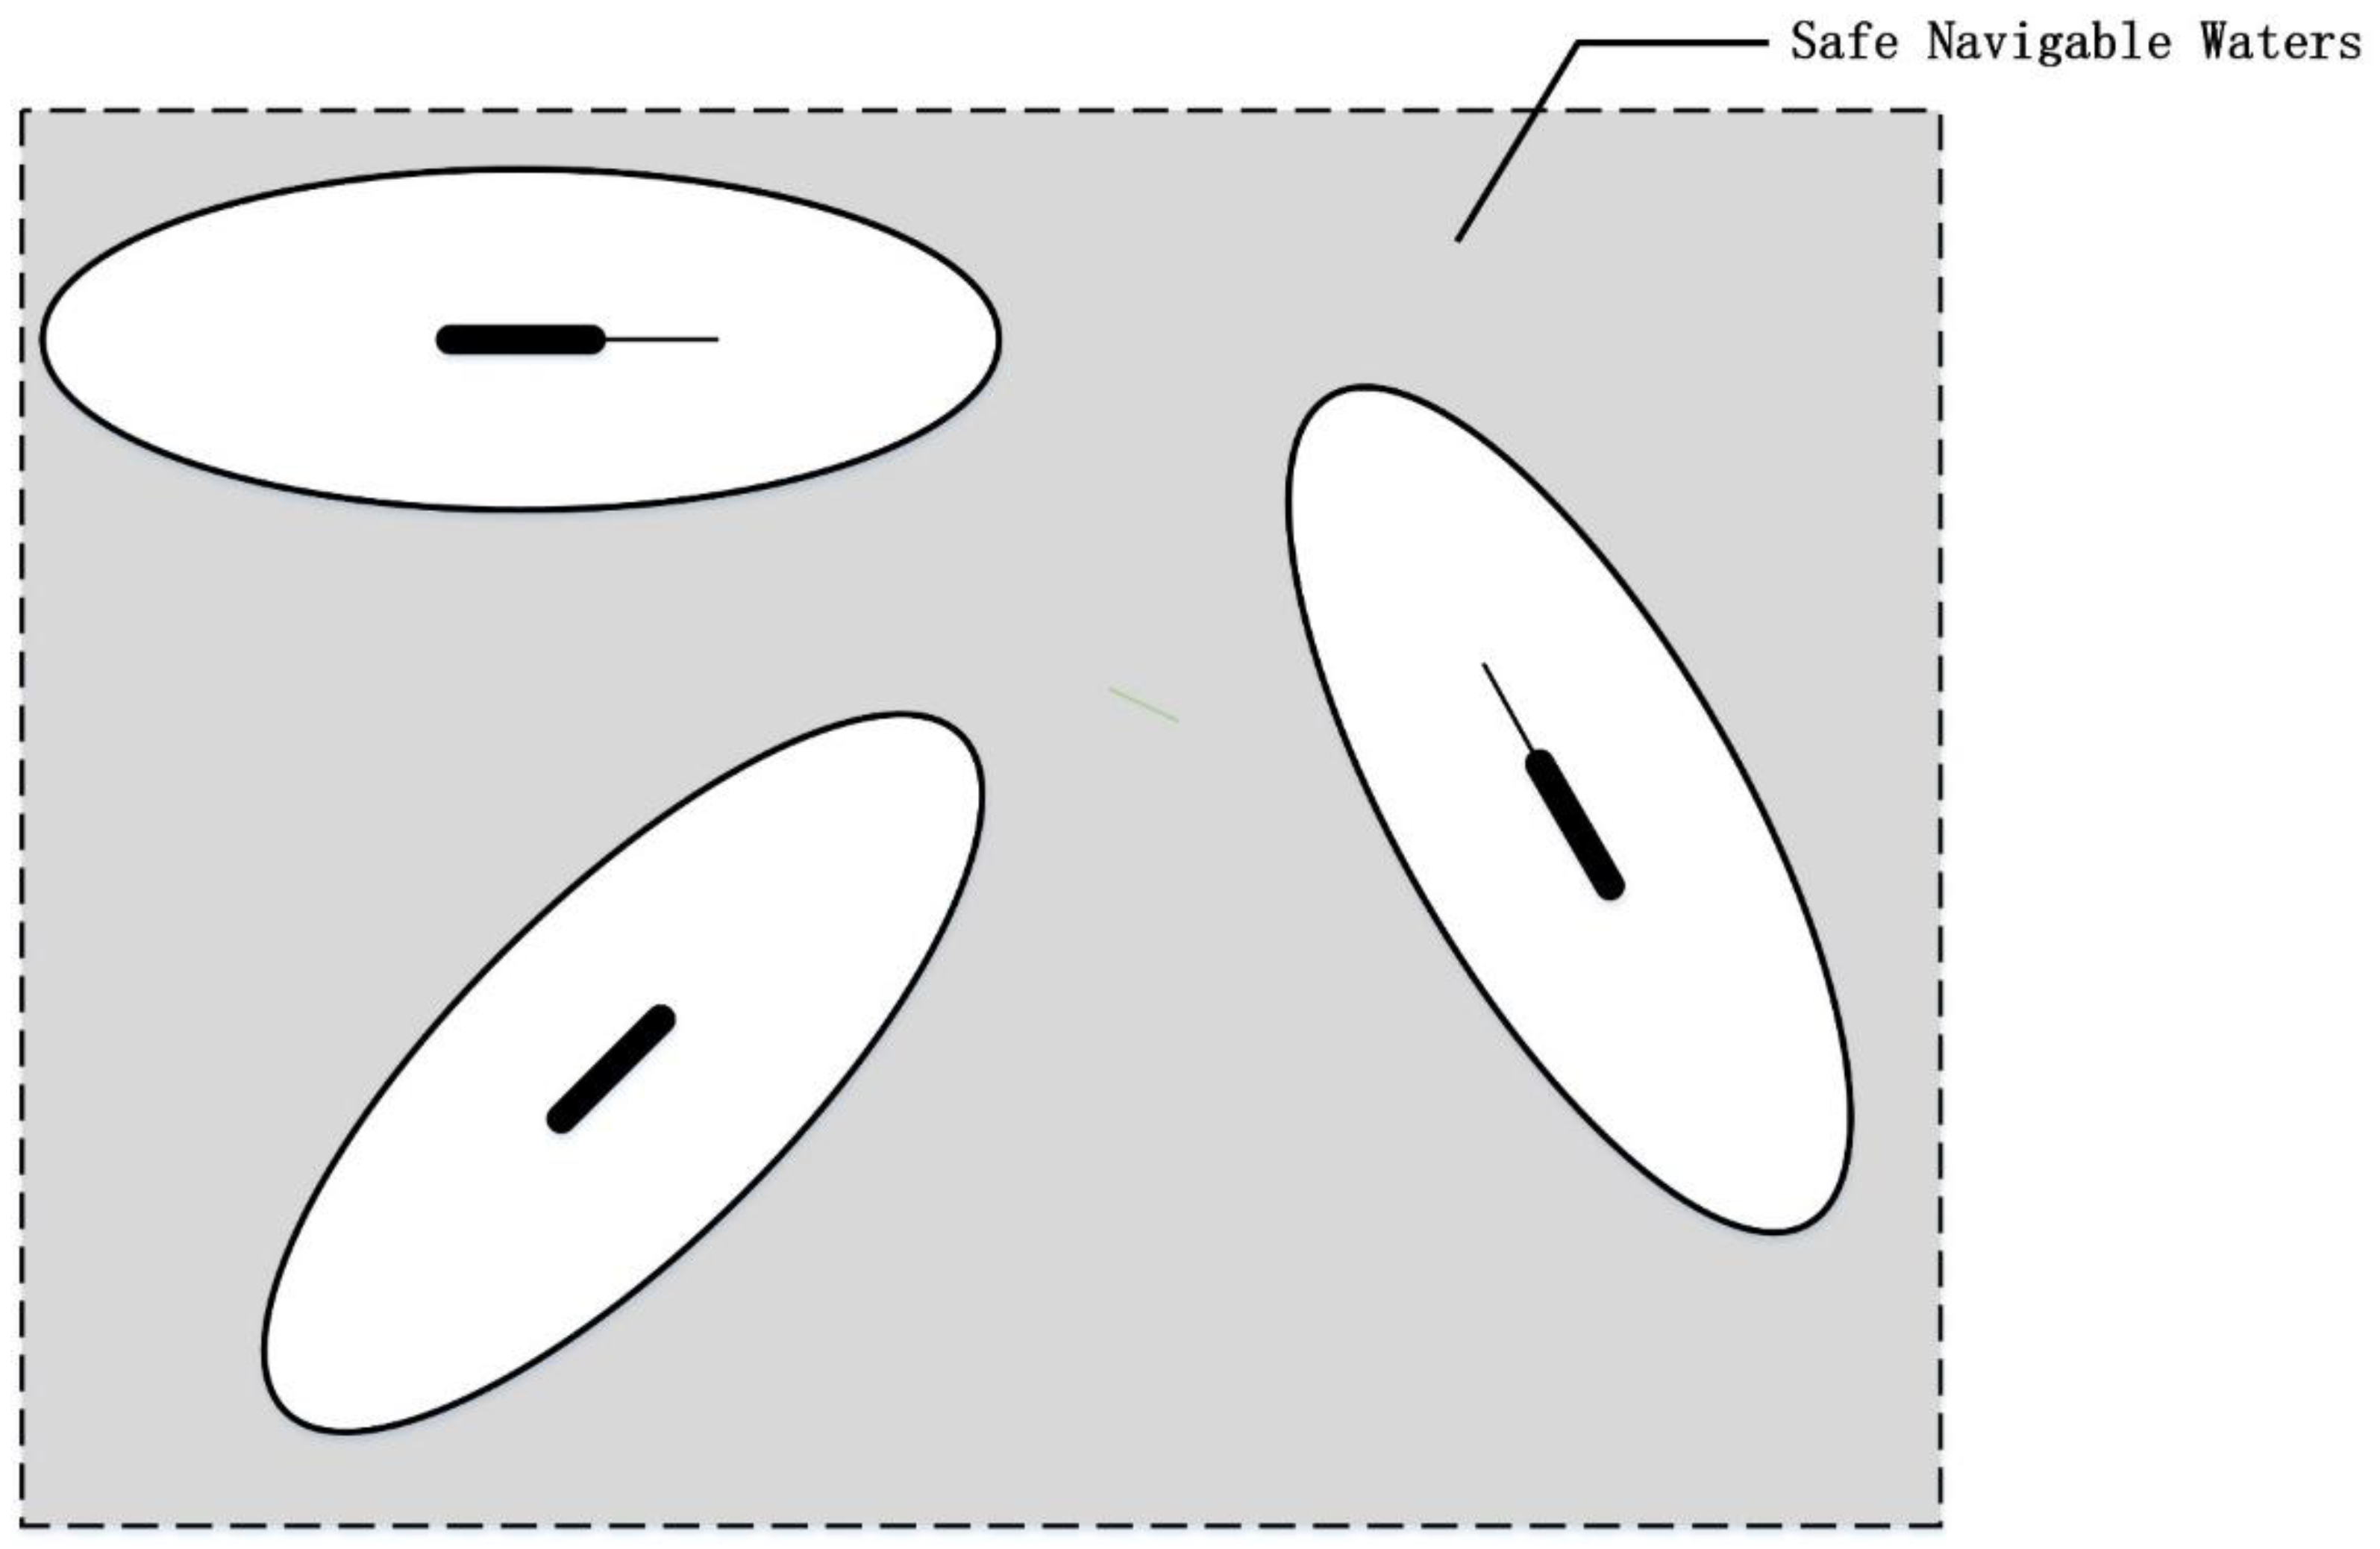
In addition, it is necessary to calculate the overall area of the anchorage and its surrounding waters
, according to the coordinates of the anchorage edges, and the size of safe navigable waters
, based on the area of all arenas within anchorage. The size of the arena of the ship was determined according to the relationship between the arena and ship domain summarized by Davis et al. [
34]. The safe navigable waters in this paper are shown in
Figure 4.
Then, the macroscopic collision risk can be obtained by calculating the ratio of the safe navigable waters
to the total area of the study waters
and combining with the negative exponential function in Equation (6), which can be expressed as Equation (10).
In addition to the microscopic and macroscopic collision risk, this paper also considered the complexity of ship traffic in the anchorage and its adjacent waters in the identification of the anchorage collision risk, so that the collision risk of the anchorage can be identified more accurately and effectively under the increasingly complex ship traffic situation. The consideration of the complexity of ship traffic in the anchorage in this paper is based on the compactness of the spatial distribution of ships in the anchorage and its adjacent waters, which can be obtained by applying the radial distribution function in statistical mechanics [
35,
36].
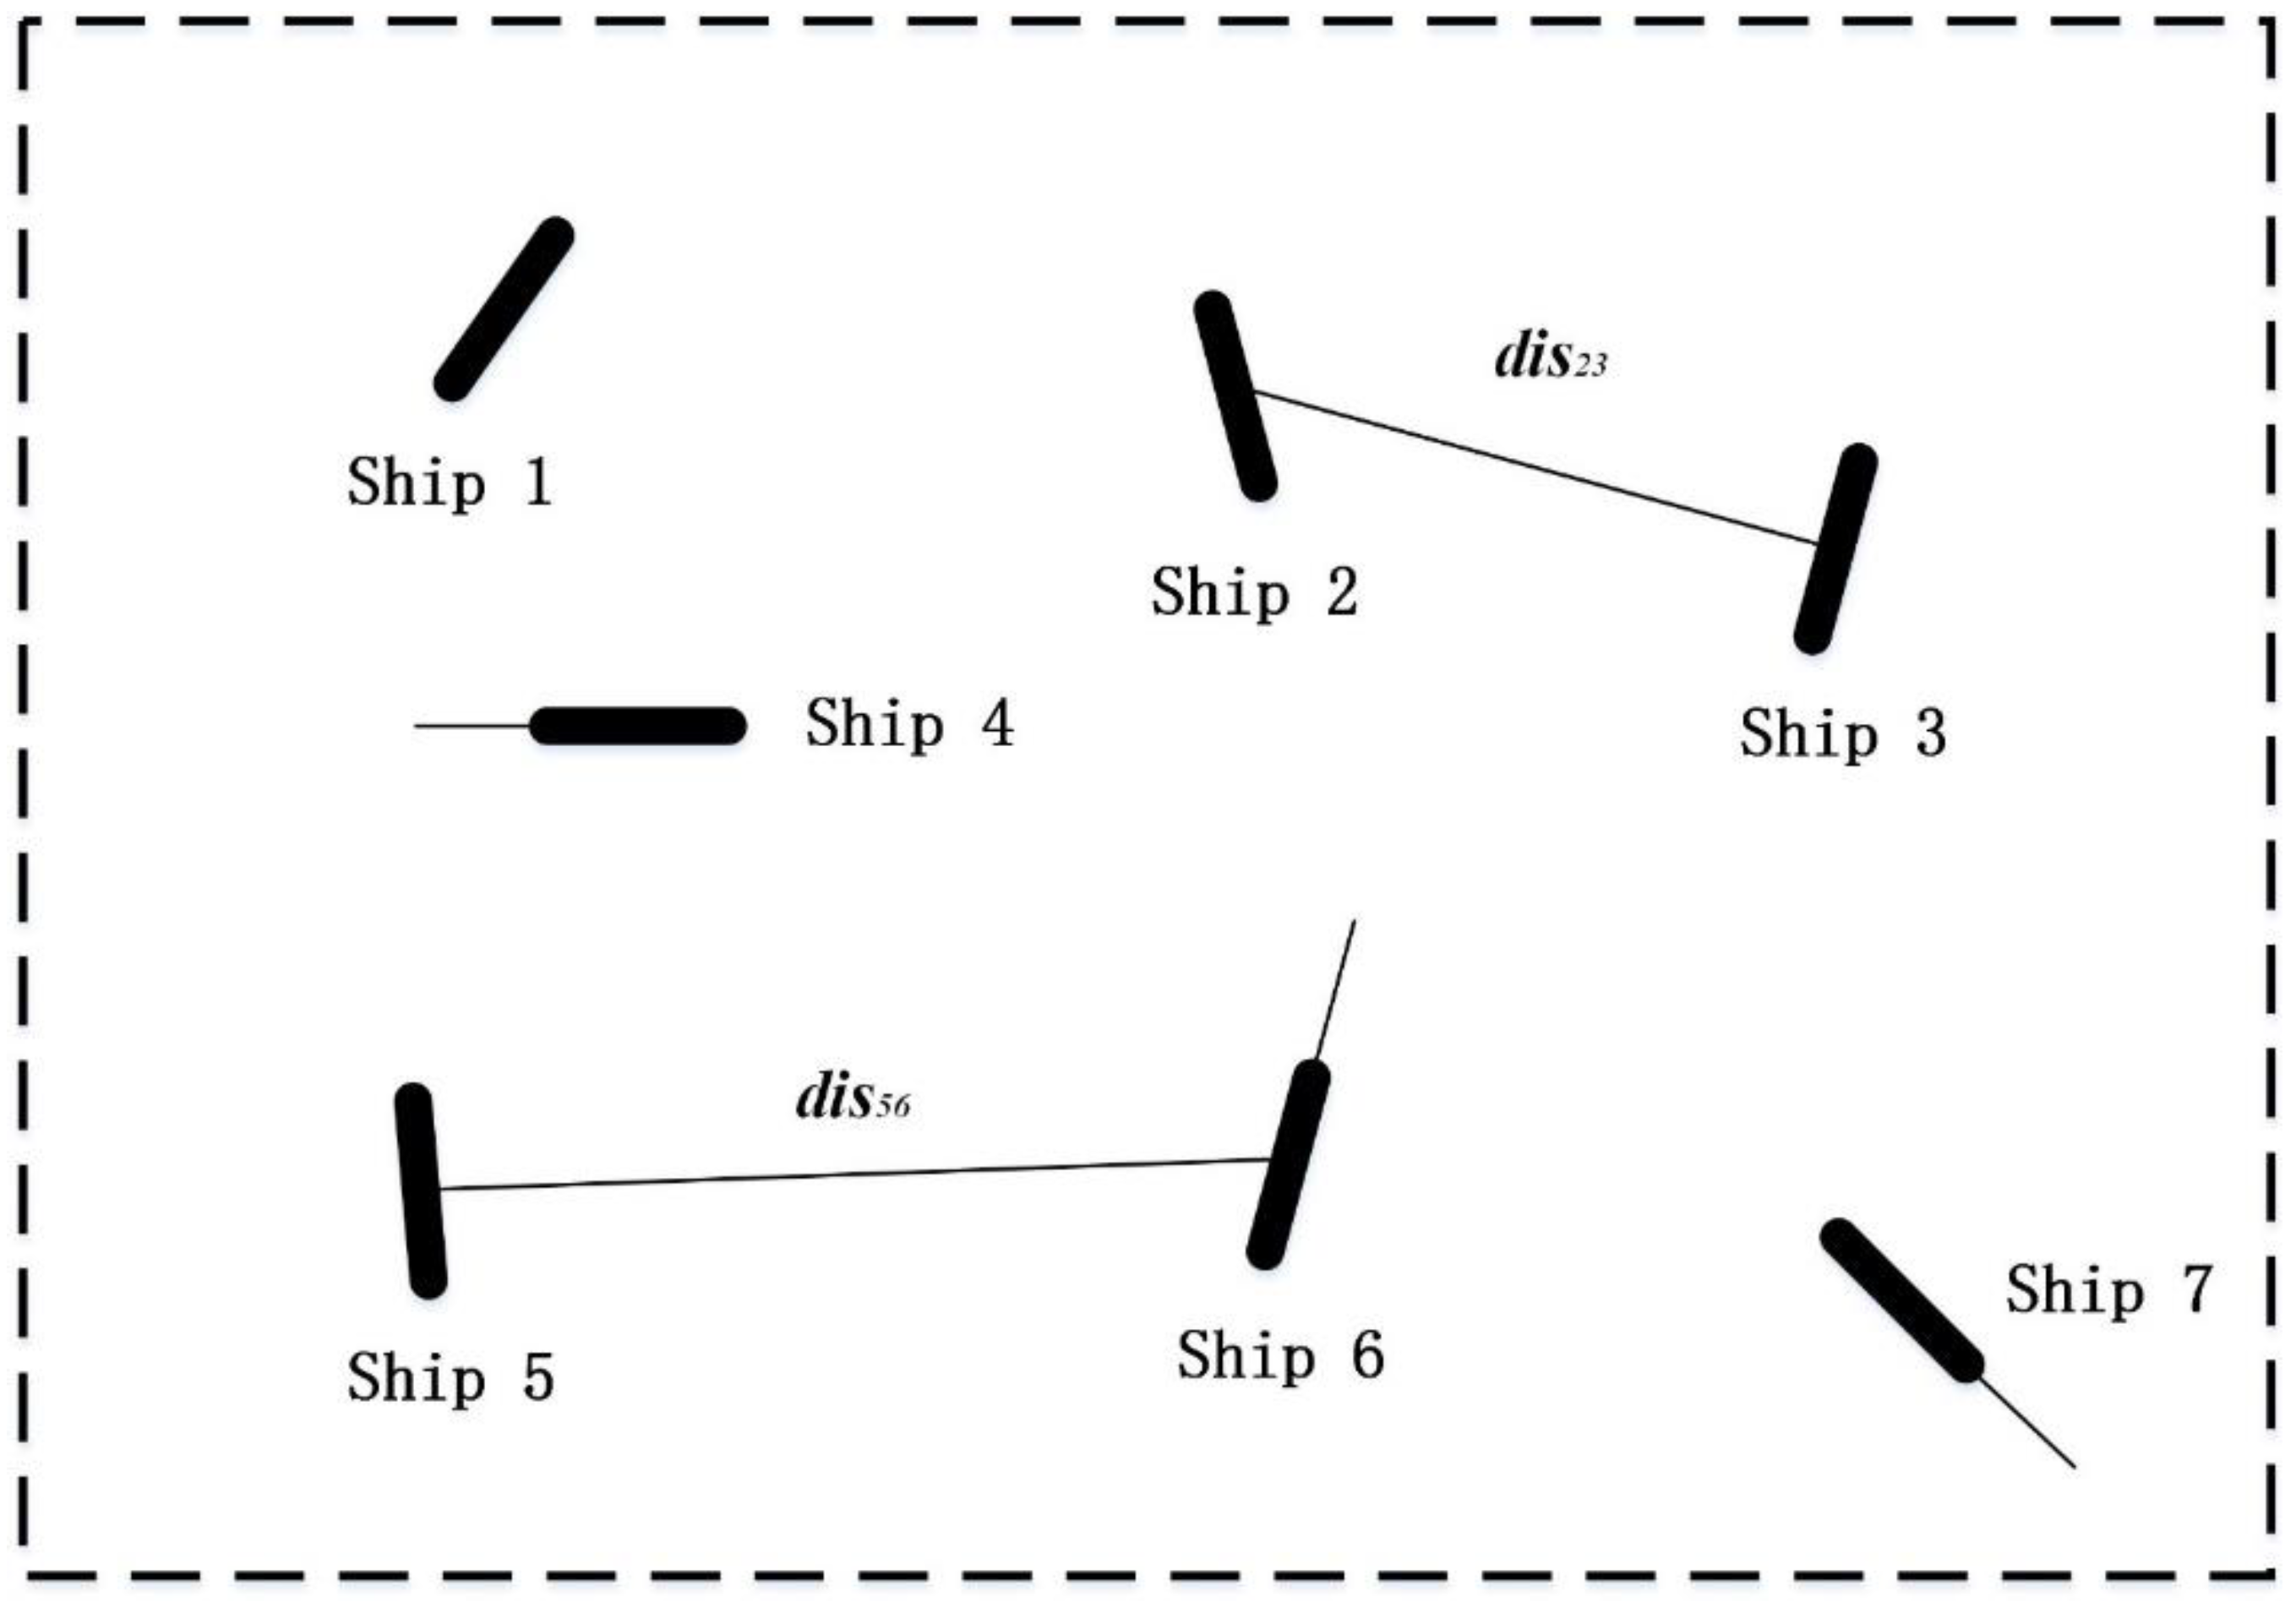
In the radial distribution model, the ships in anchorage were considered particles, and all ships within the boundary of anchorage were considered a particle system. In other words, to calculate the spatial complexity of the ships within anchorage, the first step is to calculate all distances between any two ships, as shown in
Figure 5.
Then, the radial distribution function was brought in by considering the anchorage and its adjacent waters as the distribution space. It should be noted that due to the characteristic of ship traffic, which sails on a two-dimensional plane, the distribution space is also a two-dimensional space, so the corresponding radial distribution function needs to be transformed from three-dimensional to two-dimensional. As the ship is regarded as a particle, its radial distribution in the two-dimensional space of the studied water is described, and the radial distribution is integrated within a certain threshold to obtain the spatial complexity according to the characteristic of the radial distribution function, as expressed in Equations (11) and (12).
After obtaining the collision risk in microscopic aspect
, macroscopic aspect
, and spatial compactness
, referring to the analytic expression proposed by Kearon [
5], the anchorage collision risk can be identified by the analytical expression in Equation (13).
where
,
, and
are the weight coefficients of the collision risk in each aspect. The three coefficients are set equal for normal situations and can be decided by maritime experts according to the characteristics of the studied water area, traffic situation, and identification purpose. For example, in the water area with extremely complicated ship traffic, the coefficient
which represents the importance of the collision risk in the complexity aspect, needs to be increased appropriately because the traffic complexity has a significant impact on collision risk in such water area. The anchorage collision risk
can reflect the risk level of collision within the anchorage and its adjacent waters considering the relative motion, anchorage characteristics, and spatial complexity, which can provide mariners and maritime surveillance operators with reference to the collision risk level within the anchorage waters so as to improve the maritime traffic safety.
4. Case Study
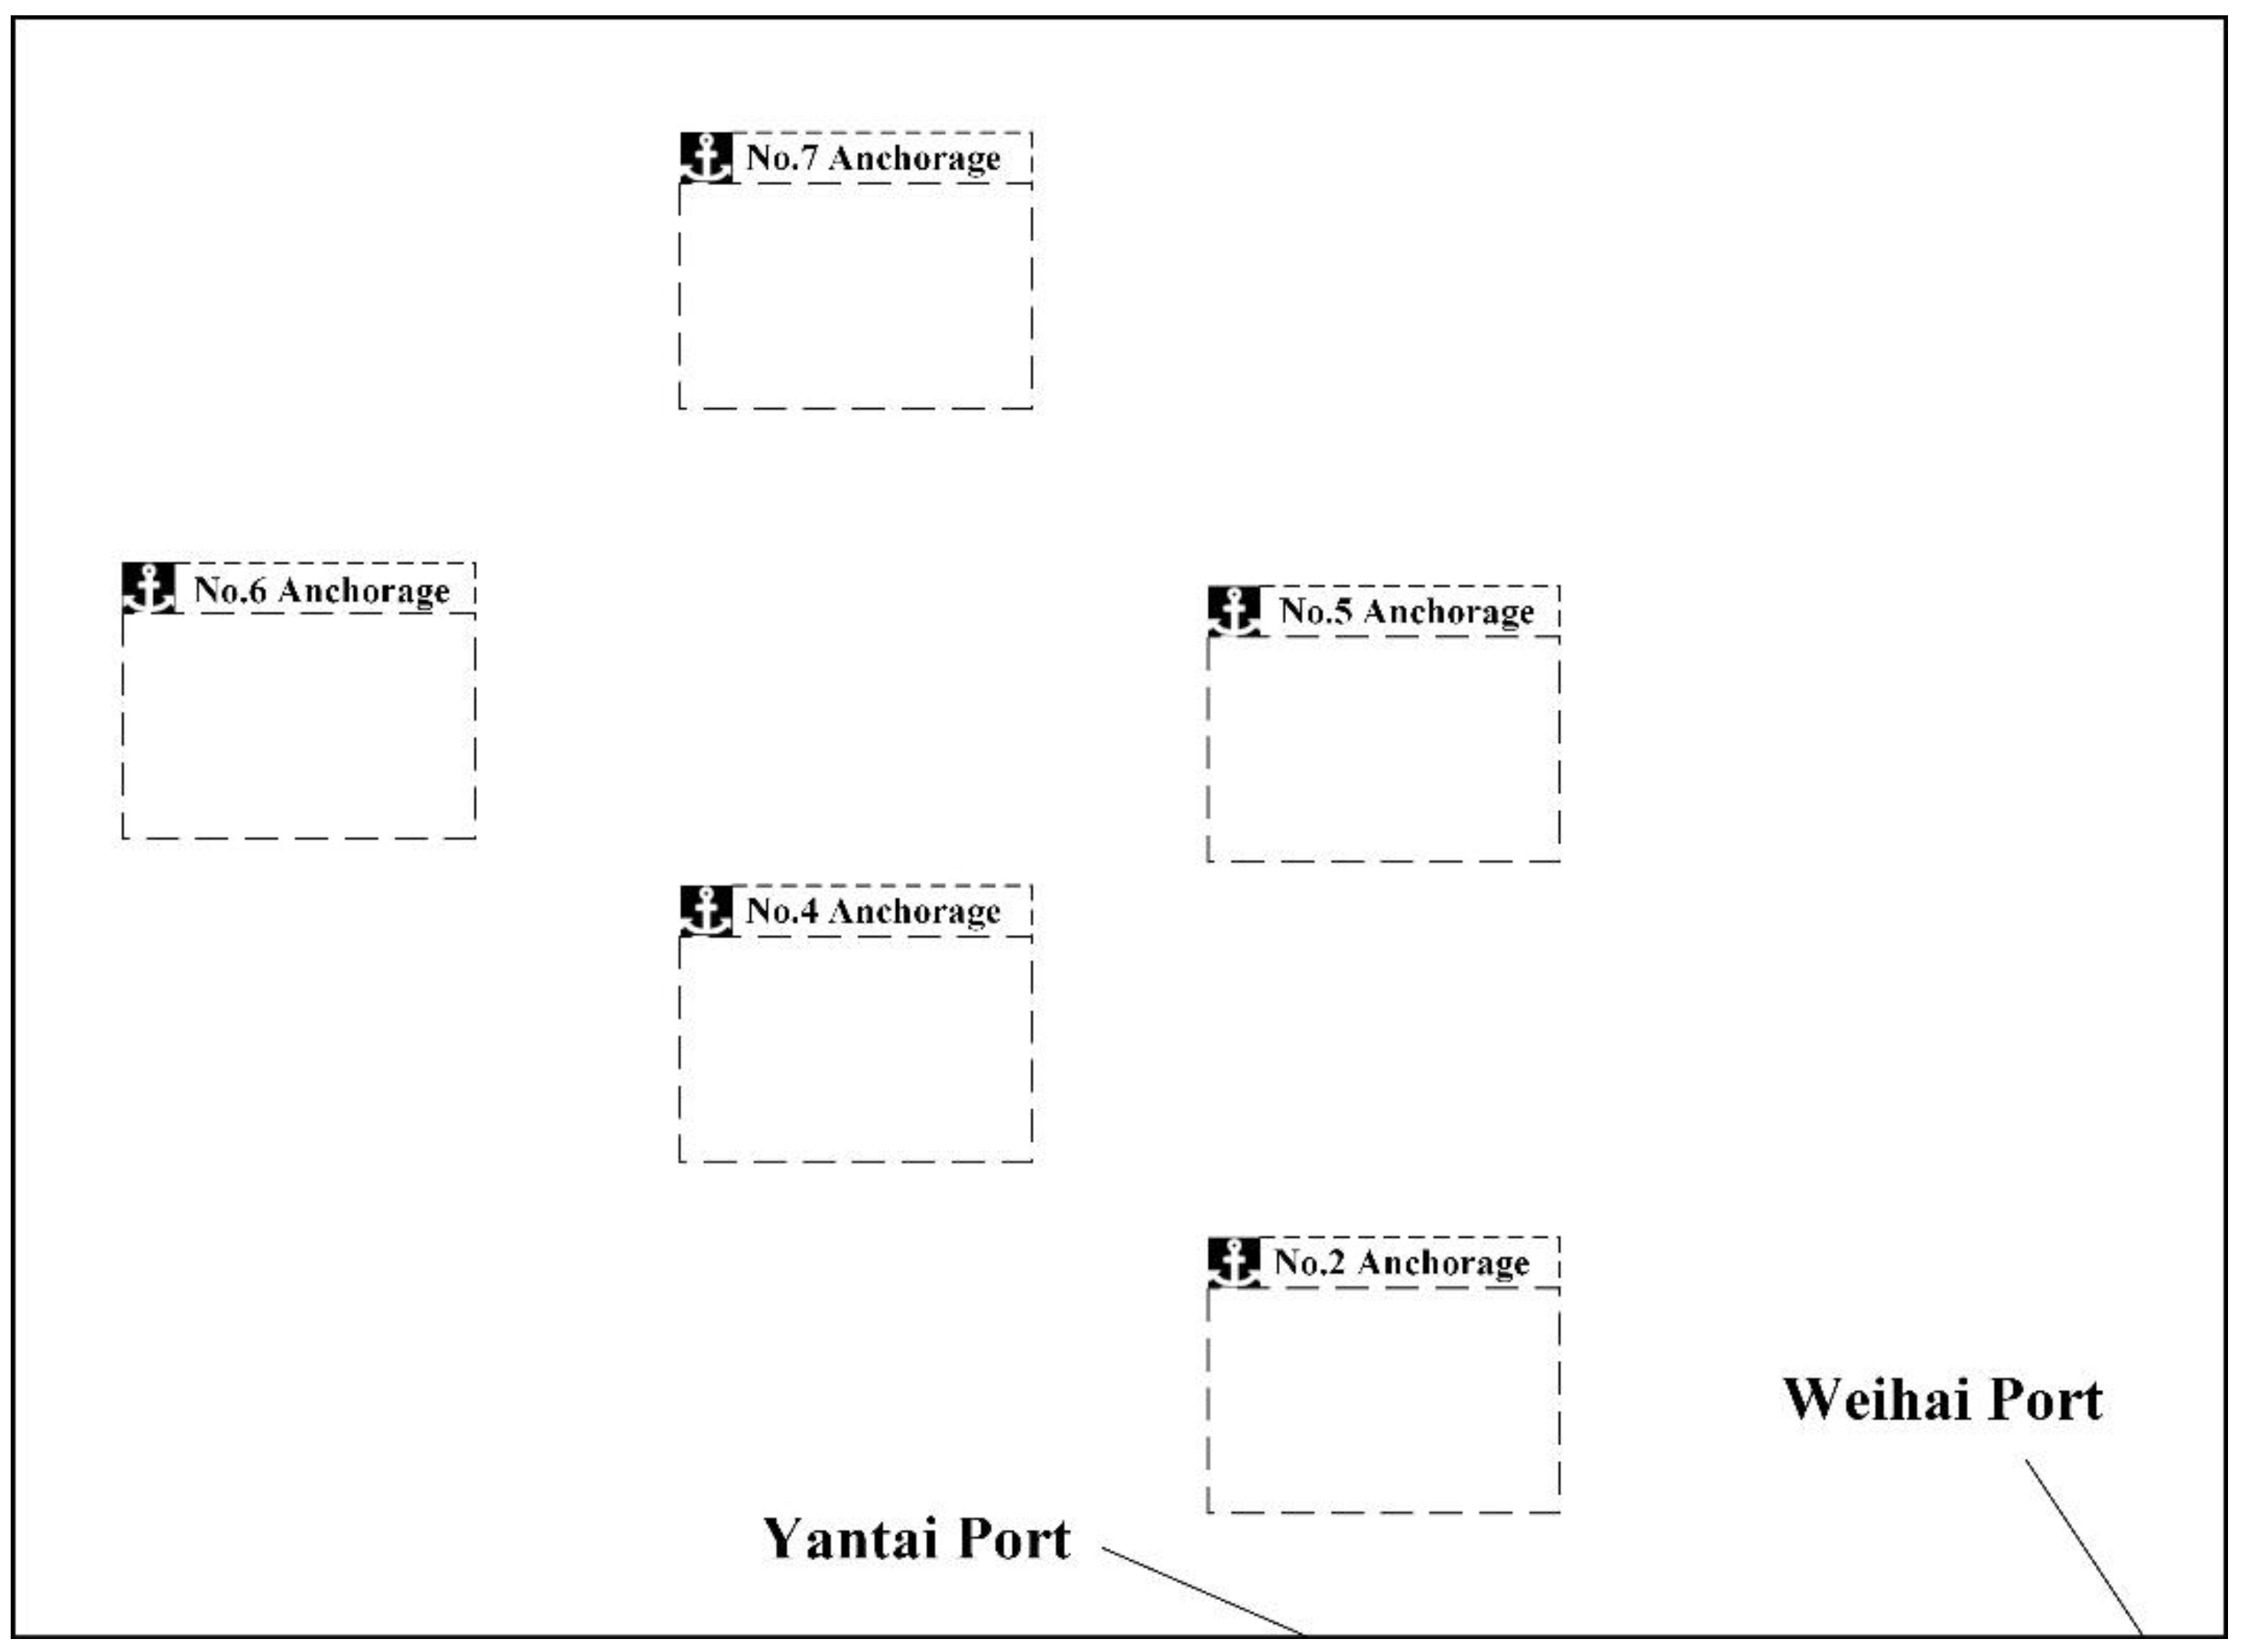
To validate that the proposed model can identify the collision risk of anchorage effectively, some experimental case studies were carried out using the real AIS data in some of the anchorages of the Northern Yellow Sea. The studied anchorages are on the north side of the Shandong Peninsula. There are some busy ports nearby, such as Weihai Port, Yantai Port, and Penglai Port. The volume of ship traffic here is relatively big, so some of the ships have to wait in the anchorage according to the schedule. Although anchoring in the anchorage can relieve the traffic pressure to a certain extent, when the number of ships in the anchorage increases, the possibility of collision accidents will increase both inside and outside the anchorage. The studied anchorages are illustrated in
Figure 6.
In this article, the AIS data used in case studies is in June 2022. Before experiments, the source data should be encoded first. The encoded AIS data were stored in a database. Then, the data should be filtered to exclude the invalid one. Because the receiving time of AIS data of ships is different, the time labels of the ship navigation information obtained from the AIS data of different ships will be inconsistent. Therefore, it is necessary to interpolate the data according to the time labels before experiments to make the data have the same time labels.
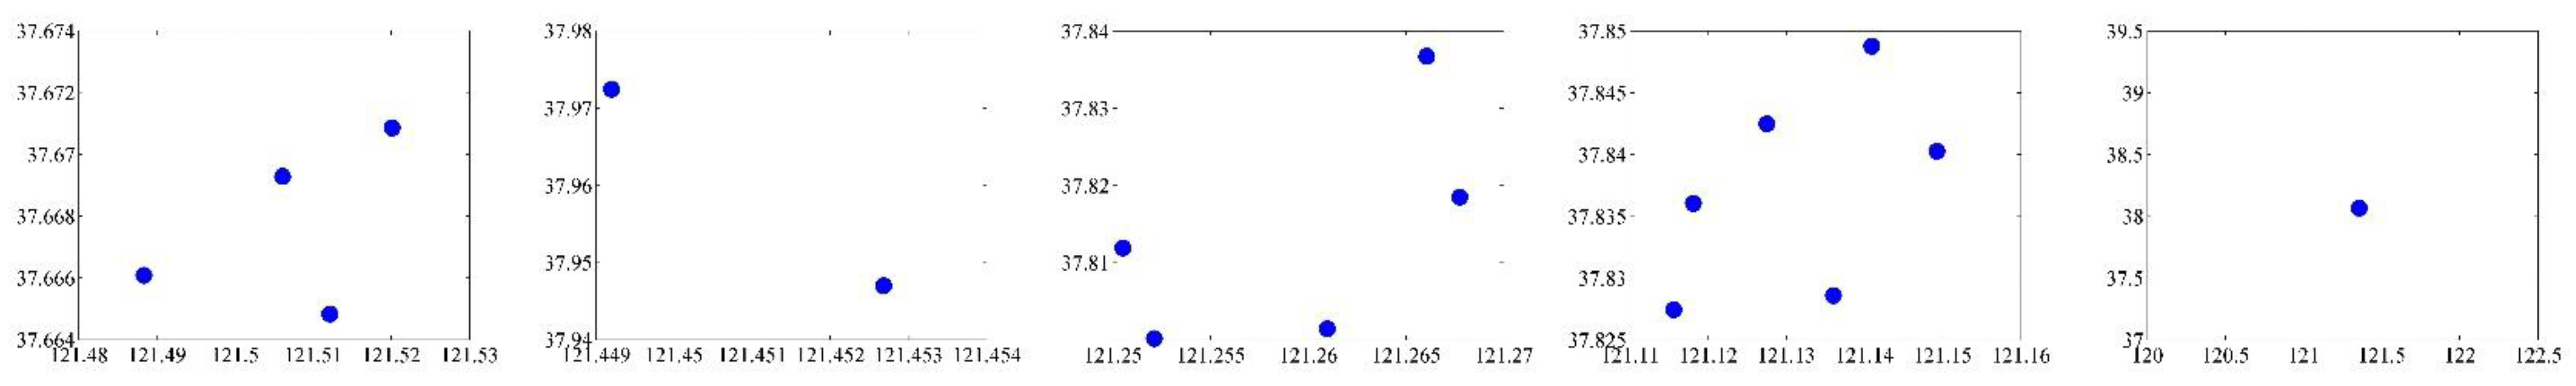
The first case study is to validate the proposed model in a spatial aspect. Anchorage No. 2, Anchorage No. 4, Anchorage No. 5, Anchorage No. 6, and Anchorage No. 7 were selected in this case study. After inputting the required information into the proposed model, the collision risk of these anchorages for a designated timing can be obtained. Firstly, the collision risks at 1620 on 18 June 2022 were identified. The results are shown in
Table 1. The ship positions in the anchorages are shown as blue dots in
Figure 7.
For analyzing the results in
Table 1, another index, ship traffic density, which can reflect the collision risk to some extent, was adopted. The ship densities for these anchorages at the moment are shown in
Table 2.
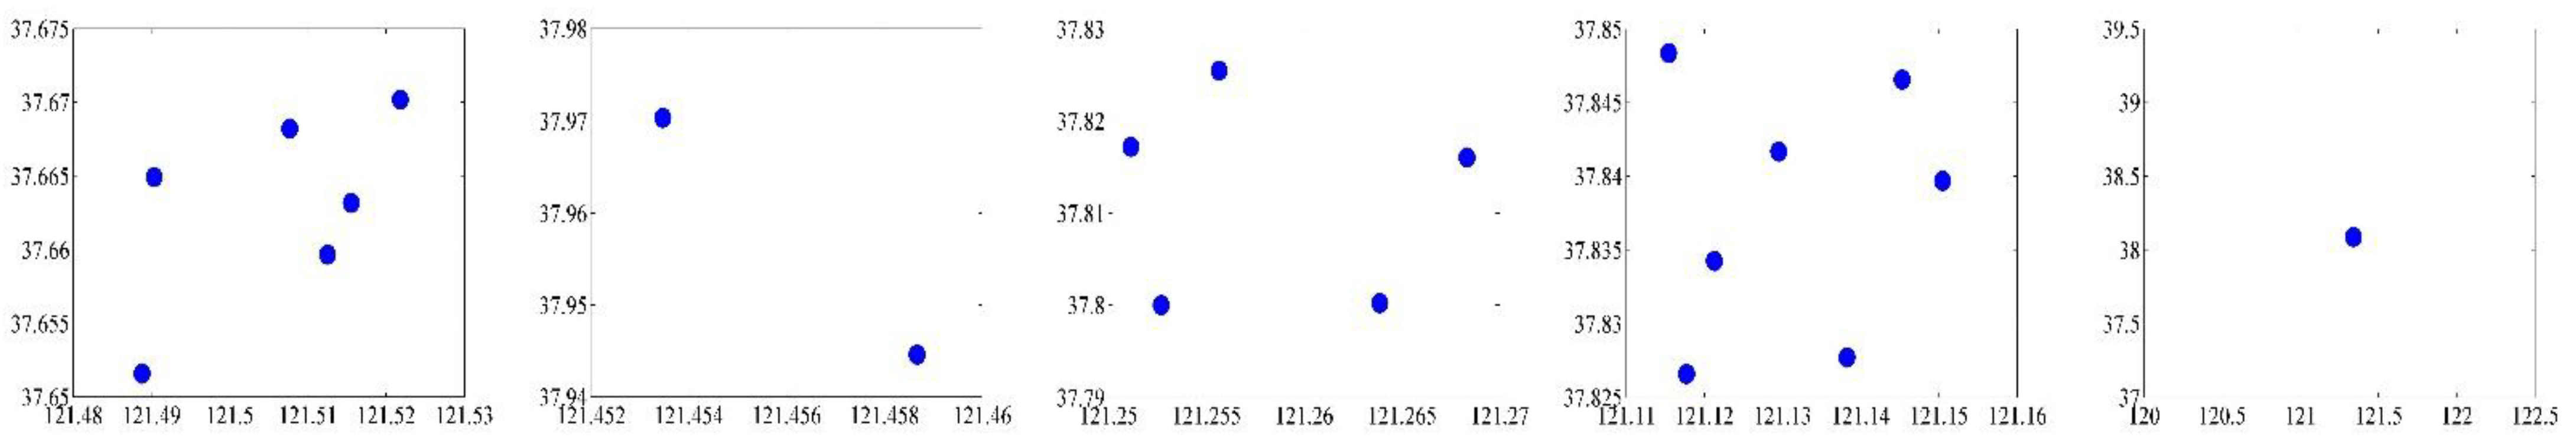
It can be observed that the anchorage with relatively high density also has a larger collision risk value, such as Anchorage No. 5 and No. 6. Anchorage No. 7, which has the least density, also presents the smaller collision risk value. As the ship traffic density can represent the collision risk to some extent, the capability of the proposed model to identify the collision risk of anchorage was validated. Further, another timing, at 2350, on 18 June 2022, was selected to carry out the case study mentioned above again. The collision risks for these anchorages obtained from the proposed model are shown in
Table 3, and the ship densities are shown in
Table 4. The ship positions in the anchorages are shown in
Figure 8.
Comparing the results in
Table 3 to that in
Table 4, the positive relationship between the anchorage collision risk and ship traffic density can also be found, where Anchorage No. 6 has the largest collision risk value and ship traffic density and Anchorage No. 7 has the smallest collision risk value and ship traffic density. In addition, comparing the results of 2350 to that of 1620, it can be found that with the increase or decrease in the number of ships in the anchorage, the collision risk in the anchorage will also increase or decrease in most cases. Therefore, the effectiveness of the proposed model can be validated.
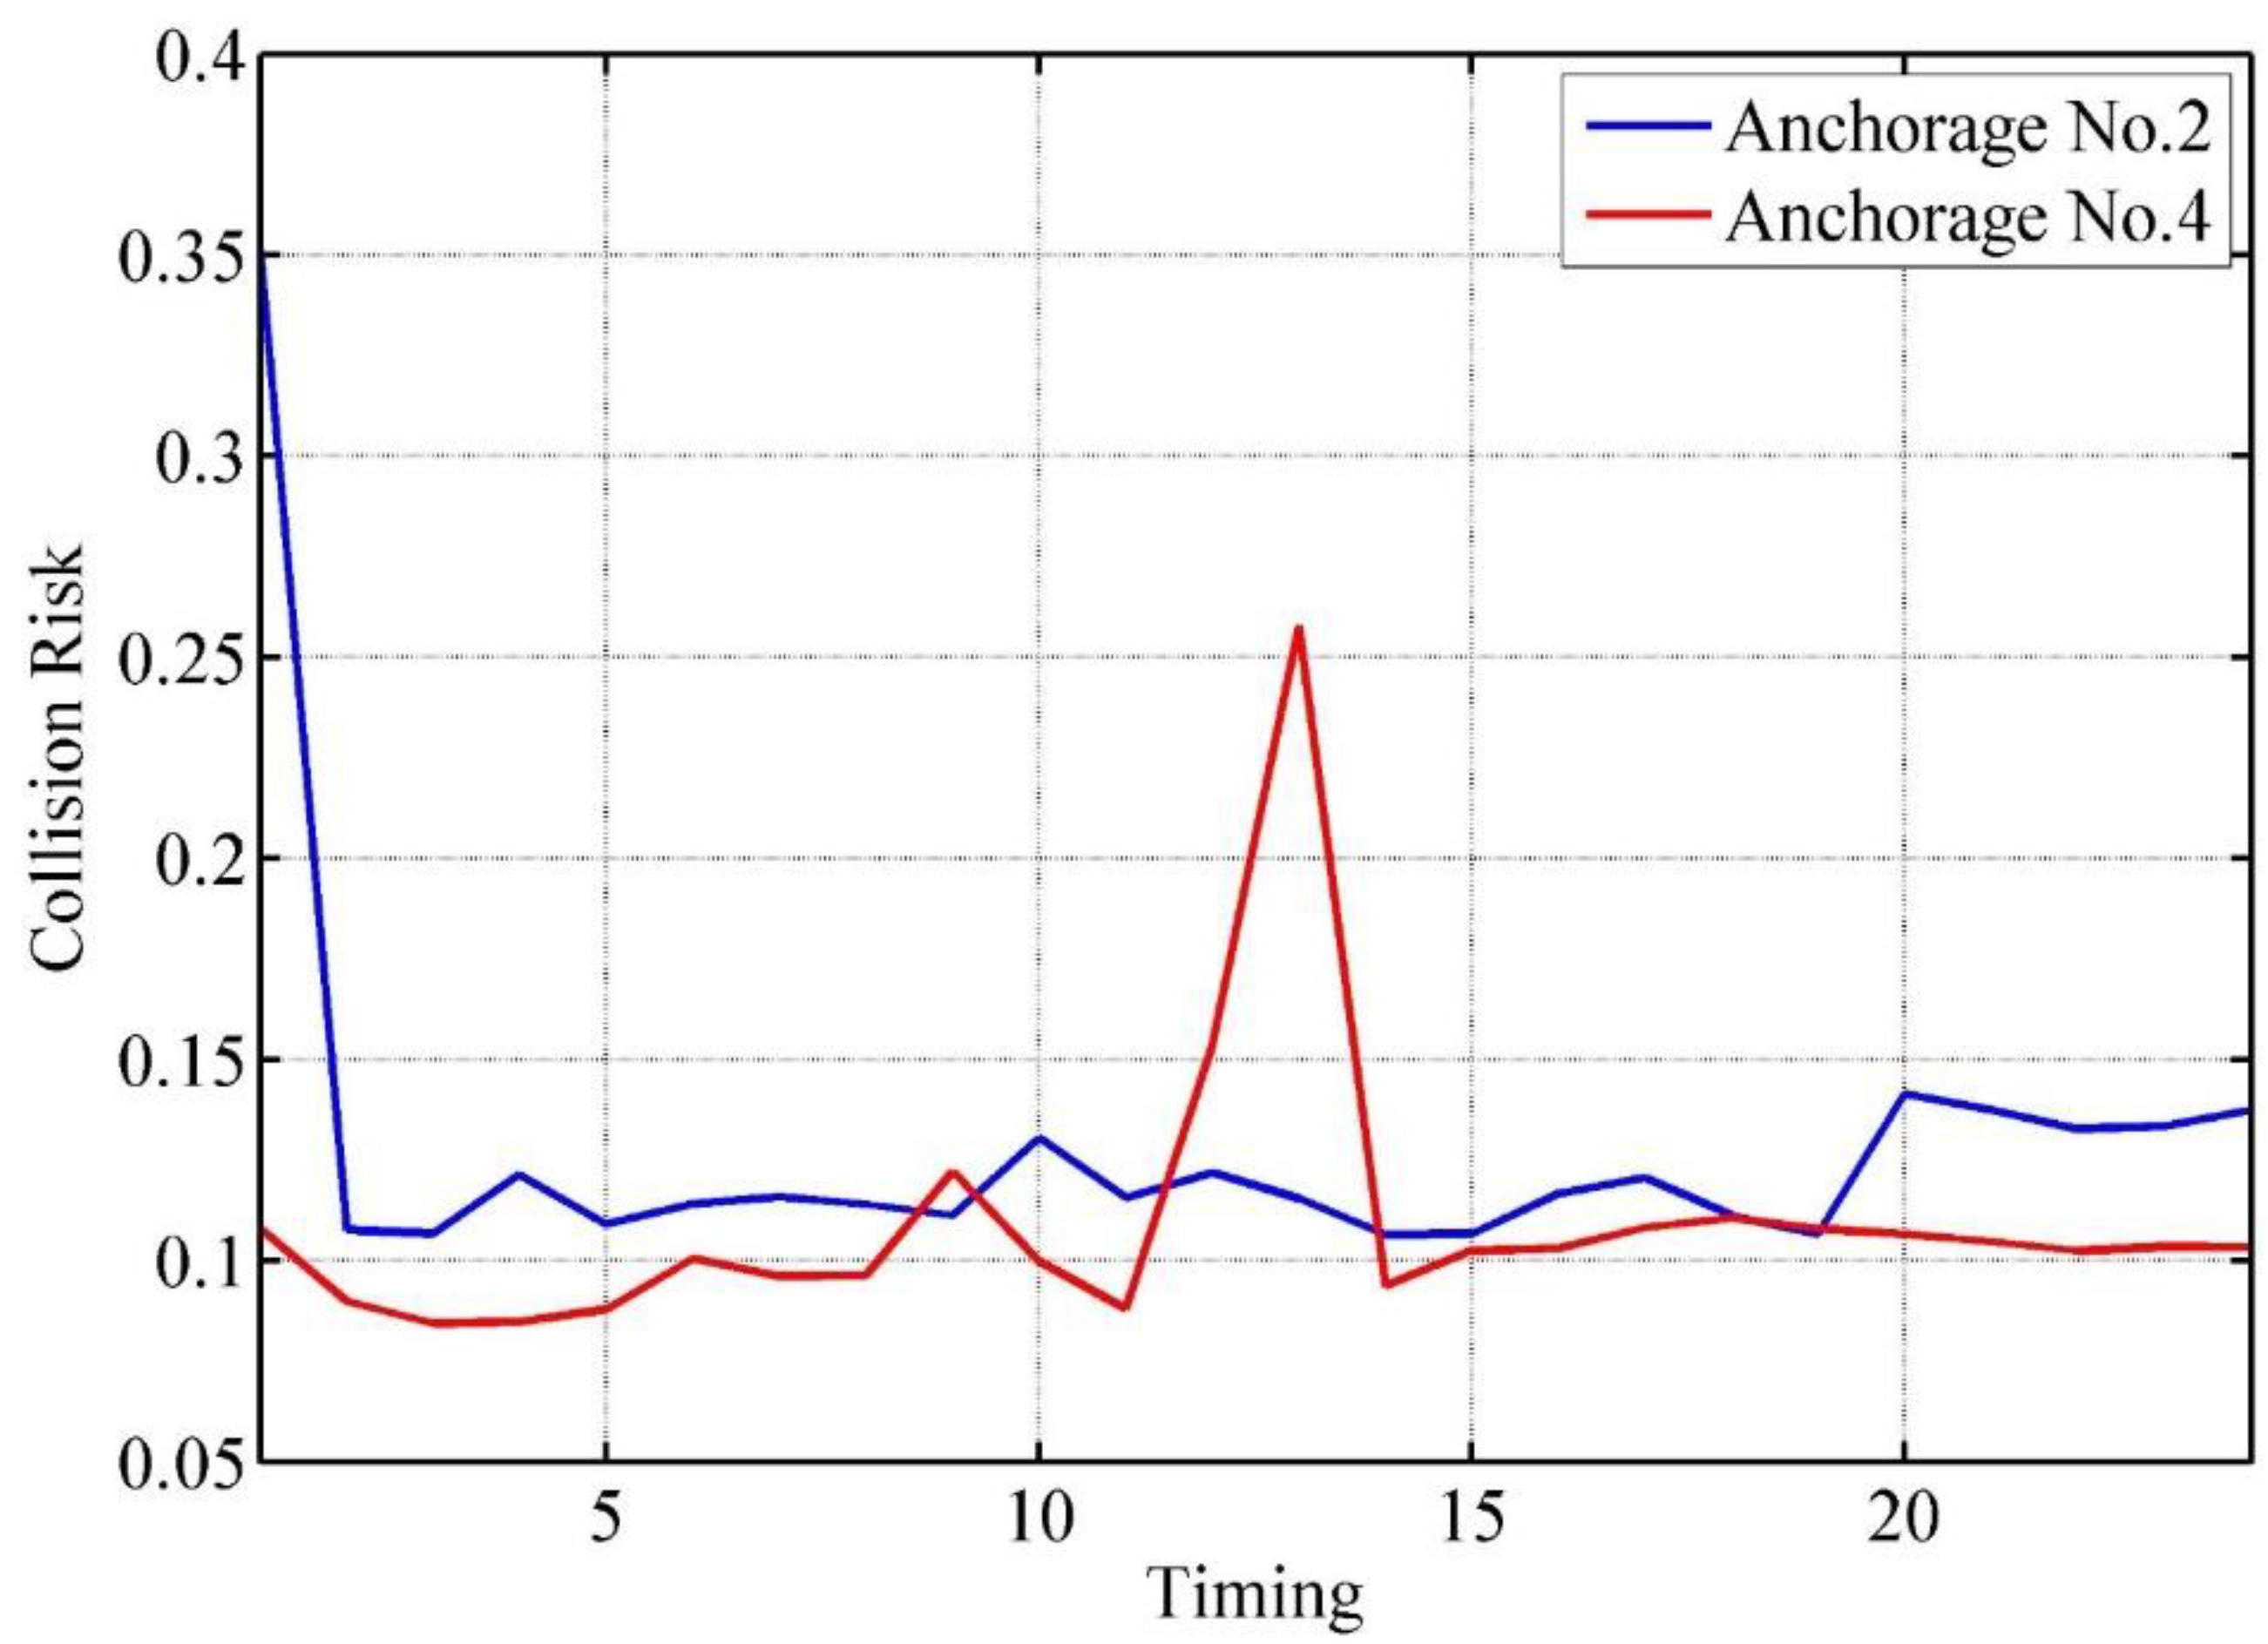
Apart from validating the proposed model in the spatial aspect, the temporal experiment was also carried out. Anchorage No. 2 and Anchorage No. 4 were selected in this experiment, where Anchorage No. 2 normally has relatively large numbers of ships. For the two selected anchorages, the collision risks were identified by the proposed model for 24 h by selecting a timing point for each hour. The results are shown in
Figure 9.
It can be observed that the collision risk of Anchorage No. 2 is higher than that of Anchorage No. 4, generally. By calculating, the average value of collision risks in Anchorage No. 2 is 0.1286, and for Anchorage No. 4 is 0.1090. For verifying the results, the ship traffic density was also adopted. The ship densities for the two anchorages in the 24 h are shown in
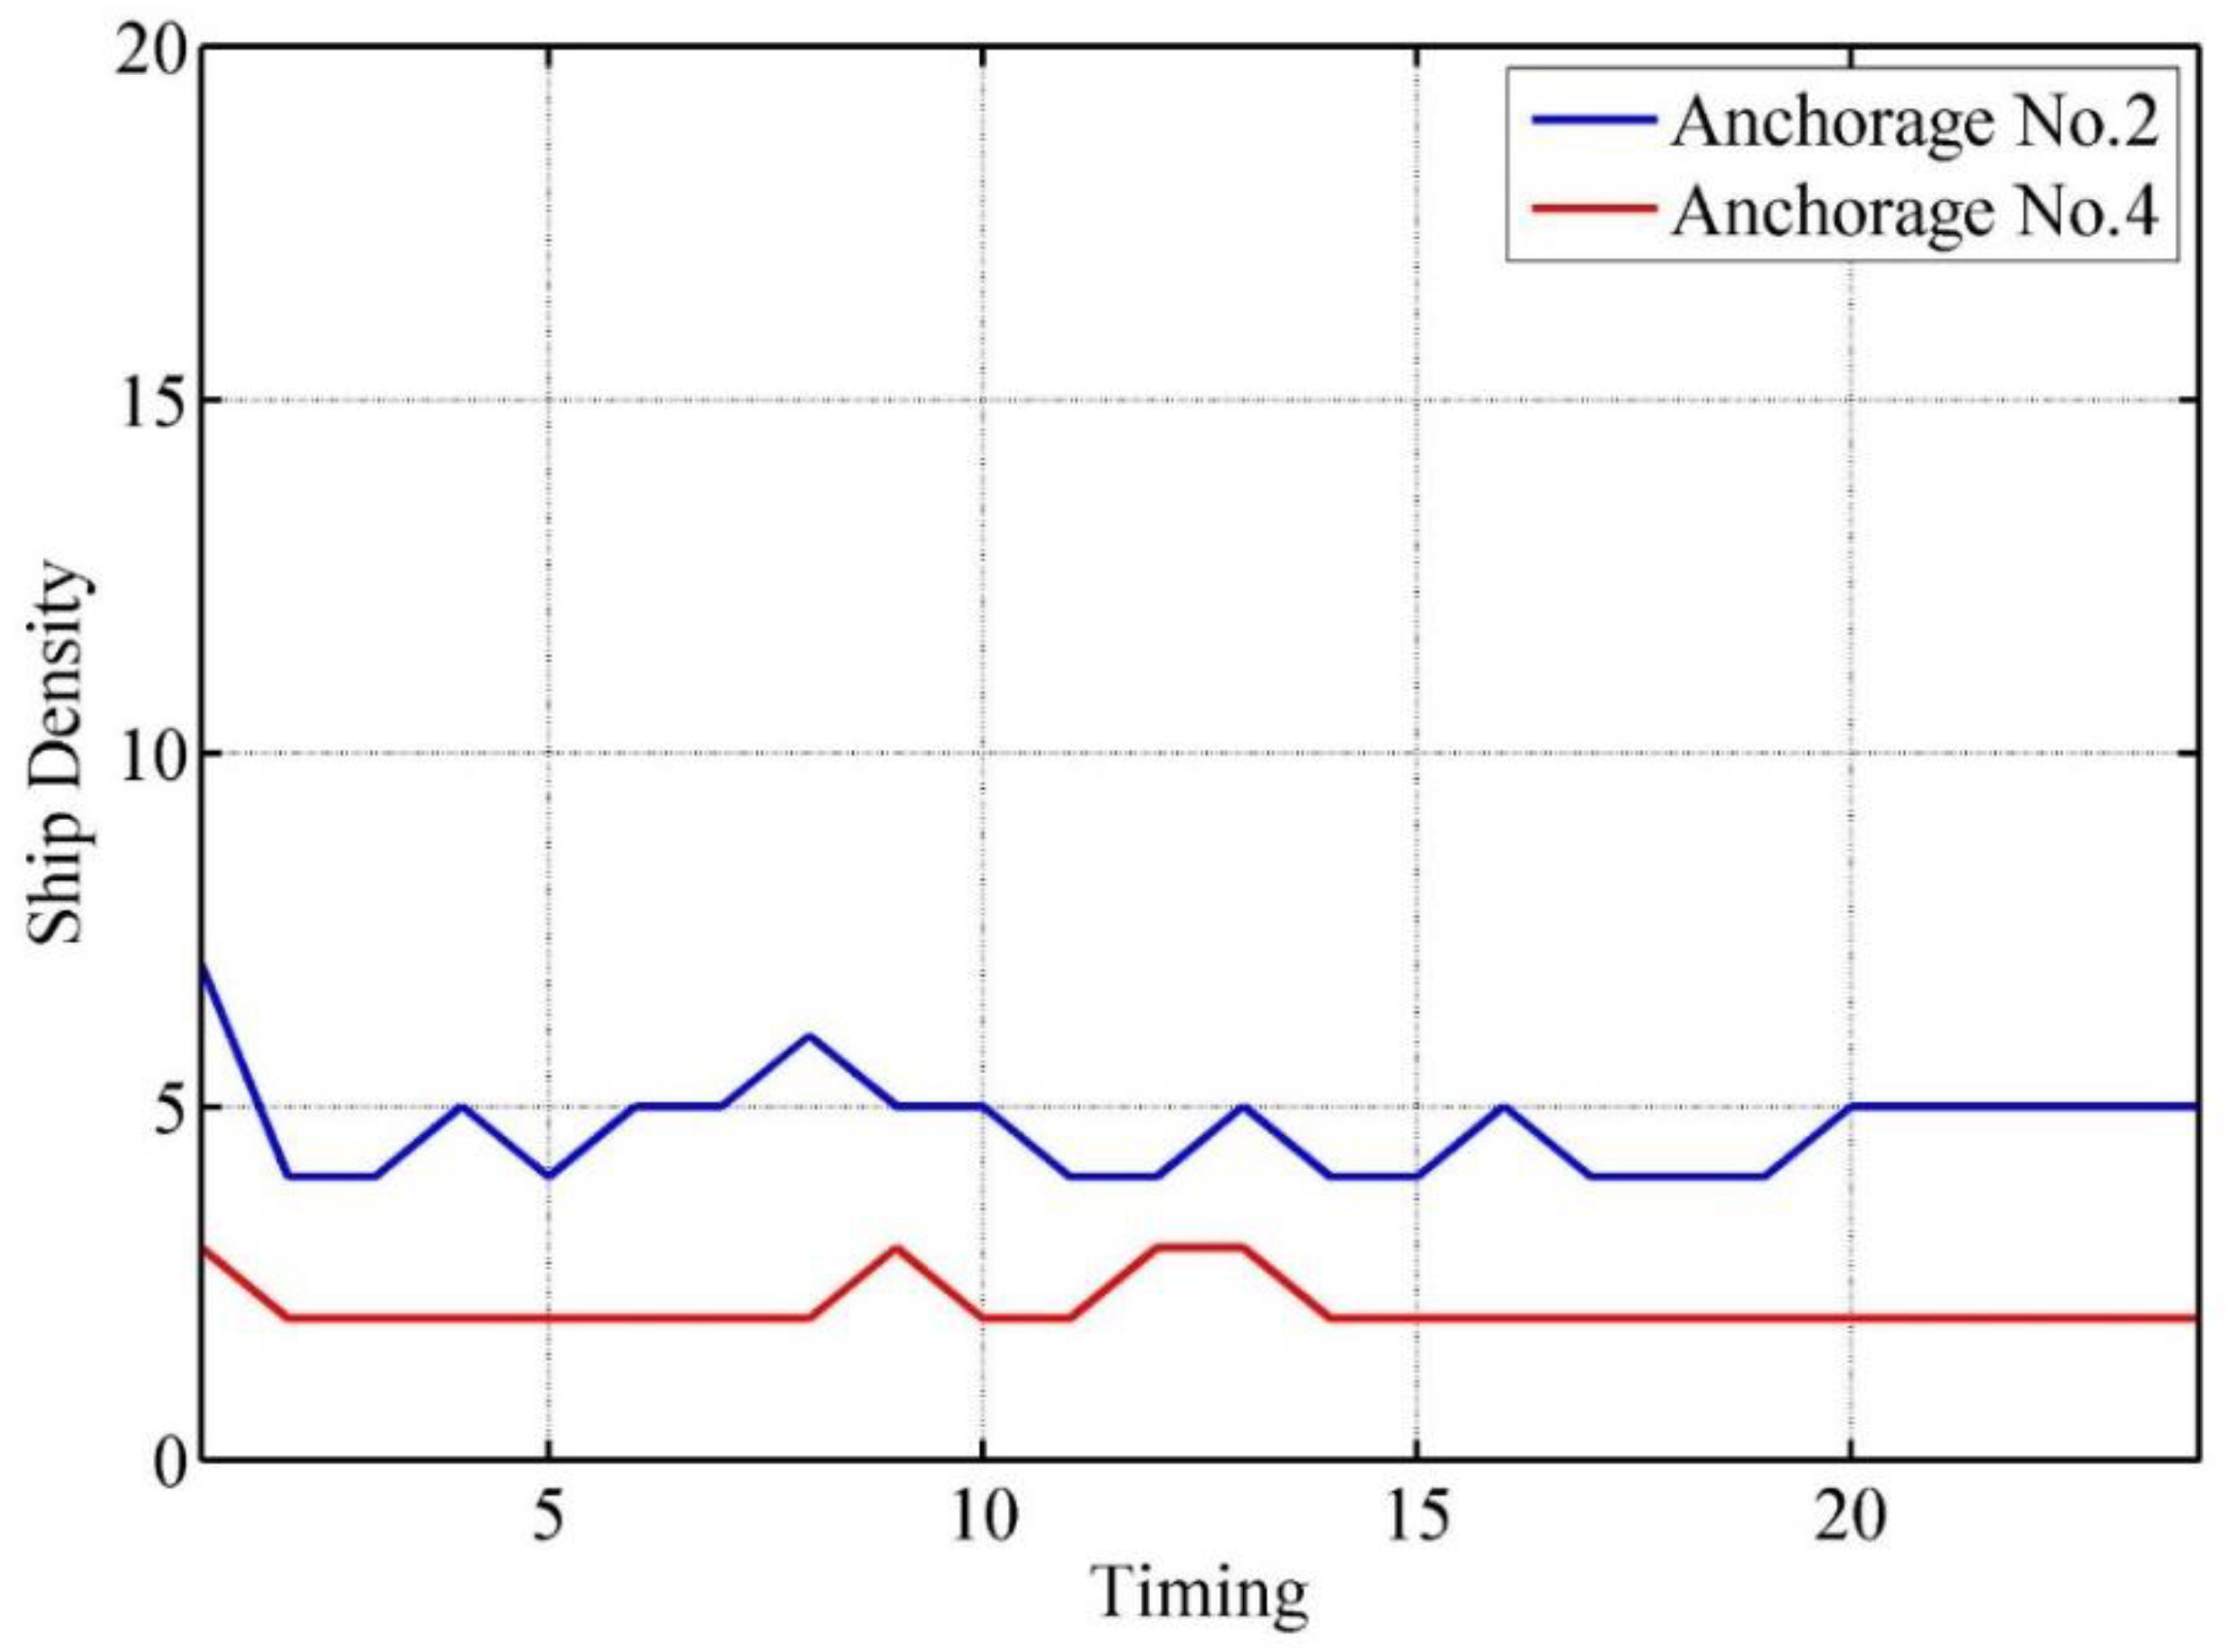
Figure 10.
It can also be found that the ship traffic density for Anchorage No. 2 is higher than that for No. 4, which reveals that the ships in Anchorage No. 2 are more crowded and have higher possibilities for collision. To check the relationship between the collision risk and ship traffic density for Anchorage No. 2 and No. 4 on 18 June 2022, a Pearson Correlation Analysis (PCA) was conducted, and the correlation result is shown in
Table 5 and
Table 6.
The results showed in
Table 5 and
Table 6 both reveal the strong positive correlation between the collision risk and ship traffic density for either Anchorage No. 2 or Anchorage No. 4. As ship traffic density can represent the collision risk to some extent, the proposed model was validated in identifying anchorage collision risk. The numbers of receiving AIS messages within the studied time interval were also identified, and the results are shown in
Table 7.
The number of receiving AIS messages can also represent the busyness of the water area for a time interval and is applied to identify traffic density [
37]. It can be found from
Table 7 that the number of receiving AIS messages for Anchorage No. 2 is higher than that of Anchorage No. 4, which is in line with the results obtained by the proposed model in revealing collision risk. Therefore, the effectiveness of the proposed model can be validated.
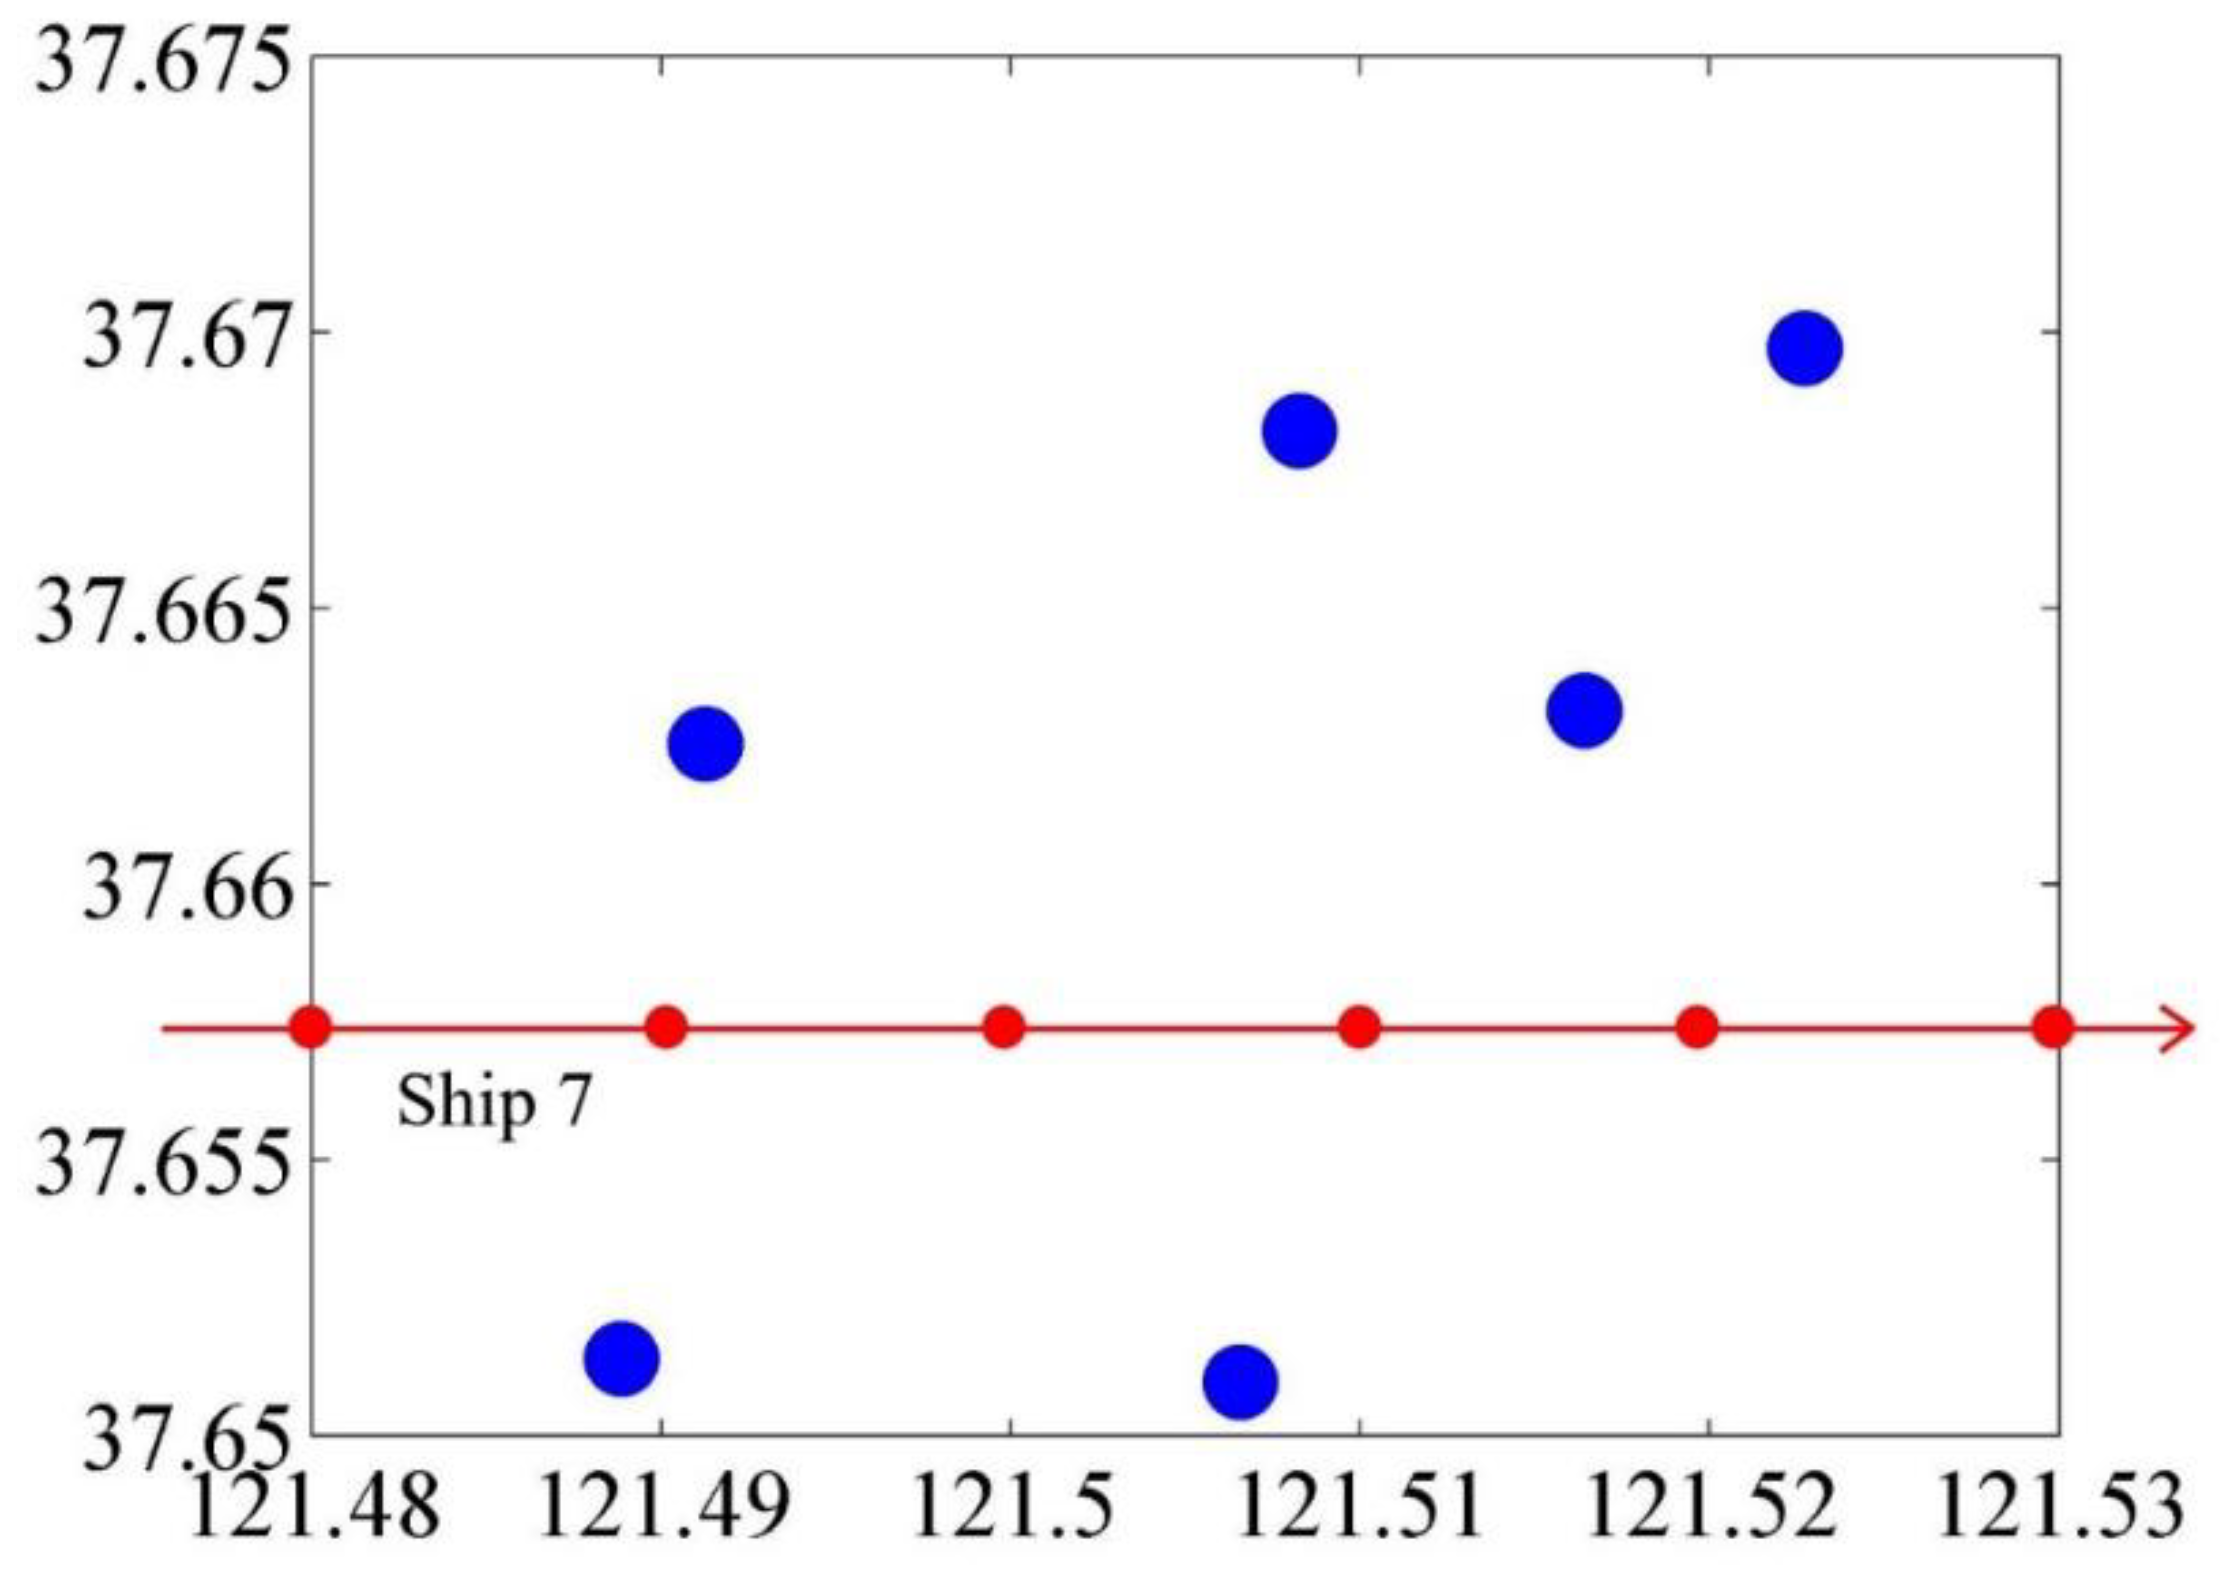
In addition, a dynamic experiment was also carried out to validate the proposed model. Anchorage No. 2 was applied, and the scenario is shown in
Figure 11.
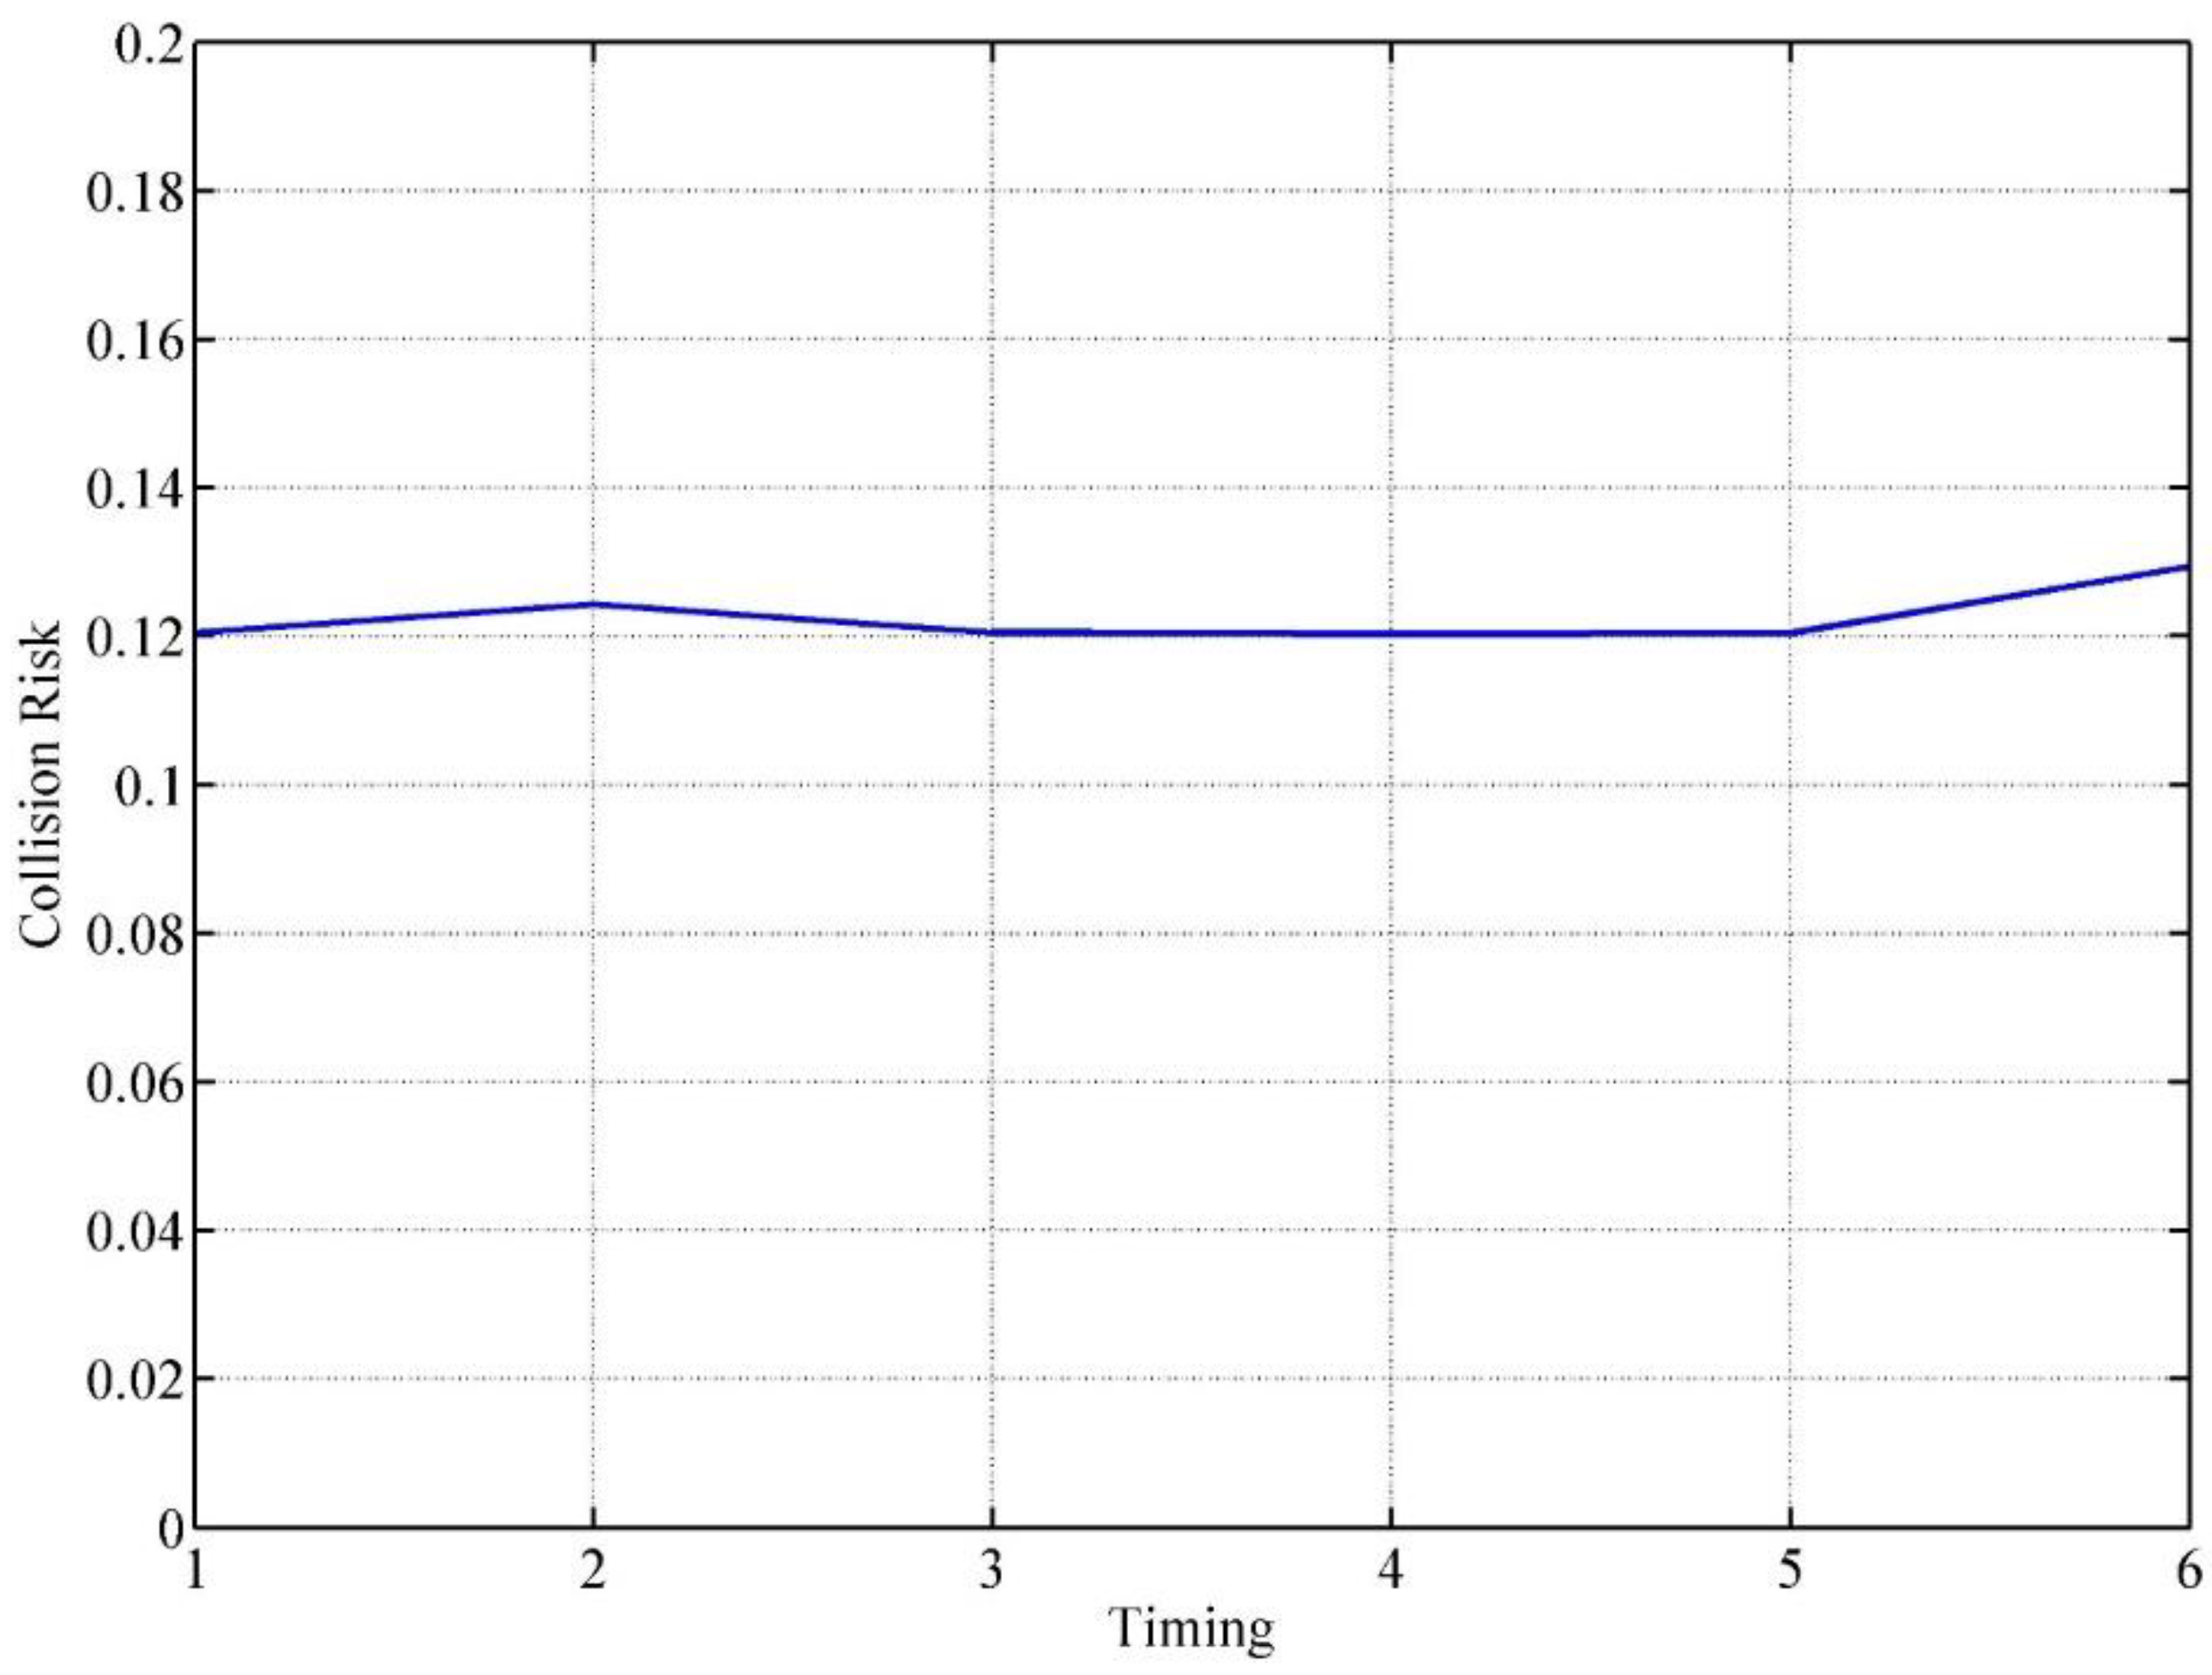
There are six ships shown as blue dots in Anchorage No. 2, which are all anchored ships. Another ship, which is named Ship 7, was crossing the anchorage from the west edge to the east edge. For this process, six timing moments were selected and marked as red dots in
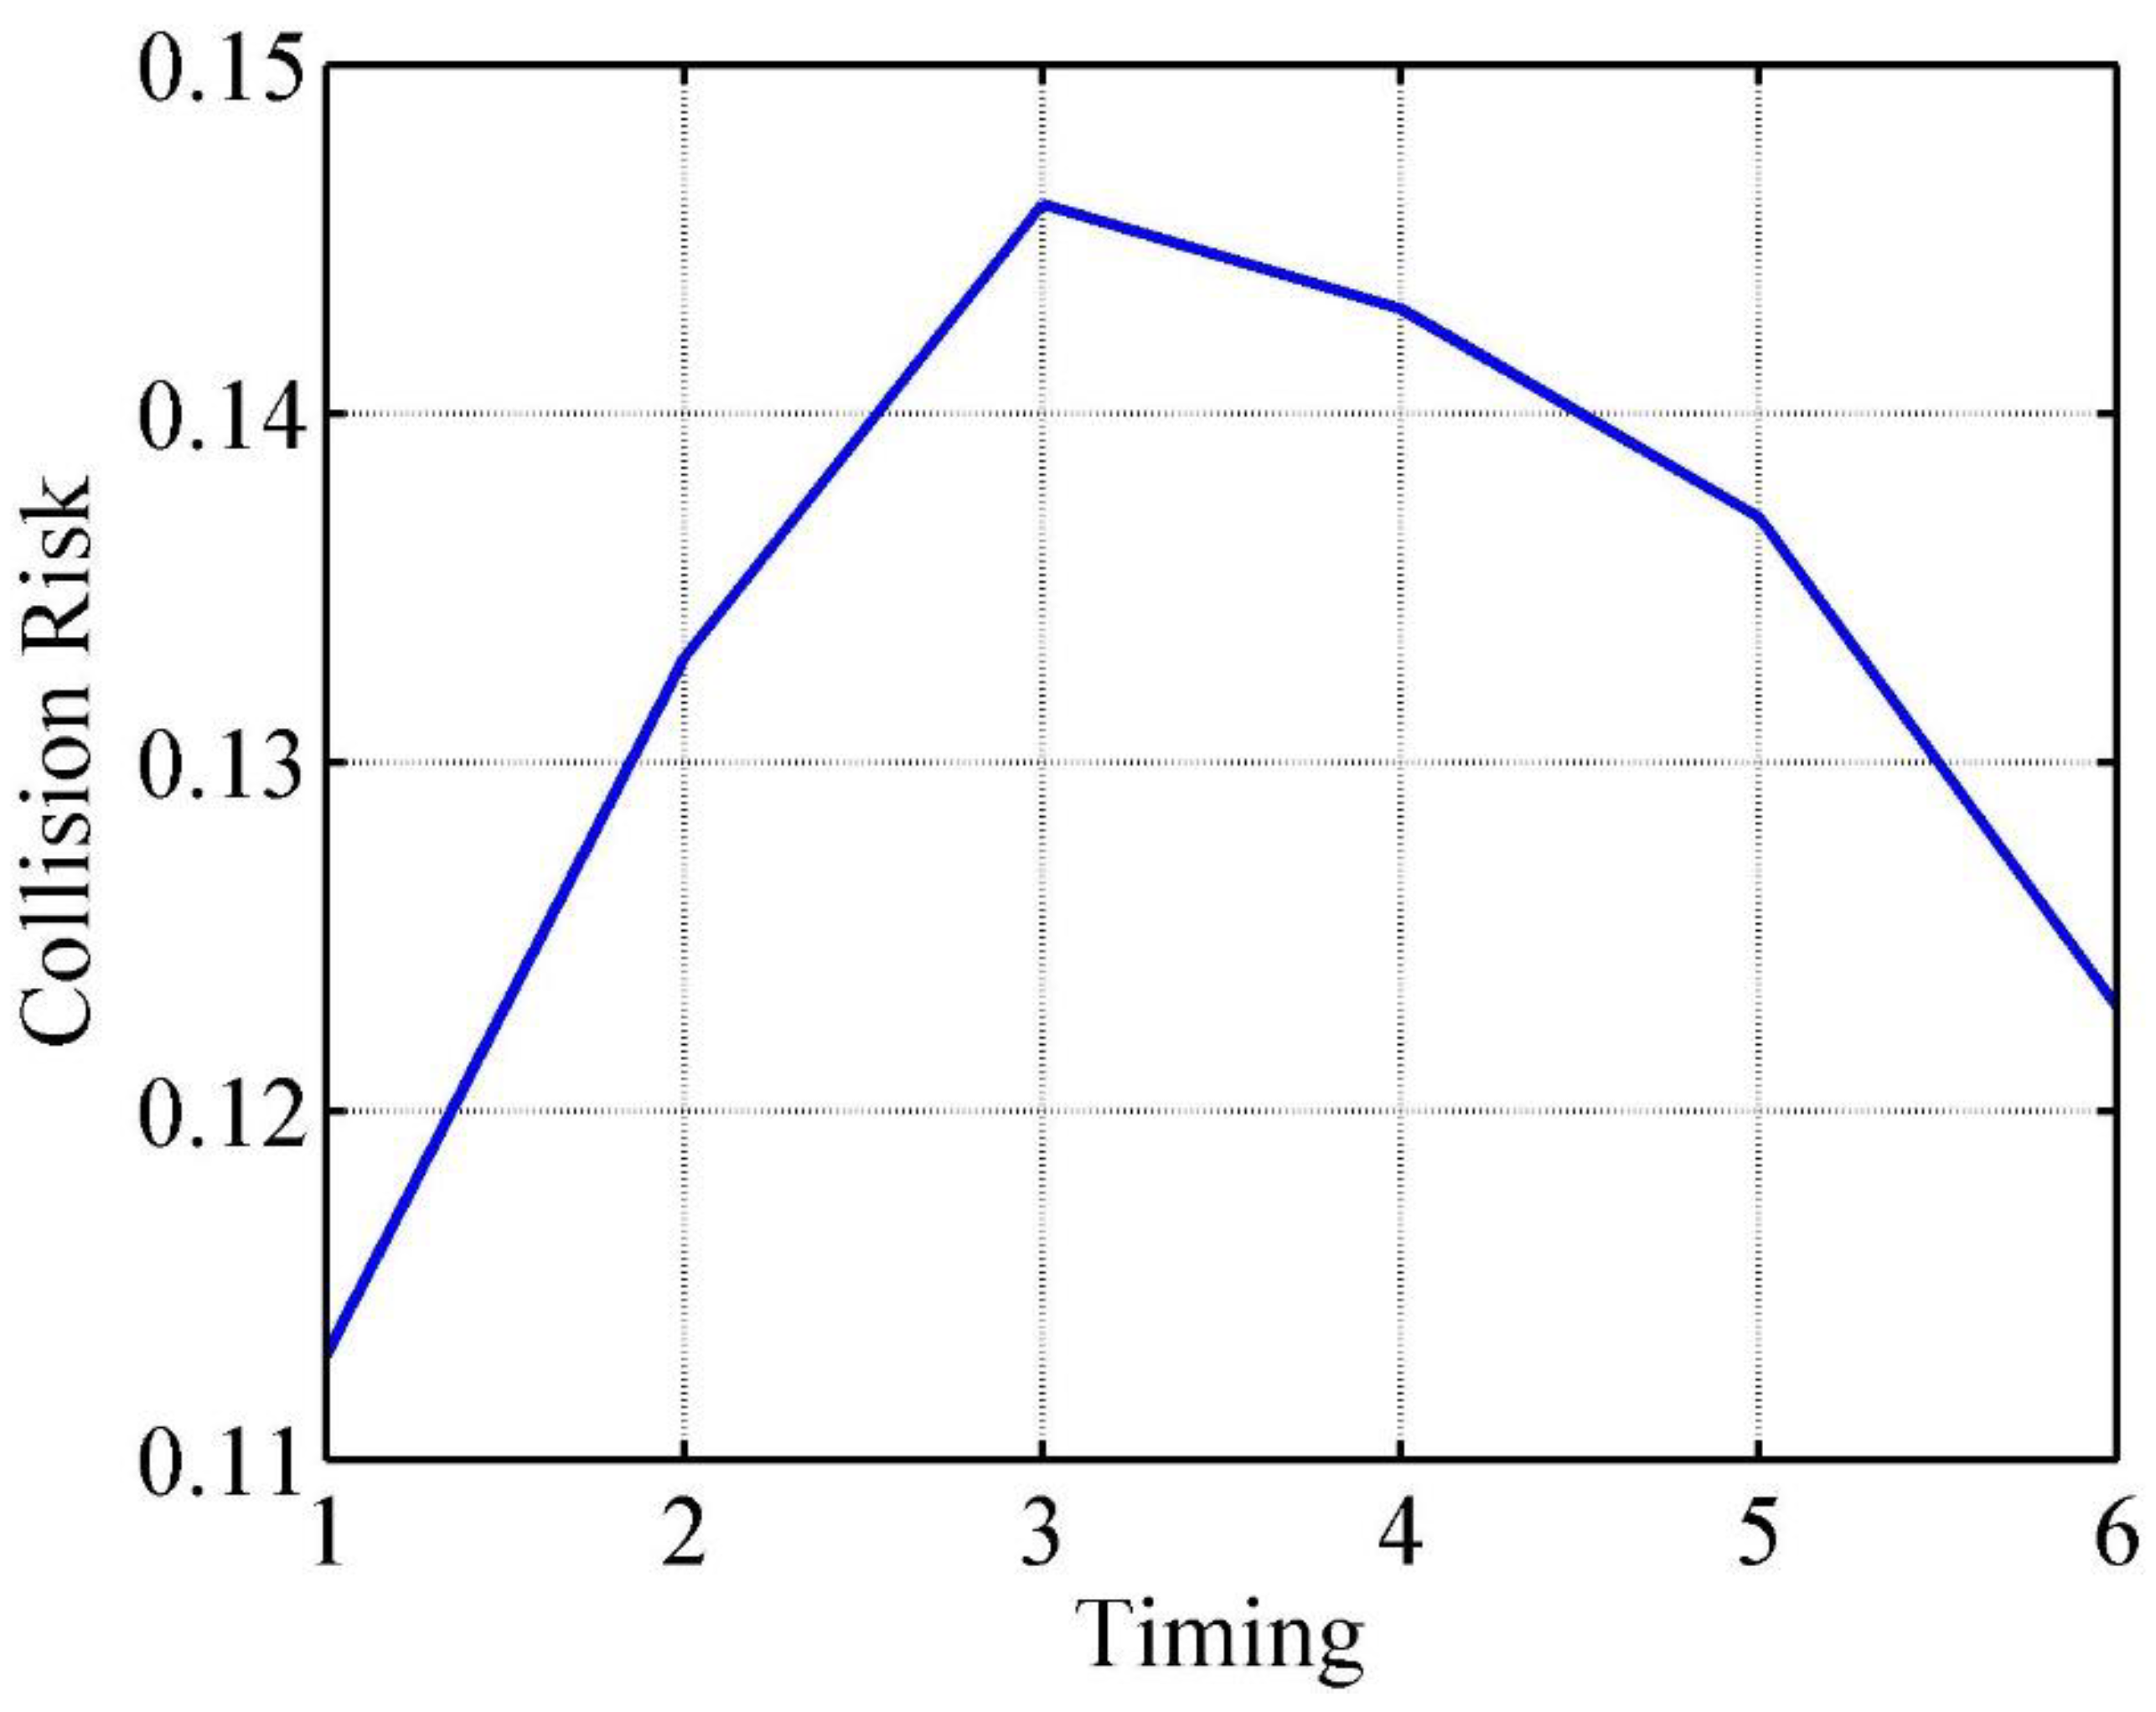
Figure 11. The collision risks for these six timing moments were calculated based on the proposed model, and the results are shown as blue line in
Figure 12.
It can be found that the collision risk increased at first and then decreased. This is consistent with the fact that as Ship 7 sailed deeper and deeper into the anchorage during the process of crossing the anchorage, the microscopic collision risk, macroscopic collision risk, and compactness risk between Ship 7 and other ships increased continuously. When this situation reached the threshold, Ship 7 gradually sailed out of the anchorage, and the relevant value began to decrease. Therefore, it can be proved that the proposed model is effective in identifying the collision risk in anchorage.
5. Discussion
In this paper, an anchorage collision risk model was proposed. The proposed model was established in microscopic, macroscopic, and complexity aspects, which considered the relative motion between ships, the characteristic of anchorage, and the spatial complexity of ship distribution. In
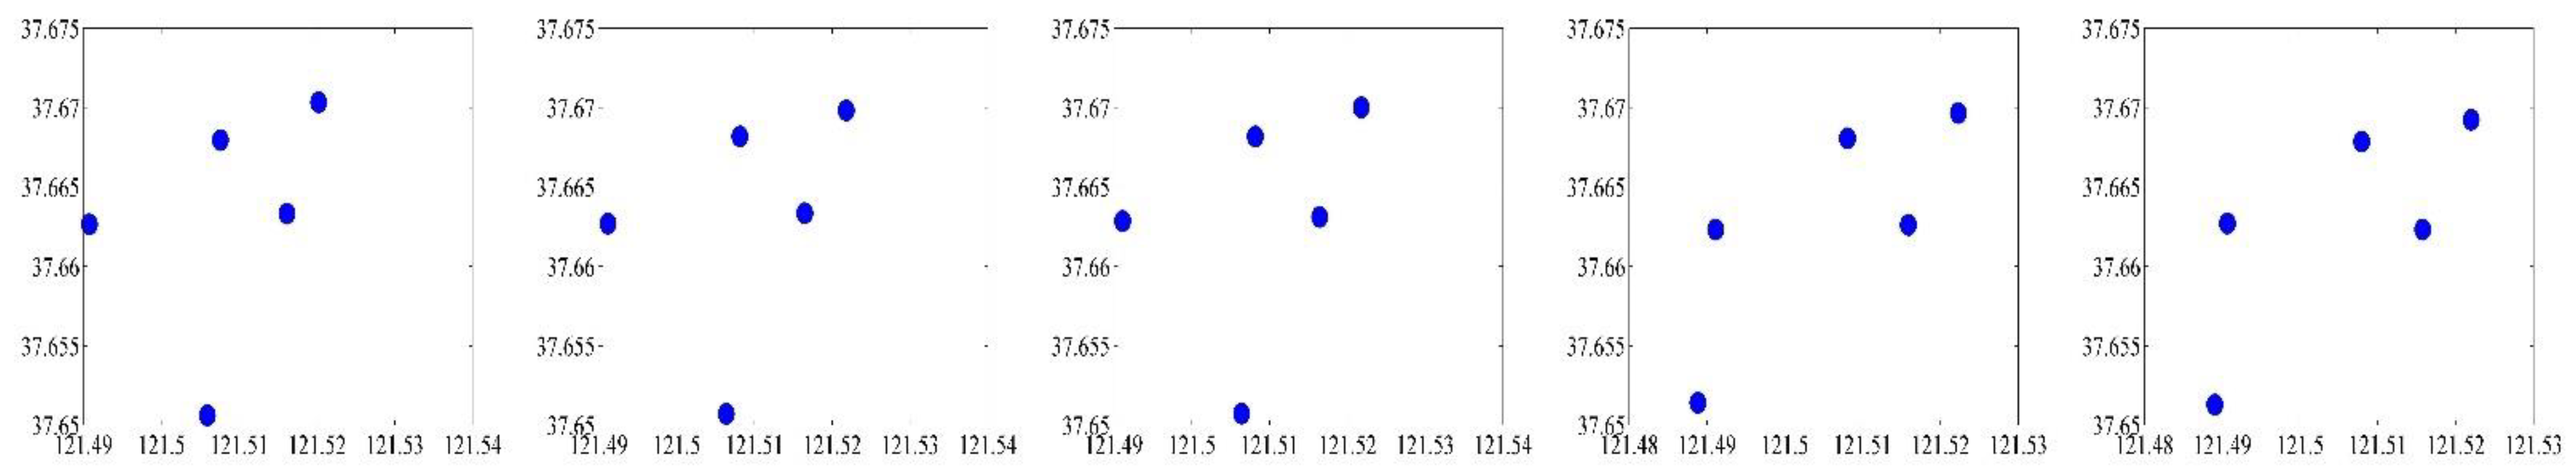
Section 3, to validate the effectiveness of the proposed model in identifying the collision risk in anchorage, some experimental case studies were carried out. In the spatial and temporal experiments, the ship traffic density was adopted as a validation index as it can evaluate the collision risk through the busyness of anchorage to some extent. However, ship traffic density is still inadequate for assessing the collision risk compared with the proposed model. In other words, the proposed model has the advantage of assessing anchorage collision risk compared with ship traffic density. To explain this, some scenarios with the same ship traffic density were selected. Firstly, for the same anchorage, Anchorage No. 2, we selected five scenarios with a ship traffic density of 5; the scenarios are shown in
Figure 13.
By applying the proposed model, the collision risks can be calculated and are shown in
Table 8.
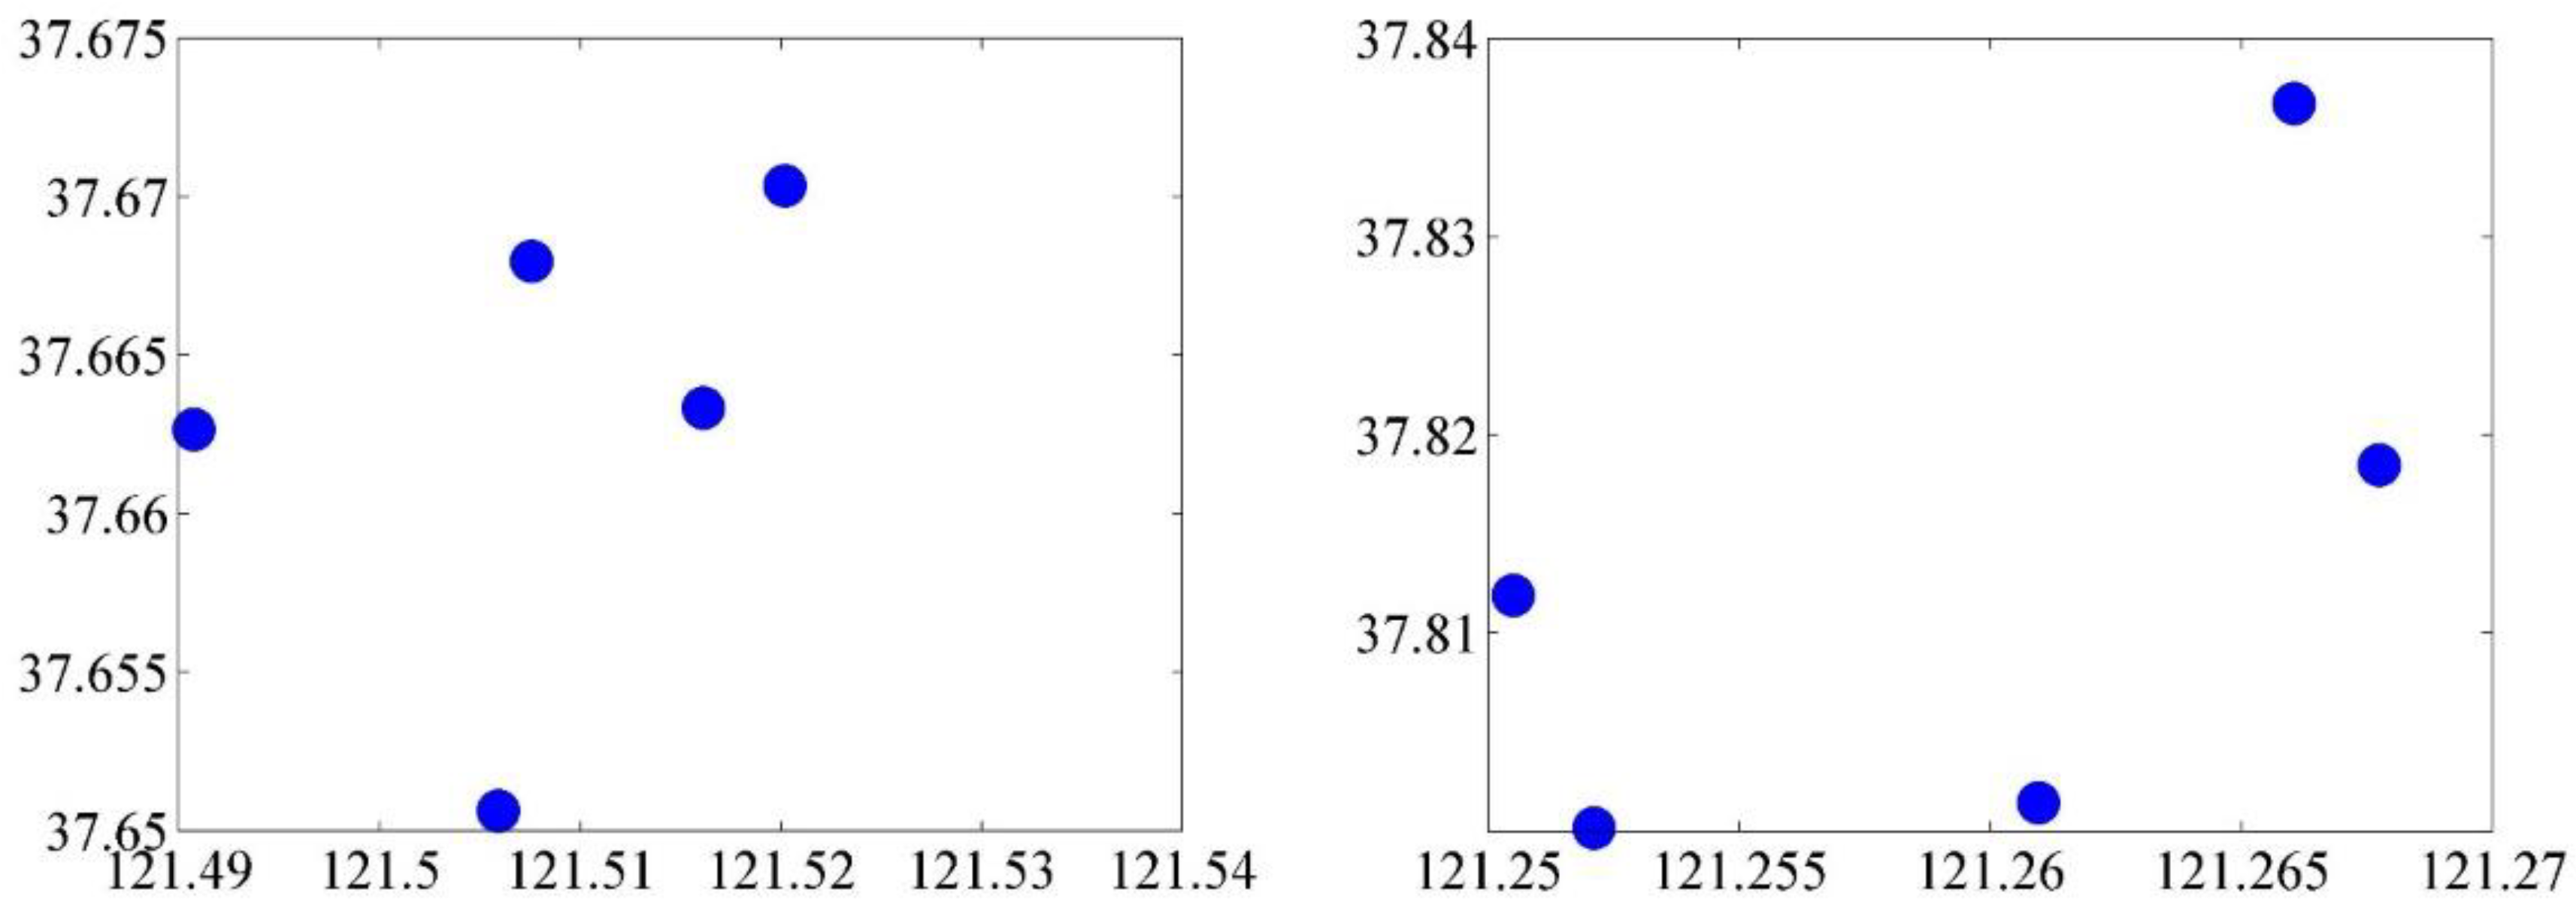
It can be found that although the five scenarios are with the same ship traffic density, the collision risks for them are not equal. This is because the different positions and different motion parameters of the ships in anchorage can lead to differences in micro-collision risk, macro-collision risk, and compactness. The experiment was also conducted in different anchorages. Each scenario in Anchorage No. 2 and No. 5 was selected, as shown in
Figure 14, and the ship traffic density is 5 for each scenario.
Calculated by the proposed model, the results are shown in
Table 9.
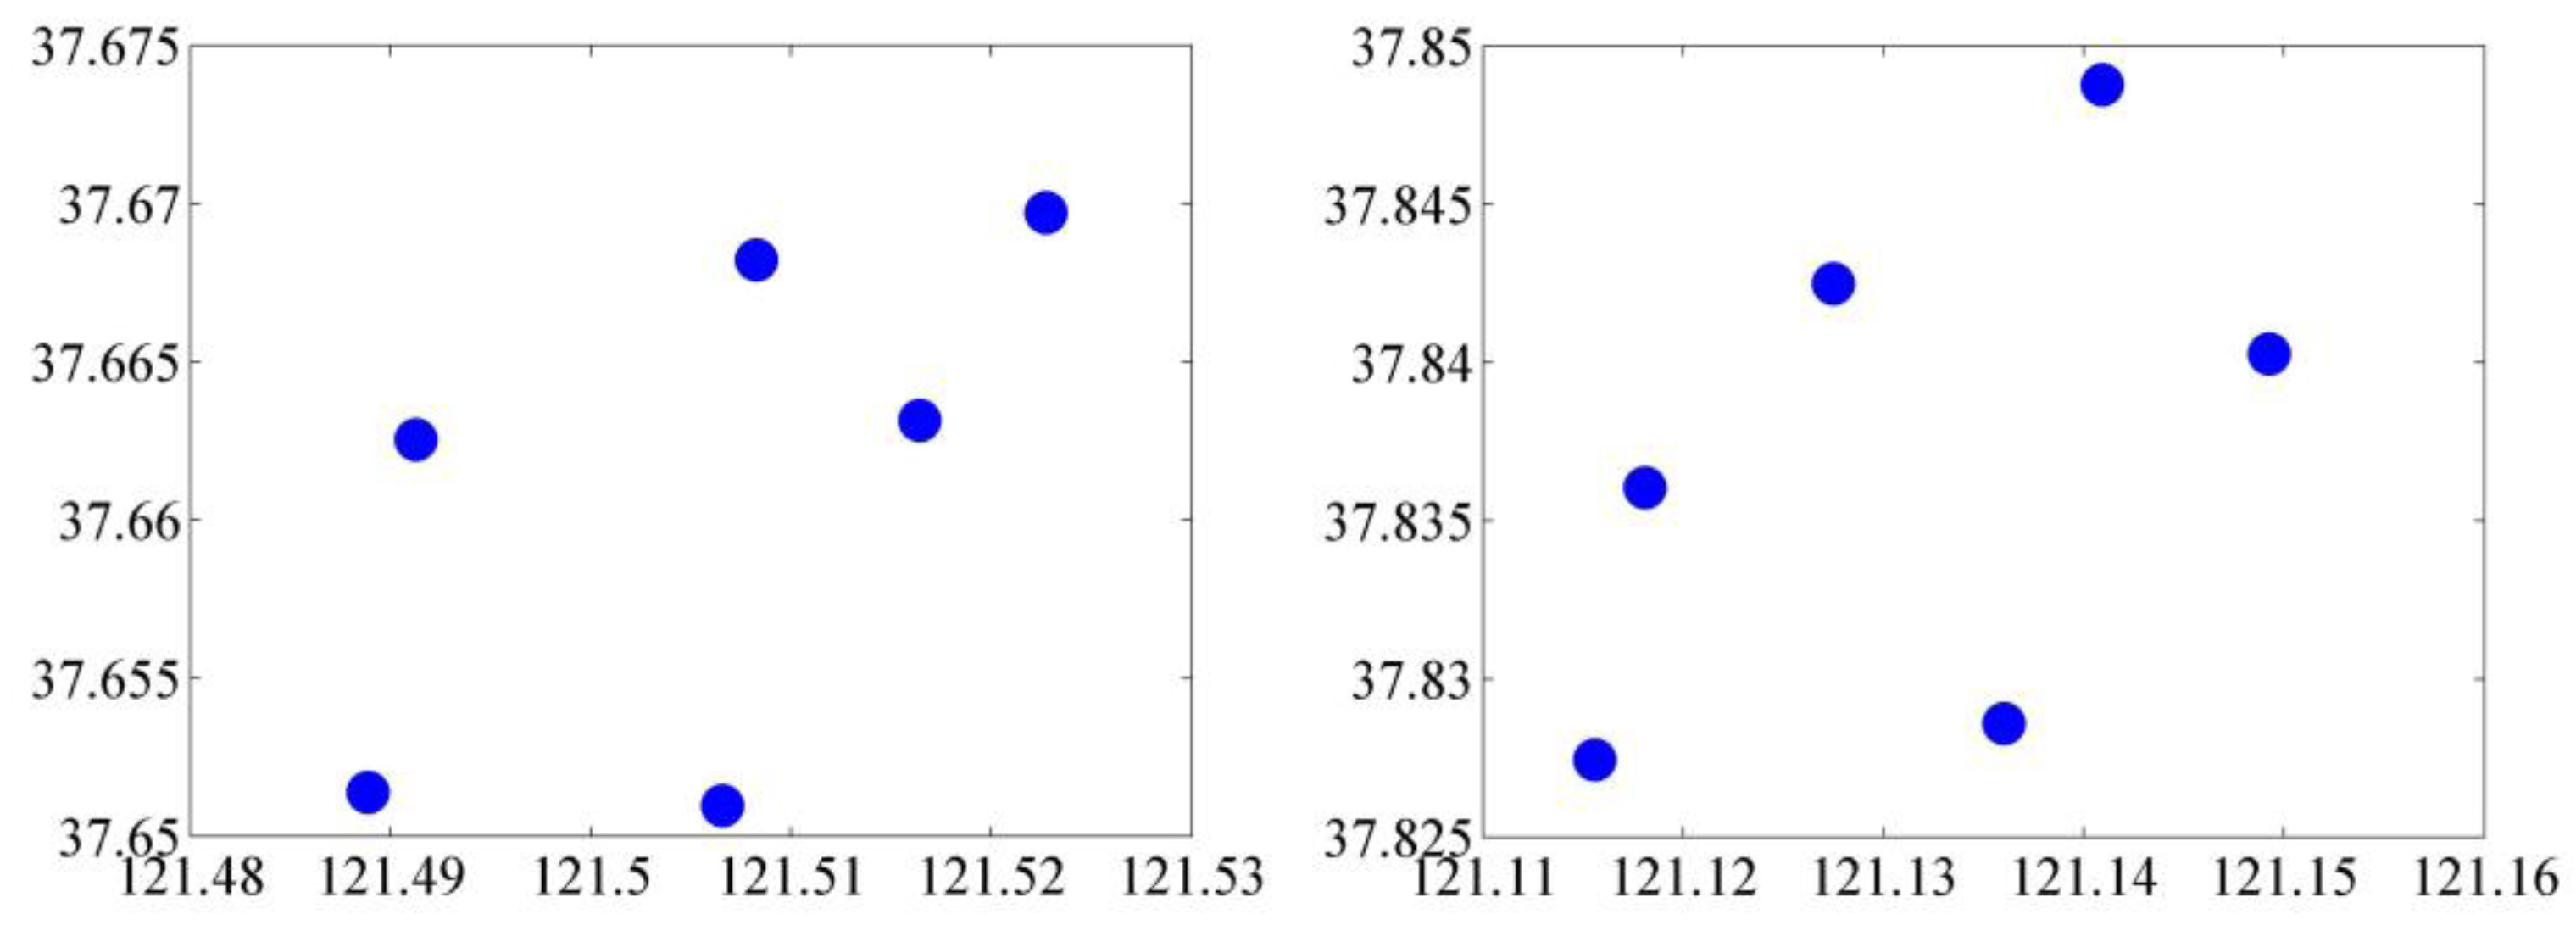
Other two scenarios, one is in Anchorage No. 2, and another is in Anchorage No. 6, are shown in
Figure 15.
The collision risk results obtained from the proposed model are shown in
Table 10.
It can be found in
Table 9 and
Table 10 that even in different anchorages, the collision risks are not equal when the ship densities are the same, which proves the superiority of the proposed model compared with the ship traffic density in assessing anchorage collision risk.
In addition, compared with the anchorage collision risk model [
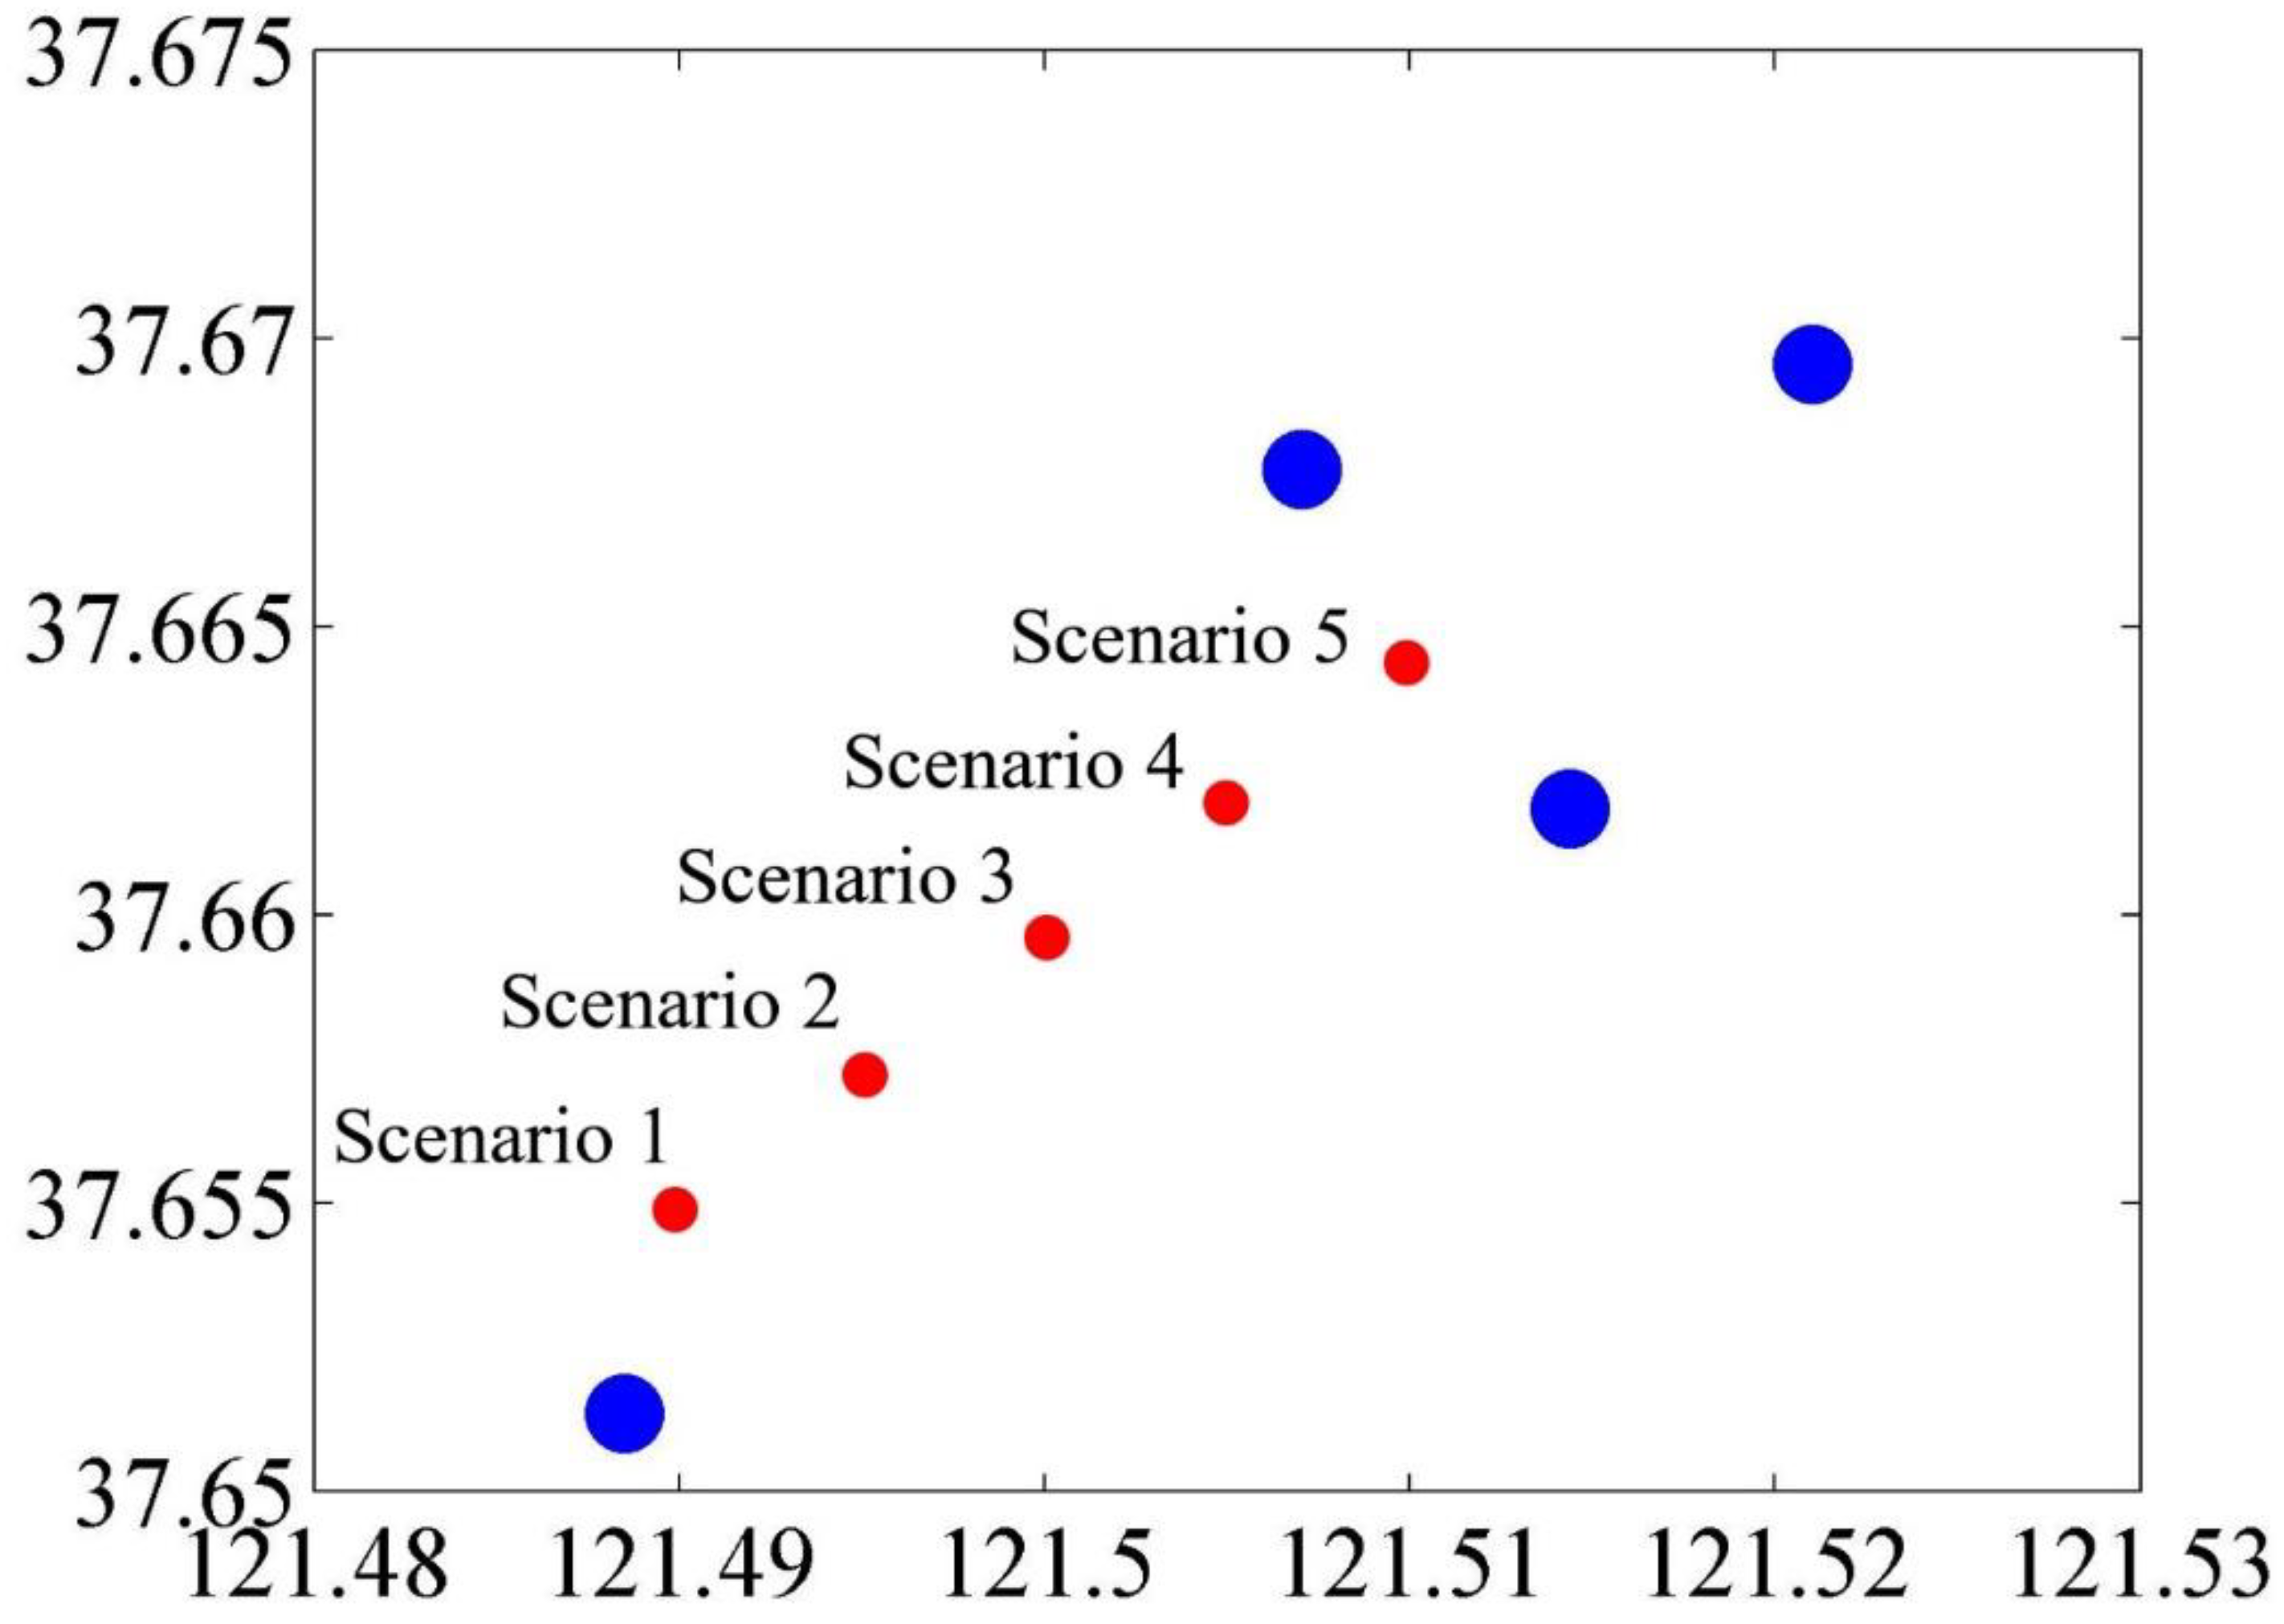
33], the main contribution of the proposed model is the consideration of ship compactness, namely, the spatial complexity. It can make the model more accurate in complex situations. To prove this advantage, a scenario in Anchorage No. 2 was selected, as shown in
Figure 16.
For this scenario, a ship on the southwest edge of the anchorage, which is Ship 1, was simulated to move to different positions in the anchorage, which approach the center of the anchorage gradually.
There is a total of six different positions for Ship 1, and the collision risks of them were calculated using the proposed model. The results are shown in
Figure 17.
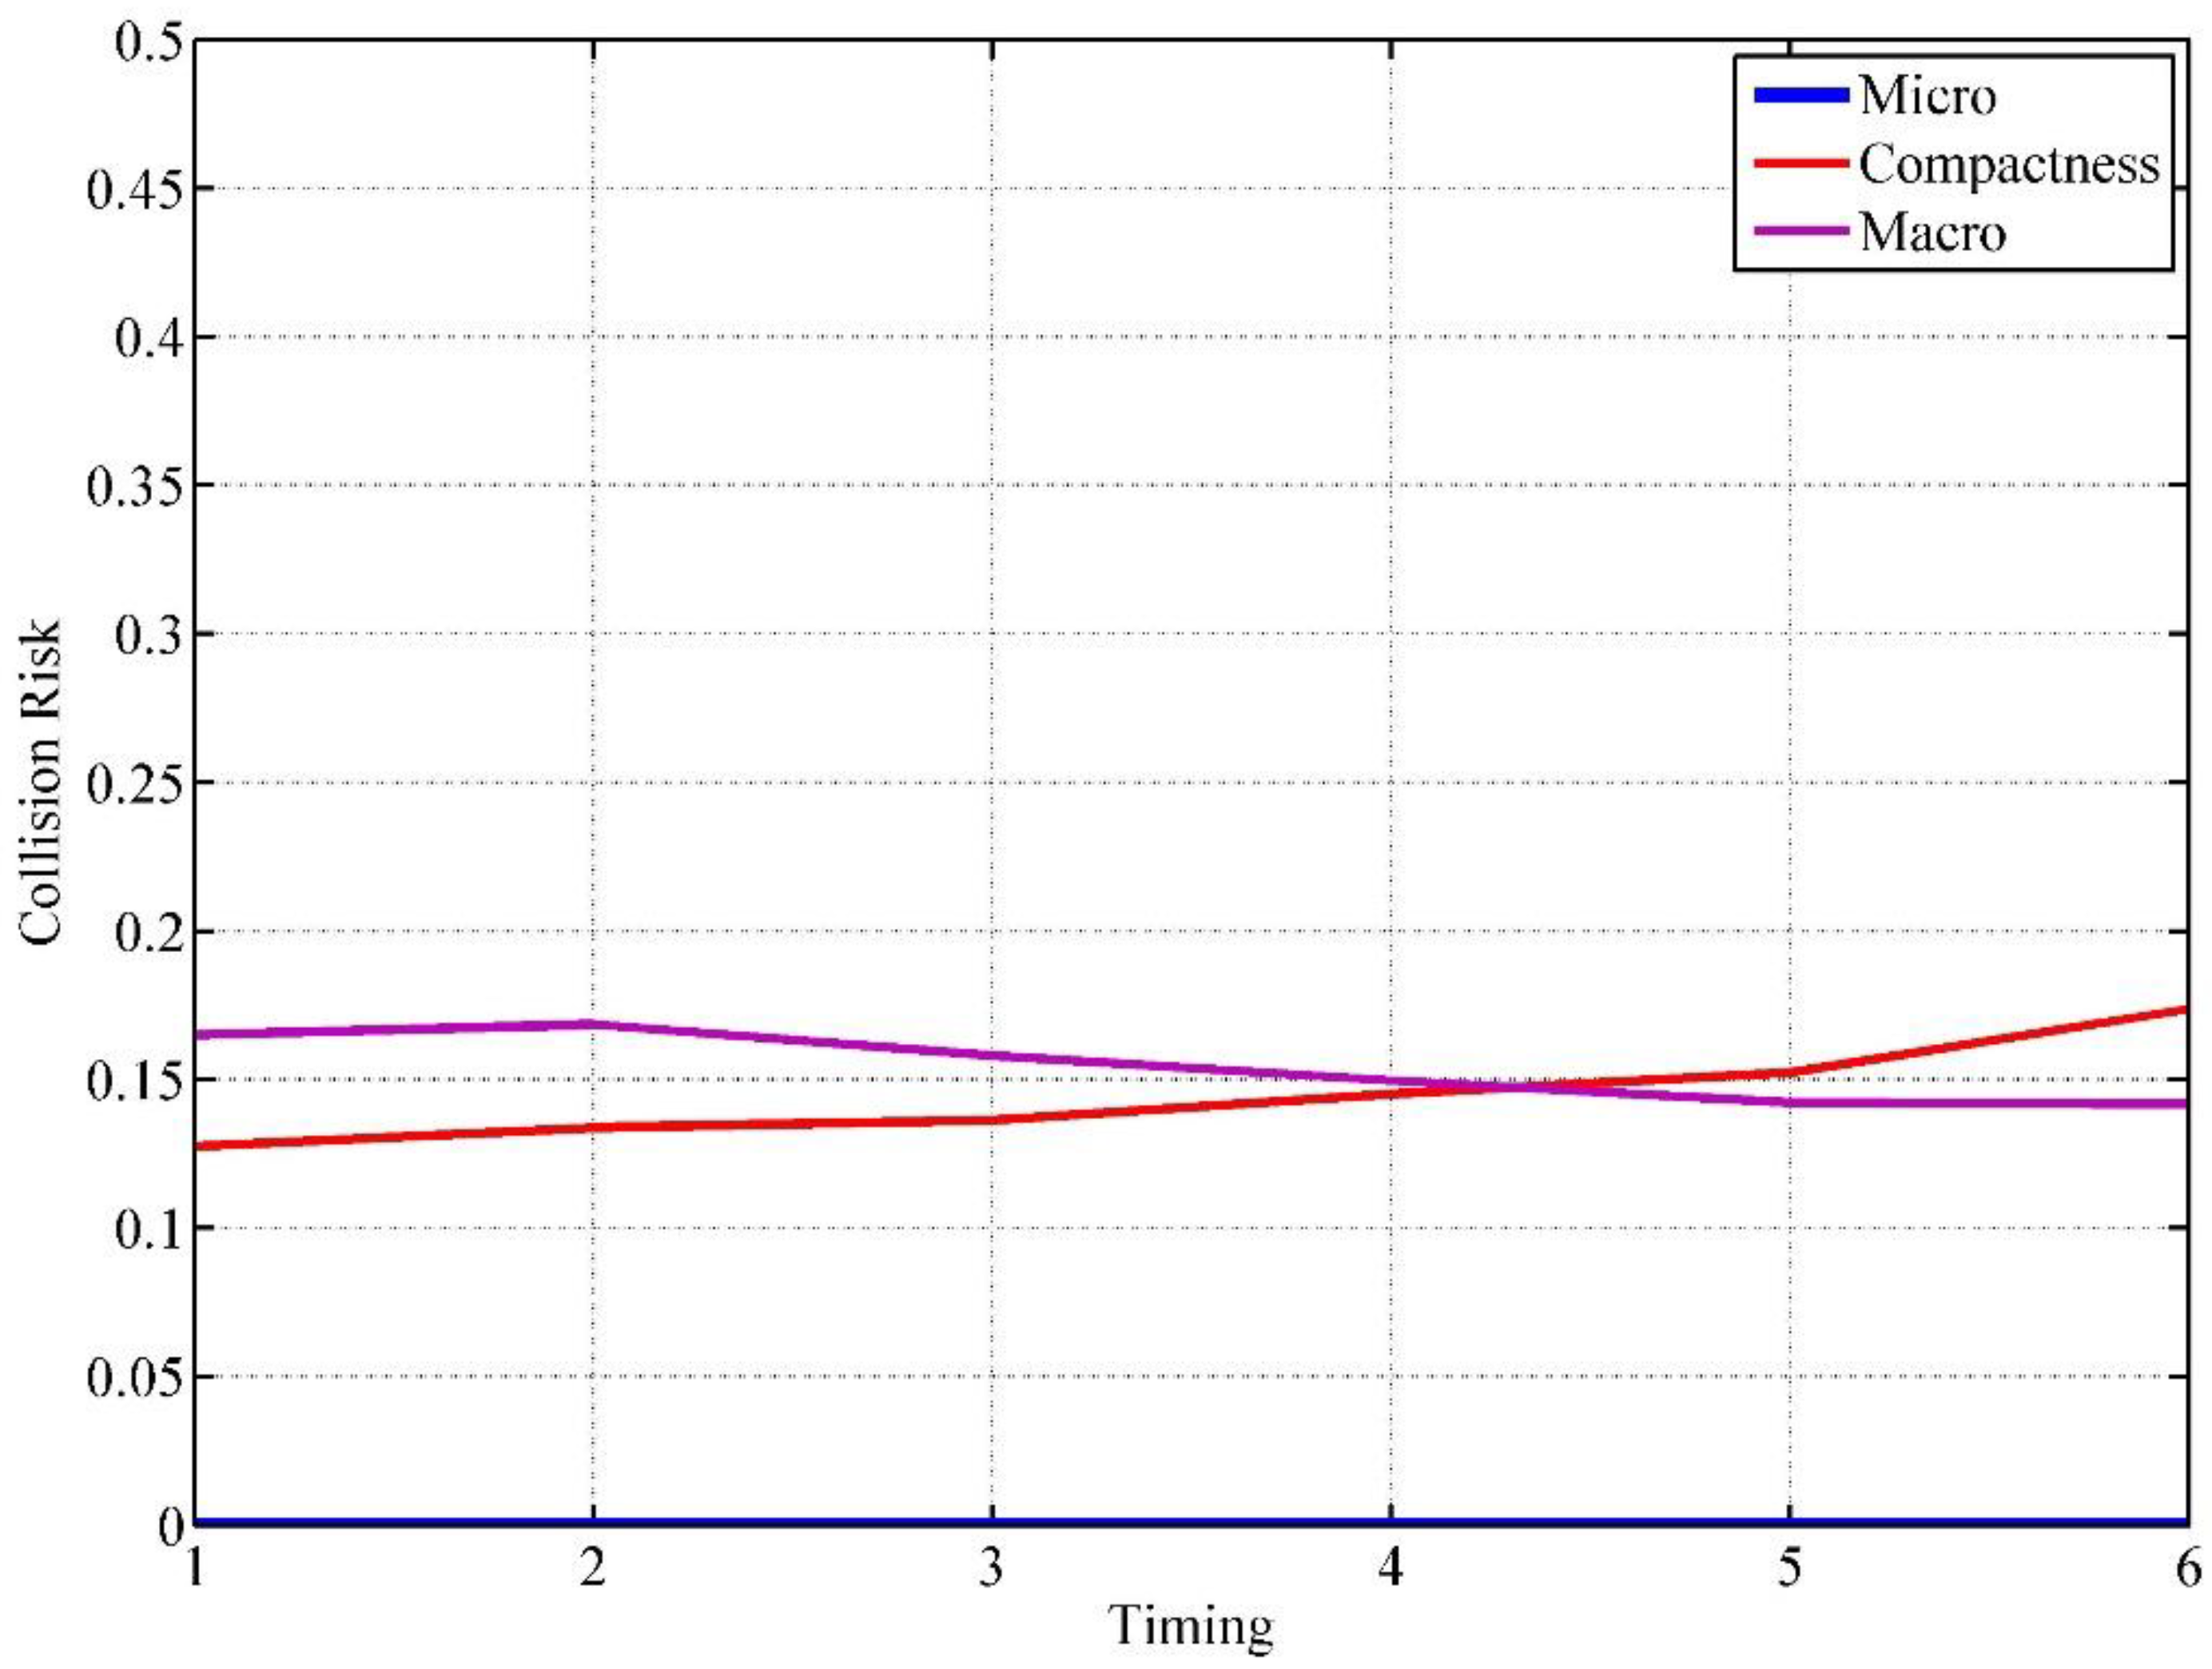
It can be observed that as the position of Ship 1 gradually approached the center, the collision risk generally increased but fluctuated at some intermediate time points. For analyzing this phenomenon, the collision risk in each aspect was also calculated and shown in
Figure 18.
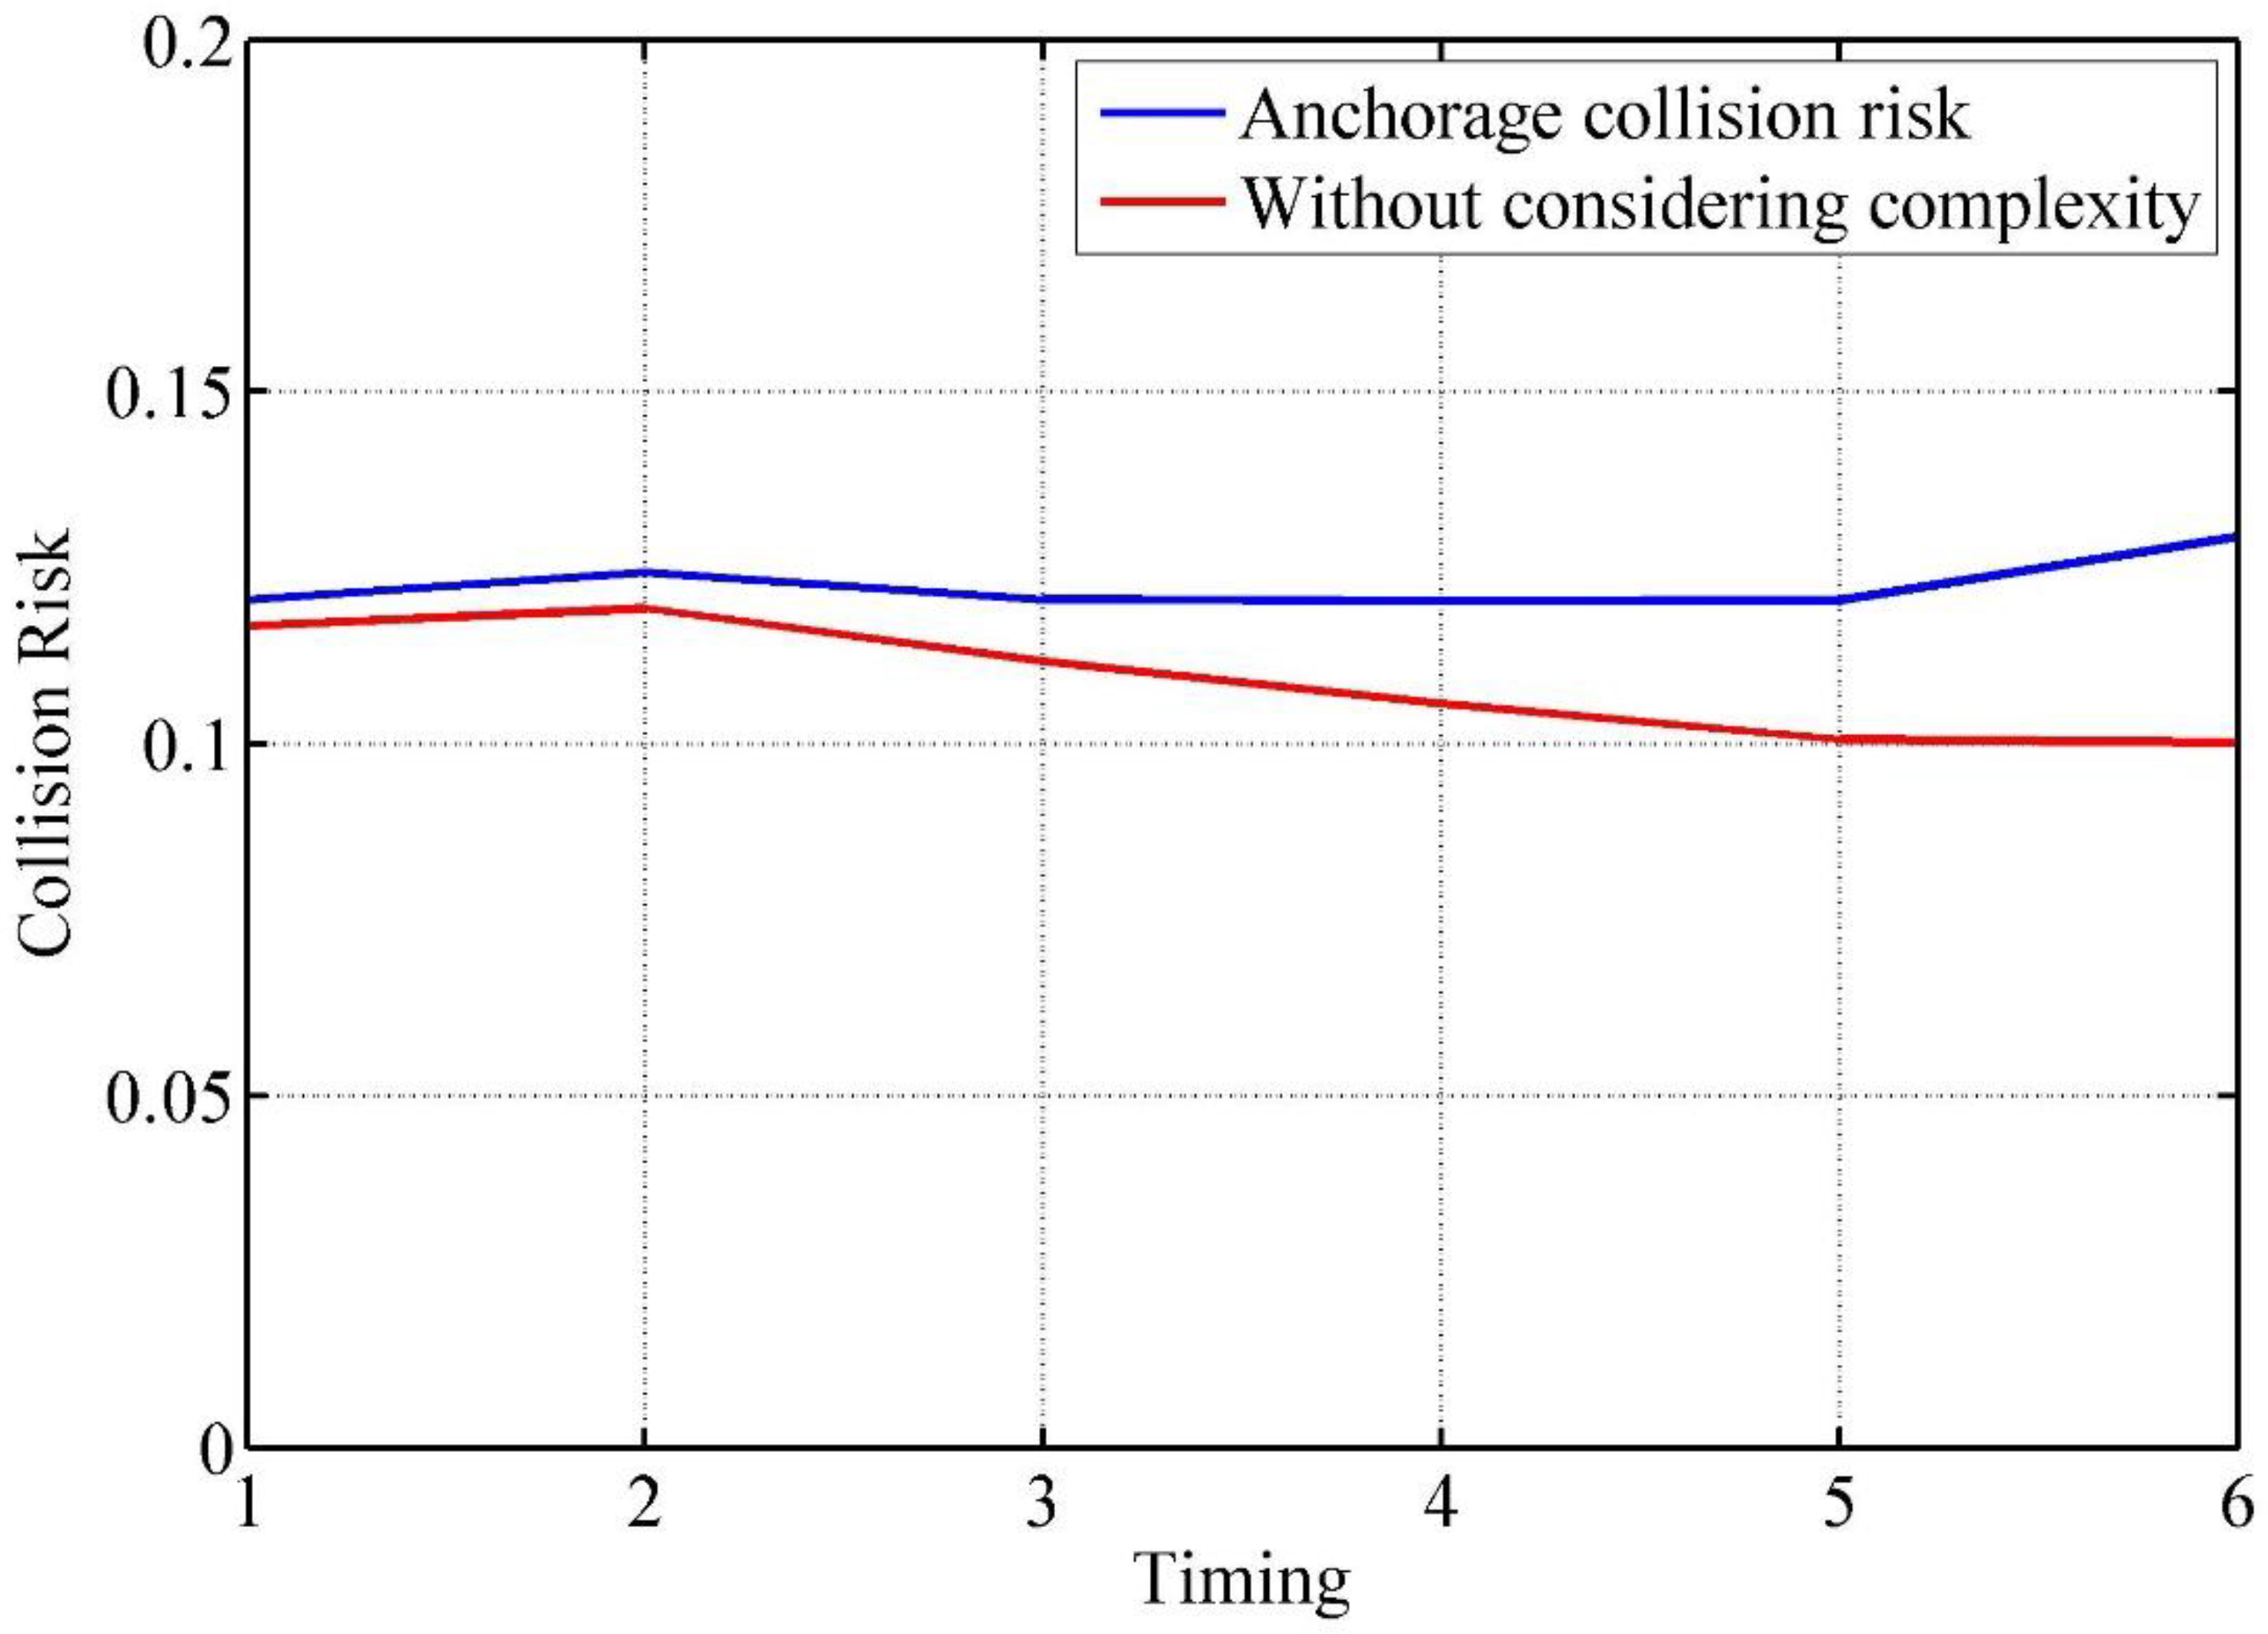
It can be found that the microscopic collision risk was always kept very low and the same because all of the ships in the anchorage in this scenario were anchored ships. However, the collision risks in macroscopic and compactness are different for each moment. For macroscopic collision risk, it increased before Moment 2 and started to decrease after Moment 2. This is because, after Moment 2, the arena of Ship 1 began to overlap with other ships’ arenas, which led to the enlargement of safe navigable waters. The collision risk in compactness kept increasing for these moments because Ship 1 was gradually approaching the center of the anchorage. If the compactness was not considered, the collision risks for these moments are shown in
Figure 19.
It can be found that the trend of the collision risks for these moments is the same as that of macroscopic collision risk (purple line in
Figure 18), where the collision risk increased before Moment 2 and started to decrease after Moment 2. However, the results cannot reflect the collision risk in the anchorage sufficiently. Because as Ship 1 continued to approach the center, that is, close to other ships, even though they were anchored ships, the complex ship traffic situation was easier to be formed, which made collision accidents more likely to happen. Therefore, without taking compactness into account, it is difficult to accurately identify the collision risk in such situations. Therefore, since the ship’s compactness is considered, the proposed model can identify the anchorage collision risk more accurately in complicated situations.
In addition, the proposed anchorage collision risk model was compared with other relevant approaches. The compared approaches include Nguyen et al. [
8], Debnath and Chin [
31], Burmeister et al. [
29], Liu et al. [
33], Huang et al. [
9], Ha et al. [
10], which are all the approaches to identifying the collision risks of a water area or between two ships.
Together with the proposed model, these approaches were compared from eight different perspectives, including the ability to assess collision risk regionally, the ability to assess the collision risk in anchorage, whether consider the microscopic factors or not, whether consider the macroscopic factors or not, whether consider the complexity factors or not, the ability to assess collision risk in real time, and the safety criterion. The comparison is shown in
Table 11.
It can be found that some of the approaches were modeled to assess the collision risk between two ships, such as Nguyen et al. [
8], Huang et al. [
9], and Ha et al. [
10], which pay attention to the microscopic factors of ship collision, such as DCPA, TCPA, etc. These methods can be utilized in automatic collision avoidance or relevant decision-making, but the ability to assess the collision risk regionally was limited. In addition, the characteristics of the anchorage and the ships within anchorage were not well considered, so it is also difficult to assess the collision risk of anchorage accurately by these approaches. For some other approaches which pay attention to the collision risk of anchorage, such as Debnath and Chin [
31], Burmeister et al. [
29], and Liu et al. [
33], there also existed some limitations. Some of the models did not consider the macroscopic factors of anchorage collision risk, such as Burmeister et al. [
29], while some of the models were limited in obtaining real-time risk value, such as Debnath and Chin [
31]. In addition, all these approaches were limited in considering traffic complexity. The safety criterion for them was not as high as the model proposed in this paper because most of them applied DCPA and TCPA, or the equivalent ship domain, which was treated as the encounter radius in all directions, as the safety criterion. However, the proposed model applied the higher safety criterion, which was the arena. Compared with DCPA or ship domain, the arena is a super domain of the ship and can allow two ships to pass safely at a distance beyond the encounter radius or the DCPA, namely, beyond the scope of the ship domain. Therefore, it has a higher safety criterion and can make more contributions to the safety of navigation.
In addition, some typical approaches were selected to make a numerical comparison with the proposed anchorage collision risk model. The scenario in
Figure 16 was used for this comparison experiment. The compared approaches were micro-approach (e.g., Nguyen et al. (2018) [
8]), traditional anchorage collision risk model (e.g., Burmeister et al. (2014) [
29]), and a recent anchorage collision risk model (Liu et al. (2020) [
33]), respectively.
It can be found that the collision risk values obtained via the various approaches for each moment are different. For the micro-approach, since the ships in each moment of the scenario were all anchored ships, there was no relative motion between the ships, and the collision risk calculated based on the relative motion would be almost zero. For the traditional anchorage collision risk models, such as Burmeister et al.’s (2014) [
29], the anchorage collision risk was calculated based on the traffic parameters or ship parameters in a period of time, so it was difficult to identify the instantaneous anchorage collision risk value by such approaches; the collision risk values would be N/A, and they are not shown in
Table 12. Compared with the anchorage collision risk in [
33], it can be found that with the position change of Ship 1, the anchorage collision risk values obtained by [
33] are not only smaller than those of the proposed model but also show a downward trend overall. This indicates that compared with the proposed model, the model in [
33] did not take into account the impact of traffic complexity on the anchorage collision risk under the situation of relatively complex traffic. At the same time, due to the relatively low safety criterion adopted, the results could also be affected. In other words, the proposed model in this paper can identify the anchorage collision risk more effectively in relatively complex anchorage waters under the premise of considering the traffic complexity and adopting higher safety criteria.
In sum, compared with previous studies on anchorage collision risk, the model has the following advantages. Firstly, the influence of traffic complexity was considered in the modeling of anchorage collision risk, which is important for identifying the collision risk of anchorage under complex traffic conditions accurately. Secondly, this paper adopted a higher safety criterion, which is the arena, instead of the ship domain when calculating the safe navigable waters, which can make potential collision risk in the anchorage easier to spot. In addition, the anchorage boundary in the proposed model was set as a variable dynamic range, which can further identify some potential collision risk at the boundary position in addition to the collision risk in the anchorage.
However, the proposed anchorage collision risk model also has some limitations. Firstly, in modeling the microscopic collision risk, the anchored ship was considered a fixed object with no speed. Actually, some anchored ships have a very low drift speed around the anchor. For the simplification of the model, the effect of this tiny drift speed was not incorporated into the model. For further improving the model, this tiny drift speed is supposed to be considered. Secondly, in modeling the complexity level, this paper only considered the complexity in the spatial aspect, which was obtained by assessing the distribution compactness of ships. Some other factors in the motion aspect should also be taken into account. Thirdly, in the case studies of this paper, the three weight coefficients of the collision risk in microscopic, macroscopic, and complexity aspects were determined equal. To further improve the accuracy of the results, the relationship between the coefficient and the characteristic of anchorage should be investigated deeper.
6. Conclusions
In this paper, an analytic model for identifying the real-time anchorage collision risk was proposed based on AIS data. In modeling the anchorage collision risk, three perspectives were considered, which are microscopic collision risk, macroscopic collision risk, and traffic complexity, respectively. Firstly, the microscopic collision risk was modeled based on the relative motion between ships considering the feature of the anchored ship. Secondly, the macroscopic collision risk was modeled according to the characteristic of anchorage by identifying the ratio of safe navigable waters to total water area within a variable dynamic range of anchorage boundary based on the arena of the ship. Thirdly, the traffic complexity was evaluated from the perspective of the spatial compactness of ships based on the radial distribution function in statistical mechanics. Finally, the three aspects were synthesized to obtain a real-time anchorage collision risk value by a classical analytic expression. Compared with the previous studies on anchorage collision risk, the proposed model additionally considered the influence of traffic complexity, which is important for identifying the anchorage collision risk under complicated traffic situations. In addition, the proposed model adopted a higher safety criterion in identifying collision risk by introducing ship arena and setting a variable dynamic range of anchorage boundary, which is more helpful for identifying the potential collision risk of anchorage. For validating the proposed model, some experimental case studies were carried out using the AIS data in the anchorages off the coast of Shandong Peninsular in China, including spatial experiment, temporal experiment, and dynamic experiment. The experiment results show that the proposed model can effectively identify the collision risk level within anchorage and its adjacent waters and has the advantage of dealing with the scenario with relatively higher complexity. The proposed model is helpful for maritime surveillance operators to monitor the ship traffic in anchorage and can also provide mariners with a cognitive reference about the danger in anchorage on their route, which can both facilitate the enhancement of maritime traffic safety.
Notwithstanding, the proposed anchorage collision risk model still has some limitations which should be overcome in the future. Firstly, in modeling microscopic collision risk, the drift speed of the anchored ship is supposed to be considered in order to fully represent the feature of the anchored ship. Secondly, in modeling complexity, it would be better to incorporate the factors on ship motion to make the consideration of traffic complexity more sufficient. Thirdly, in determining the final collision risk of anchorage, the weights of each aspect should be set according to the characteristic of the water area, which is important to improve the proposed model to a higher level.


