Article

Exploring the Pirate Attack Process Risk along the Maritime Silk Road via Dynamic Bayesian Network Analysis

Merchant Marine College, Shanghai Maritime University, Shanghai 201316, China
*
Author to whom correspondence should be addressed.
J. Mar. Sci. Eng. 2023, 11(7), 1430; https://doi.org/10.3390/jmse11071430
Submission received: 16 May 2023 / Revised: 21 June 2023 / Accepted: 26 June 2023 / Published: 17 July 2023
(This article belongs to the Special Issue Maritime Security and Risk Assessments)

Abstract

:
The Maritime Silk Road (MSR) is an important channel for maritime trade between China and other countries in the world. Maritime piracy has brought huge security risks to ships’ navigation and has seriously threatened the lives and property of crew members. To reduce the likelihood of attacks from pirates, it is necessary to study the risk to a ship exposed to attacks from pirates on the MSR. Firstly, risk factors were established from three risk component categories (hazard, mitigation capacity, and vulnerability and exposure) and the risk index system of piracy and armed robbery events was founded. Secondly, the dynamic Bayesian network (DBN) method was introduced to establish a pirate attack risk assessment model ad to conduct a quantitative analysis of the process risk of a ship being attacked by pirates. Finally, combined with the scene data of the MSR, the process risk of a ship being attacked by pirates was modeled and applied as an example. The results showed that the overall risk of a ship being attacked by pirates is the lowest in July and the highest in March. In the whole route, when the ship was in the Gulf of Guinea, the Gulf of Aden–Arabian Sea, and the Strait of Malacca, the risk of pirate attack was the highest. This dynamic network model can effectively analyze the level of risk of pirate attacks on ships, providing a reference for the safety decision-making of ships on ocean routes.

1. Introduction

In the context of economic globalization, over 90% of trade goods are transported by sea [1]. The 21st-century MSR proposed by China in 2013 is a new type of trade corridor, which follows the new development of global politics and trade mode, connecting China and the world [2]. However, frequent pirate attacks and hijackings have become a serious threat to the MSR trade [3]. Surveys have shown that frequent incidents of piracy can lead to a significant reduction in traded goods and an increase in trade costs. Piracy causes approximately USD 25 billion in losses to the world economy every year, as reported by the International Maritime Organization (IMO). This underscores the urgent need to strengthen ship security measures and combat maritime terrorism, as the maritime community acknowledges the profound impact of terrorism on maritime transportation [4]. Therefore, we analyzed the risk of a ship being attacked by pirates in the MSR transportation process, and relevant strategies were put forward according to the results, which is of great significance to the establishment and improvement of ship security systems.
In the field of research on ship security risks, as early as 2003, Wang and Gong [5] explored ship security risks in terms of ship alarms. Subsequently, Lin [6] proposed the security assessment risk decision-making method. Due to the introduction of risk assessment in the International Ship and Port Facility Security Code (ISPS), Juan [7] proposed a defend-attack-defend model starting in 2011 to conduct an adversarial analysis of the attack risk of Somali pirates. Afterward, Struwe [8] conducted feasibility discussions about the measures taken by private security companies in response to frequent piracy incidents at sea. In 2014, Vanek et al. [9] improved the number and time of ship groupings for the Gulf of Aden collective transit plan. Subsequently, researchers increasingly conducted in-depth quantitative research on ship security risks under different algorithms and models. Bouejla et al. [10] used Bayesian networks for parameter management of risk factors for pirate attacks on oilfield facilities. Lewis [11] used a multinomial logistic model to study how crews’ actions and naval actions affect the probability of pirate attacks or hijackings. However, both of them lacked descriptions of the entire risk indicator systems for pirate attacks. Therefore, Pristrom et al. [4] began to build a Bayesian network model to assess the risk of pirate hijacking and verified the feasibility of the model. However, they ignored the risk control after the risk assessment was completed and did not consider the consequences of the risk. In 2019, Jin et al. [12] used a binary logistic regression model to estimate the probability of a ship being attacked by pirates and the success of the attack, but they did not consider the characteristics of spatial changes. Given the previous lack of research on the risks of pirate attacks in ship security risk, Li [13] proposed using the Bayesian network model and the risk matrix method to assess the probability and consequences of the piracy hijacking risk in the sea area. However, they did not consider the limitations of data and the insufficient identification of risk factors. In addition, the literature above mainly studied the risk to a ship exposed to attacks from pirates under static factors without considering that the risk to a ship exposed to attacks from pirates during sea transportation is constantly changing with time and space; these factors are called the dynamic characteristics of risk.
At the same time, domestic and foreign scholars have conducted analysis and provided applications from different perspectives with respect to model and algorithm problems in risk analysis to make up for the shortcomings of specific methods such as evidential reasoning (ER), fuzzy logic, and other methods. Although these methods have been widely used to address the issue of incomplete data on maritime safety, they have not fully analyzed the causal relationships between various influencing factors. With the accumulation of big data and the improvement in mathematical algorithms, database networks have been used for risk assessment prediction and diagnostic analysis. Jiang et al. [2], Wang et al. [14], and Kabir and Papadopoulos [15] found the Bayesian network to be superior in data application. Based on identifying the influencing factors, they innovatively proposed the Bayesian confidence network model in risk analysis. Wang and Yang [16] proposed that the Bayesian network be used to analyze the causality of various influencing factors of maritime accident risk. In addition, Deng et al. [17] proposed an N-K model to reveal the risk coupling characteristics of maritime accidents, while Hsu et al. [18] proposed a continuous risk matrix model to determine the risk level during navigation. However, in reality, risks are constantly changing. To study real-time risks more accurately, Bi et al. [19] used dynamic irregular grids to analyze and evaluate navigation safety. Li et al. [20,21] and Guo et al. [22] proposed using DBN to study risk evolution. Therefore, the introduction of the DBN method not only solved the uncertainty measurement problem based on risk information but also facilitated the analysis of risk characteristics in the spatial and temporal dimensions.
Therefore, this study aims to enhance the risk system of pirate attacks on ships by examining the process risk of pirate attacks in MSR transportation. This research not only contributes to the academic field but also provides practical insights for decision-makers, ship operators, and security agencies in developing effective measures to mitigate the risk of pirate attacks and enhance the security of maritime trade along the MSR. Based on the analysis of the historical database of pirate attack risk, an index system of pirate and armed robbery events based on the interaction between factors was established. Considering the dynamic characteristics of risk factors, a DBN risk analysis model of network topology jurisdiction was established. In combination with the MSR scenario conditions, the risk level of a ship being attacked by pirates under different environmental conditions was studied.

2. Problem Description

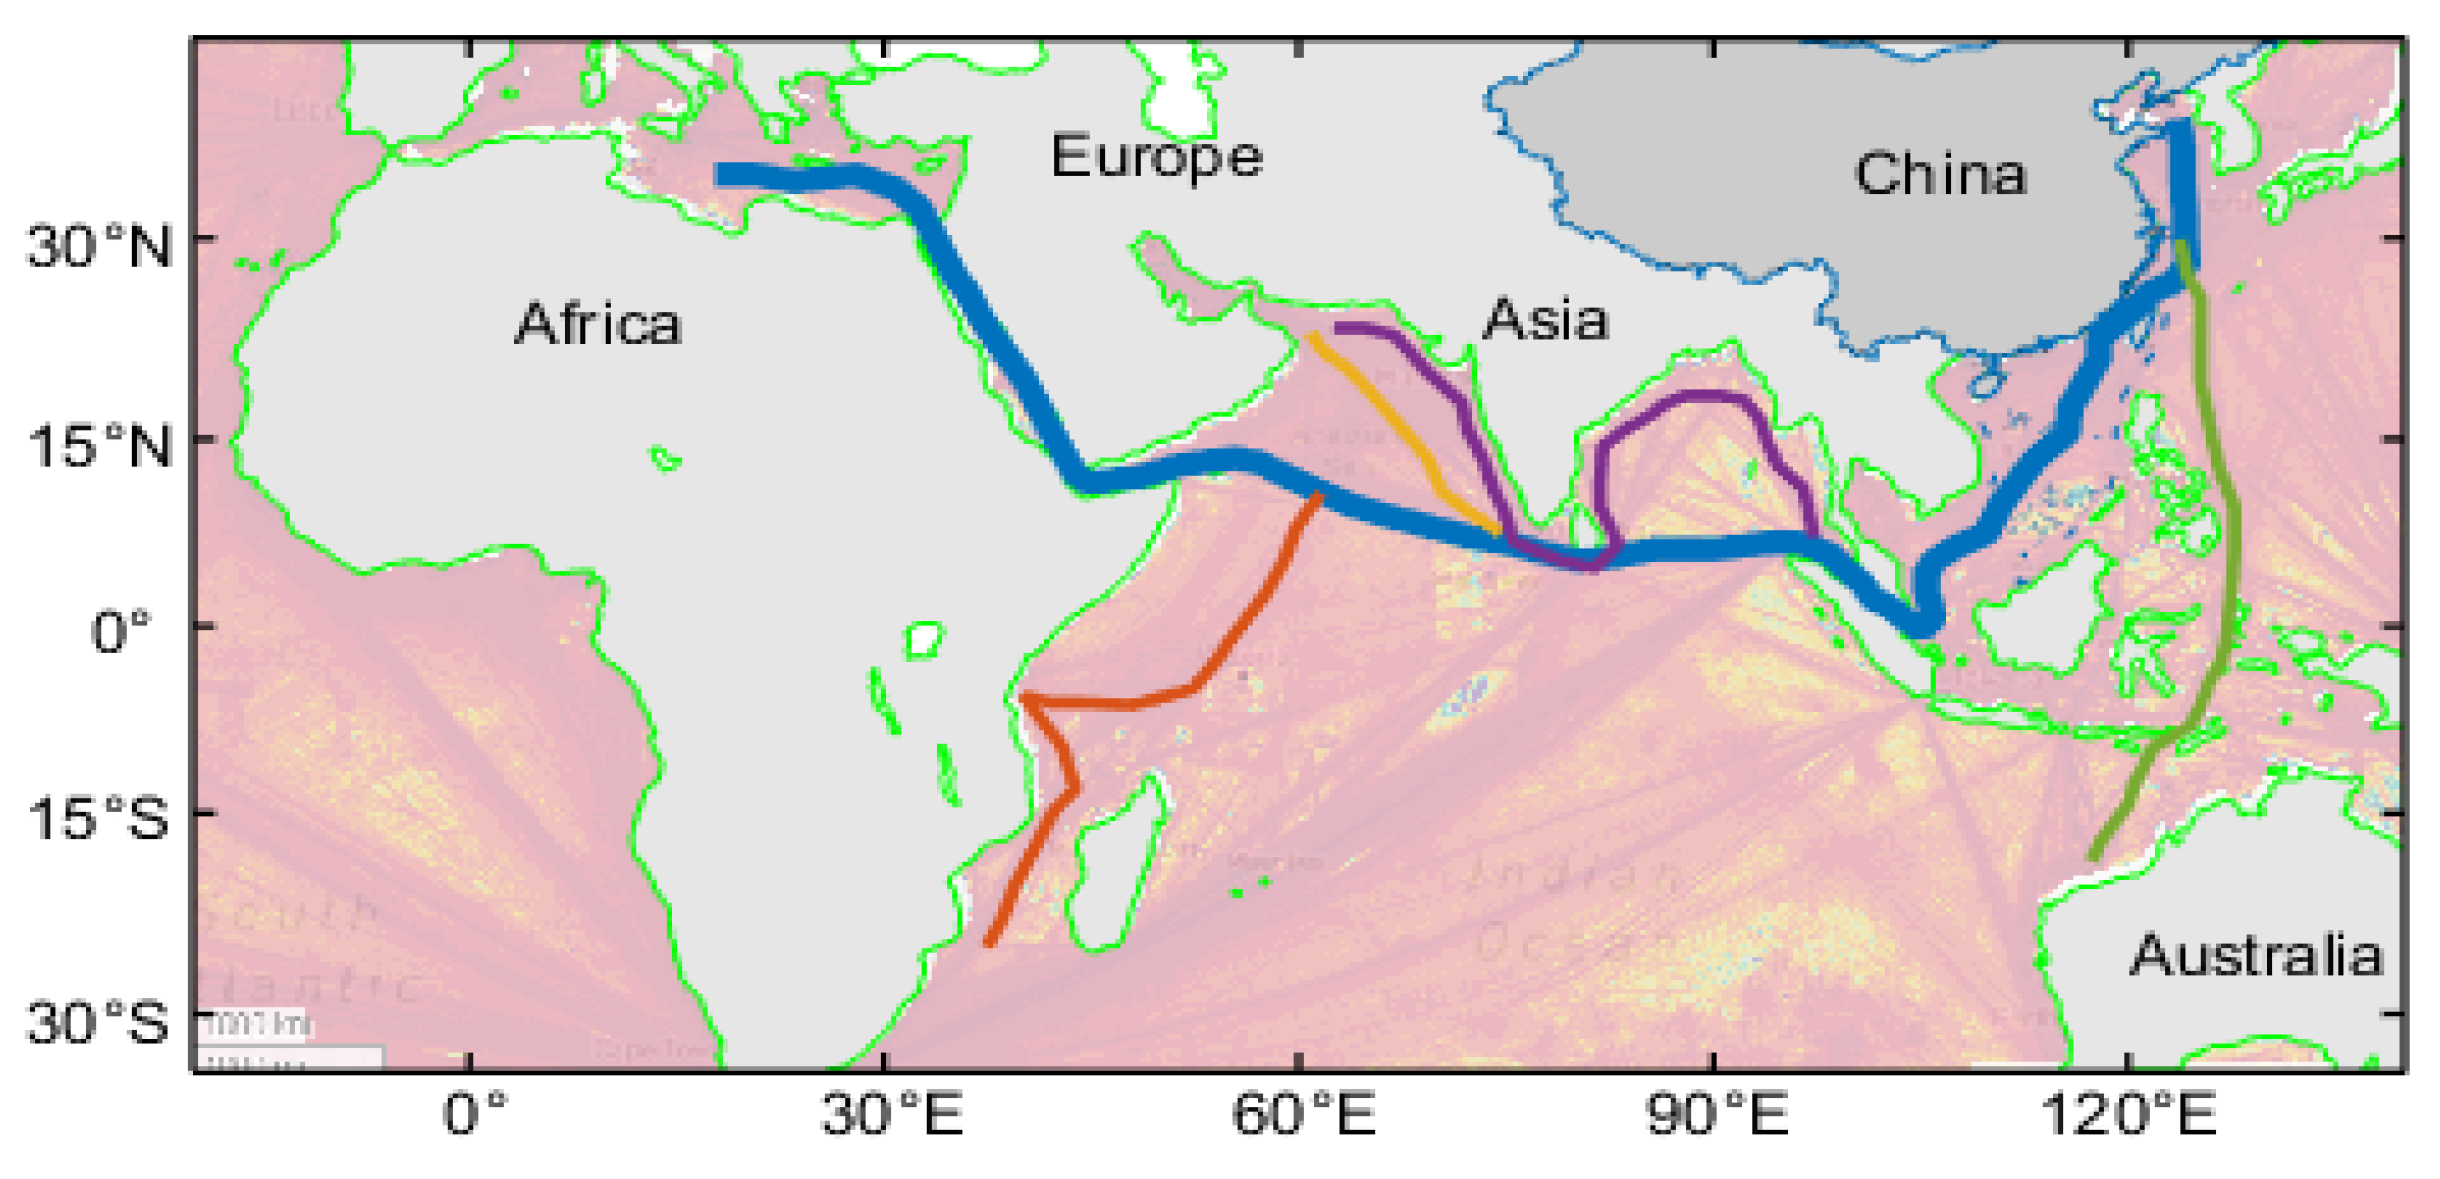
2.1. Pirate Attack Process Risk along the Maritime Silk Road

The MSR is a maritime trade route that starts from Guangzhou, Quanzhou, and other cities on the southeast coast of China and ends at several major ports on the east coast of Southeast Asia, South Asia, the Middle East, and Africa, including Indonesia, India, Sri Lanka, countries along the Persian Gulf, Egypt and other places [23]. As shown in Figure 1, the 21st-century MSR has main sea routes divided into various branches. This paper focused on the western route from Guangzhou to the Mediterranean Sea, which includes key nodes: Malacca Strait, the Gulf of Aden, and the Gulf of Guinea. Due to the important trade position of the MSR, pirate accidents frequently occur. Therefore, it is of great significance to explore the pirate attack risk along the MSR.
The risk of pirate attack falls under the category of ship security risks. Ship security risk refers to the potential threats faced by a specific ship, including its personnel, cargo, equipment, and operations, stemming from illegal acts and terrorism, and the severity of their consequences [24]. Pirate attack risk is the combination of the possibility of a ship and its personnel, cargo, equipment, and operations being threatened by terrorism during transportation and the severity of its consequences. It is the expression of the interactive evolution of dynamic factors and static factors. The risk of a ship being attacked by pirates in the process of transportation is continuous in time and space, and shows the dynamic evolution process of the risk. Therefore, the mathematical model expressing the risk of pirate attacks can be represented by Equations (1) and (2) [20,25].
P ( X n ) = X n X P ( X n | P a ( X n ) )
P ( X , Y , Z ) = P ( Y t | Y t 1 ) t = 0 T 1 P ( Z t \ Y t ) P ( X , Y )
where: X is the static factor of the pirate attack risk; Y is the dynamic factor of the pirate attack risk; Z is the risk of the ship being attacked by pirates; P ( X n ) is the conditional probability of the factor X n ; and P ( Y t | Y t 1 ) is the transfer probability matrix of the dynamic factor Y of the ship at a time t .

2.2. Risk Mechanism of a Ship Being Attacked by Pirates

In this study, we explored the risks of piracy and armed robbery against ships navigating along established routes. We also examined the critical factors that influence these risks. According to the basis that was discussed by previous scholars, risk is defined as the probability and consequences of unforeseen events occurring during a ship’s voyage [26]. A comprehensive risk equation was developed to enhance risk evaluation, incorporating influencing factors from three risk component categories (hazard, mitigation capacity, vulnerability, and exposure) [27,28,29], and the equation is calculated as follows:
Risk = Hazard   × Vulnerability   × Exposure / Mitigation   capacity
Additionally, by utilizing the existing database, we established a risk index system for piracy and armed robbery incidents during a ship’s navigation. The details of this system are shown in Table 1. Within this system, harmfulness mainly refers to the degree to which a system may suffer damage when confronted with specific events or behaviors. Vulnerability and exposure mainly refer to the degree to which a system is susceptible to damage or paralysis when facing external pressure or interference. mitigation capacity describes the ability and effectiveness of disaster prevention and reduction measures, including emergency response, disaster warning, building seismic fortification, and other capabilities. A system with good mitigation capacity can mitigate the impact of risks on the system when facing risks.

3. Model and Method

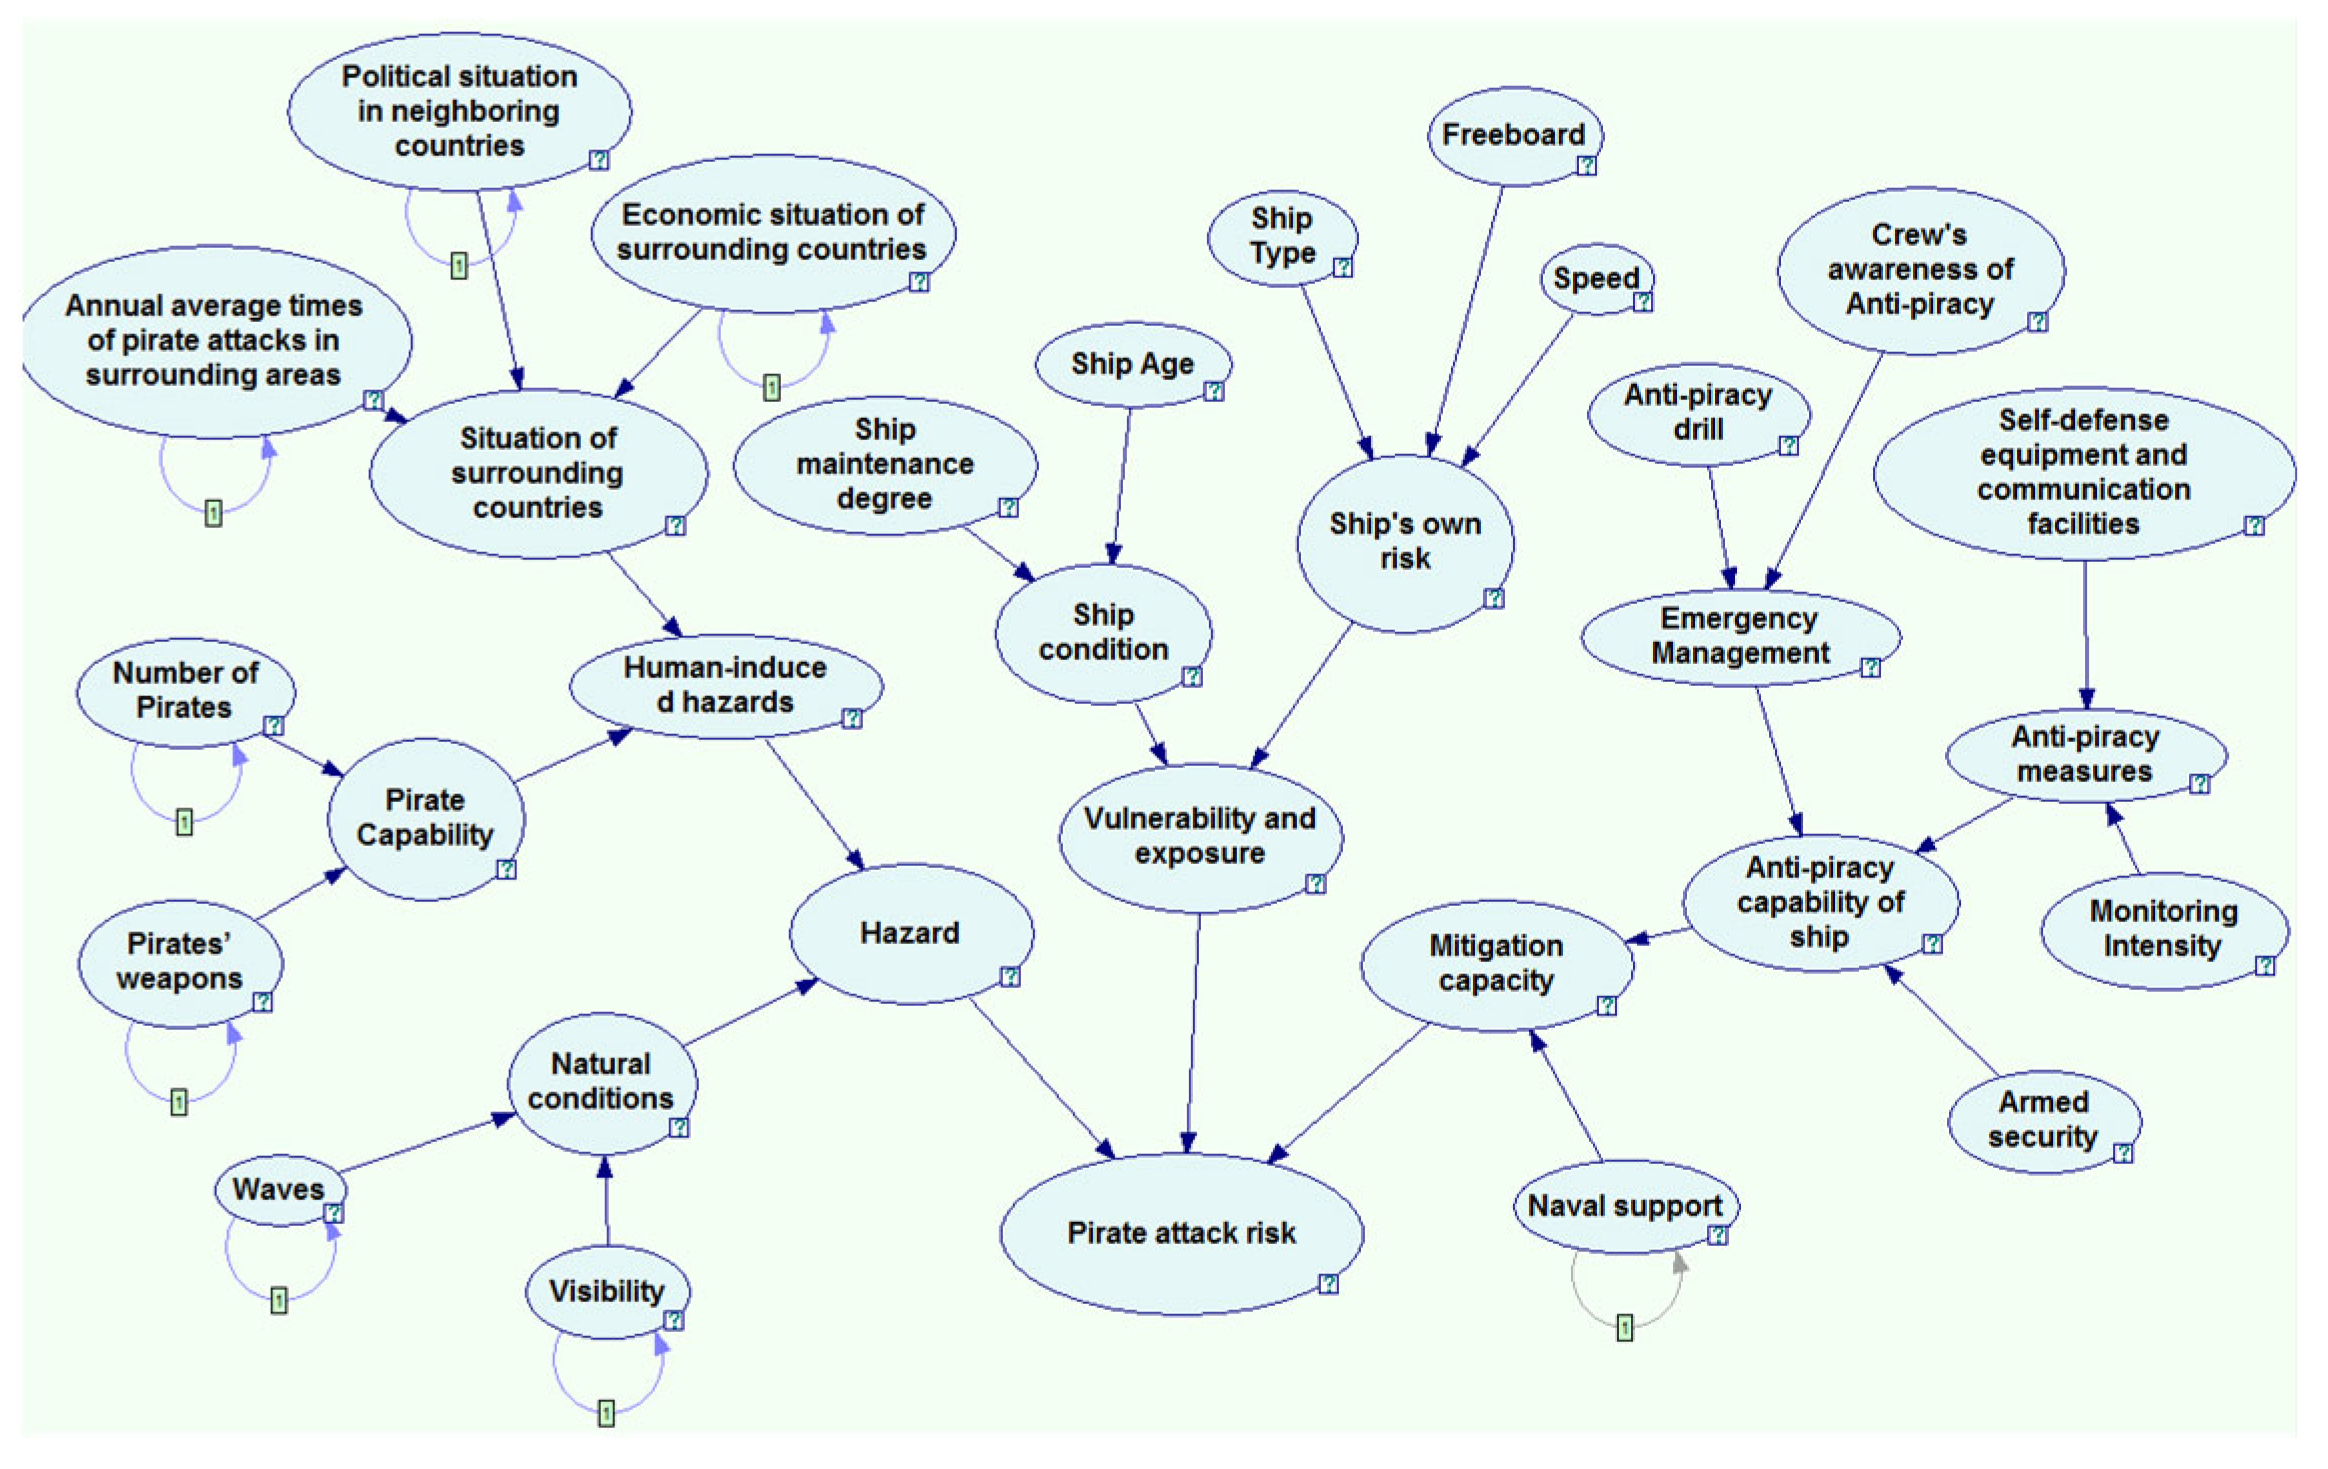
3.1. The Network Structure of Risk Analysis

In the risk indicator system for piracy and armed robbery, the risk of a ship being attacked is determined by the interaction of three risk component categories: hazard, mitigation capacity, and vulnerability and exposure. Moreover, it is also formed by the evolution of dynamic and static indicators.
For example, when the times of pirate attacks in the surrounding area is frequent and the surrounding countries are in a stage of political chaos and economic decline all year round, there is a higher possibility of the “situation of surrounding countries” indicator being “high risk”, which will promote a higher possibility of the “human-induced hazards” indicator being “high risk”. It will increase the possibility of the “ hazard” indicator being “high” and ultimately lead to an increase in the risk of pirate attacks. However, if there are high wave levels during this time, it affect the “natural conditions” indicator as “bad”, and ultimately work together with “human-induced hazards” to “hazard”, reducing the risk of pirate attacks to a certain extent based on the original increase. The same goes for other indicators. From this perspective, the relationship between indicators is network oriented, thus forming a complete pirate attack risk assessment network.
Further analysis of the factors influencing the risk of pirate attacks on ships reveals that these factors exhibit characteristics of directed acyclic relationships. Bayesian networks utilize Directed Acyclic Graphs (DAGs) to represent dependencies between variables, while other risk analysis methods may employ different model representations such as decision trees or regression models. The graph structure of Bayesian networks captures causal relationships and probabilistic dependencies, providing a more intuitive and clear model representation. Moreover, Bayesian networks are probabilistic graphical models that incorporate probability distributions to describe relationships and uncertainties. In contrast, other risk analysis methods may employ deterministic models, disregarding the impact of uncertainty. The probabilistic modeling in Bayesian networks allows for comprehensive consideration of uncertainty and provides accurate probability inference [37]. Therefore, a Bayesian network can be introduced to conduct a quantitative analysis of the risk of pirate attacks.

3.2. Dynamic Bayesian Network Model

3.2.1. Bayesian Network

Bayesian networks, also known as belief networks, are DAG models [13], which comprise nodes representing variables and directed edges connecting these nodes. Nodes represent random variables and directed edges between nodes represent the relationships between them (from parent nodes to child nodes). The relationship between parent and child nodes is expressed through conditional probability tables, while prior probabilities are used for root nodes to convey information. The variables represented by the nodes can be abstractions of any problem and the entire network comprises multiple nodes and directed edges, showing the causal relationships between variables and the conditional independence relationships between nodes. Generally, the Bayesian network structure can be determined in the following ways: (1) by obtaining the Bayesian network structure based on the database; (2) the network structure being established and adjusted according to previous literature and expert suggestions, resulting in the formation of the Bayesian network structure.
The process risk of a ship being attacked by pirates is a continuous process under a time series. However, the traditional Bayesian network ignores the correlation and interaction of factors at different times, which easily leads to misjudgment of the final result. It is difficult to meet the prediction and assessment requirements after the dynamic evolution of factors in a complex dynamic environment. DBN is an extension of the Bayesian network in time series. It extends the Bayesian network by introducing relevant temporal dependencies to model the dynamic behavior of random variables. A DBN consists of a series of time slices and time links, where each slice represents a static Bayesian network that describes the variables at the corresponding time step. The links between variables across different time slices represent temporal probability dependencies [22]. The conditional probability of each variable in a DBN can be calculated independently, which facilitates the interpretation of DBNs.
By analyzing the risk of a ship being attacked by pirates and combining the description of DBN in the previous section, it is found that DBN can describe the process risk of a ship being attacked by pirates more scientifically, intuitively, and accurately. Therefore, by considering influence factors such as waves, visibility, the number of pirates, pirates’ weapons, annual average times of pirate attacks in surrounding areas, the political situation in neighboring countries, the economic situation of surrounding countries, and naval support as dynamic variables in the model, the dynamic property of the system’s behavior can be reflected. Based on the study of the risk mechanism of pirate attacks, a process risk analysis model for pirate attacks based on DBN was established, as shown in Figure 2.

3.2.2. Model Parameter

In the DBN model, there are two types of nodes: one type has one or more parent nodes, and its state is influenced by the combination of its parent nodes, requiring the input of conditional probabilities, which can be obtained through training sample data or expert questionnaires. The other type of node is a root node, requiring the input of prior probabilities, which can be obtained through event case statistics or expert questionnaires.
The transition matrix is usually obtained through expert questionnaires or by combining the Markov model with probability distribution assumptions. DBN is represented as an even pair B 0 , B , where B 0 is the initial BN that defines the probability distribution of P ( Y ) at the initial time and is a 2-TBN containing two-time slices that define the conditional probability distribution between the variables of two adjacent time slices; the state transition probability is expressed as Equation (4).
P ( Y t | Y t 1 ) = i = 1 n t P ( Y t i | P a ( Y t i ) )
where: P ( Y ) is a set of variables, Y t i is the i-th node in the time slice t; P a ( Y t i ) is the parent node of Y t i , nt is the number of nodes in the t-th time slot.

3.3. Risk Value

Because the process risk is dynamic, the pirate attack risk will also change in different environments in the same place. To identify the specific size of the risk, it is necessary to calculate the average risk on the route in the process of risk analysis, which is expressed in Equations (5) and (6) [20].
R ¯ = 1 N t = 1 N R ( t )
R ( t ) = i = 1 n R ( t i ) γ i
where: R ¯ is the average risk of the route, R ( t ) is the comprehensive risk at time t, R ( t i ) is the likelihood of state I at time t, and is the weight of state i. This article divides the risk status of the final pirate attacks into high risk, medium risk, and low risk, with weights of 6, 3, and 1, respectively.

4. Simulation and Results

4.1. Scenario Descriptions

The ship’s route was to depart from Lagos Port in Nigeria in July 2021 to Guangzhou Port; the route was chosen to shorten the voyage and reduce sailing time while at the same time considering commercial, economic, and navigational safety requirements, and included transit through the Suez Canal, the Gulf of Aden, Sri Lanka, the Strait of Malacca, and the South China Sea. The entire route was approximately 11,657 nautical miles, with a sailing time of about 45 days. Due to the presence of pirate attack risks at multiple locations along the entire route, this study integrated a previously proposed process risk model to determine the average risk for the entire voyage.
Due to the relative length of the entire route, to improve the accuracy of risk description, this route is divided into three segments for process risk calculation considering that the dynamic Bayesian transfer matrix is homogeneous. One data sampling point is a time slice.
Seven-time slices were set in the Lagos-Suez Canal route, ten time slices were set in the Suez Canal–Sri Lanka route, and ten time slices were set in the Sri Lanka–Guangzhou Port route. The last time slice of each segment serves as the first time slice of the next segment. The entire route comprises 25 (0~24) time slices.

4.2. Information Acquisition and Parameter Determination

(1) This article incorporates environmental observation data to obtain model parameters of environmental impact factors. The visibility data along the route were gathered from literature sources [4] and transformed to determine the parameter status values. This article introduced environmental observation data to obtain model parameters of environmental impact factors. The visibility data on the route was collected through literature [4] and converted to determine the parameter status values. The sea wave data on the route were obtained from a shared meteorological information website. The data were extracted from the daily variation of sea wave meteorological information. We selected “Significant height of combined wind waves and swell” from the website as the data for the waves in the model [38], for example, as is shown in Figure 3. The daily average wave data from March 1 to March 6 were extracted. Based on expert experience, the wind and wave range were set [0, 3] as normal, [4, 6] as moderate, and level 7 and above as rough. Using interval division to determine the state description data of environmental data, for example, at t = 0, we took these six small pictures as an example in which the daily average wave level of 6 days is in the range of [0, 3]. Therefore, the probability that the wave variable is “normal” at t = 0 is 1, and other data can be obtained in the same way.
(2) Acquisition of prior probability and conditional probability. Historical database information was introduced to determine the conditional probability, prior probability, and other parameters of the network model. Based on the database of pirate and armed robbery incidents from 1994 to 2022 obtained from the IMO website, taking the ship type as an example and combining the statistical results of the database, Figure 4 was obtained. Finally, the prior probability of the ship type was determined as follows: high risk: 0.698; medium risk: 0.221; and low risk: 0.081. The prior probabilities of other non-environmental root nodes were obtained by similar statistical methods.
(3) Acquisition of transition probability. The acquisition of transition probabilities for dynamic nodes is a challenging task in the establishment of the entire model. Through the process risk analysis of pirate attacks, ten variables, including waves, visibility, the numbers of pirates, pirates’ weapons, annual average times of pirate attacks in surrounding areas, the political situation in neighboring countries, the economic situation of surrounding countries, and naval support, were defined as dynamic variables. The transition matrices of different variables were different. Basic transition probabilities of dynamic nodes were established by analyzing the 20-year historical data in the sample database. Taking pirate personnel as an example, the transition matrix is
P 0 = 0.989 0.951 0.872 0.0092 0.032 0.085 0.0018 0.017 0.043
Due to the unavailability of certain parameters in the database, such as the political situation in neighboring countries, the economic situation of surrounding countries, naval support, and so on, parameter values were obtained through questionnaires and expert consultations. The experts involved in this study include professors who have been engaged in this field for many years, as well as captains with extensive navigation experience. For instance, at t = 0, there were three possible states for the political situation in neighboring countries: extremely unstable, unstable, and stable. The probabilities of these three states were determined through questionnaires and expert consultations, with the probabilities of extremely unstable, unstable, and stable being 0.786, 0.201, and 0.013, respectively.

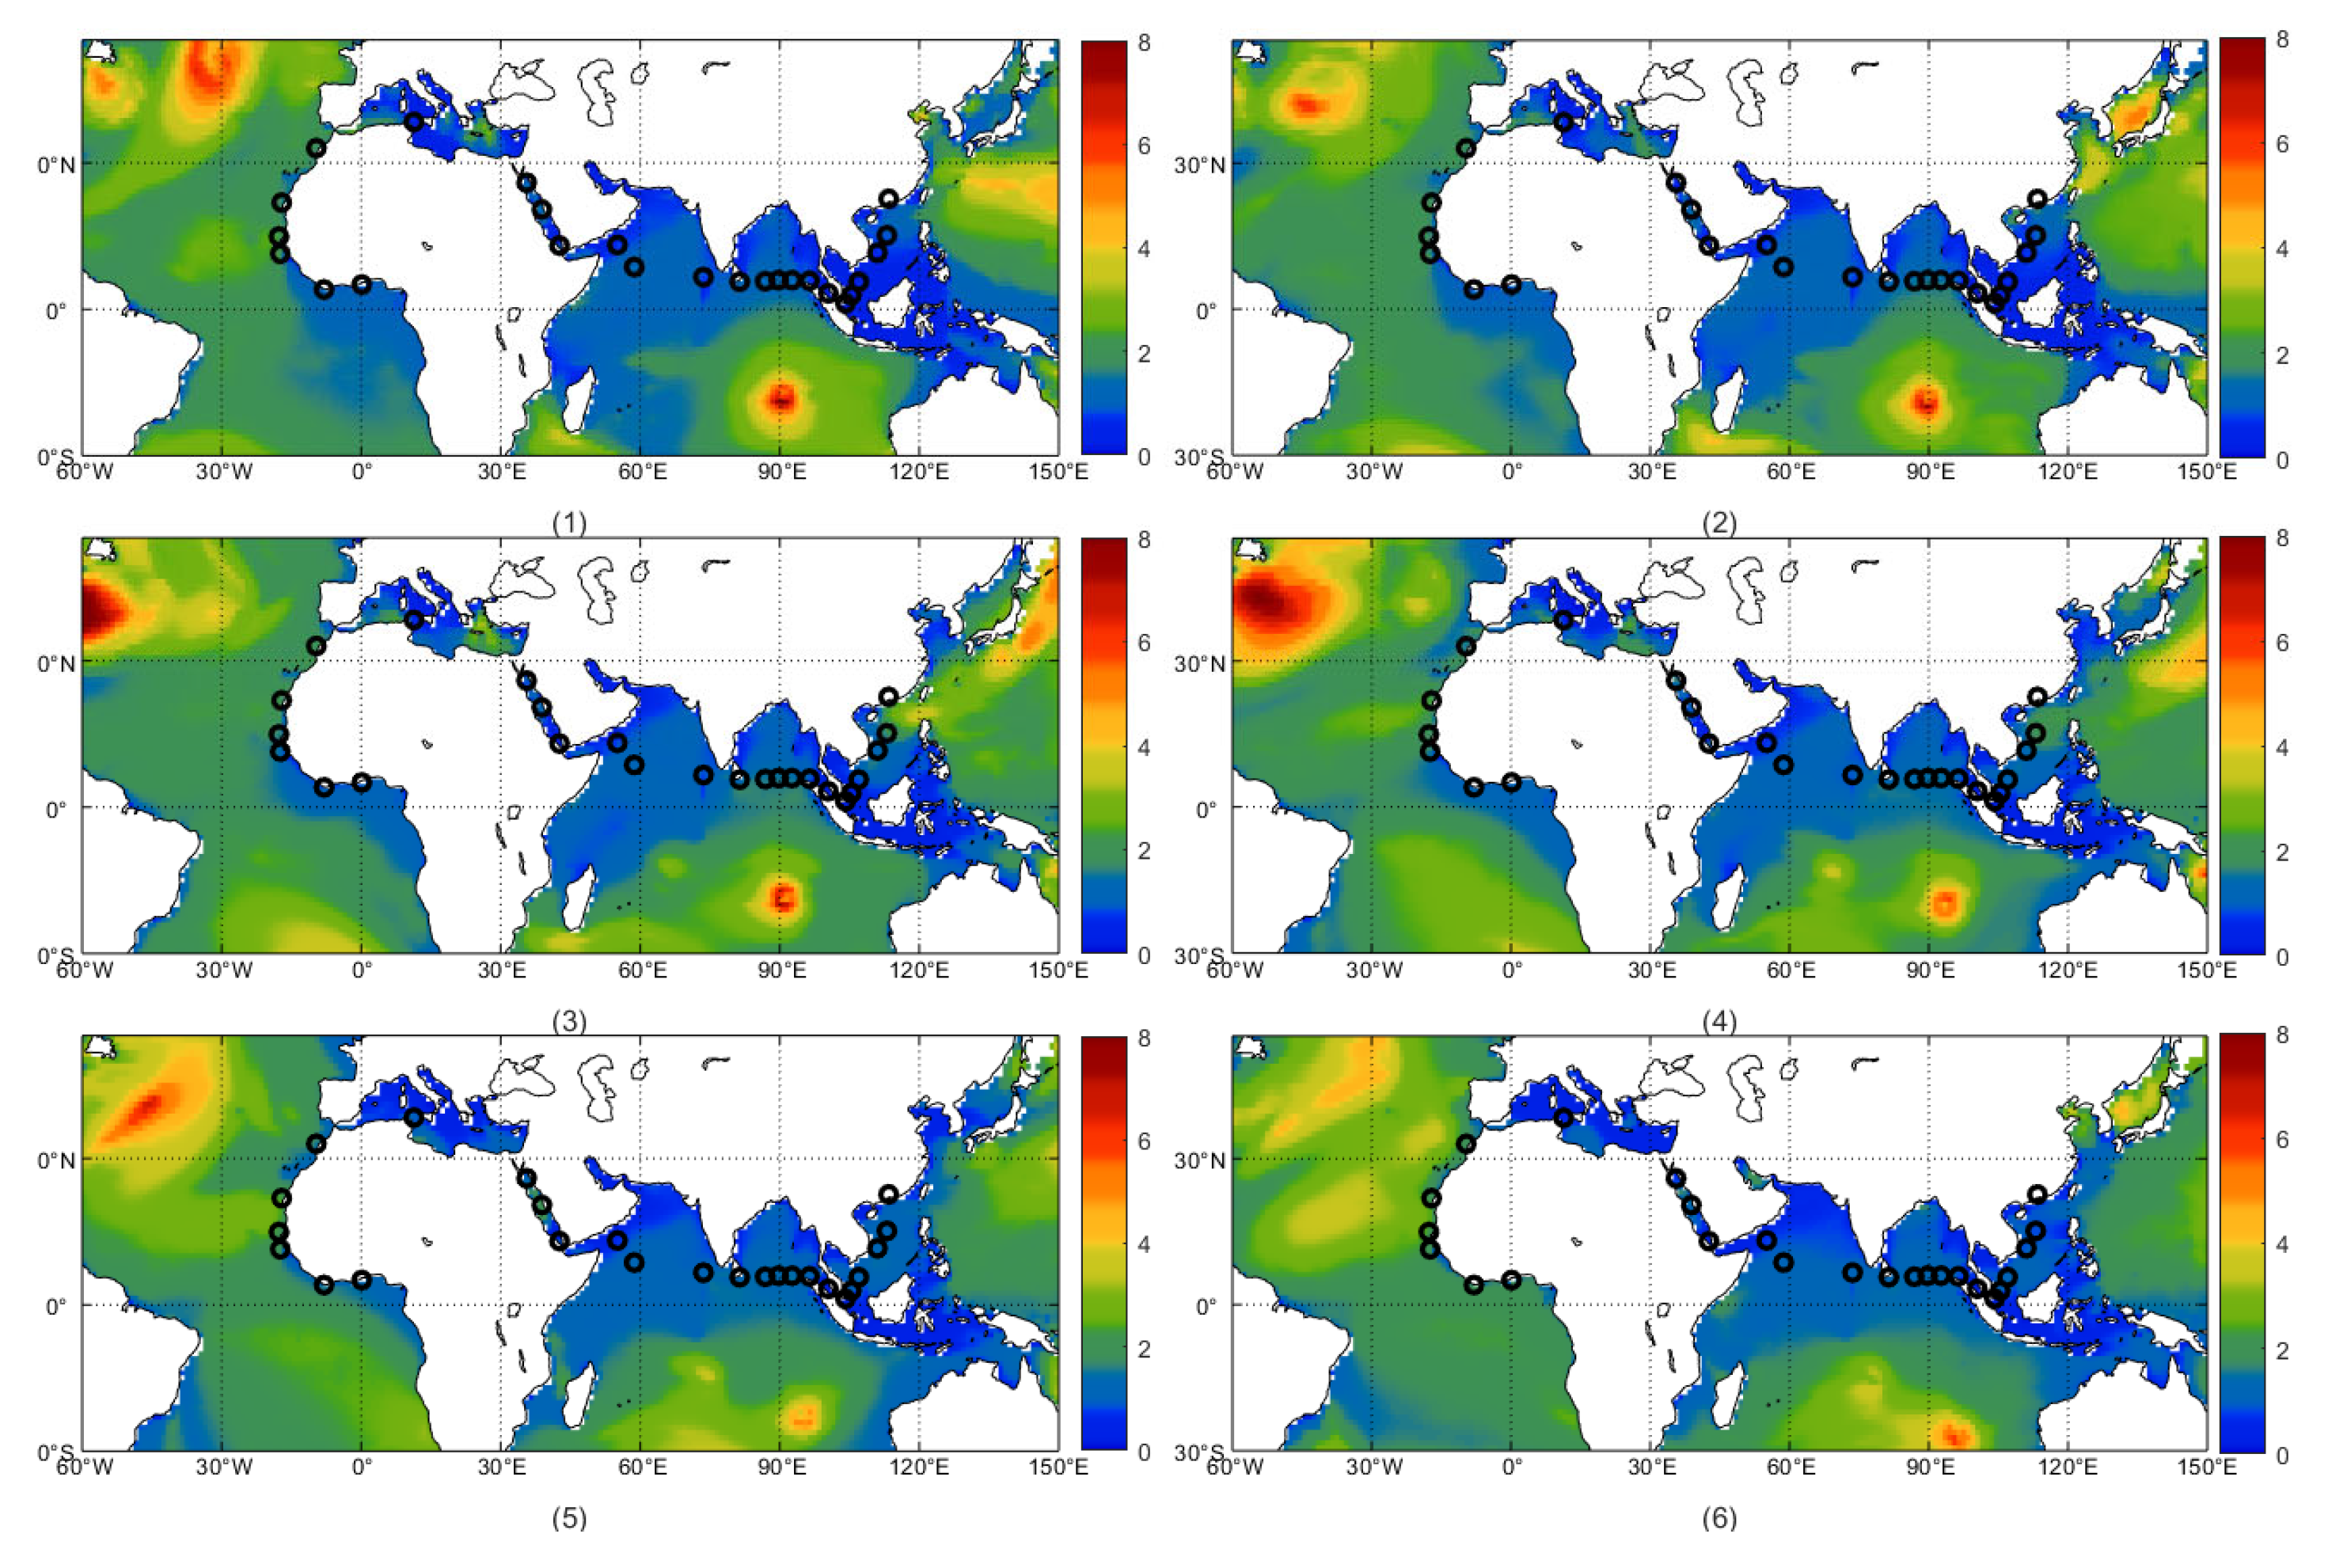
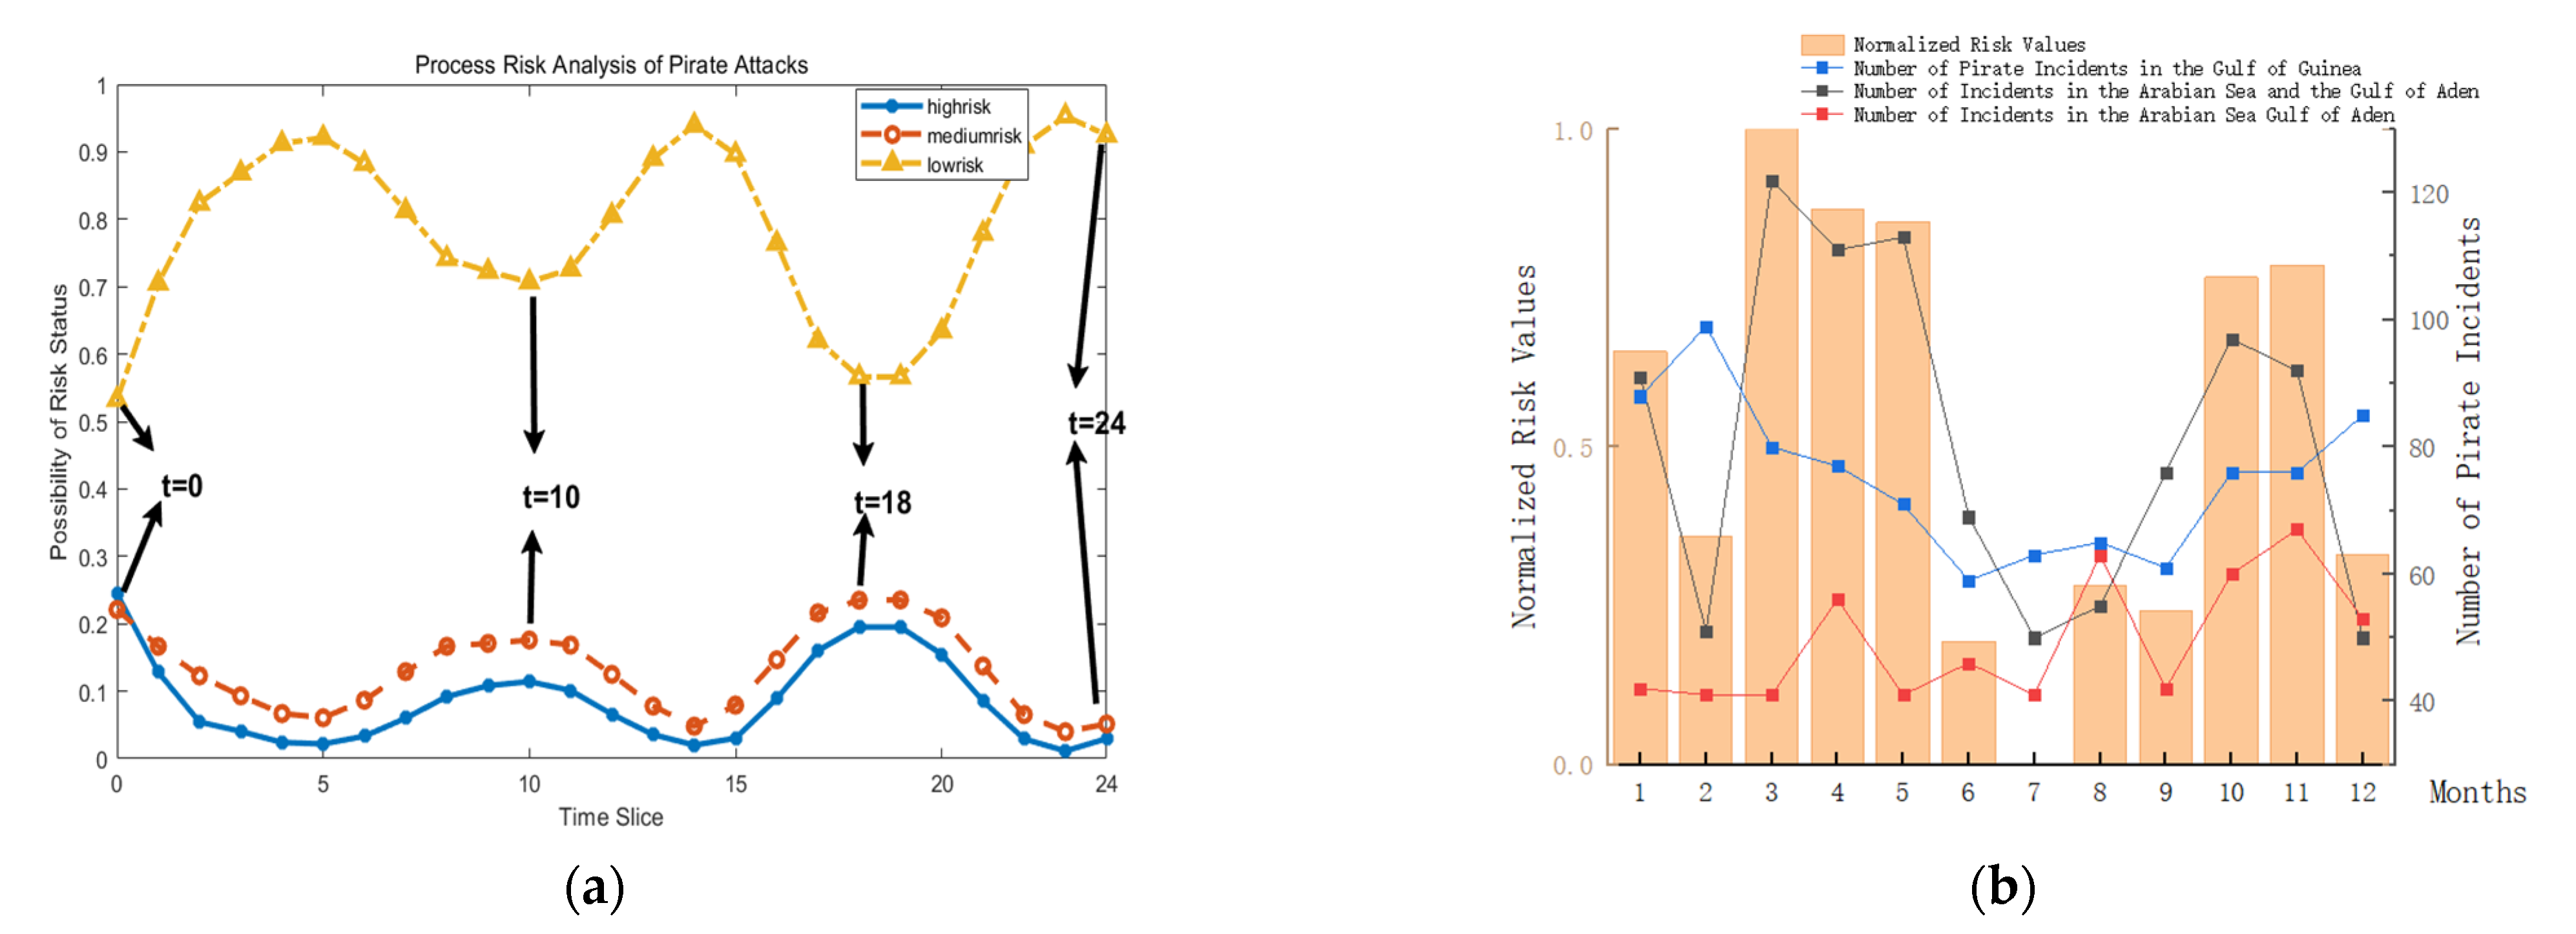
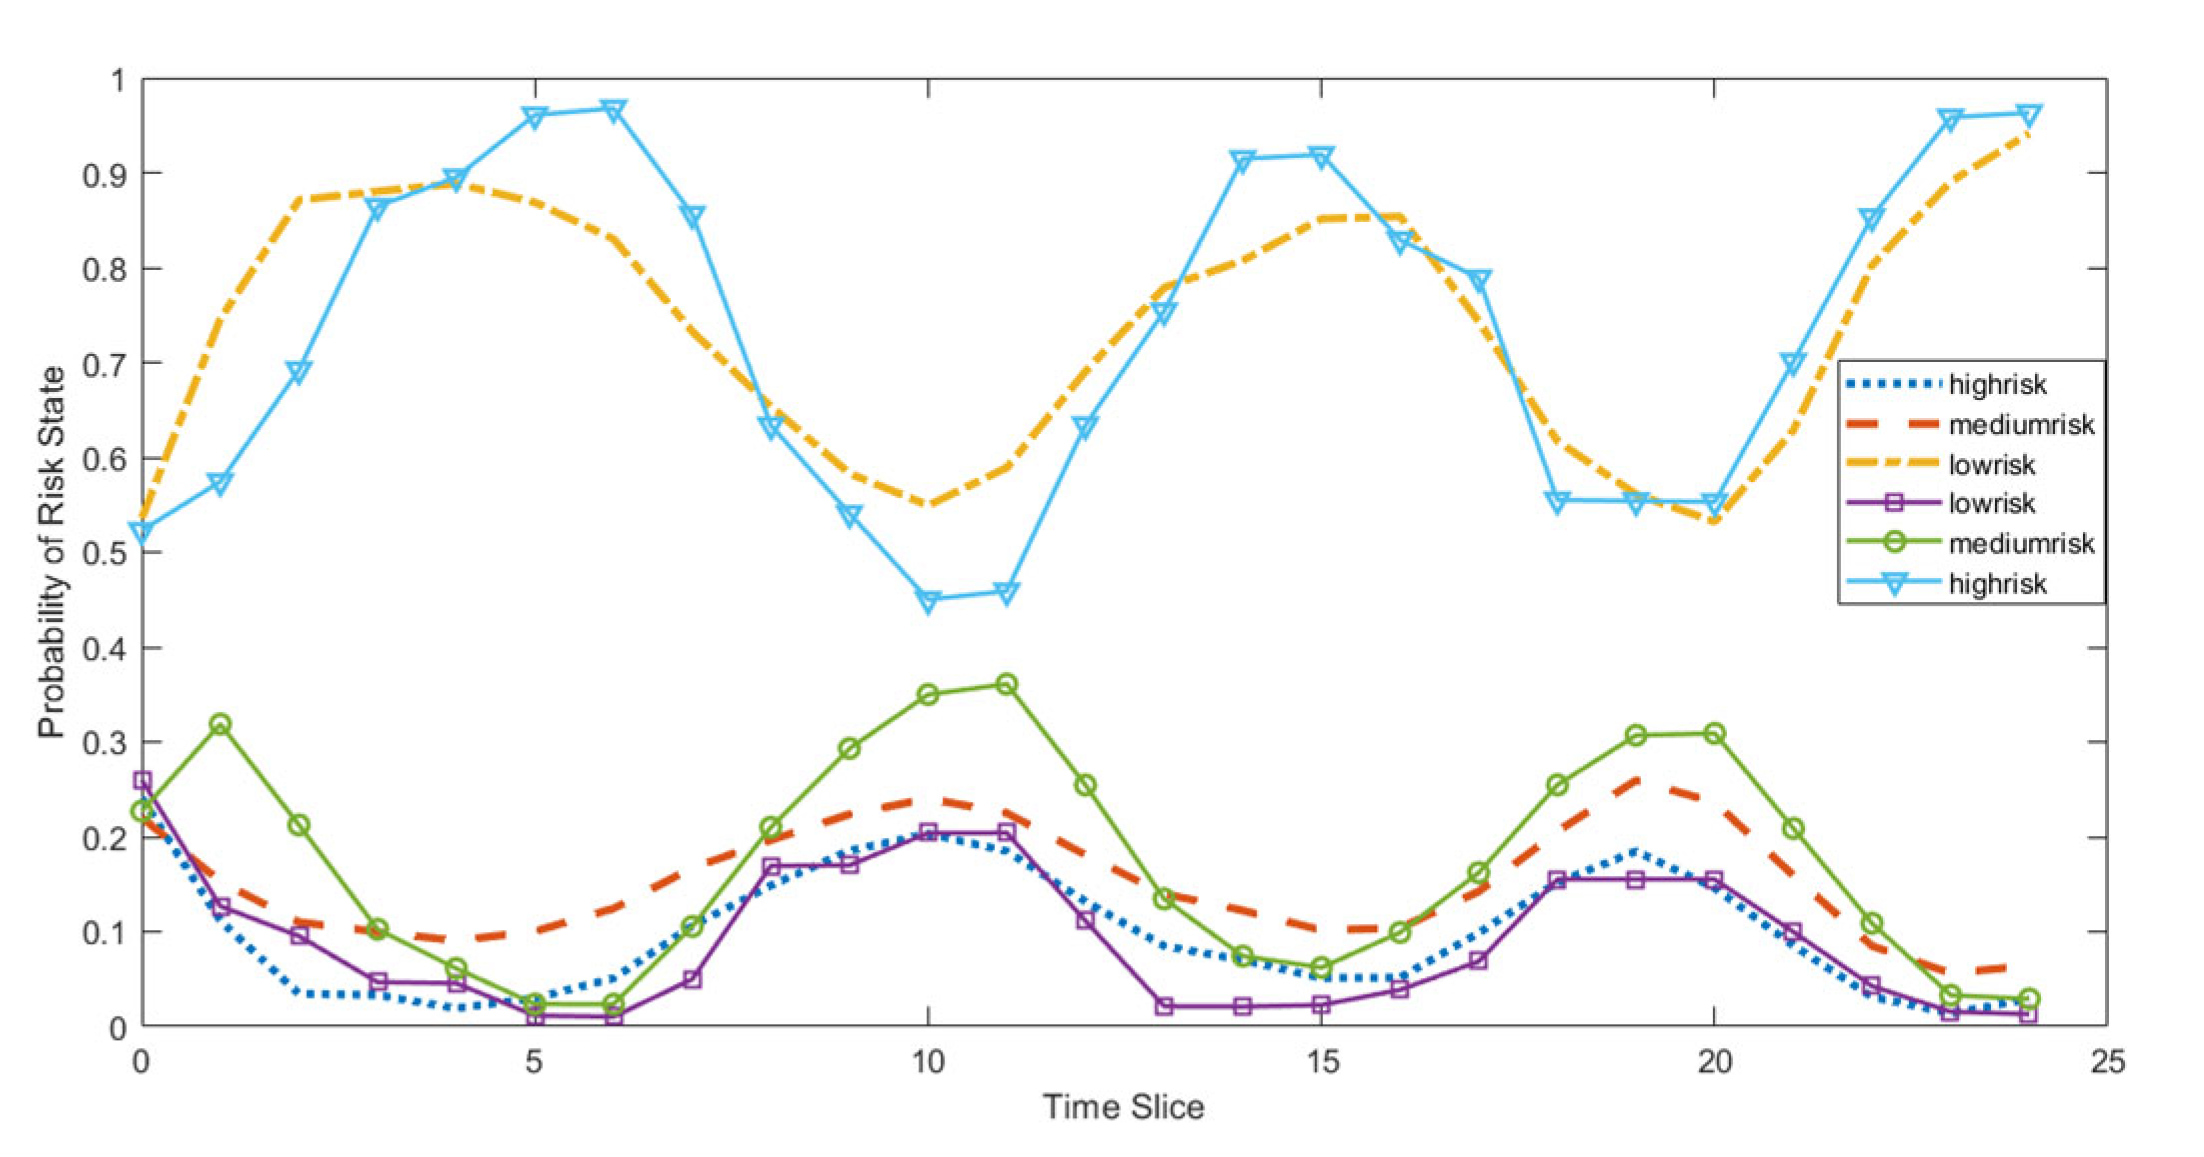
4.3. Process Risk Analysis of Pirate Attacks

(1) Based on the database of pirate attacks and armed robberies obtained from the IMO website, it is evident that there are significant differences in the times of pirate attacks that occur each month out of the 12 months in a year. Therefore, in the following analysis, this paper took the month of July 2021 as an example to assess the risk of pirate attacks, as illustrated in Figure 5a.
(2) Through the analysis of wave information, significant changes in wave conditions could be observed. Therefore, in the analysis of the process risk of pirate attacks, it was necessary to consider the monthly effects of wave factors on pirate attack risks. To this end, we calculated the average risk value for the 12 months using Equations (2) and (3). For a better analysis of risk characteristics, we normalized the values, as is shown in Figure 5b. The results indicated that the trend of pirate accidents is consistent with the trend of wave effects on pirate risk. From March to May, the times of pirate events were relatively high compared to other months, and the risk values were relatively high. From June to September, the times of pirate events and risk values were relatively lower compared to other months. Therefore, we analyzed the months of March with the highest risk values and July with the lowest risk values.

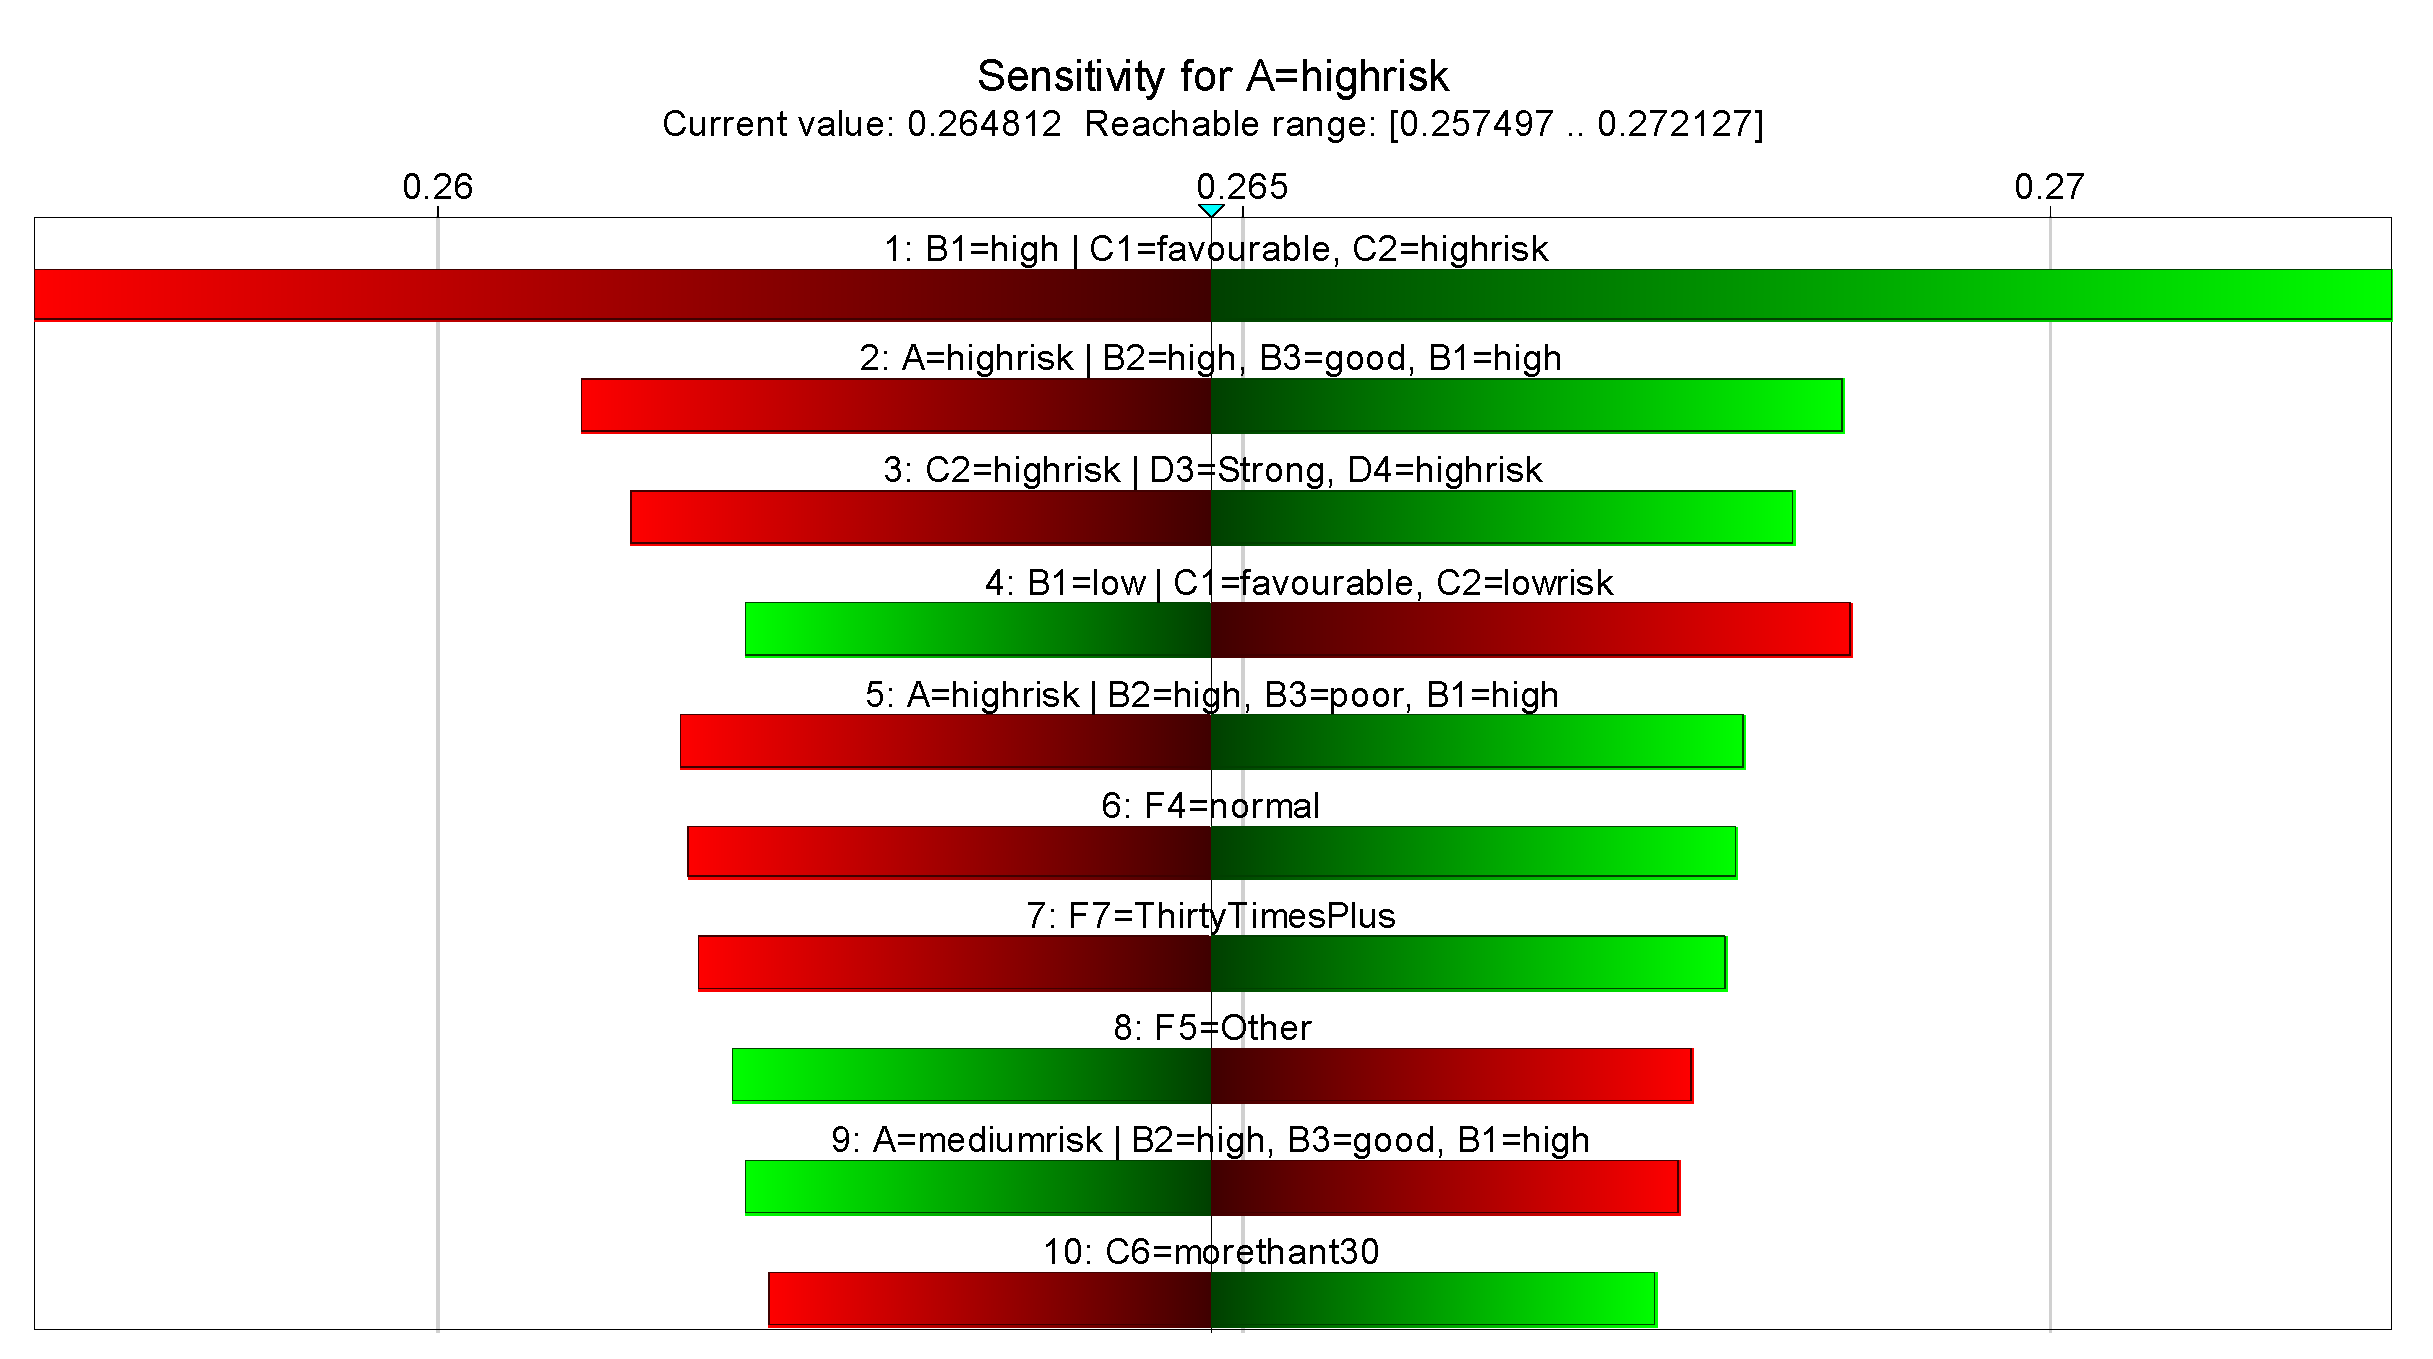
4.4. Sensitivity Analysis

In order to verify the validity of the model, 50 pieces of data in March 2021 were randomly extracted from the database of piracy incidents, and some subjective data were graded by experts with rich navigation experience. By inputting 50 groups of data into the established dynamic Bayesian network, the results of 24 time slices can be obtained. The results are shown in Figure 6, in which the dashed line represents the change of process risk and the solid line represents the results of 50 randomly selected samples input into the model.
The results indicated that the change curve of process risk is roughly consistent with the change curve trend of risk obtained by random sampling, which shows that the model is scientific and effective. In the dynamic Bayesian model, the node “pirate attack risk” was set as the target, and Bayesian network inference could be used to analyze the main sensitive nodes leading to pirate incidents.
As the model is a dynamic network structure, the first time slice was selected for model sensitivity testing to identify the most critically influential factors affecting the risk of pirate attacks. The sensitivity test results for the state “high risk” are shown in Figure 6, where “A” represents the node “pirate attack risk”, “B1” represents “hazard”, “B2” represents “vulnerability and exposure”, “B3” represents “mitigation capacity”, “C1” represents “natural conditions”, “C2” represents “human-induced hazards”, “C6” represents “naval support”, “D3” represents “pirate capability”, “D4” represents “situation of surrounding countries”, “F4” represents “waves”, “F5” represents “pirates’ weapons”, and “F7” represents “annual average times of pirate attacks in surrounding areas”. The green color indicates a positive effect on “high risk”, while the red color indicates a negative impact.
From Figure 7, we can obtain the following conclusions. Under the comprehensive influence of hazard, vulnerability and exposure, and mitigation capacity, “B1 = high|C1 = favourable, C2 = highrisk”, “A = highrisk|B2 = high, B3 = good, B1 = high”, and so on, have positive impacts on the high risk of pirate attacks, while “B1 = low|C1 = favourable, C2 = low risk”, “F5 = Other”, and so on, have negative impacts on the high risk of pirate attacks. Therefore, it can be concluded that “natural conditions” and “human-induced hazards” are the nodes that have the greatest impact on high-risk pirate attacks. “Hazard”, “vulnerability and exposure”, “mitigation capacity”, “navy support”, “pirate capability”, “situation of surrounding countries”, “wave”, “pirates’ weapons”, and “annual average times of pirate attacks in surrounding areas” have a significant impact on high-risk pirate attacks.

5. Discussion

5.1. Process Risk of a Ship Being Attacked by Pirates along the Maritime Silk Road

To investigate the impact of the environment on the risk of pirate attacks further, the months of March (a) and July (b) were taken as examples, as shown in Figure 8.
The Gulf of Guinea (t = 0~1) is located near the equator and experiences relatively stable wave conditions, so there was not much difference in pirate activities between March and July. showing a high intensity. In the region of the Gulf of Aden–Arabian Sea (t = 9~11), March is a non-monsoon period with favorable environmental conditions, resulting in high pirate attack risks. In contrast, during the monsoon period in July, the environment becomes harsh and pirate activities become difficult, leading to a significant decrease in attack risks compared to March. In the Malacca Strait (t = 17~19), the environmental conditions remain stable throughout the year due to its geographical features, resulting in stable pirate attack risks. It could be concluded that pirate attack risks were high when the environment is favorable and decreased with changes in environmental conditions. Based on the analysis, it could be concluded that the average risk of pirate attacks was the lowest in July and the highest in March along the route. Throughout the voyage, the risk of pirate attacks was the highest in the Gulf of Guinea, followed by the Gulf of Aden–Arabian Sea region and the Malacca Strait.
In addition to environmental factors, other dynamic factors also affected the process risk of a ship being attacked by pirates. For example, as shown in Figure 8, the March (a) chart indicates that when the ship is at t = 0, the risk of pirate attacks is high. At this time, the probabilities of the nodes “annual average times of pirate attacks in surrounding areas”, “number of pirates”, and “pirates’ weapons” being in a state of “thirty times and over”, “ten persons and over”, and “guns and rocket-propelled grenades” are 0.528, 0.111, and 0.317, respectively. When the ship reaches t = 7, the risk of pirate attacks is low, with probabilities for the aforementioned nodes of 0.0085, 0.00202, and 0.0091, respectively. At t = 13, the risk of pirate attacks decreases, with probabilities for the nodes of 0.095, 0.007011, and 0.00456. At t = 18, the risk increases, with probabilities for the nodes of 0.44, 0.1712, 0.312. At t = 24, the risk reaches its lowest point, with probabilities for the nodes of 0.0023, 0.00082, and 0.00108. From this analysis, it could be concluded that the risk of pirate attacks increased when there were high times of pirate incidents in the past, and when there were many pirates with advanced weapons, coupled with poor political and economic conditions in the surrounding areas. When such factors were absent or certain measures were taken, the risk of pirate attacks decreases. Moreover, when naval support was prompt or the times of pirates were low, the risk of pirate attacks also decreased.

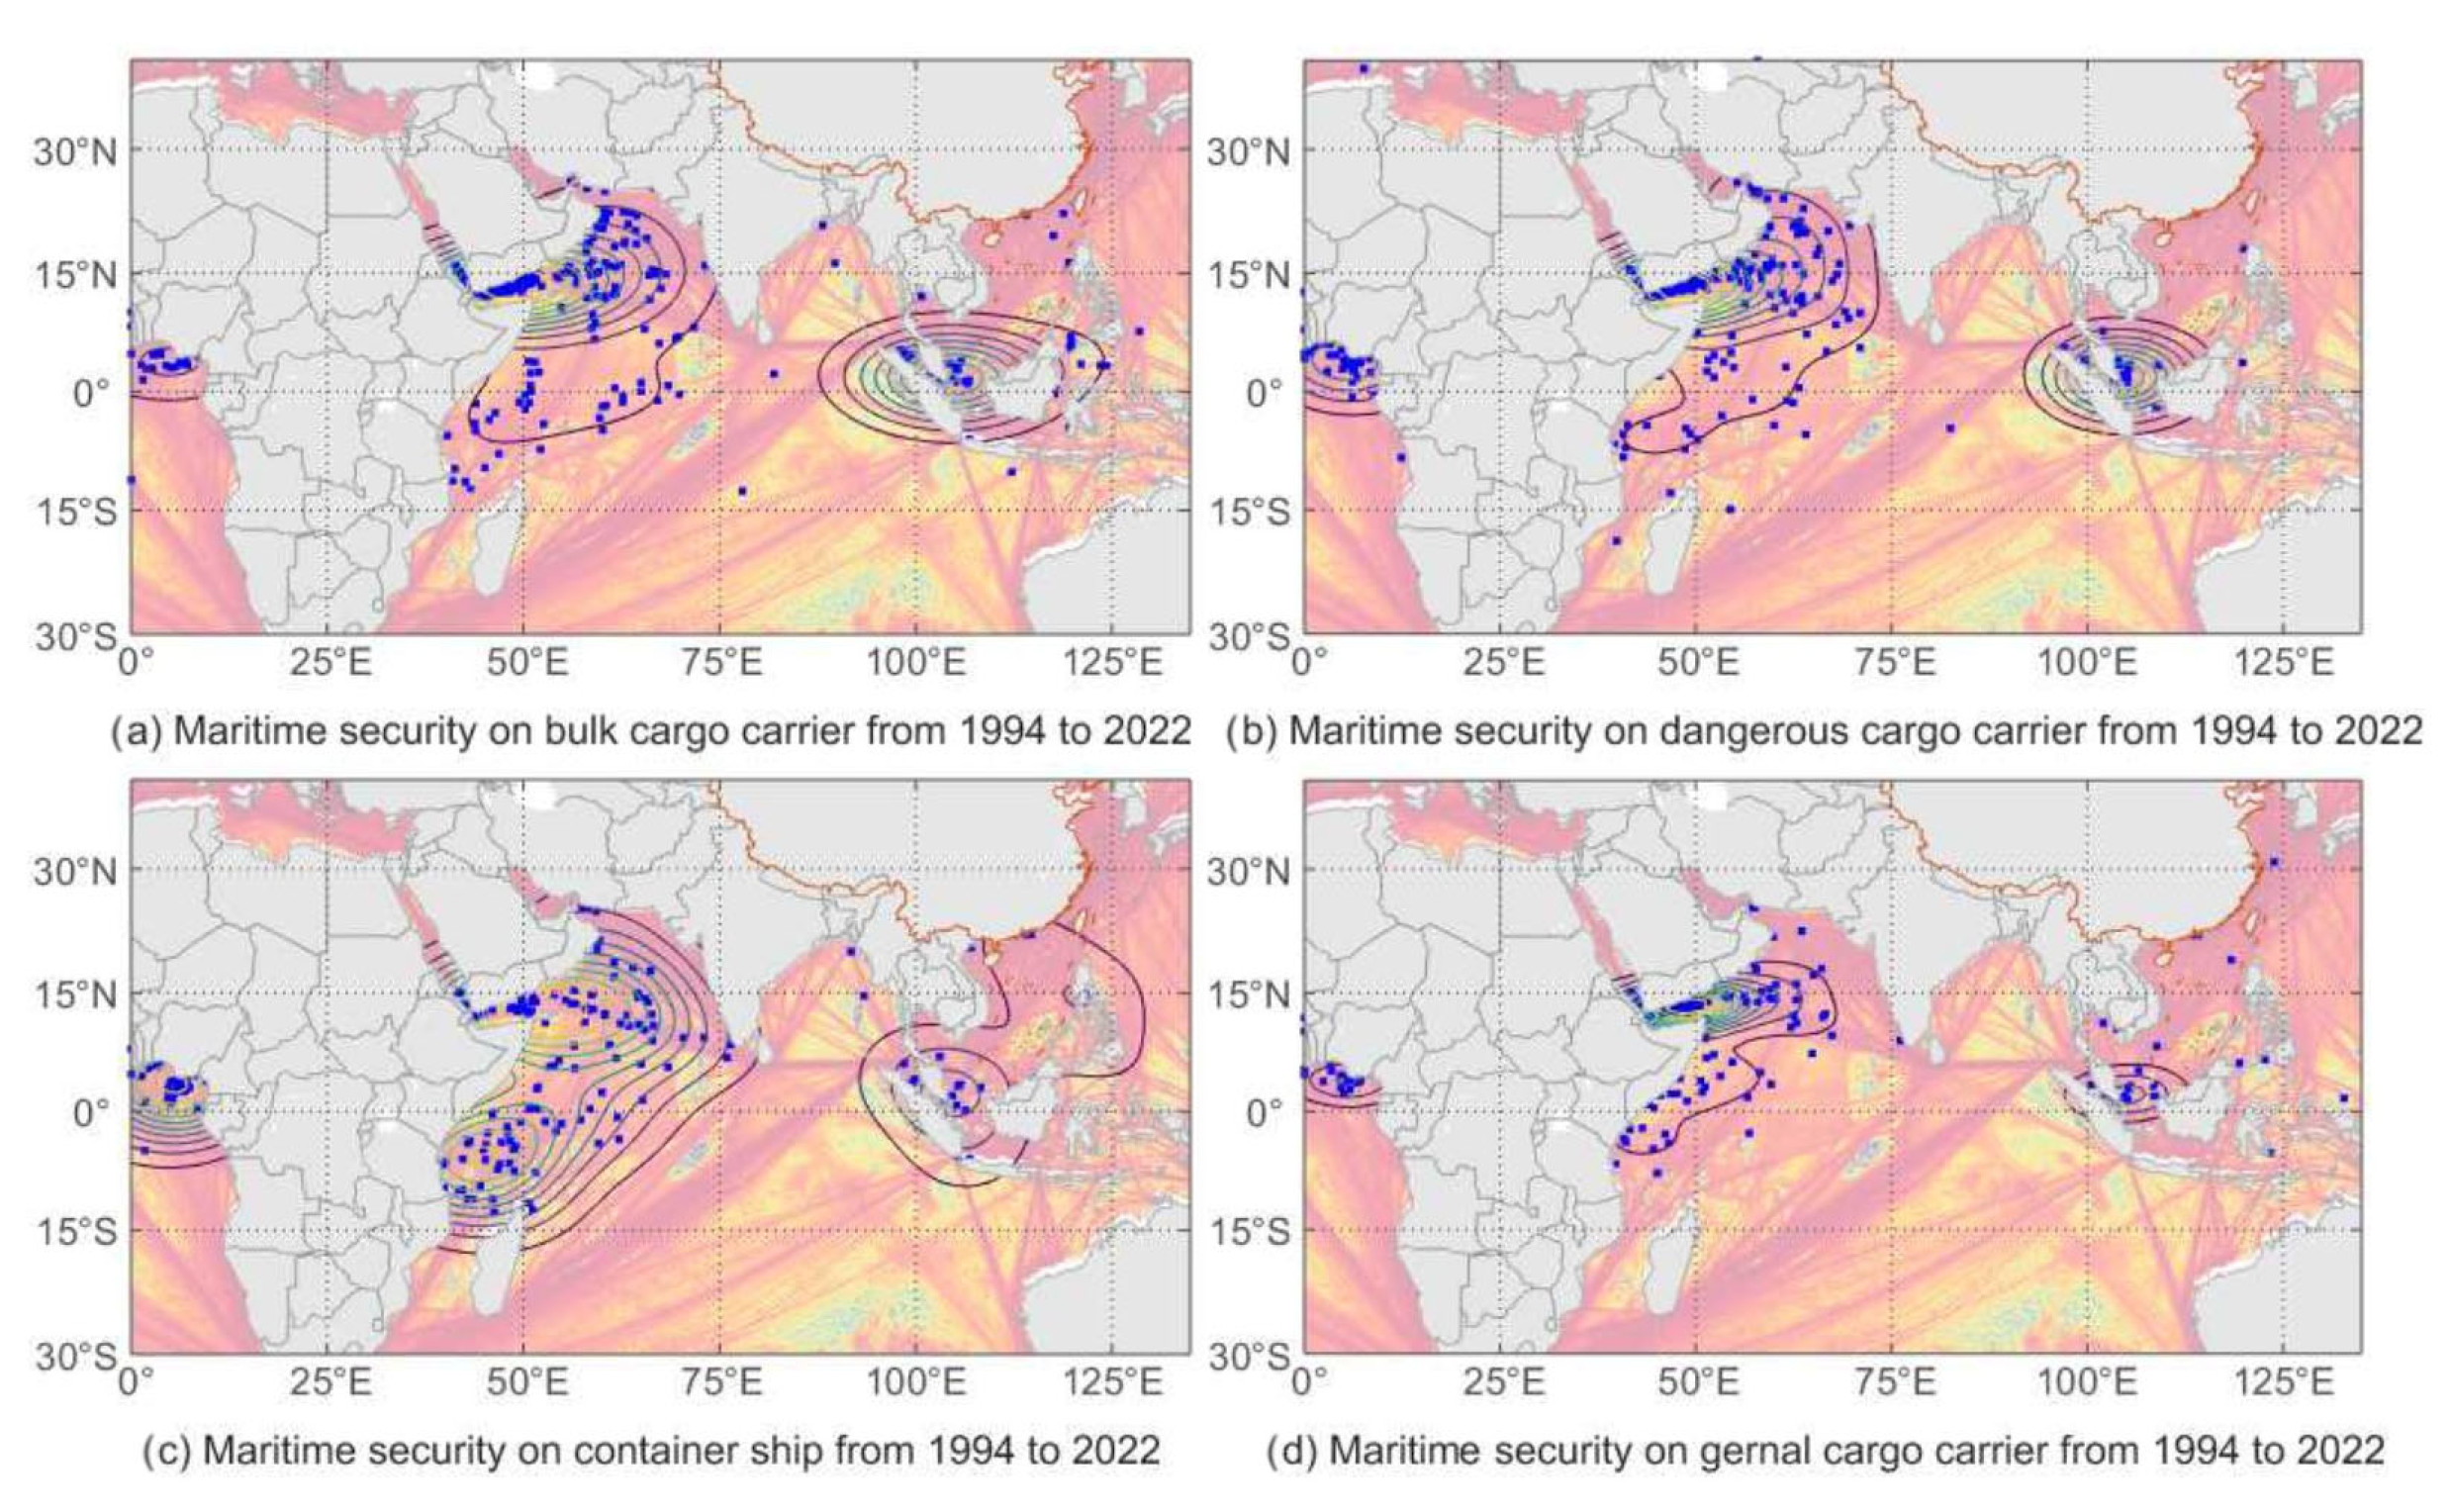
5.2. The Realistic Situation of Pirate Attacks Risk along the Maritime Silk Road

When a ship is navigating through pirate-prone areas, the likelihood of a ship being attacked by pirates was high. However, encountering adverse weather conditions could significantly reduce the likelihood of such attacks, regardless of the area. In regions where pirate incidents were frequent, the level of piracy capabilities, such as the number of pirates and the weapons used, could also impact the risk to a ship exposed to attacks from pirates. When the number of pirates was small, such as one or two, and when they had no weapons or only used simple tools, the risk of pirate attacks was greatly reduced due to the system’s ability to resist risks. However, if the number of pirates exceeded ten and they used advanced weapons and equipment, the risk increased. Additionally, ships carrying high-value goods such as petroleum were more likely to be targeted by pirates.
In reality, the Gulf of Guinea is frequented by pirates due to a lack of naval support, political instability in surrounding countries, and economic recession, among many other factors that trigger pirate attacks. As a vital channel connecting the Red Sea and the Indian Ocean, the Gulf of Aden witnesses a large number of high-value ships, such as oil tankers and cargo ships, pass through annually. The geographical location of the Gulf of Aden also holds significant military strategic importance, contributing to the surrounding countries’ political instability and poor economic conditions, leading to numerous severe pirate incidents. The Strait of Malacca, as a critical trading route in Asia, has an enormous amount of maritime transportation. Due to the vast wealth involved in trade and the significant wealth gap in nearby regions, some areas experience political instability and economic stagnation. Consequently, some individuals engage in illegal activities with support from coastal villages. Governments making efforts to combat piracy also face certain challenges. These combined factors contribute to a higher risk of piracy in the waters of the Strait of Malacca.

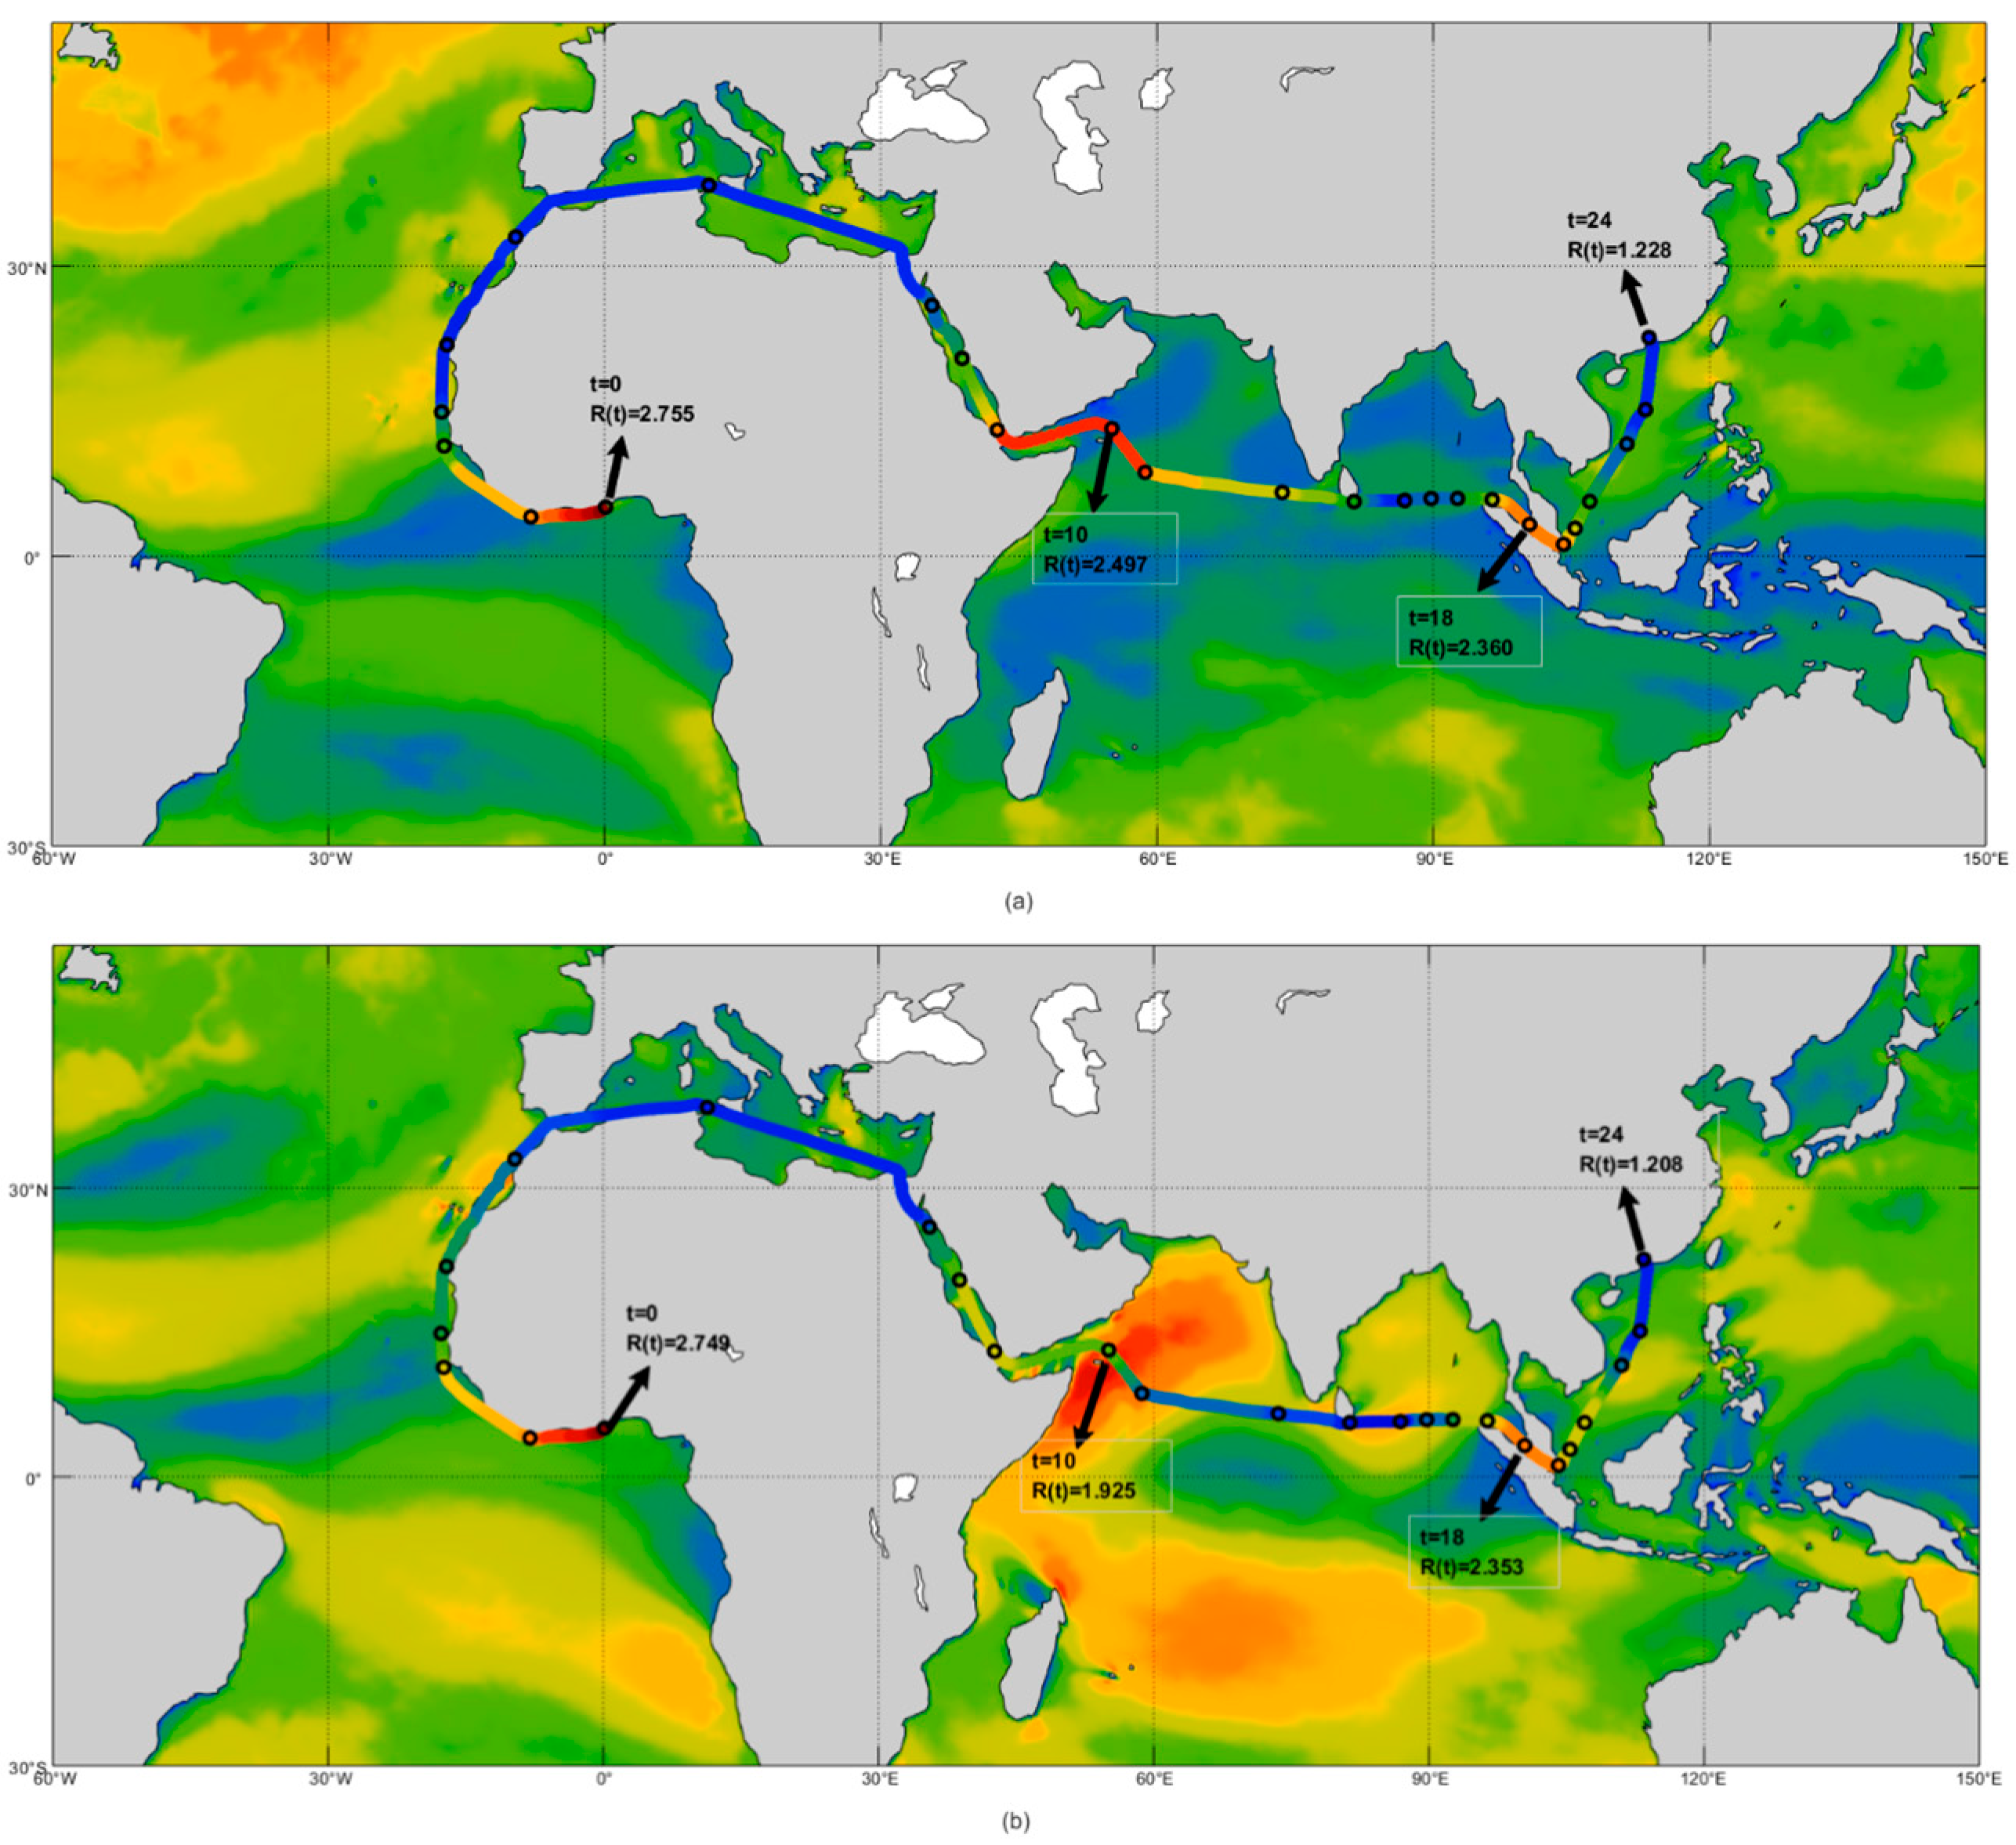
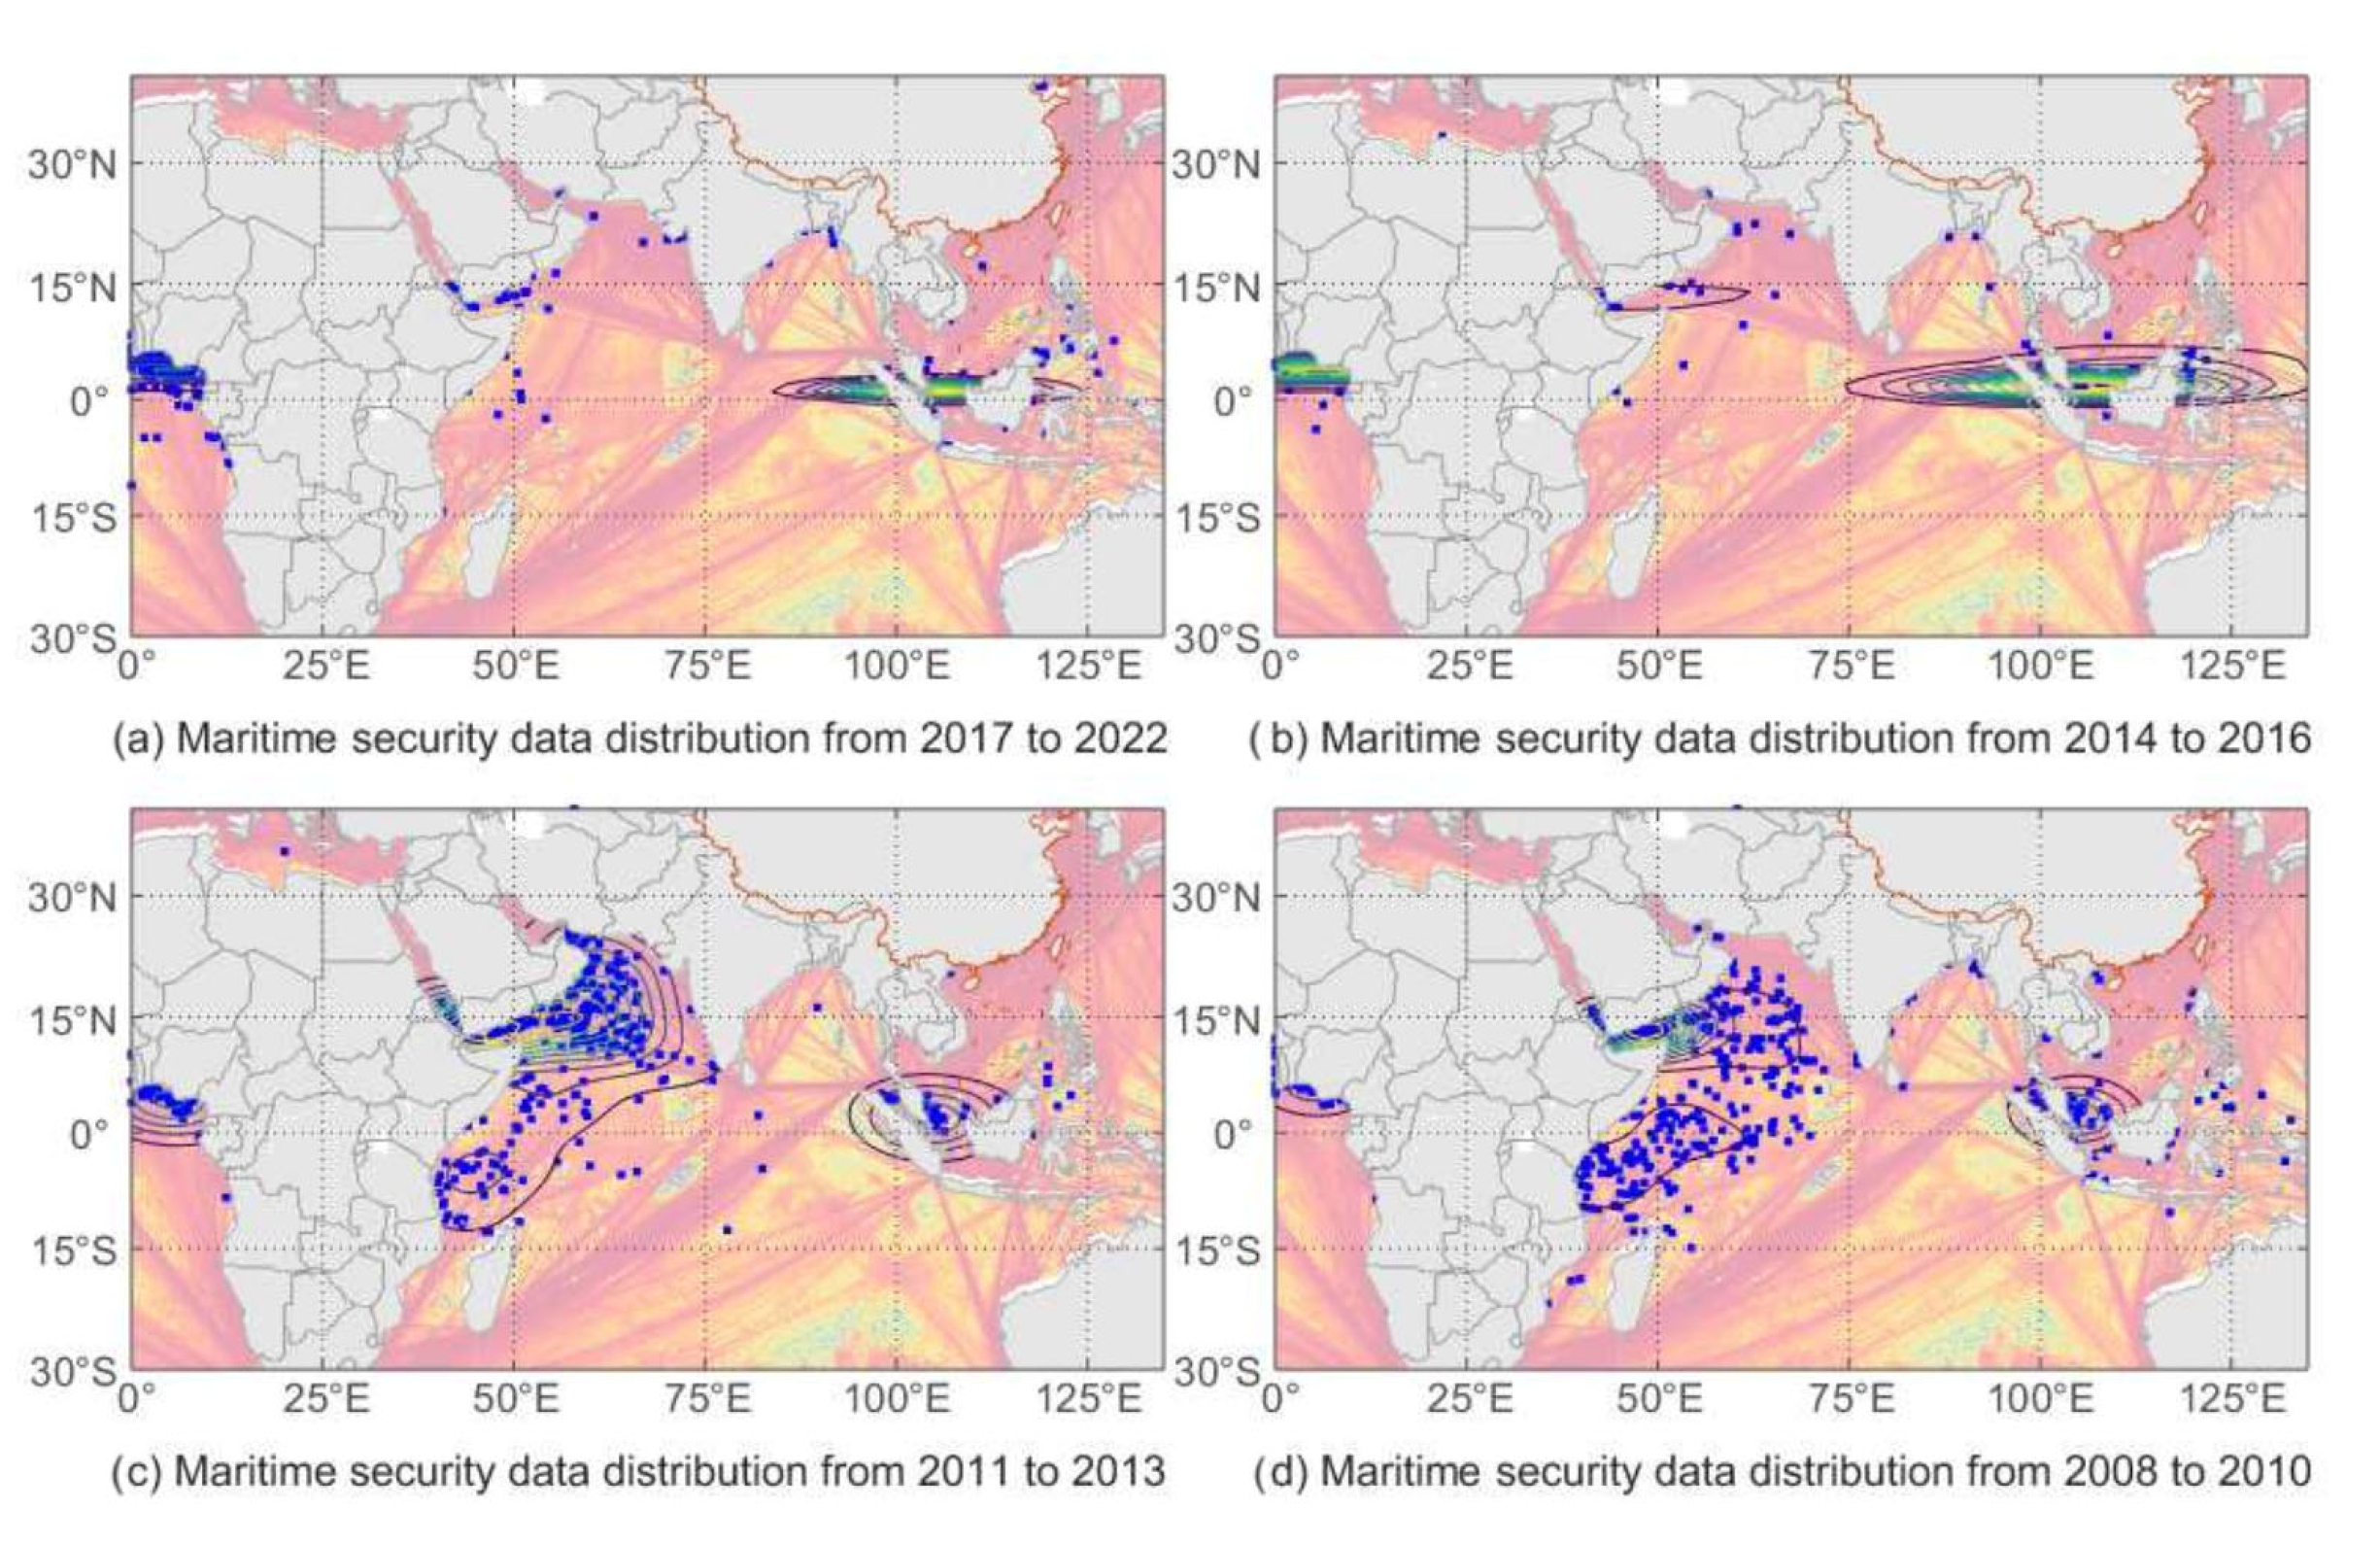
5.3. Space-Time Characteristics of Pirate Attacks along the MSR

Moreover, the presence of naval and coastal guard personnel has a tremendous impact on deterring piracy. The analysis of data on piracy and armed robbery incidents from 2003 to 2023 provided by the IMO website illustrated the spatiotemporal characteristics of pirate attacks on MSR coastal ships, as shown in Figure 9.
Through analysis of event data, it could be found that from 2008 to 2013, piracy incidents in the Malacca Strait and the Gulf of Guinea began to gradually emerge in the public eye. Of the 2464 piracy incidents that occurred globally during this period, 1205 incidents occurred in the waters of the Gulf of Aden–Arabian Sea, accounting for 48.89% of the global total. The notorious Somali pirates also originated from this area, and much of the reason for their existence can be attributed to the economic situation and political chaos of the surrounding countries [34]. Due to the severe global impact of Somali pirate incidents, the United Nations called on countries to send naval escorts. Starting in 2014, piracy incidents in the Gulf of Aden–Arabian Sea began gradually decreasing each year, with no piracy incidents occurring from January to June 2015. Thus, the presence of pirate groups in the Gulf of Aden–Arabian Sea, represented by Somali pirates, has rapidly declined under the joint global crackdown. However, the Malacca Strait, as a vital maritime transportation route, has a large wealth gap among its people and a certain pirate culture and tradition due to historical reasons [39]. It became a high-risk area for piracy incidents from 2014 to 2016 and quickly gained widespread global attention. However, due to its complex geographical location, it is difficult to combat piracy and, thus, there were still piracy incidents in the region from 2017 to 2022. The Gulf of Guinea, due to political and economic problems and weak naval forces, has gradually become another high-risk area for piracy incidents in succession to the Malacca Strait region [40].
By incorporating a transition matrix, the changes in risk over time can be represented, allowing for risk assessment. Ship navigation is a dynamic process, and the factors contributing to the risk of pirate attacks are correlated within the changing time series. By using Bayesian inference, which combines subjective and objective data, the probability of target events occurring can be calculated through network inference. Therefore, in this study, a dynamic transition matrix and nodes in a Bayesian network evaluation model were utilized to obtain risk values at different time slices, enabling the assessment of process risk. The findings indicated that the risk of pirate attacks was relatively high in the Gulf of Guinea, the Gulf of Aden, and the Malacca Strait along the route from Lagos to Guangzhou Port. The lowest risk was in July, while the highest risk was observed in March. “Natural conditions” and “human-induced hazards” were the most influential factors contributing to high-risk pirate attacks.

6. Conclusions

This paper focused on researching the risk of pirate attacks along shipping routes and developed a process risk analysis model for pirate attacks based on DBN, which incorporates the standards of the three risk component categories. Thirty-one factors, including hazard, mitigation capacity, and vulnerability and exposure, among others, were considered to enhance the risk assessment system for pirate events, enabling the assessment of the process risk of a ship being attacked by pirates along the route. The results indicated the effectiveness of process risk analysis for pirate attacks based on dynamic Bayesian networks.
Based on the environmental characteristics, physical features of pirate incidents, and logical characteristics of pirate incidents on shipping routes, this article analyzed the process risk of a ship being attacked by pirates and identified the risk characteristics of pirate attacks in different spatial and temporal contexts. The results indicated that the overall average risk of a ship being attacked by pirates on the entire route was the lowest in July and highest in March. Among the entire route, the risk values in the waters of the Gulf of Guinea and the Malacca Strait were the highest, while the risk values in the waters of the Gulf of Aden–Arabian Sea were unstable, with the lowest risk in July and the highest risk in March, demonstrating an overall high risk. Furthermore, the study highlighted the significant impact of natural conditions, human-induced hazards, the situation of surrounding countries, and navy support on the risk of a ship being attacked by pirates.
The risk of a ship being attacked by pirates in a sea route represents a complex and multi-factorial system. Pirate attacks can have varying impacts, including economic, personnel, and environmental consequences. This study specifically focused on assessing pirate attack risks along the western route of the Silk Road, and as such, it may have limitations when evaluating risks in other scenarios. Additionally, during the construction of the model, certain environmental factors, such as wind speed and precipitation [41,42], were not thoroughly explored. Therefore, accurately identifying and fully exploring the environmental information, analyzing and controlling risks, and quantifying consequences scientifically are important areas for further study in this field.

Author Contributions

X.H., methodology, software, validation, formal analysis, investigation, resources, data curation, visualization, writing—original draft preparation, writing—review and editing; H.X., conceptualization, formal analysis, writing—review and editing, supervision, project administration; S.X., methodology, validation, formal analysis, investigation, resources; S.H., conceptualization, methodology, validation, formal analysis, visualization, supervision, writing—original draft, writing—review and editing, funding acquisition. All authors have read and agreed to the published version of the manuscript.

Funding

The project is supported by the National Natural Science Foundation of China (Grant No. 52272353). This work was also supported by funding from the National Key Research and Development Program of China (Grant No. 2021YFC2801005).

Institutional Review Board Statement

Not applicable.

Informed Consent Statement

Not applicable.

Data Availability Statement

Data sharing not applicable. No new data were created or analyzed in this study. Data sharing is not applicable to this article.

Acknowledgments

We thank all those who helped us in the writing review and editing of this paper.

Conflicts of Interest

The authors declare no conflict of interest.

References

  1. Jiang, M.; Lu, J. The analysis of maritime piracy occurred in Southeast Asia by using the Bayesian network. Transp. Res. Part E Logist. Transp. Rev. 2020, 139, 101965. [Google Scholar] [CrossRef]
  2. Jiang, M.Z.; Lu, J.; Yang, Z.L.; Li, J. Risk analysis of maritime accidents along the main route of the Maritime Silk Road: A Bayesian network approach. Marit. Policy Manag. 2020, 47, 815–832. [Google Scholar] [CrossRef]
  3. Yang, Y.; Liu, W. Resilience Analysis of Maritime Silk Road Shipping Network Structure under Disruption Simulation. J. Mar. Sci. Eng. 2022, 10, 617. [Google Scholar] [CrossRef]
  4. Pristrom, S.; Yang, Z.L.; Wang, J.; Yan, X.P. A novel flexible model for piracy and robbery assessment of merchant ship operations. Reliab. Eng. Syst. Saf. 2016, 155, 196–211. [Google Scholar] [CrossRef] [Green Version]
  5. Wang, M.; Gong, S. Functions and Risks of Ship Security Alarm Systems. China Ship Surv. 2003, 11, 84–86. [Google Scholar]
  6. Ling, Z. Implementation of Ship Security Assessment. Transp. Sci. Technol. 2006, 1, 96–98. [Google Scholar]
  7. Sevillano, J.C.; Rios Insua, D.; Rios, J. Adversarial Risk Analysis: The Somali Pirates Case. Decis. Anal. 2012, 9, 86–95. [Google Scholar] [CrossRef] [Green Version]
  8. Struwe, L.B. Private Security Companies (PSCs) as a Piracy Countermeasure. Stud. Confl. Terror. 2012, 35, 588–596. [Google Scholar] [CrossRef]
  9. Vanek, O.; Hrstka, O.; Pechoucek, M. Improving Group Transit Schemes to Minimize Negative Effects of Maritime Piracy. IEEE Trans. Intell. Transp. Syst. 2014, 15, 1101–1112. [Google Scholar] [CrossRef]
  10. Bouejla, A.; Chaze, X.; Guarnieri, F.; Napoli, A. A Bayesian network to manage risks of maritime piracy against offshore oil fields. Saf. Sci. 2014, 68, 222–230. [Google Scholar] [CrossRef] [Green Version]
  11. Lewis, J.S. Maritime piracy confrontations across the globe: Can crew action shape the outcomes? Mar. Policy 2016, 64, 116–122. [Google Scholar] [CrossRef]
  12. Jin, M.J.; Shi, W.M.; Lin, K.C.; Li, K.X. Marine piracy prediction and prevention: Policy implications. Mar. Policy 2019, 108, 10. [Google Scholar] [CrossRef]
  13. Li, J.; Liu, Y.; Zhu, L. Risk Assessment of Pirate Hijacking Based on Bayesian Network. J. Saf. Environ. 2021, 21, 7. [Google Scholar]
  14. Wan, C.; Yan, X.; Zhang, D.; Qu, Z.; Yang, Z. An advanced fuzzy Bayesian-based FMEA approach for assessing maritime supply chain risks. Transp. Res. Part E Logist. Transp. Rev. 2019, 125, 222–240. [Google Scholar] [CrossRef]
  15. Kabir, S.; Papadopoulos, Y. Applications of Bayesian networks and Petri nets in safety, reliability, and risk assessments: A review. Saf. Sci. 2019, 115, 154–175. [Google Scholar] [CrossRef]
  16. Wang, L.; Yang, Z. Bayesian network modelling and analysis of accident severity in waterborne transportation: A case study in China. Reliab. Eng. Syst. Saf. 2018, 180, 277–289. [Google Scholar] [CrossRef]
  17. Deng, J.; Liu, S.; Xie, C.; Liu, K. Risk Coupling Characteristics of Maritime Accidents in Chinese Inland and Coastal Waters Based on N-K Model. J. Mar. Sci. Eng. 2022, 10, 4. [Google Scholar] [CrossRef]
  18. Hsu, W.-K.K.; Chen, J.-W.; Huynh, N.T.; Lin, Y.-Y. Risk Assessment of Navigation Safety for Ferries. J. Mar. Sci. Eng. 2022, 10, 700. [Google Scholar] [CrossRef]
  19. Bi, J.; Gao, M.; Zhang, W.; Zhang, X.; Bao, K.; Xin, Q. Research on Navigation Safety Evaluation of Coastal Waters Based on Dynamic Irregular Grid. J. Mar. Sci. Eng. 2022, 10, 733. [Google Scholar] [CrossRef]
  20. Li, Z.; Hu, S.; Gao, G.; Yao, C.; Fu, S.; Xi, Y. Decision-making on process risk of Arctic route for LNG carrier via dynamic Bayesian network modeling. J. Loss Prev. Process Ind. 2021, 71, 104473. [Google Scholar] [CrossRef]
  21. Li, Z.; Hu, S.; Zhu, X.; Gao, G.; Yao, C.; Han, B. Using DBN and evidence-based reasoning to develop a risk performance model to interfere ship navigation process safety in Arctic waters. Process Saf. Environ. Prot. 2022, 162, 357–372. [Google Scholar] [CrossRef]
  22. Guo, Y.L.; Jin, Y.X.; Hu, S.P.; Yang, Z.L.; Xi, Y.T.; Han, B. Risk evolution analysis of ship pilotage operation by an integrated model of FRAM and DBN. Reliab. Eng. Syst. Saf. 2023, 229, 18. [Google Scholar] [CrossRef]
  23. Yang, Y.B.; Liu, W.; Xu, X. Identifying Important Ports in Maritime Silk Road Shipping Network from Local and Global Perspective. Transp. Res. Record 2022, 2676, 798–810. [Google Scholar] [CrossRef]
  24. Zhu, Q. Research on the Application of Risk Management in Ship Security. J. Saf. Sci. Technol. 2012, 8, 5. [Google Scholar]
  25. Lu, X.; Xu, C.; Hou, B.; Du, L.; Li, L. Risk Assessment of subway tunnel Construction Based on Dynamic Bayesian network. Ocean Eng. 2022, 208, 12. [Google Scholar]
  26. Hu, S. Monte Carlo simulation of maritime traffic Systemic risk. J. Shanghai Marit. Univ. 2011, 32, 7–11. [Google Scholar]
  27. Zhou, X.; Cheng, L.; Li, M.C. Assessing and mapping maritime transportation risk based on spatial fuzzy multi-criteria decision making: A case study in the South China sea. Ocean. Eng. 2020, 208, 12. [Google Scholar] [CrossRef]
  28. Bruno, M.F.; Motta Zanin, G.; Barbanente, A.; Damiani, L. Understanding the Cognitive Components of Coastal Risk Assessment. J. Mar. Sci. Eng. 2021, 9, 780. [Google Scholar] [CrossRef]
  29. Bruno, M.F.; Saponieri, A.; Molfetta, M.G.; Damiani, L. The DPSIR Approach for Coastal Risk Assessment under Climate Change at Regional Scale: The Case of Apulian Coast (Italy). J. Mar. Sci. Eng. 2020, 8, 531. [Google Scholar] [CrossRef]
  30. Jiang, M.; Lu, J. Maritime accident risk estimation for sea lanes based on a dynamic Bayesian network. Marit. Policy Manag. 2020, 47, 649–664. [Google Scholar] [CrossRef]
  31. Dabrowski, J.J.; de Villiers, J.P. Maritime piracy situation modelling with dynamic Bayesian networks. Inf. Fusion 2015, 23, 116–130. [Google Scholar] [CrossRef] [Green Version]
  32. Ung, S.T. Navigation Risk estimation using a modified Bayesian Network modeling-a case study in Taiwan. Reliab. Eng. Syst. Saf. 2021, 213, 107777. [Google Scholar] [CrossRef]
  33. Shane, J.M.; Magnuson, S. Successful and Unsuccessful Pirate Attacks Worldwide: A Situational Analysis. Justice Q. 2014, 33, 682–707. [Google Scholar] [CrossRef]
  34. Coito, J.C. Pirates vs. Private Security: Commercial Shipping, the Montreux Document, and the Battle for the Gulf of Aden. Calif. Law Rev. 2013, 101, 173–226. [Google Scholar]
  35. Gong, X.X.; Lu, J. Strait/canal security assessment of the Maritime Silk Road. Int. J. Shipp. Transp. Logist. 2018, 10, 281–298. [Google Scholar] [CrossRef]
  36. Chen, C. Exploring how to do a good job in the maintenance and upkeep of ship machinery and equipment. Mod. Manuf. Technol. Equip. 2020, 4, 204–208. [Google Scholar] [CrossRef]
  37. Miao, Y.F.; Wang, L.; Zhang, G.A.; Su, Q.H.; Li, X.L. Weather threat assessment based on dynamic bayesian network. Appl. Ecol. Environ. Res. 2019, 17, 9391–9400. [Google Scholar] [CrossRef]
  38. Wang, Z.; Zhang, R.; Ge, S.; Ju, Y.; Cao, Z. Natural Environmental Risk Zoning of the Arctic Northeast Passage: Taking the Northern Sea Area of Russia as an Example. Ocean. Eng. 2017, 35, 61–70. [Google Scholar] [CrossRef]
  39. Rediker, M. Pirates, Privateers, and Rebel Raiders of the Carolina Coast (Book). J. South. Hist. 2002, 68, 152. [Google Scholar] [CrossRef]
  40. Onuoha, F. Piracy and Maritime Security in the Gulf of Guinea: Trends, Concerns, and Propositions. J. Middle East Afr. 2013, 4, 267–293. [Google Scholar] [CrossRef]
  41. Dzvonkovskaya, A.; Nikolic, D.; Orlic, V.; Peric, M.V.; Tosic, N. Remote Observation of a Small Meteotsunami in the Bight of Benin Using HF Radar Operating in Lower HF Band. IEEE Access. 2019, 7, 88601–88608. [Google Scholar] [CrossRef]
  42. Peel, M.C.; Finlayson, B.L.; McMahon, T.A. Updated world map of the Koppen-Geiger climate classification. Hydrol. Earth Syst. Sci. 2007, 11, 1633–1644. [Google Scholar] [CrossRef] [Green Version]
Figure 1. The route along the “21st-century” Maritime Silk Road.
Jmse 11 01430 g001
Figure 2. Diagram for assessing the risk of pirate attacks.
Jmse 11 01430 g002
Figure 3. Daily average wave data from March 1 to March 6 and 25 data collection points (Data Source: https://cds.climate.copernicus.eu/cdsapp#!/search?type=dataset. URL (accessed on 20 May 2023)).
Jmse 11 01430 g003
Figure 4. The security incidents distribution of different types of ships.
Jmse 11 01430 g004
Figure 5. Results of dynamic Bayesian model simulation. (a) Results of the dynamic Bayesian model. (b) Normalized risk values vs. pirate attack incidents chart.
Jmse 11 01430 g005
Figure 6. Process risk verification chart for pirate attacks.
Jmse 11 01430 g006
Figure 7. Sensitivity analysis chart.
Jmse 11 01430 g007
Figure 8. Diagram of Pirate Attack Risk for March (a) and July (b).
Jmse 11 01430 g008
Figure 9. The security incidents distribution from 2008 to 2022.
Jmse 11 01430 g009
Table 1. Risk indicator system for piracy and armed robbery incidents.
Indicator NameExplanationsIndicator StateReferences
Level 1 indicatorHazardThe higher the system hazard, the greater the risk of pirate attacks.high; medium; low;[27]
Vulnerability and exposureThe higher the system vulnerability and exposure, the greater the risk of pirate attackshigh; medium; low;[12,27]
Mitigation capacityThe higher the level of mitigation capacity, the lower the risk of pirate attacksgood; medium; poor;[27]
Level 2 indicatorNatural conditionsUnder adverse natural conditions, the initiative of pirate attacks tends to decrease.favourable; normal; bad;[1,4,13,30,31]
Human-induced hazardsThe situation of local pirates affects the level of risk.high; medium; low;[12,30]
Ship conditionWhen a ship malfunctions, it is more likely to become a target of pirate attacks.good; moderate; poor;[2,32]
Ship’s own riskWhen the ship itself has sufficient attractiveness to pirates, the risk of being attacked by pirates increases compared to other ships.high; medium; low;[1,2,4,12,33]
The anti-piracy capability of the shipWhen a ship has strong anti-piracy capabilities, the risk of being attacked by pirates will be reduced.good; moderate; poor;[12,33]
Naval supportThis variable stands for the military response time (i.e., the time necessary to render assistance to the ship under threat).t15; t30; morethant30;[11,12,27,34]
Level 3 indicatorWaveWhen the waves are larger, they will restrict the operation of boats used by pirates. The risk of a ship being attacked by pirates will be significantly reduced at this time.normal; moderate; rough;[2,26,30,31,33]
VisibilityWhen the visibility is poor, ship lookouts may not detect pirate boats promptly, which makes it easier for pirates to approach and attack the ship.good; moderate; poor;[2,4,30]
Pirate CapabilityThe stronger the pirate’s capabilities, the greater the risk of being attacked and hijacked.Strong; General; weak;[12]
The situation of surrounding countriesGenerally speaking, in a turbulent zone, many criminal factors will breed, and the occurrence likelihood of attacks from pirates will also increase greatly. high; medium; low;[10,11,12,35]
Ship maintenance degreeShip maintenance is closely related to the safety and stability of vessels during their navigation on water. If effective management and maintenance are not carried out, it can lead to significant consequences. Therefore, ship maintenance is closely tied to the condition of the vessel. Once a vessel experiences malfunctions due to maintenance issues within pirate-infested areas, the risk of pirate attacks significantly increases compared to other vessels [36] good; moderate; poor;Experts
Ship AgeThe older the ship is, the more passive and risky it is when facing pirate attacks.less than 6; between 6 and 15; fifteen years and over;[2,32]
Ship TypePirates prefer to attack high-value ships because they can bring higher profits, such as bulk carriers, oil tankers, and so on.high; medium; low;[2,10,11,12,32]
FreeboardThe lower the freeboard is, the lower the safety is, and the easier it is for pirates to board the ship, which increases the risk.high; medium; low;[1,4,12]
SpeedThe probability of successful pirate attacks decreases significantly and the risk is lower when the ship can sail at a speed of 15 knots or higher.fifteen knots and over; less than fifteen; at anchor;[2,12,33]
Emergency managementThe higher the emergency management capability of a ship is, the better its ability to handle pirate attacks in an orderly manner. Sometimes, the timely summoning of the crew or sounding alarms can reduce the risk of pirate attacks.good; moderate; poor;Experts
Anti-piracy measuresThe timely implementation of anti-piracy measures, when a pirate attack occurs, plays a significant role in preventing pirate intrusion.good; moderate; poor;[1,4,33]
Armed securityWhen armed guards are present on board, pirates are more likely to abort their attacks, resulting in a lower risk of pirate attacks.armed; unarmed; noGuards;[8,11,33]
Level 4 indicatorNumber of piratesThe greater the number of individuals involved in a pirate attack, the higher the risk posed to the targeted ship.less than 5; between 5 and 10; 10 persons and over;[10,12,33]
Pirates’ weaponsThe degree of advancement of pirate weapons determines their capabilities. Generally, the more advanced the weapons, the stronger the pirate’s abilities, and the greater the threat to ships.guns and rocket-propelled grenades; knives; other;[10,12,33]
Annual average times of pirate attacks in surrounding areasThe annual average times of pirate attacks in the surrounding area reflects the degree of piracy prevalence. The more frequent pirate attacks, the higher the risk of pirate attacks.less than 5; between 5 and 30; 30 times and over;[30,35]
Political situation in neighboring countriesIn politically unstable countries, law enforcement may have loopholes, leading to an increase in criminal activities, which may increase the probability of pirate incidents to some extent.extremely unstable; unstable; stable;[10,11,12,30,35]
Economic situation of surrounding countriesCoastal countries are prone to developing forms of robbery similar to piracy in economically underdeveloped situations.GDP less than 2500; GDP between 2500 and 6000; GDP 6000 and over;[10,11,12,35]
Anti-piracy drillRegularly organizing anti-piracy exercises for the crew can enhance their ability to respond to pirate incidents, thereby enabling them to promptly take effective measures to resist piracy.good; moderate; poor;[12,33]
Crew’s awareness of anti-piracyHaving a strong awareness of anti-piracy measures can effectively reduce the risk of pirate attacks.good; moderate; poor;Experts
Self-defense equipment and communication facilitiesShips generally equip themselves with certain self-defense devices such as water cannons, foam guns, alarm systems, etc., which can to some extent slow down or prevent pirate attacks and boarding.good; moderate; poor;[12,33]
Monitoring intensityFrequent observation can facilitate the early detection of potential pirate threats, enabling ships to take preemptive measures.frequent; moderate; infrequent;[11]
Disclaimer/Publisher’s Note: The statements, opinions and data contained in all publications are solely those of the individual author(s) and contributor(s) and not of MDPI and/or the editor(s). MDPI and/or the editor(s) disclaim responsibility for any injury to people or property resulting from any ideas, methods, instructions or products referred to in the content.

