Article

Model Experimental Study on a T-Foil Control Method with Anti-Vertical Motion Optimization of the Mono Hull

1
Ship and Maritime College, Guangdong Ocean University, Zhanjiang 524088, China
2
Liaoning Engineering Laboratory for Deep-Sea Floating Structures, School of Naval Architecture, Dalian University of Technology, Dalian 116024, China
3
Collaborative Innovation Center for Advanced Ship and Deep-Sea Exploration, Shanghai 200240, China
*
Author to whom correspondence should be addressed.
J. Mar. Sci. Eng. 2023, 11(8), 1551; https://doi.org/10.3390/jmse11081551
Submission received: 2 July 2023 / Revised: 25 July 2023 / Accepted: 25 July 2023 / Published: 4 August 2023
(This article belongs to the Special Issue Maritime Autonomous Surface Ships)

Abstract

:
T-foils with active control systems can adjust their attack angle according to the movement of the ship in real time, providing higher lift force and improving the seakeeping performance of a ship. The optimization of the control signal and that of the control method have an important influence on the effect of active T-foils. In this paper, the control method of the T-foil’s swinging angle is established and optimized on the basis of model testing in order to increase the effect of the T-foil. First, the governing equation is introduced by establishing the proportional relationship between the angular motion of the hull and the lift moment of the T-foil. On the basis of the model of the T-foil’s lift force, the governing equation of the T-foil’s swinging angle is deduced and simplified using the test results of the ship model with a passive T-foil and without a T-foil. Then, the active T-foil control system is established by comparing the effects of T-foils with different control signals. Finally, the efficacies of the passive and active T-foil are reported and discussed. It is found that the pitch angular velocity is a more appropriate signal than the pitch angle and pitch angular acceleration. T-foils with pitch angular velocity control can decrease the vertical motion response in the resonance region of a ship’s encounter frequency by more than about 20% compared to the case of the bare ship model, while also increasing the anti-bow acceleration effect by more than 15% compared to the case of passive control. The results obtained by model testing have a certain guiding significance for specific engineering practices.

1. Introduction

High-performance ships have excellent comprehensive performance and have gradually been accepted in terms of reliability, security, economy, etc. With the development of the world’s marine engineering and shipping market, the requirement for R&D is increasing, and this is developing actively in the ship market, which possesses great vitality. Since the 1990s, large-tonnage semi-planing ships have been widely used because they combine the advantage of large displacement, which characterizes conventional displacement-type ships, with the good rapidity of planing boats [1]. However, semi-planing ships are susceptible to waves when sailing at high speed, and the amplitude of the vertical motion is high, thus increasing the rate of seasickness. Furthermore, high-amplitude motion can easily cause slamming phenomena, and it generates a large slamming load [2]. This can easily cause fatigue damage, or even fracture, in the hull structure. Therefore, methods for reducing the motion amplitude of high-speed ships in waves represent extremely important work for improving motion performance.
Recent studies have shown that vertical motion can be reduced considerably by installing a T-foil on the bow when the ship is sailing at high speed (i.e., at a Froude number between 0.5 and 1) [3,4]. T-foils with vertical foils and horizontal foils can counteract the effect of wave disturbance force by applying a vertical force (moment) on the bow in the opposite direction to that of the ship’s motion [5], and then they can play a suppressing role in the ship’s motion. By introducing the automatic control program (PID control) into the T-foil system, the swing angle of the horizontal foil can be adjusted in real time with the movement of the ship. Compared to passive T-foils (i.e., without control), active T-foils can significantly increase the restoring force (moment) and improve the anti-vertical motion effect [6,7,8].
In PID control, the key issue is establishing the transfer function between force and motion. The longitudinal motion control is related to numerous parameters, such as heave displacement, pitch angle, vertical acceleration, hysteresis effect, heave velocity, etc. Therefore, the main problem for the motion control of semi-planing ships is finding the most important motion parameters among these motions.
Esteban et al. [9,10] used vertical acceleration (Worst Vertical Acceleration, WVA) and the rate of seasickness (Motion Sickness Incidence, MSI) at typical positions on the hull as optimization criteria, and they performed numerical simulations of the ship’s motion using MATLAB’s Simulink module to compare the effects of each control parameter. The simulation results showed that reasonable adjustment of each parameter in the PID control was able to effectively reduce the vertical acceleration by 26% and the rate of seasickness by 10% compared to the passive control.
Giron-Sierra [11,12,13] installed a T-foil and stern flaps on a high-speed ferry and conducted model tests in a towing basin. A multi-objective optimized PD control procedure was designed for the rate of seasickness, the cavitation phenomenon and mechanical efficiency. It was shown that the heave and pitch motions of the ship were important parameters for controlling the rotation of the T-foil, which was able to effectively limit the bow acceleration of the ship and improve the rate of seasickness.
Alavimehr et al. [14,15] proposed a nonlinear control method based on model tests in still water. The swing angles of the T-foil and the stern flaps were controlled using a single-signal control (pitch angular velocity or heave velocity). Model testing was conducted in regular waves to compare the anti-heave and pitch effects. The results showed that the nonlinear controlled T-foil had a better anti-vertical motion effect than the linear control. The effect of anti-heave motion is more obvious when using an active T-foil with heave velocity control. However, the effect of suppressing pitch and bow acceleration was not obvious. Accordingly, it is more suitable for reducing the pitch and bow acceleration response of the ship model by using the pitch angular velocity to control the swing angle. However, it is difficult to significantly reduce the heave, pitch, and bow acceleration of the ship at the same time using a single-signal control. The equation for controlling the swing angle should be further optimized.
Previous studies have mostly focused on different control strategies for active T-foils. However, no matter what control method is used (PID control, fuzzy control, etc.), there will be obvious different anti-vertical motion effects when using different motion control signals. Therefore, the determination of the main motion signal for the T-foil angle is extremely important, and it is also a key factor in optimizing the control method. However, there are a limited number of comparative studies on the control effect of different motion signals in the existing research, and these studies have mostly been based on numerical dynamic simulation, resulting in a lack of experimental research. Therefore, it is necessary to further optimize the control method of T-foils and optimize the master signal of T-foils through model testing.
In this paper, the experimental study of a model under high speed (Fr = 0.63) in a regular wave is carried out for a semi-planing deep-V mono-hull ship. The test principle is first introduced including control equation and motion signals for the T-foil’s active control. By measuring the motion of the bare ship model with the passive T-foil (the T-foil’s swing angle is 0°), the control equation of the T-foil is proposed, and the control parameters are integrated. Then, the model test was established, and three motion signals are used to control the lift force (moment) of the T-foil, respectively. Comparing the anti-vertical motion effect by the T-foil with different control signals, the control method of the T-foil was optimized. Finally, model tests were conducted based on the optimized control method to verify its anti-vertical motion effect.

2. Control Method

The swing angle of a horizontal foil is affected by factors such as sea state, real-time hull motion, profile size, etc. The design of an active control system of a T-foil can be simplified by modeling the uncertain problem and expressing it in a highly structured parametric form. For high-speed hull motion on waves, in particular, an active control system should have strong control timeliness and accuracy. This requires that the control method is not too complex, thus preventing delay in the swing angle control of the horizontal foil in practical applications and producing the desired anti-vertical motion effect on the longitudinal motion of the ship.

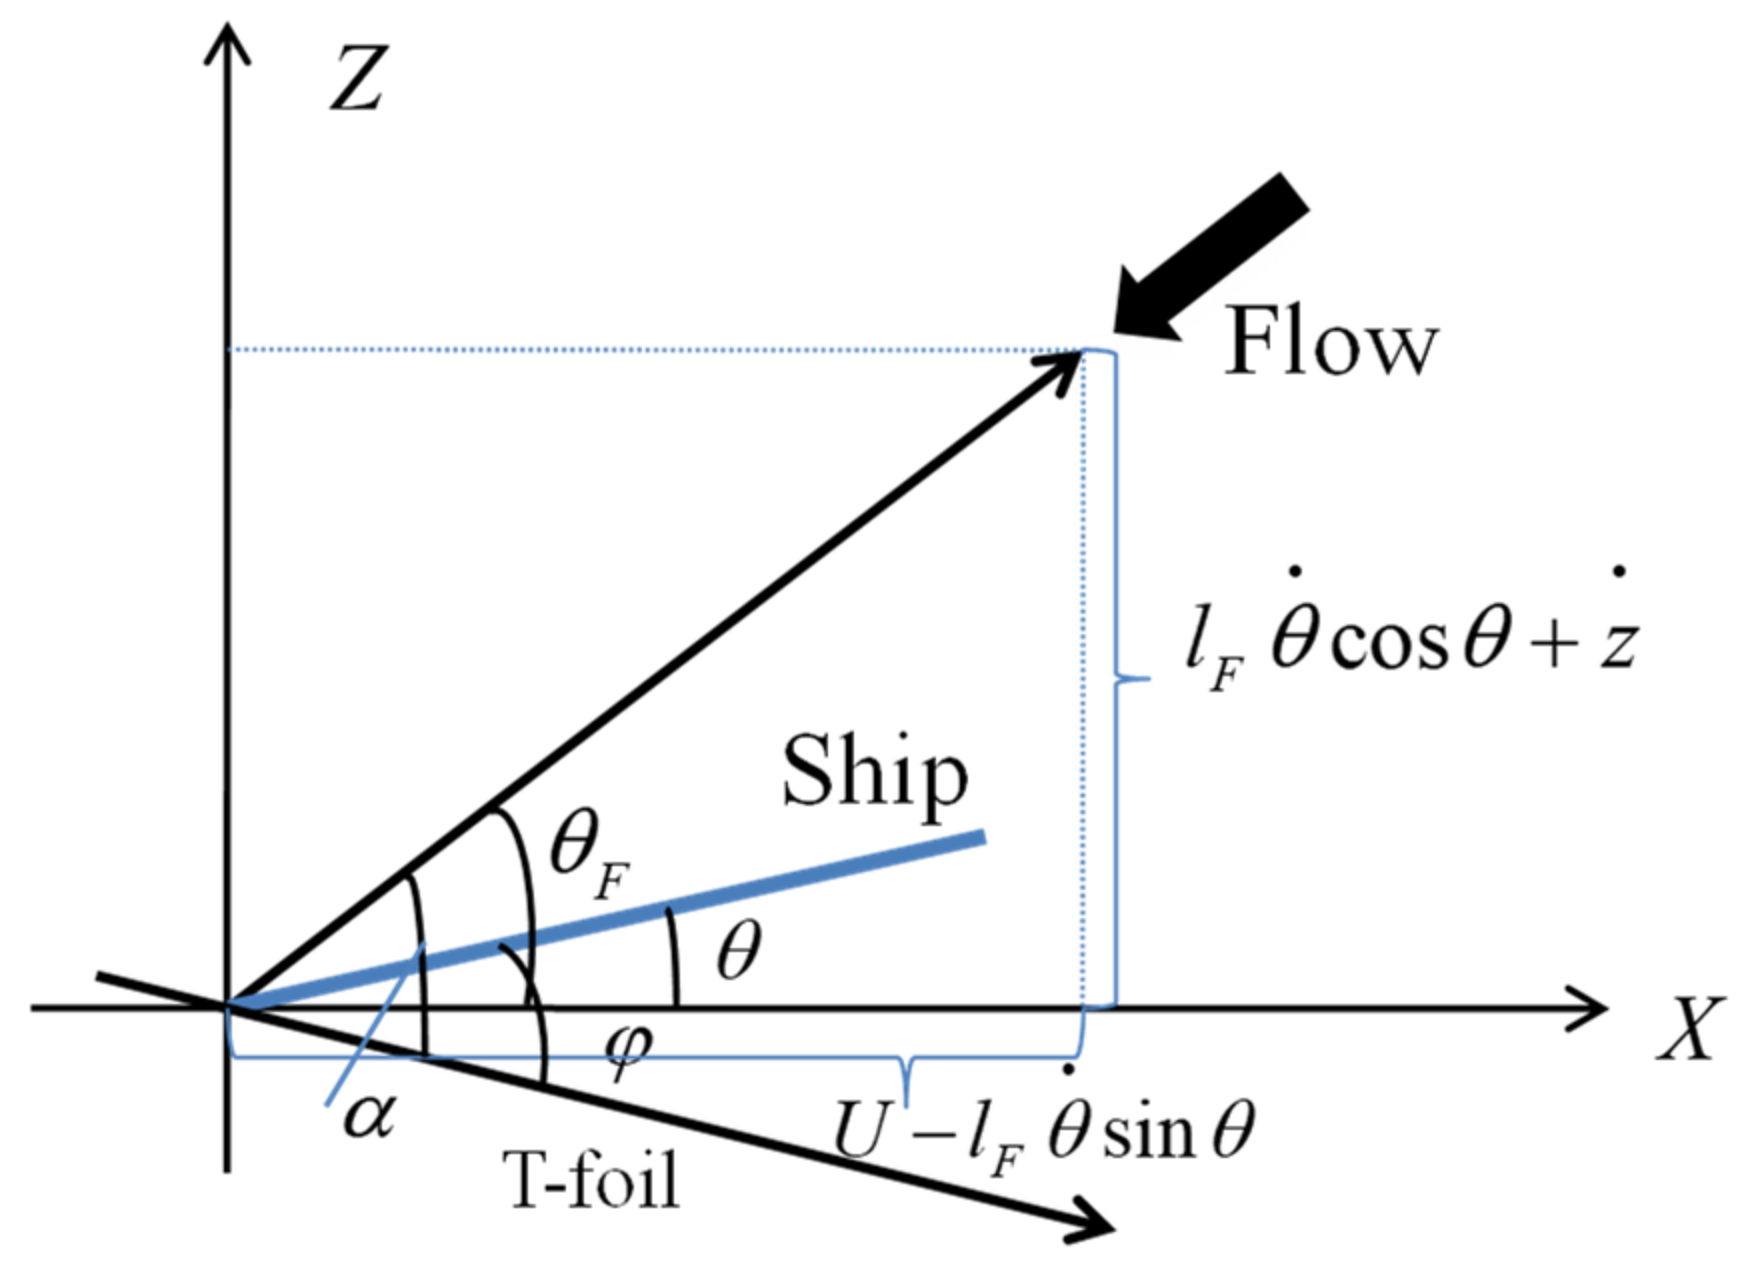
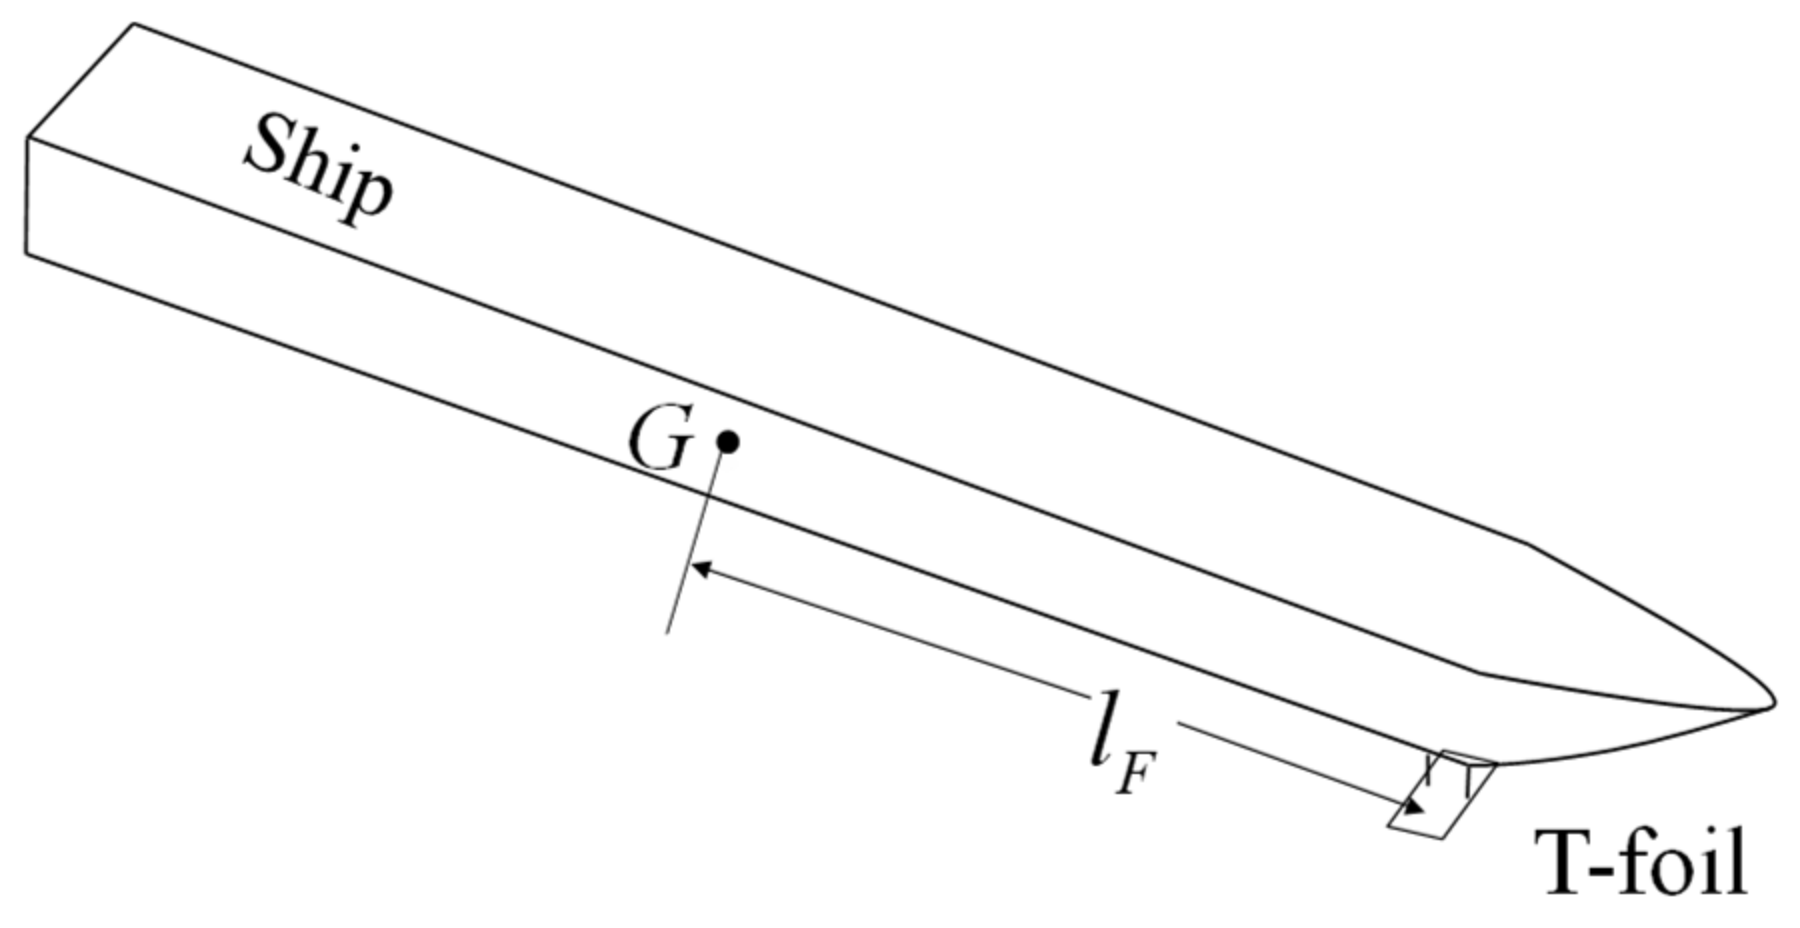
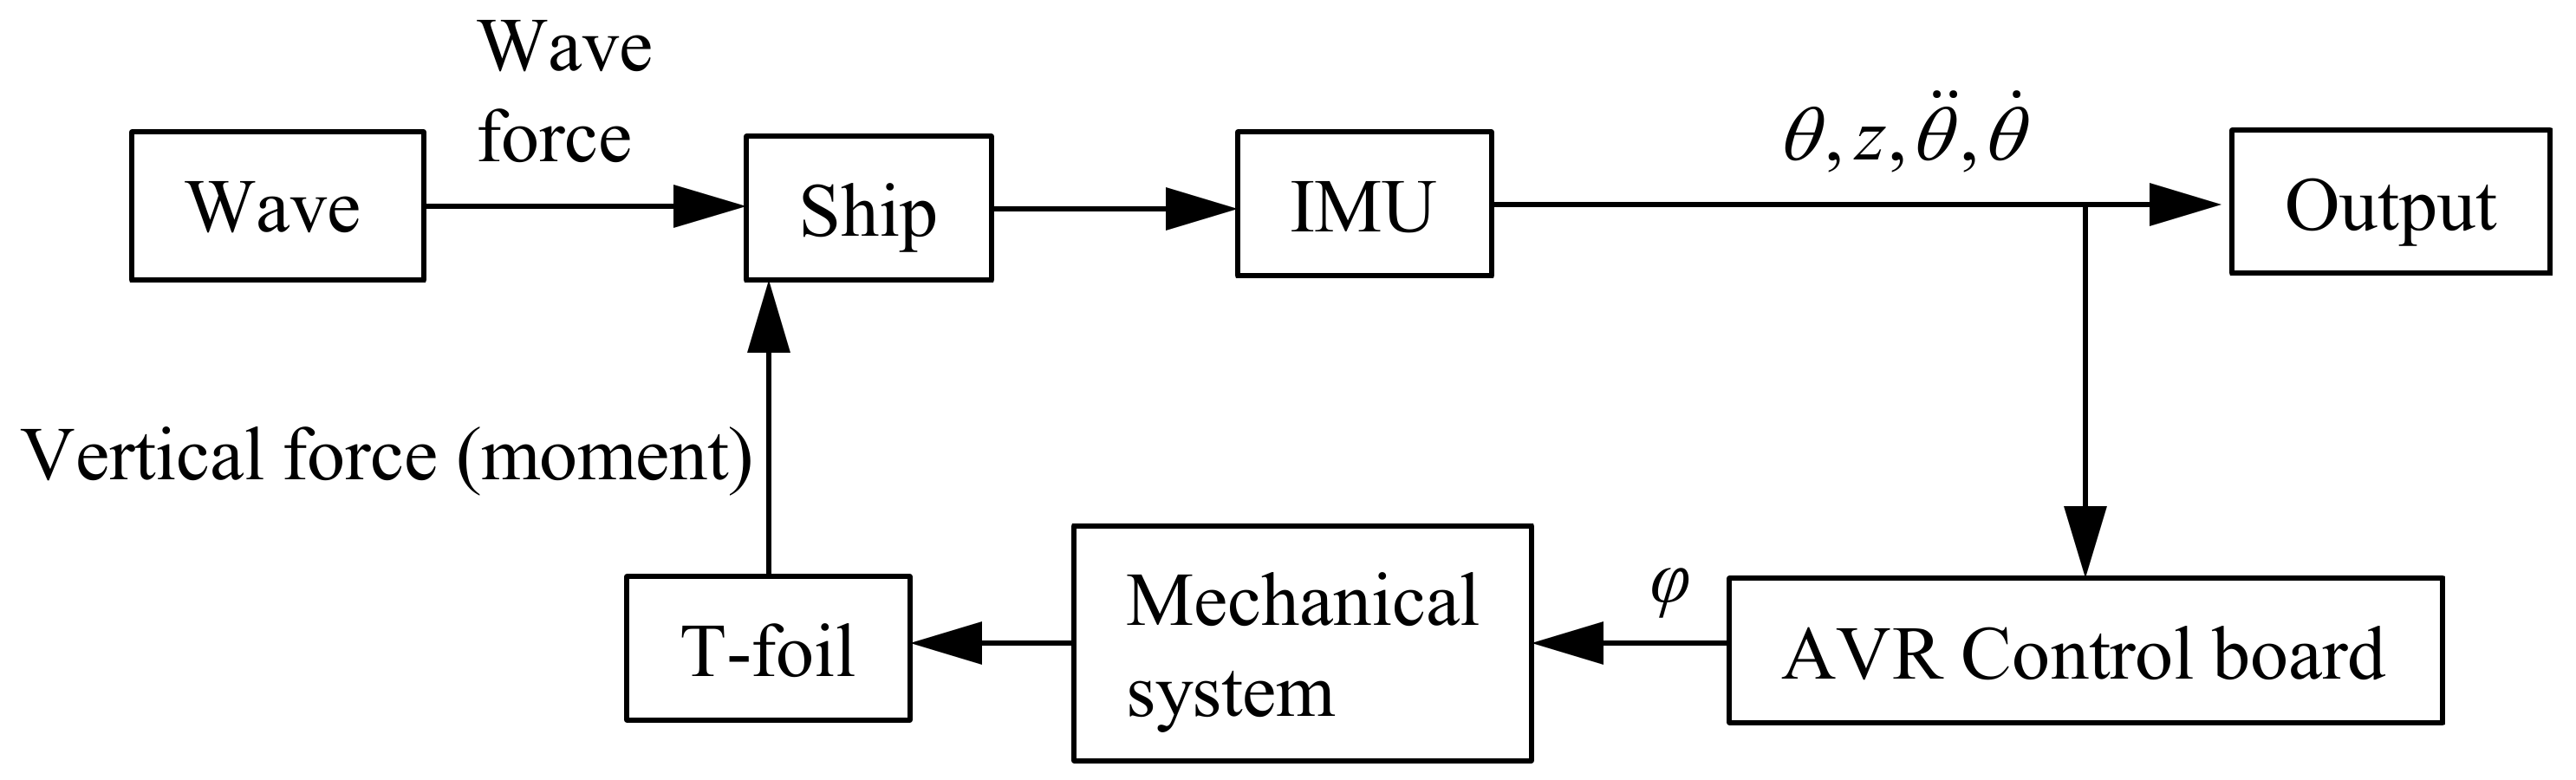
2.1. Mathematical Model of Active Control of T-Foil

The vertical motion of a ship is reduced by the lift force fT and lifting moment MT of a T-foil; the lift force (moment) can counteract the wave force (moment). The unsteady thin airfoil theory was applied to perform theoretical calculations for determining dynamic lift effects, especially in high-encounter frequencies because of the unsteady motion of hydrofoil [16]. Belibassakis et al. [17,18,19] established unsteady lifting models based on the integration of 2D sectional lift along a span to calculate the lift force of a hydrofoil. In this study, the T-foil’s deflection amplitude is limited (−10°–10°). The deviation of the lift force’s prediction between unsteady and quasi-static lift theories was acceptable in high Froude numbers and low wavelength [16]. The lift force and lifting moment are generally expressed as:
f T = 1 2 ρ U 2 A d C L d α α M T = 1 2 l F ρ U 2 A d C L d α α
where ρ represents the fluid density (kg/m3), A is the T-foil area (m2), and CL is the lift coefficient.
The attack angle of the T-foil α consists of the horizontal foil’s swing angle φ (i.e., the deflection angle of the T-foil’s horizontal foil with respect to the intermediate position), the pitch angle of the ship θ, and an additional angle θF formed by both the ship and vertical motions of the fluid particle in the flow field [20]. This is presented in Figure 1, and the attack angle α is expressed as:
α = φ θ + θ F
The additional angle θF is affected by the combined effect of the heave velocity z ˙ , the pitch angular velocity θ ˙ , the vertical velocity of the wave particle at the hydrofoil surface κ ˙ , and the ship’s speed U. θF is expressed as:
θ F = arctan l F θ ˙ cos θ z ˙ κ ˙ U l F θ ˙ sin θ
According to the micro-amplitude wave theory, the fluid particle motion is a simple harmonic motion, and its vertical velocity decreases exponentially with water depth. Great depth causes the vertical velocity κ ˙ of the fluid particle at the T-foil position to be extremely lower than the pitch angular velocity θ ˙ and the heave velocity z ˙ ; hence, the effect of κ ˙ can be neglected. Furthermore, the incident wave amplitude A0, which is significantly lower than the wavelength λ, causes the amplitude of the ship’s vertical motion on the wave to be low. Equation (3) can then be simplified as:
θ F l F θ ˙ z ˙ U
where lF is the distance from the installation position of the T-foil to the longitudinal position of the ship’s center of gravity (longitudinal center of gravity, LCG), as illustrated in Figure 2. Here, the lift force (fT) and lifting moment (MT) can be expressed as:
f T = 1 2 ρ U 2 A d C L d α ( φ θ + l F θ ˙ z ˙ U ) M T = 1 2 l F ρ U 2 A d C L d α ( φ θ + l F θ ˙ z ˙ U )

2.2. Lifting Moment Control Equation

The active T-foil control system can achieve anti-vertical motion by adjusting the attack angle in real time and then providing a greater reverse lift (moment) during significant ship motions. Following this analysis, the rotation of the T-foil is controlled in real time by the lifting moment control, i.e., the lifting moment MT generated by the T-foil is in the opposite direction of the hull motion [21] (including heave and pitch motions). This is expressed as:
M T = C 1 θ C 2 θ ˙ C 3 θ ¨ C 4 z 0 C 5 z ˙ C 6 z ¨
where C1, C2, C3, C4, C5, and C6 are the control parameters; these values represent the profile parameters of the T-foil, ship type, ship speed, and sea state; θ is the adjusted pitch angle θ, i.e., relating to the equilibrium position of the ship during motion; z0 is the adjusted heave displacement z, i.e., relating to the equilibrium position of the ship during motion.
According to previous studies, the anti-pitch and bow acceleration effects are more obvious while using the pitch angular velocity signal to control swing angle. T-foils controlled by the heave velocity signal only show a better anti-vertical motion effect on heave motion. Since bow acceleration greatly influences the extent of seasickness, this study uses the pitch motion control signal of the hull and ignores the heave motion effect on lifting moment MT, as expressed in Equation (6), which can now be reduced to:
M T = C 1 θ C 2 θ ˙ C 3 θ ¨
When the T-foil profile is selected and its attack angle α α 1 , α1 is the stall angle of the foil, 1 2 ρ U 2 A d C L d α is a constant at a certain speed set to KF. By coupling Equations (7) and (5), Equation (8) is obtained as:
φ = C 3 K F l F θ ¨ + ( 1 C 1 K F l F ) θ ( C 2 K F l F + l F U ) θ ˙ + 1 U z ˙ + C 1 K F l F θ 0
where θ0 is the stern inclination angle, which can be obtained experimentally or numerically with θ = θ θ 0 . The purpose of this method is to make the lifting moment of the T-foil M T and the angular motion of the hull (pitch angular velocity θ ˙ , pitch angle θ, or pitch angular acceleration θ ¨ ) go in opposite directions, reducing longitudinal motion amplitude by limiting angular motion.
If the pitch angle signal is separately used as control, the equation takes the pitch angle θ as the main control signal of the T-foil, and then the phase of the T-foil’s lifting moment MT differs from that of the pitch angle (θ) by π. Therefore, the T-foil generates a lifting moment in the opposite direction of pitch displacement and then limits the pitch motion of the hull, thereby affecting heave motion as well. The control parameter of this method is C2 = C3. Equation (8) can be simplified as follows:
φ = ( 1 C 1 K F l F ) θ l F U θ ˙ + 1 U z ˙ + C 1 K F l F θ 0
When the T-foil is fixed to the ship, the swing angle of its horizontal foil φ is composed of a pitch angle θ, pitch angular velocity θ ˙ , heave velocity z ˙ , speed U, and stern inclination angle θ 0 . The stern inclination angle does not change even with constant ship speed. When this method is used, the bow acceleration phase of the hull is about 1.06 π ahead of the pitch angle phase, and the lifting moment phase is close to that of the bow acceleration; this may have negative effects on bow acceleration.
Similarly, if the pitch angular velocity θ ˙ is the main control signal, the longitudinal motion of the ship is limited by reducing the pitch angular velocity of the hull. The control parameter of this method is C1 = C3 = 0, and Equation (8) can be simplified here as:
φ = θ ( C 2 K F l F + l F U ) θ ˙ + 1 U z ˙
If the pitch angular acceleration θ ¨ is the main control signal, the T-foil will generate a lifting moment against the hull’s angular acceleration. This control strategy then affects the longitudinal motion of the hull by suppressing pitch acceleration. The control parameter is C1 = C2 = 0, and Equation (8) can be simplified here as:
φ = C 3 K F l F θ ¨ + θ l F U θ ˙ + 1 U z ˙
From the phase perspective, the obvious phase differences between the hull motion parameters cause a negative feedback region to exist in each control method as mentioned above, thereby limiting the effect of the T-foil. Therefore, a comparative calculation of the T-foil effect is required to determine the most adequate control signal and control equation.

2.3. Control Equation Simplification

A method similar to the trial and error method is used to determine the adequate control parameters. First, the motion parameters of the ship model (including the time-record curves of heave and pitch motions) during passive T-foil control were obtained via numerical calculations. The parameters can help obtain the values of heave velocity z ˙ , pitch angular velocity θ ˙ , pitch angle θ, and pitch angular acceleration θ ¨ for each ship motion.
If a single motion signal is used to control the lifting moment of the T-foil (e.g., the pitch angular velocity θ ˙ ), C1 and C3 in Equation (8) will be taken as zero. φ1 and φ2 are the lower and upper limits of the swing angle of the T-foil’s horizontal foil, respectively; this is expressed as follows: φ φ 1 , φ 2 . Obviously, φ1 and φ2 are known quantities. The maximum values of the pitch angular velocity θ ˙ m a x , corresponding pitch angle θ 21 , and heave velocity z ˙ 21 can be obtained at any moment from a time-record curve of the model; then, the value of C2 can be determined:
C 21 = K F l F θ ˙ m a x ( θ 21 φ 2 + z ˙ 21 U ) l F U
where C21 is the preliminary value of C2, and the theoretical value of the pendulum angle, φ, can be obtained for any moment by substituting C21 into Equation (10). C21 is further adjusted to ensure φmax is as close as possible to but not more than φ2 throughout the motion, whereas φmin is close to but not less than φ1, and then C2 = C21. Subsequent calculations of the effect of the active T-foil show that C2 needs to be further adjusted according to real-time situations to ensure the full rotation of the T-foil within the maximum swing angle. Similarly, C1 and C3 can be determined when the lifting moment of the T-foil is controlled separately by the other two signals.

3. Test Design

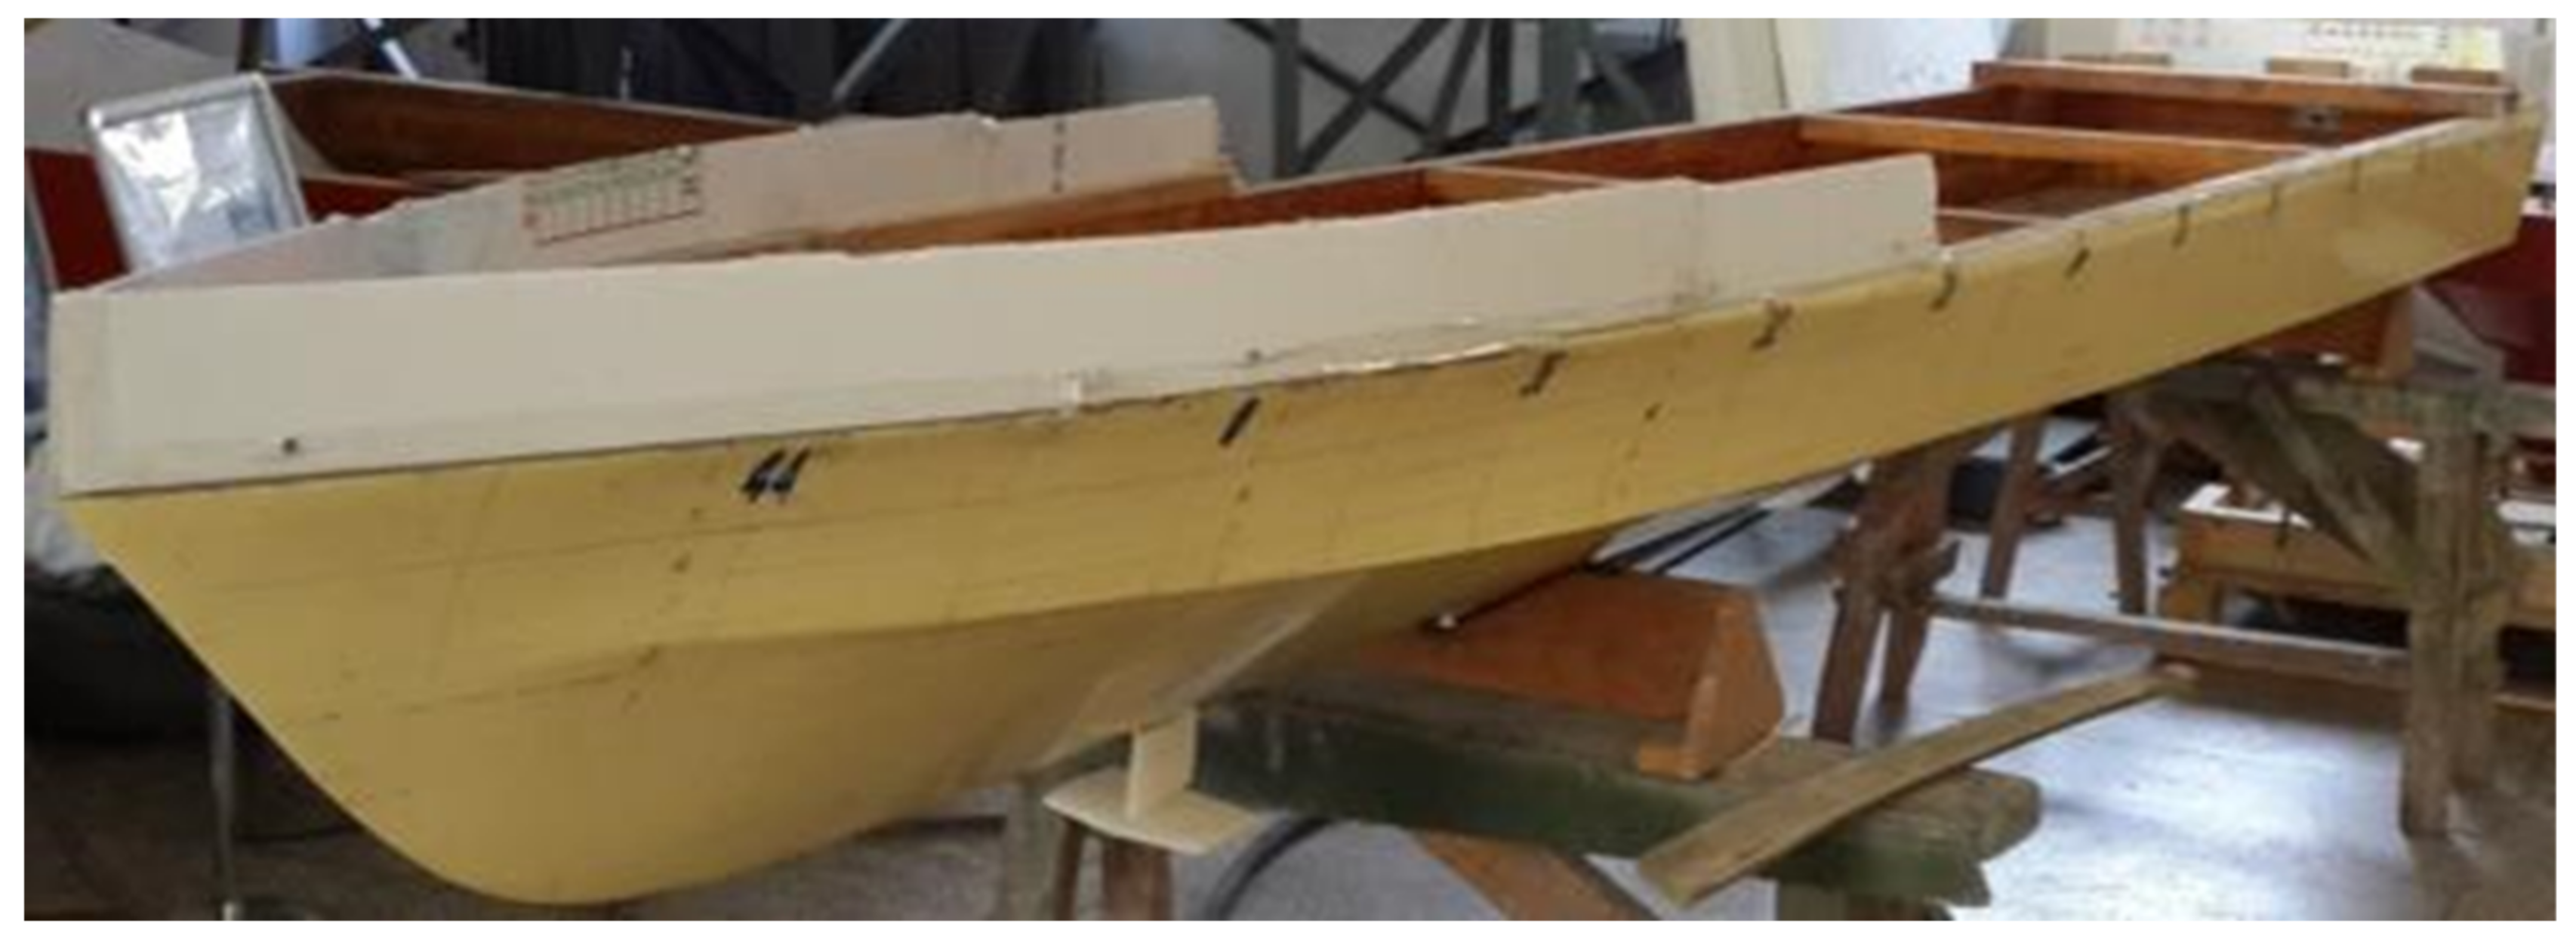
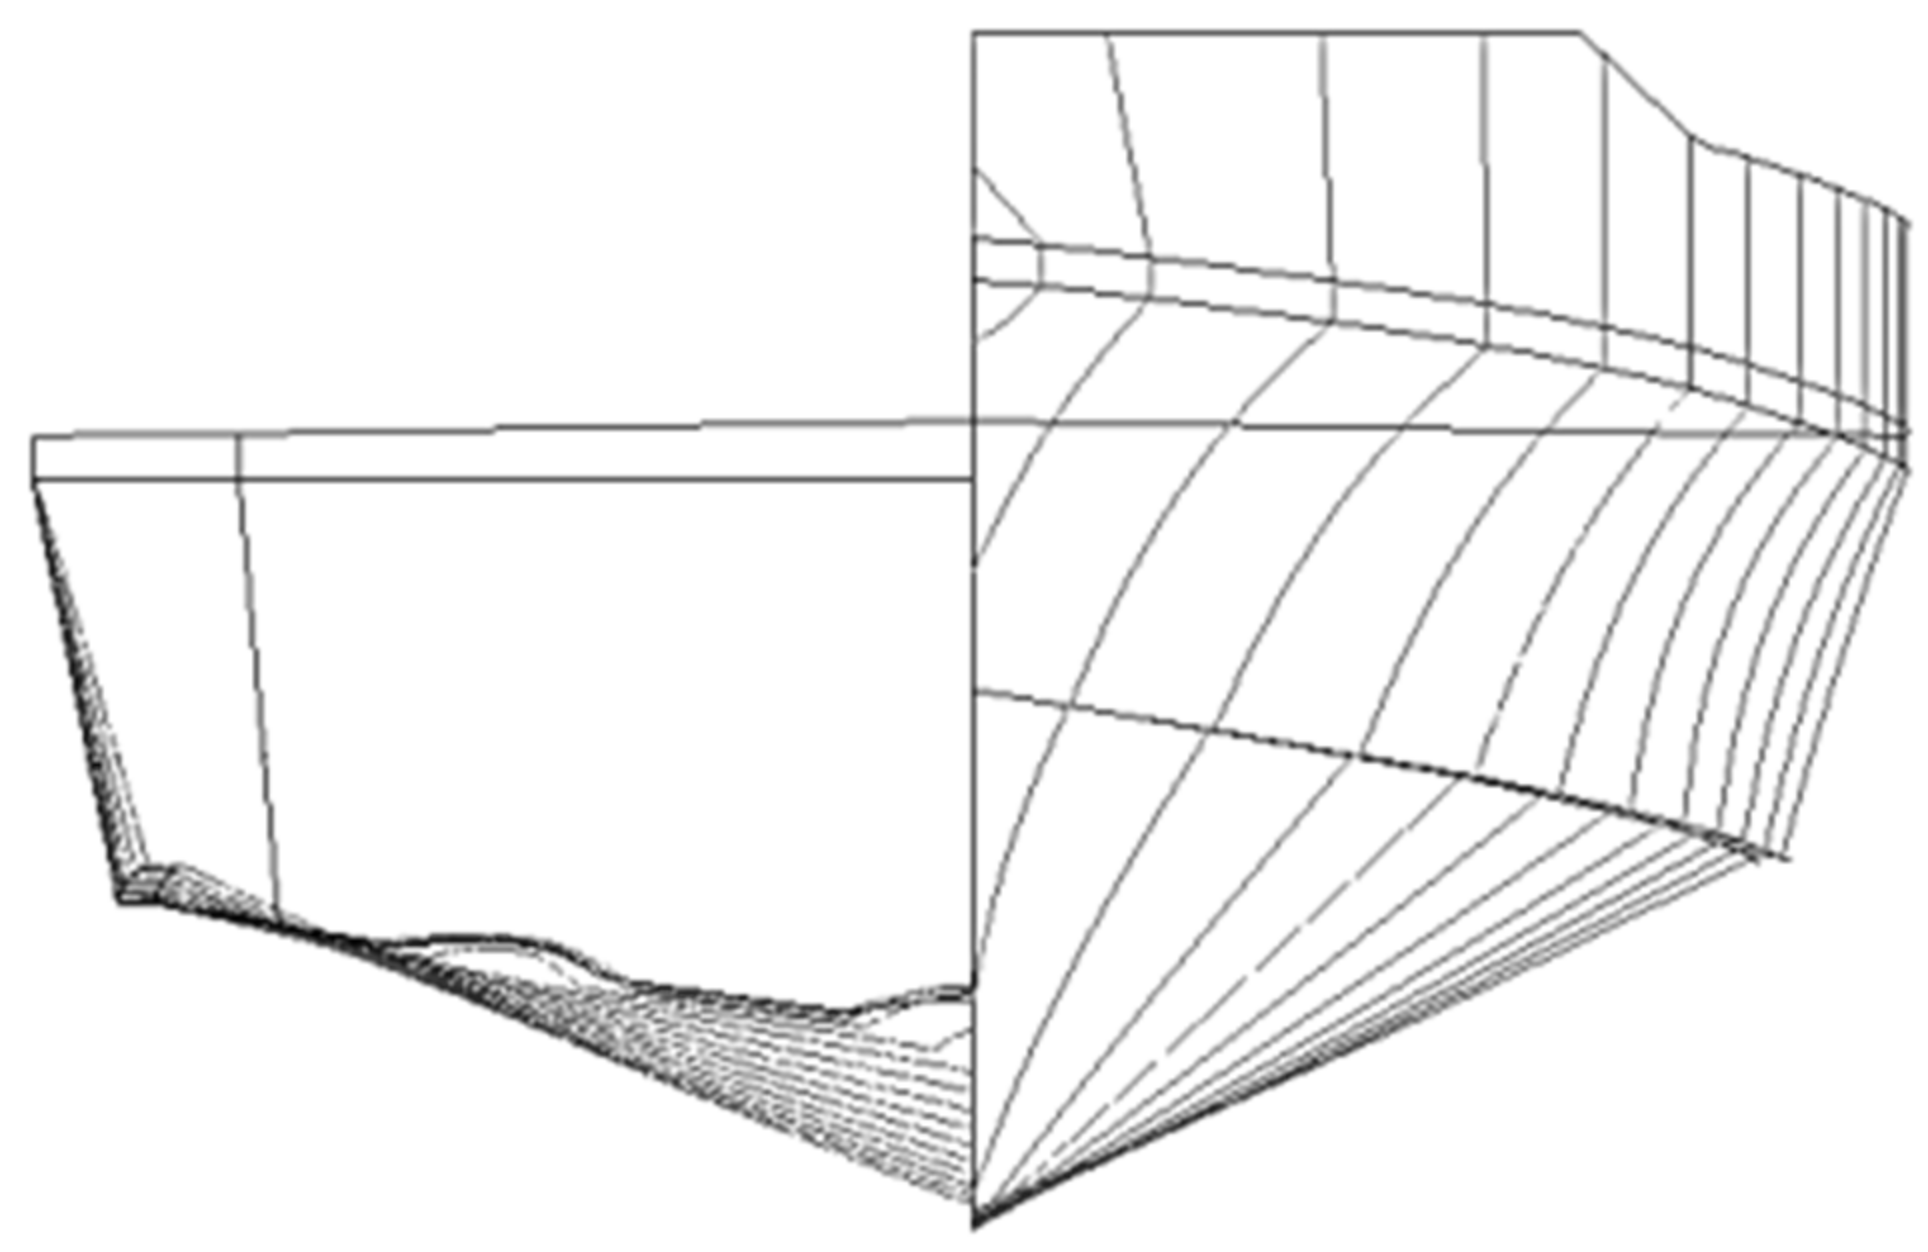
3.1. Experimental Model

The dimensions of the T-foil used in this study are presented in Table 1. The T-foil was installed at Station 16 of the hull, 0.76 m from the bowsprit, as shown in Figure 3. The horizontal and vertical foils are of NACA0012 profile, as shown in Figure 4, and they are connected by a rotating shaft. The shaft is 0.04 m away from the leading edge of the horizontal foil. In this test, the deflection range of the horizontal foil’s swing angle is from −10° to 10° ( φ [ 10 , 10 ] ); this is within the stall angle of this T-foil profile. Previous CFD calculations of the lift performance of this T-foil show that the lift coefficient is related to the attack angle as follows: d C L d α = 3.34   ( 1 / rad ) .
The monohull ship [22] used for the test is a deep-V type, as shown in Figure 5, designed by the Fluid Teaching and Research Department of the School of Ship Engineering, Dalian University of Technology, China. The ship model is made of wood; the scaling ratio is 1:12; the speed of the real ship is 26 kn; and its main dimensions are presented in Table 2. The hull-type line diagram is also shown in Figure 5.

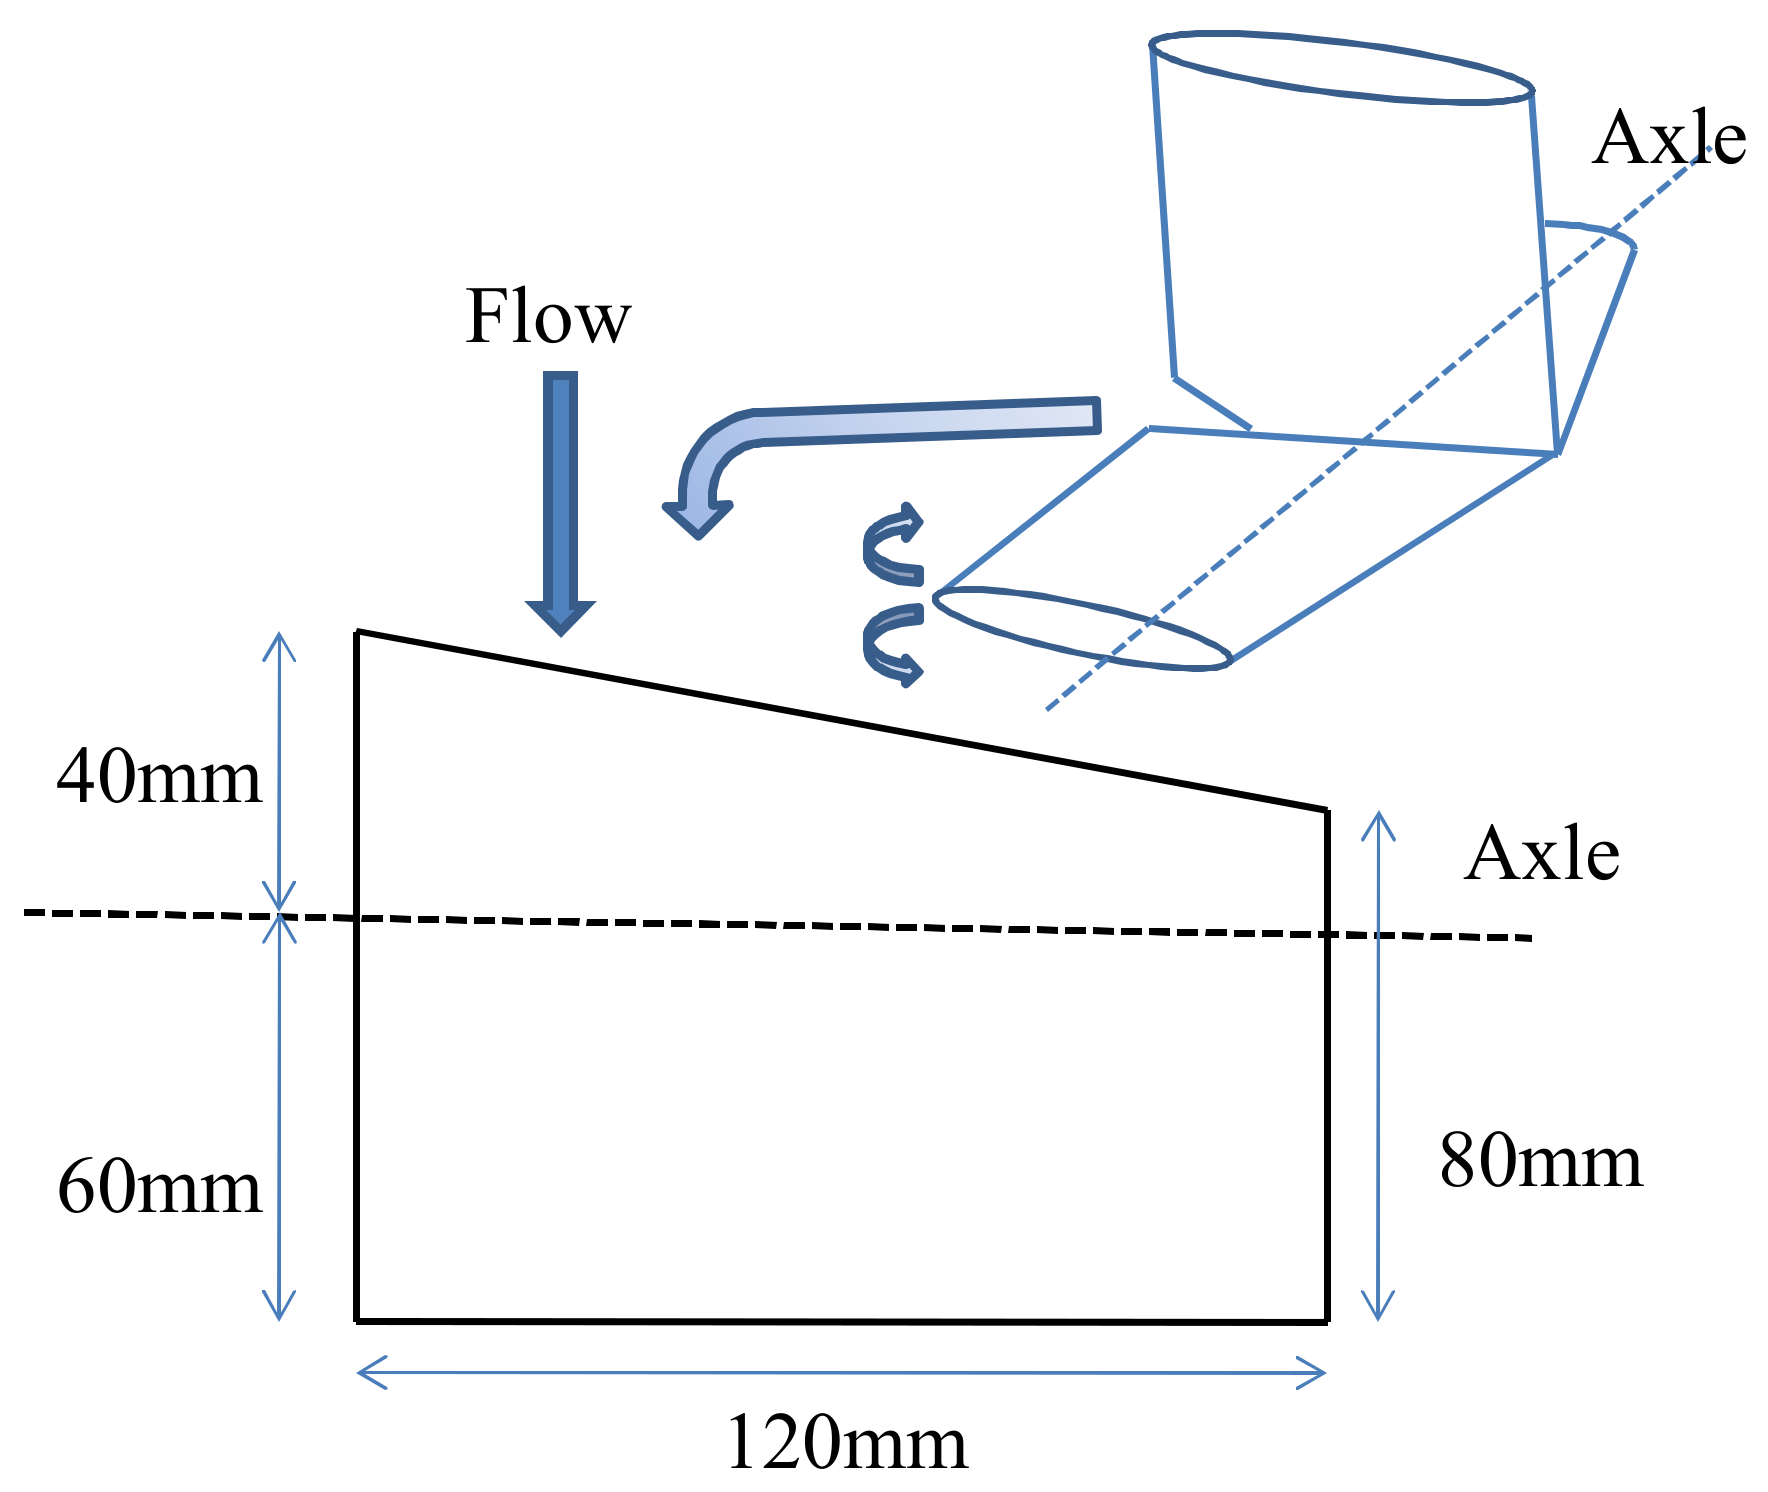
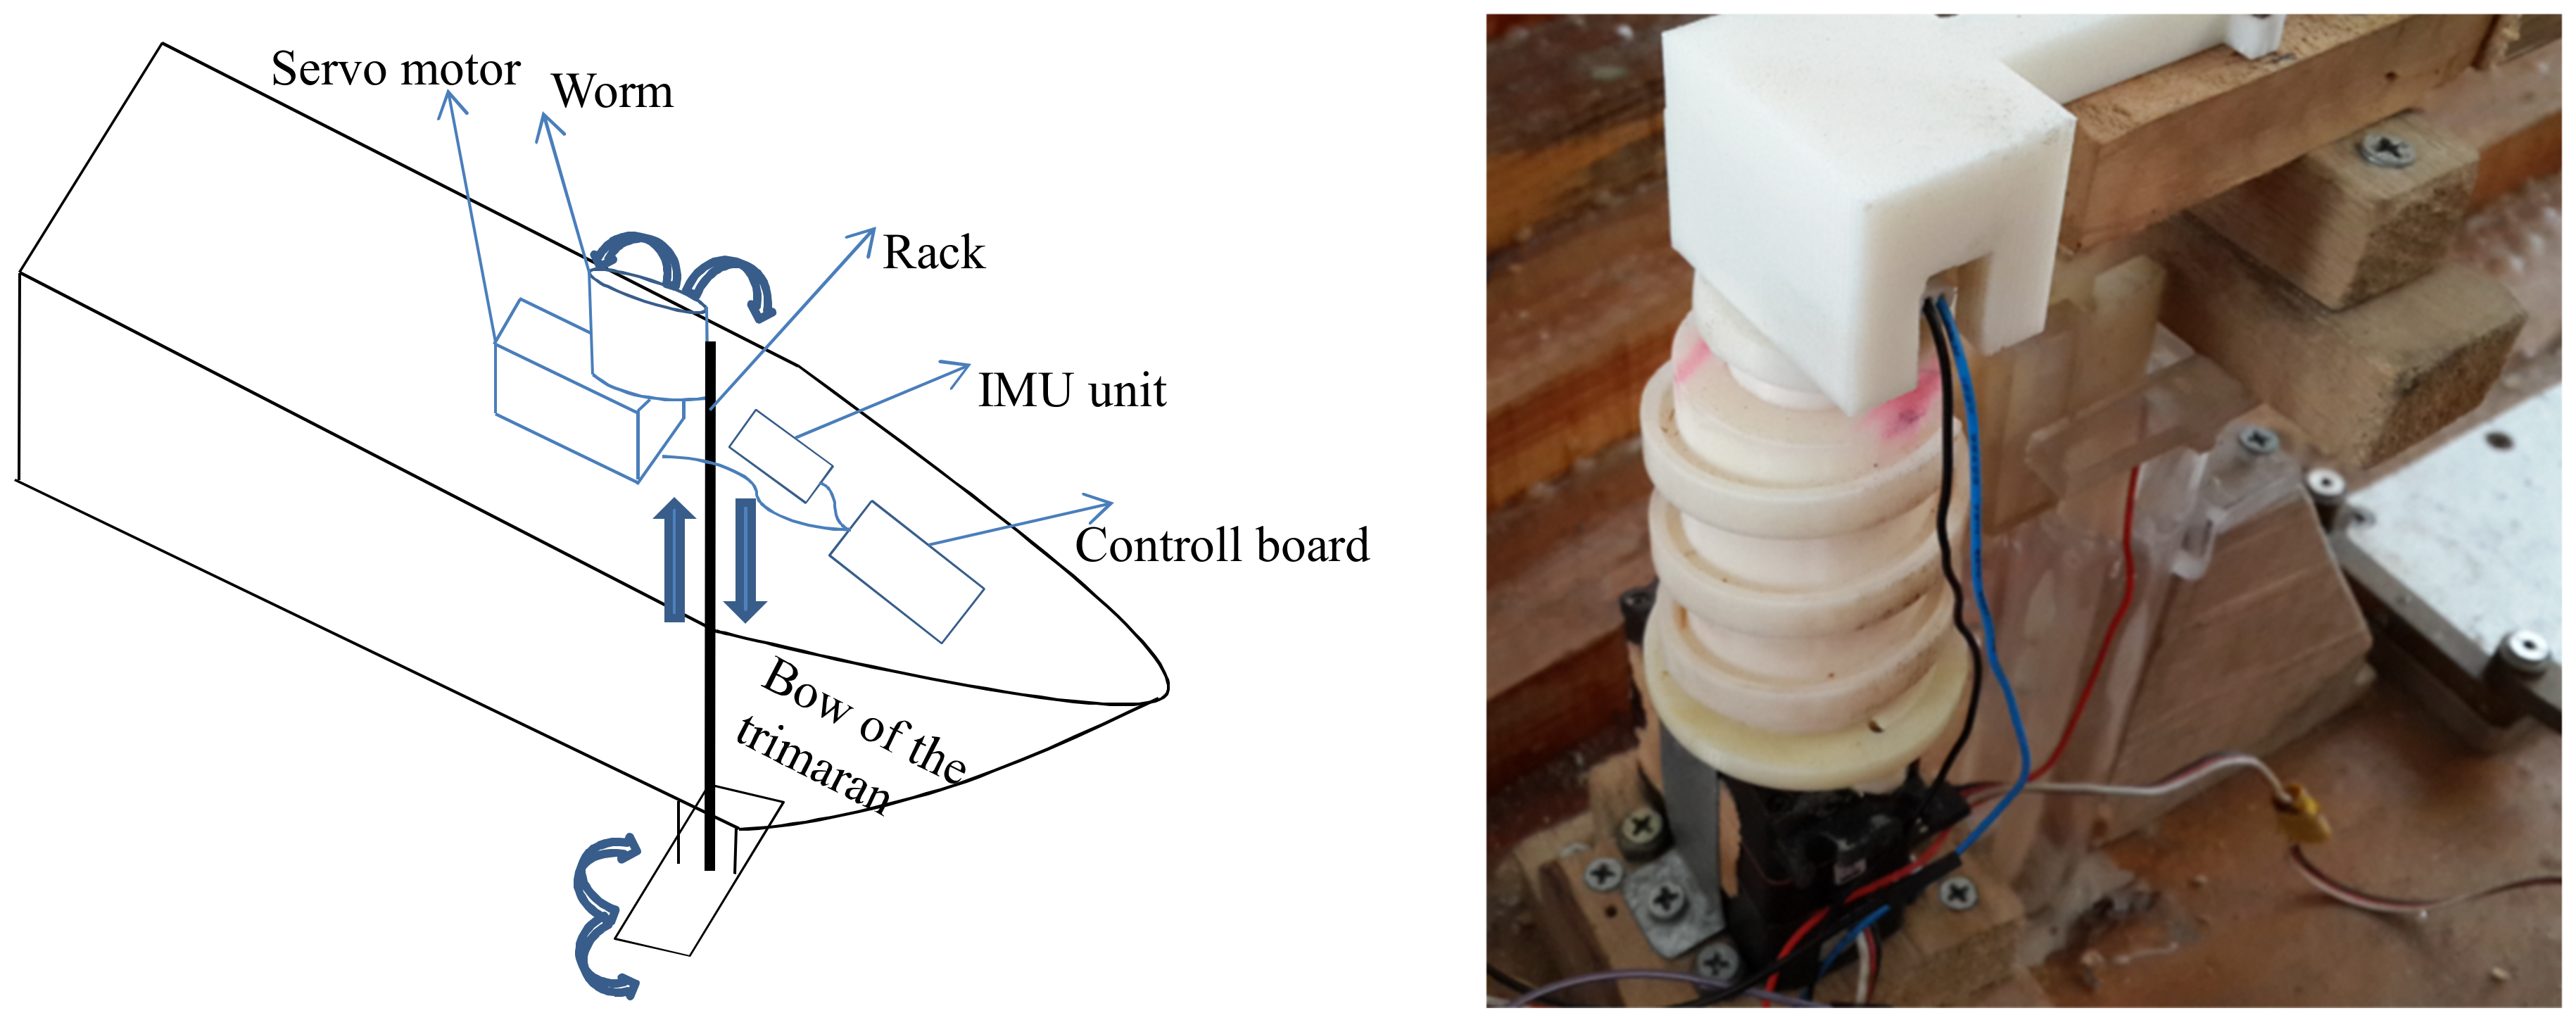
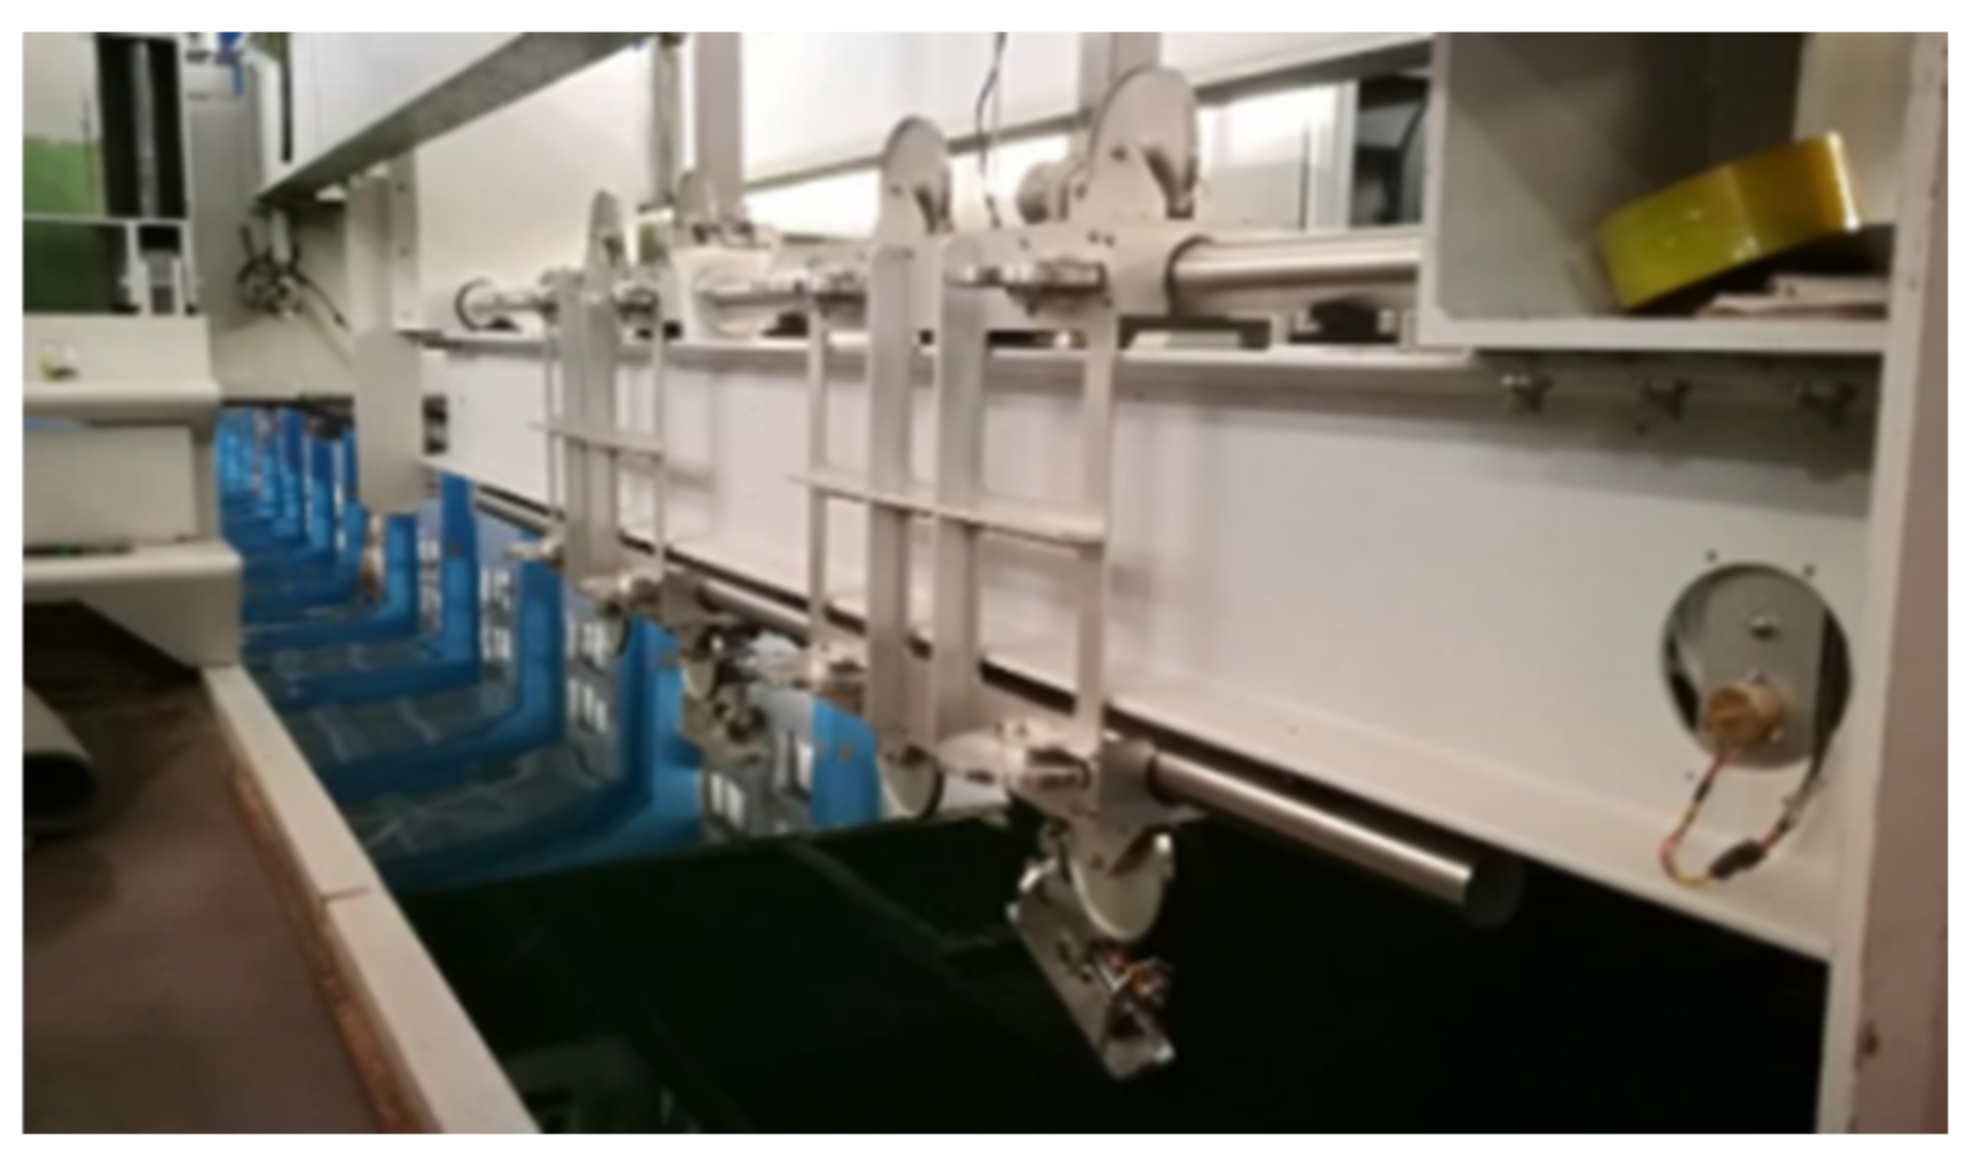
3.2. T-Foil Control System
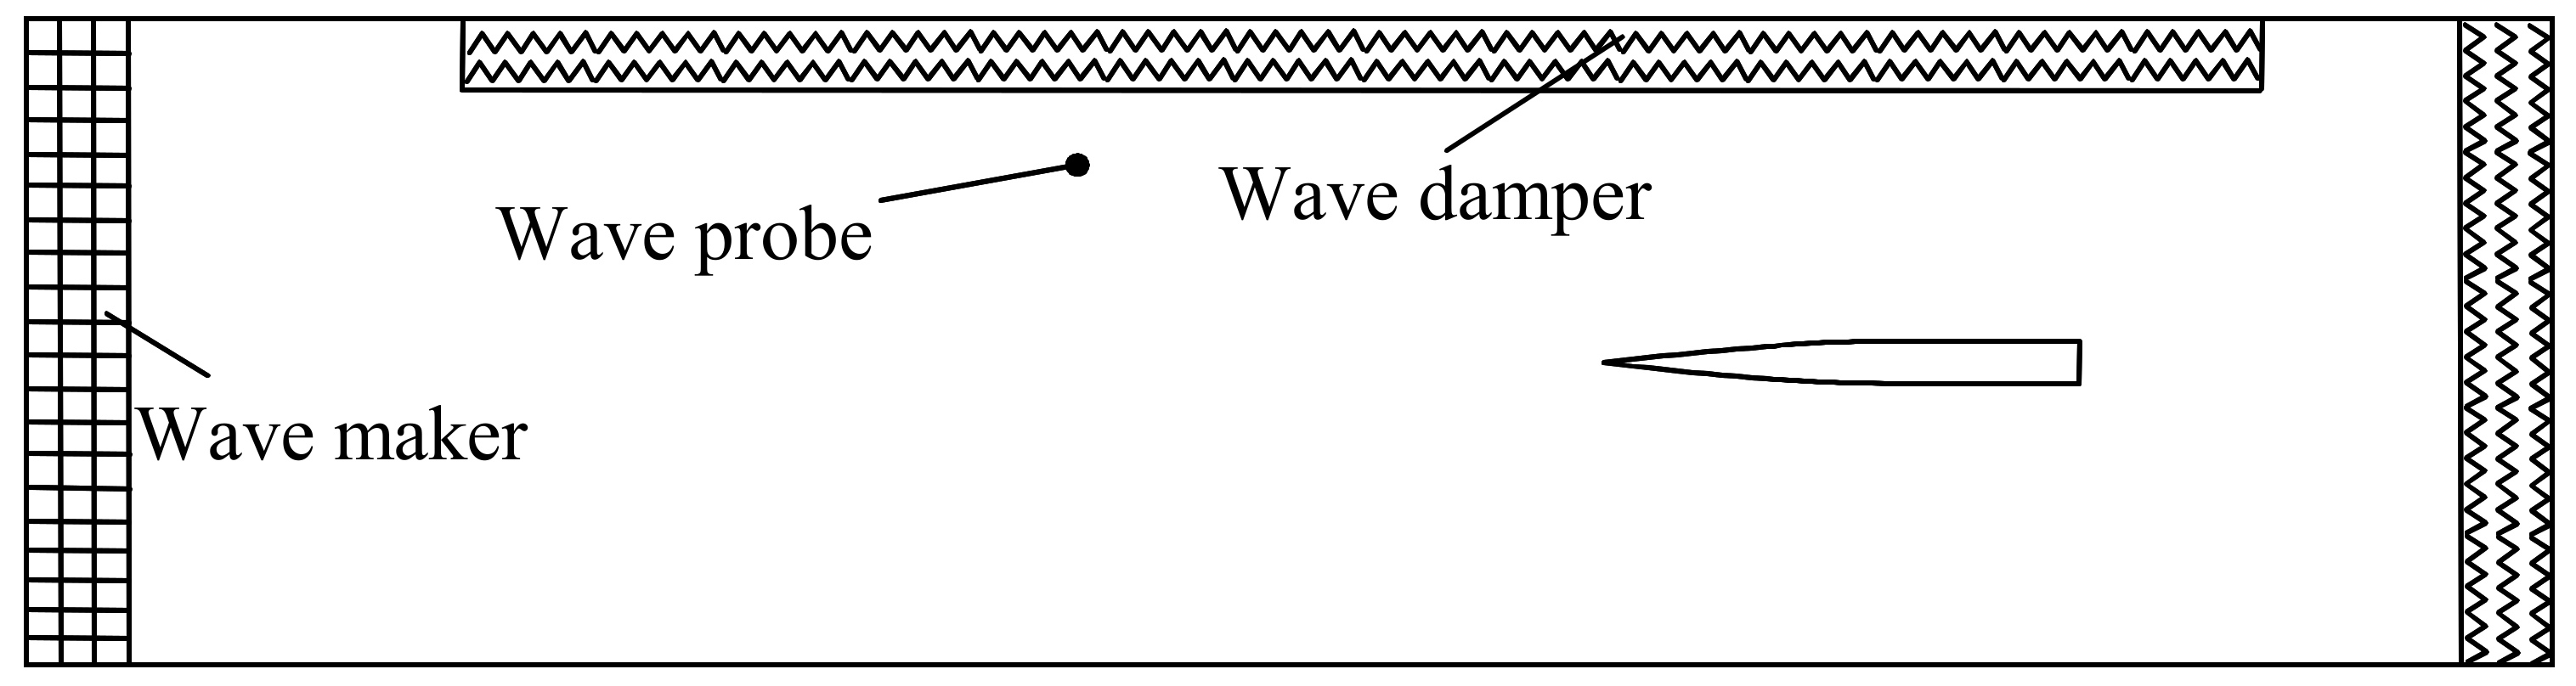
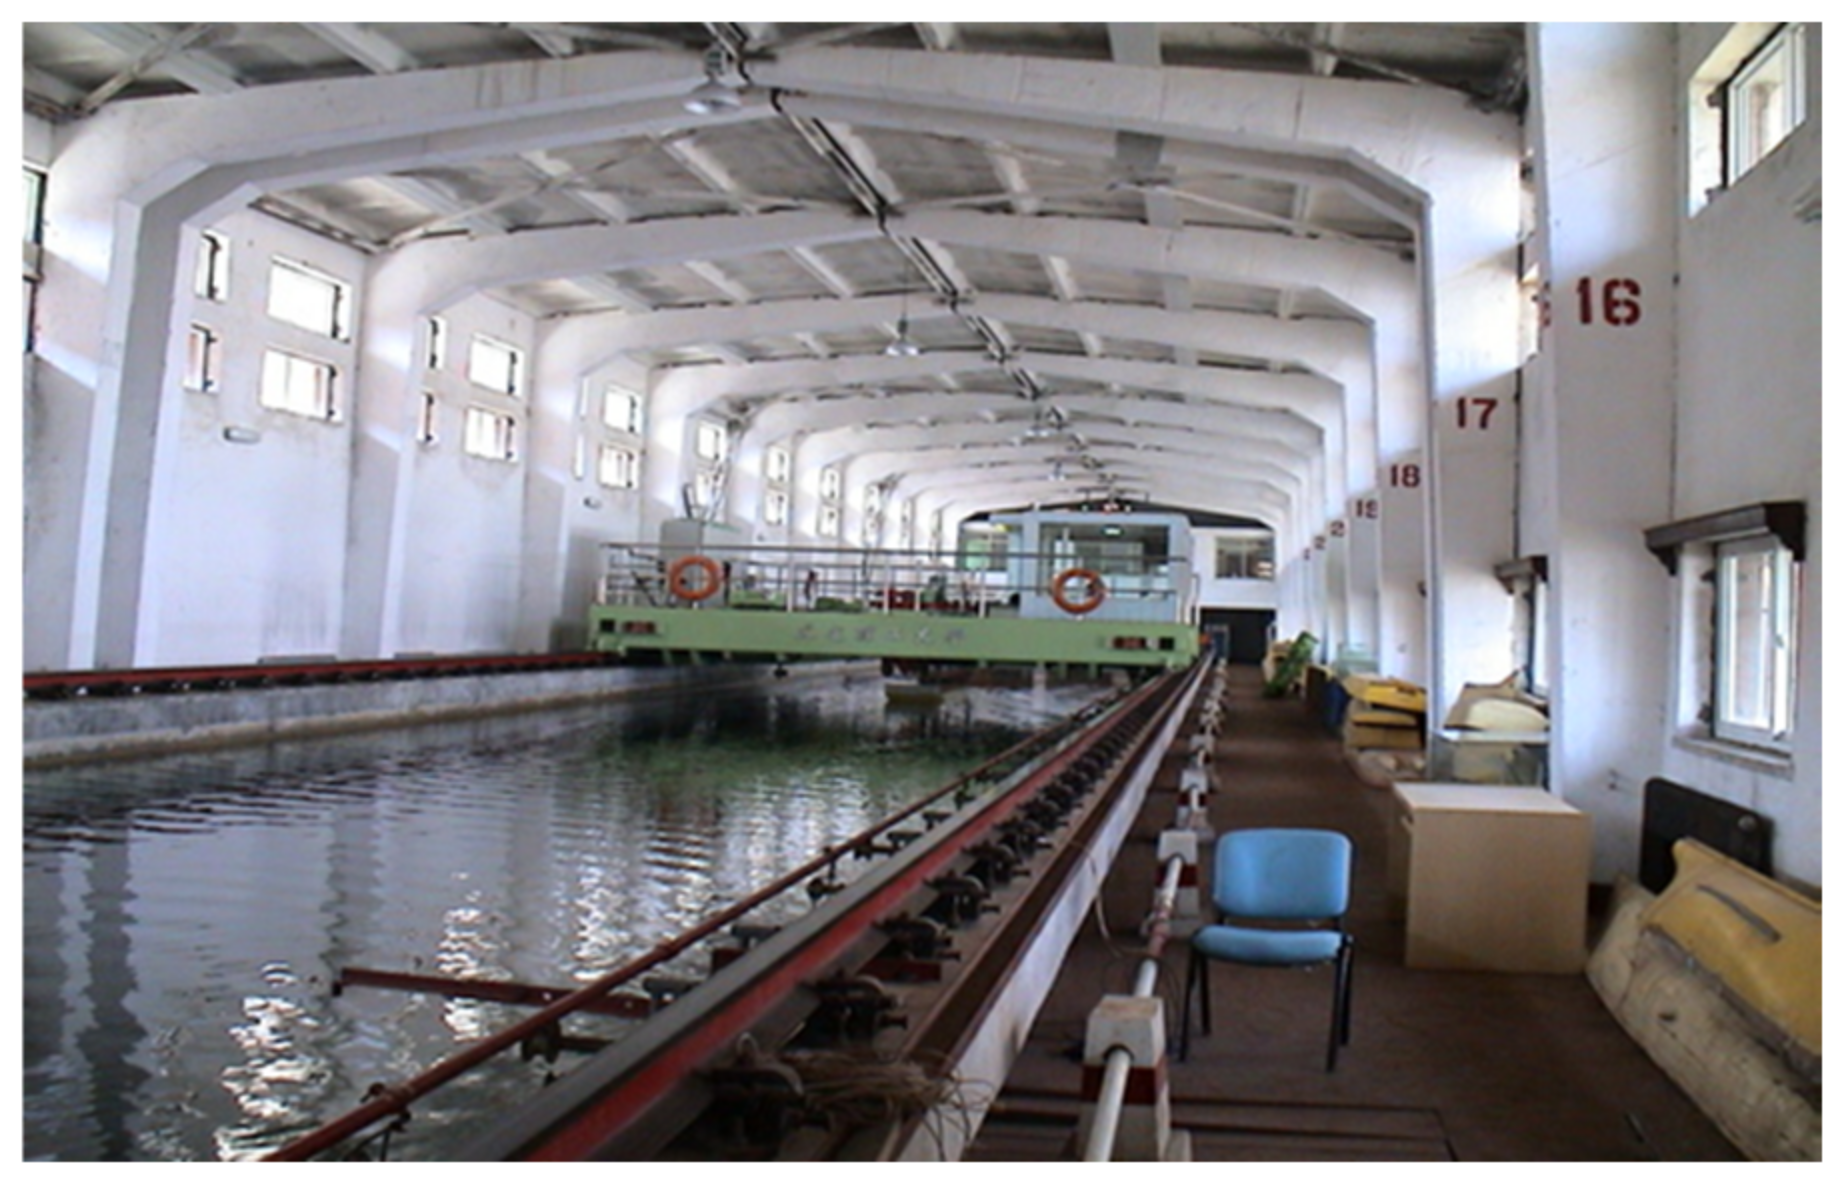
The T-foil control system is divided into the automatic control and the mechanical drive parts. The automatic control part consists of a control board with a built-in AVR microcontroller (manufacturer: Zhiwei Robotics Corps, Shanghai City, China), an inertial measurement unit (IMU), an angle sensor, and an upper computer measurement program (shown in Figure 6). The IMU has a built-in three-axis gyroscope and acceleration sensor, incorporating a Kalman filter algorithm to filter out noise during the attitude solution process. The IMU is fixed on the mid-longitudinal section of the bow above the T-foil to measure the heave velocity, pitch angle, and pitch angular velocity of the model. The mechanical drive part comprises a worm gear transmission system; an inclination sensor is fixed above the transmission system; and the rotation angle of the T-foil’s horizontal foil is determined by measuring the rotation angle of the servo motor.
The workflow of the control system is shown in Figure 7. The head sea regular waves induce the vertical motion of ship model in corresponding frequencies. The IMU sensor installed directly above the T-foil can measure the data of heave amplitude z and pitch angle θ. Then, the motion signals are output to the control board with built-in AVR microcontroller. The control board with the governing Equation (8) processes the input signal in real time to obtain the real-time swinging angle of the T-foil. The data of motion can also send to the upper computer data acquisition system. The upper computer data acquisition system can record the motion parameters of the model in real time, including the heave amplitude, heave velocity, pitch angle, pitch angular velocity, vertical acceleration, and T-foil’s swing angle, and it can export the recorded data to the computer in the form of Excel table for storage. On this basis, the swinging angle signal has been input into the mechanical system. The servo motor drives the worm gear transmission mechanism to adjust the T-foil’s swing angle in real time. T-foil’s deflection can induce the vertical force (moment) to reduce the vertical motion.
The reliability of the mechanical drive part (as shown in Figure 6) of the T-foil control system was first examined before tests began, and the differences in the actual and theoretical swing angles of the T-foil were analyzed. The actual swing angle was tested by giving the steering engine a sinusoidal swing angle signal with a frequency of 2.4 Hz; this was compared with its theoretical counterpart, and the results are illustrated in Figure 8. The mechanical clearance of the steering engine and deviation of the mechanical drive system caused the actual swing angle to lag for about 30 ms compared to its theoretical counterpart; the difference was little when compared to the encounter period and could be ignored. The test results showed that the transmission system met the test requirements.

3.3. Test Equipment

The test tank of the ship model was in the towing tank of Dalian University of Technology [23], a member of the International Towing Tank Conference (ITTC), having a total length of 160 m, width of 7 m, and depth of 3.65 m. The wave-making system of the tank used a push-plate wave-making machine, which had a maximum wave-making height of 0.4 m and high wave-making accuracy. It could produce regular and irregular waves with good repeatability. The characteristic parameters (such as wave height and period) were measured by the wave height meter and fed back to the control computer for adjustment. A wave damper was installed at the side wall of the tank. A sketch of the tank’s layout of equipment is shown in Figure 9.
In the tank, the ship model was towed forward by a Computerized Planar Motion Carriage system; the experimental setup of the towing tank is shown in Figure 10. The ship model was fixed on a seaworthy instrument on the carriage (as shown in Figure 11), so its heave amplitude, pitch and roll angles, as well as drag force, could be measured. In the test, the measurement points of the heave amplitude and pitch angle were located at the LCG of the ship model. Furthermore, acceleration sensors were installed on the bow of the ship model to measure bow acceleration, and filters were installed on each measurement device.

3.4. Model Experimental Design

The model tests focus on the vertical motion response of this semi-planing monohull ship with regular waves of different wavelengths at high speeds. Therefore, the speed chosen as its maximum design speed is U = 3.861 m/s (Fr = 0.63); the wavelength λ varies at 3–8 m; and the wave height is h = 0.046 m. The tests steps are as follows:
(1)
The response to heave, pitch, and bow accelerations was measured when the ship model sailed under regular waves with different wavelengths.
(2)
The motion responses of the ship model with a passive T-foil were measured under the same speed and wave conditions to calculate the value of the control parameter, C, according to the measured time-record curve.
The active control system of the T-foil was introduced to examine the response of the ship model when different motion signals are used as inputs; the optimal lifting moment control signal was determined by comparing the effects of the active T-foil.

4. Analysis of Experiment Results and Discussion

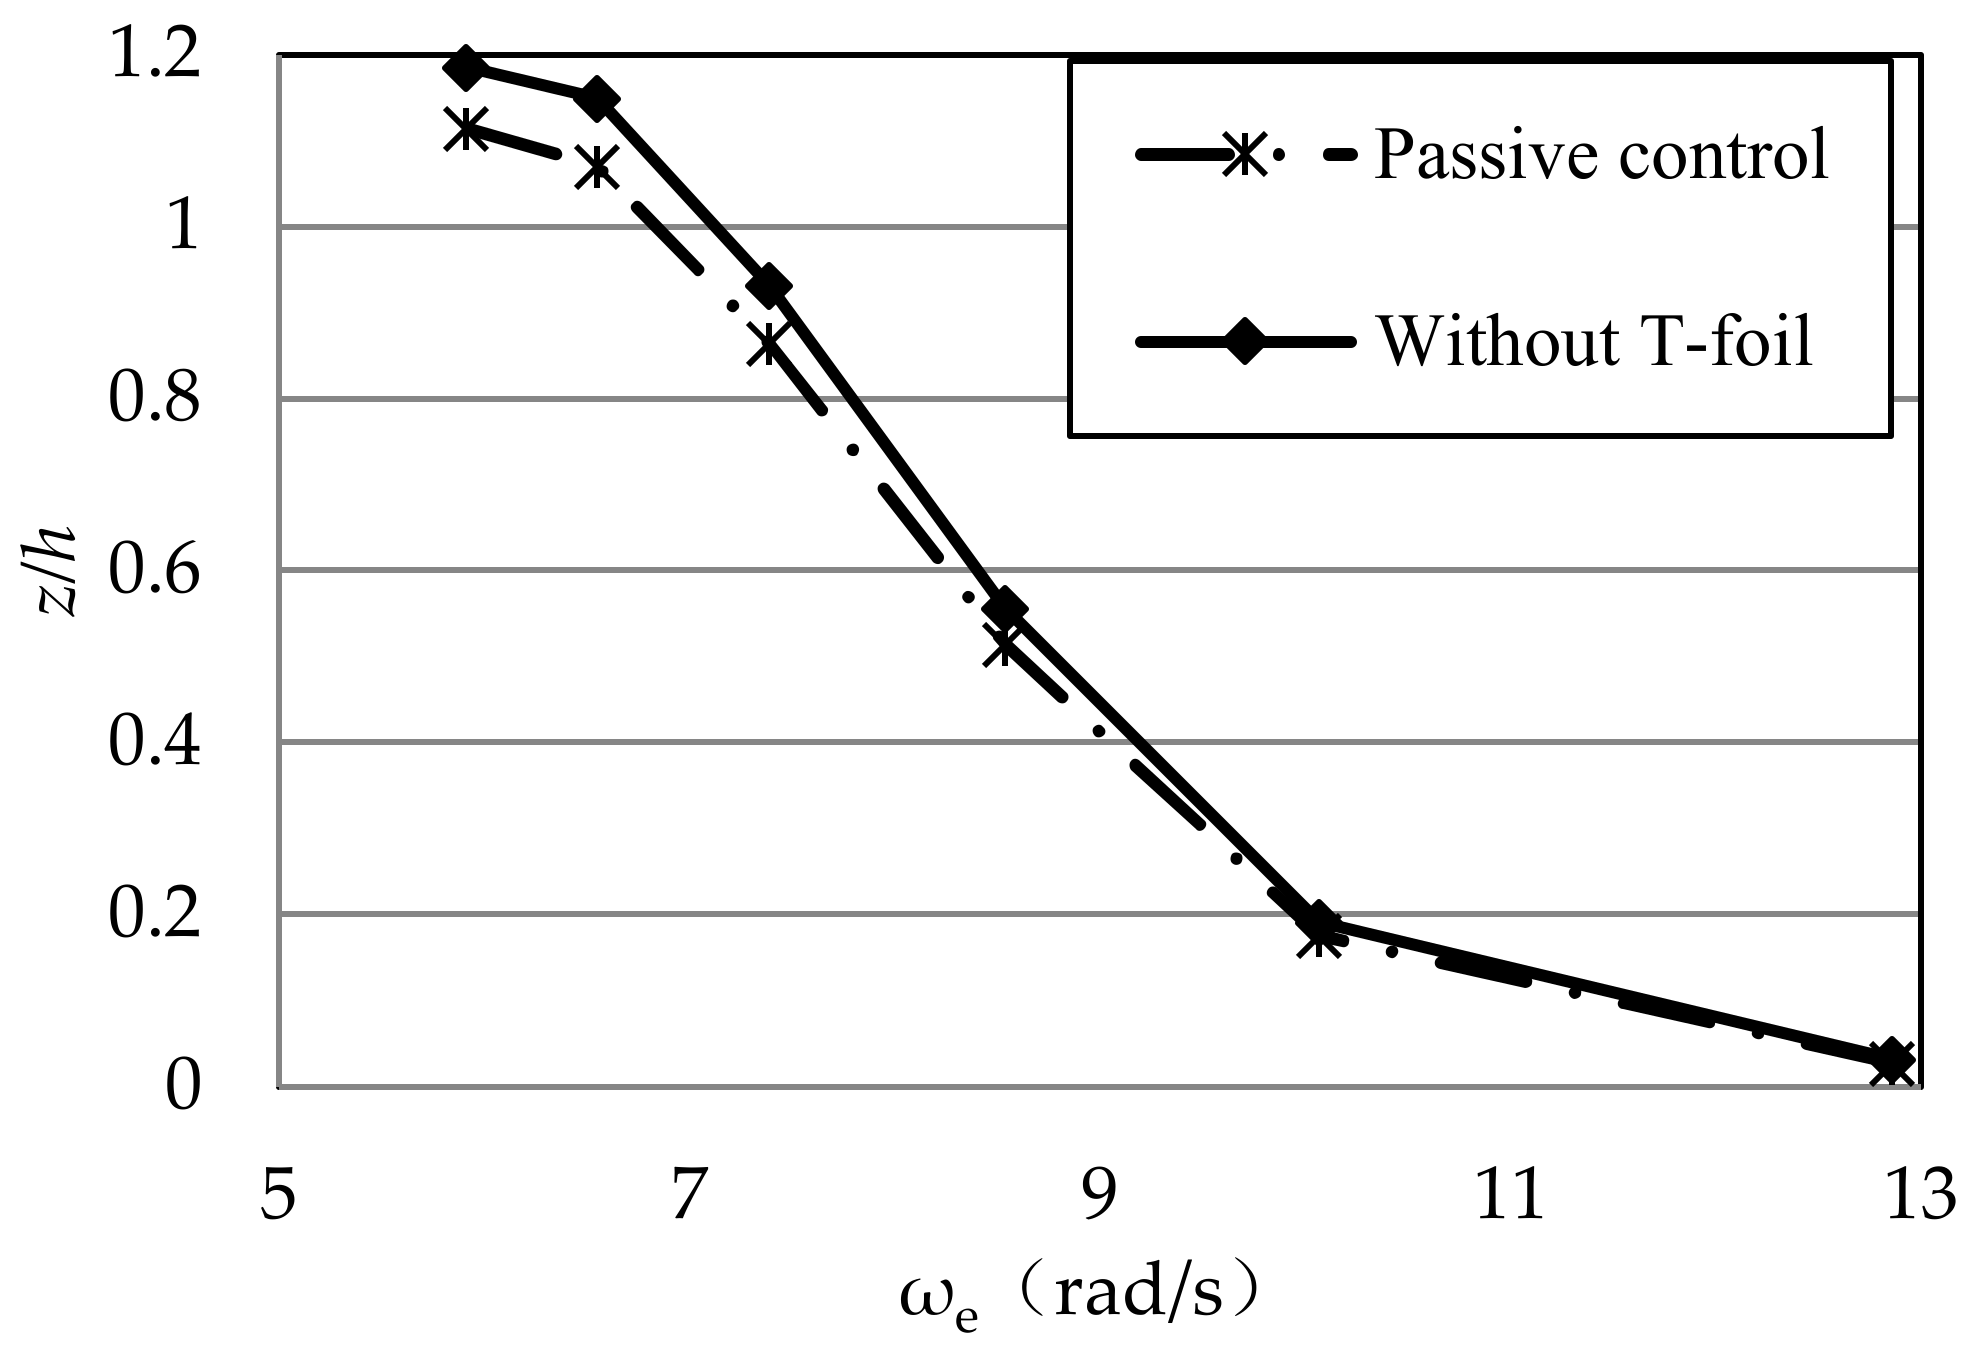
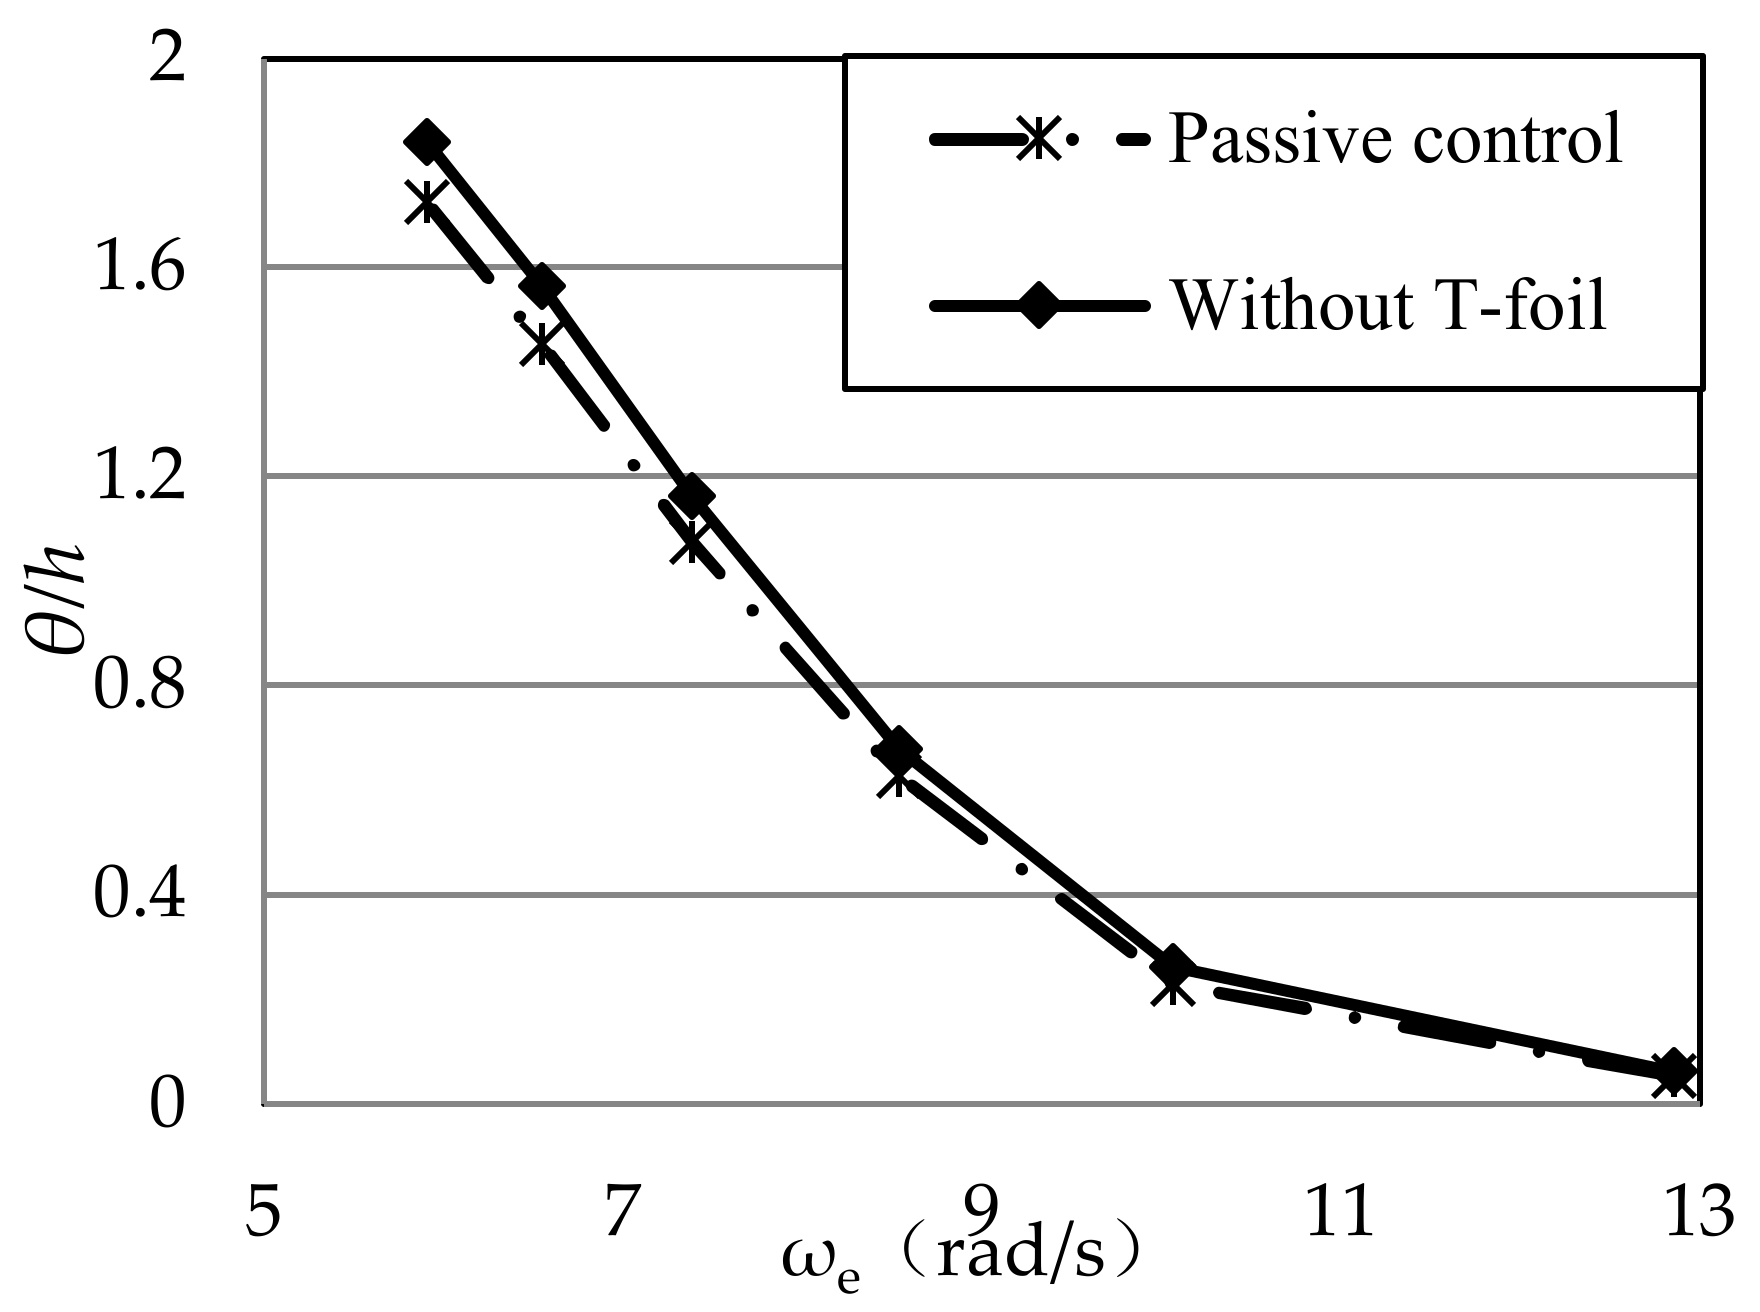
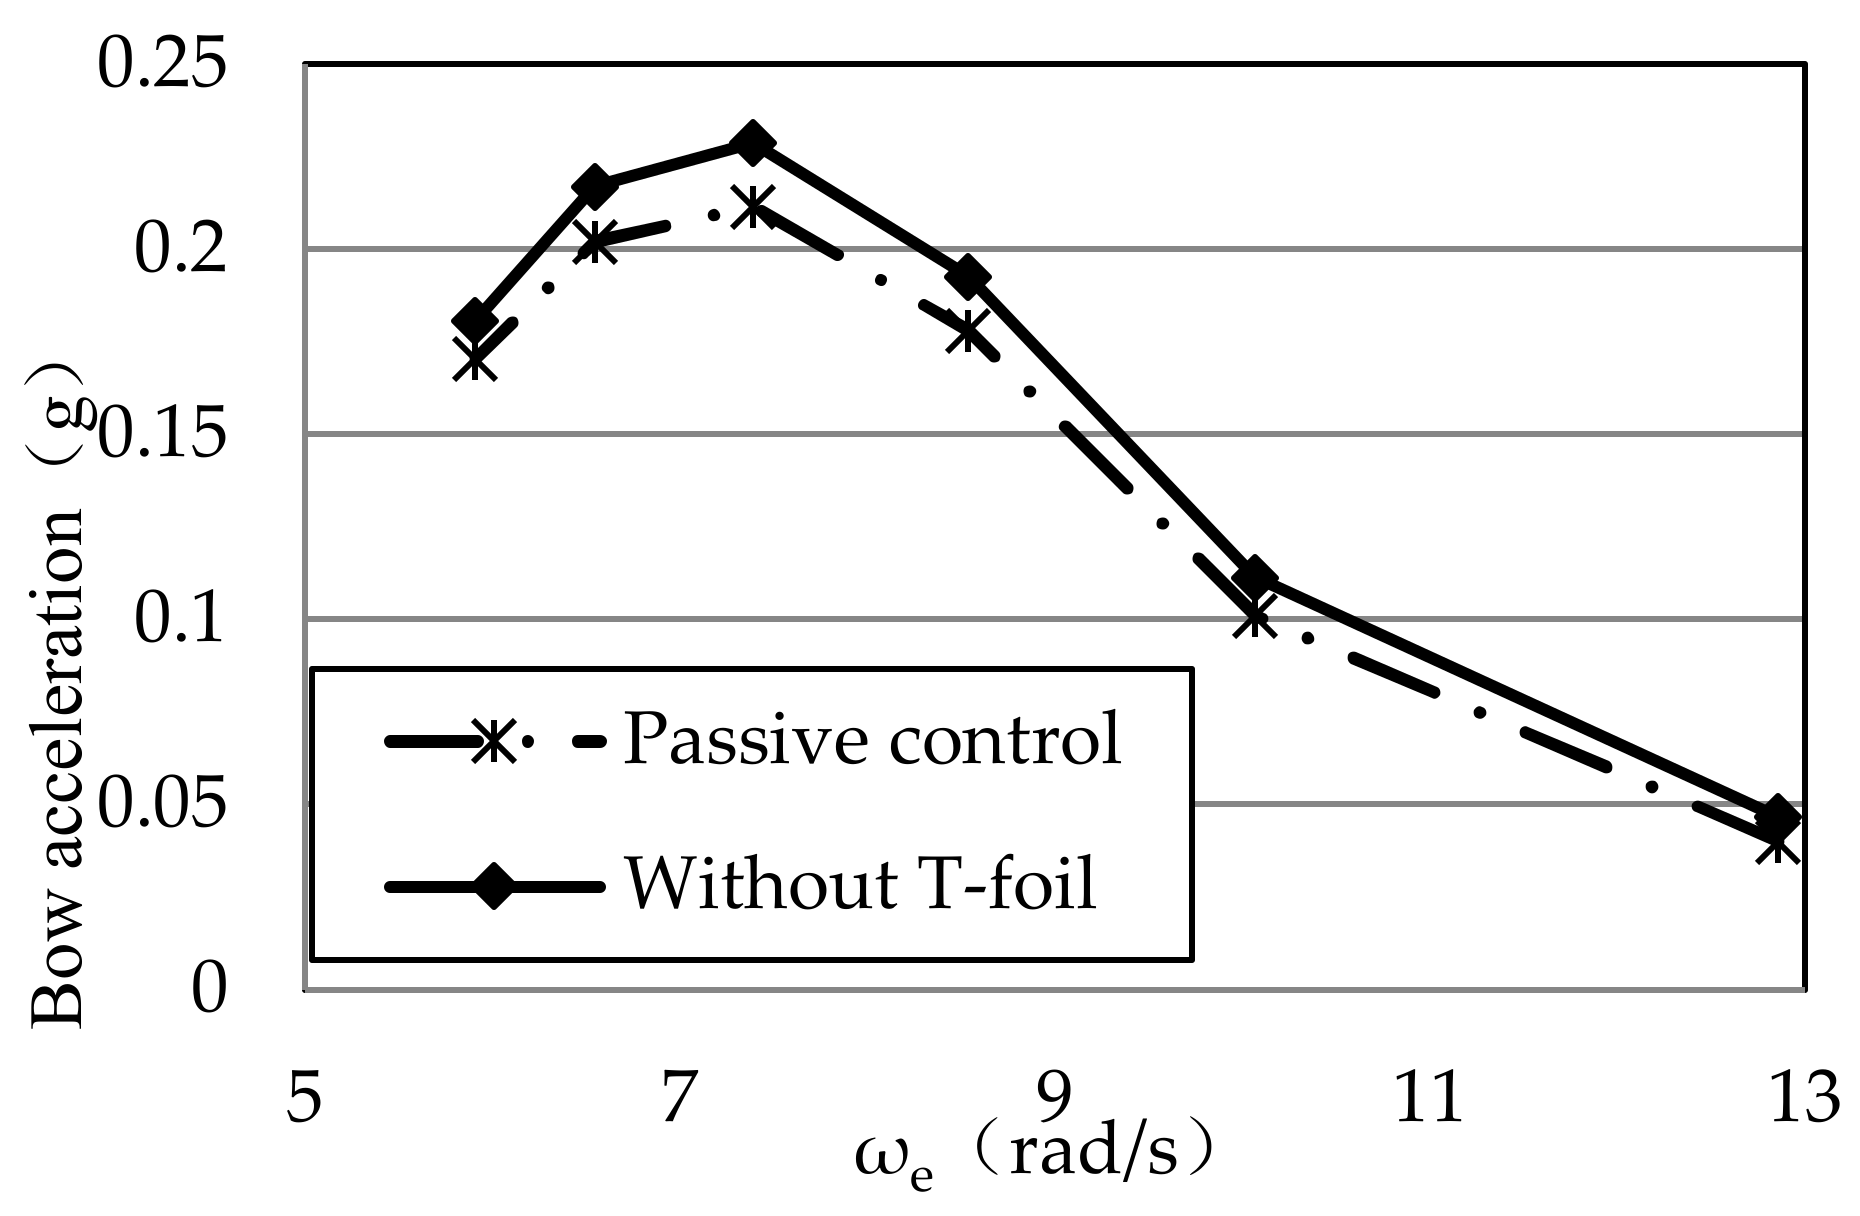
4.1. The Effect of Passive T-Foil

The model test of the passive T-foil was first conducted on the longitudinal motion of the semi-planing monohull ship with different wavelengths of regular waves to provide a basis for calculating the control parameter C in the active T-foil control system. The results of the analysis of the heave amplitude response at each encounter frequency are presented in Table 3, and the graph is presented in Figure 12. The heave response of the ship model increases as wavelength increases. The passive T-foil can reduce heave amplitude by 6–7% in higher heave response conditions (wavelength: λ = 6, 7, and 8 m). In lower-response conditions (λ = 3, 4 m), although the percentage of suppression effect improves slightly, the effect is not significant because of the low-response amplitude at that moment.
The result analysis of the pitch motion is presented in Table 4, and the graph is presented in Figure 13. The variation trend of the pitch motion response with wavelength is like that of the heave motion; the pitch angle is larger at long waves than at short ones. The anti-vertical motion effect of the passive T-foil on pitch motion is between 6.3 and 7.7% in the high-pitch response conditions. This is similar to the suppression ability of heave motion. This phenomenon occurs because the passive T-foil’s attack angle is small; hence, the anti-pitch motion percentage is limited.
For the bow acceleration motion, the result analysis is presented in Table 5, and the graph is presented in Figure 14. Unlike pitch and heave motions, the peak response of bow acceleration is located at λ = 6 m. The vertical acceleration value of the T-foil can be reduced by 7.56% under this condition, and its anti-vertical motion ability decreases slightly as the wavelength continues to increase. This phenomenon occurs because the installation position of the T-foil is more backward, and the lifting moment it produces is relatively small; thus, the effect is not obvious.

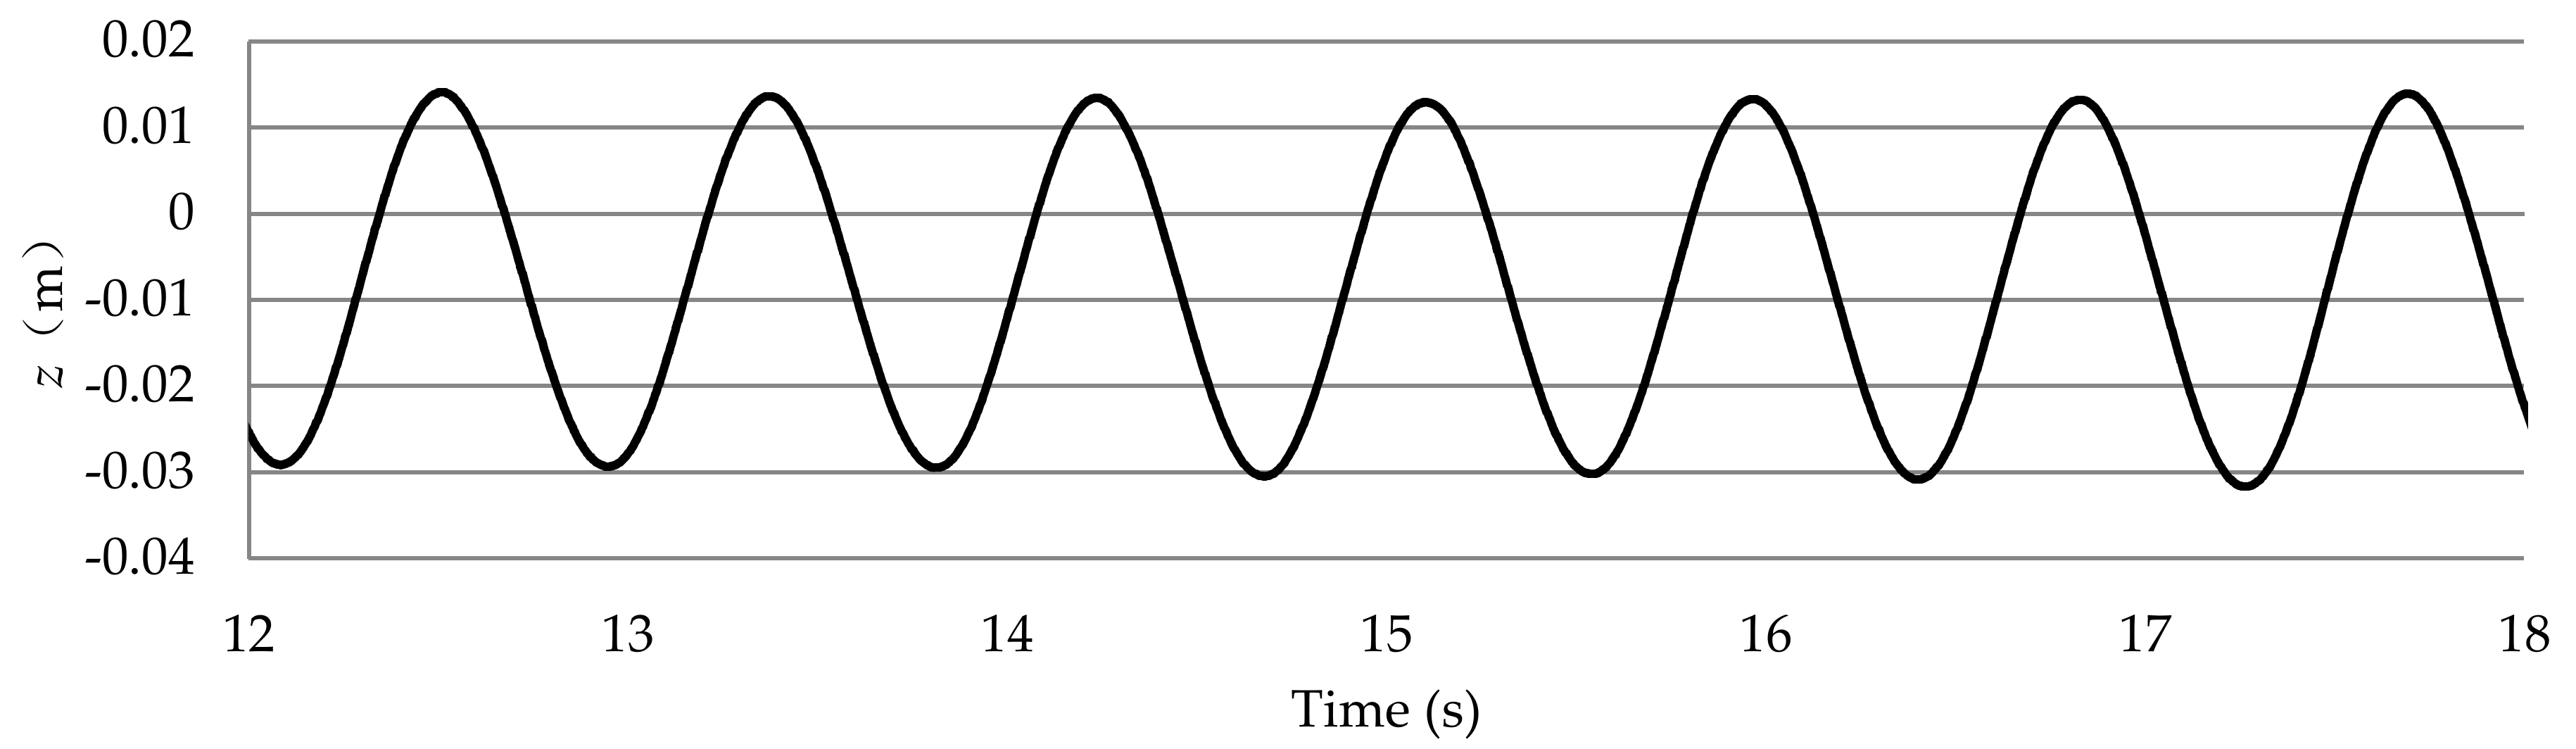
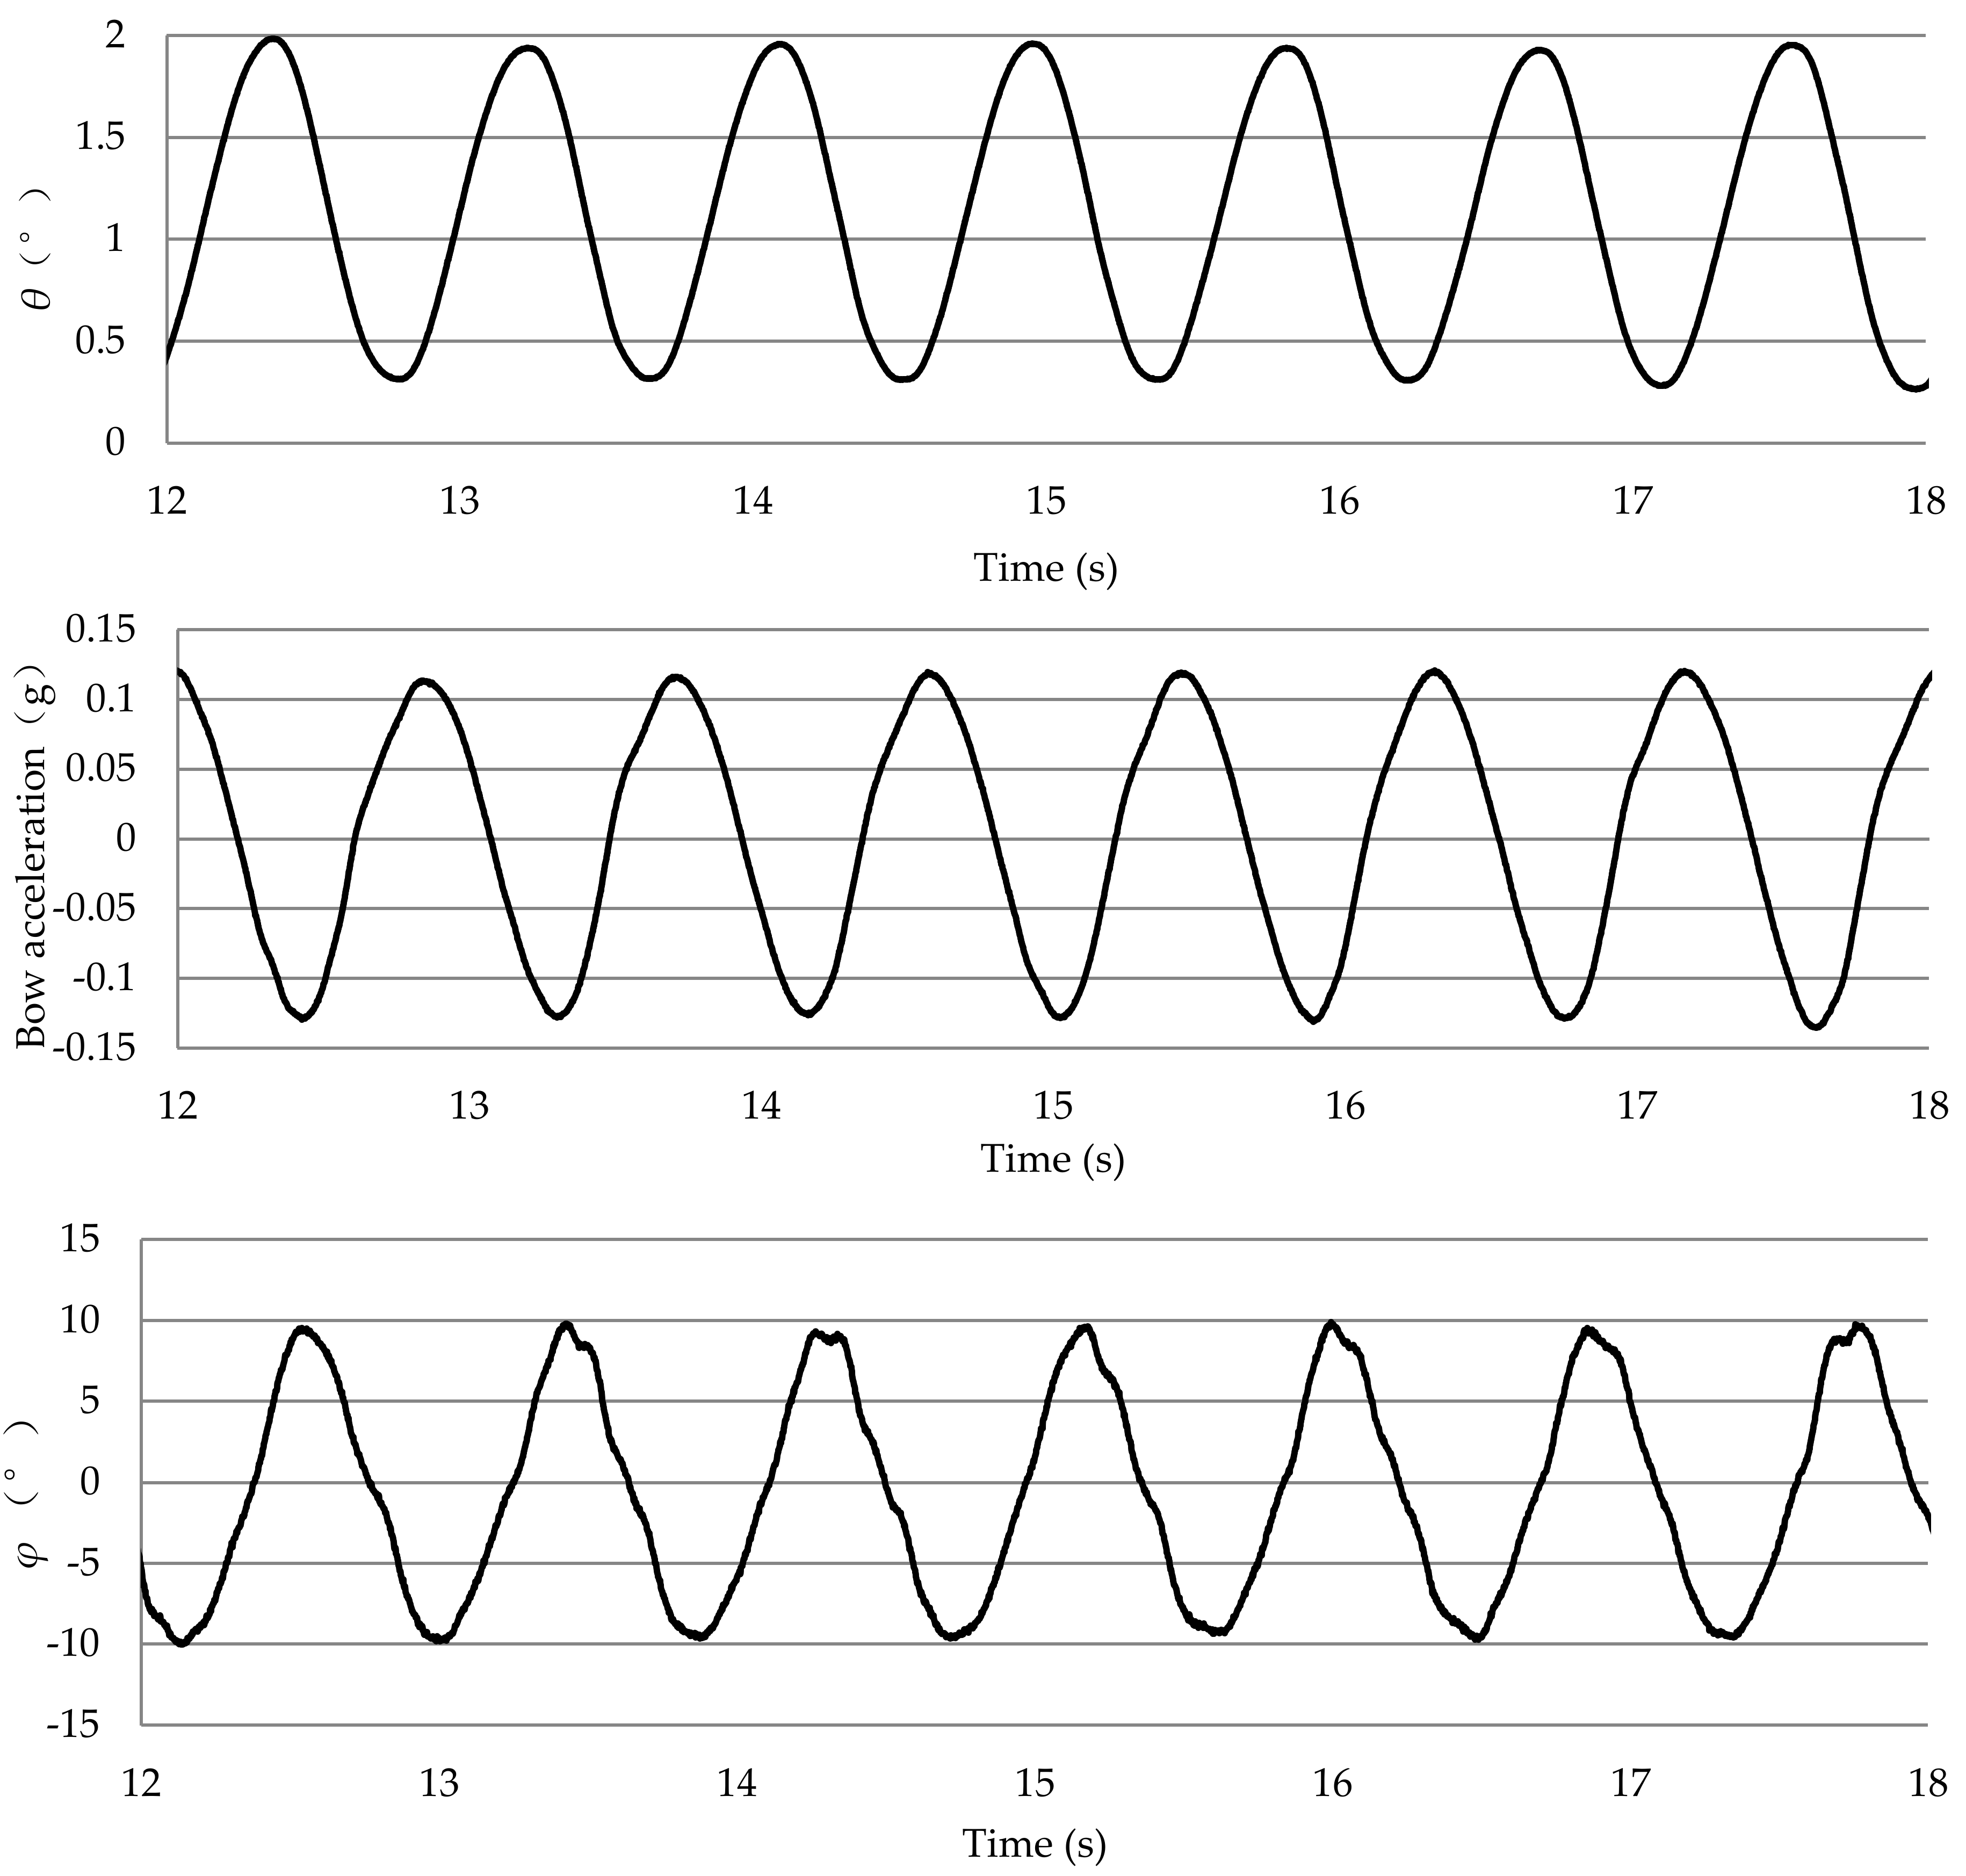
4.2. Comparison of Motion Signals

Based on the ship model and passive control suppression tests and according to the measured ship motion results, the values of each control parameter C can be obtained using the trial and error method with Equations (8) and (9). Several typical working conditions need to be selected for motion response measurement and for comparison of the difference in the anti-vertical motion effect of the ship model using different angular displacement motion control signals (pitch angle θ, pitch angular velocity θ ˙ , and pitch angular acceleration θ ¨ ).
The results of the passive control tests show that the high-response regions of heave and pitch motions are located at λ = 6, 7, and 8 m. For bow acceleration, the model’s response is higher when λ ≥ 5 m. In higher-response conditions, the anti-vertical motion percentage of the T-foil at λ = 5 and 6 m is slightly higher than at other wavelengths, but the effect of the T-foil in the low-response regions must also be considered. Hence, λ at 3, 5, and 6 m were chosen as the typical working conditions and for the comparison tests of different control signals.
The suppression effects percentages of different control signals on the vertical motion response of the monohull ship under typical working conditions are shown in Table 6, Table 7 and Table 8, and the response amplitudes are illustrated in Figure 15. Through comparison, it was found that the vertical motion of the ship model was more likely to reduce when the angular velocity signal was used to control the lifting moment of the active T-foil. At high-response regions for the active T-foil, the motion amplitude could be reduced by about 20%, unlike with the passive control. The pitch angle control signal had a more obvious suppression effect on pitch and heave motions than the angular acceleration control signal did, and the effect was about 10% in high-response regions. This difference between the two control signals is little compared to the bow acceleration suppression effect, which is weaker than the pitch angular velocity signal. Therefore, in the subsequent active control tests, the pitch angular velocity signal was used as the control signal for each working condition; here, Equation (9) is simplified as:
φ = θ ( C 2 K F l F + l F U ) θ ˙ + 1 U z ˙

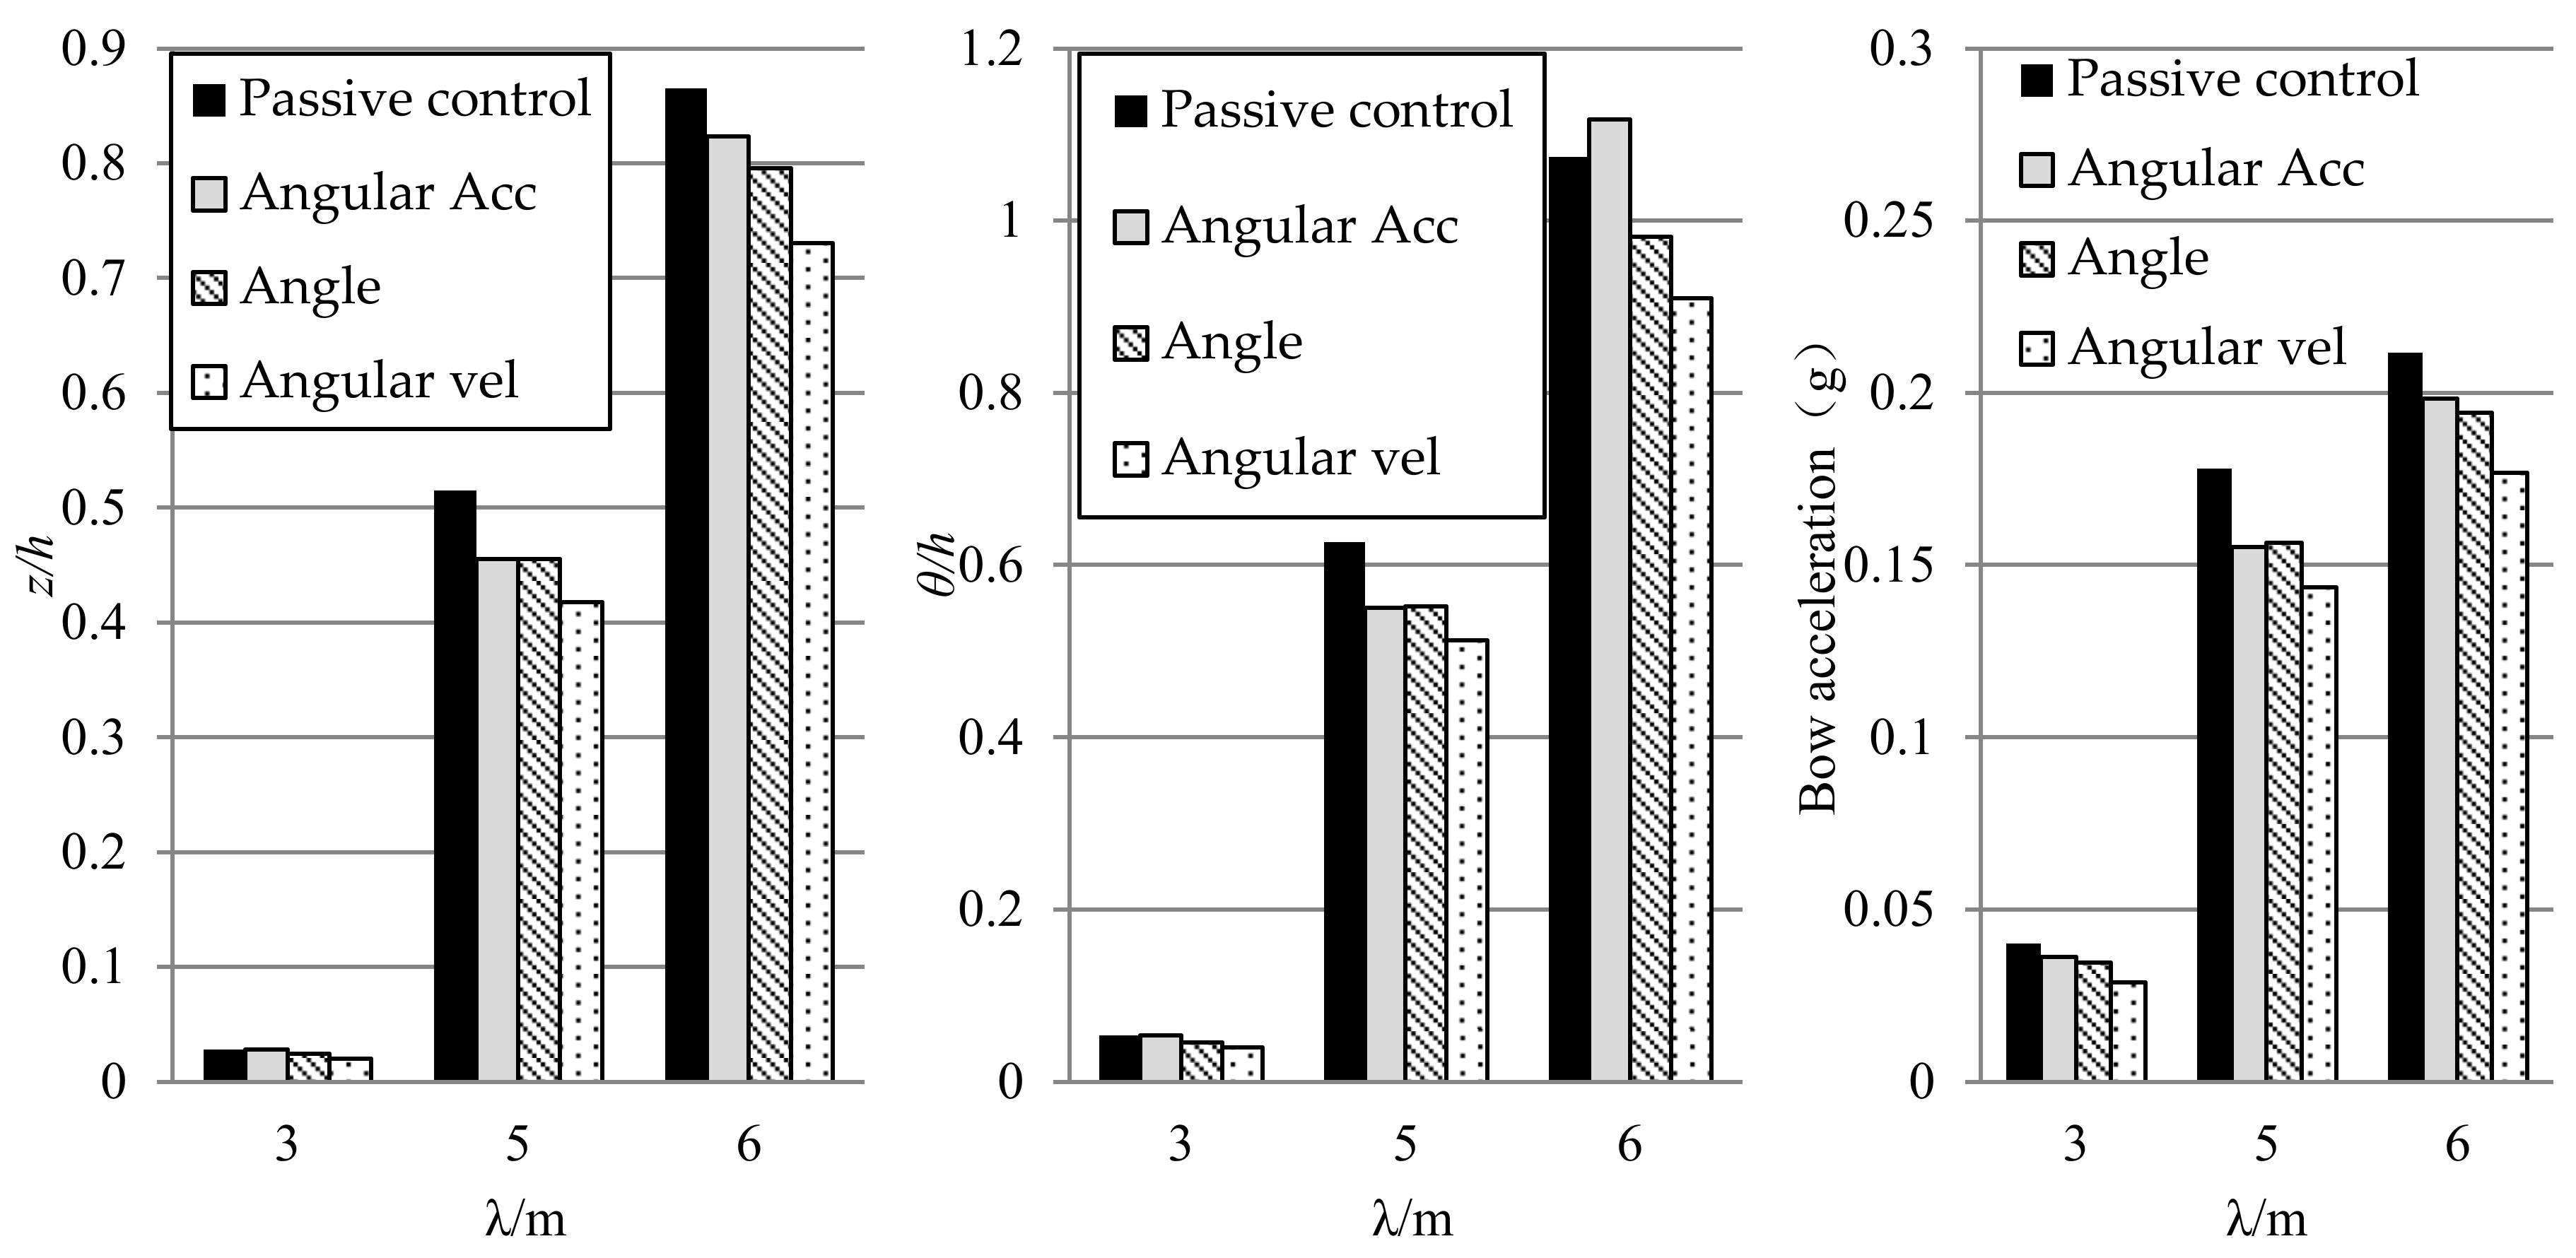
4.3. Effect of Active T-Foil

In the active control case, solving the control parameter C for each working condition is based on the results analysis of the model test of the passive T-foil for the corresponding working conditions. In this test, φ1 = −10° and φ2 = 10° according to the time-record curve of the pitch angle of the passive T-foil, and the maximum value of the angular velocity during the ship model navigation was obtained by differentiation. Subsequently, the control parameter C was obtained for each working condition using the trial and error method through Equations (10) and (12), as presented in Table 9. The swing angle’s output signal of the T-foil was processed by the sliding average filtering method to eliminate the influence of the jitter. When λ = 6 m, the time-record curves of the motion parameters were obtained, as shown in Figure 16.
The results of the active T-foil control tests using the pitch angular velocity signal to control the lifting moment of the T-foil are presented in Table 10, Table 11 and Table 12, and the response curves are presented in Figure 17, Figure 18 and Figure 19. After introducing the active T-foil, the heave motion (Figure 17 and Table 10) is effectively reduced by more than 25% using the pitch angular velocity control signal because of the low motion response value at short-wave conditions (λ = 3, 4 m). Here, the heave amplitude is reduced by more than 20%, which is higher than for the passive T-foil. As the wavelength increases, the response of the ship model improves. In the high-response region (λ = 6–8 m), the active T-foil can reduce the heave amplitude by about 20% higher than the passive T-foil. The angular velocity control signal can induce an additional heave suppression effect of about 13%.
The anti-pitch effect of the active T-foil is illustrated in Figure 17 and summarized in Table 11. T-foils can show positive effects (up to 30% or more of anti-vertical motion) in short-wave conditions. However, the pitch angle effect is limited because of a low motion amplitude. The active T-foil can effectively reduce the pitch angle by more than 20% at the peak-response region (λ = 8 m) compared to the ship model without T-foil and by about 14% compared to the passive T-foil. Overall, the pitch angle suppression effect is slightly better than that of heave motion because the lifting moment of the T-foil increases the pitch damping of the hull and reduces the pitch angular velocity.
For bow acceleration (Figure 19, Table 12), the anti-bow acceleration percentages for both T-foils reduce as wavelength increases. The response of the model with active T-foil in short-wave conditions is reduced by up to 38% compared with that of the passive T-foil, but its effect is not obvious because of the low acceleration value. In high-response regions (λ = 5–8 m), the active T-foil can effectively reduce the bow acceleration response by more than 19%, which is 14% lower compared with that of the passive T-foil. At the peak (λ = 6 m), the reduction in pitch motion increases due to the additional lifting moment generated by the active T-foil; thus, the bow acceleration reduces by 15% compared with the passive T-foil, drastically reducing the likelihood of seasickness.

4.4. Discussion of Result

The lifting moment of the T-foil can resist the vertical velocity of the ship model by using pitch angular velocity signals as the main control signal of the T-foil’s swing angle; this is equivalent to increasing the oscillation damping of the ship. The test results show that the effect of the active T-foil can be improved in each condition compared to that of the passive T-foil. Unlike with the passive T-foil, anti-vertical motion effects are more obvious in high-response conditions (resonance region), and the anti-vertical motion percentages of heave, pitch, and bow acceleration can increase by more than 15%. This is because the change in the T-foil’s angle increases the lift force, changes the natural frequency of the ship, and ensures more obvious suppression effects in high-response areas. However, in these high-frequency regions with short wavelengths, the motion amplitude is low; hence, the T-foil effect is weak.
By comparing the pitch, heave, and bow acceleration responses, vertical motion is reduced considerably by the active T-foil with pitch angular velocity. The amplitude reduction by the T-foil in bow acceleration is slightly better than in heave and pitch motions, especially in short-wave conditions. In resonance regions, the bow acceleration with an active T-foil is reduced by nearly 20% compared with the ship model without a T-foil. This is because the lift force (moment) opposes the vertical velocity of the ship model and ensures a more obvious suppression effect on acceleration.

5. Conclusions and Prospects

5.1. Conclusions

A model test was conducted for a monohull ship with a T-foil under regular wave conditions. By conducting lift force (moment) analyses, the governing equation for the T-foil’s swing angle was formed and optimized through model tests by comparing the anti-vertical motion effects of different motion control signals. The T-foil’s lift force (moment) was adjusted according to the pitch angular velocity. The effect of the active T-foil under each working condition was obtained at high speed, and the conclusions are as follows:
(1)
The active T-foil improves the vertical motion performance of a high-speed monohull model under regular wave conditions using pitch angular velocity control signals. The effect is slightly better than using pitch angle or pitch angle acceleration control signals, with the motion amplitude limitation in the high-response area being particularly obvious. The vertical motion amplitude is reduced by nearly 10% via the pitch angular velocity control method compared to the other two signals. Furthermore, the effect of the pitch angle control signal is slightly better than that of the pitch angular acceleration signal.
(2)
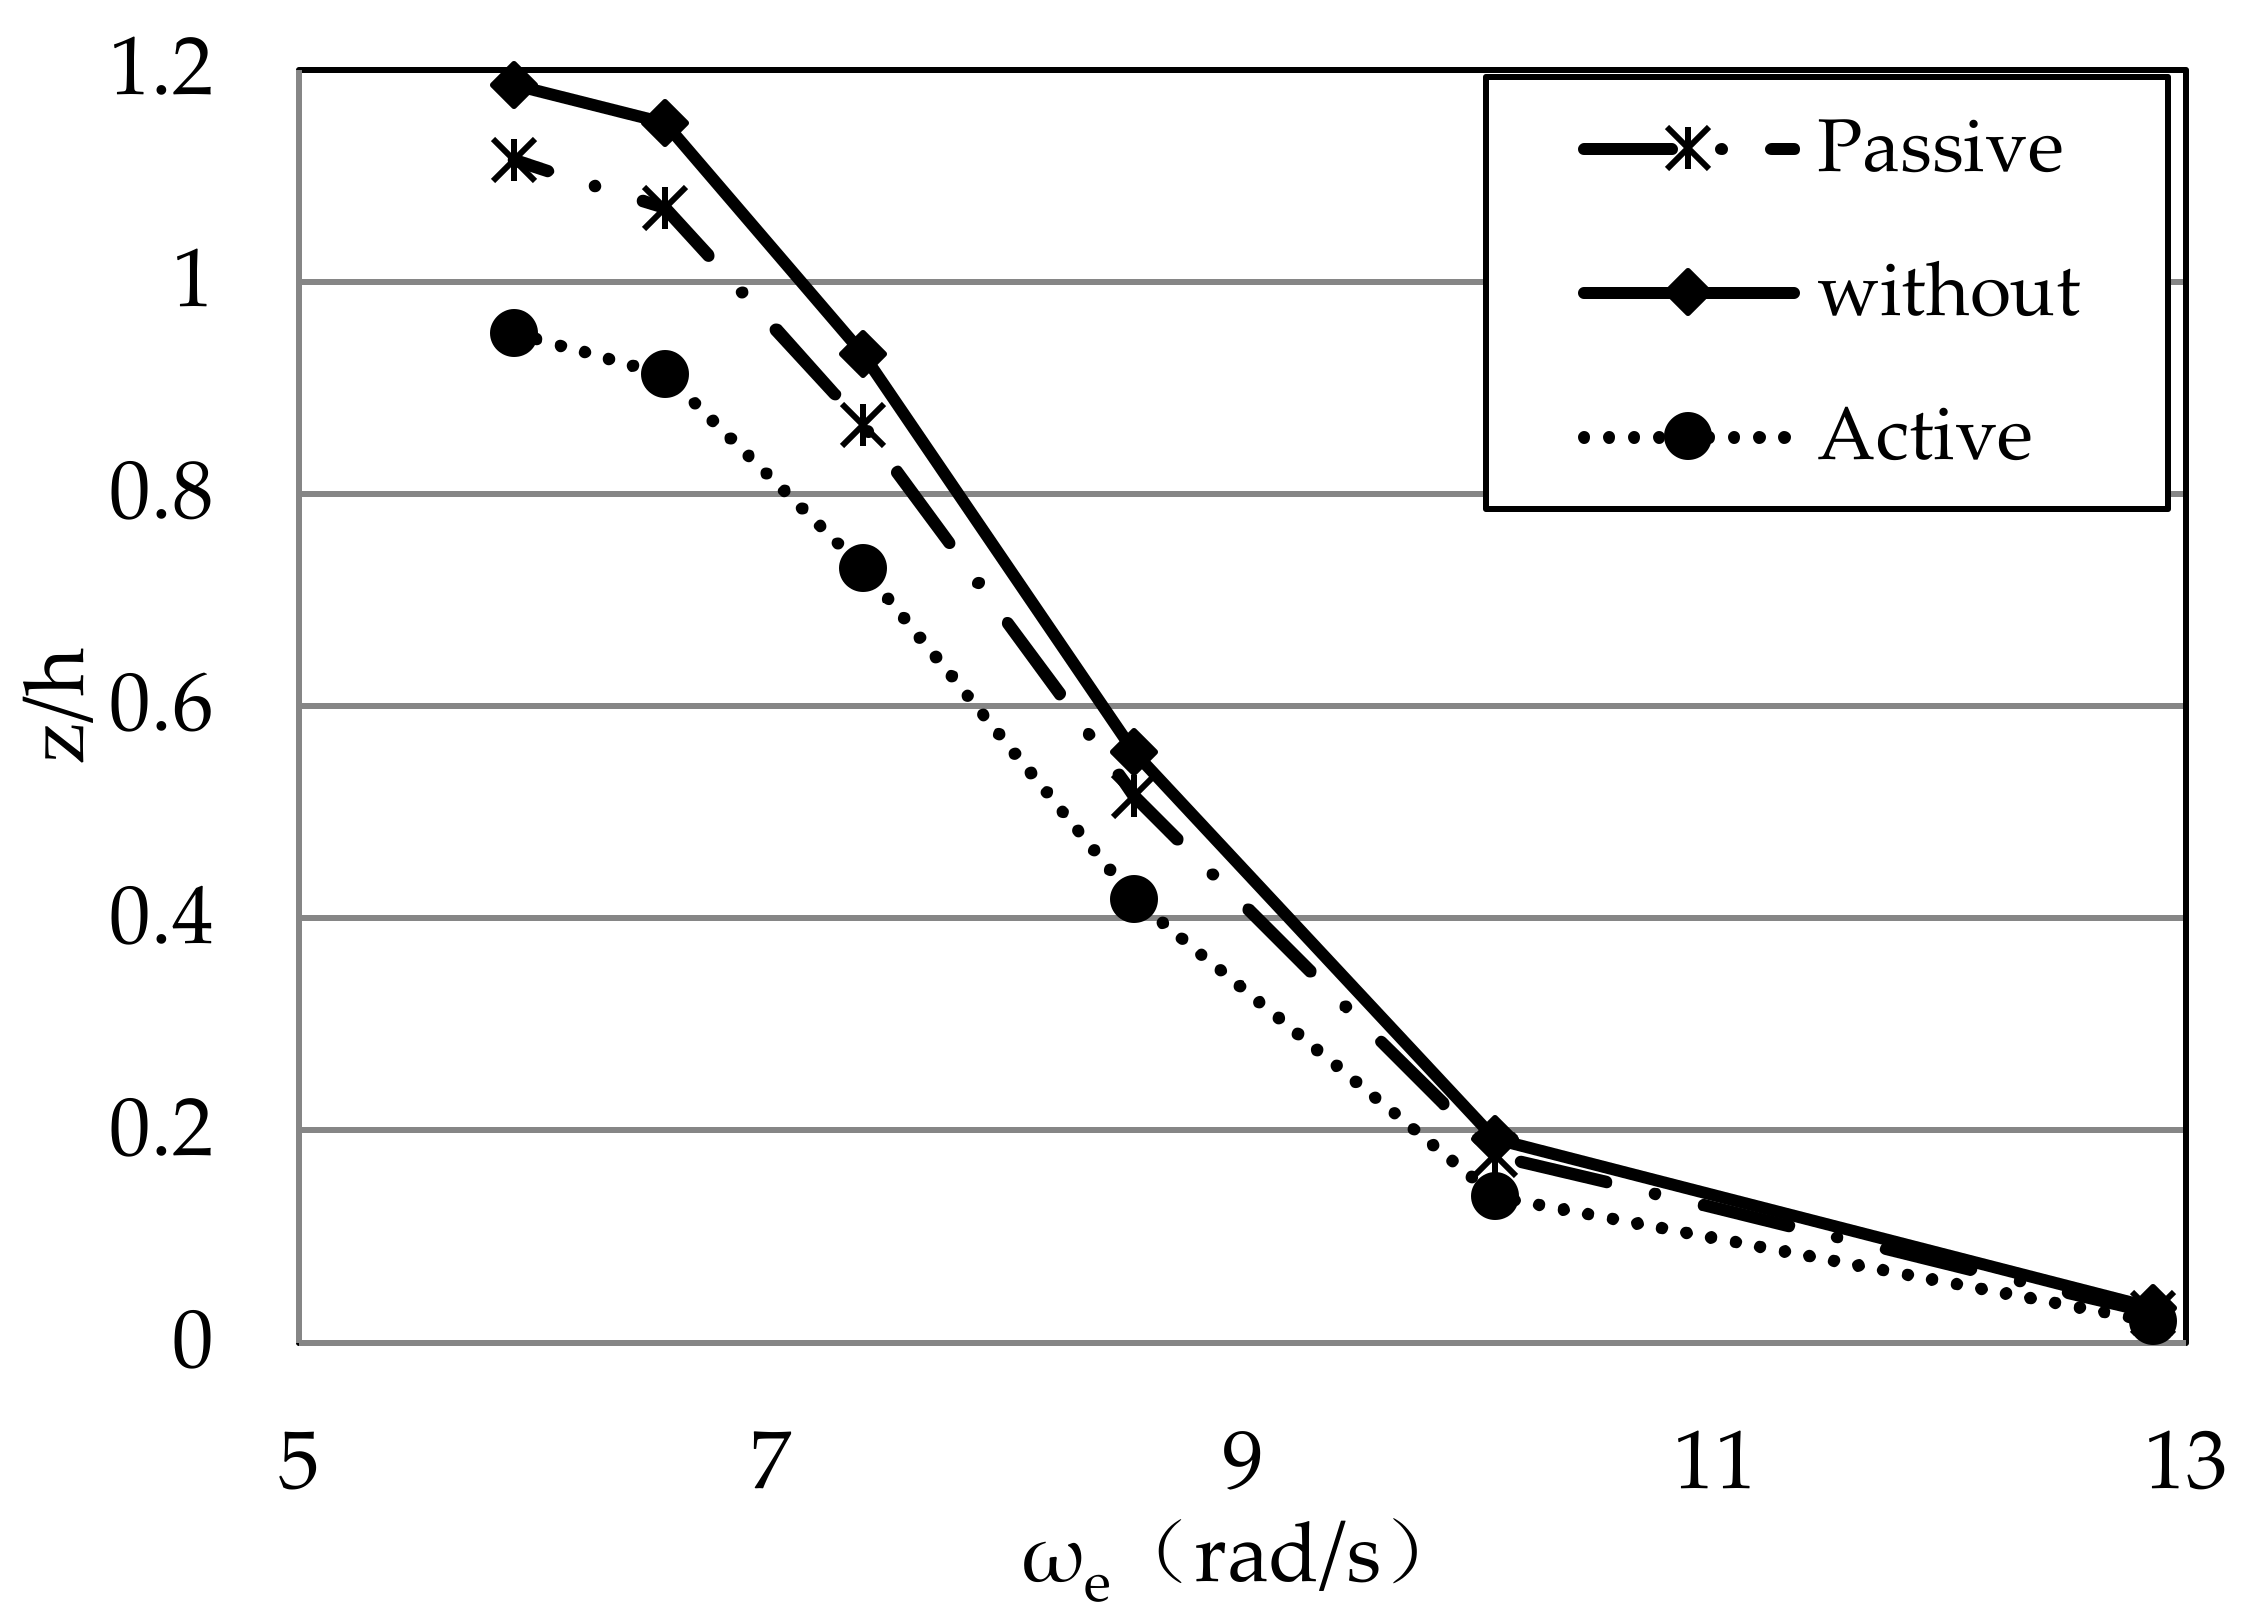
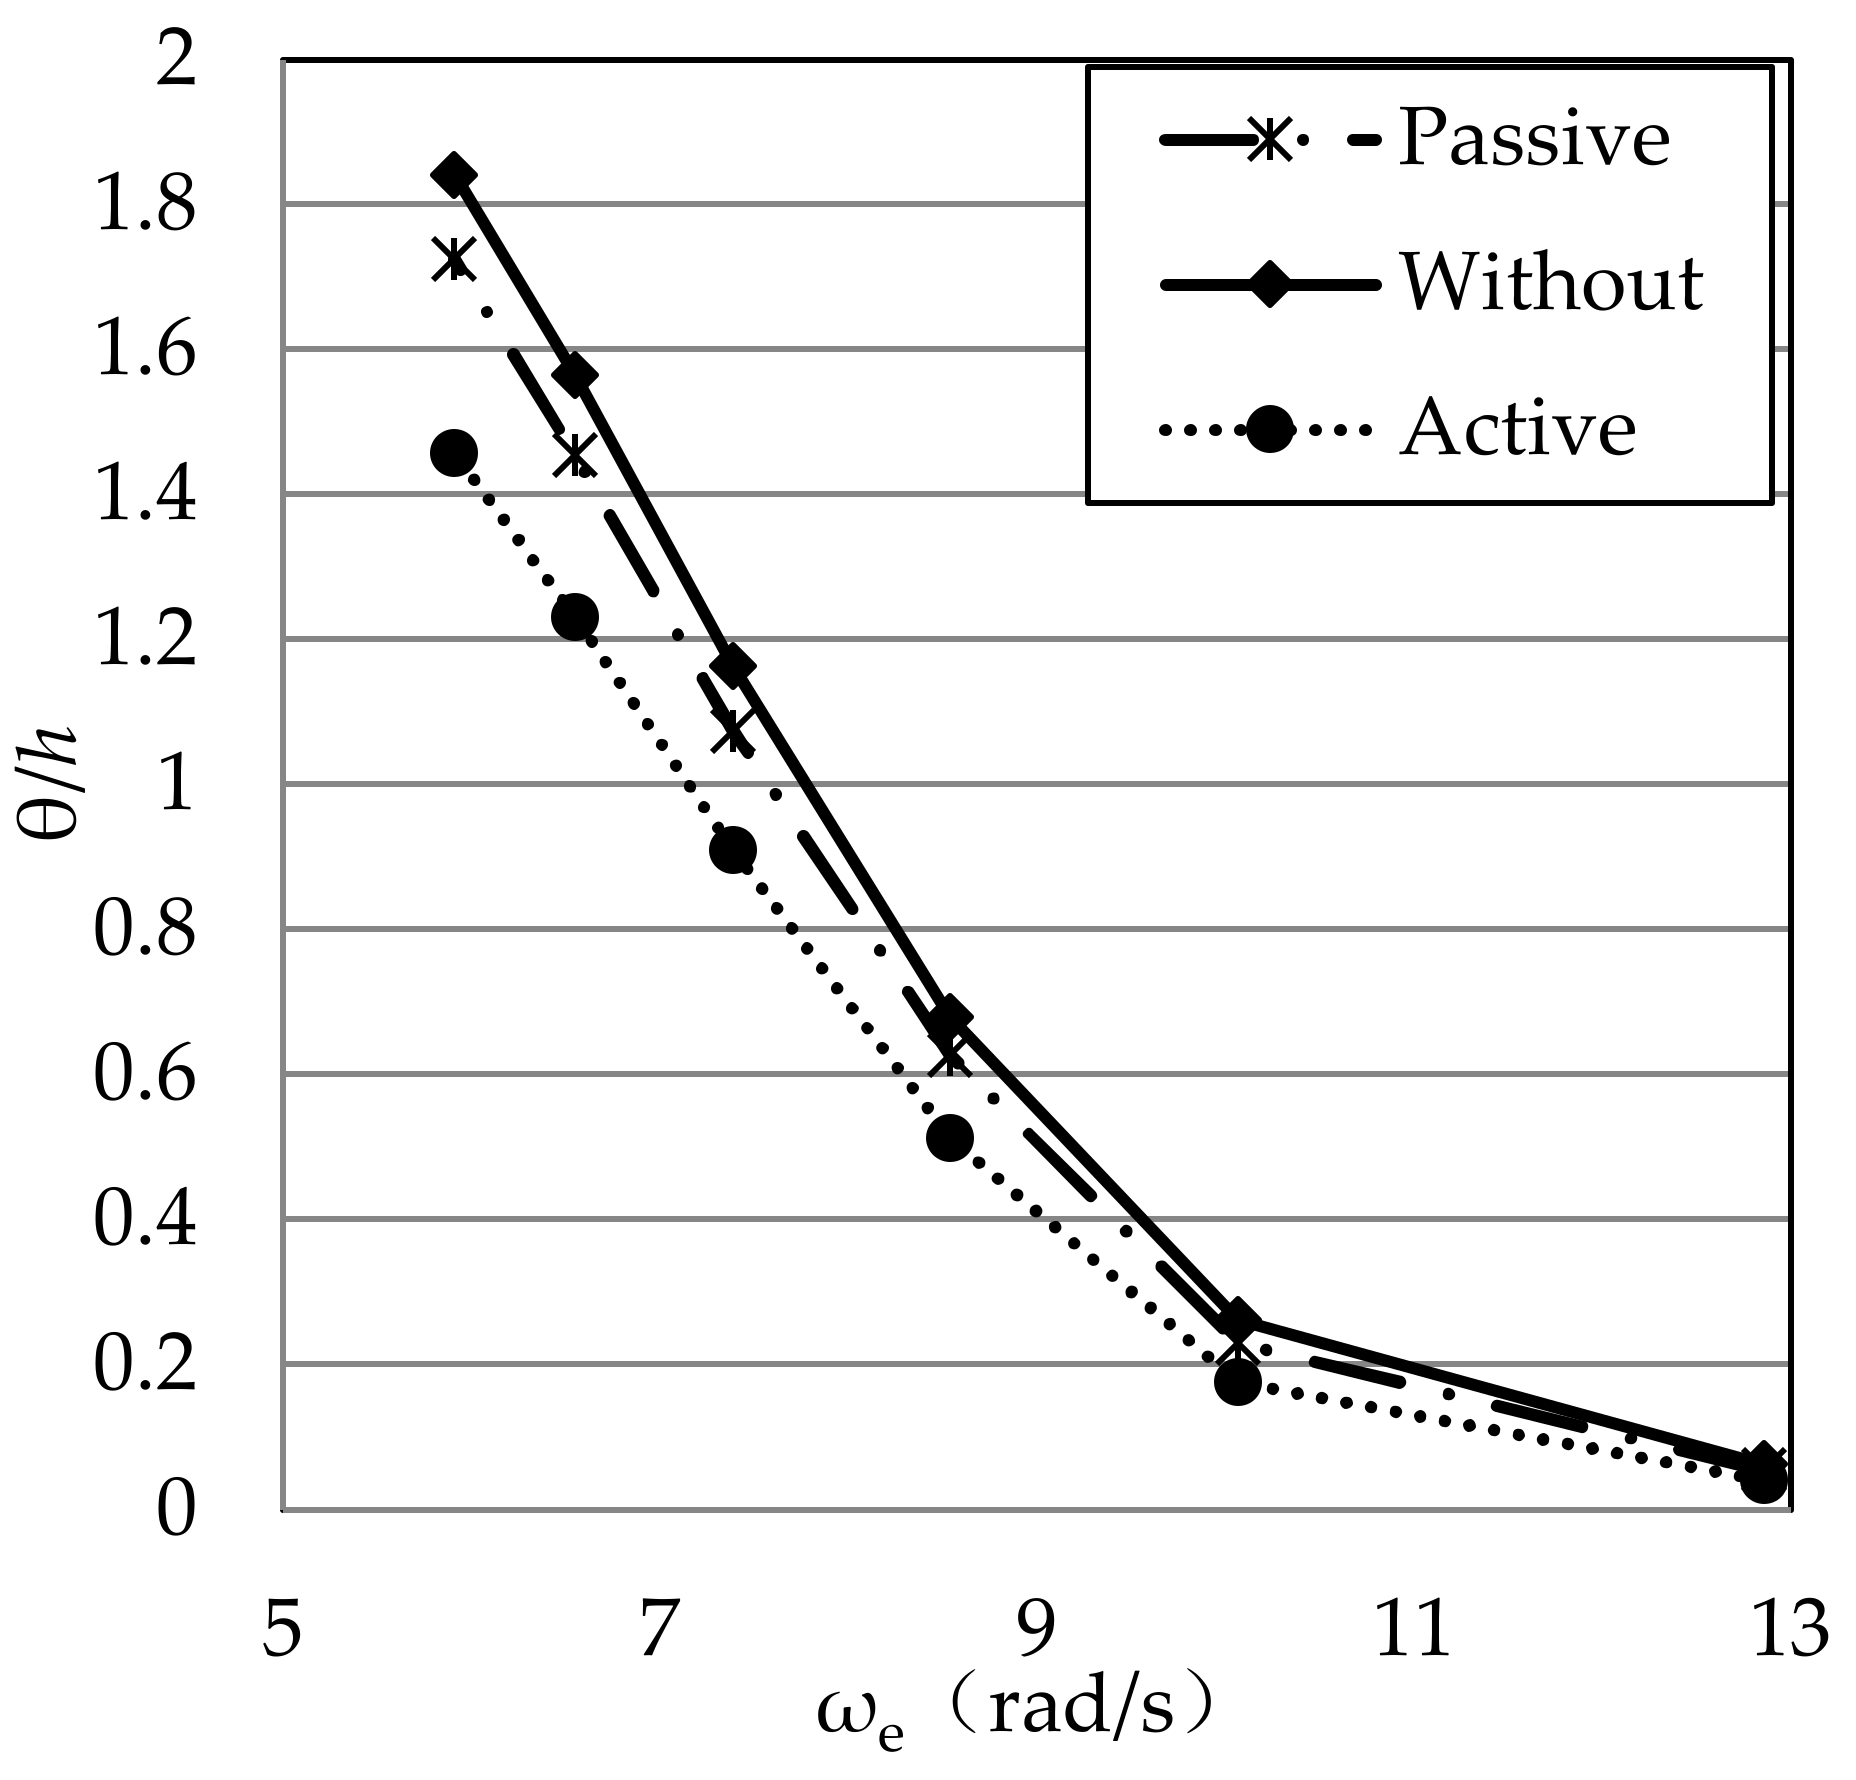
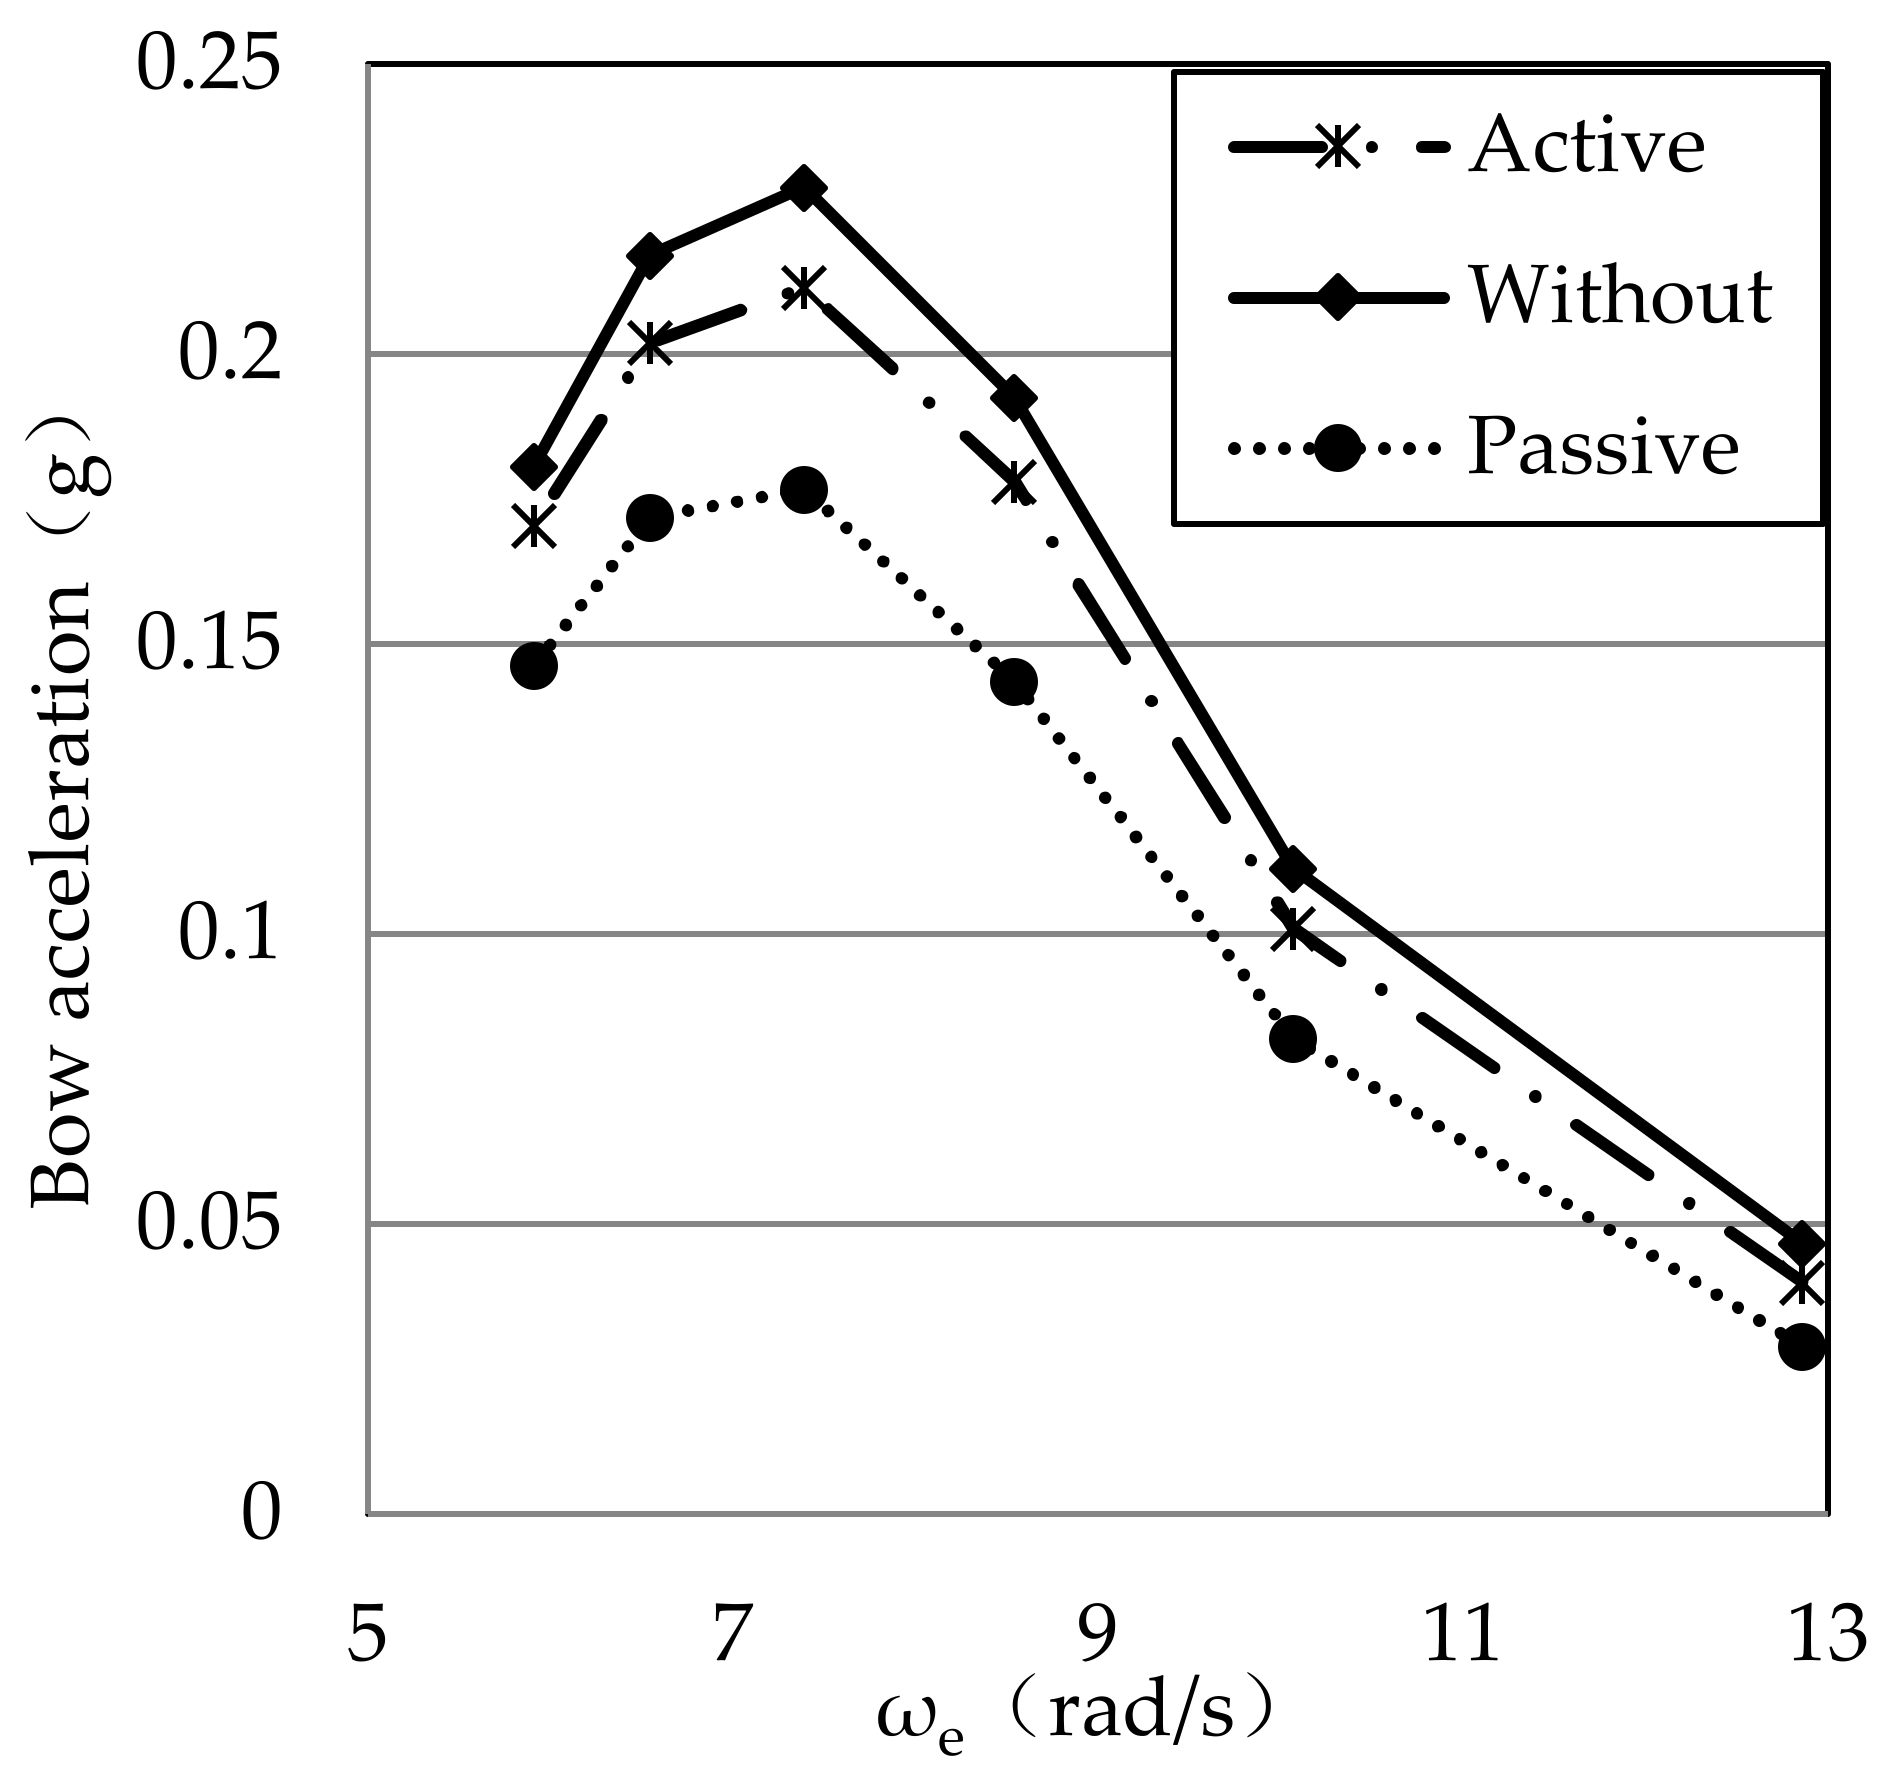
The active T-foil reduces the longitudinal motion response (including in heave, pitch, and bow acceleration) by more than 20% in all working conditions compared to the ship model without a T-foil. Under short-wave conditions, the suppression effect can be up to 30% or more because of a low motion amplitude, and it can be between 19% and 25% in peak-response regions.
(3)
Unlike with the passive T-foil, at high-response conditions, the introduction of the angular velocity control signal improves the suppression effect on heave, pitch, and bow acceleration by about 14–15%; at low-response conditions, the effect of the active T-foil is enhanced by up to 20% or more.
By and large, introducing the active control method leads to a more obvious reduction in heave, pitch, and bow acceleration, especially in the high-response regions. This proves that the effects of anti-vertical motions are obvious with the active T-foil control method proposed in this research.

5.2. Further Work

Further work can encompass the improvement of the following aspects:
(1)
The T-foil can be installed closer to the bow, and the T-foil’s parameter needs to be further optimized.
(2)
The governing equation of the swing angle can be optimized using a multi-signal control and control parameters adjusted in real time.
(3)
The anti-roll effect when using a T-foil needs to be studied.
(4)
In this study, the calculation of lift force is based on a static lift force theory, neglecting unsteady hydrofoil effects. The model can be improved by introducing an unsteady airfoil theory.

Author Contributions

Conceptualization, Y.S.; methodology, Y.S. and Z.Z.; software, D.Z.; formal analysis, Y.S. and Y.W.; data curation, Z.W.; writing−original draft preparation, Y.S.; writing−review and editing, D.Z.; supervision, D.Z.; funding acquisition, Y.S. and D.Z. All authors have read and agreed to the published version of the manuscript.

Funding

This research was funded by Program for Scientific Research Start-up Funds of Guangdong Ocean University, grant number 060302072102 and Zhanjiang Marine Youth Talent Project—Comparative Study, grant number 2021E5007.

Institutional Review Board Statement

The study did not require ethical approval.

Informed Consent Statement

The study did not involve humans.

Data Availability Statement

The data that support the findings of this study are available from the corresponding author, upon reasonable request.

Conflicts of Interest

The authors declare no conflict of interest.

References

  1. Faltinsen, O.M. Hydrodynamics of High-Speed Marine Vehicles; Cambridge University Press: Cambridge, UK, 2005. [Google Scholar]
  2. Tang, H.; Ren, H.; Wan, Q. Investigation of longitudinal vibrations and slamming of a trimaran in regular waves. J. Ship Res. 2017, 61, 153–166. [Google Scholar] [CrossRef]
  3. Davis, M.R.; Watson, N.L.; Holloway, D.S. Wave response of an 86 m high speed catamaran with active T-foils and stern tabs. Trans. R. Inst. Nav. Archit. Part A Int. J. Marit. Eng. 2003, 145, 15–34. [Google Scholar]
  4. Jiao, J.; Sun, S.; Li, J.; Adenya, C.A.; Ren, H.; Chen, C.; Wang, D. A comprehensive study on the seakeeping performance of high speed hybrid ships by 2.5D theoretical calculation and different scaled model experiments. Ocean Eng. 2018, 160, 197–223. [Google Scholar] [CrossRef]
  5. Haywood, A.; Duncan, A.; Klaka, K.; Bennett, J. The development of a ride control system for fast ferries. Control Eng. Pract. 1995, 3, 695–702. [Google Scholar] [CrossRef]
  6. Fang, M.C.; Shyu, W.J. Improved prediction of hydrodynamic characters of SWATH ships in wave. Proc. Natl. Sci. Counc. 1994, 18, 495–507. [Google Scholar]
  7. De la Cruz, J.; Aranda, J.; Giron-Sierra, J.; Velasco, F.; Esteban, S.; Diaz, J.; de Andres-Toro, B. Improving the comfort of a fast ferry. IEEE Control Syst. 2004, 24, 47–60. [Google Scholar]
  8. Mehr, J.A.; Ali-Lavroff, J.; Davis, M.R.; Holloway, D.; Thomas, G. An experimental investigation of ride control algorithms for high-speed catamarans Part 1: Reduction of ship motions. J. Ship Res. 2017, 61, 35–49. [Google Scholar]
  9. Esteban, S.; Giron-Sierra, J.M.; De Andres-Toro, B.; De La Cruz, J.M. Development of a control-oriented model of the vertical motions of a fast ferry. J. Ship Res. 2004, 48, 218–230. [Google Scholar] [CrossRef]
  10. Esteban, S.; Giron-Sierra, J.; De Andres-Toro, B.; Cruz, J.D.; Riola, J.M. Fast ships models for seakeeping improvement studies using flaps and T-foil. Math. Comput. Model. 2005, 41, 1–24. [Google Scholar] [CrossRef]
  11. Giron-Sierra, J.M.; Andres-Toro, B.; Esteban, S.; Recas, J.; Besada, E.; Cruz, J.M.; Maron, A. First principles modelling study for the development of a 6 DOF motions model of a fast ferry. IFAC Proc. Vol. 2004, 36, 73–78. [Google Scholar] [CrossRef]
  12. Giron-Sierra, J.; Andres-Toro, B.; Esteban, S.; Recas, J.; Besada, E.; De la Cruz, J.; Riola, J.M. Model based analysis of seasickness effects in a fast ferry. IFAC Proc. Vol. 2003, 36, 103–108. [Google Scholar] [CrossRef]
  13. Giron-Sierra, J.M.; Esteban, S.; Cruz, J.M.; Andres, B.D.; Riola, J.M. Fast ship’s longitudinal motion attenuation with T-Foil and flaps. In Proceedings of the Novel Vehicle Concepts and Emerging Vehicle Technologies Symposium, Ottawa, ON, Canada, 18–21 October 1999; The RTO Applied Vehicle Technology Panel: Neuilly-sur-Seine, France, 2003; pp. 26–34. [Google Scholar]
  14. Alavimehr, J.; Davis, M.R.; Lavroff, J.; Holloway, D.S.; Thomas, G.A. Response of a high-speed wave-piercing catamaran to an active ride control system. Trans. R. Inst. Nav. Archit. Part A Int. J. Marit. Eng. 2016, 158, A325–A335. [Google Scholar] [CrossRef]
  15. Alavimehr, J.; Lavroff, J.; Davis, M.R.; Holloway, D.; Thomas, G. An experimental investigation of ride control algorithms for high-speed catamarans Part 2: Mitigation of wave impact loads. J. Ship Res. 2017, 61, 51–63. [Google Scholar] [CrossRef]
  16. Alavimehr, J. The Influence of Ride Control System on the Motion and Load Response of a Hydroelastic Segmented Catamaran Model. Ph.D. Thesis, University of Tasmania, Hobart, Australia, 2016. [Google Scholar]
  17. Belibassakis, K.A.; Politis, G.K. Hydrodynamic performance of flapping wings for augmenting ship propulsion in waves. Ocean Eng. 2013, 72, 227–240. [Google Scholar] [CrossRef]
  18. Filippas, E.; Papadakis, G.; Belibassakis, K.A. Free-surface effects on the performance of Flapping-Foil thruster for augmenting ship propulsion in waves. J. Mar. Sci. Eng. 2020, 8, 357. [Google Scholar] [CrossRef]
  19. Ntouras, D.; Papadakis, G.; Belibassakis, K.A. Ship bow wings with application to trim and resistance control in calm water and in waves. J. Mar. Sci. Eng. 2022, 10, 492. [Google Scholar] [CrossRef]
  20. López, R.; Santos, M. Neuro-Fuzzy system to control the fast ferry vertical acceleration. In Proceedings of the 15th IFAC World Congress, Barcelona, Spain, 21–26 July 2002; pp. 319–324. [Google Scholar]
  21. Giron-Sierra, J.M.; Esteban, S. Frequency domain study of longitudinal motion attenuation of a fst ferry using a T-Foil. In Proceedings of the 17th World Congress the International Federation of Automatic Control, Seoul, Republic of Korea, 6–11 July 2008; pp. 15004–15009. [Google Scholar]
  22. Wang, W.; Zong, Z.; Ni, S.; Zhang, L.; Chen, Z. Model tests of effect of interceptor on resistance of a semi-planing ship. Chin. J. Res. 2012, 7, 18–22. [Google Scholar]
  23. Jia, J.; Zong, Z.; Shi, H. Model experiments of a trimaran with transom stern. Int. Shipbuild. Prog. 2009, 56, 119–133. [Google Scholar]
Figure 1. Graphic analysis of effective attack angle.
Jmse 11 01551 g001
Figure 2. Distance between installation position and ship’s LCG.
Jmse 11 01551 g002
Figure 3. Installation site of the T-foil.
Jmse 11 01551 g003
Figure 4. Dimensions of the T-foil.
Jmse 11 01551 g004
Figure 5. Model geometry.
Jmse 11 01551 g005
Figure 6. Automatic and mechanical control parts.
Jmse 11 01551 g006
Figure 7. Flow chart of control system.
Jmse 11 01551 g007
Figure 8. Differences in T-foil’s swing angles (2.4 Hz).
Jmse 11 01551 g008
Figure 9. Experimental setup of towing tank.
Jmse 11 01551 g009
Figure 10. Ship model towing tank.
Jmse 11 01551 g010
Figure 11. Four-degrees-of-freedom seaworthy instrument.
Jmse 11 01551 g011
Figure 12. Heave motion reduction by passive T-foil.
Jmse 11 01551 g012
Figure 13. Pitch motion reduction by passive T-foil.
Jmse 11 01551 g013
Figure 14. Bow acceleration reduction by passive T-foil.
Jmse 11 01551 g014
Figure 15. Vertical motion comparison as influenced by different motion signals.
Jmse 11 01551 g015
Figure 16. Time-record curves of model tests at λ = 6 m.
Jmse 11 01551 g016aJmse 11 01551 g016b
Figure 17. Heave response at different encounter frequencies.
Jmse 11 01551 g017
Figure 18. Pitch response at different encounter frequencies.
Jmse 11 01551 g018
Figure 19. Bow acceleration at different encounter frequencies.
Jmse 11 01551 g019
Table 1. Dimensions of the T-foil.
IndexValue
Airfoil shapeNACA0012
Wingspan/mm240
Chord length/mm100
Aspect ratio2.667
Max angle/(o)±10
Max angular velocity/(Hz)2.4
Length of vertical foil/mm60
Table 2. Main dimensions of the ship model.
IndexValue
Overall length/m3.833
Length of Waterline length/m3.616
Breadth/m0.758
Draught/m0.321
Displacement/kg259.7
Displacement (model)/kg152.4
Designed draft/m0.204
Table 3. Heave motion response (passive T-foil control).
λ (m)Encounter FrequencyBare
Ship
Passive
Control
%
312.860.03220.027713.98
410.070.19130.1768
58.540.55650.5157.46
67.390.93220.8657.21
76.551.14961.076.92
85.911.18611.1155.99
Table 4. Pitch motion response (passive T-foil control).
λ (m)Encounter FrequencyBare
Ship
Passive
Control
%
312.860.1710.14813.45
410.070.540.47512.04
58.541.1251.0377.82
67.391.6051.4827.66
76.551.8511.727.08
85.911.9051.7856.30
Table 5. Bow acceleration response (passive T-foil control).
λ (m)Encounter FrequencyBare
Ship
Passive
Control
%
312.860.04670.0414.35
410.070.11140.1019.34
58.540.19250.1787.53
67.390.22880.21157.56
76.550.2170.2026.91
85.910.18070.17055.64
Table 6. Comparison of heave motions among different signals.
Wavelength
λ/m
Encounter Frequency
ωe/rad
Response in Passive Control
/m
Response in Angle Control
/m
Response in Angular Velocity Control/mResponse in Angular
Acceleration Control/m
Anti-Heave Effect/%
Angle ControlAngular Velocity ControlAngular Acceleration. Control
312.860 0.020 0.028 0.025 0.028 11.303 28.195 −0.802
58.540 0.418 0.515 0.455 0.455 11.682 18.913 11.604
67.390 0.730 0.865 0.795 0.823 8.062 15.618 4.808
Table 7. Comparison of pitch motions among different signals.
Wavelength
λ/m
Encounter Frequency
ωe/rad
Response in Passive
Control
/m
Response in Angle
Control
/m
Response in Angular Velocity Control/mResponse in Angular Acceleration Control/mAnti-Heave Effect/%
Angle ControlAngular Velocity ControlAngular Acceleration. Control
312.8600.040 0.054 0.045 0.054 15.747 25.811 −0.789
58.5400.512 0.626 0.552 0.550 11.829 18.228 12.100
67.3900.910 1.074 0.981 1.117 8.612 15.283 −4.009
Table 8. Comparison of bow acceleration among different signals.
Wavelength
λ/m
Encounter Frequency
ωe/rad
Response in Passive
Control
/m
Response in Angle
Control
/m
Response in Angular Velocity Control/mResponse in Angular Acceleration Control/mAnti-Heave Effect/%
Angle ControlAngular Velocity ControlAngular Acceleration. Control
312.860.0290.0400.0350.03613.57527.7759.395
58.540.1440.1780.1560.15512.10819.35412.773
67.390.1770.2120.1940.1988.23916.4686.286
Table 9. Control parameter C values.
λ
(m)
C2
(kg∙m2/(s∙rad))
C1
(kg∙m2/(s2∙rad))
C3
(kg∙m2/(rad))
337.522 634.031 2.705
426.213 ------
516.143 184.188 2.234
615.183 157.068 2.967
717.661 --- ---
817.853 --- ---
Table 10. Anti-heave motion effect of a monohull with active T-foil.
λ (m)Encounter
Frequency
Active
Control
Passive
Control
Bare
Ship
Anti-Vertical Motion Effect
Active%Passive%
312.860.0200.0280.03238.23013.975
410.070.1380.1760.19128.1137.998
58.540.4180.5150.55724.9607.457
67.390.7300.8650.93221.7017.209
76.550.9141.0701.15020.5386.924
85.910.9521.1151.18619.7205.994
Table 11. Anti-pitch motion effect of a monohull with active T-foil.
λ (m)Encounter
Frequency
Active
Control
Passive
Control
Bare
Ship
Anti-Vertical Motion Effect
Active%Passive%
312.860.1100.1480.17135.78913.450
410.070.3630.4750.54032.83312.037
58.540.8481.0371.12524.6247.822
67.391.2561.4821.60521.7767.664
76.551.4551.7201.85121.3787.077
85.911.5081.7851.90520.8196.299
Table 12. Anti-bow acceleration effect of a monohull with active T-foil.
λ (m)Encounter
Frequency
Active
Control
Passive
Control
Bare
Ship
Anti-Vertical Motion Effect
Active%Passive%
312.860.0290.040 0.047 38.137 14.347
410.070.0820.101 0.111 26.320 9.336
58.540.1440.178 0.193 25.429 7.532
67.390.1770.212 0.229 22.784 7.561
76.550.1720.202 0.217 20.783 6.912
85.910.1460.171 0.181 19.065 5.645
Disclaimer/Publisher’s Note: The statements, opinions and data contained in all publications are solely those of the individual author(s) and contributor(s) and not of MDPI and/or the editor(s). MDPI and/or the editor(s) disclaim responsibility for any injury to people or property resulting from any ideas, methods, instructions or products referred to in the content.

