Article

Analysis of Flow and Runner Dynamic Response Characteristics under Pump Conditions of Variable-Speed Pump Turbine

1
Department of Energy and Power Engineering, Xihua University, Chengdu 610039, China
2
Huaneng Clean Energy Research Institute, Beijing 102209, China
3
Hebei Fengning Pumped Storage Energy Co., Ltd., Chengde 067000, China
4
Department of Energy and Power Engineering, Tsinghua University, Beijing 100084, China
*
Author to whom correspondence should be addressed.
J. Mar. Sci. Eng. 2023, 11(8), 1493; https://doi.org/10.3390/jmse11081493
Submission received: 17 June 2023 / Revised: 12 July 2023 / Accepted: 24 July 2023 / Published: 26 July 2023
(This article belongs to the Special Issue Advancement in the Multiphase Flow in Fluid Machinery)

Abstract

:
Pumped storage power stations can ensure the safe operation of the grid, as well as utilize clean energy sources to establish a low-carbon, safe, and efficient energy system. As pump turbines, the core components of pumped storage power plants, become more and more popular, the technical requirements for hydraulic design begin to improve year by year. However, when the unit operates far beyond the optimal range, the variable-speed pump turbine can overcome the shortcomings of the fixed-speed unit and solve the problem of unstable operation under partial load. The pressure pulsation of the unit in the pump condition is investigated by numerical simulation, analyzing the hydraulic thrust, and studying the dynamic response characteristics of the runner at a maximum speed of 456.5 rpm. Comparing the pressure pulsation amplitude of various components in the entire flow passage, the highest values of pressure pulsation were found in the runner and vaneless space. The axial hydraulic thrust has a fluctuation range between 174t and 198t and 0t to 40t for radial force. As per the structural analysis, it has been observed that the runner demonstrates uneven patterns in both its axial and radial deformations, with deformation mainly concentrated in radial displacement and stress distribution mainly concentrated on the blades near the crown. The dynamic stress amplitude of the runner at monitoring point S1 (located on the runner blade near the crown) is 37 MPa. This stress has a dominant frequency of 4.8fn, while the monitoring point S2 (located on the runner blade near the band) is 4 MPa, and the dominant frequency is 1.8fn. Using these findings, the design of the variable-speed pump turbine’s runner can be optimized, and the unit’s stable and secure operation can be guided accordingly.

1. Introduction

Pumped storage is the largest and most cost-effective energy storage method on the market today [1], and it plays several crucial roles in modern power regulation systems, such as regulating peaks with valleys, ensuring frequency and phase regulation, providing emergency backup in case of accidents, and facilitating black start in modern power systems [2]. Similarly, due to the advantages of flexible operation, rapid response, and providing high-quality power supply, the establishment of pumped storage power stations has become a key measure for building a clean, efficient, and safe modern energy system [3]. As is well known, the pump turbine serves as a vital component of pumped storage units and serves as the primary mechanism for energy conversion. Many researchers are working to improve the hydraulic design technology of pump turbines to improve the efficiency of energy conversion [4,5].
During periods of low electricity demand, in pumped storage power plants, pump turbine units operate as pumps to move water from a lower reservoir to an upper reservoir. This process converts electrical energy (which is used to power the pumps) into potential energy stored in the water. However, the complex conversion process between pump operating conditions and turbine operating conditions makes it difficult to balance stability and efficiency. Therefore, the design and operation of large pumped storage units require careful consideration to ensure efficient and safe operation [6]. Currently, fixed-speed pump turbines are effective solutions to frequent unit starts and stops, as well as sudden changes in operating conditions, load fluctuations, and management peaks [7]. However, they have inherent limitations, such as a lack of adjustable pumping power and lower efficiency during turbine operation. This limits their ability to respond quickly to changes in grid demand conditions. Implementing variable speed for pump turbines can improve their efficiency and enhance their automatic frequency regulation capabilities during pumping operations. This can result in higher efficiency and improved system stability [7,8]. The variable-speed pump turbine, like the fixed-speed water pump turbine, is subject to various forces that affect its stability during operation, including hydraulic thrust, mechanical forces, and electromagnetic forces. Among these forces, the stability of the unit is most affected by the hydraulic thrust [9]. As an illustration, axial hydraulic thrust can cause various problems, such as the high temperature of the thrust bearing, increased stress levels, and deformation of the generator frame [10,11]. In addition to hydraulic thrust, pressure pulsation characteristics are also a key parameter for evaluating the safe and stable operation of equipment, and it has been found that both the values of hydraulic thrust and pressure pulsation tend to vary with speed variations. Therefore, studying hydraulic thrust and pressure pulsation in the flow passage under pumping conditions can help ensure the unit’s safety and structural strength in hydraulic design.
Currently, research on pressure pulsation and hydraulic thrust of pump turbines is mostly focused on fixed-speed units. As an illustration, Svarstadand and Nielsen [12] measured the pressure pulsation variation in reversible pump turbines, both in the laboratory and in the field, when transitioning from the pump to turbine conditions and found that the highest-pressure pulsation amplitude occurred at the back pump condition. Liao et al. [13] investigated the low compressibility of water and simulated the steady and unsteady internal flow under turbine conditions and found that under the condition of a small blade opening, large pressure fluctuations were observed in both the bladeless zone and the draft tube [14]. Through these studies, we can conclude that the pressure fluctuation in the vaneless area and in the draft tube is the highest. However, due to the disadvantage of traditional fixed-speed pumped storage units under pump conditions [15], more and more scientists are turning their attention to variable-speed pump turbines. Pavesi et al. [16] conducted three-dimensional transient numerical simulations to study unstable behavior resulting from reduced pumping power. The researchers reduced rotational speed from 100% to 80% to investigate the onset and development of unsteady phenomena. I Iliev et al. [17] tested the pressure pulsation in variable-speed operation mode and obtained a 1% increase in its efficiency compared to the optimal head pump turbine, operation at synchronous speed. Several studies have demonstrated that variable-speed operation mode can be an effective way to boost the operating efficiency of pump turbines. In addition to examining the characteristics of pressure pulsation with variable-speed pump turbines, we also reviewed the relevant literature on the impact of hydraulic thrust on the stability of pumped storage units. The axial hydraulic thrust is applied to the runner, and the increased load and friction loss result from the larger axial hydraulic thrust [18]. During the operation of the pump, due to the uneven pressure distribution in the spiral case compared to the working condition of the turbine, a large radial force will be generated. This radial hydraulic thrust changes with the operating condition and has a certain degree of randomness. Mao et al. [19] used numerical simulation to study transient processes in pump turbines and concluded that the continuous reduction in the axial hydraulic thrust is beneficial to the increase in the rotational speed and also to the operational stability of the unit. Kong et al. [10] identified that axial hydraulic thrust might cause resonance during startup and shutdown. These studies indicate that hydraulic thrust has a significant impact on the pump turbine, but there is currently little research on the radial force, and there has not been a comprehensive assessment conducted yet regarding the influence of rotational speed on hydraulic thrust and pressure pulsation.
The selection of a numerical model is essential to the study of both pressure pulsation and hydraulic thrust [20,21,22]; over the years, scientists have been working on new computational models to achieve more reliable and accurate results [23,24]. The Reynolds time-averaged method (RANS) based on the k - ω turbulence model has not only high computational accuracy but also high computational efficiency in the calculation of pump turbine flow field, so it is recommended to be used in the analysis of pump turbine non-constant flow [25,26,27,28]. So for this experiment, the same computational model was selected for numerical simulation research.
The response of the structure’s dynamics is commonly employed to establish the level of stress and deformation within the structure. The fatigue resistance of the runner is directly proportional to the magnitude of the dynamic stress experienced [29]. He et al. [30] observed the effect of gap on the dynamic stress of the runner and proposed an improved one-way fluid–solid coupling method (ASOW-FFI) based on acoustic–solid coupling, which was found to lead to a significant improvement in its computational accuracy near the resonance point using this method. Egusquiza et al. [31] utilized a combination of numerical simulations and experimental approaches to learn the effect of the additional mass of the fluid on the dynamic stress of the runner. However, the stress distribution and displacement on the runner of variable-speed pump turbines have not been researched in the above literature, so this calculation fills some research gaps.
By reviewing the relevant references, there have been some advances in research on pressure pulsation and hydraulic thrust of pump turbines; however, two research gaps in fact still exist. First, most of the current research on pump turbines is focused on the fixed-speed unit, and few people have studied the effect of rotational speed on pump turbines. Secondly, the pressure pulsation changed characteristics, and the evolution of the pressure pulsation is captured in the simulation and experiment of the pump condition, but the interaction mechanism between the pressure pulsation and the hydraulic thrust of the pump turbine when the speed is changed remains to be revealed. The innovation of the study is the influence of the rotational speed on the pressure pulsation, hydraulic thrust, and dynamic response of the runner under pumping conditions, which is different from that of the fixed-speed unit. In addition, their formation mechanisms and effects on variable-speed pump turbines are revealed.
The rest of the paper is organized as follows: Section 2 introduces the model used for calculation, grid division, monitoring point distribution, numerical calculation methods, and boundary condition settings for studying pressure pulsation characteristics and hydraulic thrust under pump operating conditions are introduced, along with the numerical model and basic settings for studying the runner dynamic response. Section 3 shows the streamlined diagram of the internal flow field, pressure distribution on the runner surface, and the results of numerical simulation analysis for pressure pulsations, hydraulic thrust, and runner dynamic stress at each monitoring point. In Section 4 of this paper, conclusions drawn from the research are presented, along with suggestions for future research directions.

2. Numerical Simulation Approach and Validation

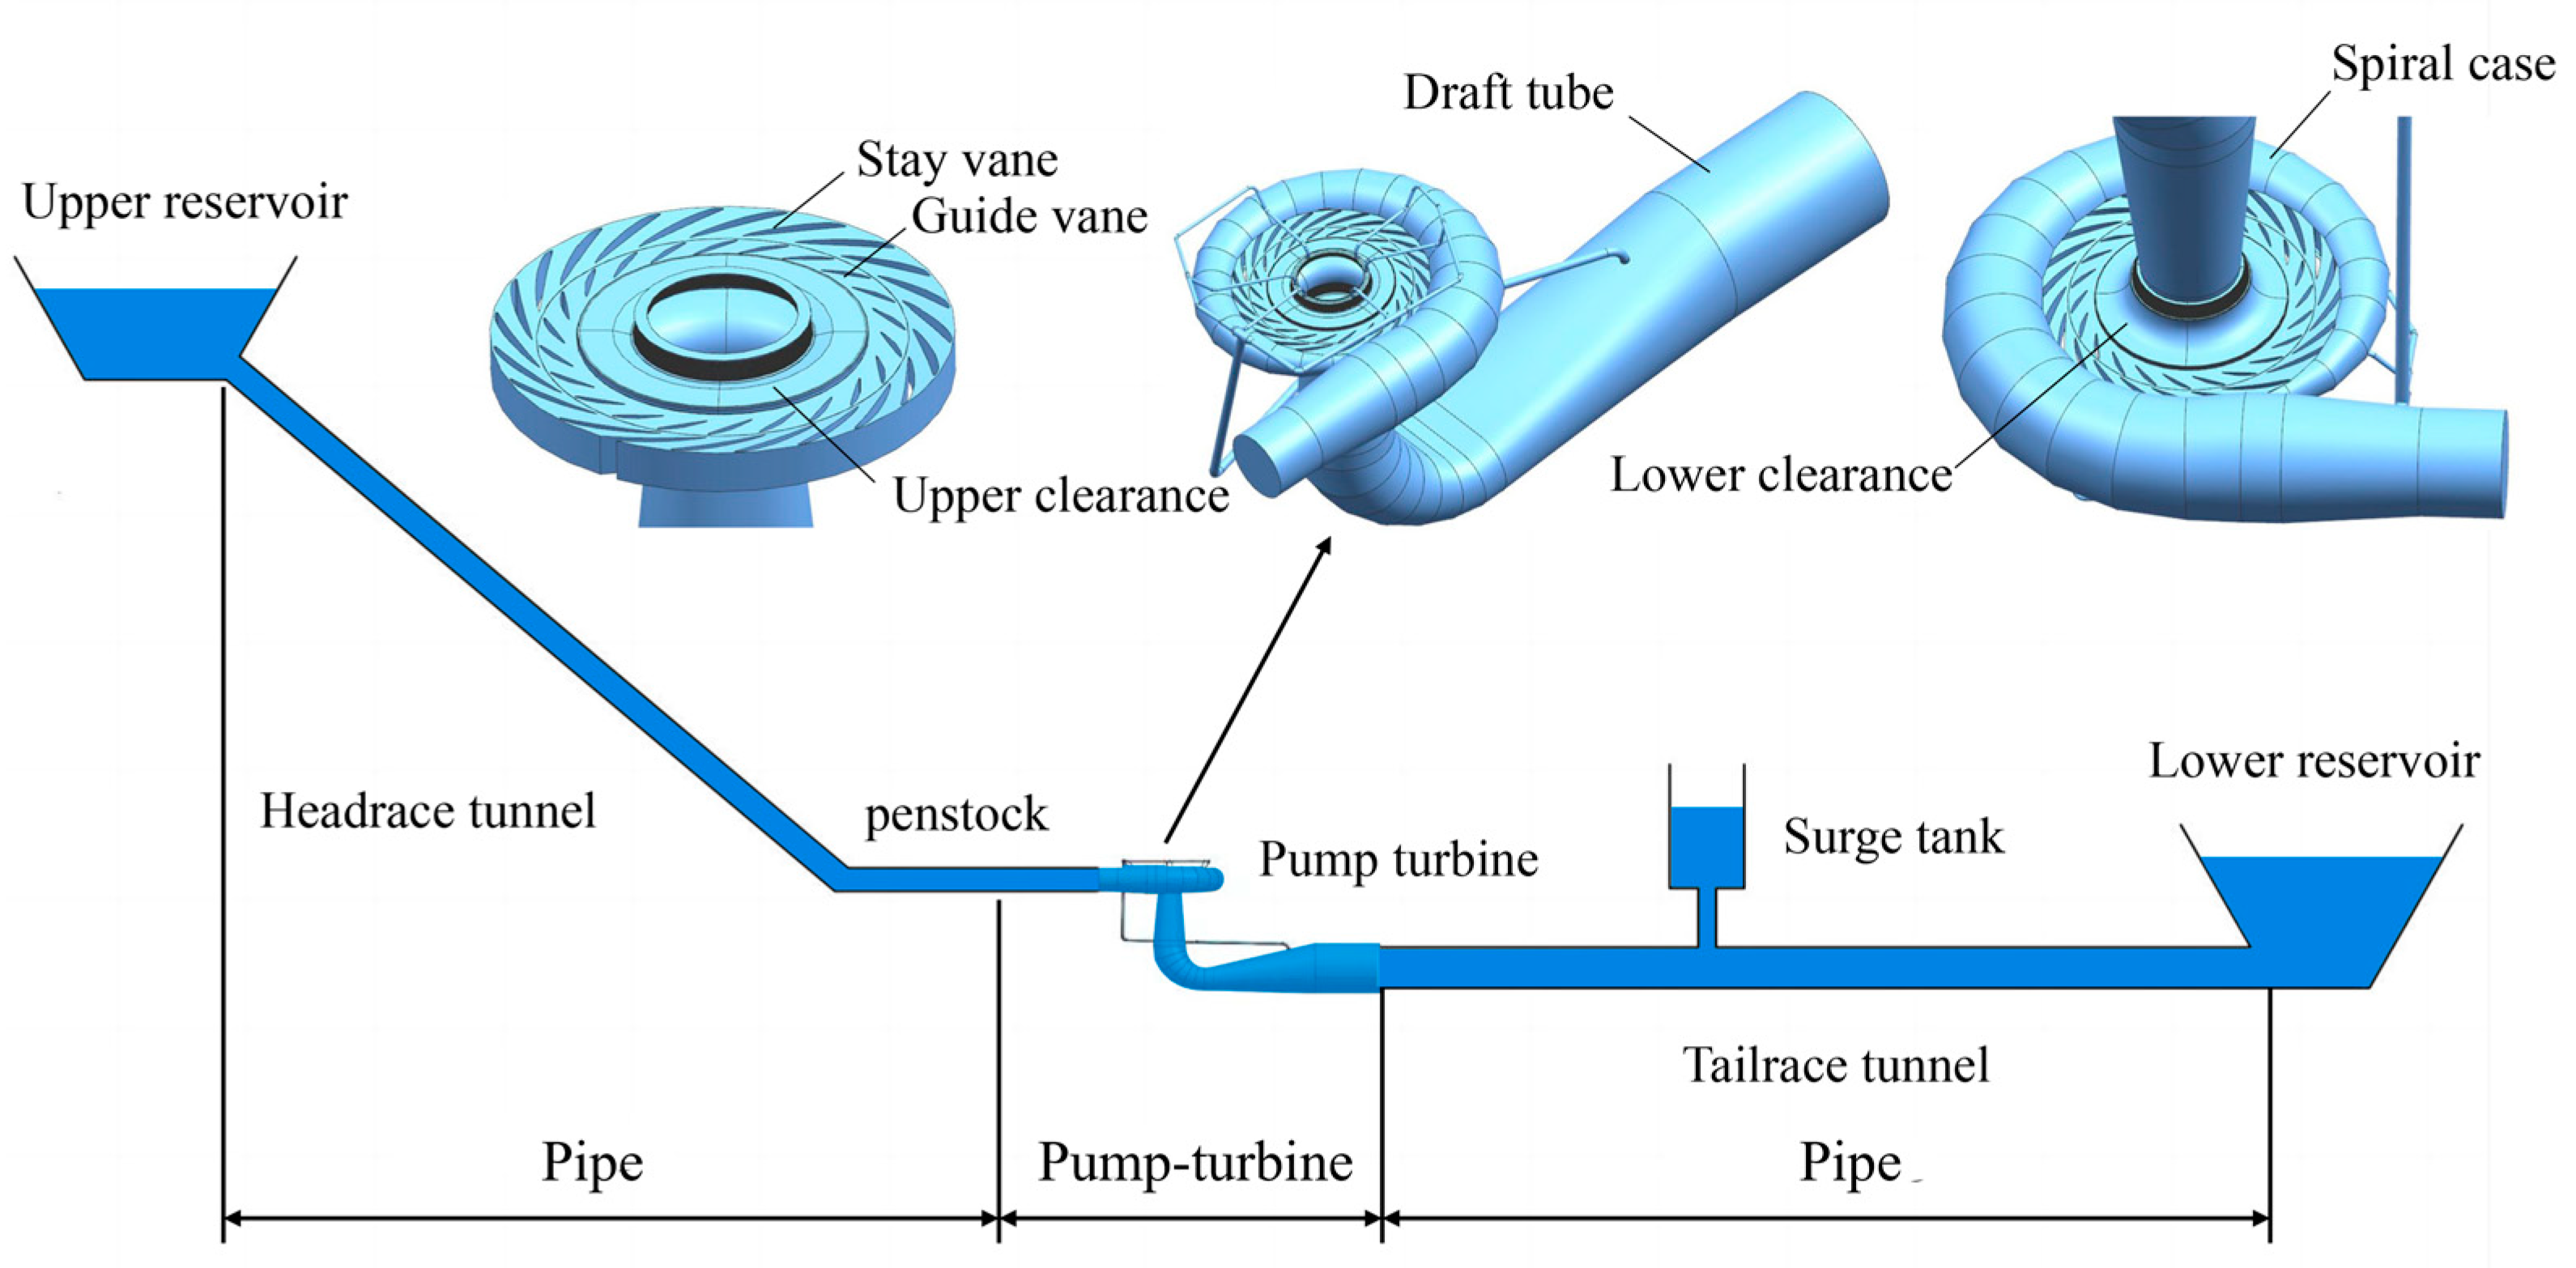
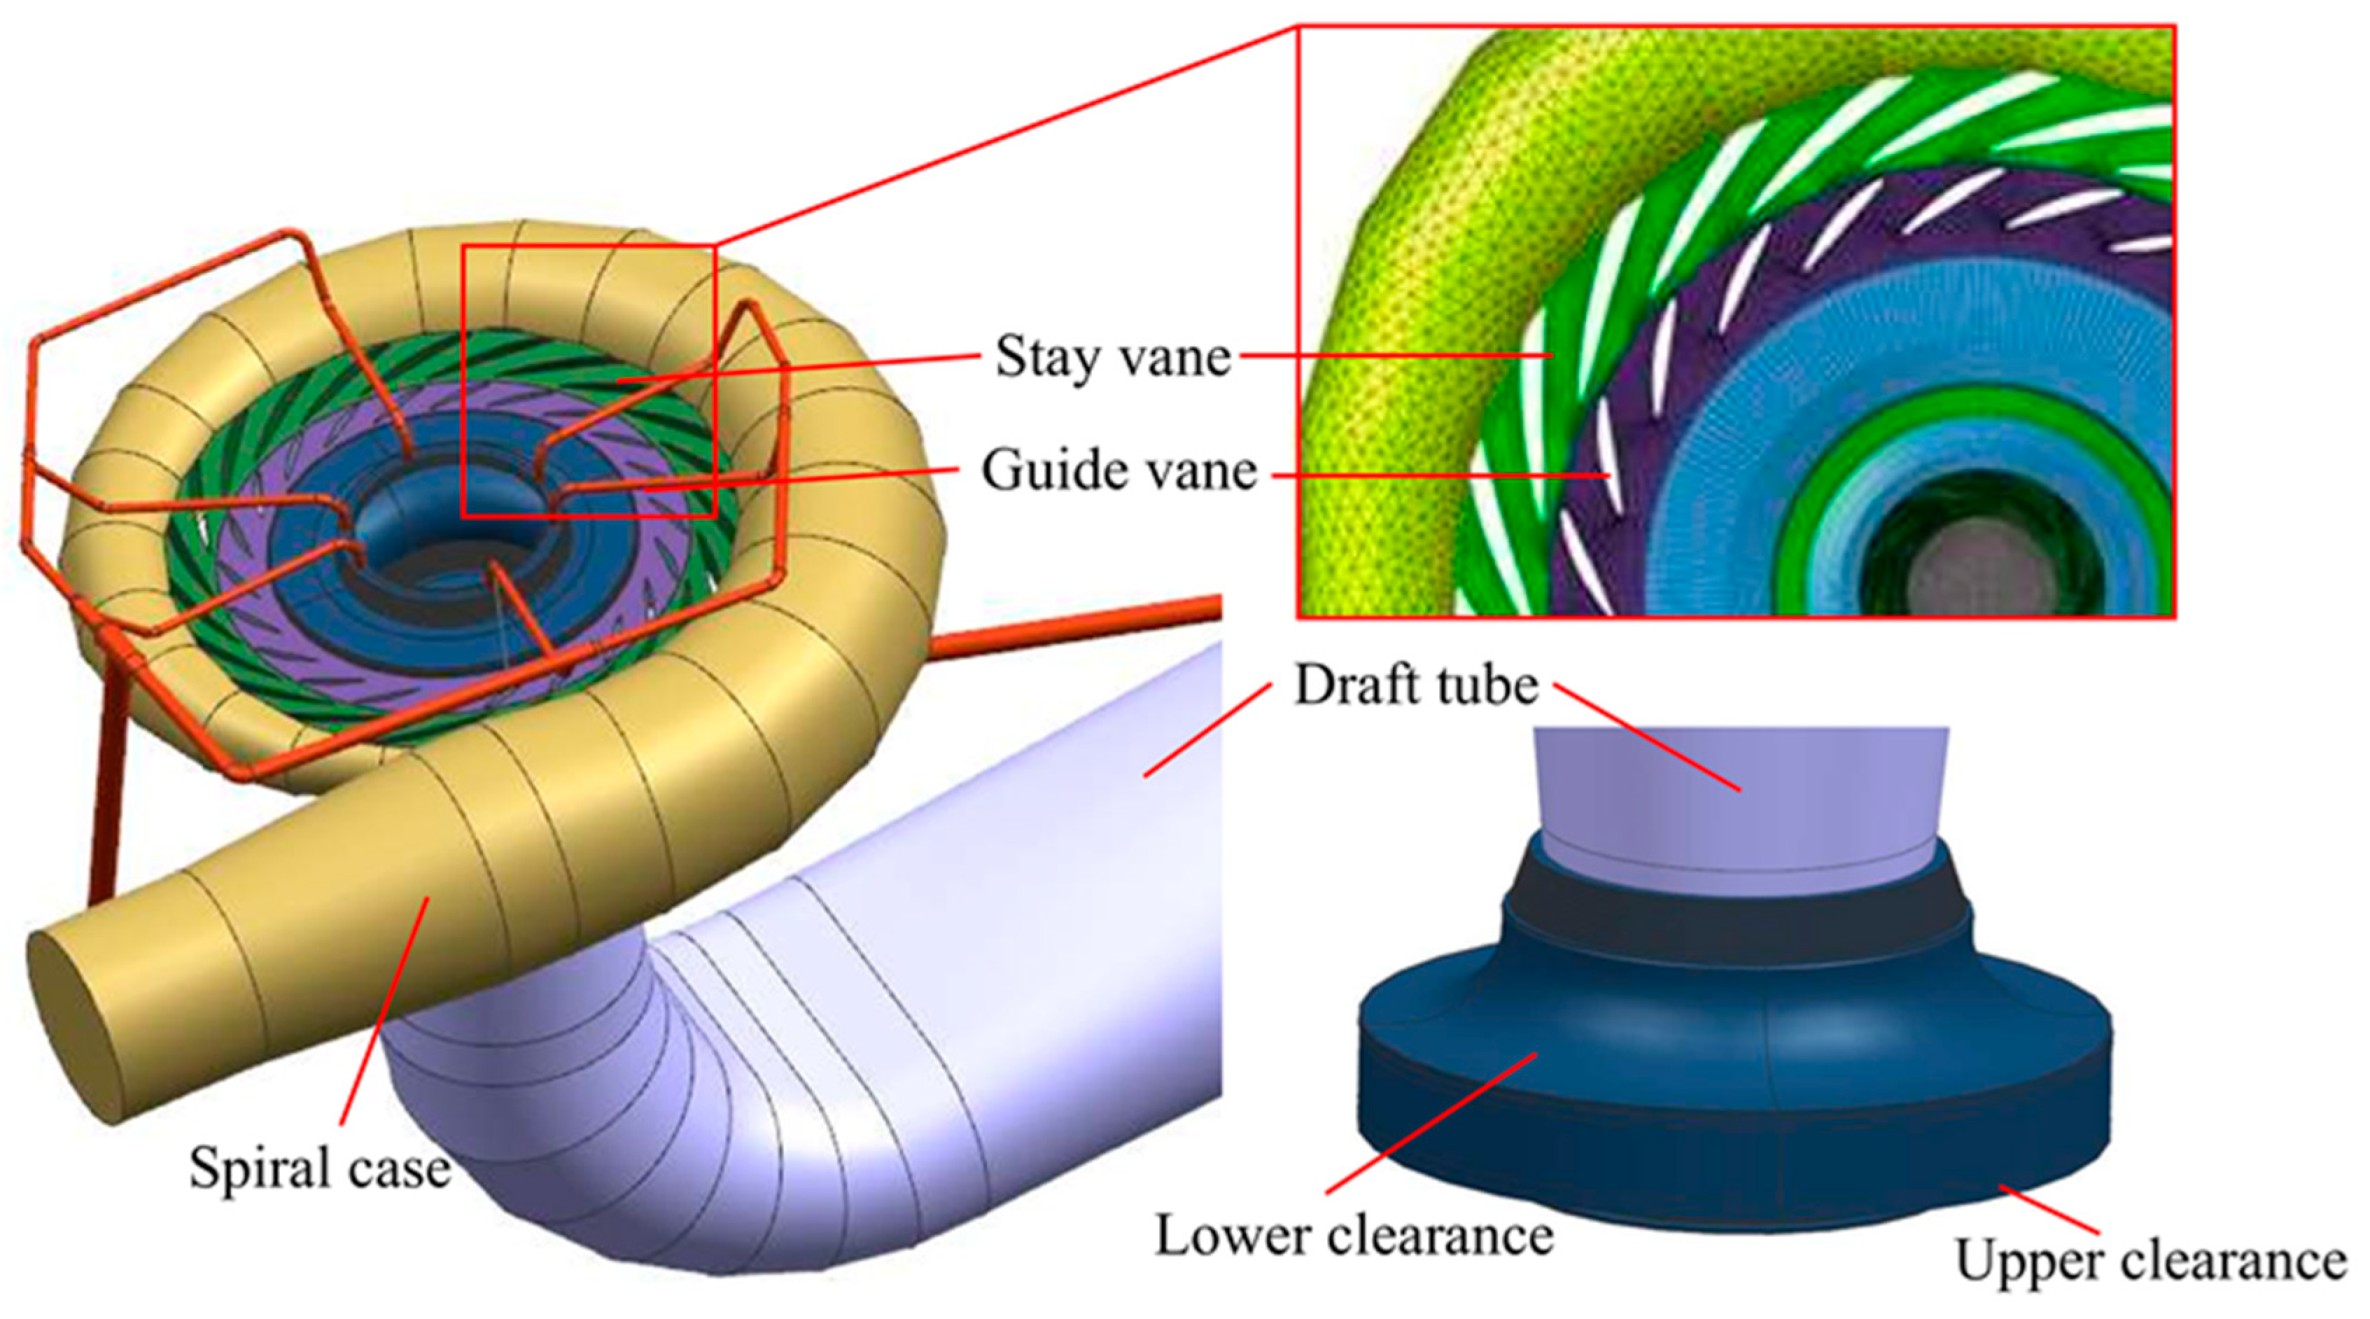
2.1. Geometry Model and Flow Governing Equations

In this work, the variable-speed pump turbine fluid region of a pumped storage power station is illustrated in Figure 1. The whole longest of the upstream tunnel pipe of the entire power station is 1101.9 m, and the total length of the downstream tunnel pipe is 857 m. The variable-speed pump turbine in the core area includes a spiral case, draft tube, guide vane, stay vane, crown, band, runner, and a pressure balance pipe. Under the pump condition of variable-speed pump turbine, the fluid flows out of the spiral case through the draft tube, stay vanes, guide vanes, and runner. The model used in this paper has a pressure balance tube installed at the crown gap to reduce the axial hydraulic thrust [32,33]. The relevant design parameters of the variable-speed pump turbine are shown in Table 1, with specific flow rate Q11 and specific speed n11 used to represent operating conditions. n11 is the rotating speed calculated using unit runner diameter and unit head in Equation (1), and Q11 is the flow rate calculated using per unit runner diameter D and per unit head H in Equation (2).
n 11 = n D H
Q 11 = Q D 2 H

2.2. Numerical Setup and Boundary Conditions

The SST k − ω model was chosen because it diminishes the need for dense meshing close to the walls, which helps prevent the solution results from being sensitive to the mass of the nearby wall meshes, thus making its turbulence calculations more inclusive and convergent and also providing some robustness in the computational process [26,27]. The unsteady turbulent flow inside the pump turbine was described by adopting the continuity equation and momentum equation (Equations (3) and (4)).
u i ¯ x i = 0
u i ¯ t + ρ u j ¯ u i ¯ x j = ρ f j p ¯ x i + μ u i ¯ x j ρ u i u j ¯ x j
where  u i ¯ x i f i ,   ρ u i u j ¯ , ρ, and  p ¯  represent the averaged flow velocity, the turbulent flow, the body forces acting on the unit volume fluid, water density, and the averaged pressure. The RANS equation for the SST k − ω model can be written as (Equations (5) and (6)):
ρ k t + ρ u i k x i = P k 3 2 l k ω + μ + σ k μ t k x i x i
ρ ω t + ρ u i ω x i = C ω P β ρ ω 2 + μ l + σ ω μ t ω x i x i + 2 1 F 1 ρ σ ω 2 ω k x i ω x i
where  l k ω = k 1 2 β k ω   μ , P C ω , and  F 1  represent the turbulence scale, the dynamic viscosity, the production term, the production term coefficient, the blending function, and  σ k σ ω , and  β k    are model constants.
Set the model inlet as a pressure type boundary to yield the total pressure, and the outlet was set to the flow type boundary to yield a mass flow rate. The guide vane opening was 21.19°. In the fluid domain, all walls were configured as no-slip walls, and data transmission interfaces were established at the junction of each two components. Meanwhile, the interfaces of the other fixed components were defined as static-static interfaces, the runner domain was set as the rotating domain, and the rotational speed was set to −456.5 rpm. In the stable frame calculation, the initial flow field of the transient simulation is obtained on the basis of the results of the steady simulation. The time step was set as 0.00078 s, with a total time of 0.91 s. We set the convergence residuals of each quantity were ≤10−4.
The monitoring point positions used to measure pressure pulsation are shown in Figure 2.

2.3. Gird Generation

The accuracy of the numerical simulation performance is determined by the rationality of the grid division. In this numerical simulation, a combination of tetrahedral unstructured mesh and hexahedral structured mesh is used to ensure accuracy and save time and cost. A hybrid grid consisting of a hexahedral grid and a tetrahedral grid is used for the guide vane, stay vane, crown gap, and pressure balance tube. Hexahedral meshes are used for draft tubes, runners, and spiral cases. The final grid number is 4,389,241, and the final grid generation scheme depicting the entire fluid domain is showcased in Table 2. The focus in pump mode should be in the bladeless space, so in Figure 3, the distribution of the mesh details around the runner, stay/guide vanes, and the spiral case are shown.

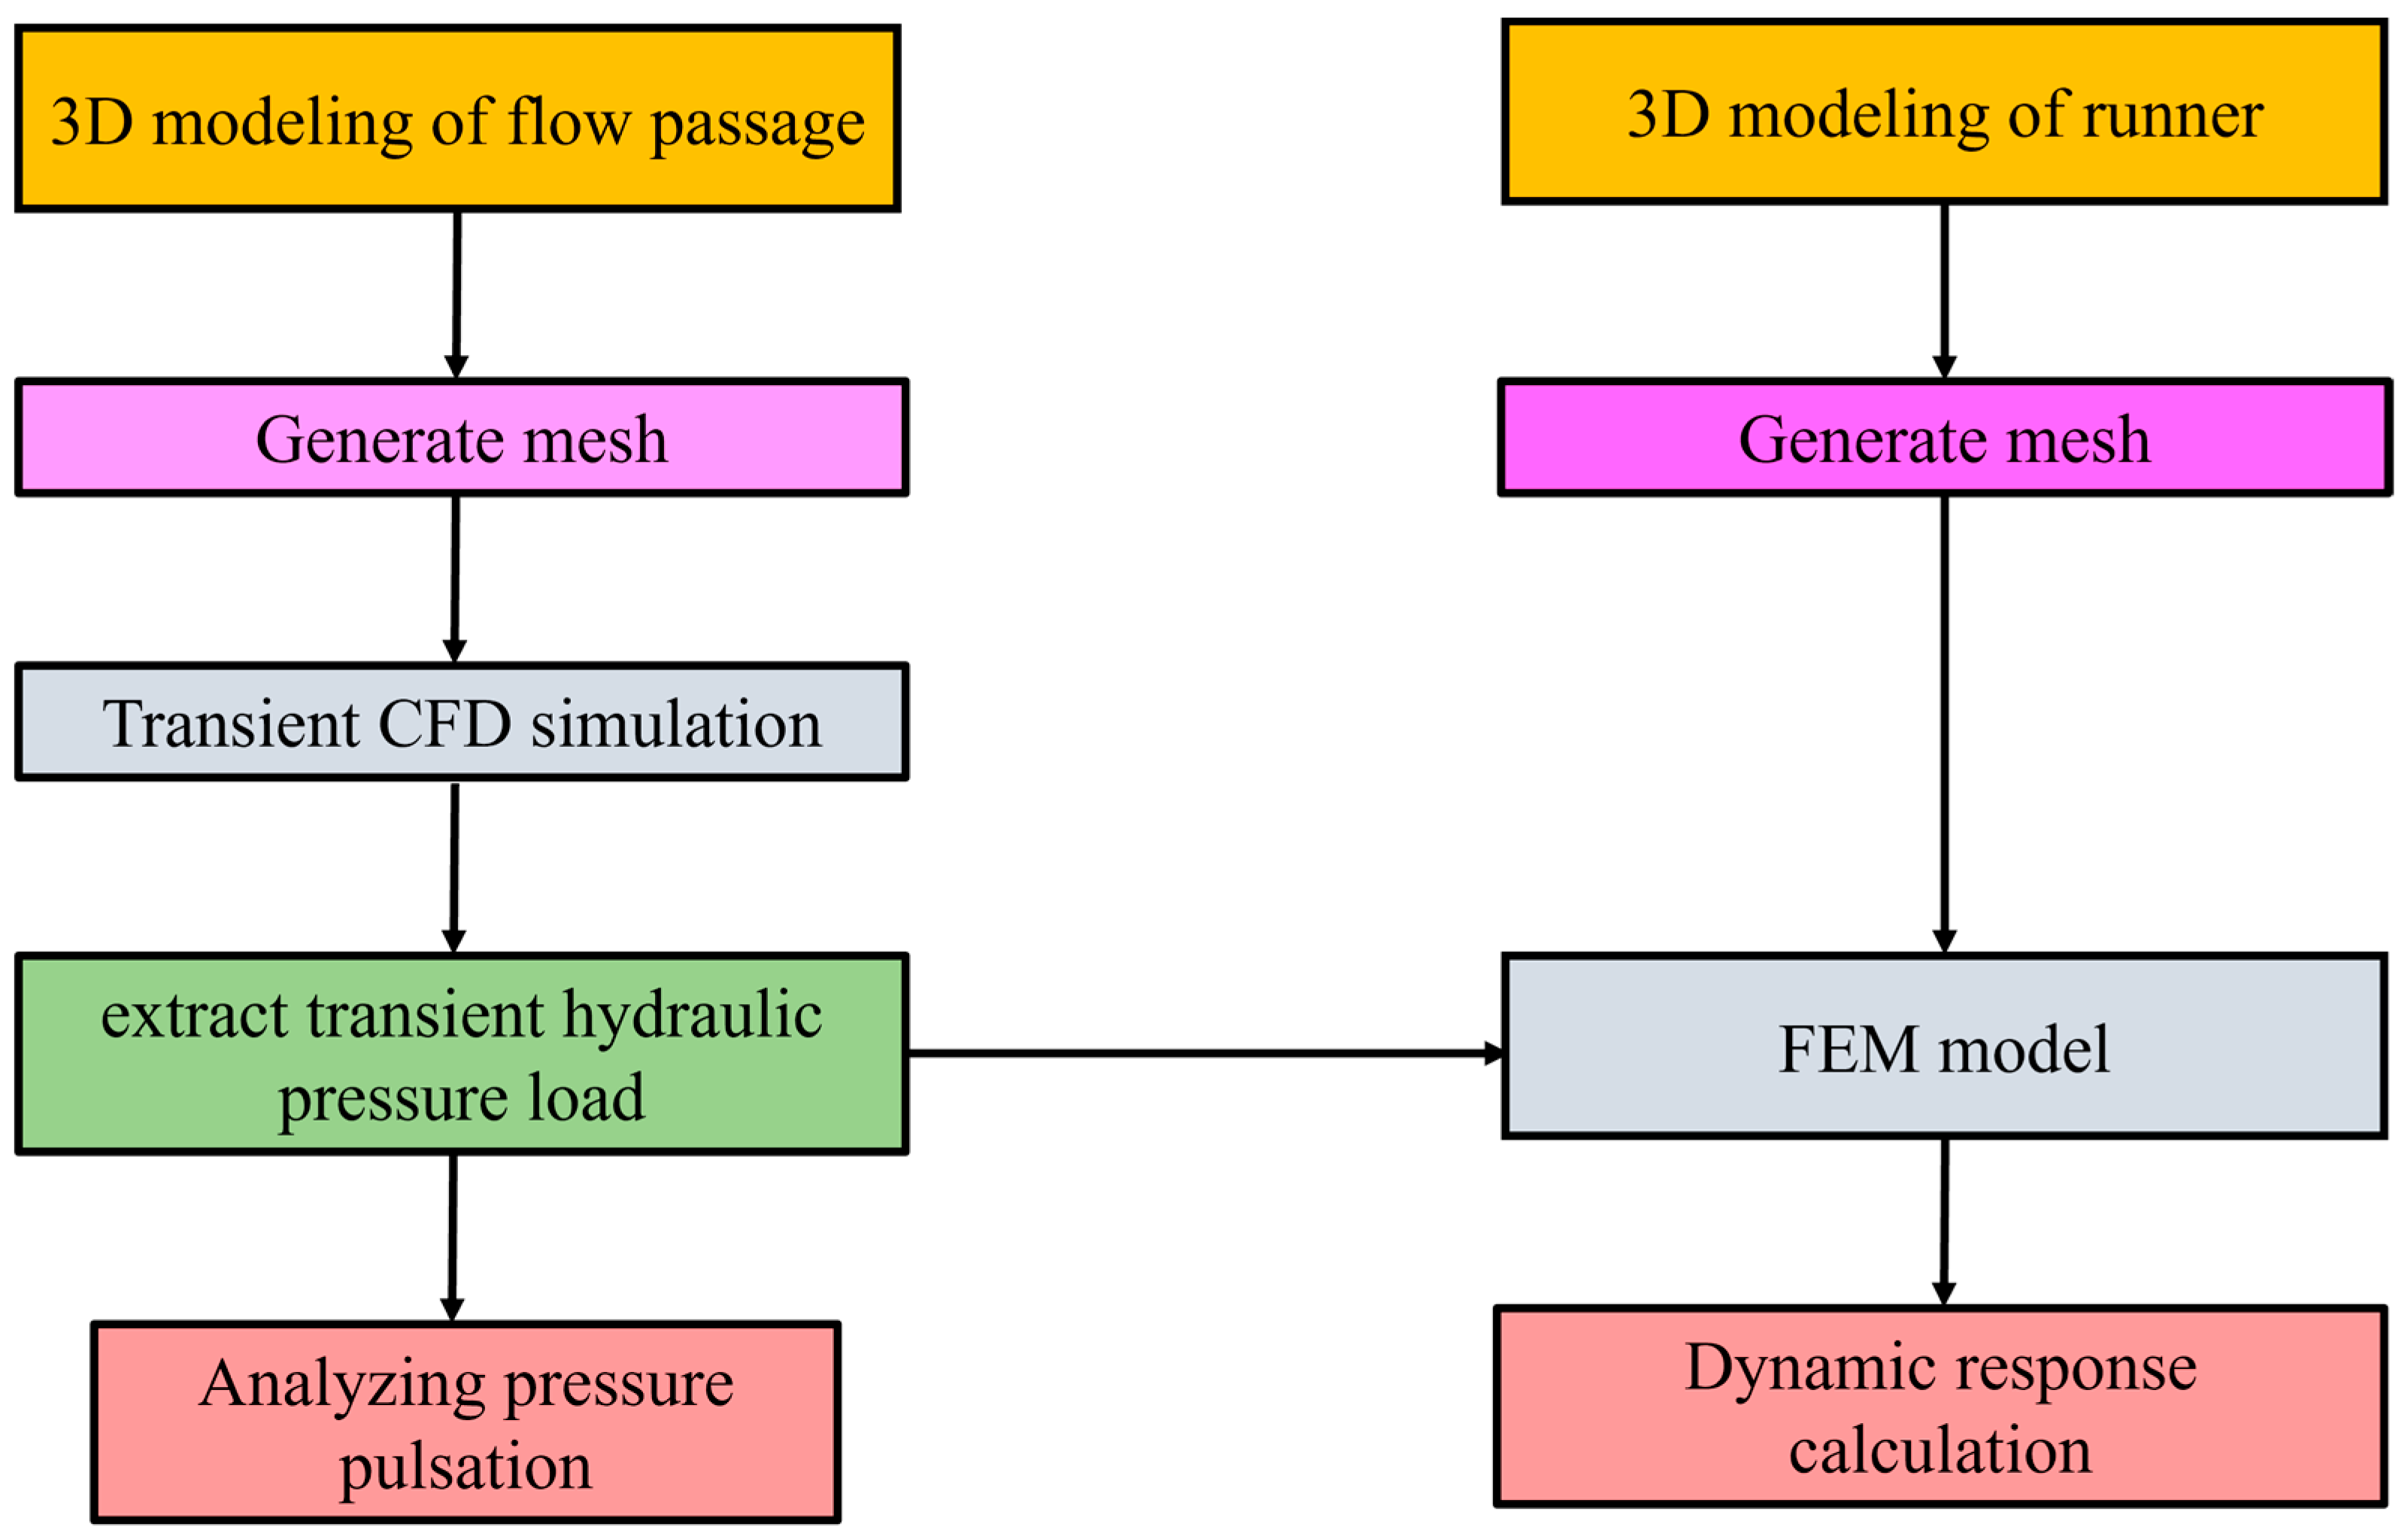
2.4. Dynamic Response Analysis Methods

The flowchart of the work is shown in Figure 4.
The structural dynamics equation for a linear system can be expressed as:
M s u ¨ t + C s u t + K s u t = F t ˙
where  M s    is the mass matrix of the structural system,  C s    is the damping matrix of the structural system,  K s  is the stiffness matrix of the structural system, u(t) is the nodal displacement vector, and F(t) is the external excitation force and also the external water pressure.
ANSYS APDL was utilized to compute the dynamic response characteristics of the runner, where the material of the runner was structural steel, which had a theoretical density of 7860 Kg/m3, Young’s modulus was 200 GPa, and Poisson’s ratio was 0.3. The runner’s stress level was evaluated using equivalent von Mises stress, with a gravitational acceleration of 9.8 m/s2. Fourth strength theory was used to calculate the runner’s level of stress:
σ = 1 2 σ 1 σ 2 2 + σ 2 σ 3 2 + σ 3 σ 1 2

3. Results and Discussion

3.1. Hydraulic Performance

The accuracy of the numerical simulation results was verified using standard design performance parameters. Table 3 was used to compare the design performance parameters with the hydraulic performance as determined by the numerical simulation results. The maximum error is less than 4.2%, which proves that the SST k − ω turbulence model selected for this numerical simulation is feasible.
The pressure distribution on the runner surface, crown surface, and surface of the band is presented in Figure 5, where the pressure is uniformly distributed on the circumference. The pressure value on the runner gradually increases from the inner edge of the circumference to the outer edge, and the maximum value can attain about 7 MPa. The pressure distribution on both the crown and the band surfaces is comparable to that observed on the runner surface, which is also evenly distributed in the circumferential direction and gradually increases from the inner edge of the circumference to the outer edge. It can be observed that both the crown and the band have the greatest pressure near the outer edge of the circumference, which can reach 6 MPa.
The pressure distribution on the runner surface during one rotation cycle is shown in Figure 6, where T is approximately 0.1314 s. Pressure variation is stable during one rotation cycle. It can be seen that the pressure distribution on the surface of the runner does not change much during the rotation of the runner with time.
Figure 7 shows the streamline, where water flows into the flow passage through the draft tube and out through the spiral case under pump conditions at a speed of 456.5 rpm and the guide vane opening of 21.19°. We can see that the streamline in the draft tube is smooth, while there is a vortex rope in the spiral case. To further observe the flow passage streamline, the streamline diagram is established in the x-y plane of the stay vane. In Figure 8, we can observe that the streamline inside the runner is smooth, indicating that there is no turbulence or recirculation of the fluid, only the flow separation in the stay vane flow passage, which leads to a vortex in the stay vane flow passage. Moreover, the flow velocity in the bladeless area is the largest, and the bladeless area is also one of the most unstable flow areas of the unit under pump conditions.

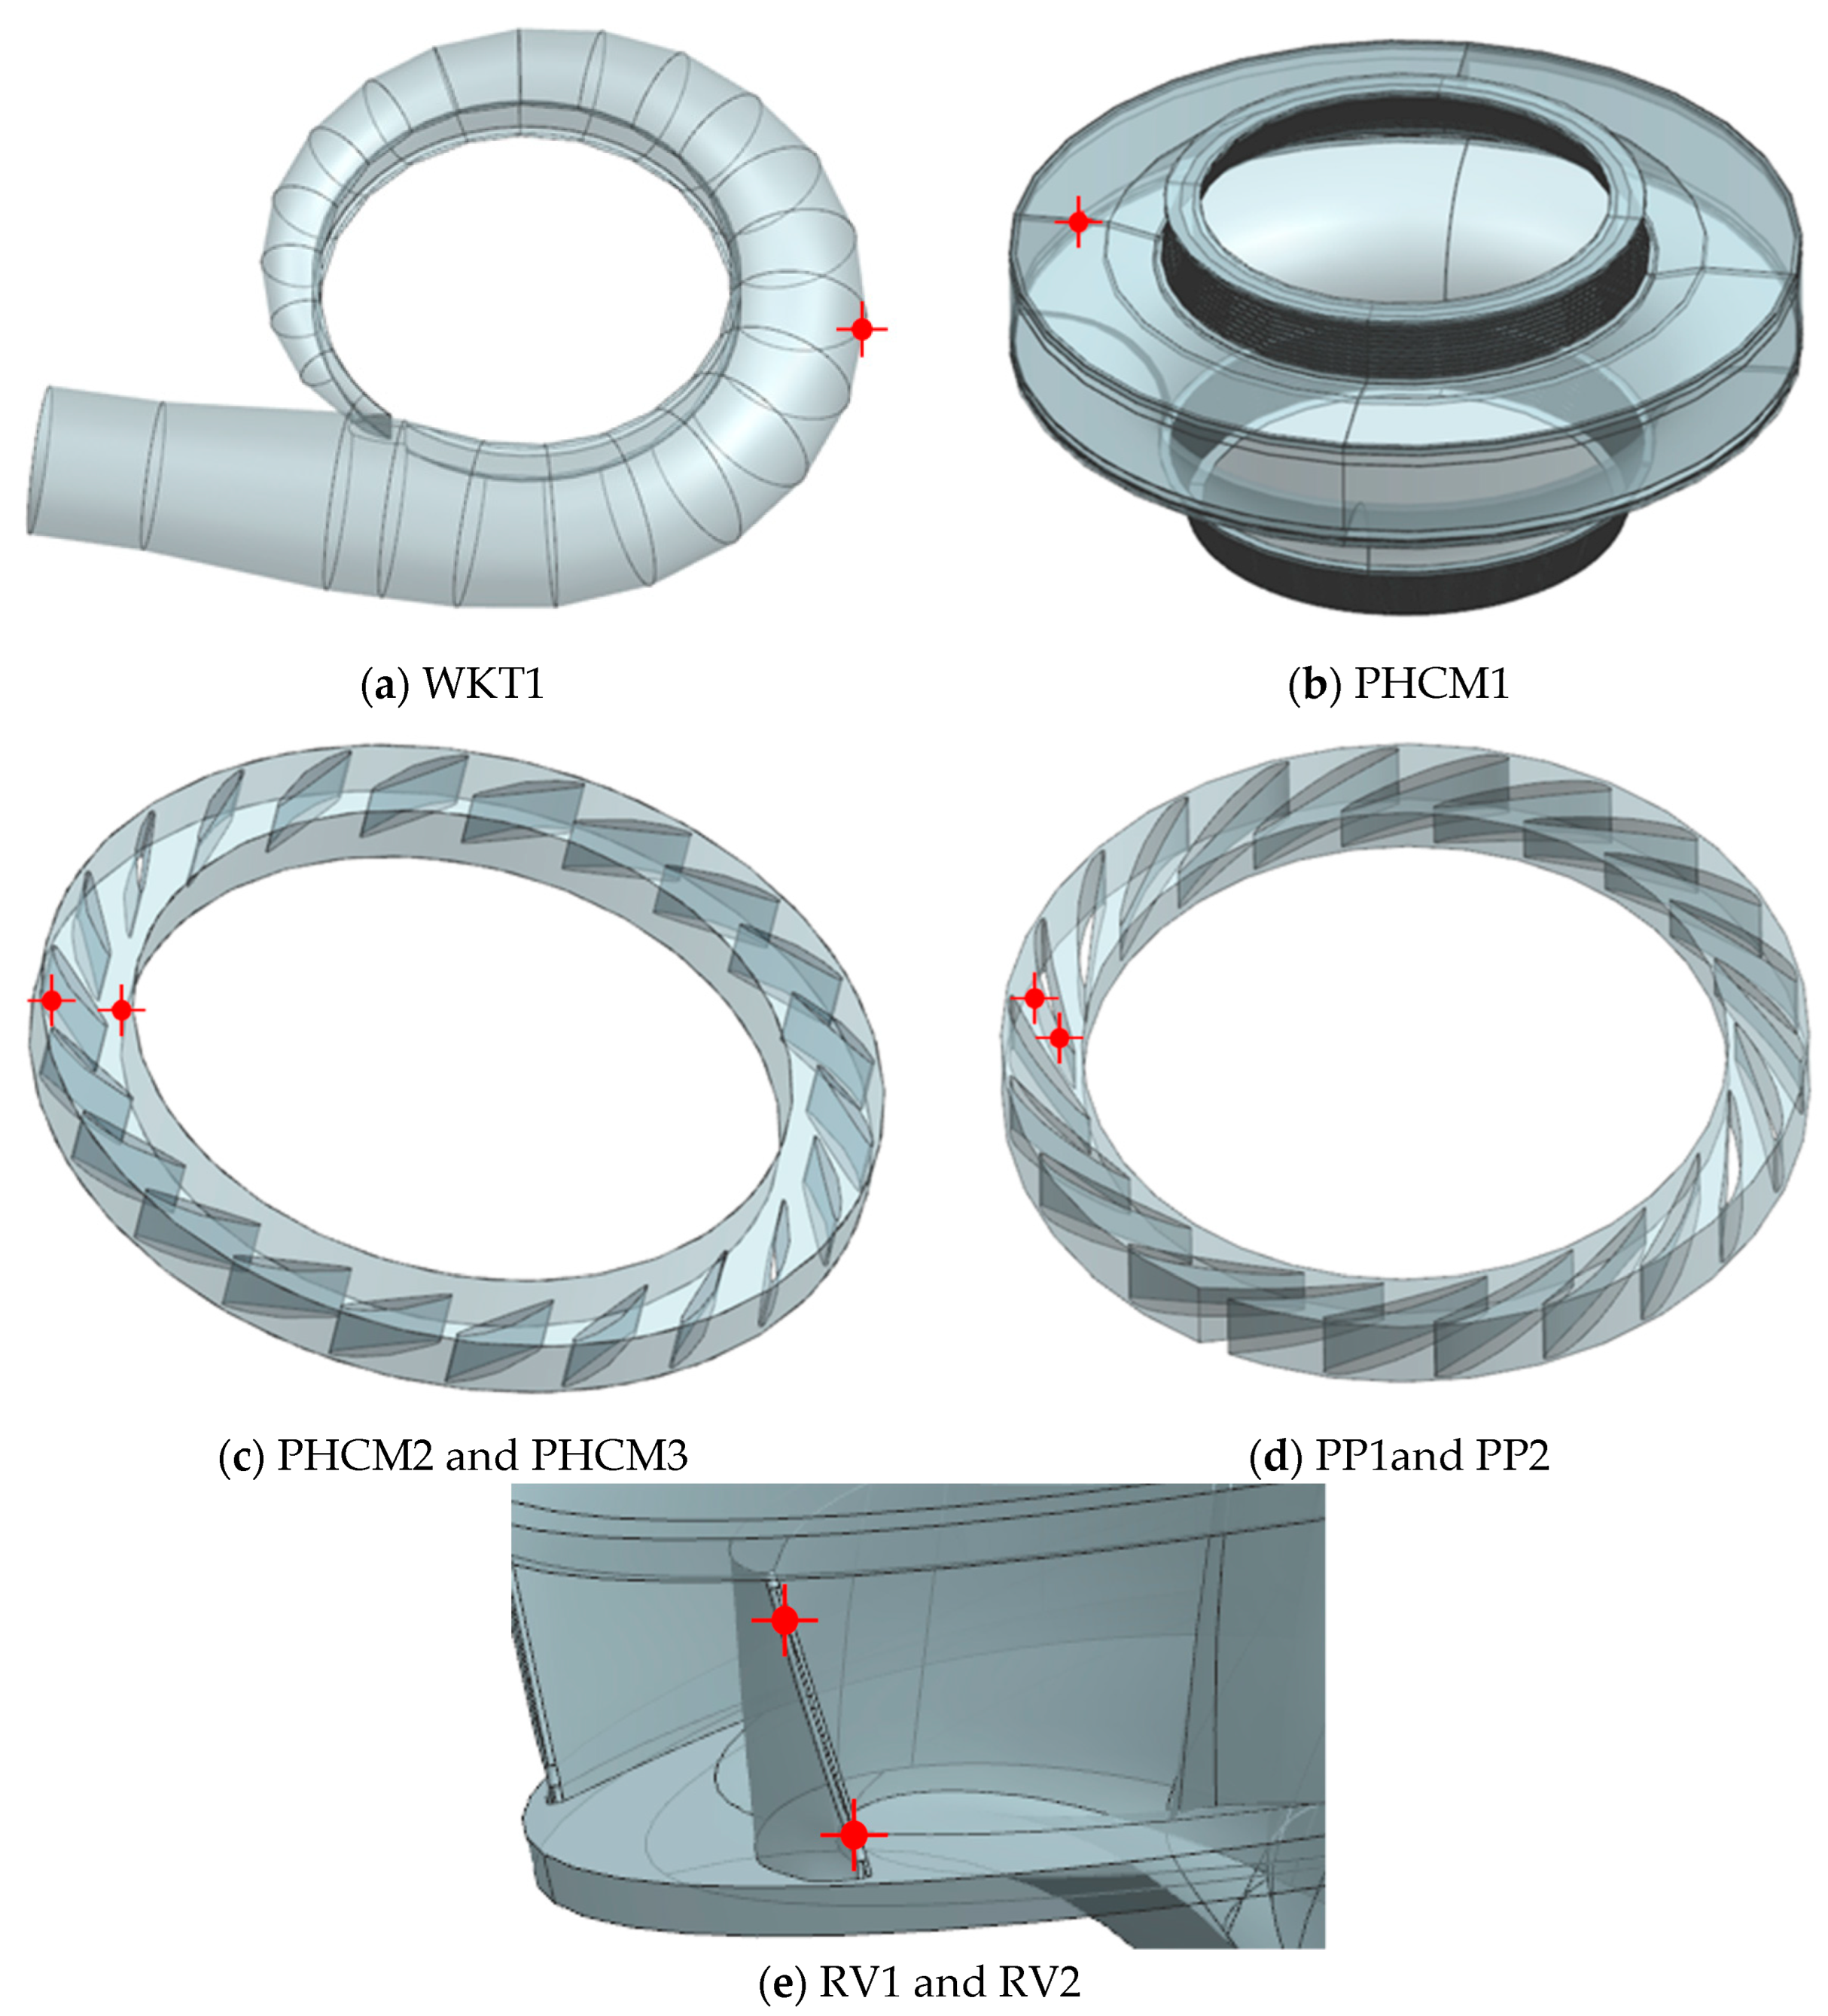
3.2. Pressure Pulsation Characteristics

Under pumping conditions with a rotational speed of 456.5 rpm, the pressure pulsation was monitored at eight different points, respectively, located in the spiral case, guide vanes, stay vanes, runner, and gap. The variable-speed pump turbine model has 9 blades for the runner and 22 blades for the guide vanes. The numerical simulation results of 0.7 s pressure pulsation and hydraulic thrust are chosen, and the time history is the same after 0.7 s.
Figure 9 shows the time and frequency domain plots of the pressure pulsations measured at point PHCM1 (crown gap) with time. At the point PHCM1, the pressure pulsation amplitude is approximately 145 KPa. Additionally, it is evident that the frequency that dominates the pressure fluctuation at the PHCM1 point is 9fn (f/fn = 9), which is the runner blade passing frequency. Where f, fn, and f/fn represent the frequency value, the rotation frequency, and the ratio of frequency to rotation frequency.
Figure 10 shows the time domain plot and frequency domain spectrum of pressure pulsation with time at monitoring points PHCM2 (inlet) and PHCM3 (outlet) located on a guide vane. The pressure pulsation amplitude at the PHCM2 point is about 625 KPa, and at the PHCM3 point is about 510 KPa. 9 fn (f/fn = 9) represents the dominant frequency of the pressure fluctuation at the PHCM2 point, which is the passing frequency of the runner blades. The dominant frequency at the PHCM3 point is also 9fn. However, there is also a low frequency of 0.4fn in the secondary frequency. The low-frequency pulsation component is involved in the monitoring point location. PHCM2 is closer to the vaneless space, which is the largest and most complex area of the pump turbine pressure pulsation.
We can observe the two monitoring points, PP1 (inlet) and PP2 (outlet), located on a stay vane in Figure 11. At the PP1 point, the amplitude of pressure pulsation is approximately 455 KPa, and at the PP2 point is about 200 KPa. It is clear that the frequency that dominates the pressure fluctuation at the PP1 point is 0.54fn, but there is also a passing frequency of 9fn, which is the runner blades passing frequency. The frequency that dominates the pressure fluctuation at the PP2 point is 0.56fn, and there is also a passing frequency of 9fn. It can be concluded that the low frequency of the pressure pulsation at the stay vane is the dominant frequency, which may be related to the relationship between the dominant frequency of 0.56fn and vortices in Figure 8.
Based on Figure 12 at monitor WKT1 (spiral case), the pressure pulsation amplitude at the WKT1 point is approximately 82 kPa, and the dominant frequency of pressure fluctuation at the WKT1 point is 9fn, which is the runner blade passing frequency. As there is a vortex rope in the spiral case, the low frequency accounts for a larger portion as well.
Figure 13 shows the time and frequency domain spectrum at monitor RV1 and monitor RV2. The pressure pulsation amplitude at the RV1 point is about 925 KPa, and at the monitor point, RV2 is about 262 KPa. The dominant frequency of the pressure fluctuation at the RV1 point can be observed to be 4.5fn, while the frequency that dominates the pressure fluctuation at the RV2 point is 4.8fn. This may be associated with the influence of the water flow near the runner blades, the deluge, and the secondary water impact.

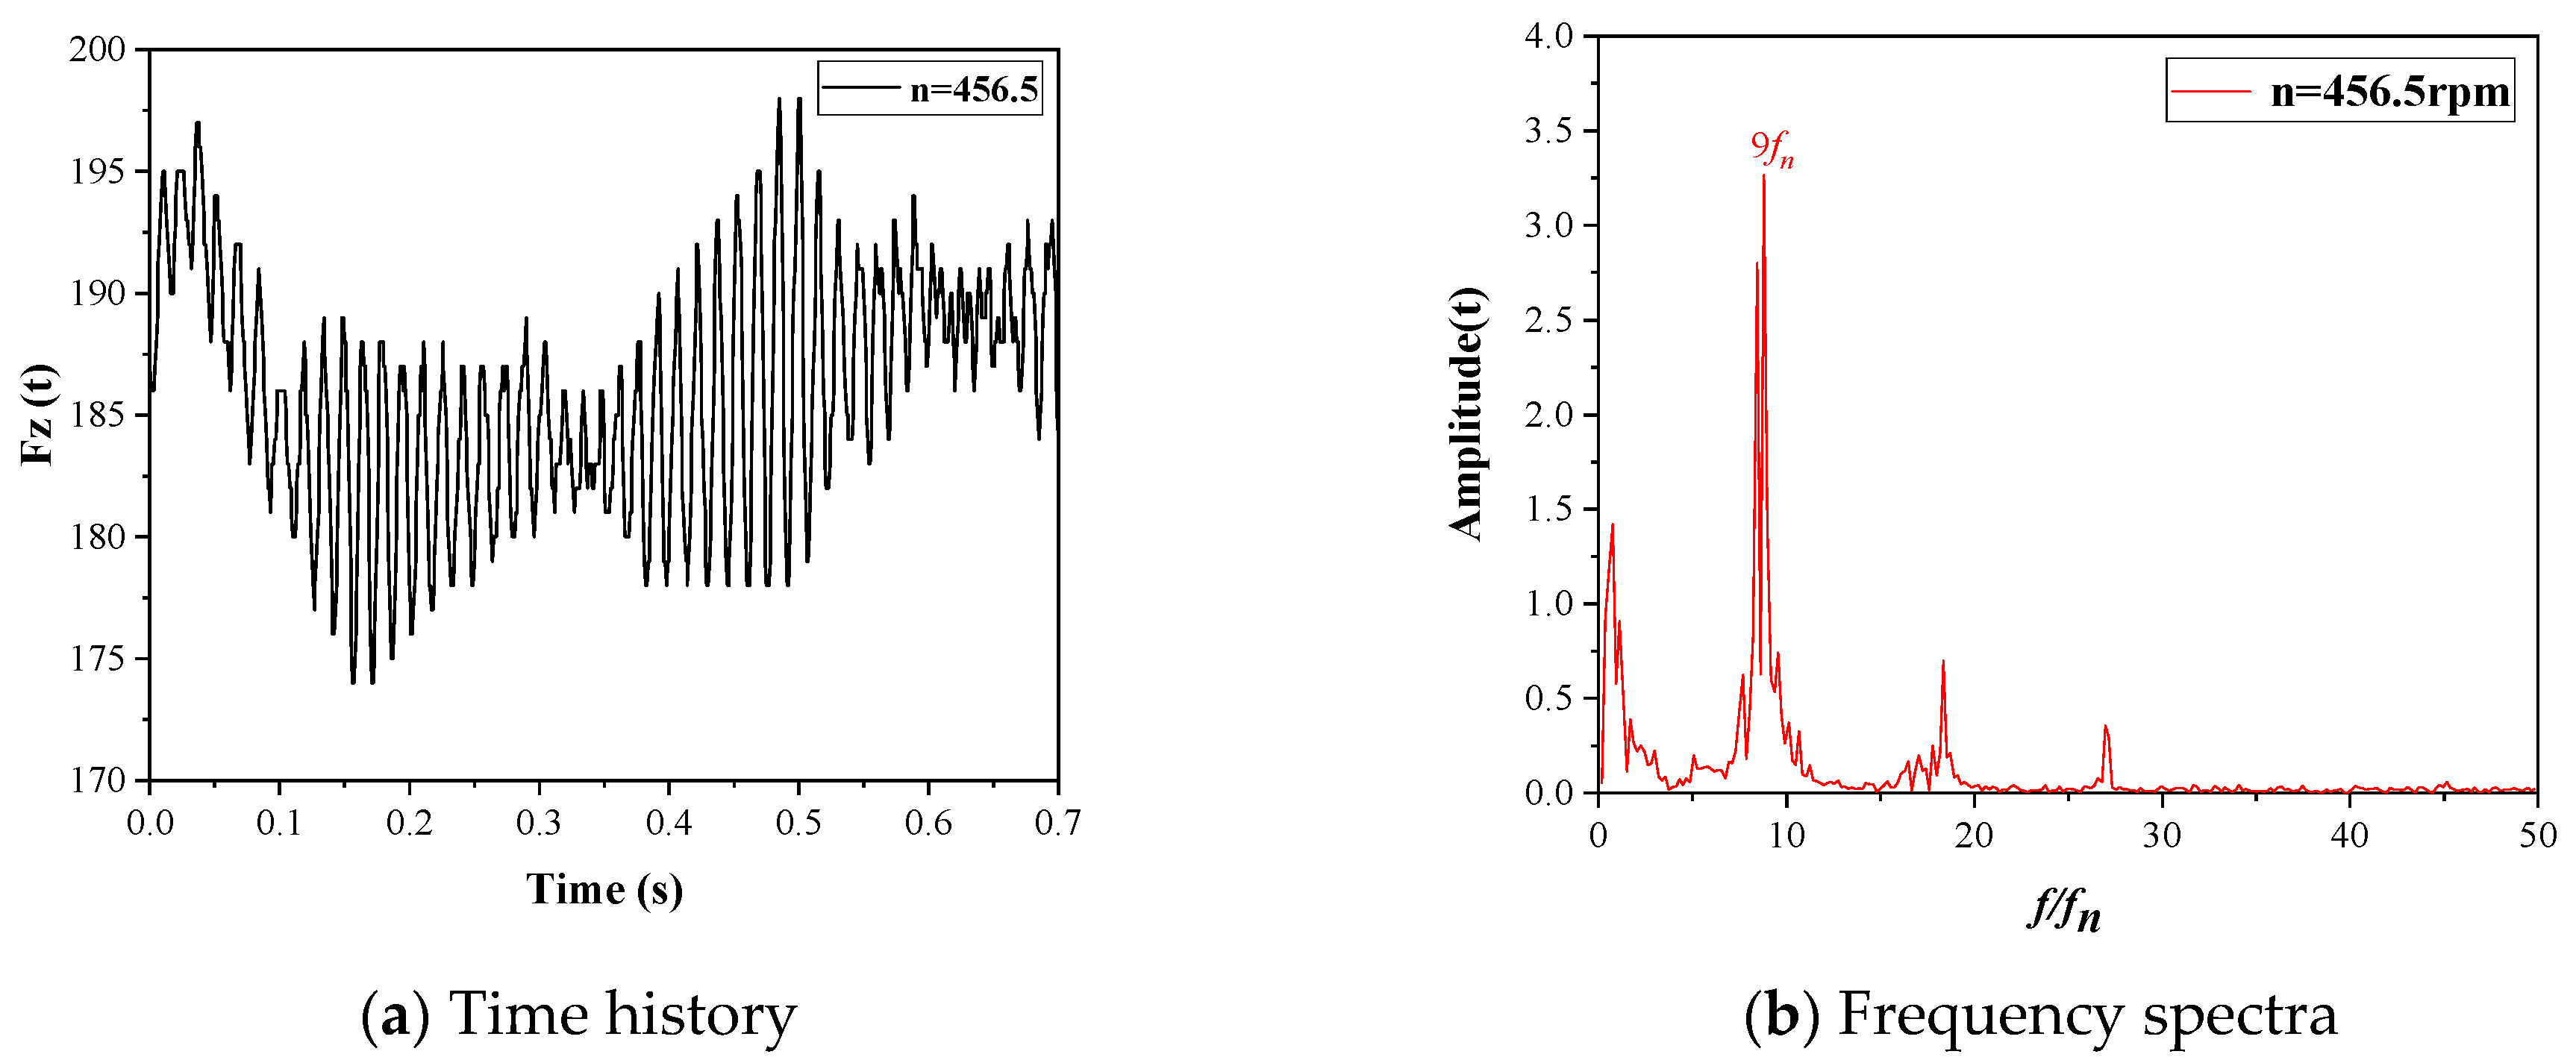
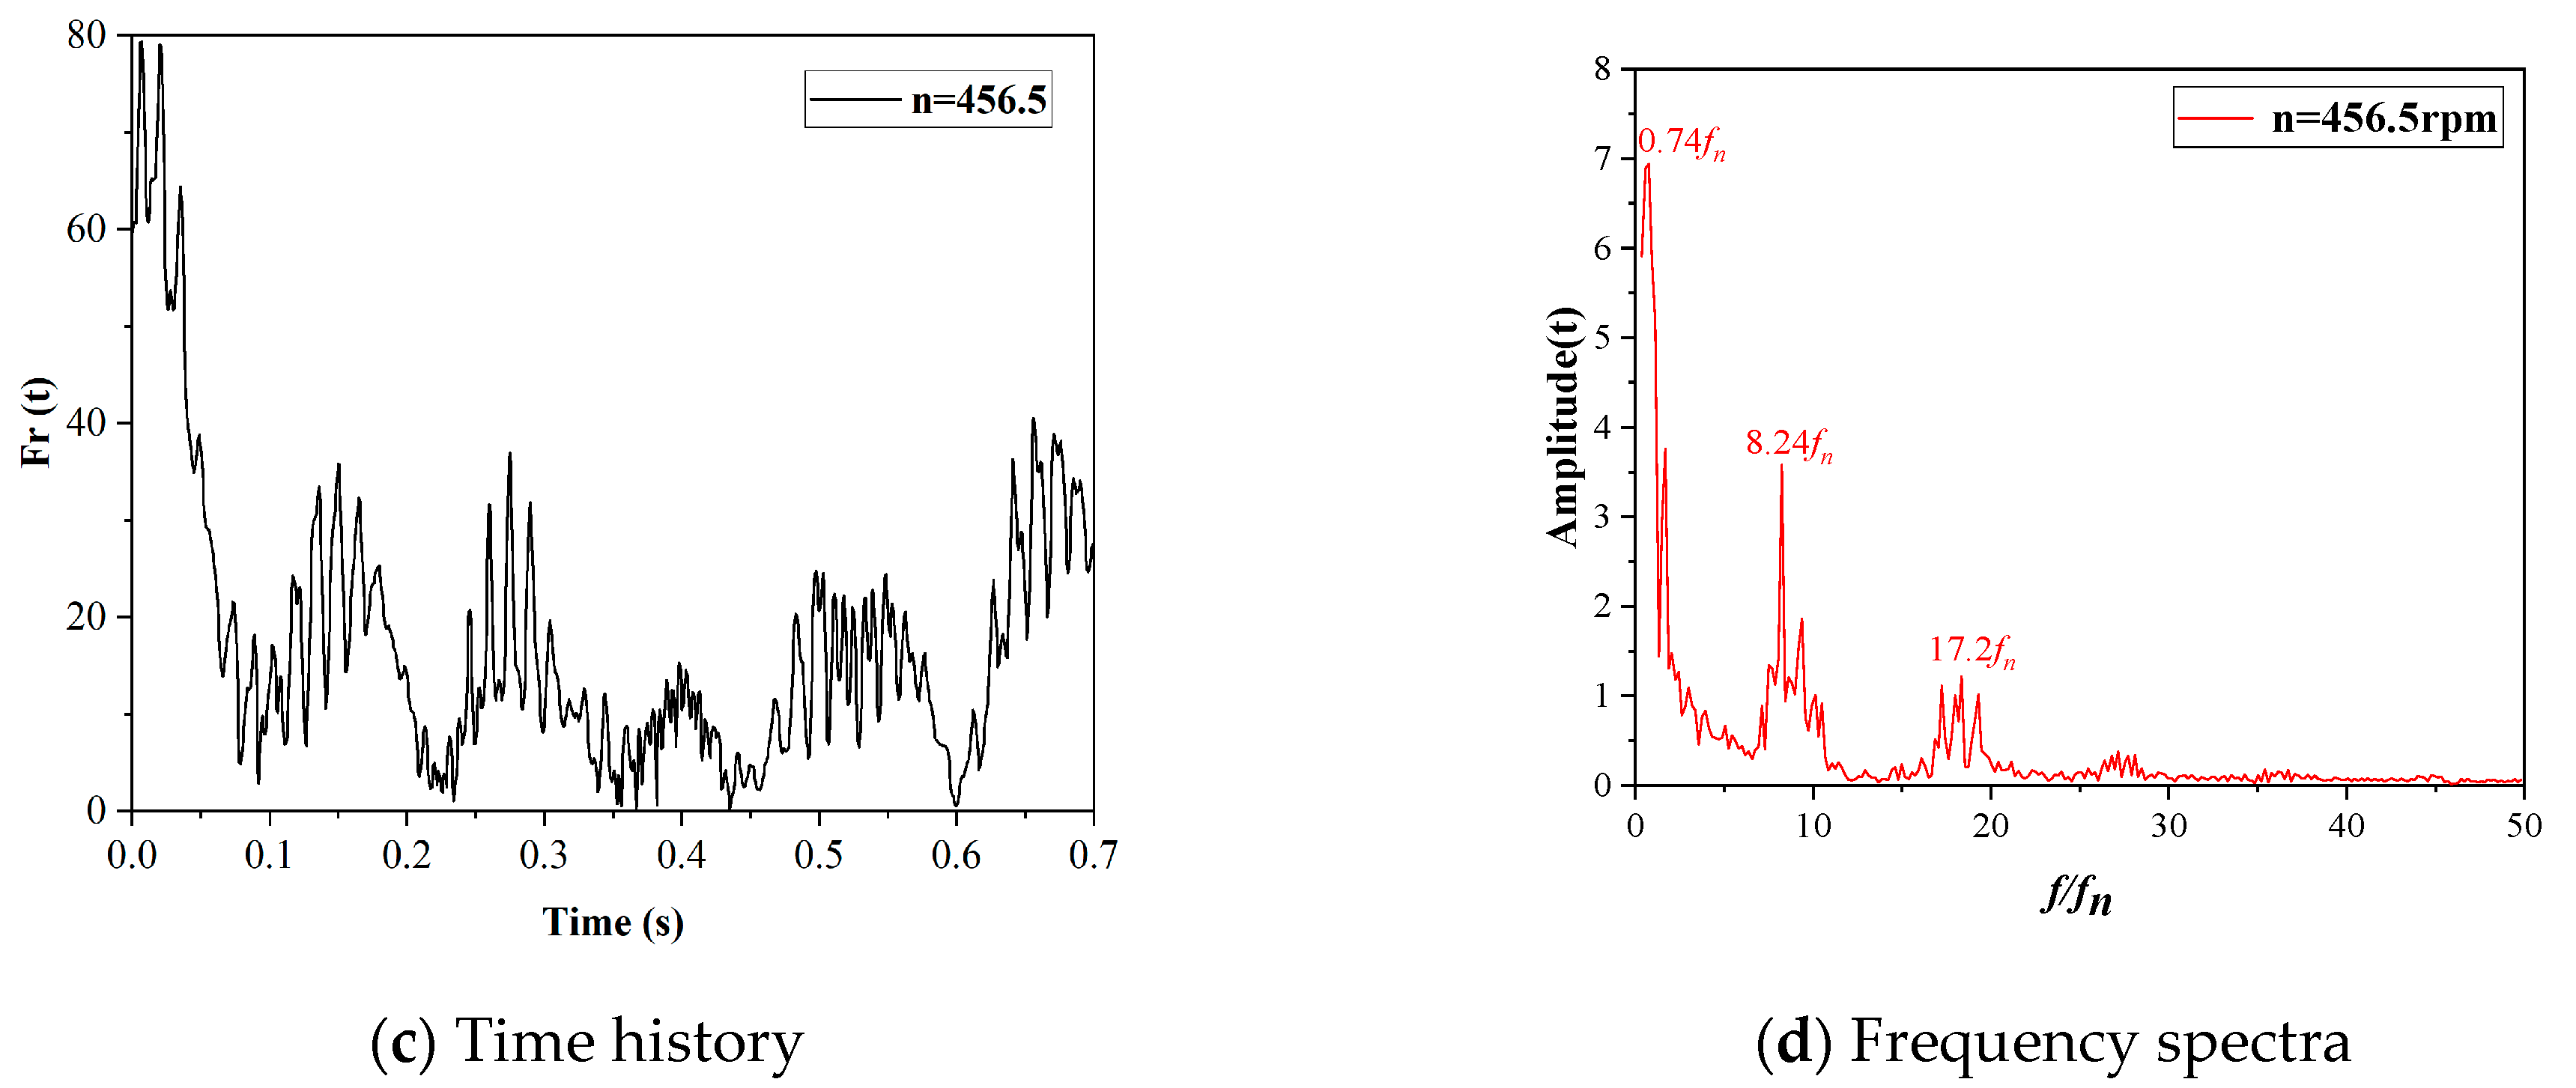
3.3. Hydraulic Thrust

Figure 14 shows the variation in the hydraulic thrust with time in the CFD fluid domain model when the speed is 456.5 rpm. The figure of axial hydraulic thrust is positive, which indicates that the direction of hydraulic thrust is upward. In this way, the thrust bearing experiences a reduction in the amount of load it bears. The axial hydraulic thrust can fluctuate up to 24 t. As shown in Figure 14, the frequency of the axial hydraulic thrust is more complex, and the spectrum shows that the dominant frequency of axial hydraulic thrust is 9fn, a frequency related to the passage of the runner blade.
When the speed of the variable-speed pump turbine changes, the radial force will also change, which will not only affect the operation of the runner but also the operation of the guide bearing in the shaft system. The radial force can fluctuate up to approximately 40 t. And, the frequency spectrum shows the dominant frequency of radial force is 0.74fn, but a frequency of 8.24fn is also present.

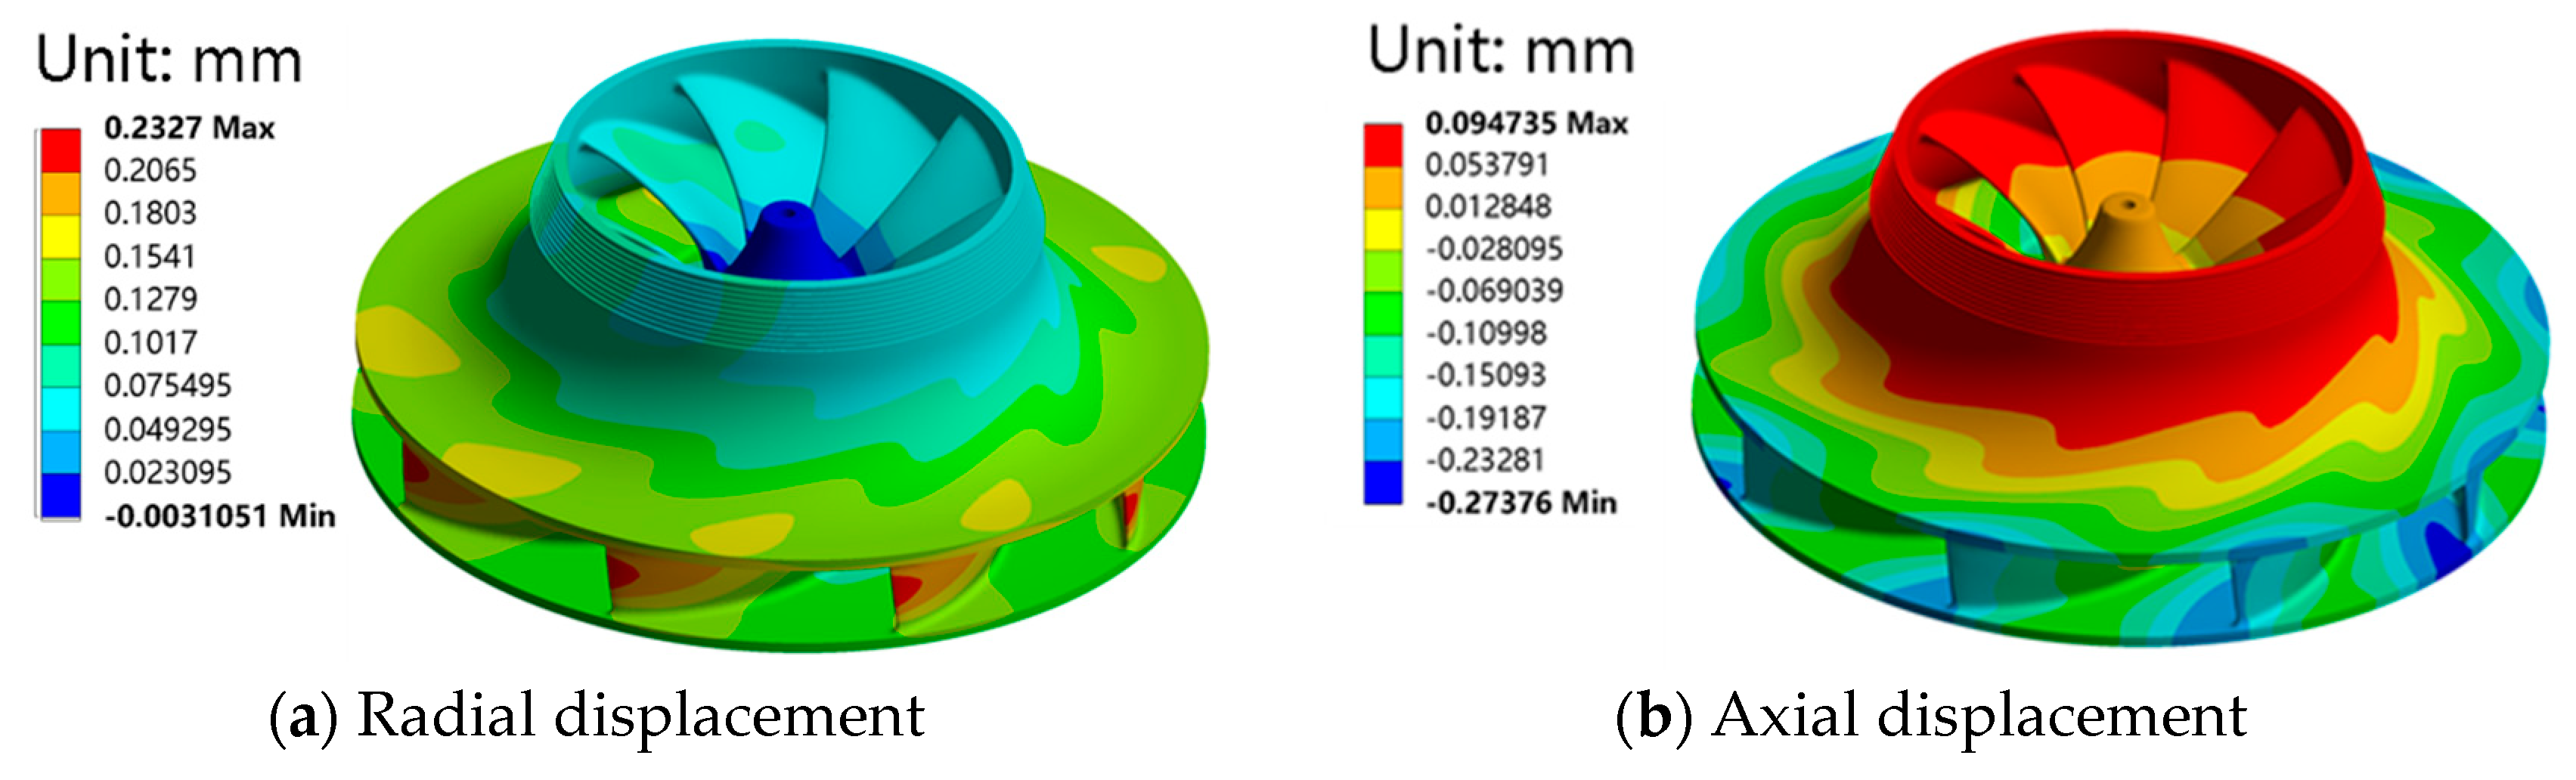
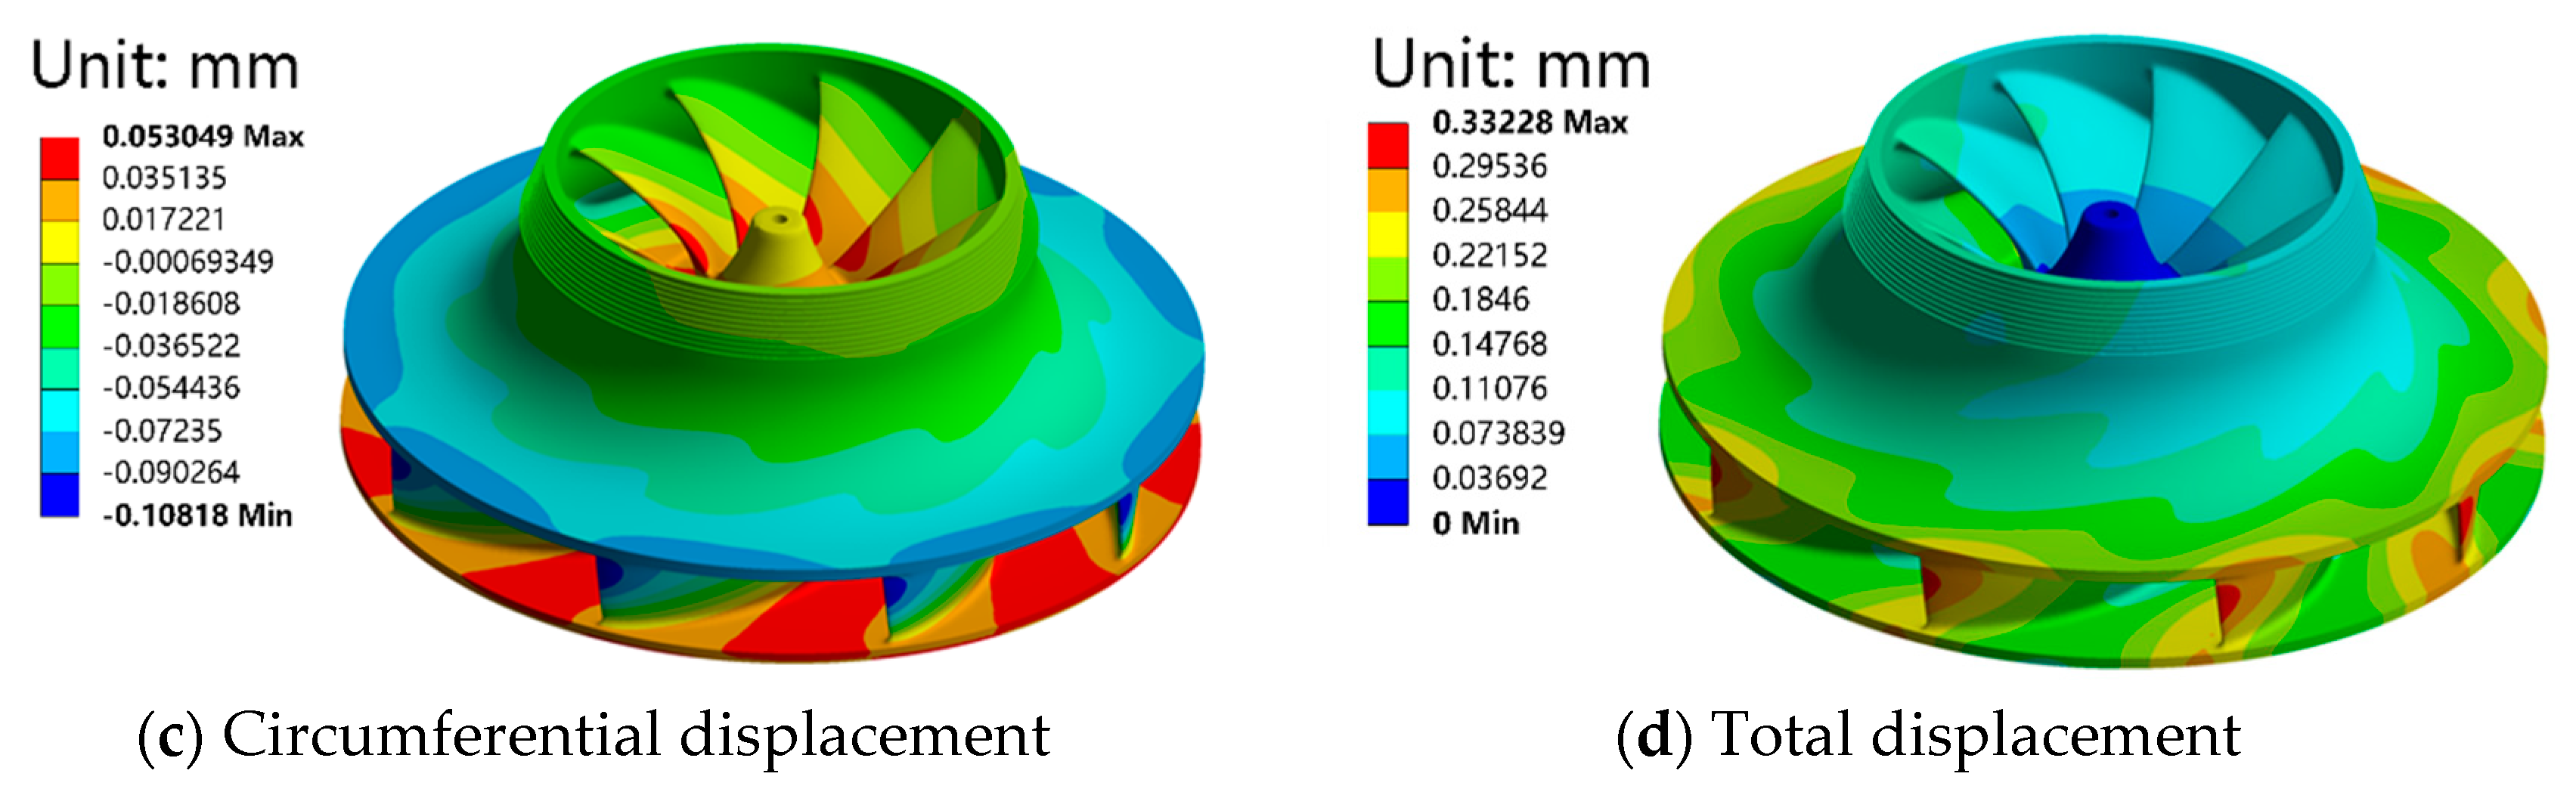
3.4. Dynamic Response of the Runner

Determine the runner dynamic response under pump conditions, in which the radial, axial, circumferential, and total displacement of the runner is shown in Figure 15. The axial and radial displacement on the runner shows an asymmetric pattern, and the axial displacement is smaller than the radial displacement, and the displacement of the runner is mainly in the radial direction, but also with a small amount of upward displacement and a certain inclination.
Figure 16 shows the runner dynamic stress distribution. The runner blade is the main dynamic stress concentration area, especially where it intersects the crown and band, with the highest stress in the blade near the crown. Two dynamic stress monitoring points, S1 and S2, are established on the runner to examine the runner’s dynamic stress and frequency characteristics, and the locations are also shown in Figure 16.
Figure 17 shows the observed dynamic stresses at monitoring points S1 and S2, and their variations are very complex. It is evident that the amplitude of the dynamic stress at monitor point S1 is 37 MPa and at point S2 is 4 MPa. Figure 18 shows the frequency domain plot of the dynamic stress variation at two points, S1 and S2. The stress dominant frequency at point S1 is 4.8fn, but there is also a frequency of 22fn, which is the guide vane passing frequency, and the dominant frequency of the stress at point S2 is 1.8fn.

4. Conclusions

In this study, a complete set of CFD models for variable-speed pump turbines was established to study the effect of speed on the hydraulic performance of the unit in order to fill the gap in existing research. And, the transient simulation under the pump conditions was carried out to analyze the pressure pulsation characteristics, axial hydraulic thrust, and radial force in the flow passage and also to determine the runner dynamic behavior. And, the following conclusions were drawn:
(a)
The SST k − ω turbulence model was used to calculate the hydraulic performance under pump conditions because after comparing the value of design performance parameters with the calculated hydraulic performance, the maximum error was found to be less than 4.2%, indicating that it is feasible to use this numerical model to calculate the pressure pulsation characteristics and hydraulic thrust of the variable-speed pump turbine.
(b)
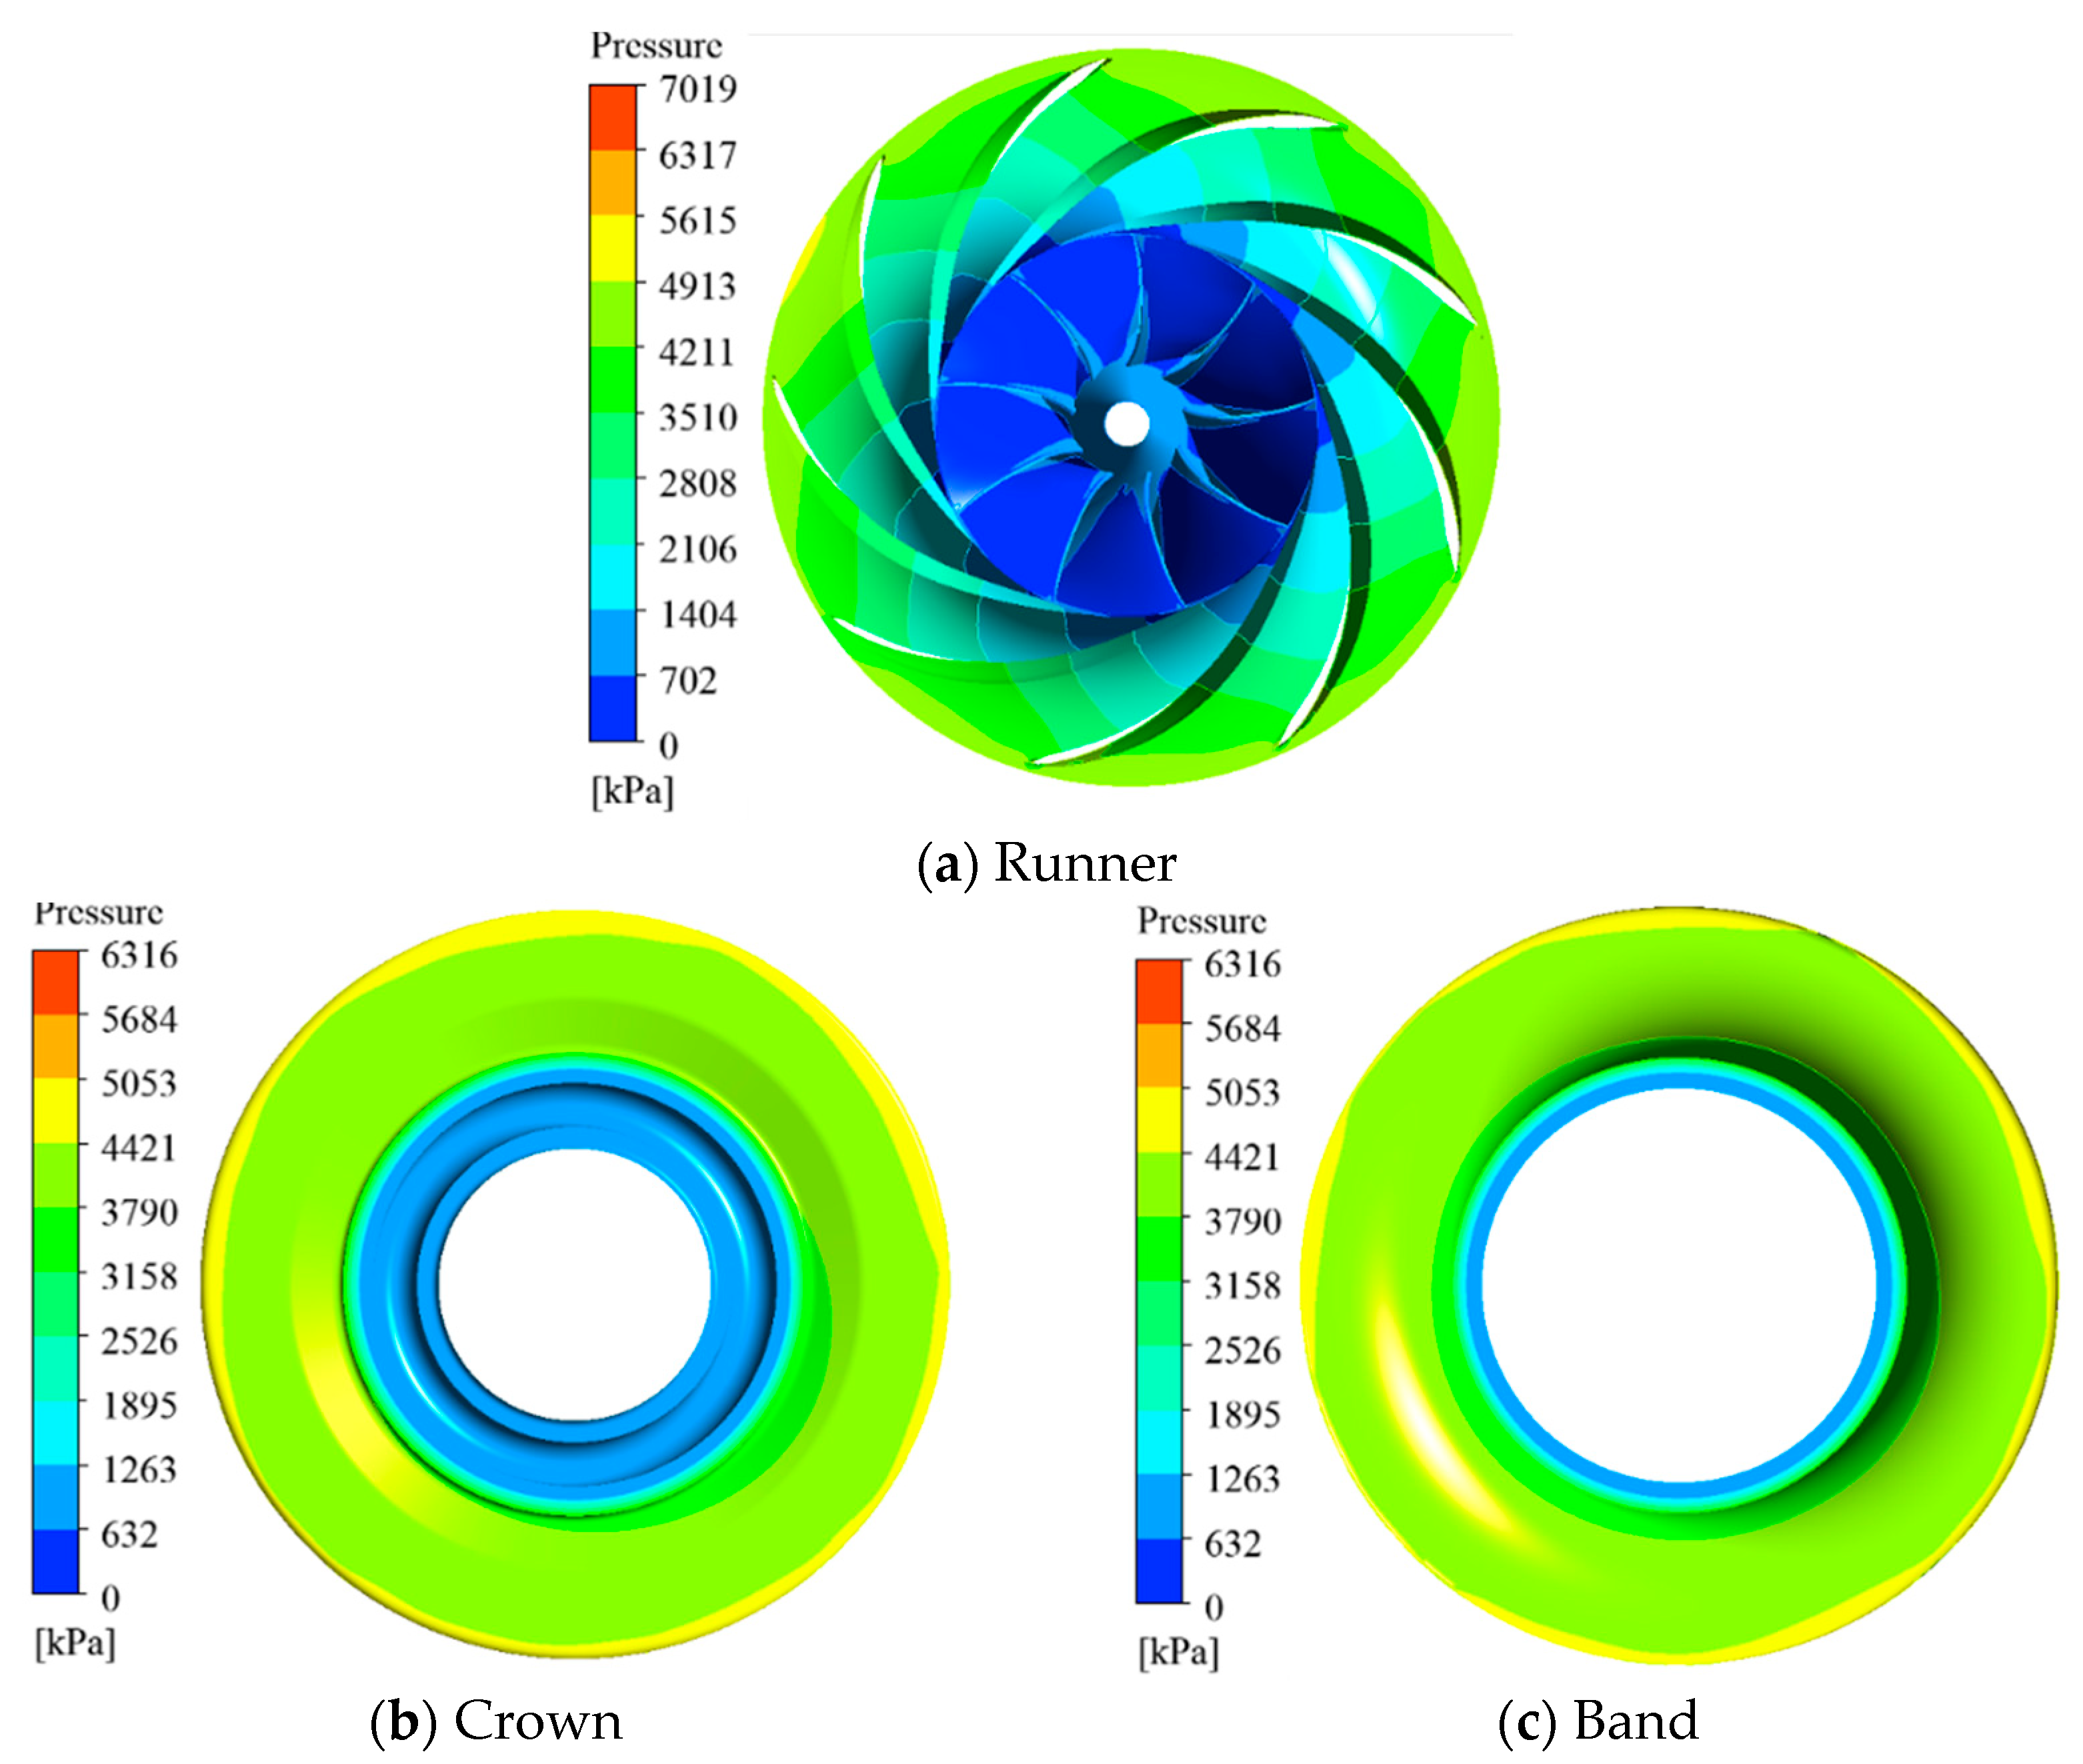
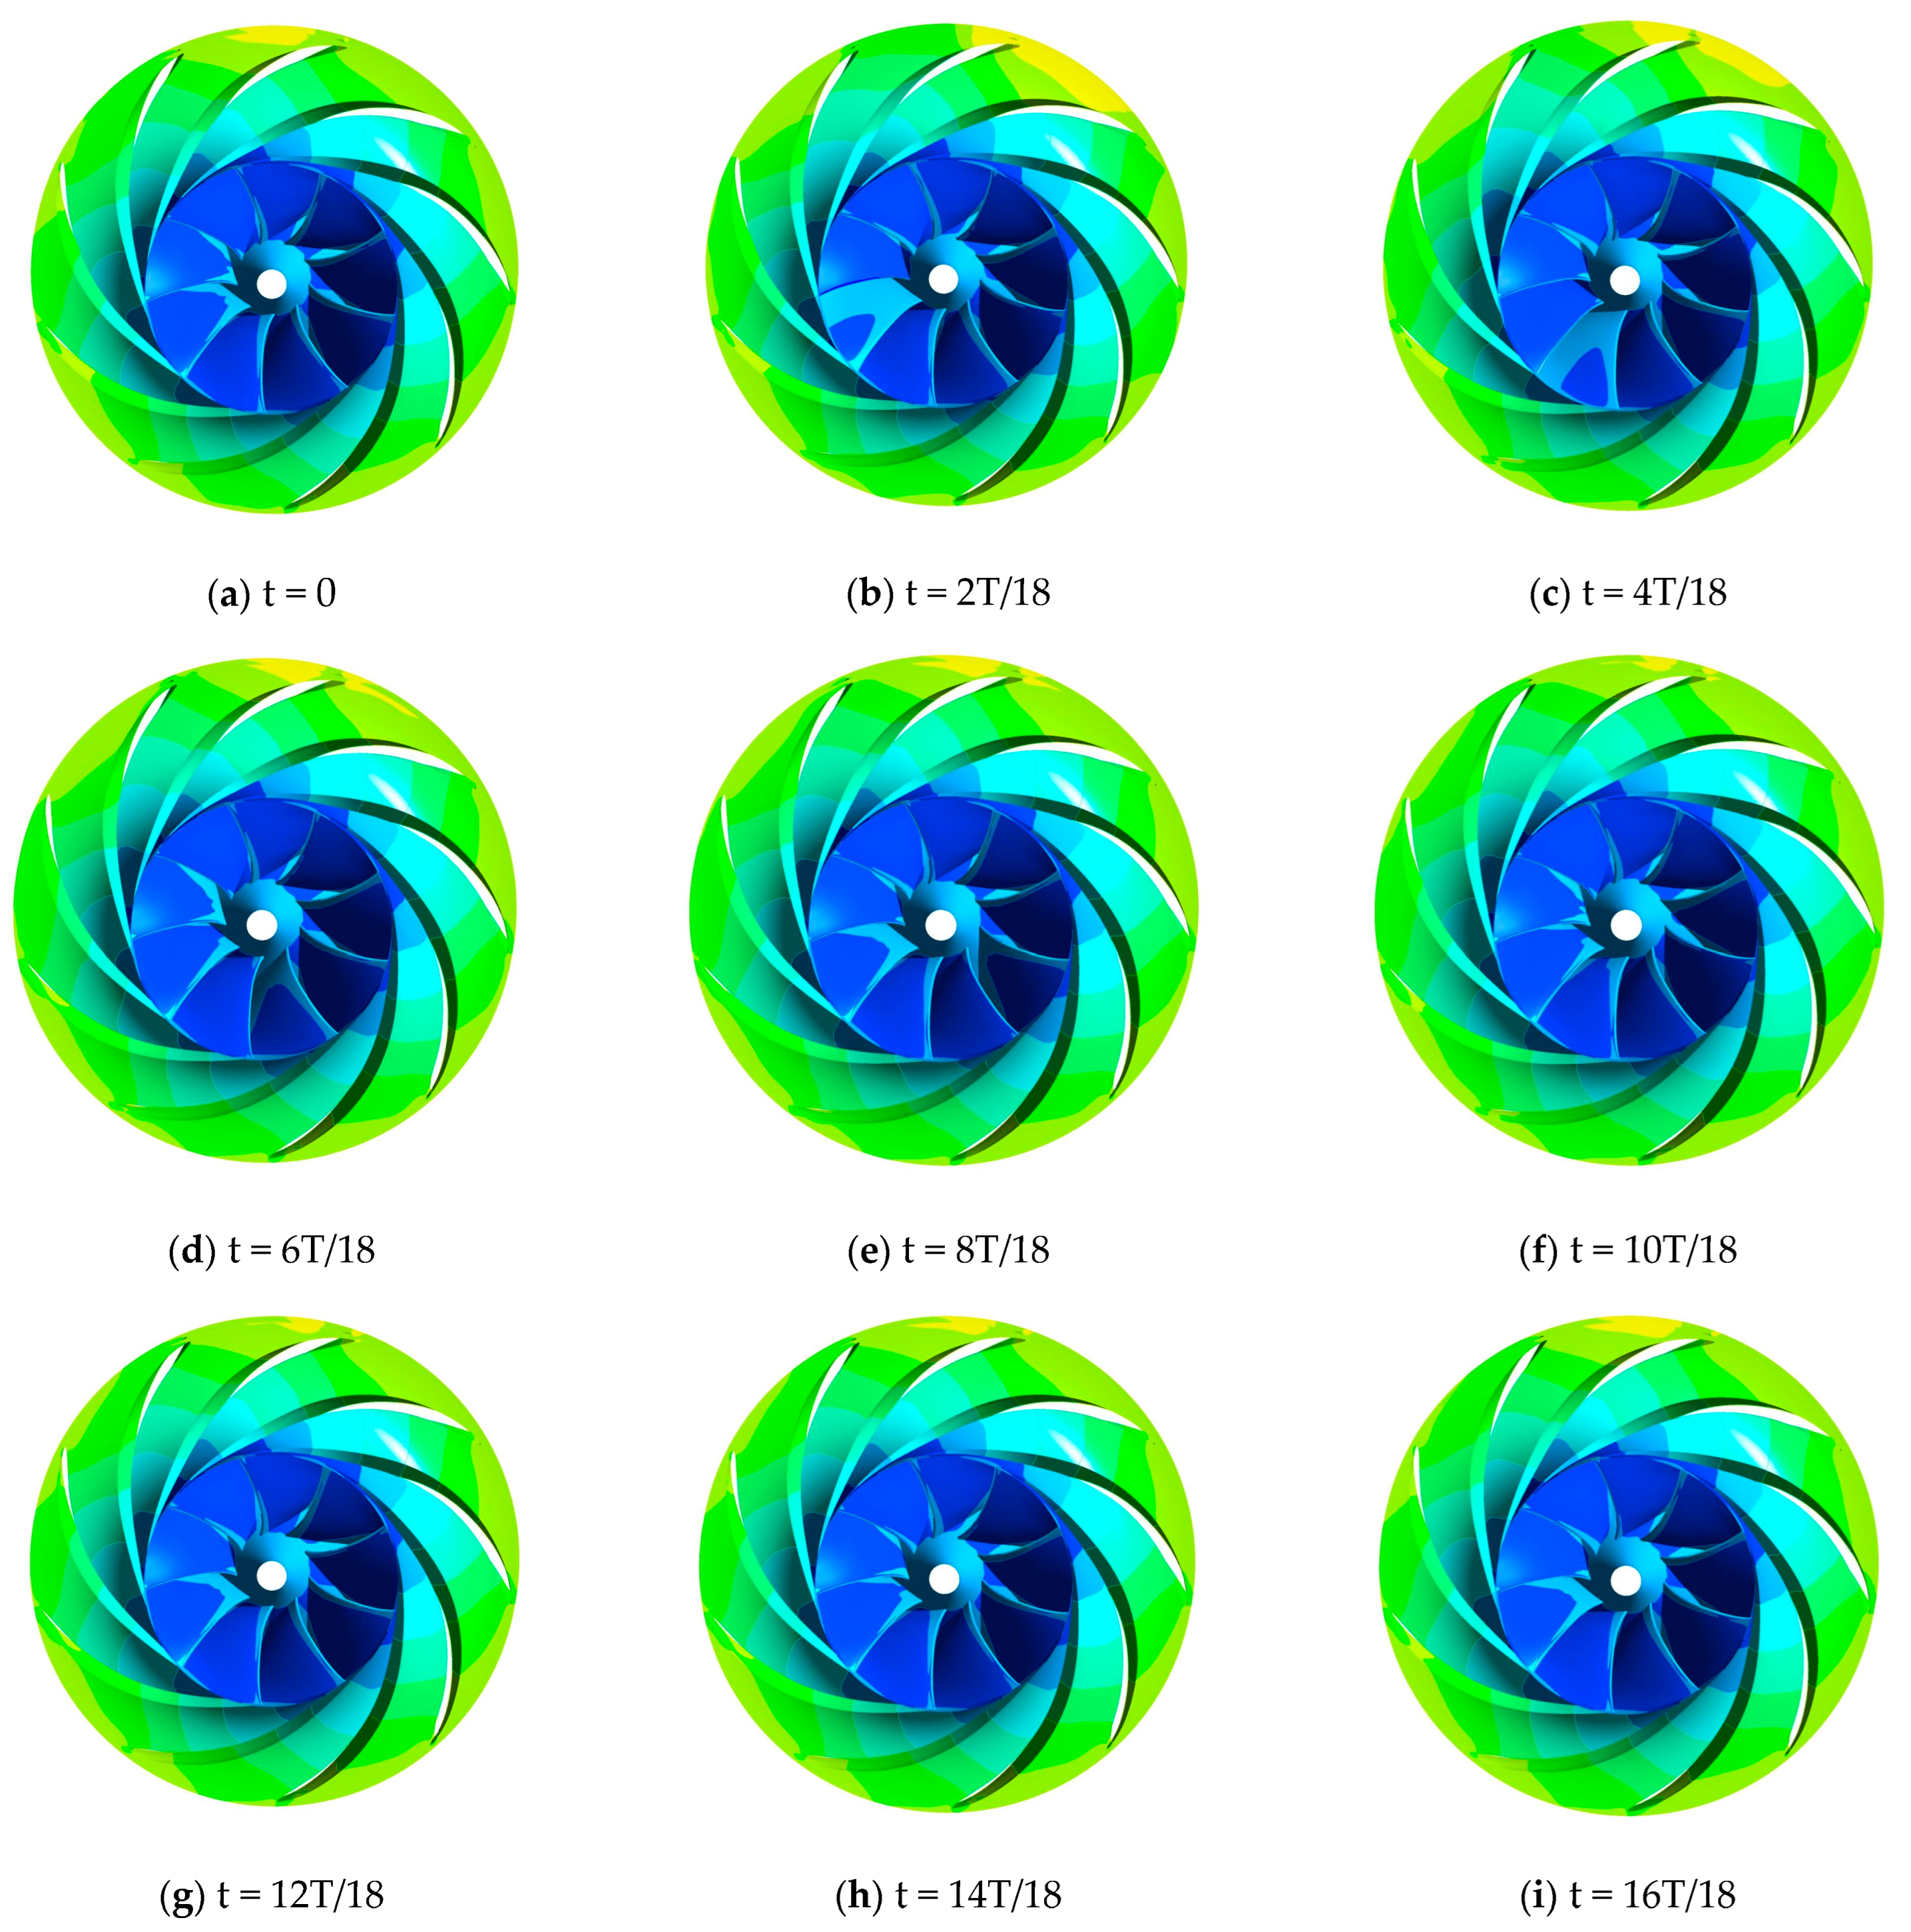
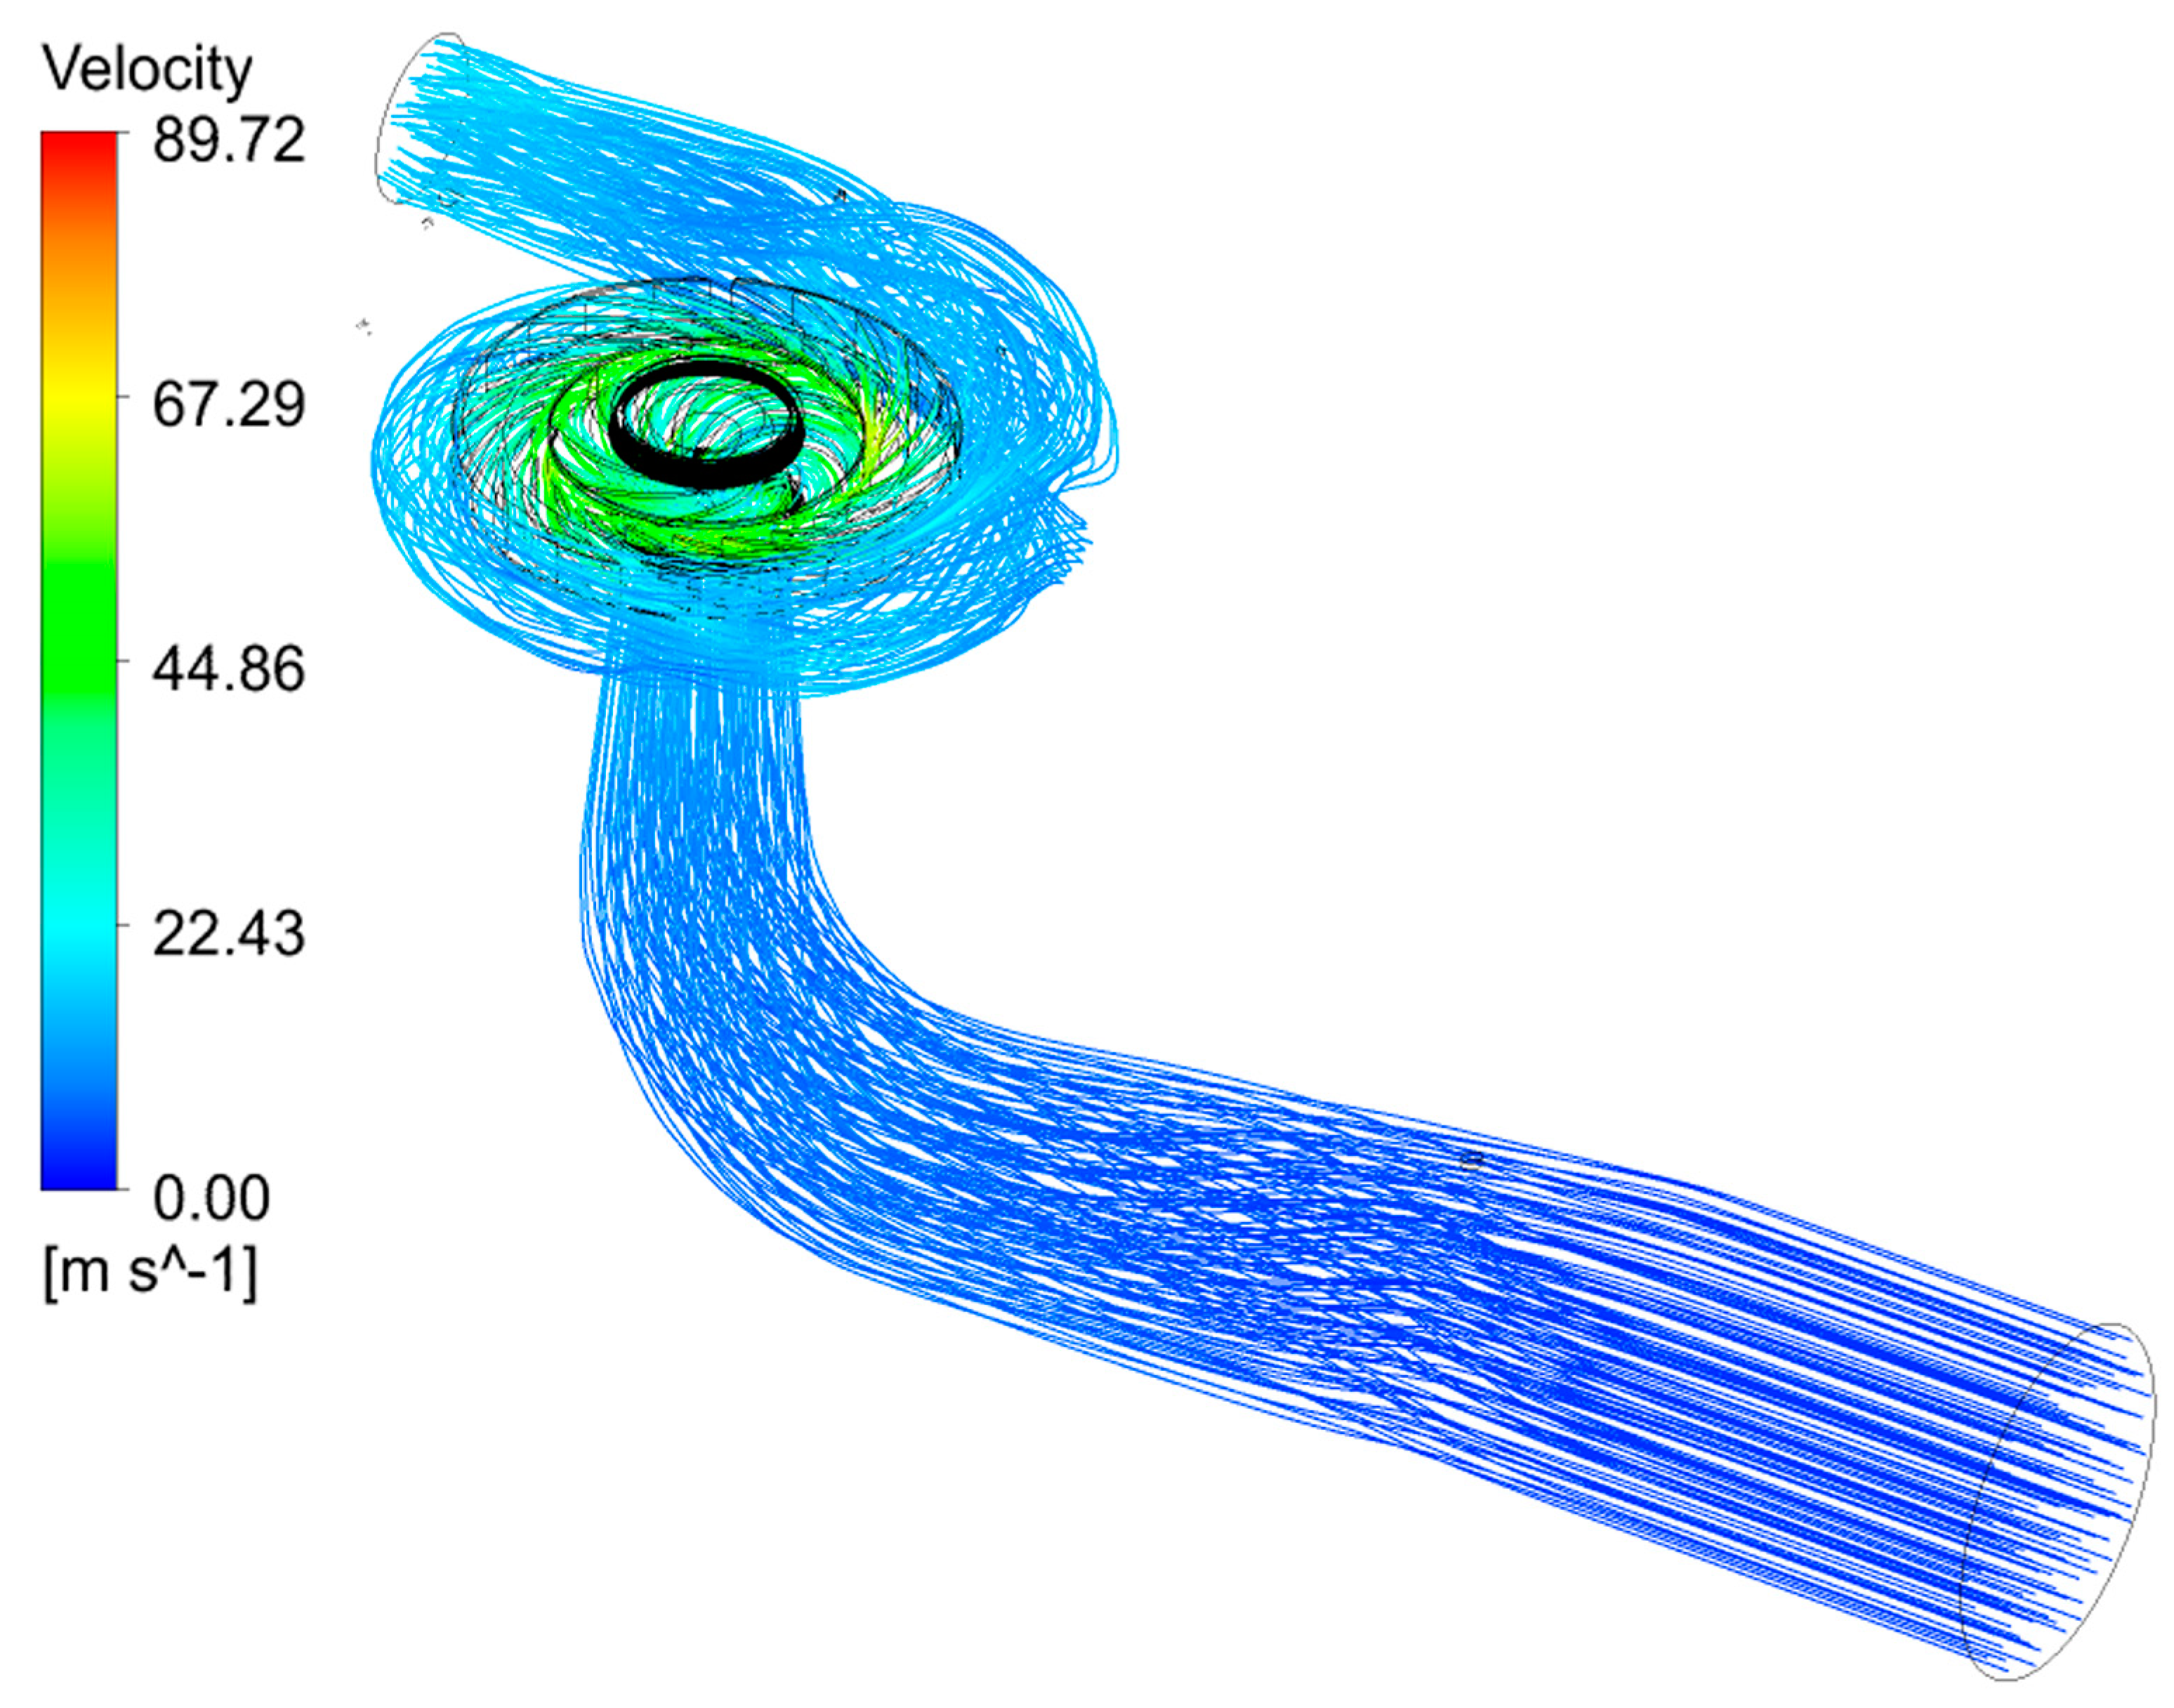
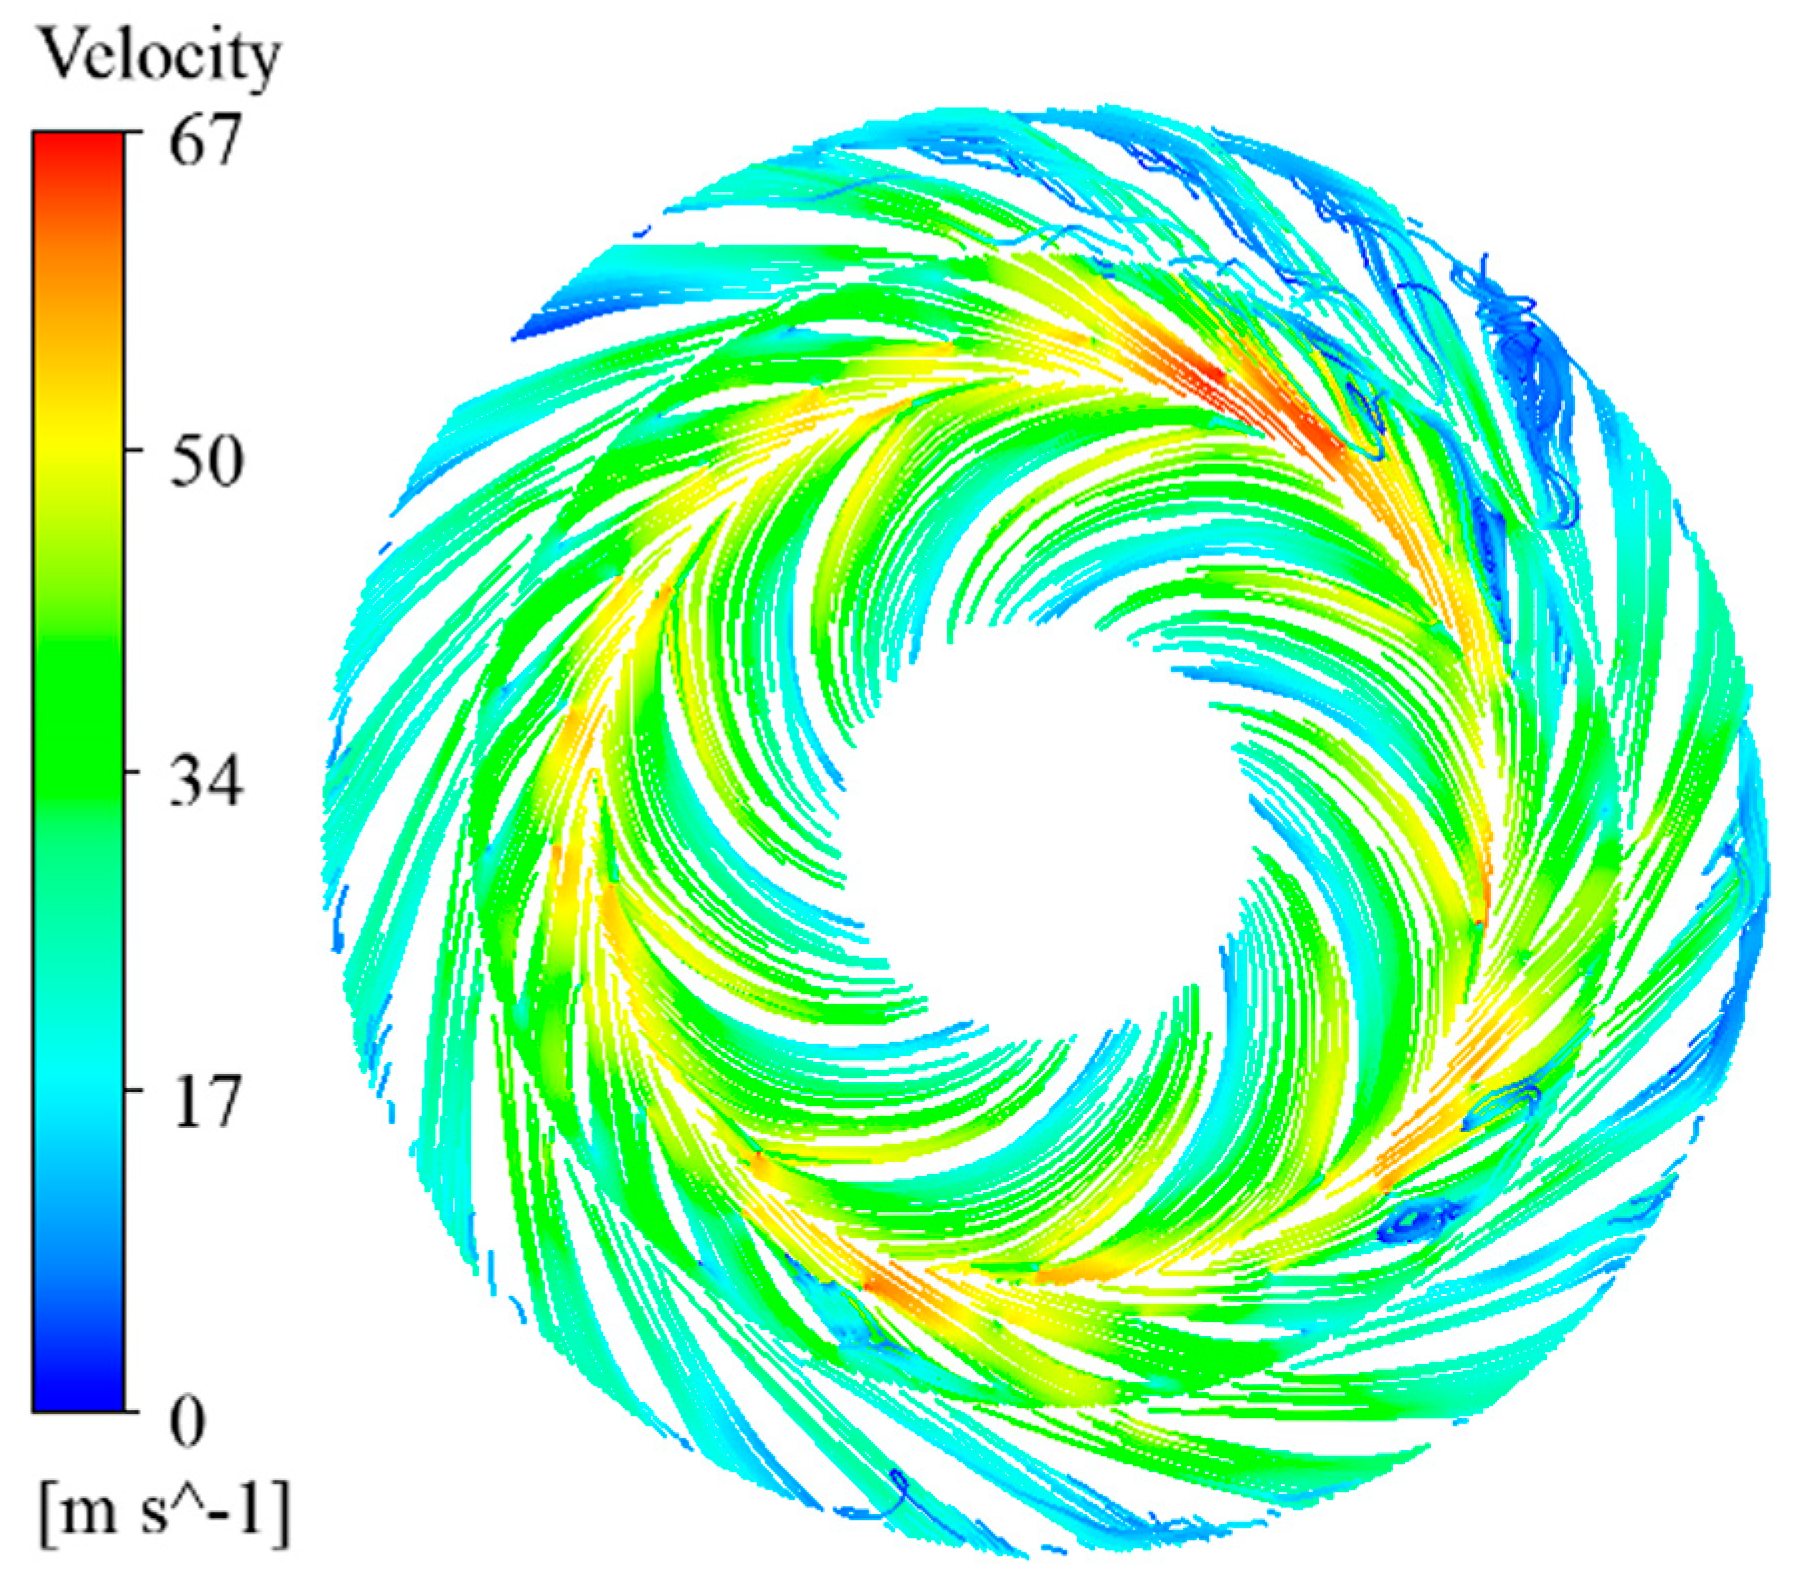
The pressure distribution on the runner surface remains uniform on the circumference and increases gradually from the inner edge to the outer edge of the circumference, with the maximum value located at the outer edge. The streamline inside the draft tube and runner is smooth. However, the flow separation phenomenon occurs in the stay vane flow passage, there is a vortex rope inside the spiral case, and the flow velocity in the bladeless area is the largest in the whole flow passage.
(c)
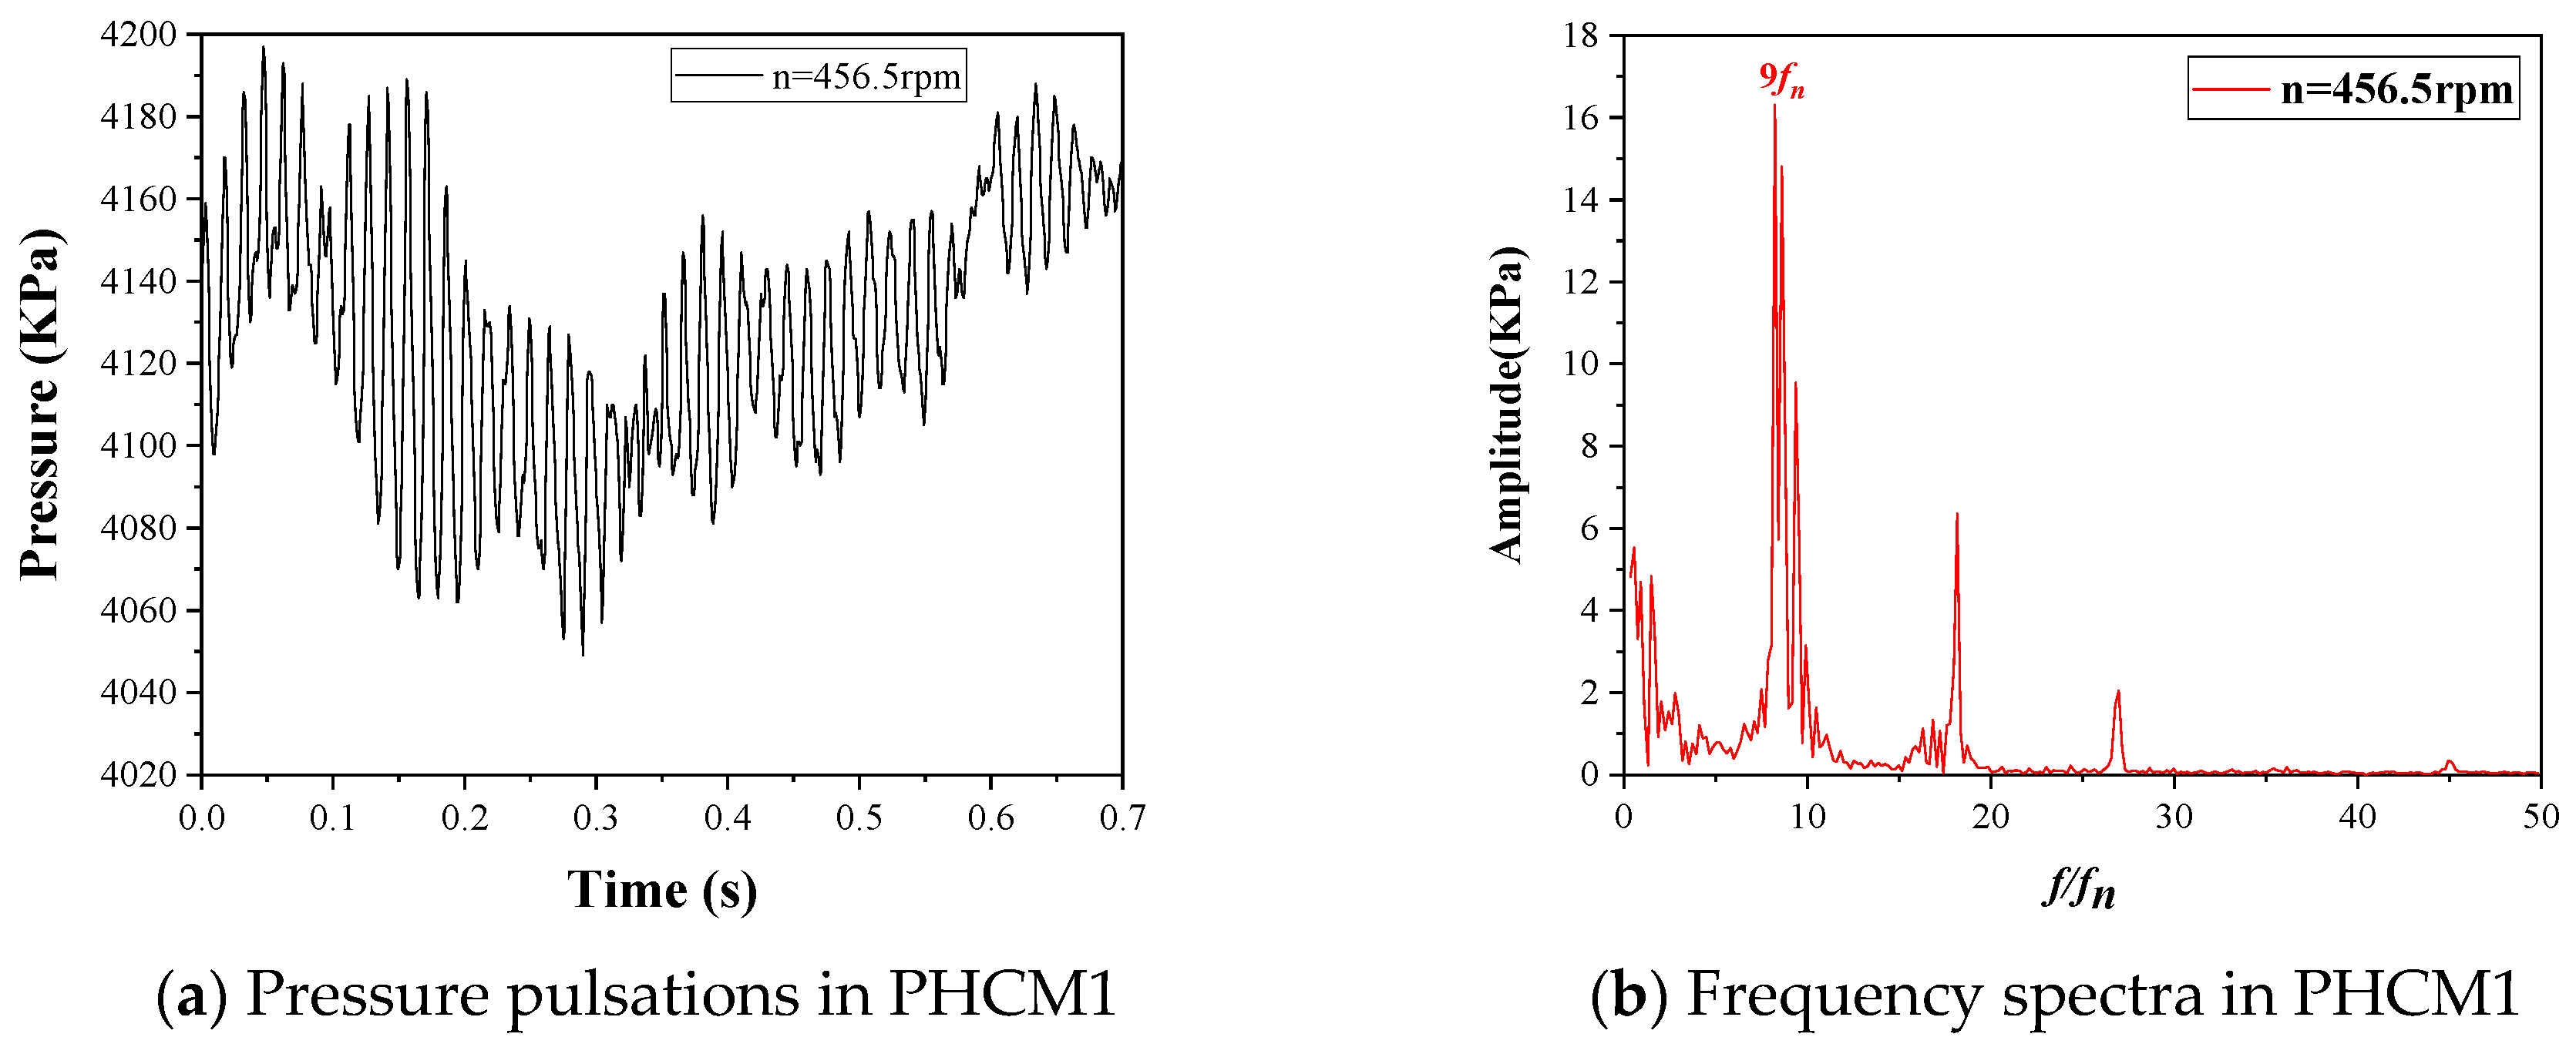
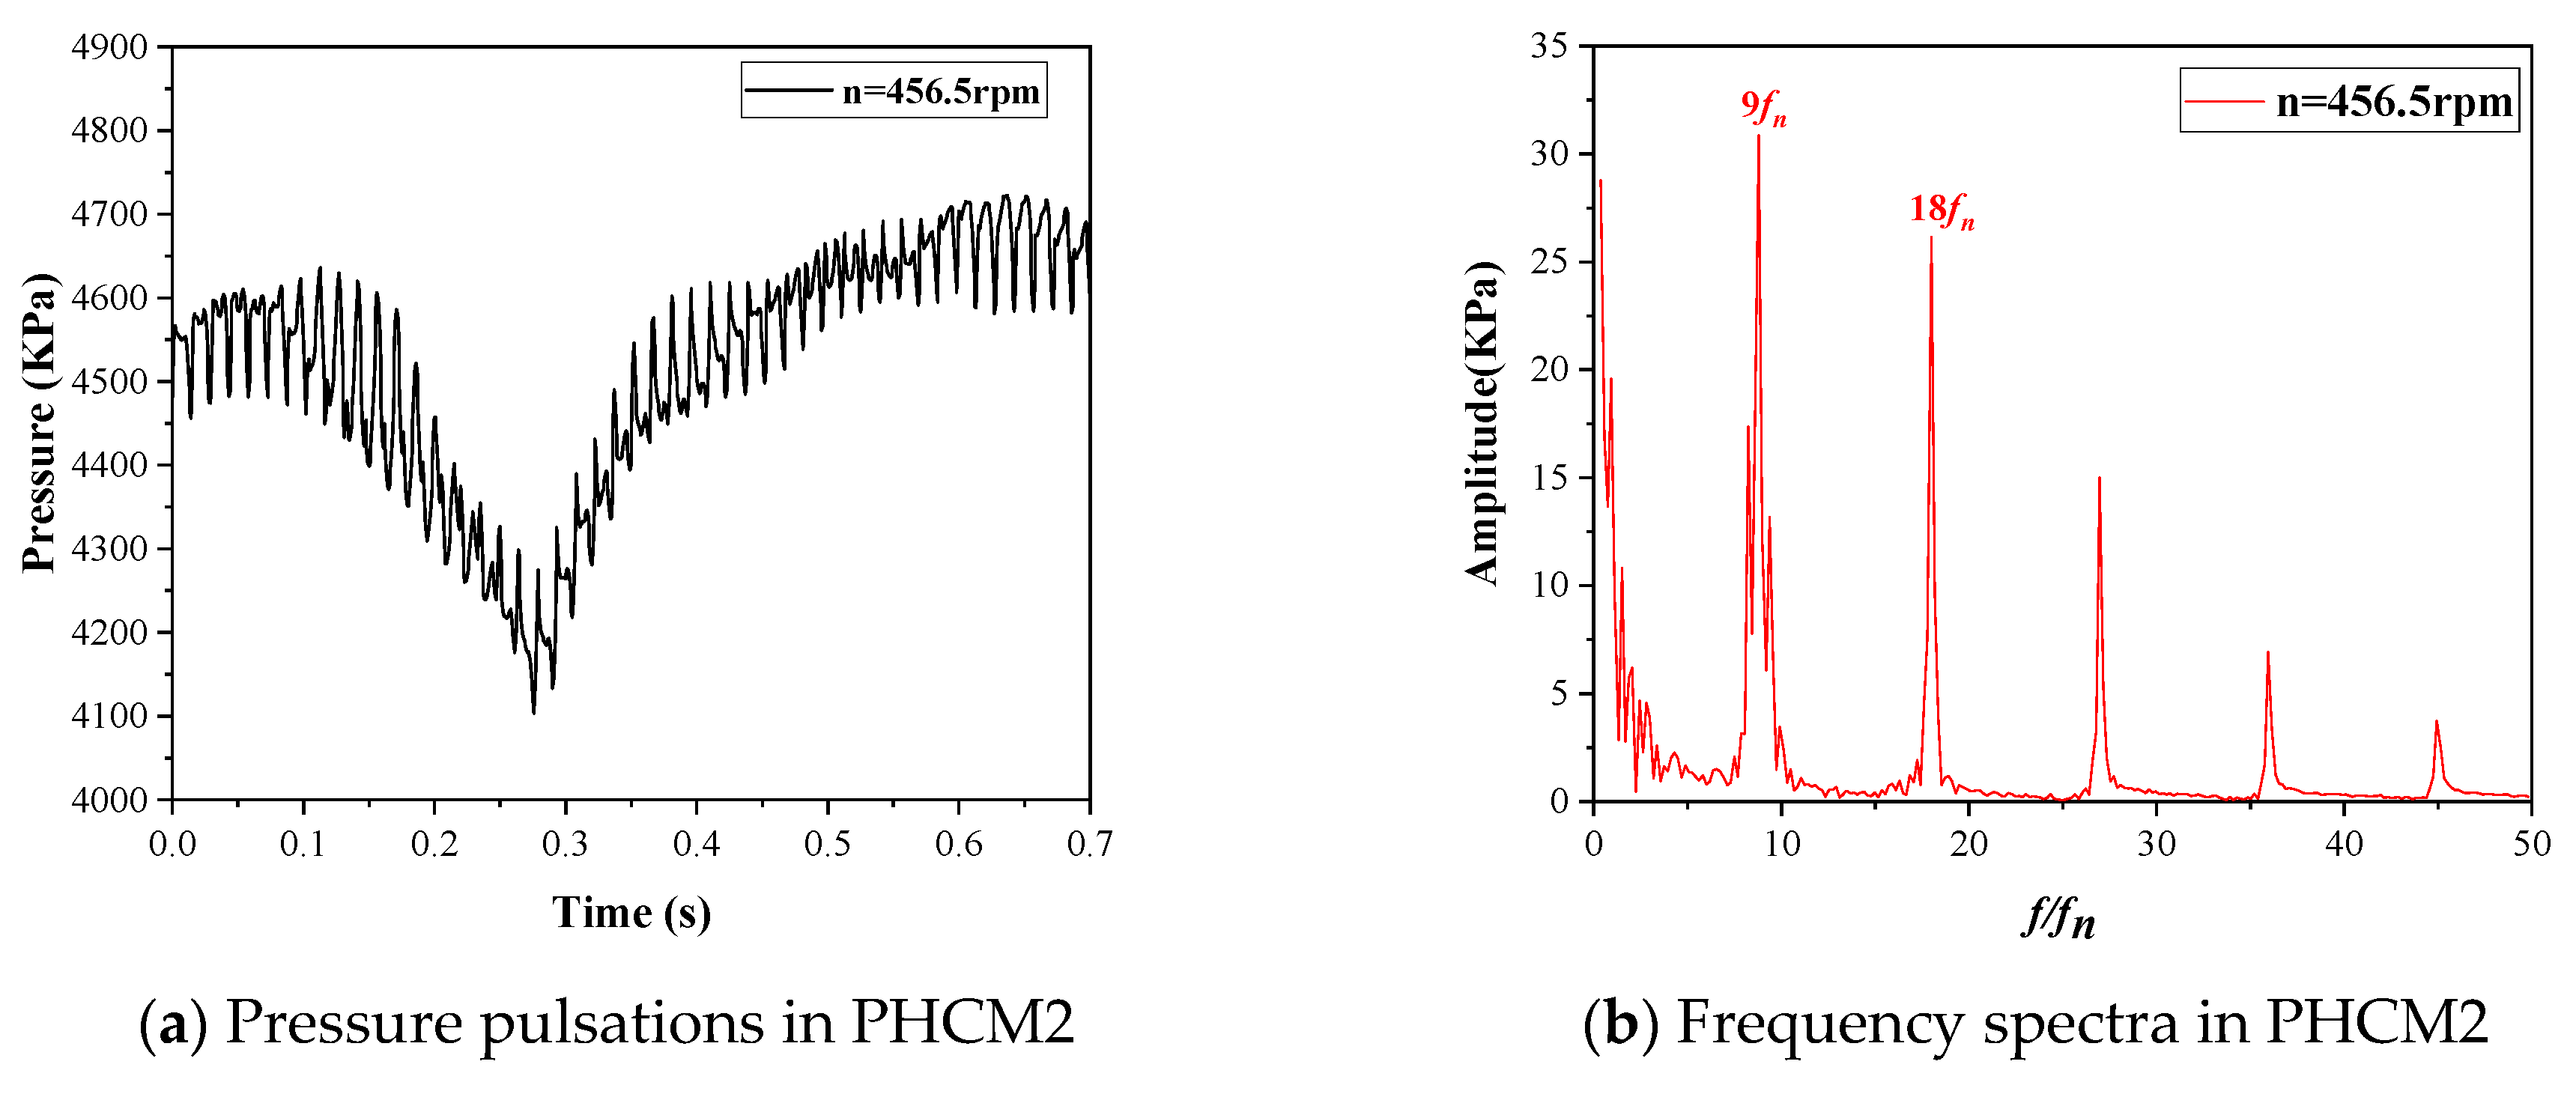
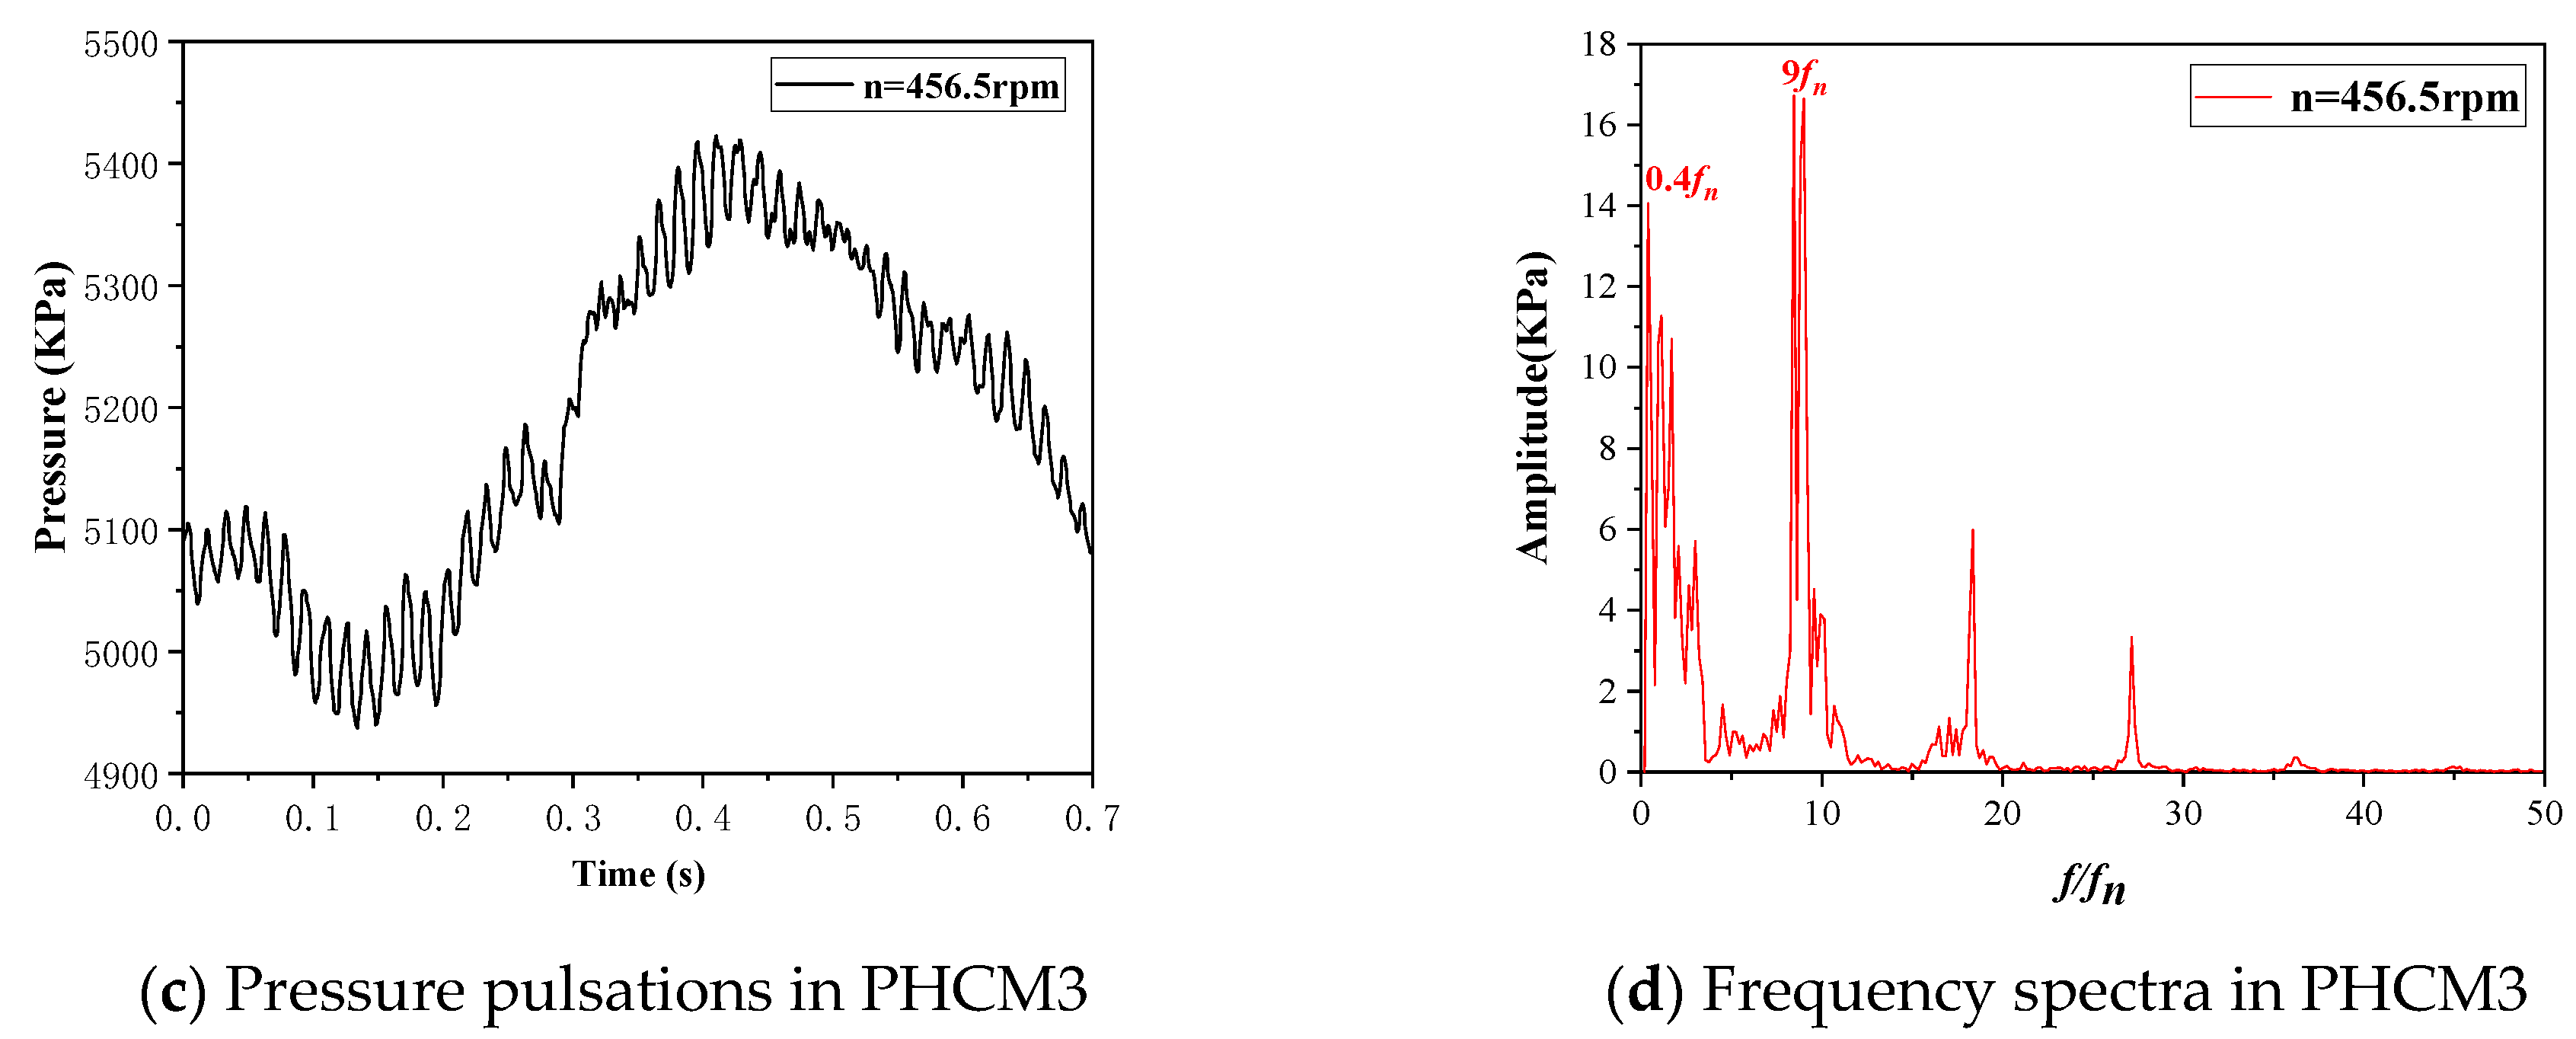
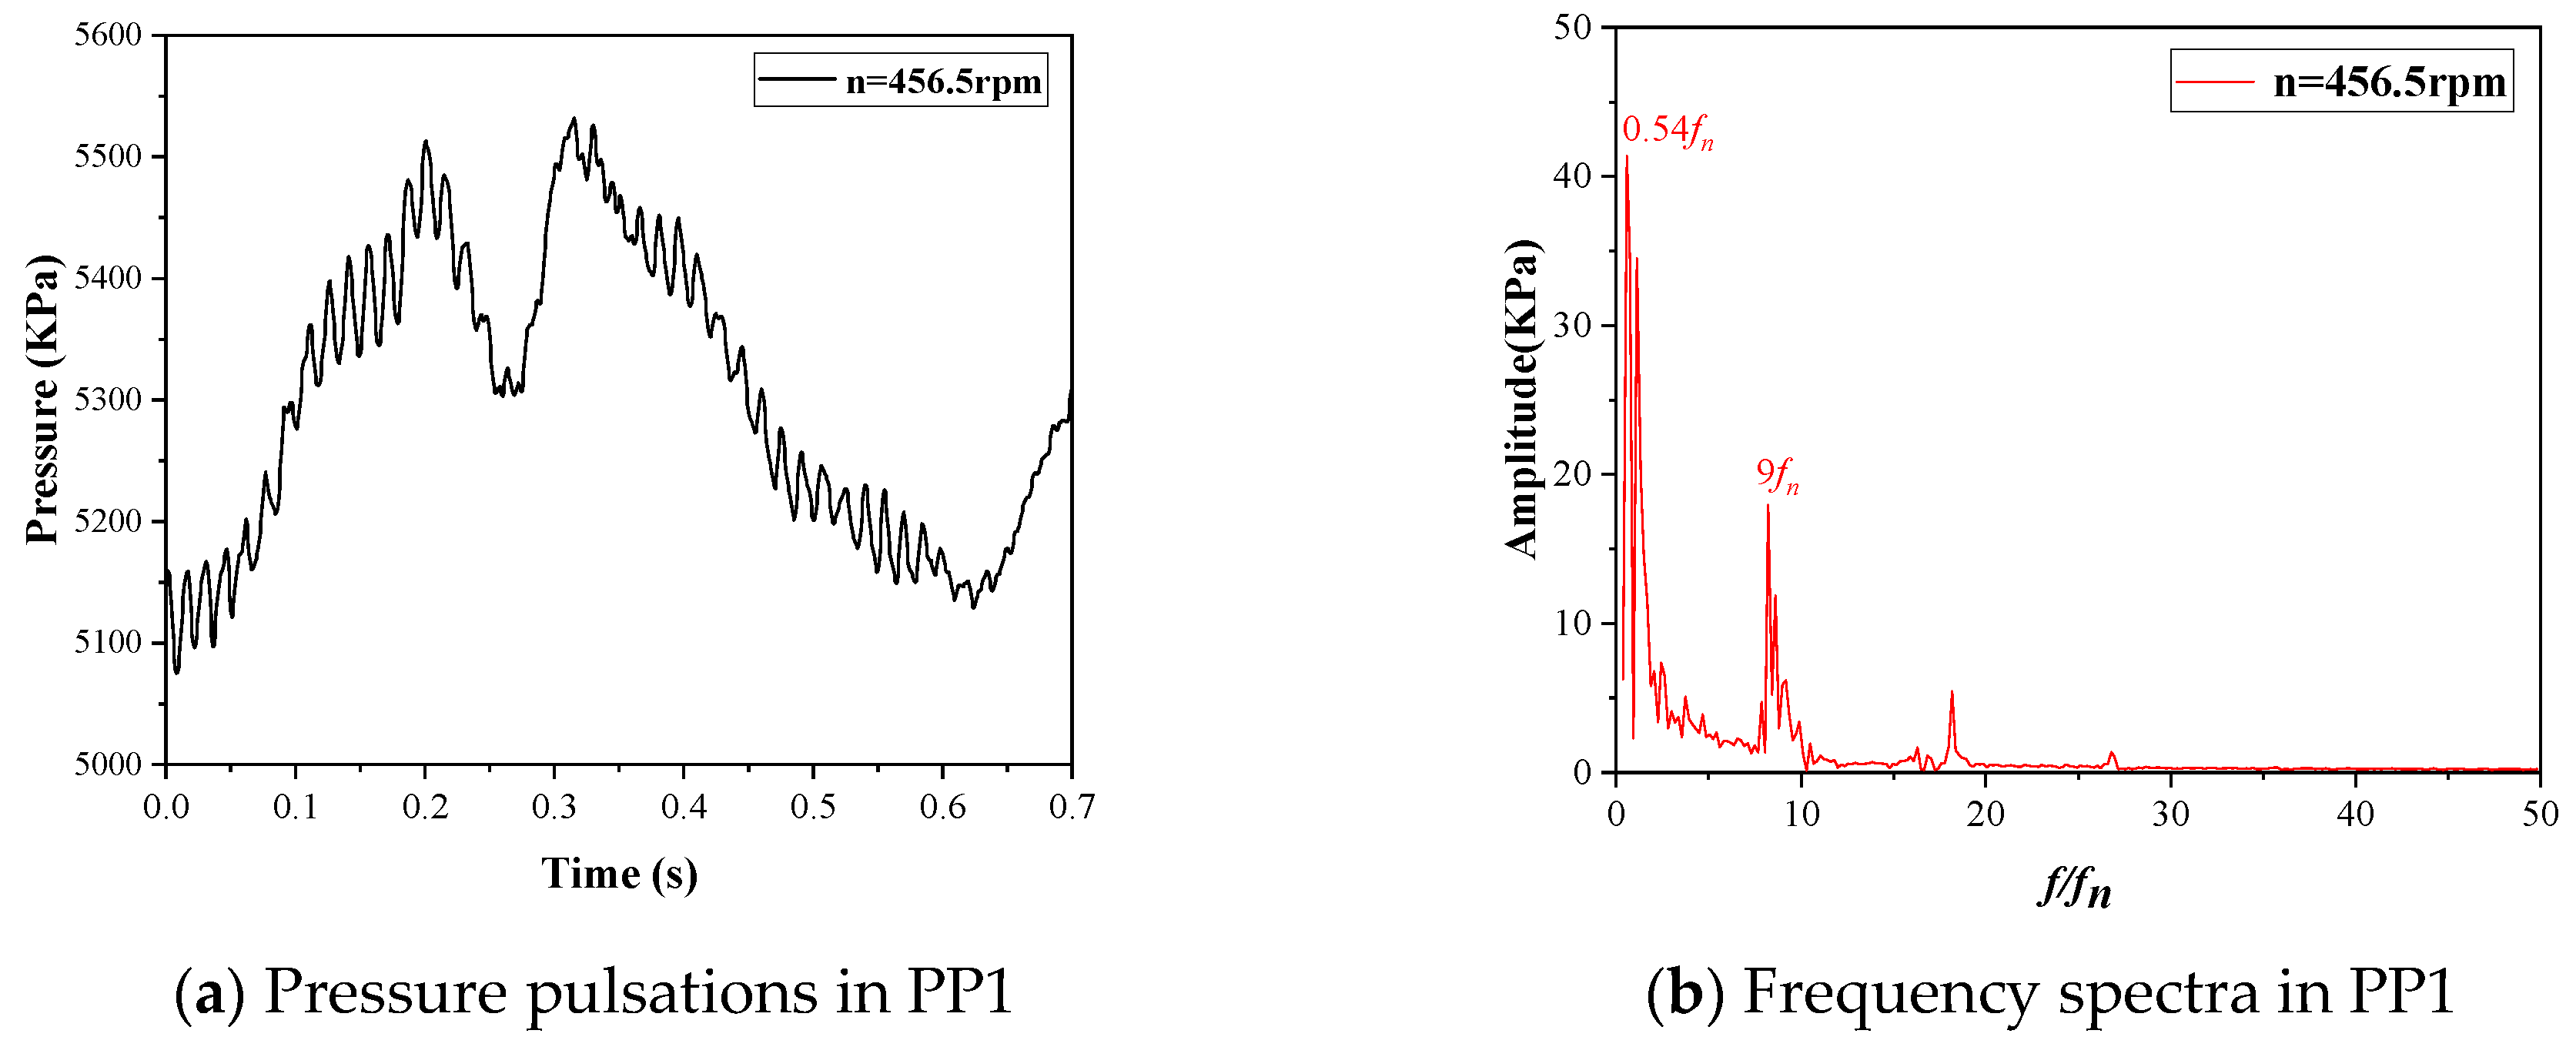
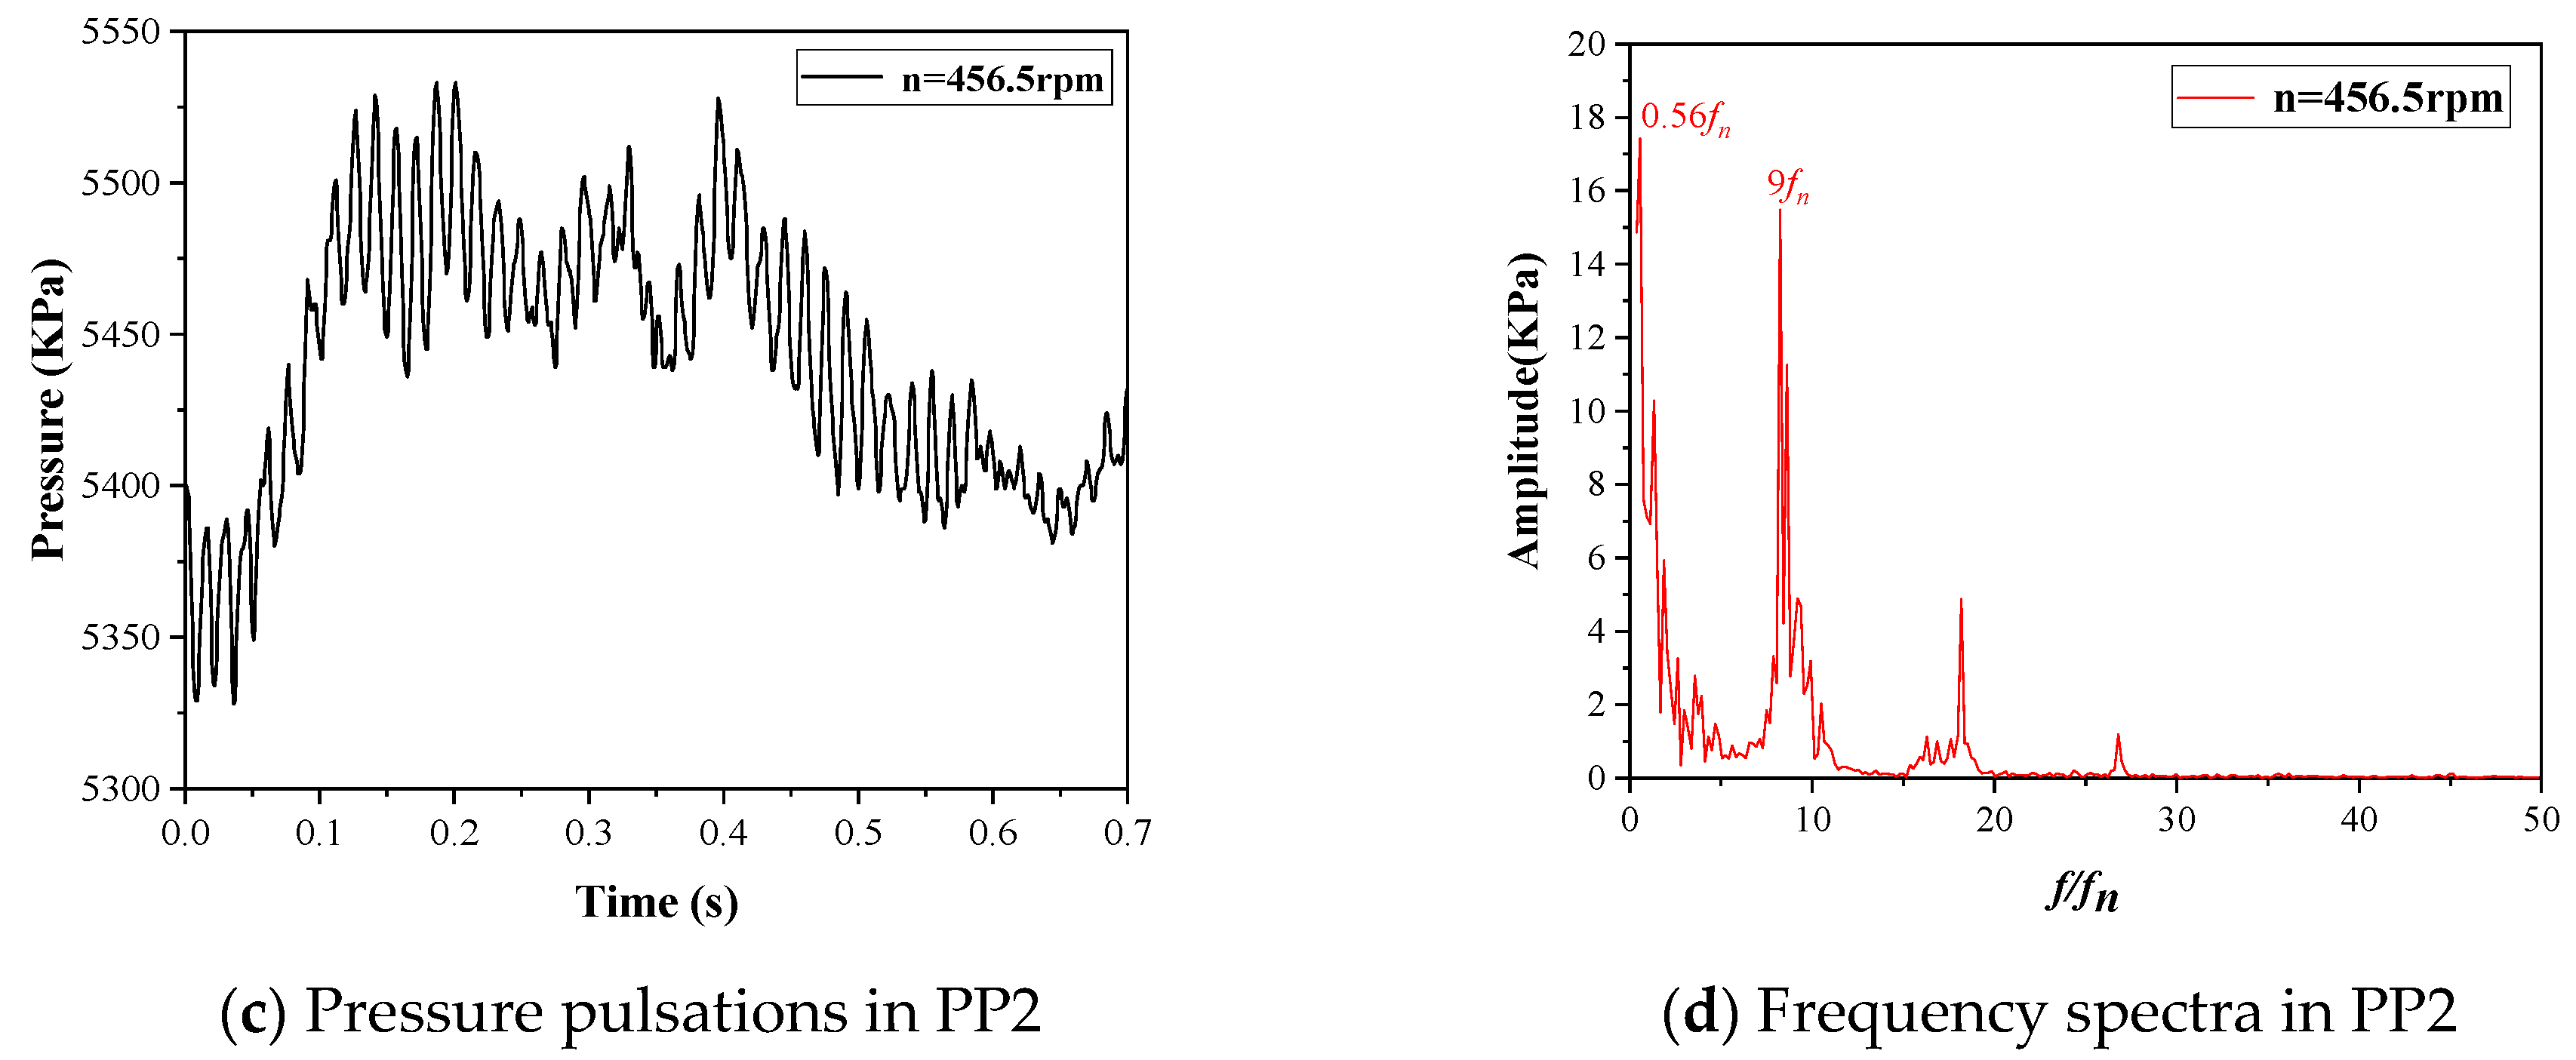
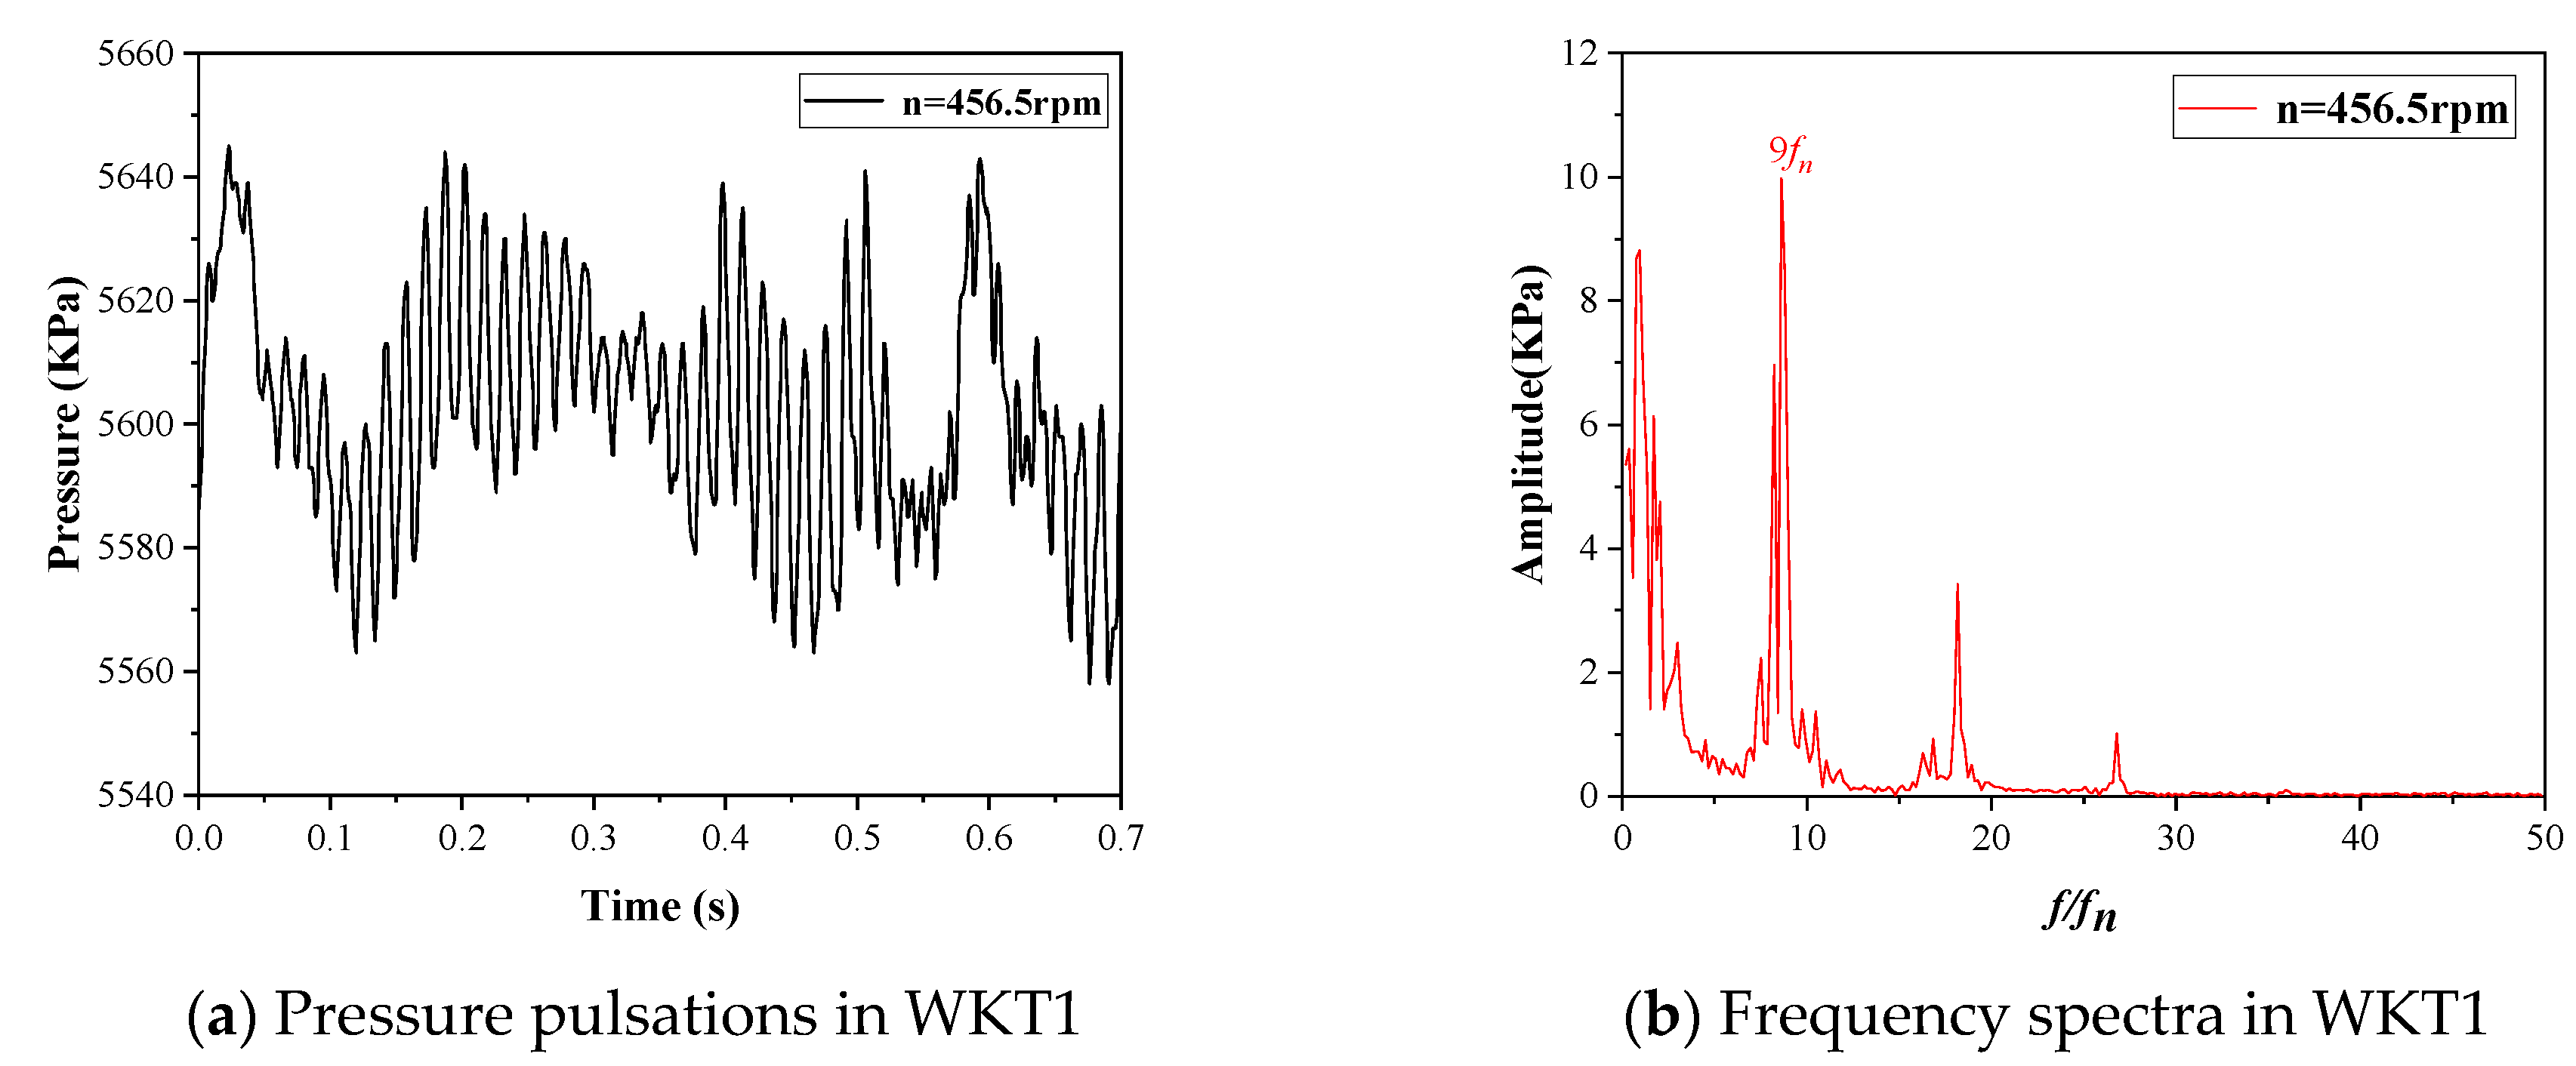
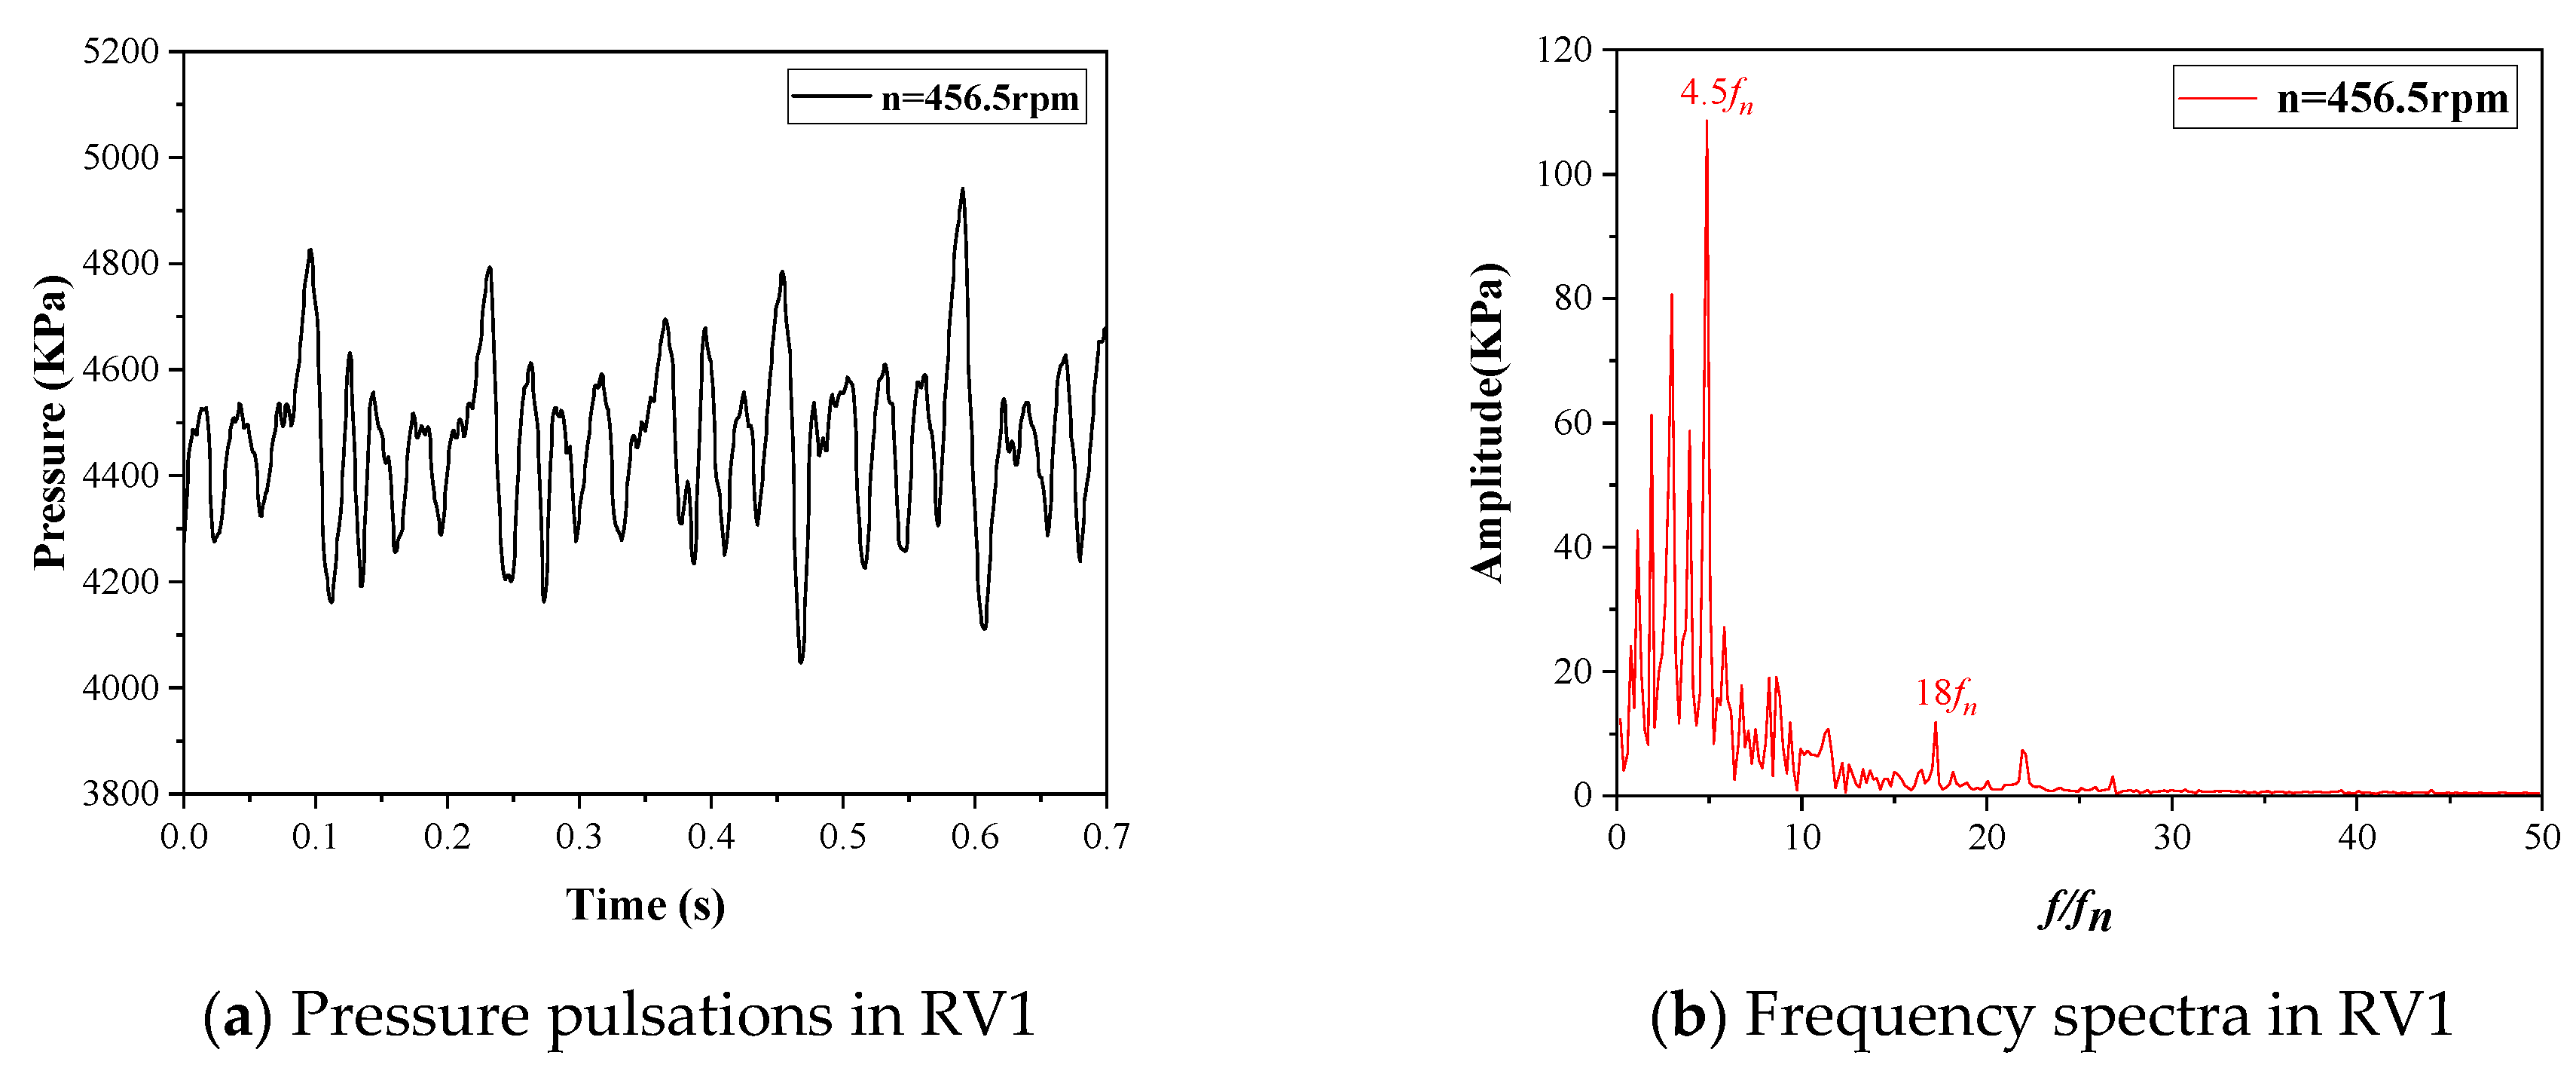
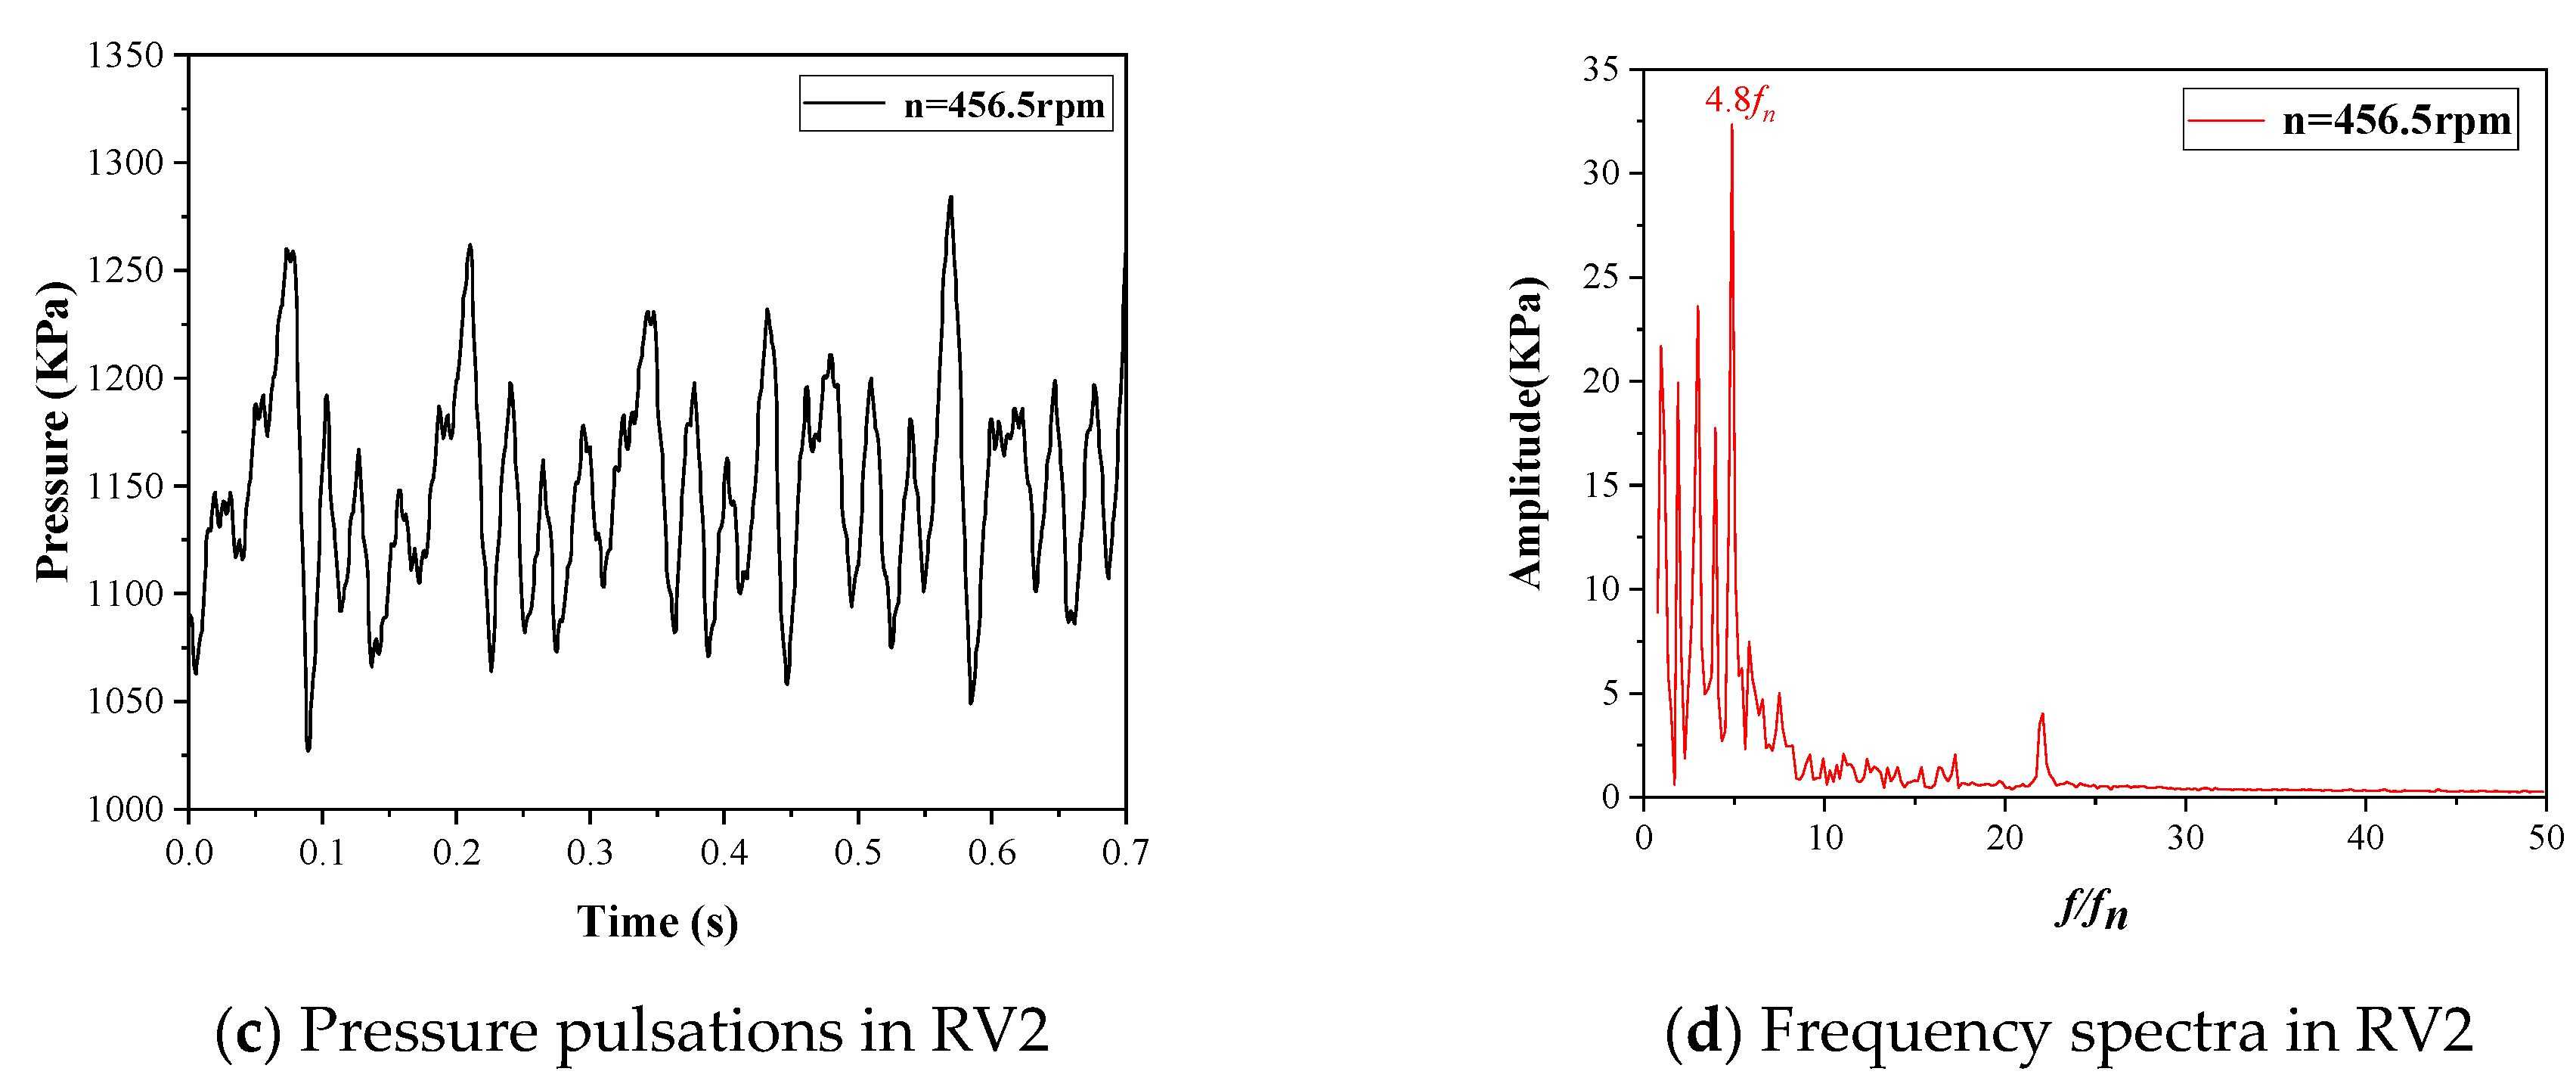
The pressure pulsation amplitude at the runner is the largest, followed by the leafless area. These two parts need extra attention in the hydraulic design. Through analysis of the pressure pulsation at each monitoring point, we found that the dominant frequencies of monitoring points at the gap, guide vane, and spiral case were all 9fn. However, the dominant frequency at the stay vane is 0.5fn at the low frequency and 9fn at the secondary frequency. The main frequency at the runner is also not 22fn, but 4.5fn, which is closely related to the complex flow in the vaneless space.
(d)
Under pump conditions, the axial hydraulic thrust fluctuates up to 24t with a dominant frequency of 9fn. The radial force fluctuates up to about 40t with a dominant frequency of 0.74fn.
(e)
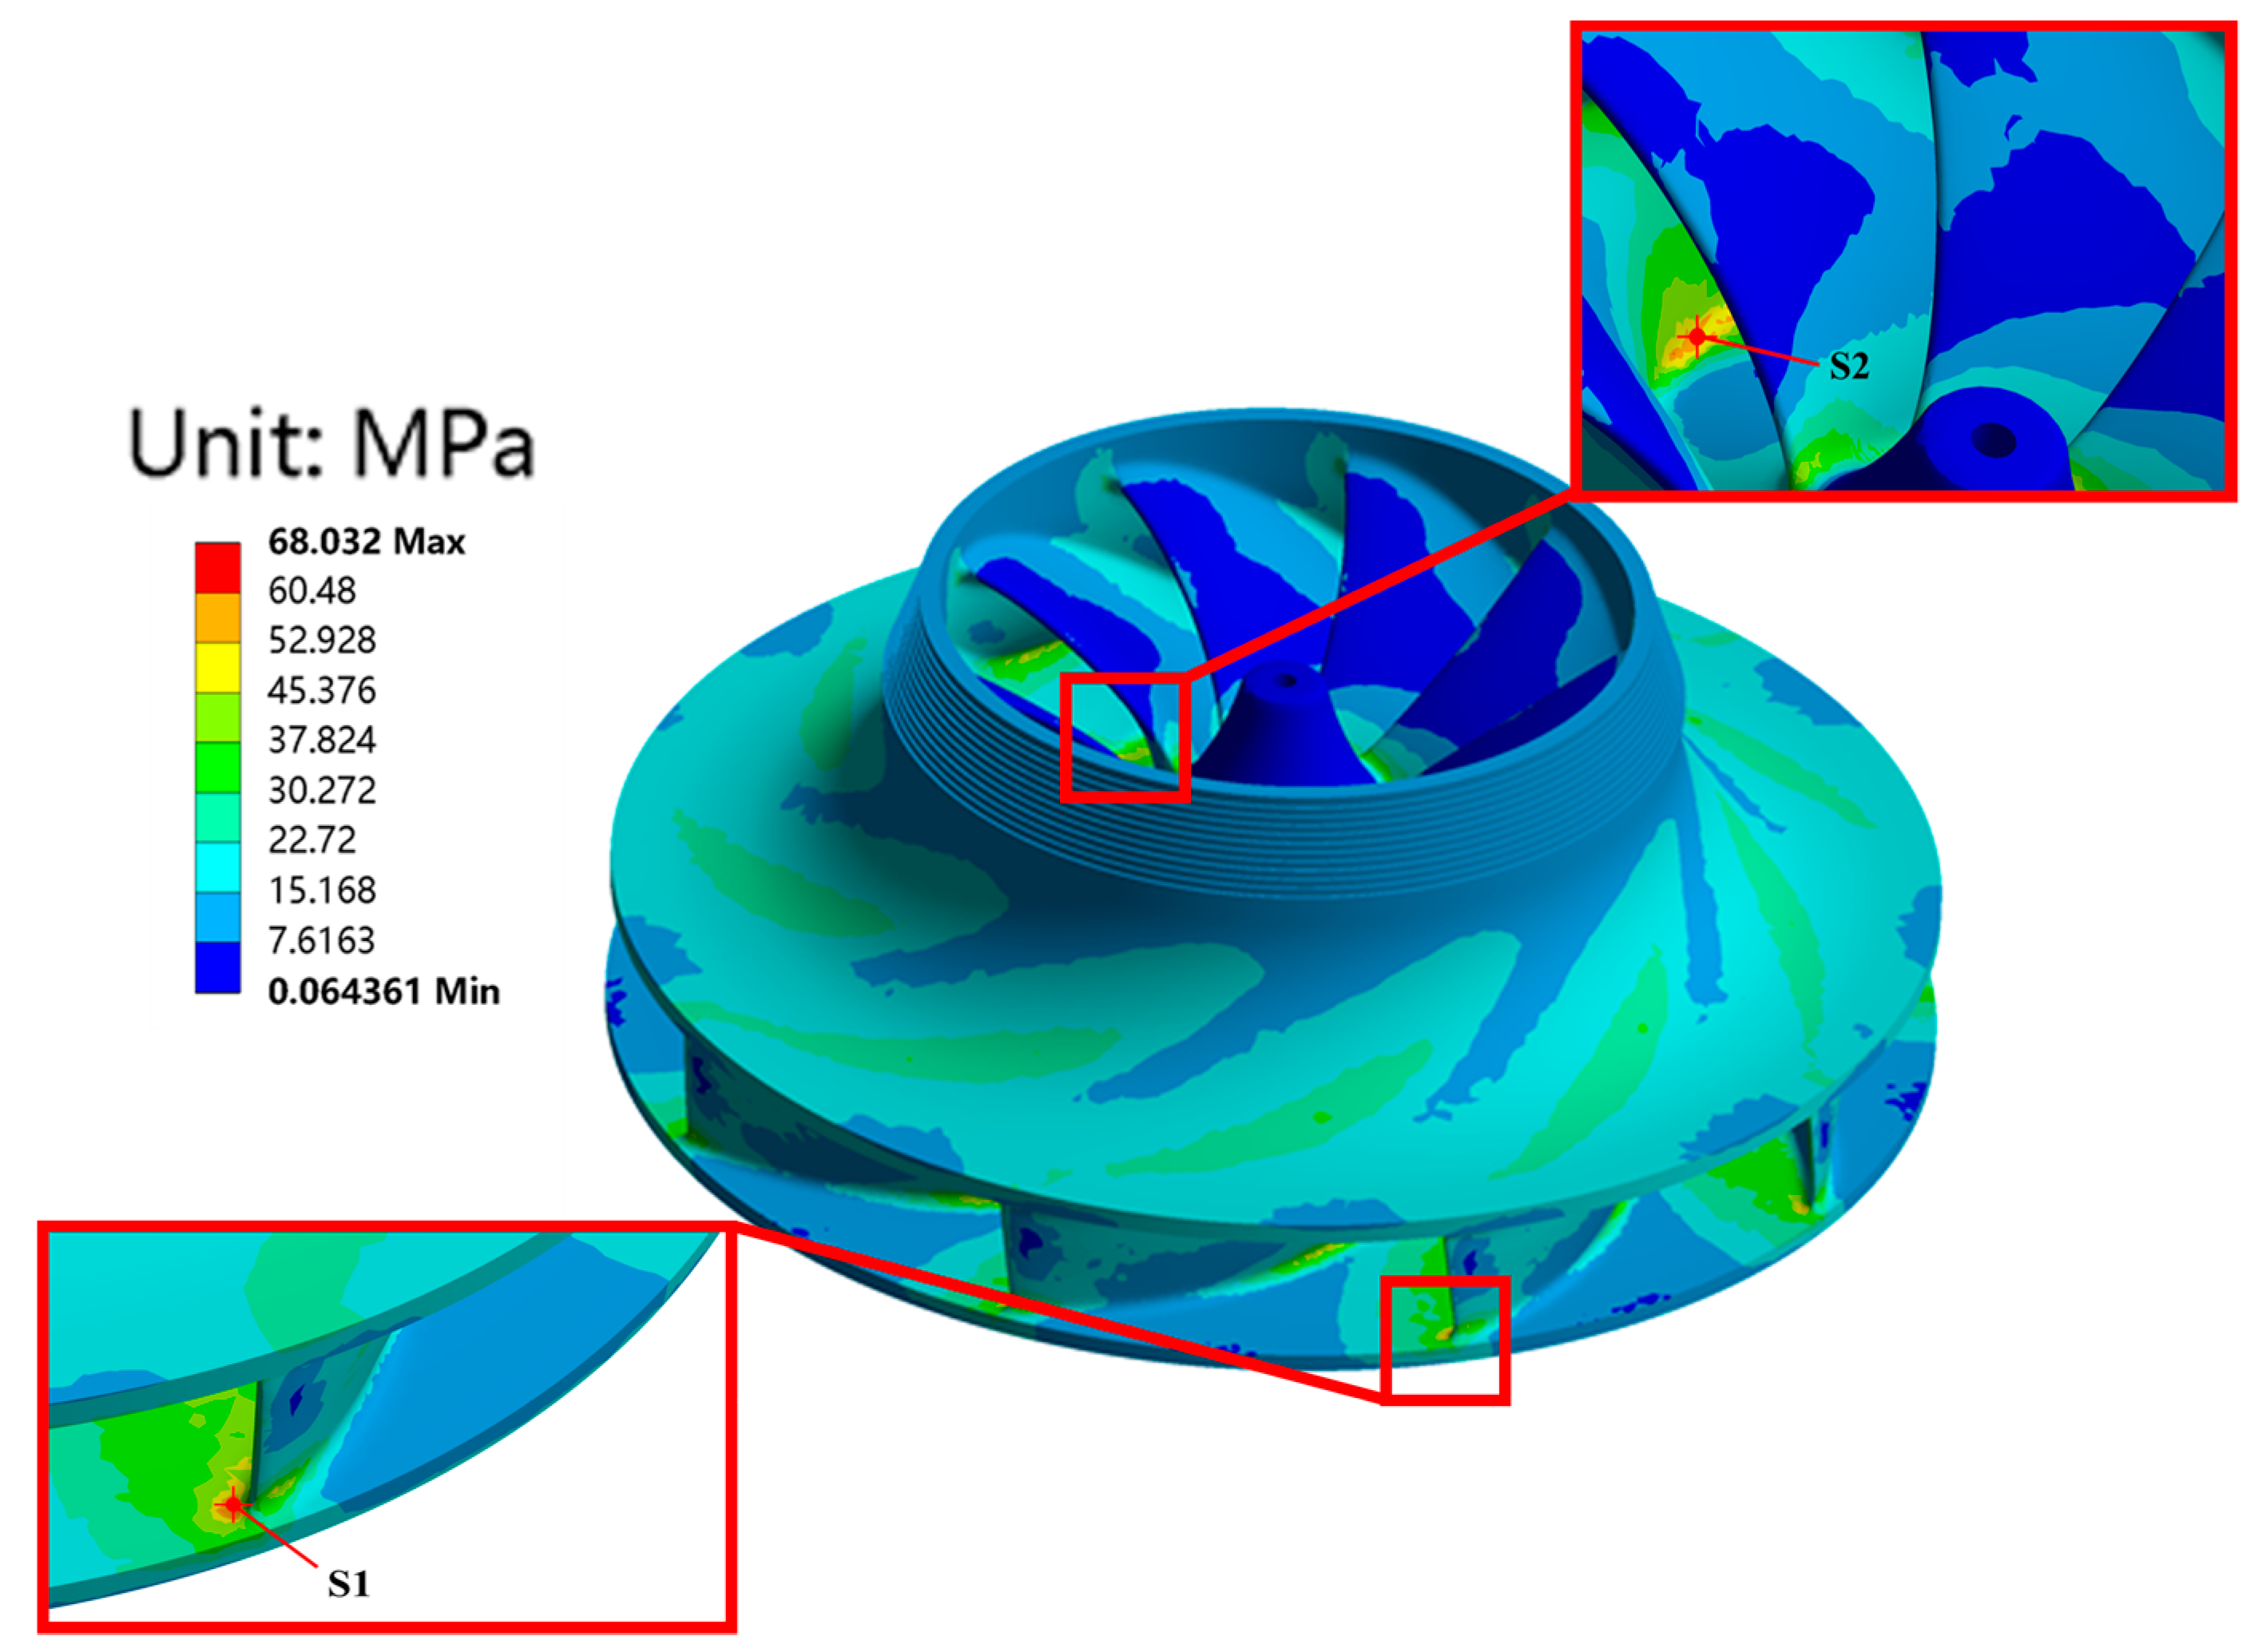
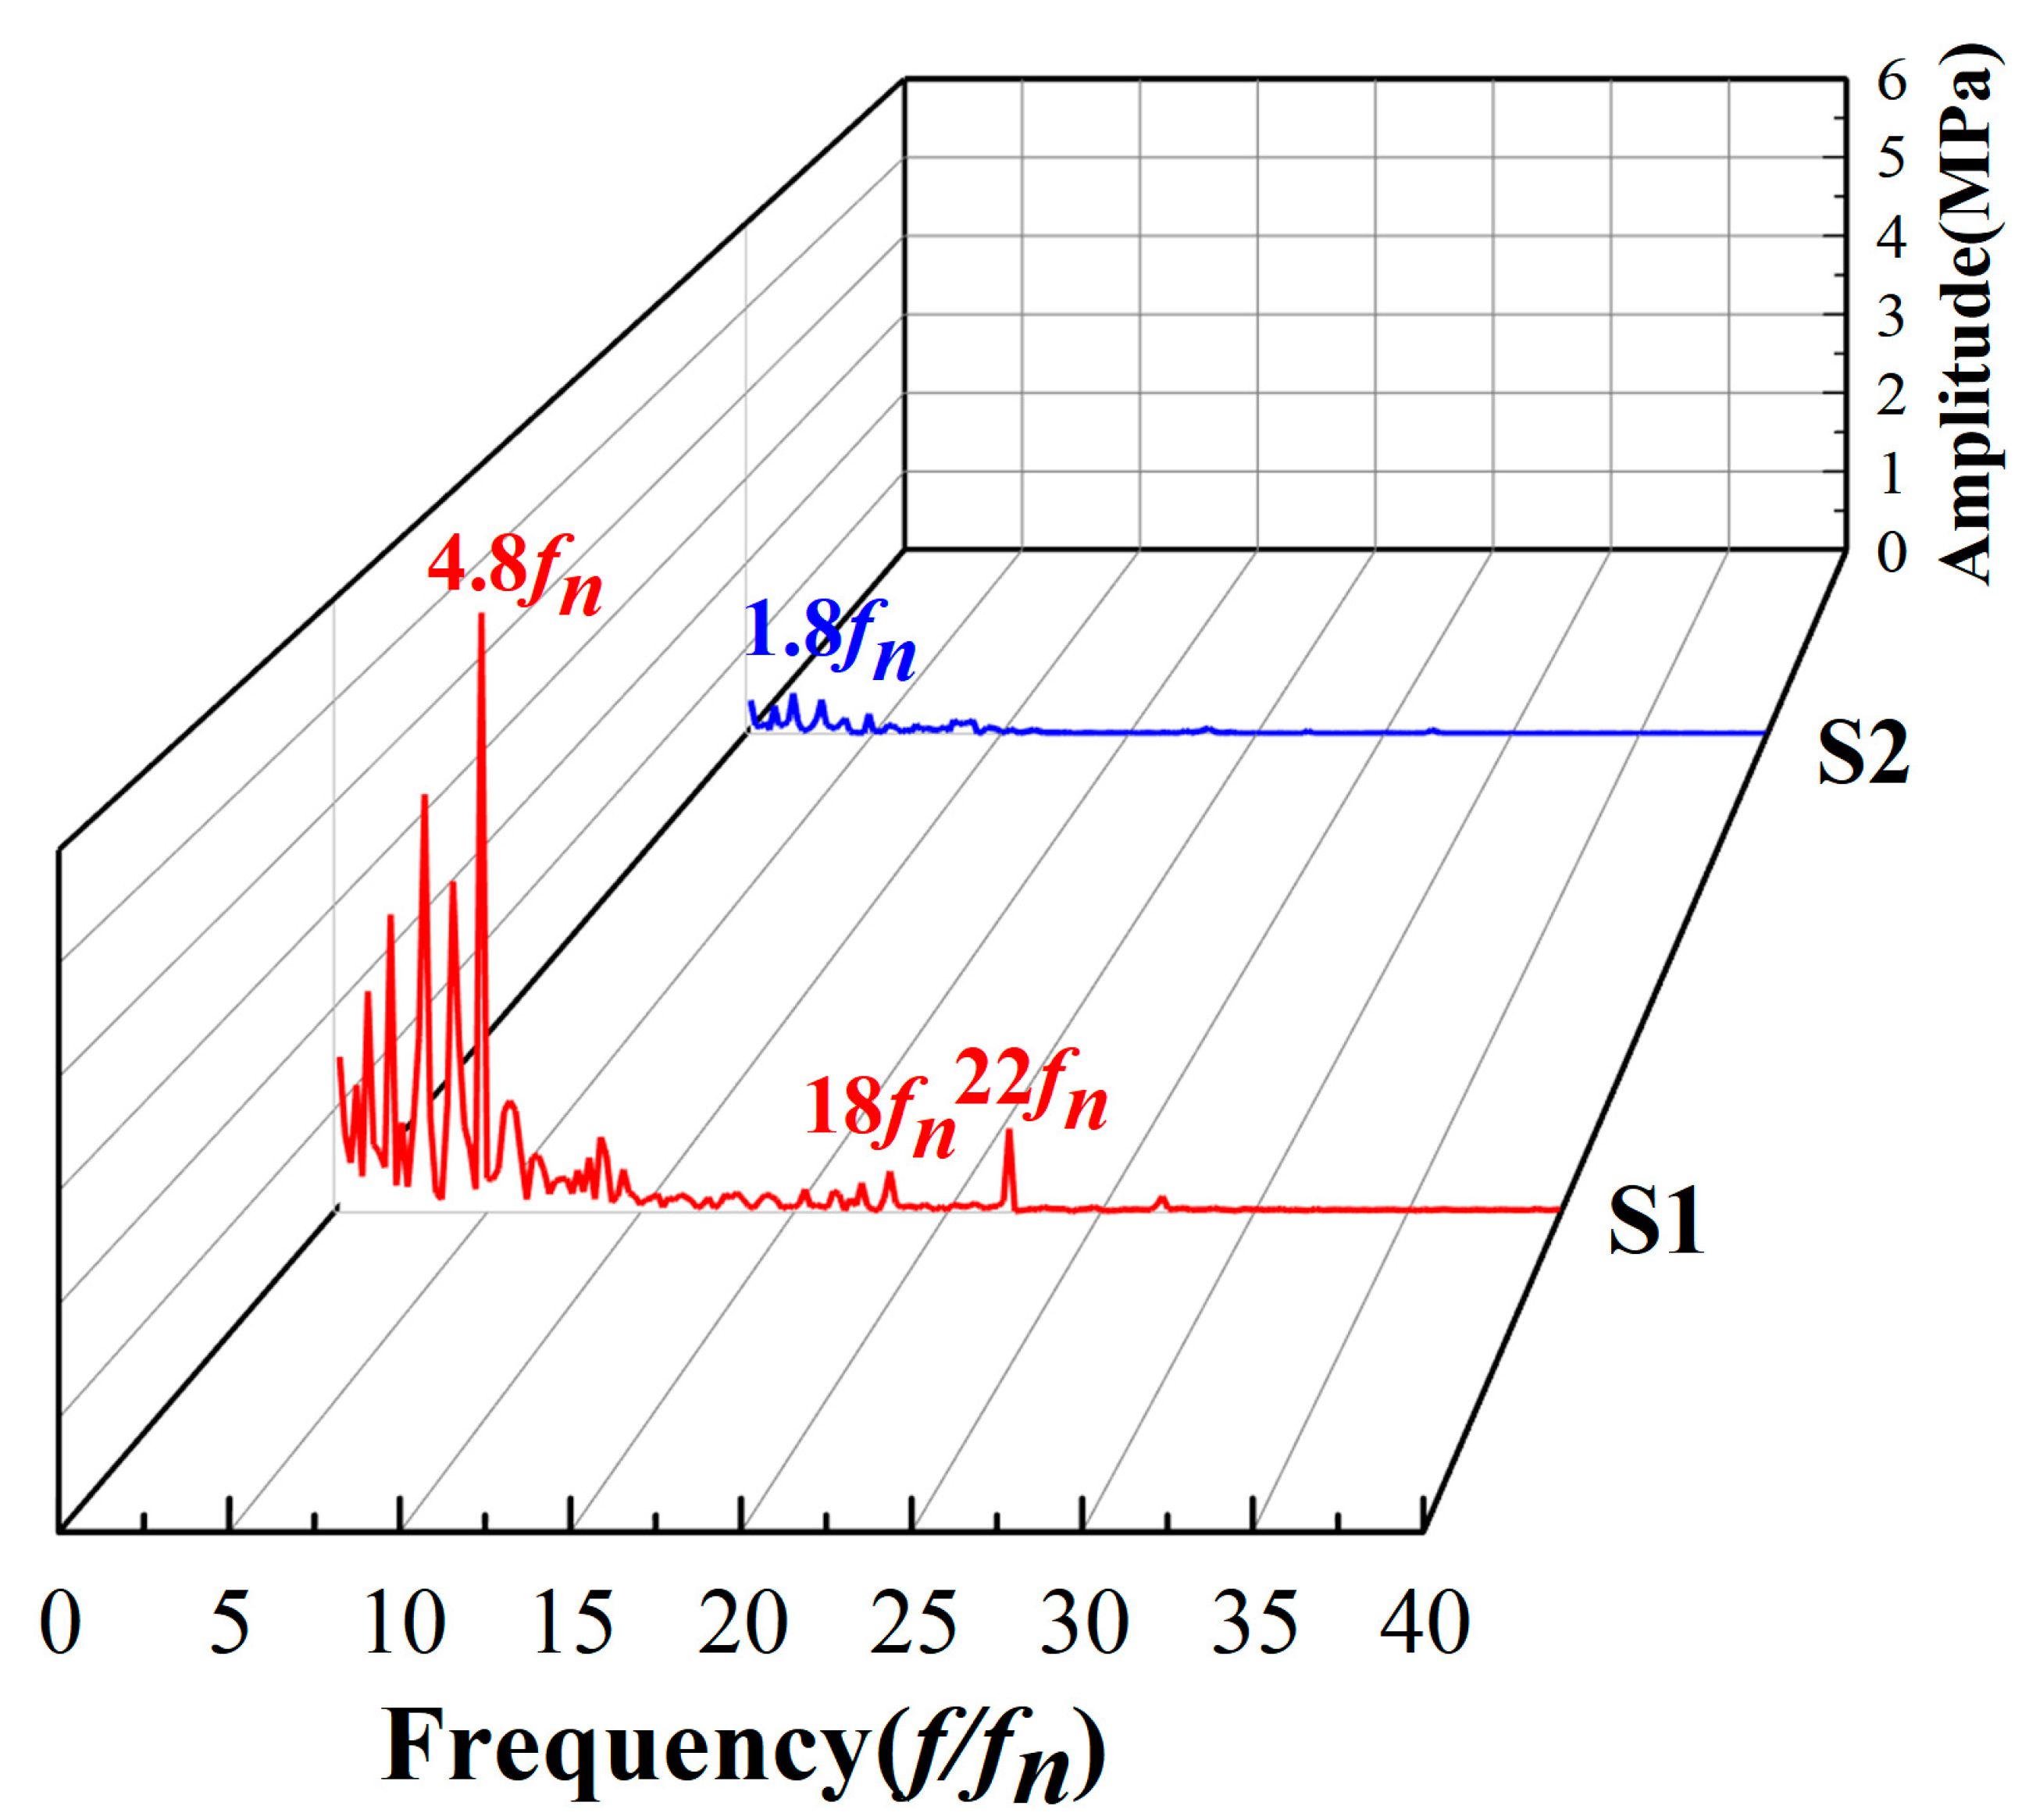
The deformation of the runner in the axial and radial directions shows an asymmetric pattern, and the deformation is greater in the radial direction compared to the axial direction. The dynamic stresses are mainly concentrated on the runner blades. The stress that the blades of the runner experience near the crown is greater. The stress dominant frequency at point S1 is 4.8fn, but there is also a frequency of 22fn, and the stress dominant frequency at point S2 is 1.8fn.
In general, this paper identifies the areas of maximum pressure pulsation in variable-speed pump turbines under pumping conditions through numerical simulations, as well as investigates the hydraulic thrust and the runner dynamic response, which can help improve the design of the runner and also enhance the unit’s safety and stability.

Author Contributions

Data curation, writing—original draft, L.S.; investigation, J.C.; formal analysis, L.W.; methodology, S.Y.; project administration, S.D.; software, Z.W. (Zichao Wei); validation, Z.W. (Zhengwei Wang); conceptualization, funding acquisition, writing—review and editing, X.L. All authors have read and agreed to the published version of the manuscript.

Funding

This research was funded by the Science and Technology Project of State Grid Xinyuan Group Co., Ltd.

Institutional Review Board Statement

Not applicable.

Informed Consent Statement

Not applicable.

Data Availability Statement

Not applicable.

Conflicts of Interest

The authors declare no conflict of interest.

References

  1. Zhang, L.; Guo, Y.; Wang, H.; Yang, X.; Lian, J. Research on Vibration Characteristics of an Underground Powerhouse of Large Pumped-Storage Power Station. Energies 2022, 15, 9637. [Google Scholar] [CrossRef]
  2. An, Z.; Wu, J.; Liao, W.; Tong, J.; Cheng, C.; Yu, J. Application of AC Excitation Variable Speed Pumped Storage Technology and Its Prospects. Pumped Storage Power Plant Eng. Constr. Anthol. 2018, 5, 268–272. [Google Scholar]
  3. Li, S.; Cao, Z.; Hu, K.; Chen, D. Performance Assessment for Primary Frequency Regulation of Variable-Speed Pumped Storage Plant in Isolated Power Systems. Energies 2023, 16, 1238. [Google Scholar] [CrossRef]
  4. Sambito, M.; Piazza, S.; Freni, G. Stochastic Approach for Optimal Positioning of Pumps as Turbines (PATs). Sustainability 2021, 13, 12318. [Google Scholar] [CrossRef]
  5. Moazeni, F.; Khazaei, J. Optimal energy management of water-energy networks via optimal placement of pumps-as-turbines and demand response through water storage tanks. Appl. Energy 2021, 283, 116335. [Google Scholar] [CrossRef]
  6. Tao, R.; Song, X.; Ye, C. Pumped Storage Technology, Reversible Pump Turbines and Their Importance in Power Grids. Water 2022, 14, 3569. [Google Scholar] [CrossRef]
  7. Cavazzini, G.; Houdeline, J.-B.; Pavesi, G.; Teller, O.; Ardizzon, G. Unstable behaviour of pump-turbines and its effects on power regulation capacity of pumped-hydro energy storage plants. Renew. Sustain. Energy Rev. 2018, 94, 399–409. [Google Scholar] [CrossRef]
  8. Guo, H. Technology and Application of AC Excitation Variable Speed Energy Storage Unit. South. Power Grid Technol. 2011, 5, 97–100. [Google Scholar] [CrossRef]
  9. Guo, J.; Bi, H.; Luo, G.; Wang, Z. Prediction on the axial water thrust characteristics of pump turbine runner under partial load. J. Phys. Conf. Ser. 2023, 2441, 012044. [Google Scholar] [CrossRef]
  10. Kong, L.; Cao, J.; Li, X.; Zhou, X.; Hu, H.; Wang, T.; Gui, S.; Lai, W.; Zhu, Z.; Wang, Z.; et al. Numerical Analysis on the Hydraulic Thrust and Dynamic Response Characteristics of a Turbine Pump. Energies 2022, 15, 1580. [Google Scholar] [CrossRef]
  11. Dompierre, F.; Sabourin, M. Determination of turbine runner dynamic behaviour under operating condition by a two-way staggered fluid-structureinteraction method. IOP Conf. Ser. Earth Environ. Sci. 2010, 12, 012085. [Google Scholar] [CrossRef]
  12. Svarstad, M.F.; Nielsen, T.K. Pressure pulsations during a fast transition from pump to turbine mode of operation in laboratory and field experiment. IOP Conf. Ser. Earth Environ. Sci. 2019, 240, 082006. [Google Scholar] [CrossRef]
  13. Liao, W.L.; Lei, X.L.; Zhao, Y.P.; Ruan, H.; Li, Z.H. Pressure pulsation in small opening operating mode of pump turbine’s turbine mode. IOP Conf. Ser. Earth Environ. Sci. 2018, 163, 012051. [Google Scholar] [CrossRef]
  14. Song, X.; Liu, C. Experimental investigation of pressure pulsation induced by the floor-attached vortex in an axial flow pump. Adv. Mech. Eng. 2019, 11, 1–13. [Google Scholar] [CrossRef] [Green Version]
  15. Donalek, P.J. Pumped Storage Hydro: Then and Now. IEEE Power Energy Mag. 2020, 18, 49–57. [Google Scholar] [CrossRef]
  16. Pavesi, G.; Cavazzini, G.; Ardizzon, G. Numerical Analysis of the Transient Behaviour of a Variable Speed Pump-Turbine during a Pumping Power Reduction Scenario. Energies 2016, 9, 534. [Google Scholar] [CrossRef] [Green Version]
  17. Iliev, I.; Trivedi, C.; Agnalt, E.; Dahlhaug, O.G. Variable-speed operation and pressure pulsations in a Francis turbine and a pump-turbine. IOP Conf. Ser. Earth Environ. Sci. 2019, 240, 072034. [Google Scholar] [CrossRef]
  18. Zhang, F.; Lv, Y.; Gui, Z.; Wang, Z. Effect of the Diameter of Pressure-Balance Pipe on Axial Hydraulic Thrust. J. Mar. Sci. Eng. 2021, 9, 724. [Google Scholar] [CrossRef]
  19. Mao, X.L.; Lu, J.H.; Yang, J.G.; Wei, D.; Li, T.; Zhang, N. Analysis of Inter-blade Vortex and Runner Blades Force of Pump Turbine during Load Rejection Period. IOP Conf. Ser. Earth Environ. Sci. 2021, 701, 012033. [Google Scholar] [CrossRef]
  20. Chen, F.; Bi, H.; Ahn, S.-H.; Mao, Z.; Luo, Y.; Wang, Z. Investigation on Dynamic Stresses of Pump-Turbine Runner during Start Up in Turbine Mode. Processes 2021, 9, 499. [Google Scholar] [CrossRef]
  21. Luo, Y.; Wang, Z.; Liu, X.; Xiao, Y.; Chen, C.; Wang, H.; Yan, J. Numerical prediction of pressure pulsation for a low head bidirectional tidal bulb turbine. Energy 2015, 89, 730–738. [Google Scholar] [CrossRef]
  22. Kan, K.; Xu, Z.; Chen, H.; Xu, H.; Zheng, Y.; Zhou, D.; Muhirwa, A.; Maxime, B. Energy loss mechanisms of transition from pump mode to turbine mode of an axial-flow pump under bidirectional conditions. Energy 2022, 257, 124630. [Google Scholar] [CrossRef]
  23. Ahn, S.-H.; Zhou, X.; He, L.; Luo, Y.; Wang, Z. Numerical estimation of prototype hydraulic efficiency in a low head power station based on gross head conditions. Renew. Energy 2020, 153, 175–181. [Google Scholar] [CrossRef]
  24. Song, X.; Liu, C. Experimental investigation of floor-attached vortex effects on the pressure pulsation at the bottom of the axial flow pump sump. Renew. Energy 2020, 145, 2327–2336. [Google Scholar] [CrossRef]
  25. Liu, D.; Xu, W.; Zhao, Y. Study of cavitation characteristics and operating characteristics of variable speed pumped storage units. Hydropower Pumped Storage 2020, 6, 36–45. [Google Scholar]
  26. Li, Z.; Bi, H.; Karney, B.; Wang, Z.; Yao, Z. Three-dimensional transient simulation of a prototype pump-turbine during normal turbine shutdown. J. Hydraul. Res. 2017, 55, 520–537. [Google Scholar] [CrossRef]
  27. Zuo, Z.; Fan, H.; Liu, S.; Wu, Y. S-shaped characteristics on the performance curves of pump-turbines in turbine mode—A review. Renew. Sustain. Energy Rev. 2016, 60, 836–851. [Google Scholar] [CrossRef]
  28. Braun, O.; Kueny, J.L.; Avellan, F. Numerical Analysis of Flow Phenomena Related to the Unstable Energy-Discharge Characteristic of a Pump-Turbine in Pump Mode. In Proceedings of the ASME 2005 Fluid Engineering Division Summer Meeting (FEDSM2005), Houston, TX, USA, 19–23 June 2005; pp. 19–23. [Google Scholar]
  29. Tanaka, H. Vibration Behavior and Dynamic Stress of Runners of Very High Head Reversible Pump-turbines. Int. J. Fluid Mach. Syst. 2011, 4, 289–306. [Google Scholar] [CrossRef]
  30. He, L.; Zhou, L.; Ahn, S.-H.; Wang, Z.; Nakahara, Y.; Kurosawa, S. Evaluation of gap influence on the dynamic response behavior of pump-turbine runner. Eng. Comput. 2019, 36, 491–508. [Google Scholar] [CrossRef]
  31. Egusquiza, E.; Valentín, D.; Liang, Q.W. Fluid added mass effect in the modal response of a pump-turbine impeller. In Proceedings of the ASME 2009 International Design Engineering Technical Conferences and Computers and Information in Engineering Conference, San Diego, CA, USA, 30 August–2 September 2009. [Google Scholar]
  32. Deriaz, P.; Warnock, J.G. Reversible Pump-Turbines for Sir Adam Beck-Niagara Pumping-Generating Station. Basic Eng. 1959, 81, 521. [Google Scholar] [CrossRef]
  33. Chang, X. Mechanical design of 300MW pump-turbine for Heimifeng pumped storage power station. Dongfang Electr. Rev. 2011, 25, 26. [Google Scholar] [CrossRef]
Figure 1. Simplification of the piping system and variable-speed pump turbine geometry model for a pumped storage power station.
Jmse 11 01493 g001
Figure 2. Monitoring points. (a) Monitoring point WKT1; (b) monitoring point PHCM1; (c) monitoring points PHCM2 (right) and PHCM3 (left); (d) monitoring points PP1 (right) and PP2 (left); (e) monitoring points RV1 (up) and RV2 (down).
Jmse 11 01493 g002
Figure 3. Distribution of grid nodes in variable-speed pump turbine.
Jmse 11 01493 g003
Figure 4. Flowchart of the work steps.
Jmse 11 01493 g004
Figure 5. Pressure distribution on the surface of the runner. (a) Pressure distribution on runner surface; (b) pressure distribution on crown surface; (c) pressure distribution on band surface.
Jmse 11 01493 g005
Figure 6. Pressure distribution on the surface of the runner in one rotational period.
Jmse 11 01493 g006
Figure 7. The flow passage streamline.
Jmse 11 01493 g007
Figure 8. Streamline of the middle plane of the pump condition.
Jmse 11 01493 g008
Figure 9. Time history and frequency spectra of pressure pulsation at PHCM1.
Jmse 11 01493 g009
Figure 10. Time history and frequency spectra of pressure pulsation at PHCM2 and PHCM3. (a) Pressure pulsations in PHCM2.
Jmse 11 01493 g010aJmse 11 01493 g010b
Figure 11. Time history and frequency spectra of pressure pulsation at PP1 and PP2.
Jmse 11 01493 g011aJmse 11 01493 g011b
Figure 12. Time history and frequency spectra of pressure pulsation at WKT1.
Jmse 11 01493 g012
Figure 13. Time history and frequency spectra of pressure pulsation at RV1 and RV2.
Jmse 11 01493 g013aJmse 11 01493 g013b
Figure 14. Time history and frequency spectra of the hydraulic thrust. (a) Time history of axial hydraulic thrust; (b) frequency spectra of axial hydraulic thrust; (c) time history of radial force; (d) frequency spectra of radial force.
Jmse 11 01493 g014aJmse 11 01493 g014b
Figure 15. Displacement on the runner.
Jmse 11 01493 g015aJmse 11 01493 g015b
Figure 16. The von Mises stress monitoring points S1 and S2 on the runner.
Jmse 11 01493 g016
Figure 17. The von Mises stress at the monitoring points.
Jmse 11 01493 g017
Figure 18. Frequency spectra of the dynamic stresses.
Jmse 11 01493 g018
Table 1. Variable-speed pump turbine specification parameters under pumping conditions.
Parameter NameSymbolsValues
Impeller exit diameterD2 (mm)2162.6
Impeller entrance diameterD1 (mm)408.4
Impeller blades numbernIM (−)9
Stay/guide vanes numbernSV/nGV (−)22/22
Spiral casing exit diameterDOUT (mm)2350
Draft tube entrance diameter DIN (mm)2197
Rated headHR (m)430
Rated dischargeQR (m3)79.16
Rated rotation speednR (r/min)428.6
Table 2. Mesh elements.
ComponentElement TypeElement Number
Spiral caseTetrahedra493,696
Stay vanesHexahedral579,660
Guide vanesHexahedral383,780
RunnerHexahedral2,008,124
GapHexahedral598,200
Pressure balance pipeHybrid72,236
Draft tubeHexahedral372,265
Total-4,389,241
Table 3. The simulation results and design parameters comparison.
ProjectsHead (m)Power (MW)
Simulation482.1344
Designed parameter471.2330
Error%2.3%4.2%
Disclaimer/Publisher’s Note: The statements, opinions and data contained in all publications are solely those of the individual author(s) and contributor(s) and not of MDPI and/or the editor(s). MDPI and/or the editor(s) disclaim responsibility for any injury to people or property resulting from any ideas, methods, instructions or products referred to in the content.

