Article

A Study on the Hydrodynamics and Coupling Effects of the Multibody Floating Photovoltaic (FPV) Concept

1
Digital Solutions, Det Norske Veritas, Shanghai 200336, China
2
Deepwater Engineering Research Center, Dalian University of Technology, Dalian 116024, China
*
Author to whom correspondence should be addressed.
J. Mar. Sci. Eng. 2023, 11(8), 1491; https://doi.org/10.3390/jmse11081491
Submission received: 28 June 2023 / Revised: 16 July 2023 / Accepted: 17 July 2023 / Published: 26 July 2023
(This article belongs to the Special Issue Offshore Wind Turbine Foundations)

Abstract

:
Floating photovoltaics (FPVs) have been developed rapidly in the past few years and will gradually become the “third pillar” of the photovoltaic industry. To better understand the performance of FPV floaters, this paper provides an in-depth study on the hydrodynamics of a single FPV module and the coupling effects of multiple modules. The results show that a conventional frequency domain approach, which includes both panel and Morison models, may not necessarily provide realistic results. Even after adding an additional damping matrix for the floaters based on empirical values from the oil and gas (O&G) industry, and a free surface damping model between the pontoons, the responses were still not convincing. Therefore, a nonlinear time-domain hydrodynamic solver was introduced. Further studies and comparisons were performed to understand the behavior of the module, and some updated damping coefficients were summarized. Thereafter, a multibody hydrodynamic model was built to check the coupling effects. With the additional damping surface on the gap surface among the modules, some attempts were made to derive reasonable results, when the model test was not available. Preliminary studies of both a scaled-down system (with 9 modules and mooring lines) and a full-scale system (with 90 modules, buoys, and mooring systems) were also investigated, and some initial results were demonstrated.

1. Introduction

Renewable energy has developed rapidly during the past decades, and its proportion in the total power generation has gradually increased. The share of renewable energy (wind and solar power, bioenergy, and geothermal power) in global primary energy is expected to increase from around 10% in 2019 to between 35% and 65% by 2050 in three different scenarios [1].
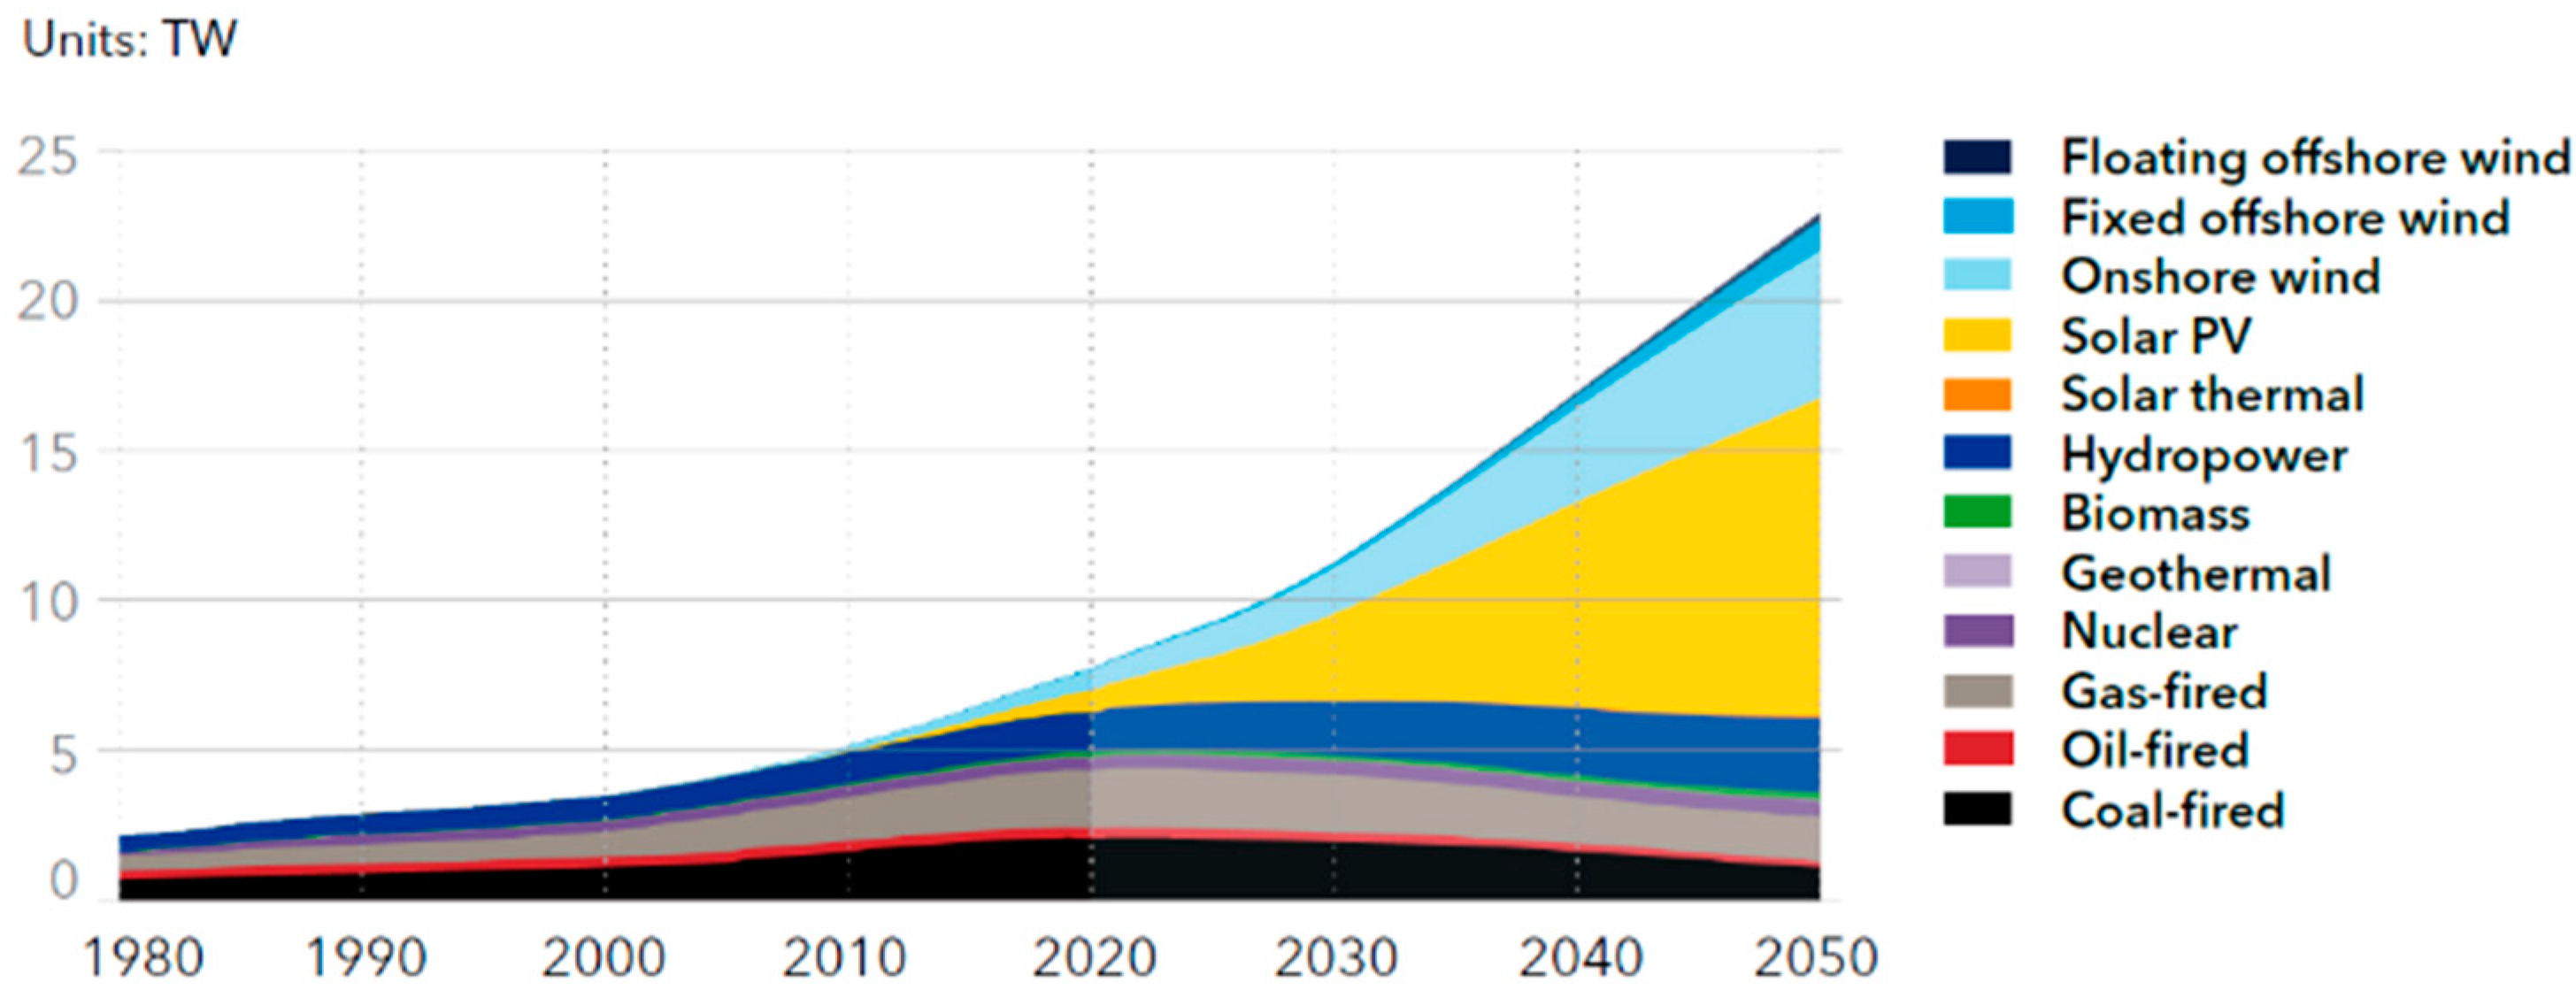
Among the renewable energy family, wind and solar power seem especially promising. With increasing deployment and module efficiency for solar and by higher load factors and lower operating costs of wind, the levelized cost of electricity (LCOE) generated from wind and solar power has fallen significantly [1]. Studies have shown that, in 2050, solar energy will serve a third of the world’s electricity demand [2], as shown in Figure 1.
Although the Capacity Factor of photovoltaics (PVs) may be lower compared to other renewable energy, such as hydroelectric plants, its other advantages, e.g., simple structure configuration, low development cost, and limited impact on the environment, has still accelerated its development globally. On the other hand, due to low PV panel efficiency (typically around 14%, which implies that a 1 MWp power station requires at least 15,000 m2 of land), onshore PV may potentially occupy large areas of land that cannot be used for other purposes (agriculture, pasture, etc.). Combined with other potential risks, the onshore PV market may face a contraction in some areas, such as Europe and North America [3].
Due to the above situation, in the past few years, FPV technologies, which install solar panels on floating platforms in the water, have become one of the most promising innovations and development directions. Compared with on-land PV, the FPV panels could be cooled down by the water, which may lead to a higher power generation efficiency. Moreover, the FPV plants are particularly suitable for areas with limited land areas but a high demand for electricity and water saving. Examples include irrigation reservoirs, hydroelectric dams, water treatment facilities, tailing ponds, and even aquaculture ponds. PV panels may also bring multiple benefits to these waters, such as reducing water eutrophication, inhibiting algae growth, protecting water sources, and making better use of water resources. Combining FPV power generation and hydropower generation to form a hybrid system has more advantages because it can make full use of existing power transmission infrastructure, be close to end users and markets, and increase power generation. Kim [4] put forward an alternative based on flexible thin-film PV that floats directly on the waterline and concentrated on the techno-economic appraisal of offshore PV systems in comparison to conventional marine renewable energy technologies. Thin-film PV was found to be economically competitive with offshore wind energy projects at certain latitudes. The specific yield was higher for thin-film PV than for wind, wave, and tidal barrage systems. In addition, the specific installed capacity was also higher than those of the other conventional technologies considered (excluding tidal current turbines). Lin [5] presented a new concept of conveying decommissioned FPSO as a platform for floating PV plants. The proposed PV system was designed to power offshore platforms or drilling rigs. Effects of tilt angle on energy outputs were evaluated through a frequency-domain hydrodynamic analysis of the FPSO. The results showed that roll motion has a larger negative effect on the total radiation on a collector, compared with pitch motion.
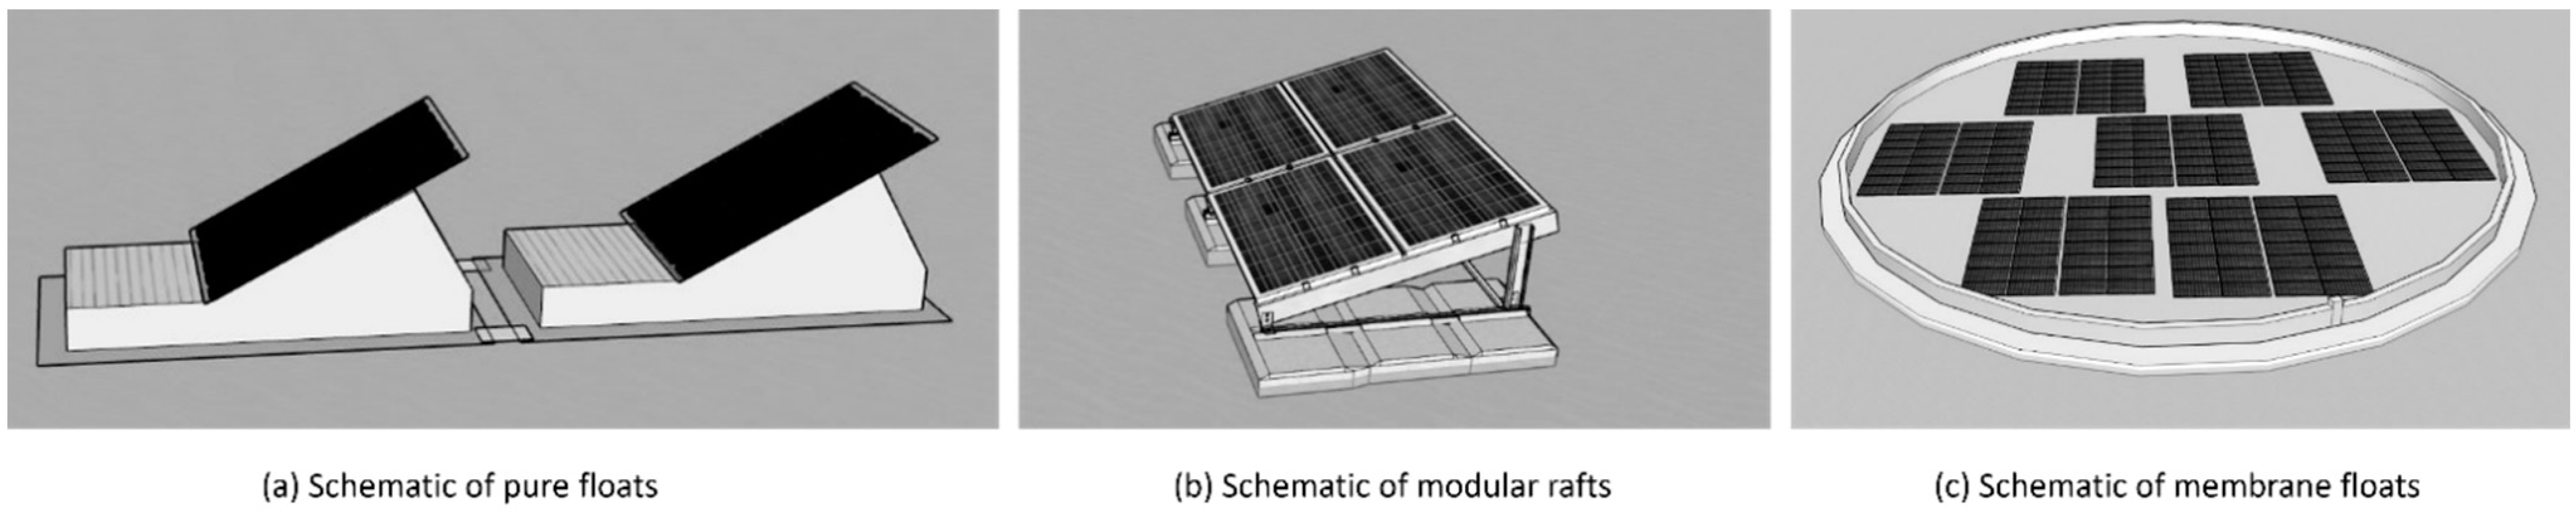
According to DNV-recommended practice, DNV-RP-0584, the most common FPV arrays are structurally defined into three main categories: (a) pure floats (or floats with PV modules), (b) modular rafts, and (c) membranes. See Figure 2 [6].
The first two types have similarities in terms of structure design and configurations, both of which include a large number of multiple floaters/modules linked by different kinds of connectors, whilst the third type has completely different structure characteristics. Patil [7] and Yousuf [8] gave reviews on floating solar photovoltaic power plants installed in the world and relevant technologies, showing the timeline of FPV concepts. These systems were either constructed for research purposes or for commercial use. All grid-connected systems are kept afloat using pontoons or floats with panels rigidly connected to these floats. However, it was also suggested to study optimization to improve the performance of FPV power plants. Choi [9] presented the structural design for the development of the floating-type photovoltaic energy generation system using pultruded FRP members. In the design of the system, finite element analysis was conducted using the mechanical property data measured by experiment. Kim [10] presented the design and construction process of a floating PV generation system with details of its actual construction. Moreover, they suggested the composition of the unit structure and the process for the construction of the large-scale floating PV generation complex. It was pointed out in the paper that for the commercialization of large-scale floating PV generation systems using FRP members, it may be necessary to develop appropriate elemental techniques, construction skills, mooring systems, etc. Friel [11] outlined technological variations in conceptual and installed designs of FPV installations. The paper also presented various studies of floating solar floaters, in the aspects of hydrodynamics, aerodynamics, structural analysis, aero-hydro-elastic coupled analysis and design, performance, and feasibility. With the proprietary nature of the FPVs and as the technology is still in an early stage of development, the literature and technical data of designs and installations are very limited. Many of the studies reporting floating solar systems were conducted as a technical feasibility analysis for the assessment of electrical performance, and the optimization of efficiencies with cooling, tracking, and concentrating mechanisms. The study of Baderiya [12] presented a preliminary mooring design method adapted to floating solar from a quasi-static perspective. It introduced a generic, analytical, and industry-used method to determine the loads due to waves, current, and wind on the floating island, and discussed the main design challenges for each case. Ikhennicheu [13] presented three reference cases for floating solar farms. The aim was to present one of the methodologies currently used in industry to perform a mooring design and to highlight the areas where further research was necessary before continuing to develop industrial projects. The results showed that wind loads dominate for all cases, except for the offshore conditions, where waves have a significant contribution to the total load (around 50%).
As for now, it seems that the hydrodynamic analysis for a single floater and coupling effects with a large number of modules have not been studied thoroughly yet in the FPV industry, and neither has the analytic approaches for mooring design.
The main purpose of this paper is to study the feasibility and fidelity of different numerical approaches in application to the analysis of floating PV. As the starting point of a large research project, the conclusions of the paper are also meant to provide some initial guidelines of the methodologies for the follow-up numerical studies and possible model test validations.
The paper is organized as follows. In Section 2, the concept of the floating PV, including the main dimensions of the single module, as well as the array system, is introduced. The different hydrodynamic methods, as well as the damping model used in the calculation, are briefly explained in Section 3. Section 4 starts with the frequency domain analysis of a single floater module, and then introduces the time domain solver to check the nonlinear hydrodynamics due to the low draft and small airgaps in the free surface areas between the pontoons. A comparison of the frequency domain responses with different damping combinations and the time domain results is also conducted and some damping coefficients are suggested. With proper damping coefficients from the first part of the analysis, in Section 5, a multi-body analysis is performed to check the hydrodynamic coupling. Also, a damping surface model is tested to obtain realistic responses of the system. Some further discussions of the hydrodynamic analysis are provided in Section 6. And in Section 7, time-domain-coupled analyses of a scaled-down system (with 9 modules and mooring lines) are conducted, followed by the building of a realistic FPV system (with 90 modules, 4 buoys, connectors, inner bridle lines, and mooring lines), and some preliminary results are presented. Finally, the main conclusions can be found in Section 8.

2. Analysis Concept

The parameters of a single module of the FPV example used in the study are shown in Figure 3. The main parameters are shown in Table 1. As this is a research project, the module was designed based on the summary of similar projects without commercial purpose.
Figure 4 shows the complete FPV system with the main parameters in Table 2.
The parameters of the mooring lines are shown in Table 3.

3. Potential Analysis, Free Surface Damping, and Nonlinear Hydrodynamics

A general approach to simulate this complex system is to first obtain the hydrodynamic analysis for a single module, and later use it to set up the multibody system with connectors and mooring systems in a coupled analysis solver.
In the current paper, the main analysis is carried out by using a frequency domain potential solver [14], whilst for the calibration purpose, which is explained a little bit later, a time domain potential solver [15] is also used in some analyses.
The potential theory as described by Newman [16] is applied to calculate first-order radiation and diffraction effects on large-volume structures. The implementation uses a 3D panel method to evaluate velocity.
The flow is assumed to be ideal and time-harmonic. The free surface condition is linearized for the first-order potential theory. The radiation and diffraction velocity potentials on the wet part of the body surface are determined from the solution of an integral equation obtained by using Green’s theorem with the free surface source potentials as the Green’s functions. The source strengths are evaluated based on the source distribution method using the same source potentials.
The assumption of potential flow allows for defining the velocity flow as the gradient of the velocity potential Φ that satisfies the Laplace equation in the fluid domain.
2 Φ = 0
In the frequency domain, the harmonic time dependence allows for defining a complex velocity potential ϕ related to Φ by
Φ = R e ϕ e i ω t  
where ω is the frequency of the incident wave and t is time. The associated boundary-value problem is expressed in terms of the complex velocity potential ϕ with the understanding that the product of all complex quantities with the factor e i ω t applies. The linearized form of the free-surface condition is
ϕ z K ϕ = 0 ,       o n   z = 0
where K = ω 2 / g . The linearization of the problem permits the decomposition of the velocity potential ϕ into the radiation ϕ R and diffraction ϕ D components.
ϕ = ϕ R + ϕ D
Compared to traditional O&G floaters, as the floaters of the FPV system normally have a small size and free board, several aspects may bring nonlinearities during the hydrodynamic analysis and need thorough investigation.
First, considering the shape of the module, the viscous forces on the rectangular pontoons may occupy a large proportion of the total wave forces. Two alternatives may be used here to include the loads. It could be represented as (part of) the global damping matrix, whilst if a more accurate estimation is needed, an equivalent beam model could also be included with the loads calculated with Morison theory.
More complexity comes from the free surface elevation, which may cause the motion resonances of the modules. It is known that linear potential flow theory over-predicts the free surface elevations in a confined waterplane area, for example, the gap between two ship-hulls or the moon-pool area of a drilling ship. The main reason for the differences between the potential solver and the experimental results may come from the fact that the viscosity in the confined waterplane may dominate the surface elevation and forces, whilst it may not be able to be well predicted with conventional potential theory.
In addition, according to Vada [17], the piston and sloshing modes may be excited in a resonance scenario of the moonpool. For a single FPV module, the area between the pontoons is relatively enclosed. It is also suspected that under certain wavelengths, these resonance modes may also be excited. In the O&G industry, this phenomenon has been observed for the semisubmersible platform, which has a similar shape configuration, although the latter has a much larger size.
Similarly, when it comes to multibody analysis, if the viscous effect is ignored, it is difficult to estimate the motion of the free surface among bodies, especially if they are in a large number of module arrays. Under a certain wavelength and direction, large elevations, so-called “gap resonance”, may be expected from the pure potential analysis. Such resonance may lead to large motion responses of the floater in some degrees of freedom, which may further amplify the resonance of the system and cause unrealistic analytic results.
The problem is illustrated in Figure 5.
The viscous forces will in general dissipate energy, and hence both the gap surface elevation and body motions should be reduced.
For the free surface damping model (which is also commonly referred to as the damping lid), many numerical and experimental studies have been conducted. Buchner [18] developed a time domain simulation model to predict the responses of an LNG FPSO alongside a moored LNG carrier, in which an impermeable surface lid was used to calculate the drift forces. Chen [19] introduced the multi-domain boundary element method (MDBEM) for bodies with a hull form including moonpools. The free surface damping was defined as proportional to the vertical displacement with opposite direction. In Markeng’s study [20], the relevant potential theories were summarized and two damping models were discussed.
  • The pressure damping model, in which an artificial pressure is introduced as a real physical effect, with the purpose of reproducing the same energy input to the system as the viscous damping forces. As the added pressure terms have actual physical meaning, the advantage of this approach is that it is easier to obtain theoretical values. However, during the numerical solution, the corresponding velocity potential is a nonlinear term, and the use of iterative calculations poses a convergence challenge.
  • Another method has primarily been used in the context of numerical beaches, in which a dissipation term is introduced into the kinematic free surface condition; therefore, only incoming waves are present at the outer boundary of the gap areas.
To suppress the unrealistic free surface elevations with a panel model placed on the confined water-plane area, an imposed damping free surface condition is introduced as follows [14]:
ϕ n = K ϕ 1 2 i ϵ ϵ 2 ,                   o n     S e
Comparing Equation (5) with (4), the additional terms with linear damping factor ϵ are added on the exterior free surface area S e .
The integral equation then becomes:
2 π 4 π ϕ X + S b ϕ ξ G ξ ; X n ξ d ξ + K 2 i ϵ + ϵ 2 S e ϕ ξ G ξ ; X d ξ = S b ϕ ξ n ξ G ξ ; X d ξ ,   X S b S e
where S b denotes the body mean wet surface. The Green function G ξ ; X represents the velocity potential at field point X due to a point source located at point ξ.
Zhao [21] compared the results of gap resonance analysis from several different solvers and provided a validation against the model test.
Due to the small size of the FPV modules, another consideration is the relatively large wet surface change, which may bring in wave impacts on the bottom and water on-deck. In such a scenario, the nonlinear effects may be very strong and difficult to estimate without model test results. Therefore, a nonlinear hydrodynamics code [15] is also used in the paper to check those effects and validate additional damping coefficients from the linear frequency domain method.

4. Single-Module Hydrodynamic Analysis

4.1. Frequency Domain Analysis

As a starting point, a single module is modeled and analyzed in the frequency domain. Figure 6a,b show the panel FEM model and Morison beam model, respectively, the latter of which is used to capture the viscous forces.
In a linear analysis, only the wet surfaces below the mean water level need to be created. And for the Morison beam model, only the drag coefficient is specified as the added mass is taken care of by the potential calculation.
The directions and periods used to generate the Response Amplitude Operate (RAO) are listed in Table 4.
The black curves in Figure 7 show the RAOs of roll and heave with a wave direction of 90 degrees. Some unrealistic roll response is caused, which may indirectly lead to large heave motion as well. An initial attempt is made to add an extra critical damping coefficient on the roll mode, as the blue lines in the RAO figures, which results in a decrease in both roll and heave responses. However, the roll motion is still beyond a reasonable value.
In this paper, we investigate the numerical treatment of irregular frequencies and moonpool resonance by using a Green’s function method. We look at the interaction of these two resonances and how much the moonpool resonance influences other results. We also look at the importance of the meshing including the addition of a mesh in the moonpool. Such a mesh is normally only used when we want to include damping of the moonpool resonance, but it is shown that including this mesh may be beneficial also without damping. Considering the wavelength of the sensitive period, it is suspected some resonance mode of the free surface is excited, which is further coupled with the roll mode. An initial investigation is shown in Figure 8. It seems a “sloshing” mode occurs, and a very high free surface elevation occurs under the lower deck.
To suppress it, a damping surface is added between the pontoons, as shown in Figure 9 (the red mesh surface panel between the pontoons), with the results shown as the red curves in Figure 10. The heave motion is further decreased while the damping surface does not affect the roll response in this case.

4.2. Time Domain Potential Analysis

Considering that we have already added the Morison beam model, together with critical damping coefficients and free surface damping, in the real design process, without the model test, it becomes difficult to further “refine” the frequency domain analysis, since the possible wave on-deck and/or wave impact on the bottom could bring strong nonlinearity in this case.
Therefore, a nonlinear time domain potential solver is used with the wet surface model extended to the upper and lower deck, as shown in Figure 11. The free surface mesh model is also created as needed in the analysis.
A comparison of linear and nonlinear analysis with the same model is shown first in Figure 12. The incoming regular wave is set up with the period around the peak response in the frequency domain analysis. The large roll (black curve) from the linear analysis corresponds to the frequency domain results, while the result from the nonlinear analysis (red curve) looks much more reasonable.
Figure 13 shows a snapshot of total dynamic pressure at 205 s. The bottom, the upper part of the inner and outer sides of the pontoon, and the upper deck are all subject to pressure in the nonlinear analysis.
We further investigate the pressure components, as shown in Figure 14. The radiation pressure is calculated on the panels below the mean water level (MWL), as shown in Figure 14a (the black lines). These are also the panel models used in most of the linear potential solvers. By considering the simultaneous wet surface, the dynamic pressures above the MWL can be obtained, as shown in Figure 14b,c. It is then very obvious that the nonlinear effects from the change in the wet surface cannot be ignored for such an FPV module concept, as the total pressure shown in Figure 14d.
Additionally, the lower surface of the upper deck of the FPV module is above the MWL in a still-water condition but would be subject to some pressure when the wave hits it. This part of the loads would not be captured in a linear analysis either, as shown in Figure 13a.
Although the nonlinear hydrodynamic analysis may provide a more accurate analysis, it may not be practical for a comprehensive study, due to heavy calculation efforts and the need for statistical post-processing. However, it may be used as a calibration reference in the earlier design phase when model test results are not available. As an example, an attempt to obtain a “proper” critical damping coefficient is shown in Figure 15, where the blue curve shows a linear analysis with a critical roll damping coefficient of 0.8, which results in a similar magnitude. However, 0.8 is unusually large for critical damping; therefore, in a real project, a model test may still be needed to further investigate the response.
A similar practice could be performed for heave response as well, as shown in Figure 16, in which a critical damping of 0.25 is added. It is still a large value compared to conventional offshore structures.

4.3. Frequency Domain Analysis with Morison Beam Model, Free Surface Damping, and Critical Damping Coefficients

With the above parameters and refined panel mesh, an updated frequency hydrodynamic analysis is performed including the following combinations of factors, as shown in Table 5.
Critical damping matrices 1 and 2 represent the different heave (C33) and roll (C44) damping coefficients, which are equal to (0.1, 0.05) and (0.25, 0.8), respectively. The former is the empirical value from the O&G industry and the latter is from the previous single-body nonlinear analysis comparison.
Results are shown in Figure 17 and Figure 18 (the plot on the right of each figure is a “zoom-in” by only including analyses (c)–(f)).
Analysis (a) represents a baseline case where only linear potential loads are considered. In this case, it ends up with unrealistic large motions. (b) partially includes the viscous force on the pontoons, which is well reflected in the heave motion. (c) considers the possible resonance on the free surface between the pontoon, which gives an even more realistic heave response, but has limited effects on roll motion. (d) is an attempt to use empirical damping coefficients from similar structures in the O&G industry. The results of heave seem similar to the those in analysis (e), which uses damping matrix 2 only. For the roll motion, it seems that a damping coefficient that is calibrated with nonlinear analysis is necessary anyway, if we compare the results from analyses (c), (d), (e), and (f) in Figure 18. This is, however, understandable based on previous discussions, as the larger nonlinearity may exist.
Considering the modeling and calculation effort in time domain analysis, when model tests results are not available, especially in the preliminary design and analysis phase, it may be more engineering-efficient to directly use critical damping matrix 2.

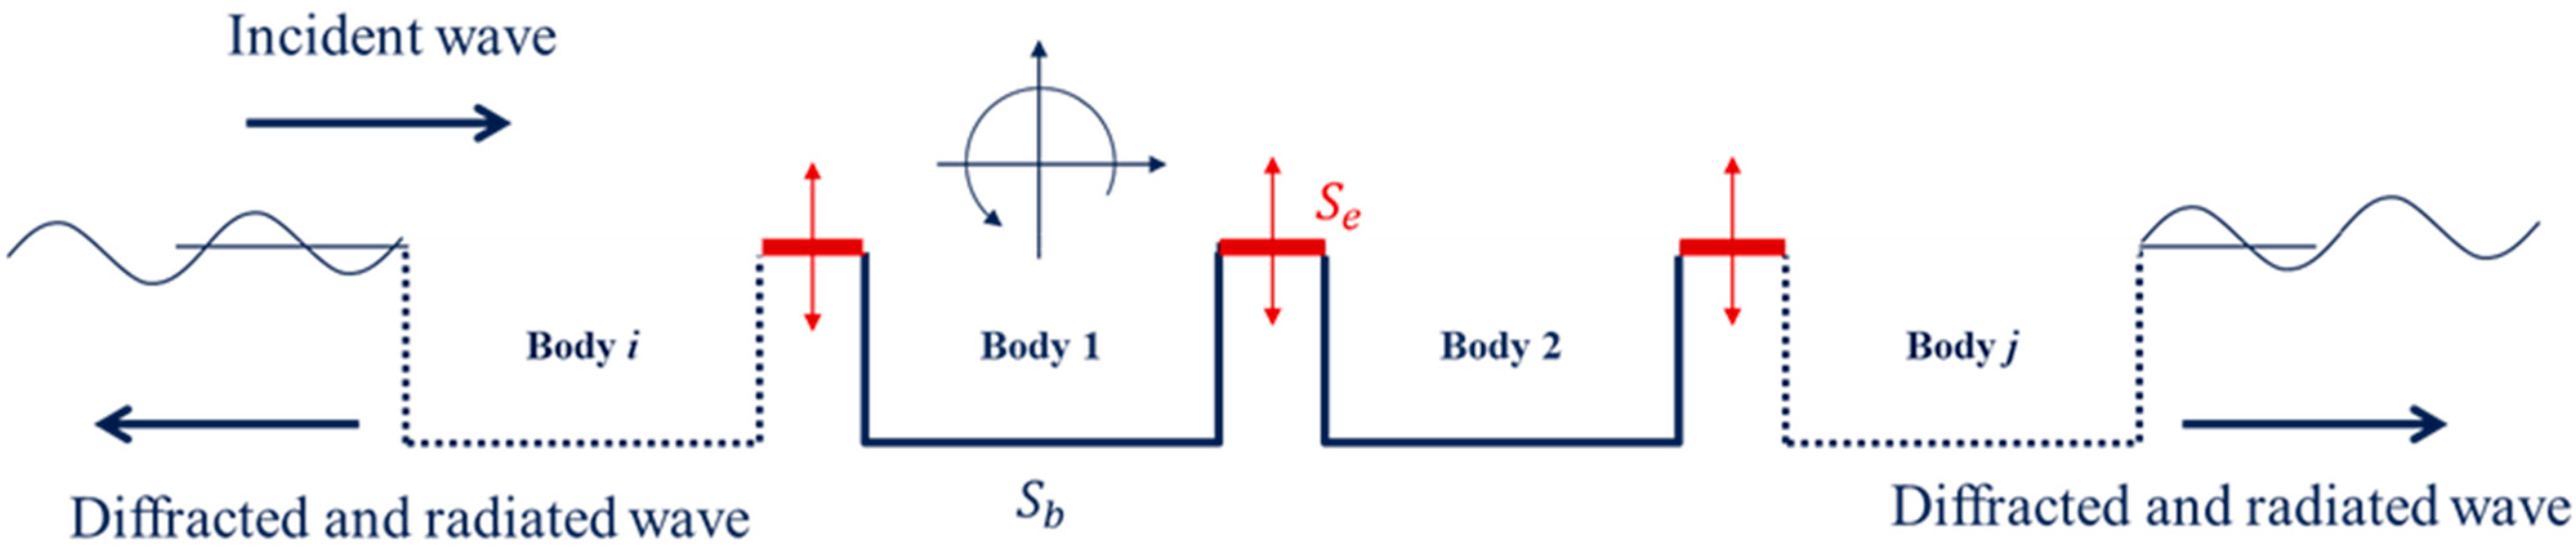
5. Multiple-Module Hydrodynamic Analysis

Another aspect normally brought up for FPV analysis is the multibody coupling analysis.
Here, two kinds of coupling effects are actually of common interest. The first one is hydrodynamic coupling and the second is the mechanism connections among modules. Although it is possible to include the extra stiffness (and damping) between bodies in the hydrodynamic coupling analysis to represent the connectors, the multibody stiffness matrix will become prohibitively large and complex due to the large number of modules in FPV concepts; therefore, we only check the hydrodynamic coupling effects first and leave the modeling of connectors in the time domain system simulation to be discussed in a follow-up paper.
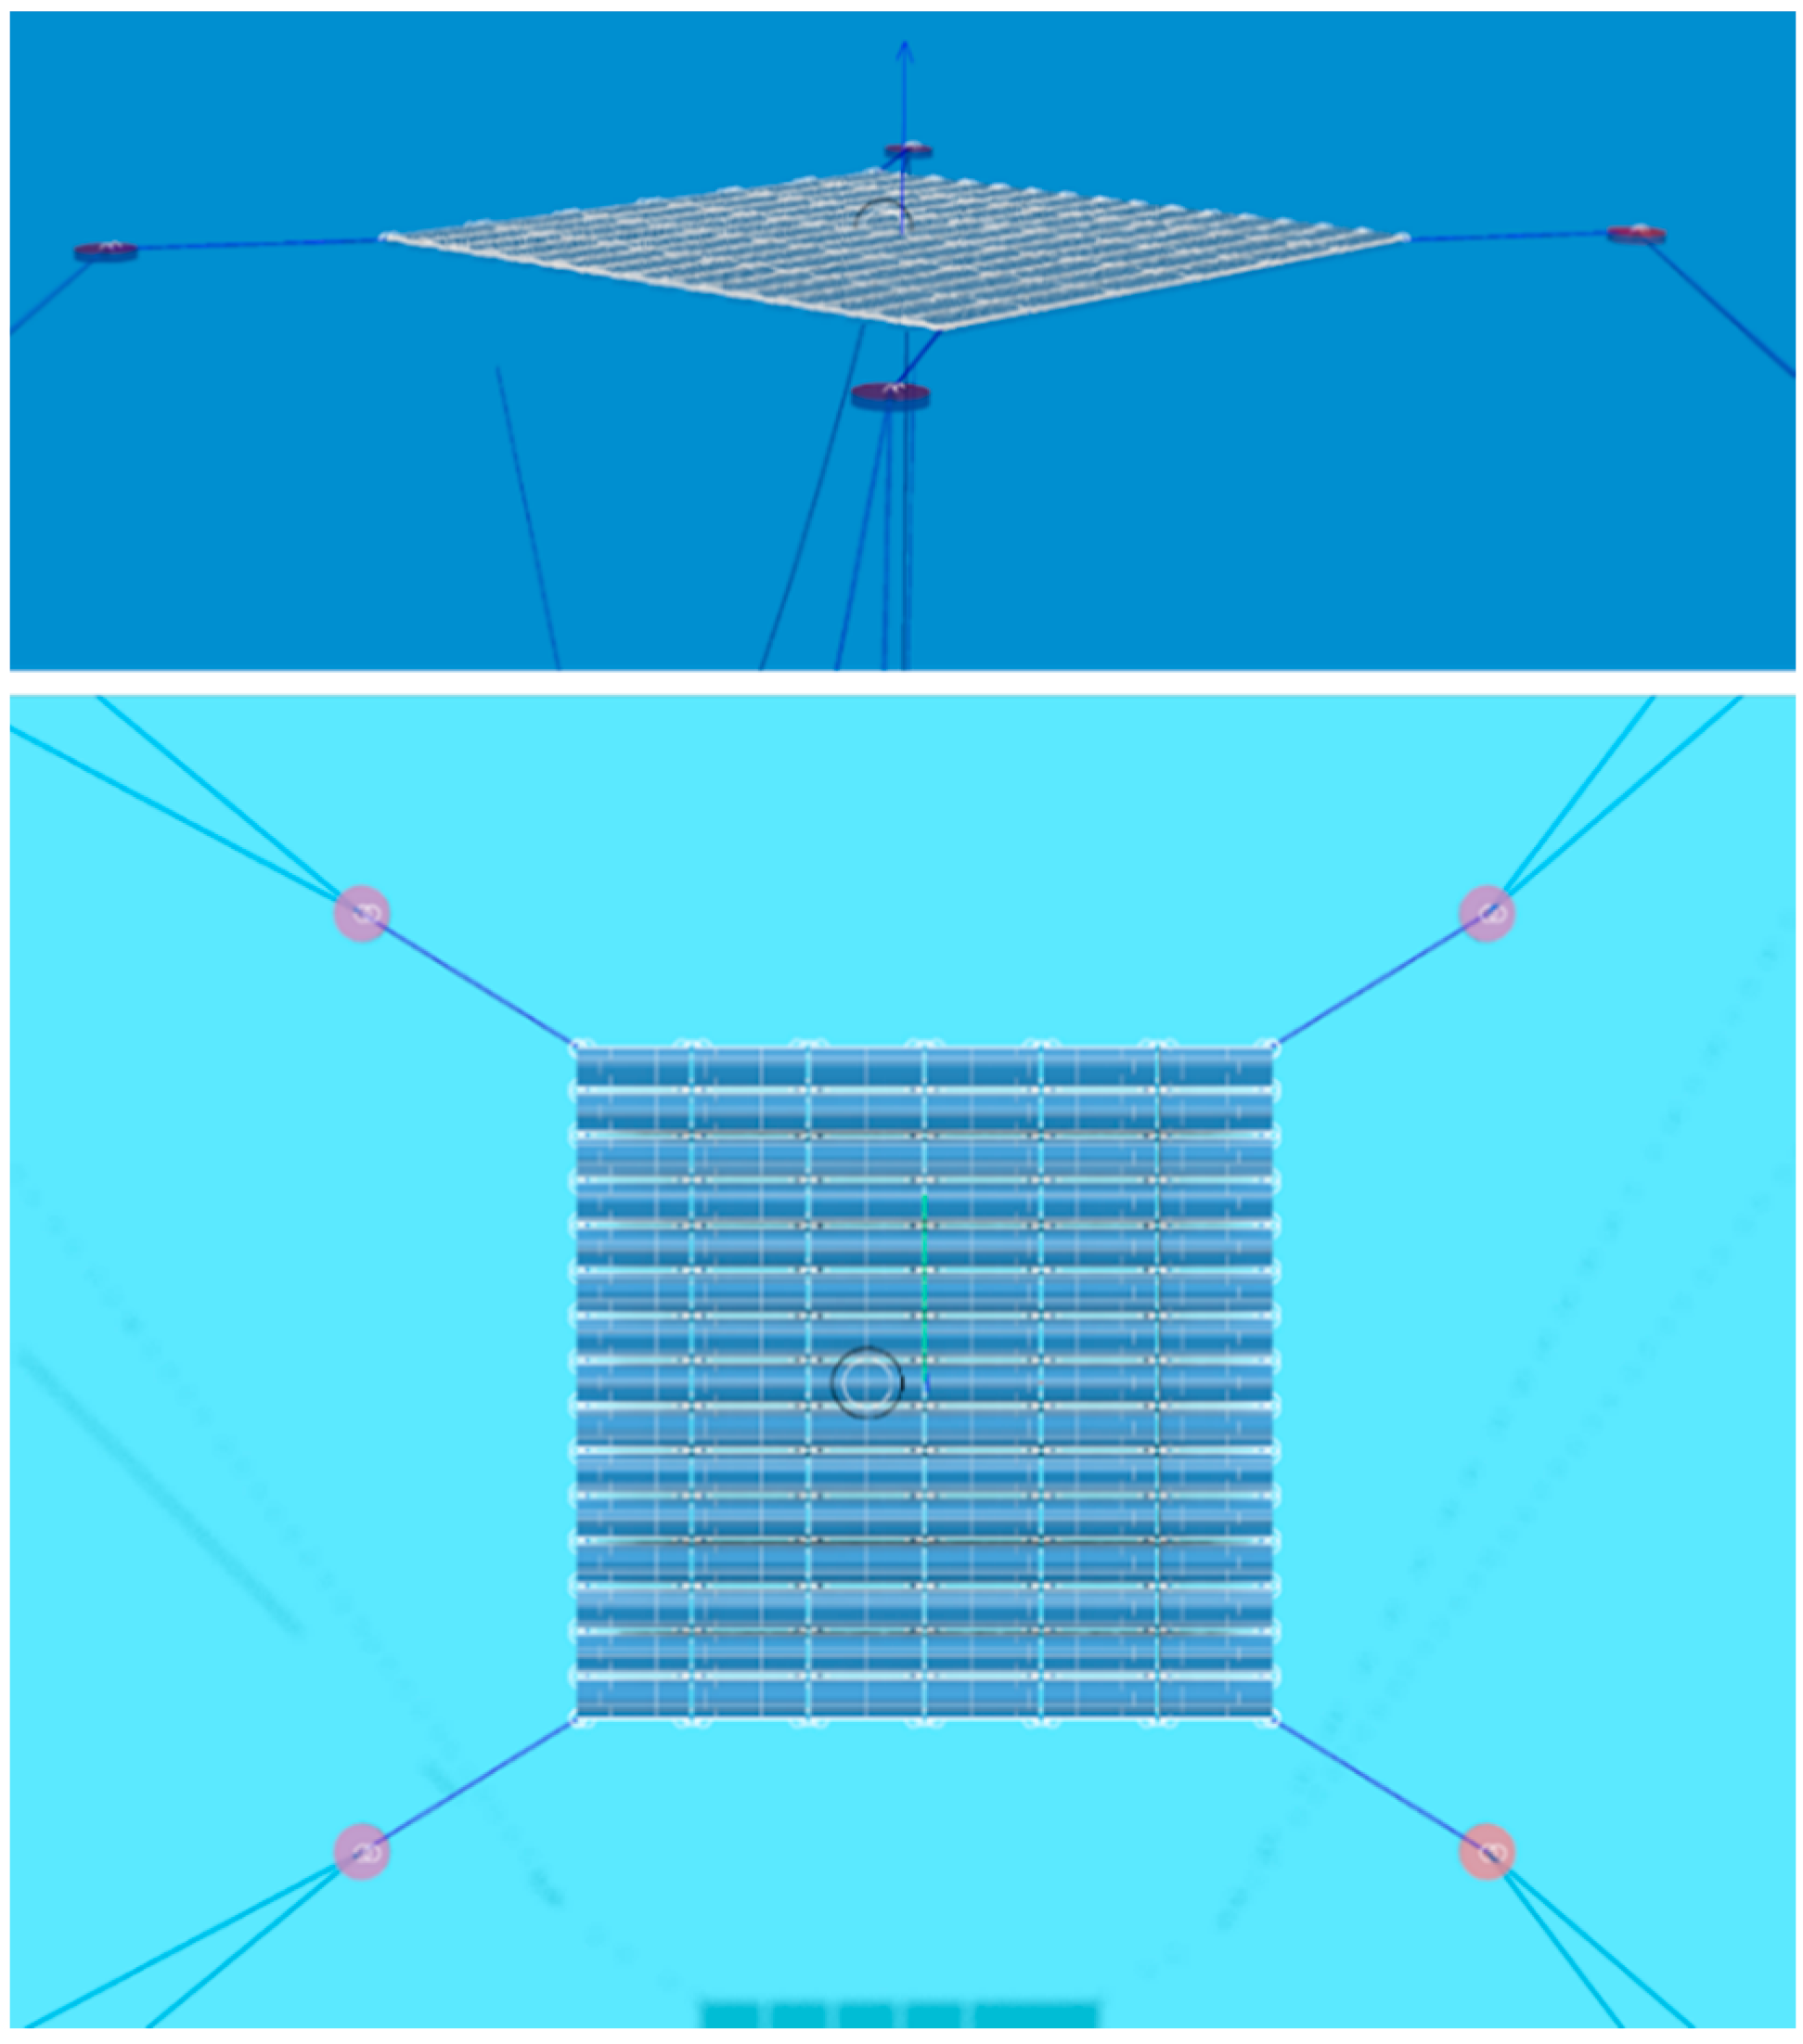
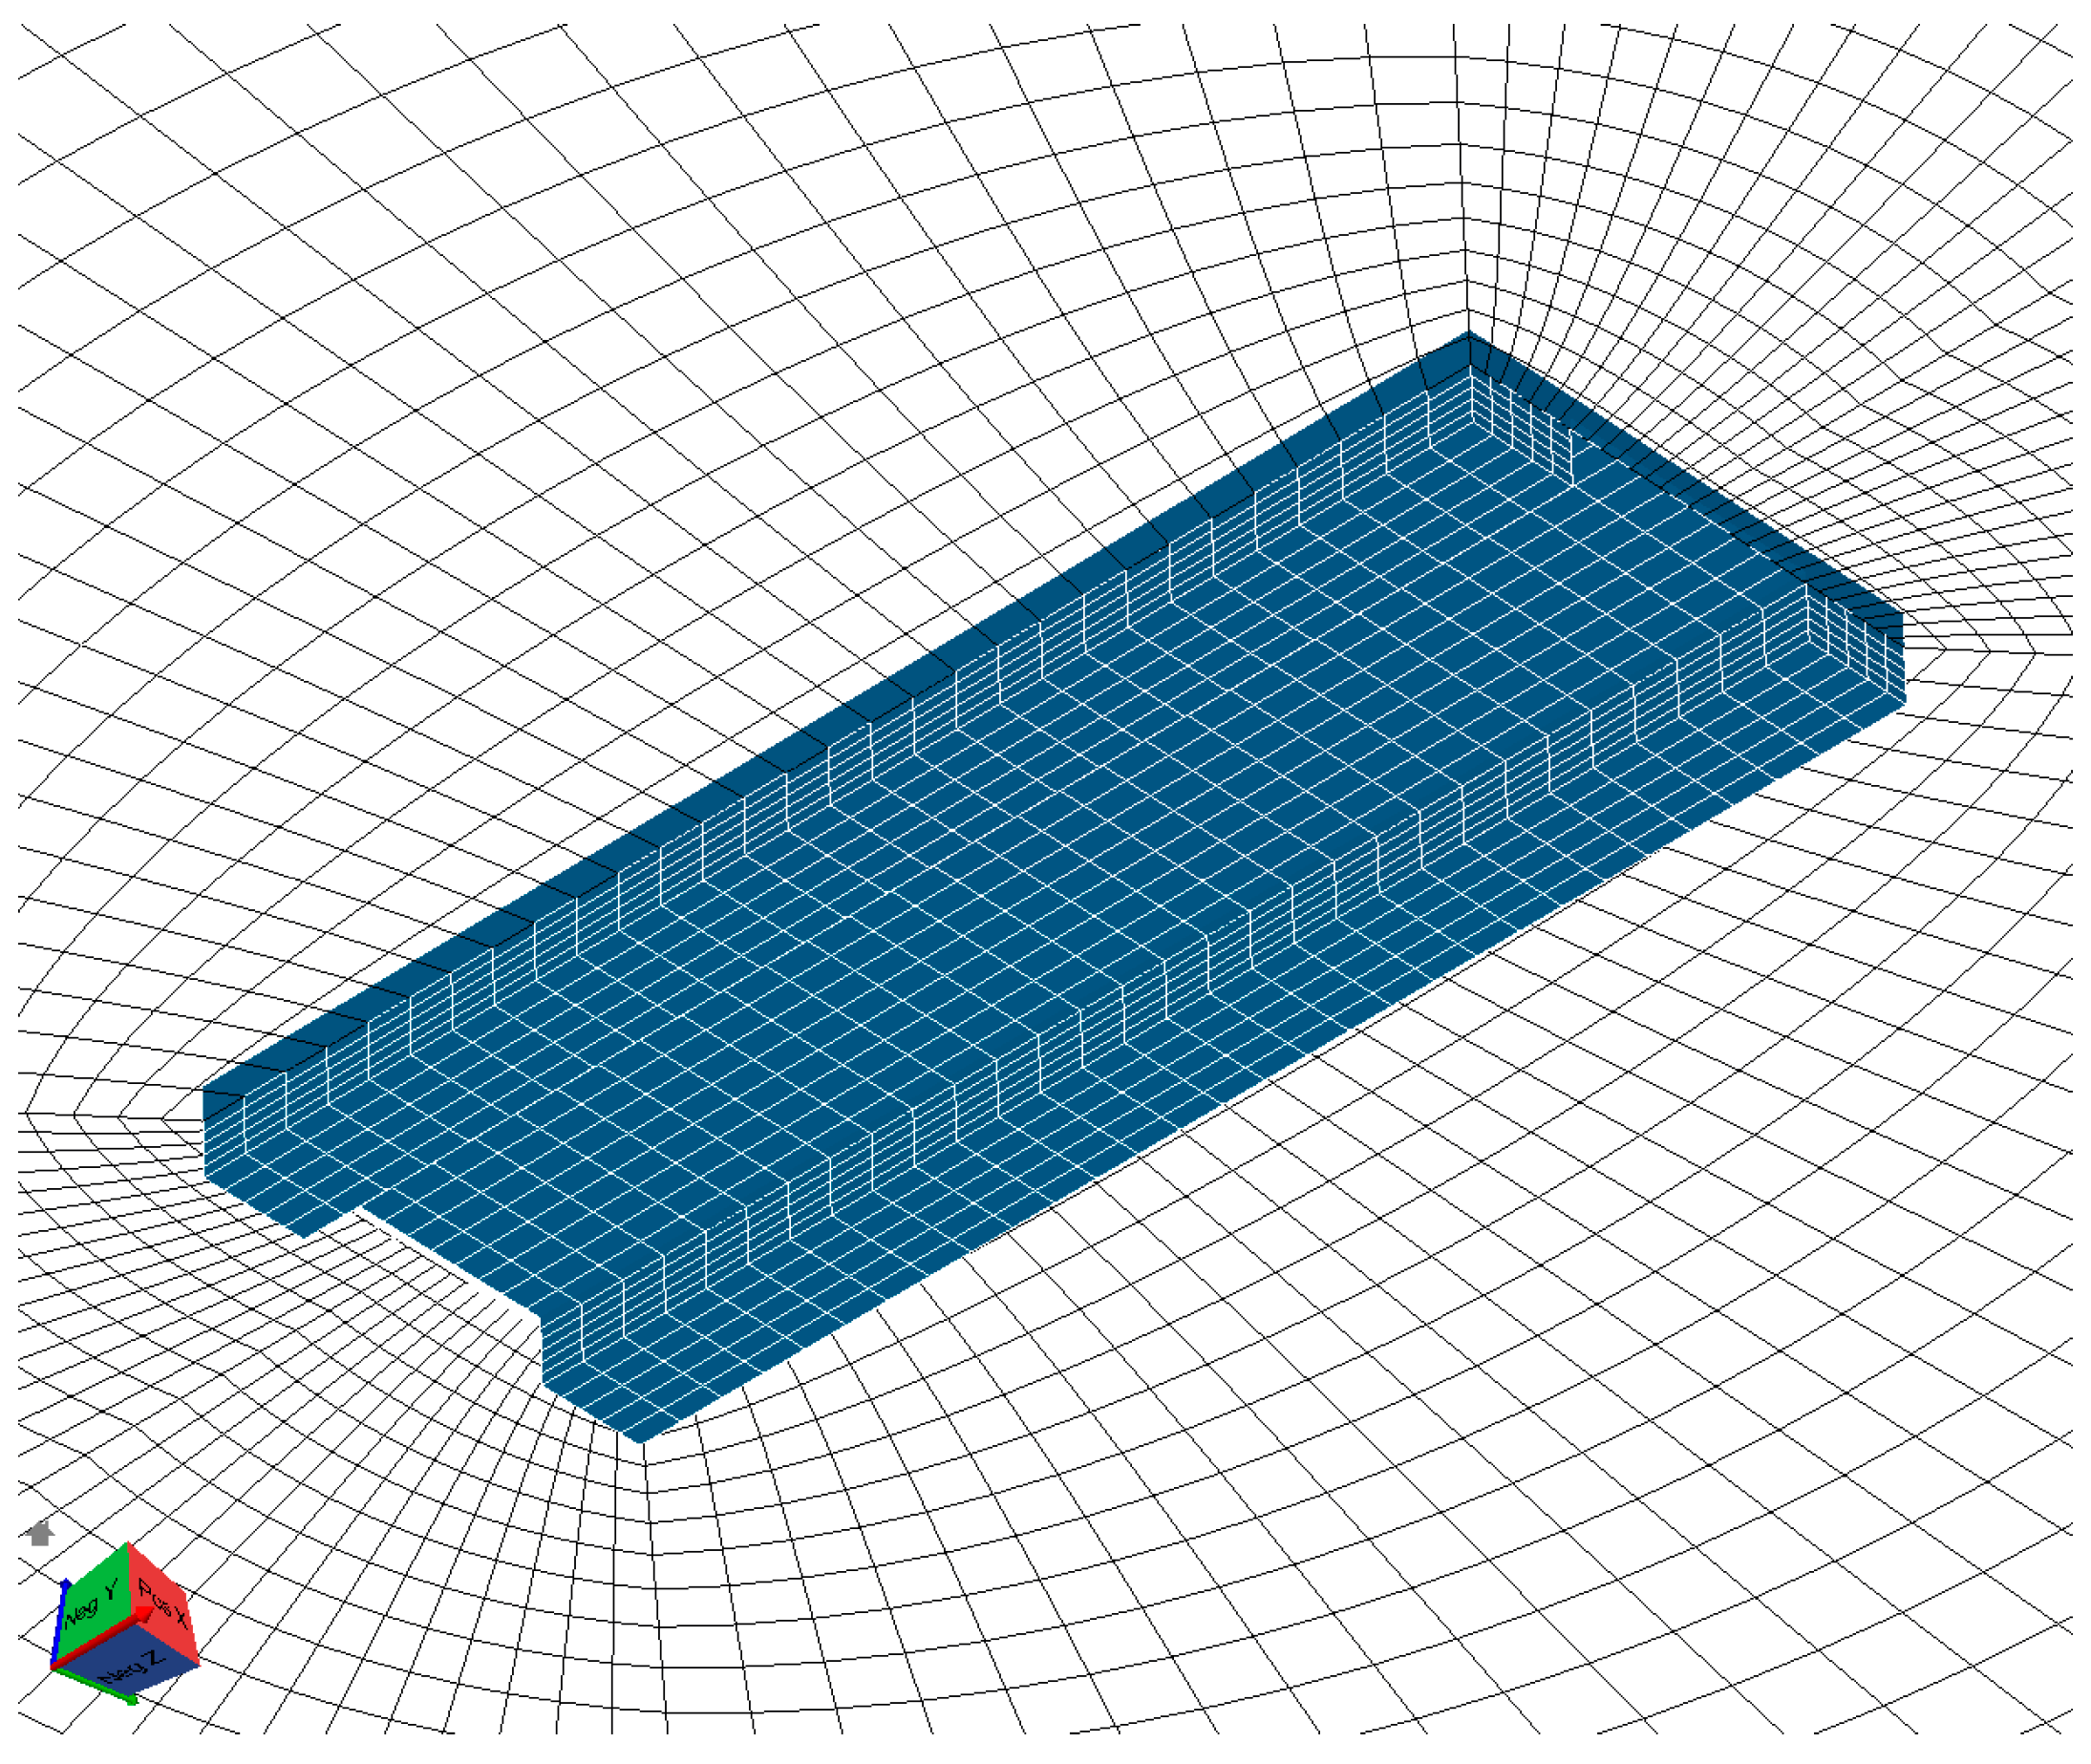
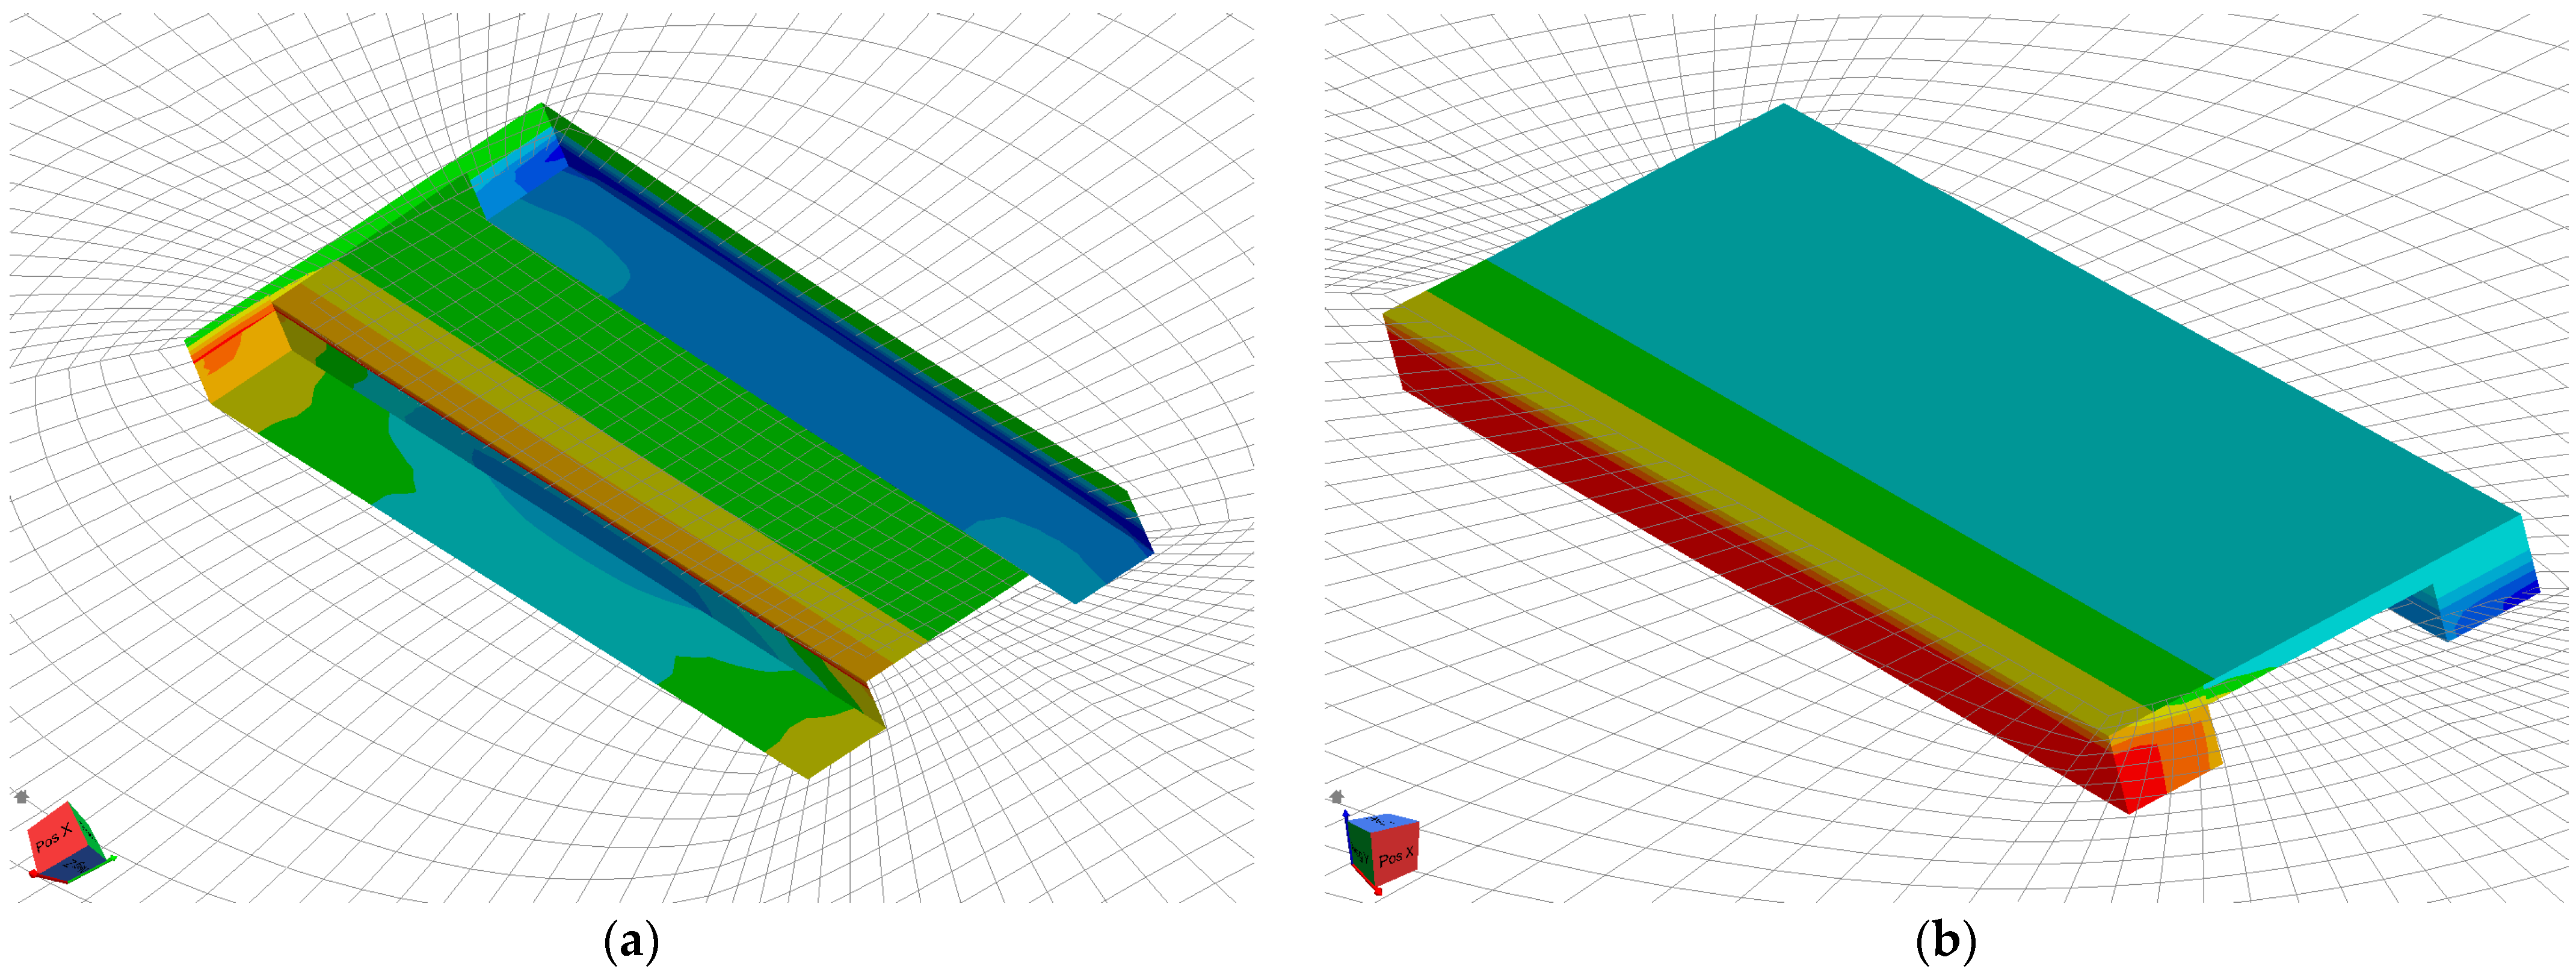
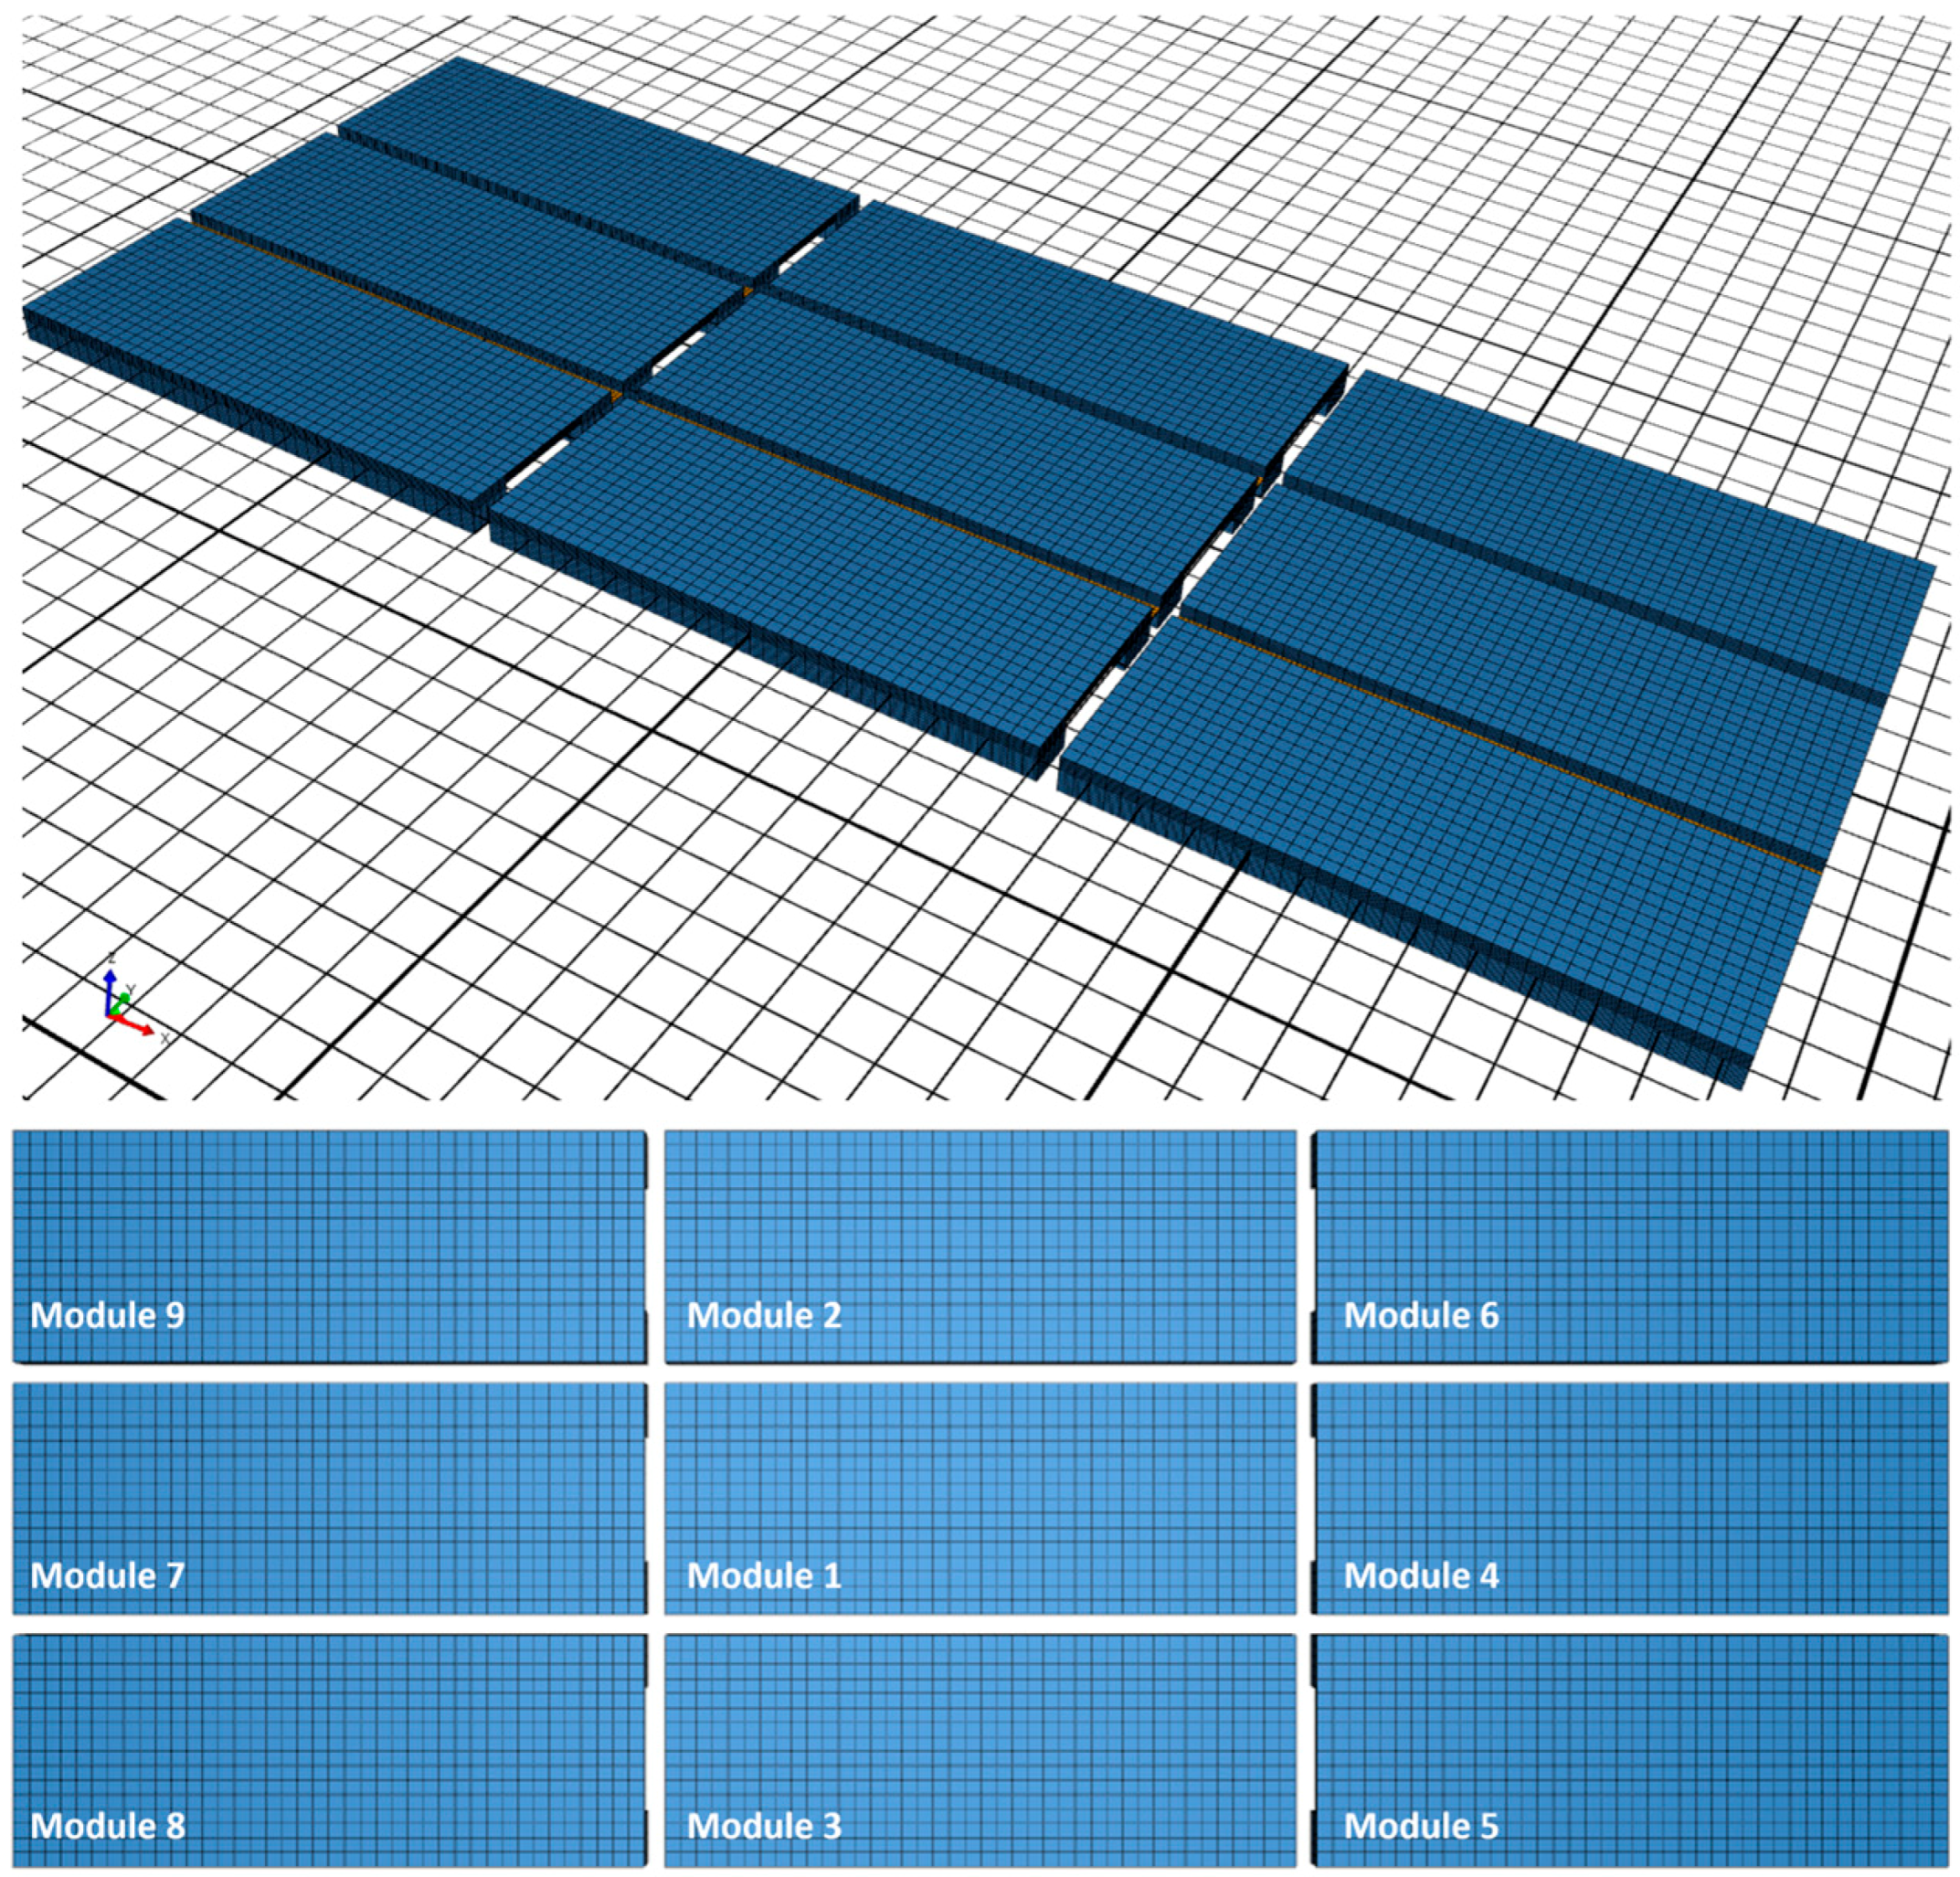
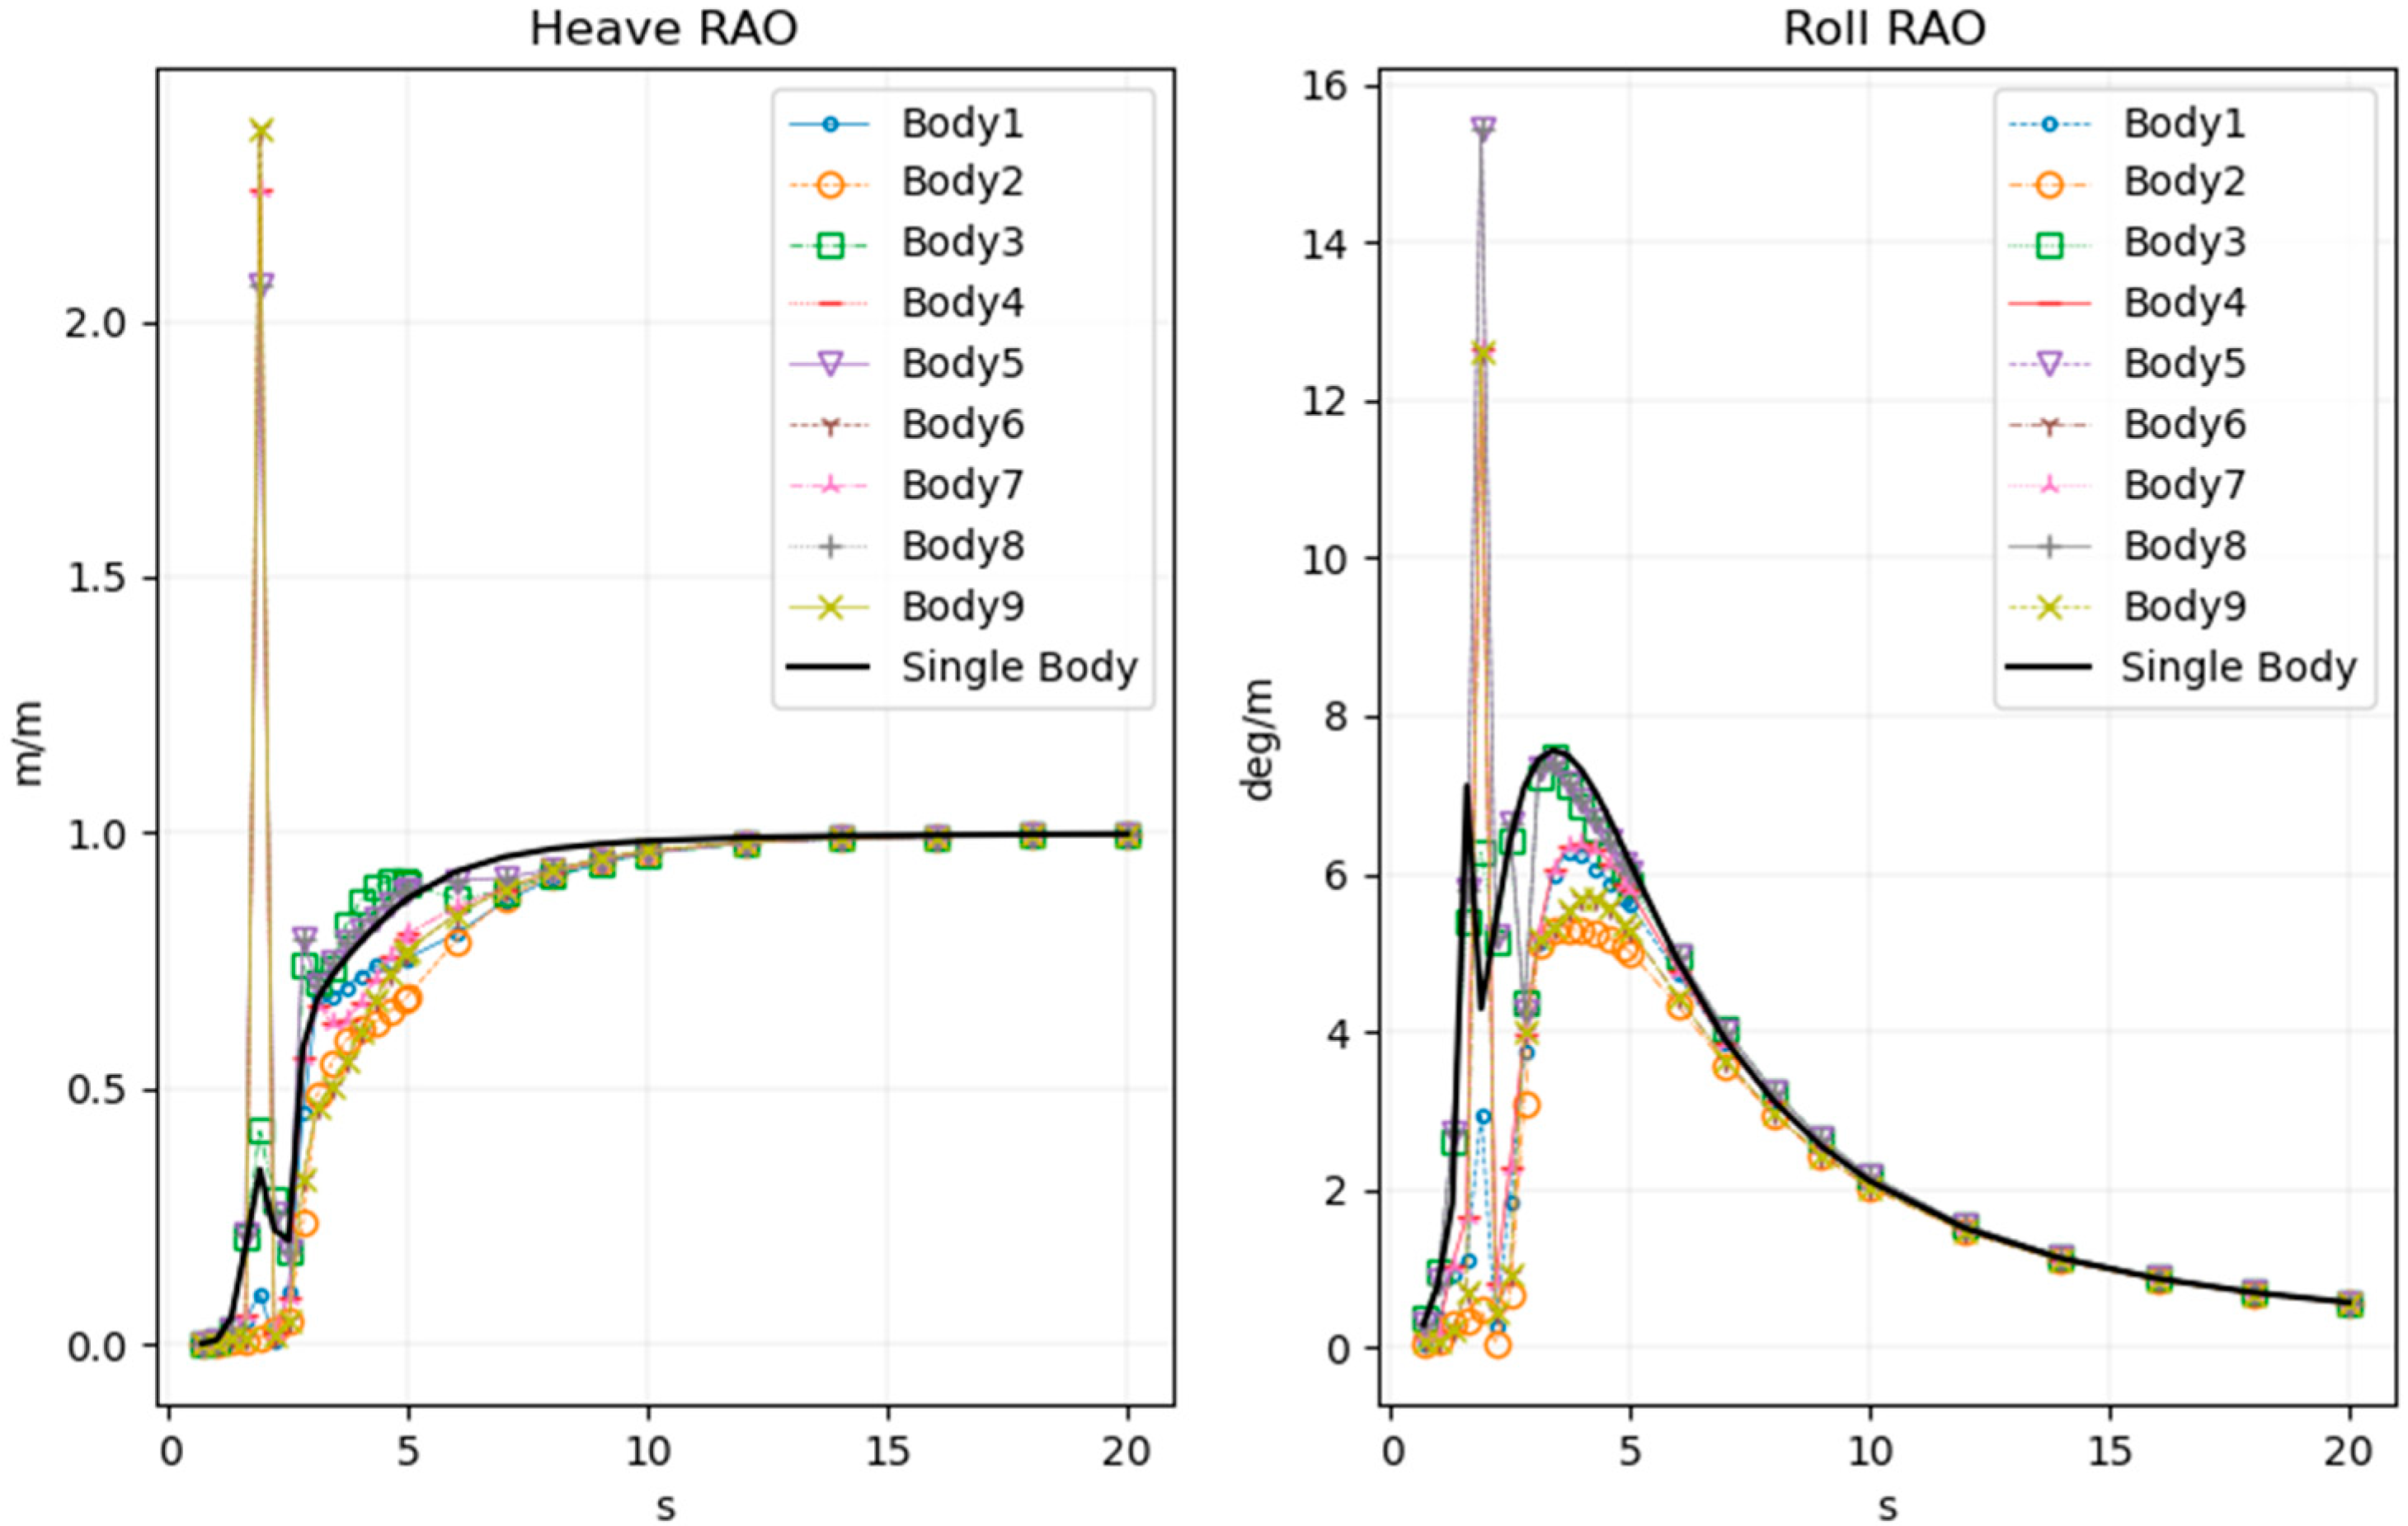
As shown in Figure 19, a system with a 3 × 3-module array is modeled, and the same critical damping coefficients from the previous study are specified for individual modules.
Figure 20 shows the results from the initial nine-body analysis. It is found that modules 1 and 2 have relatively small heave and roll motions, and module 3’s responses are close to the single-body analysis. This is understandable, considering that modules 1 and 2 may be “shadowed” by other modules. On the other hand, it is an interesting observation that the modules on the outer side of the array obtain quite large responses. They seem to be far more excited by the hydrodynamic coupling if we compare them with the single-body responses.
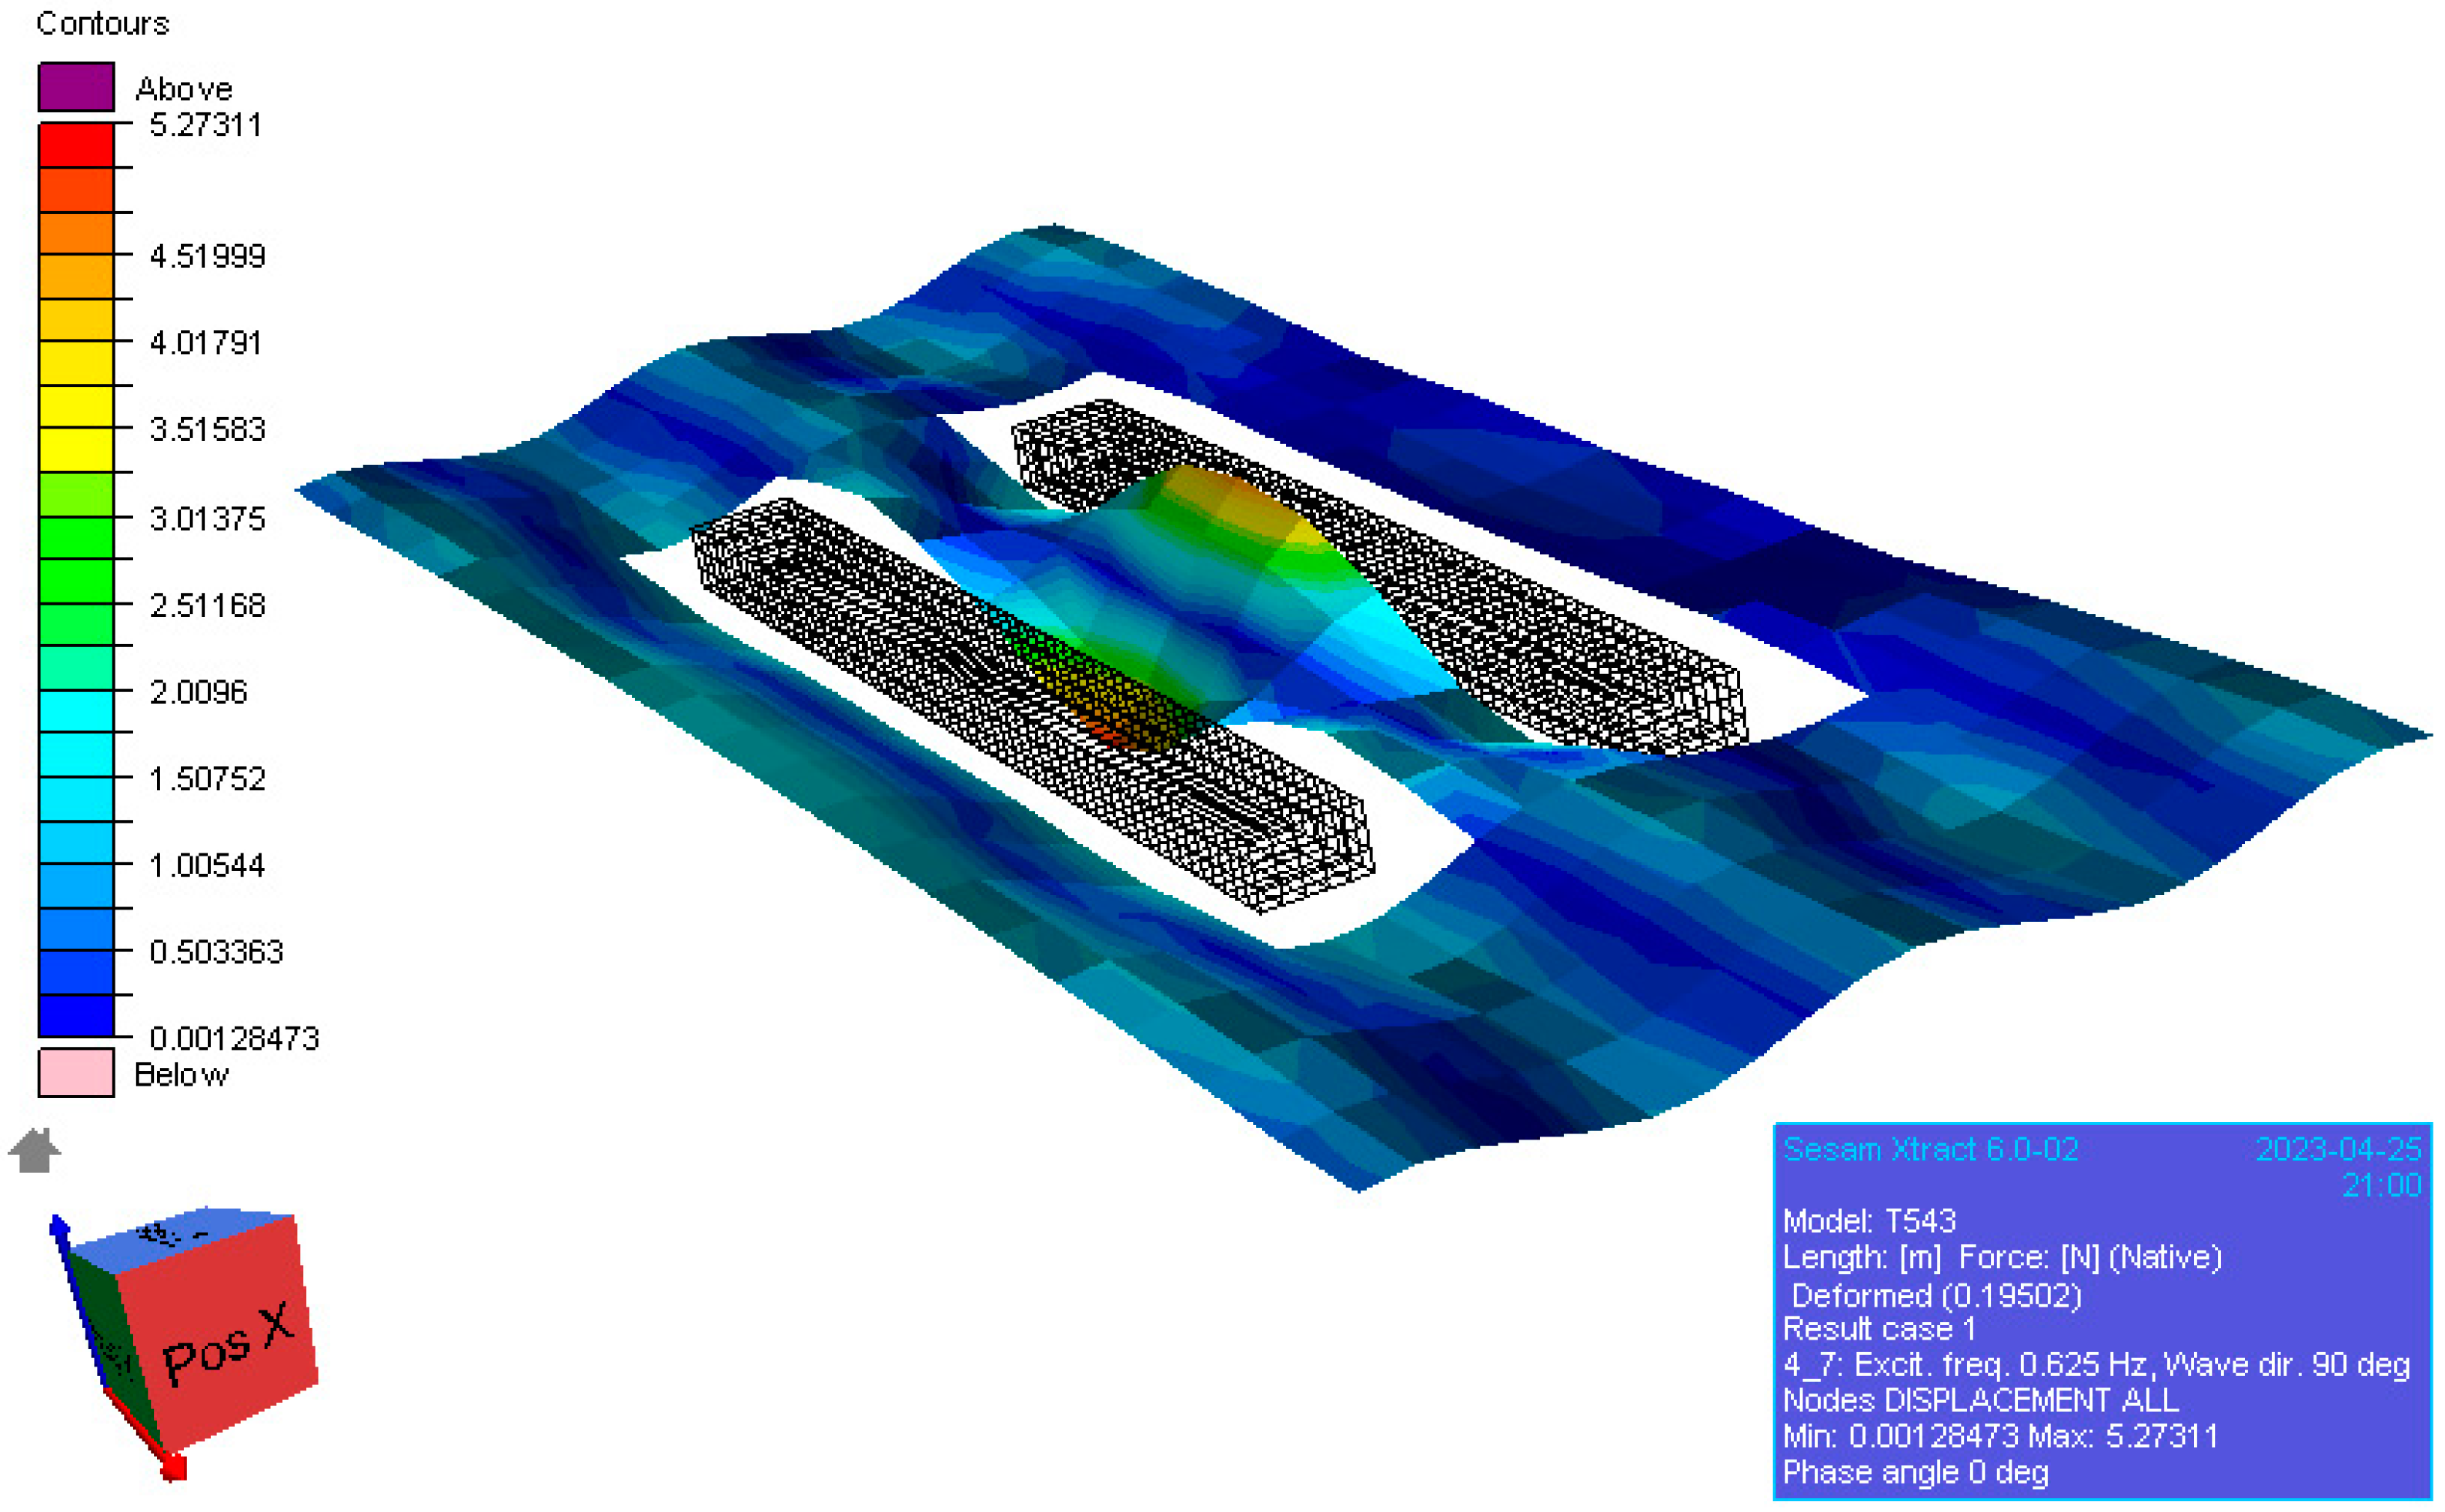
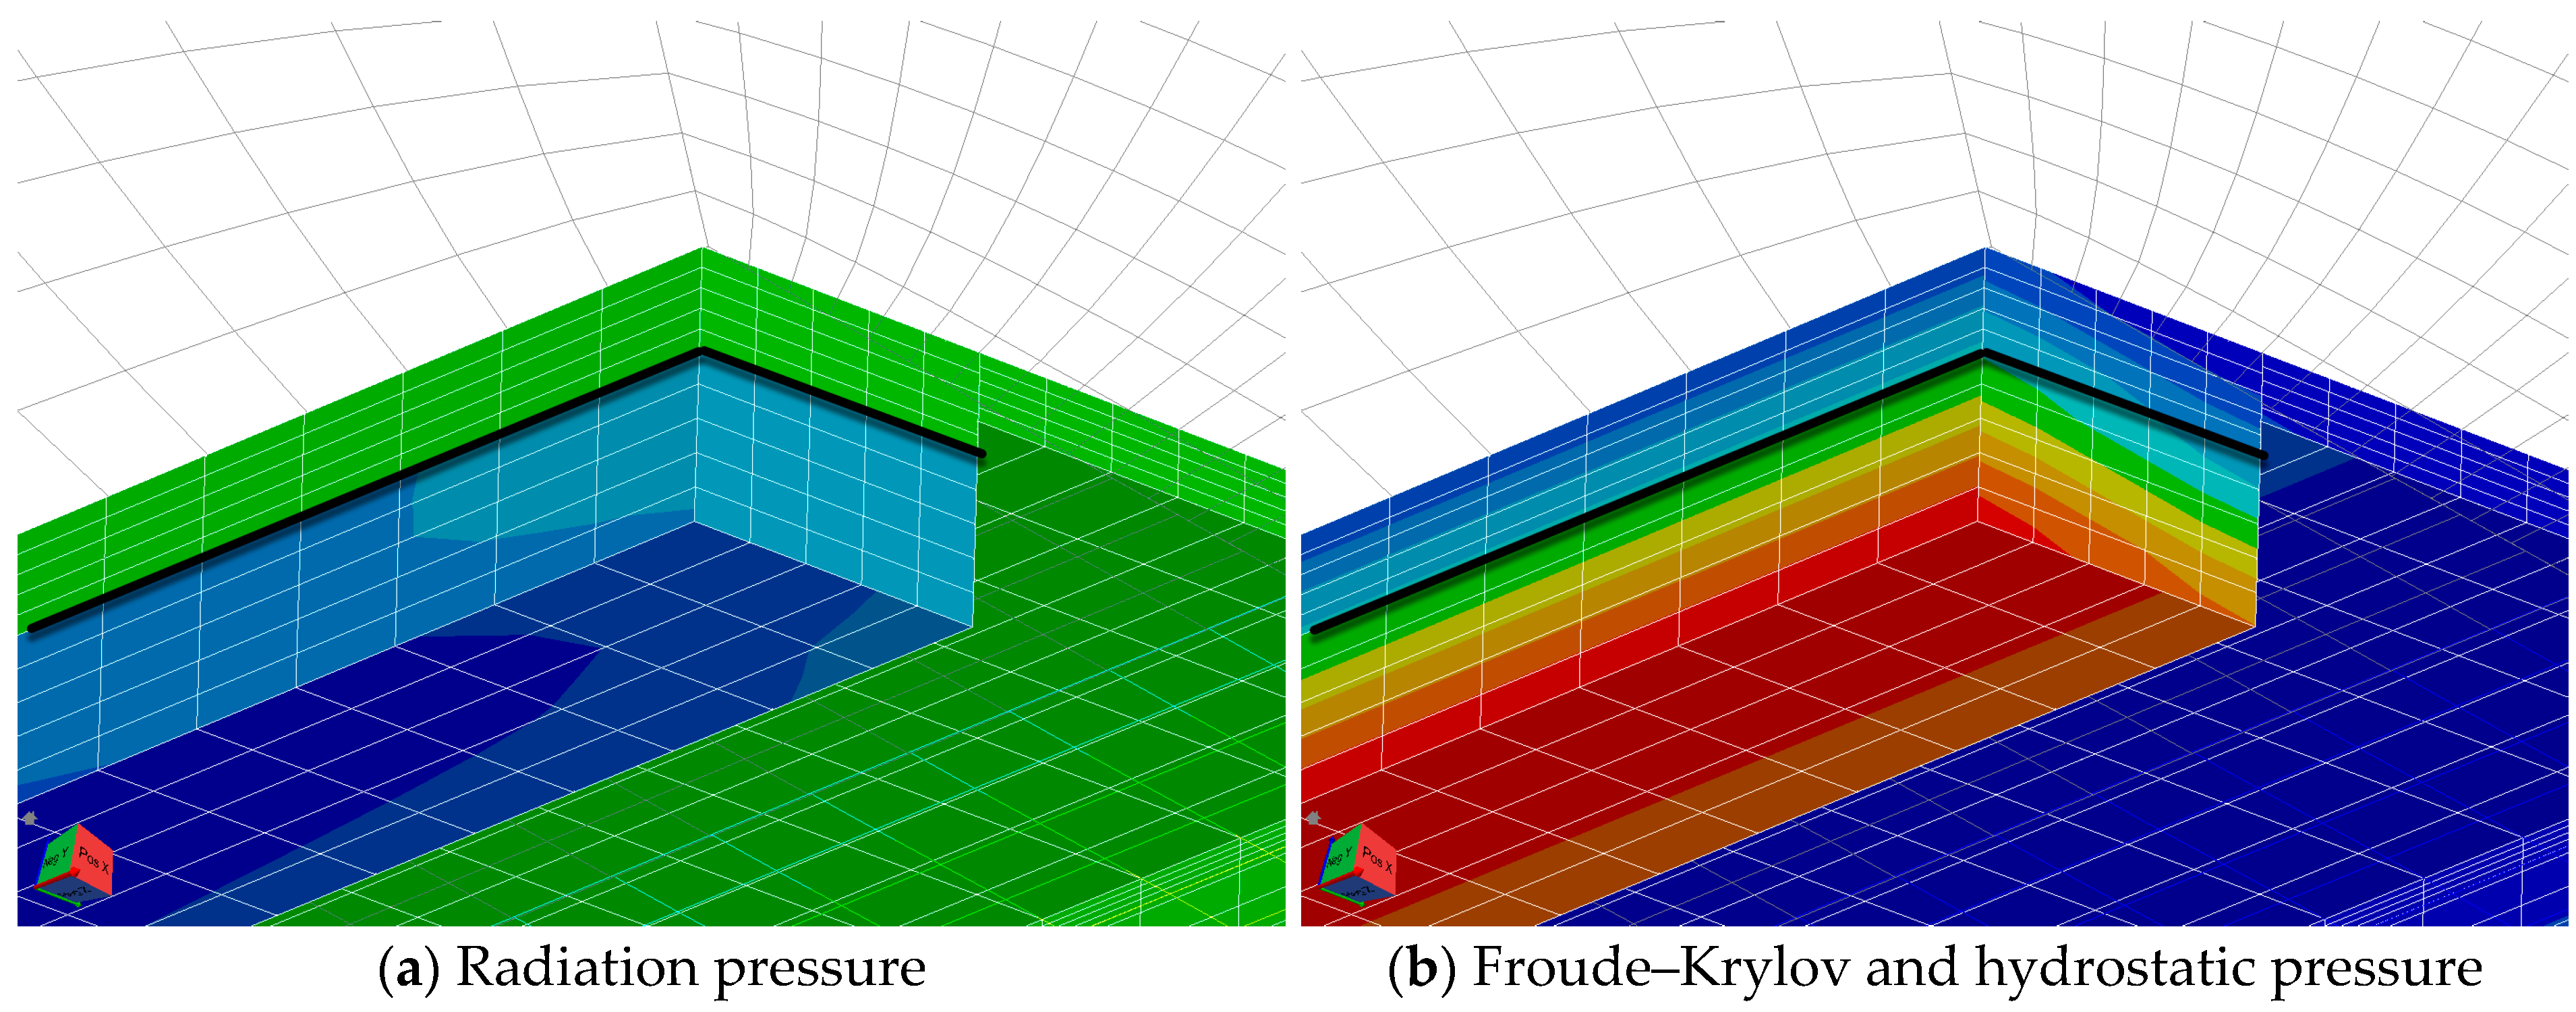
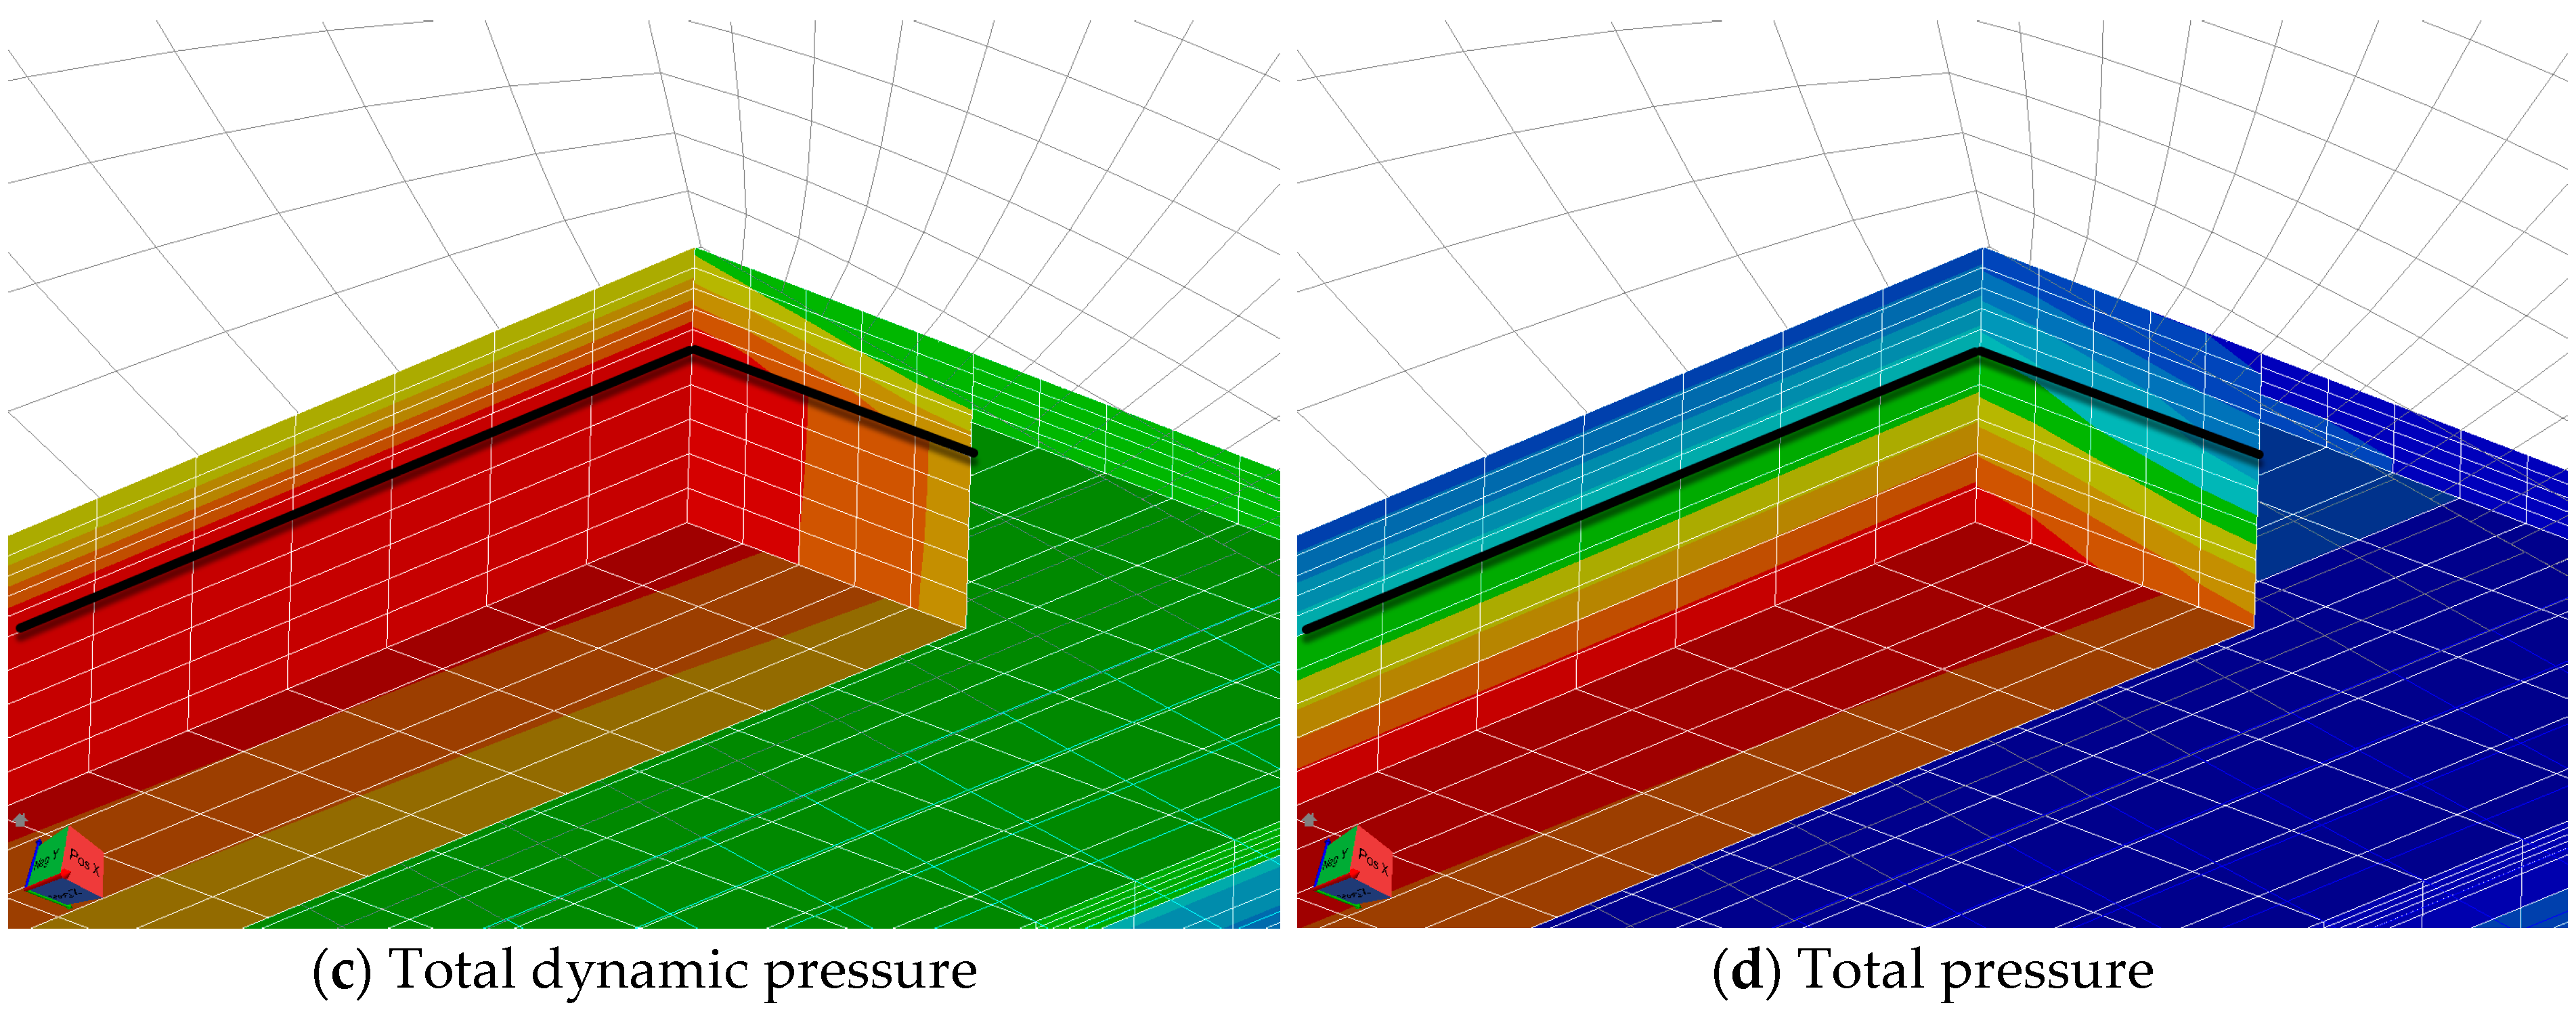
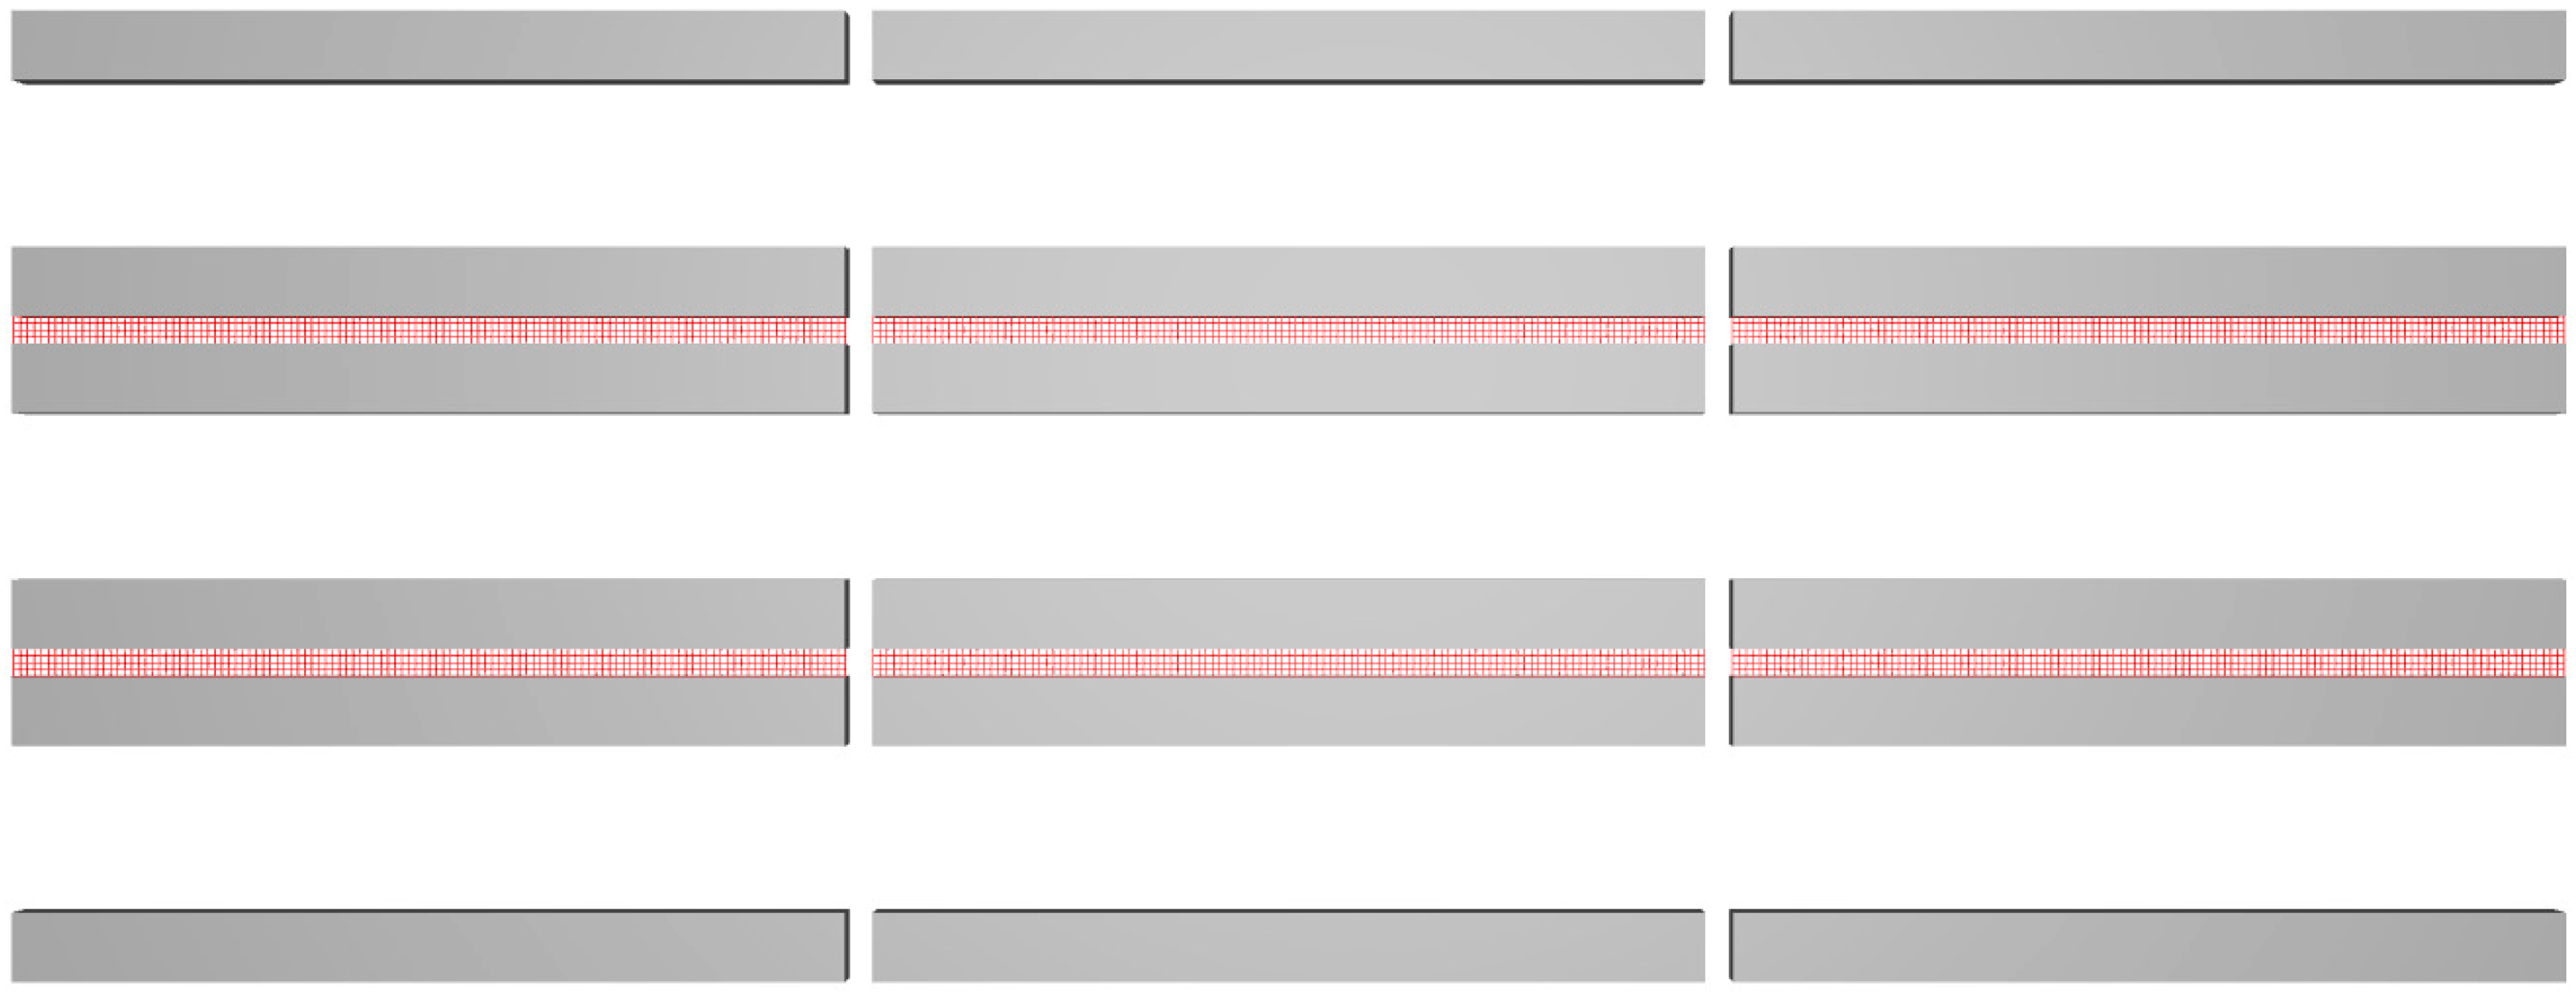
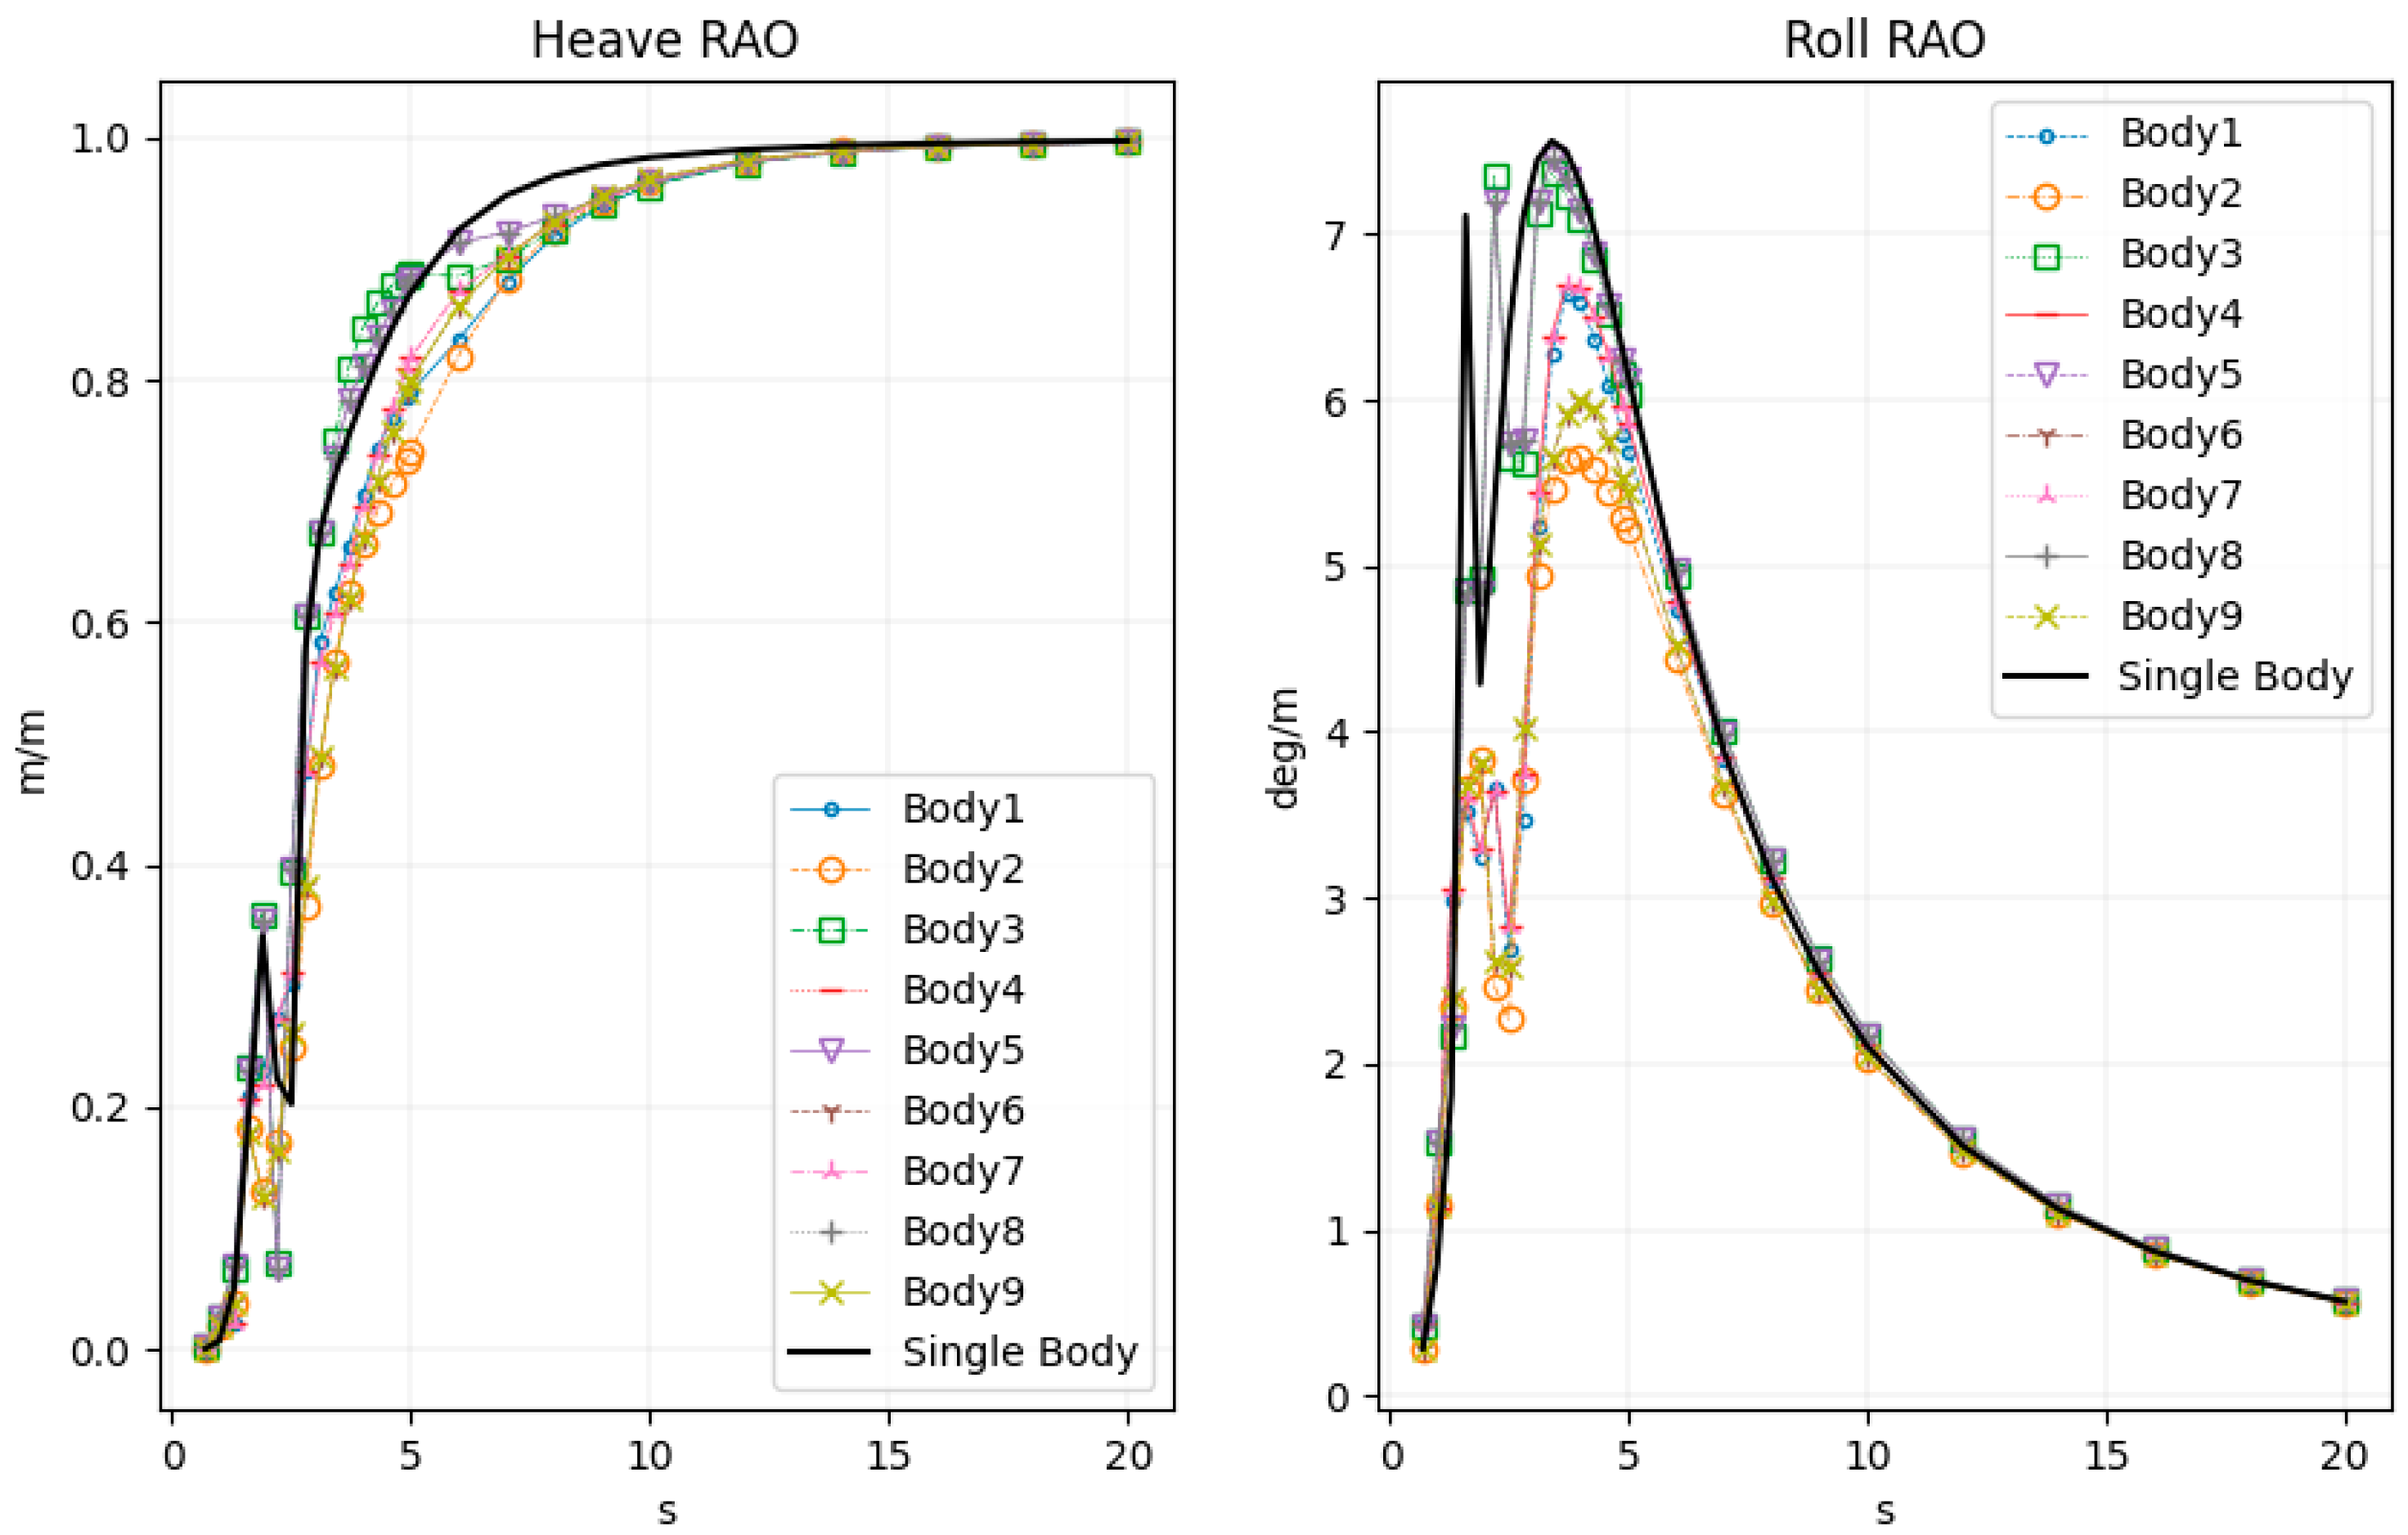
To further estimate the effects of the gaps among the modules, as shown in Figure 21, a separate mesh model is placed between the gaps of the modules (the red mesh), and some damping is added. The results are shown in Figure 22, which looks much more consistent.

6. Discussion of the Hydrodynamic Analysis

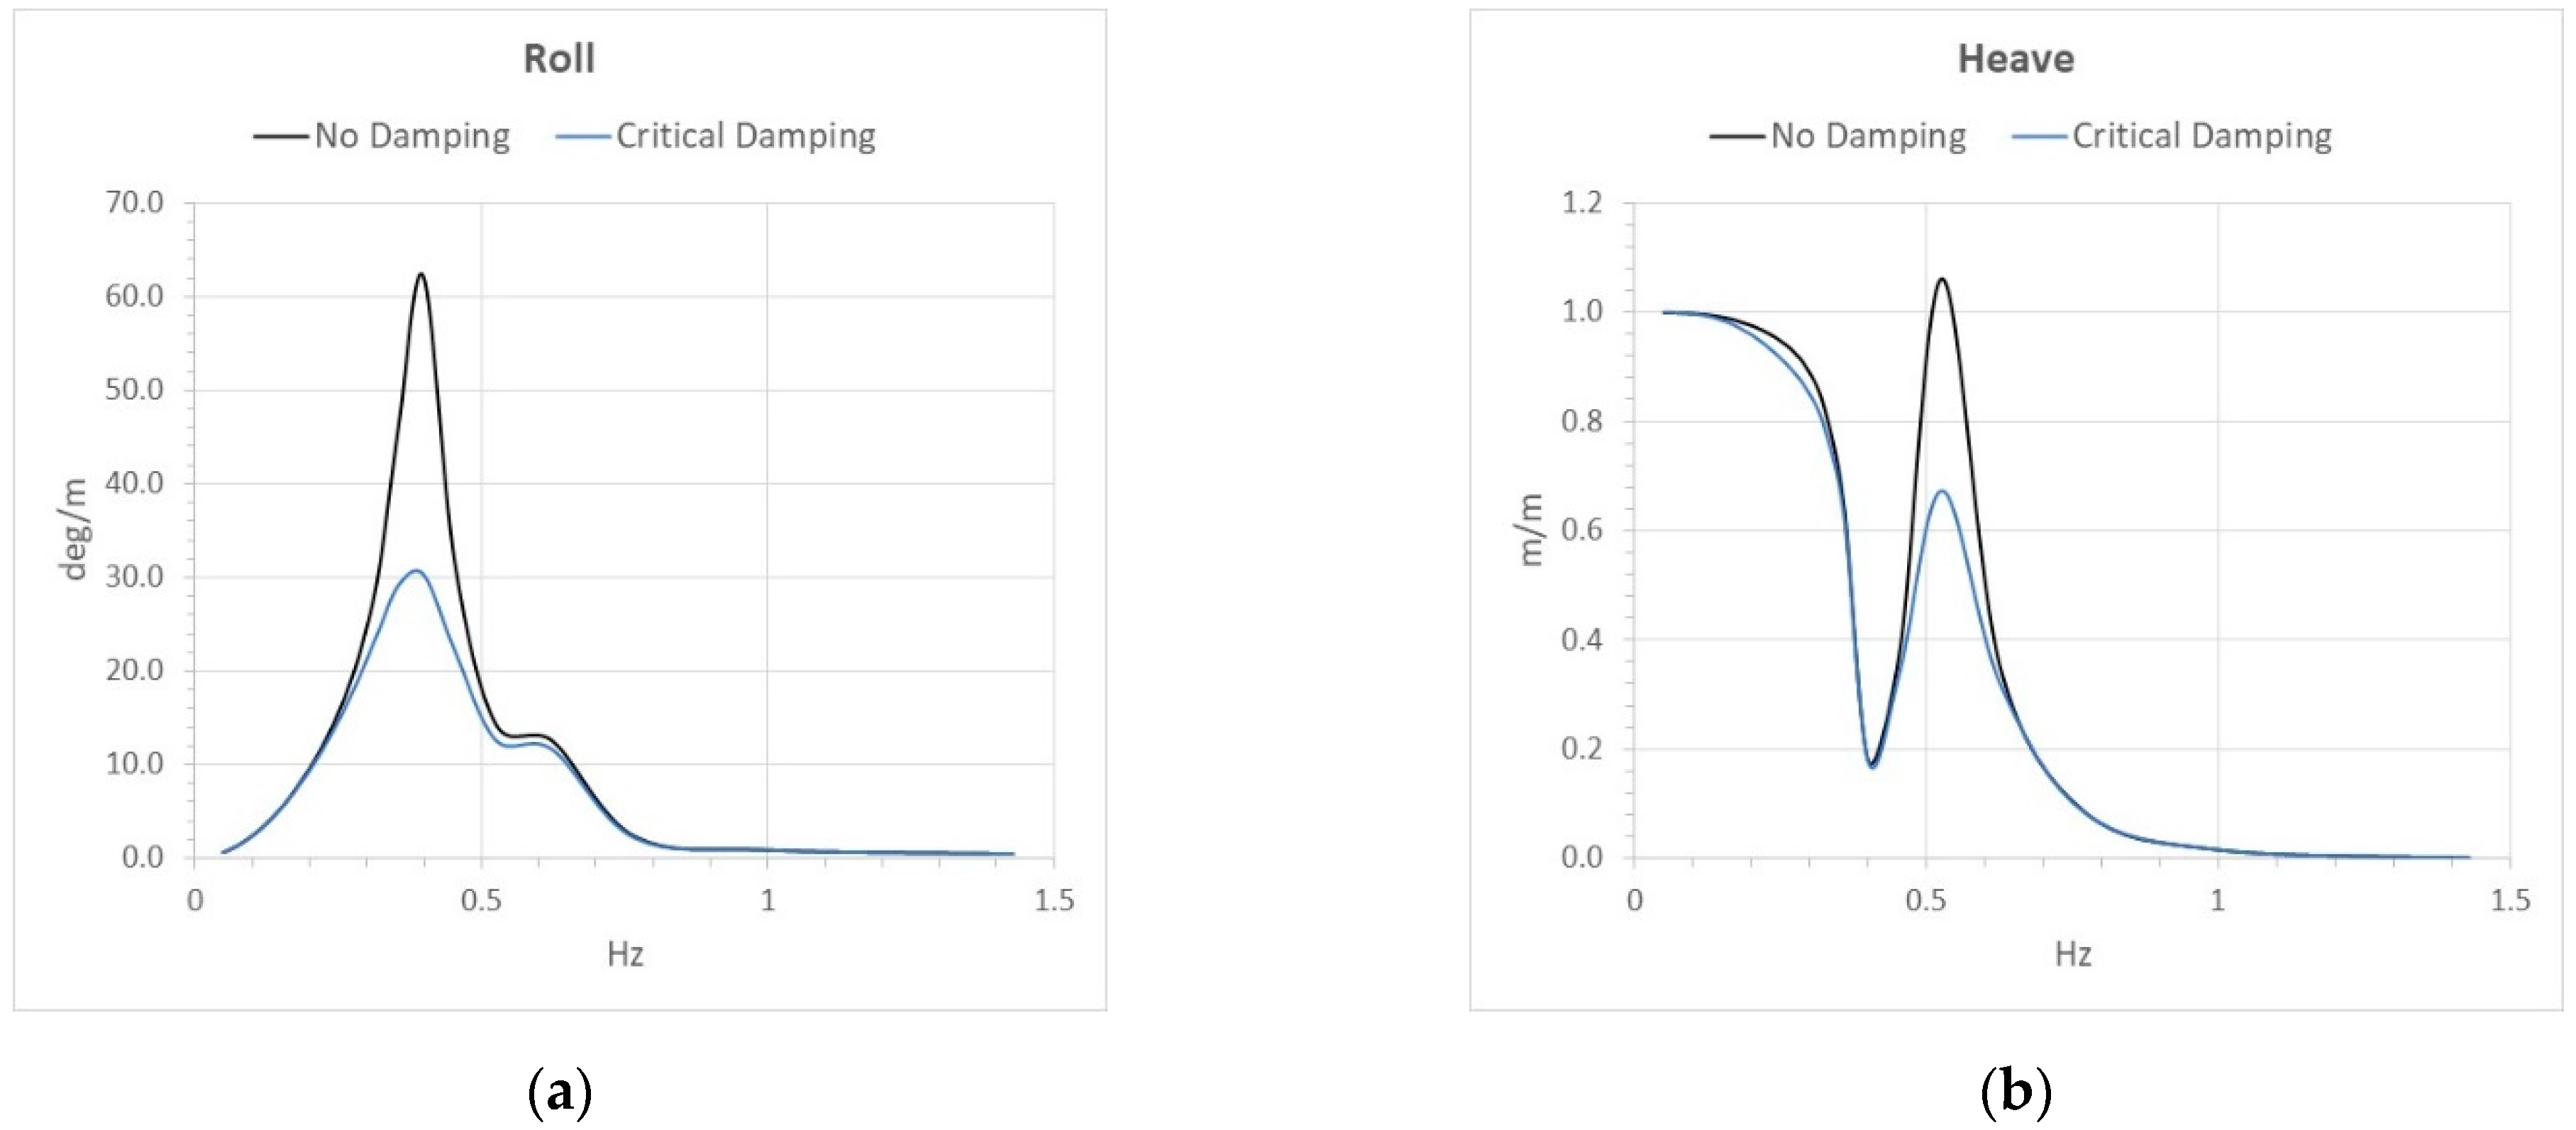
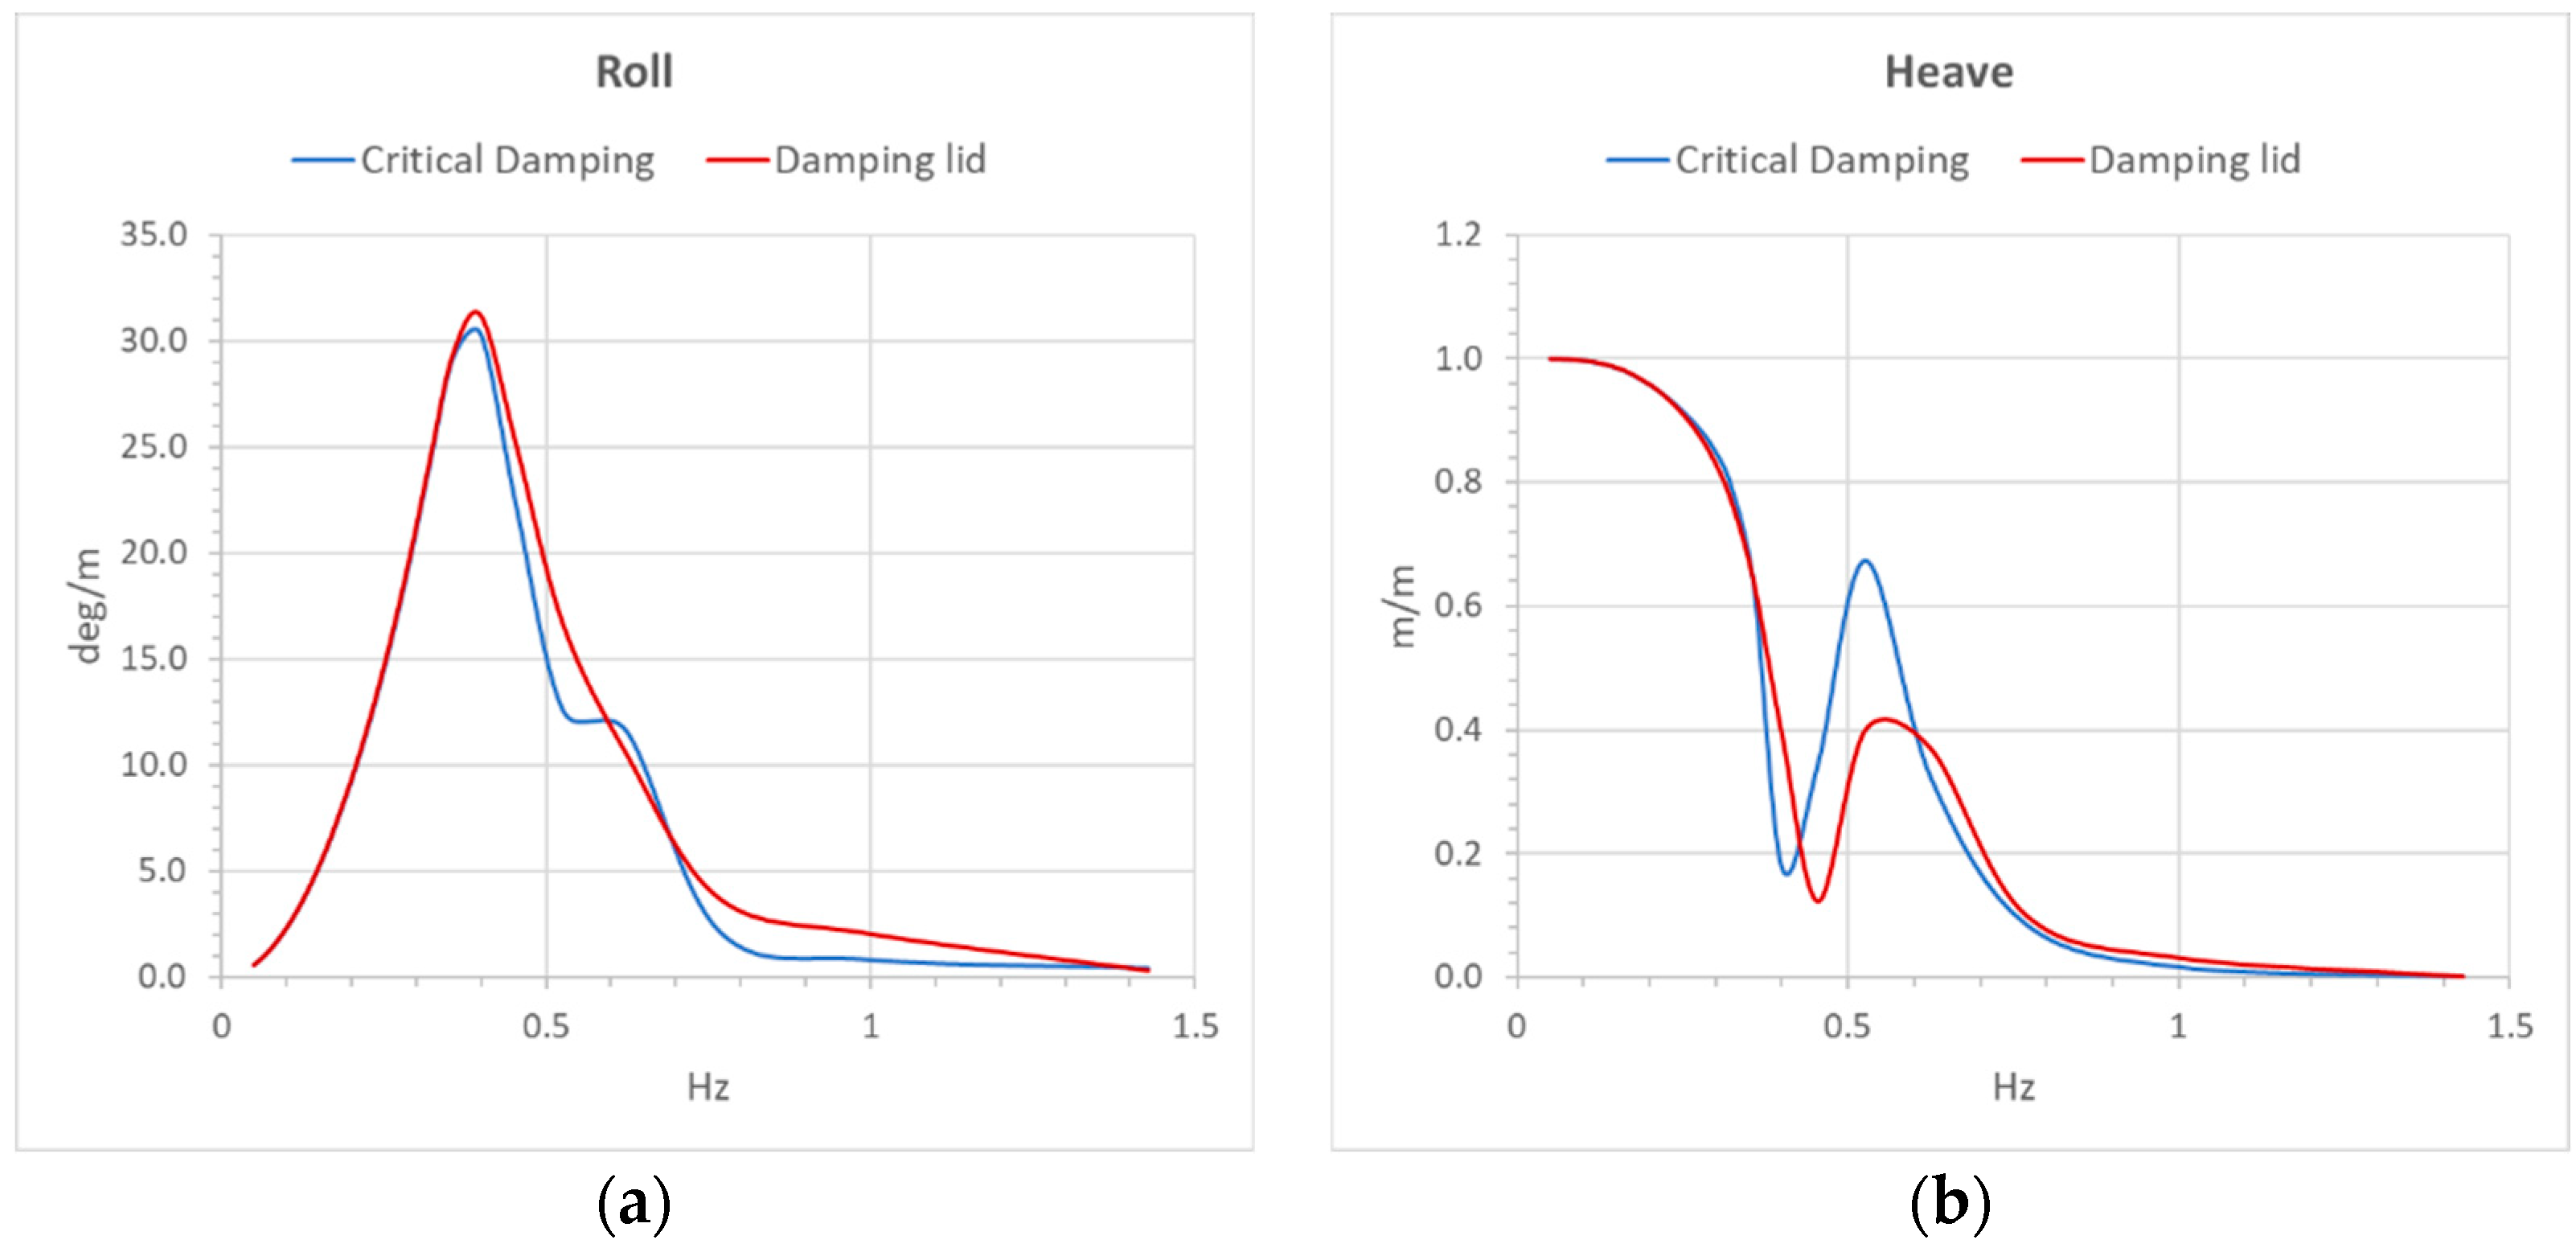
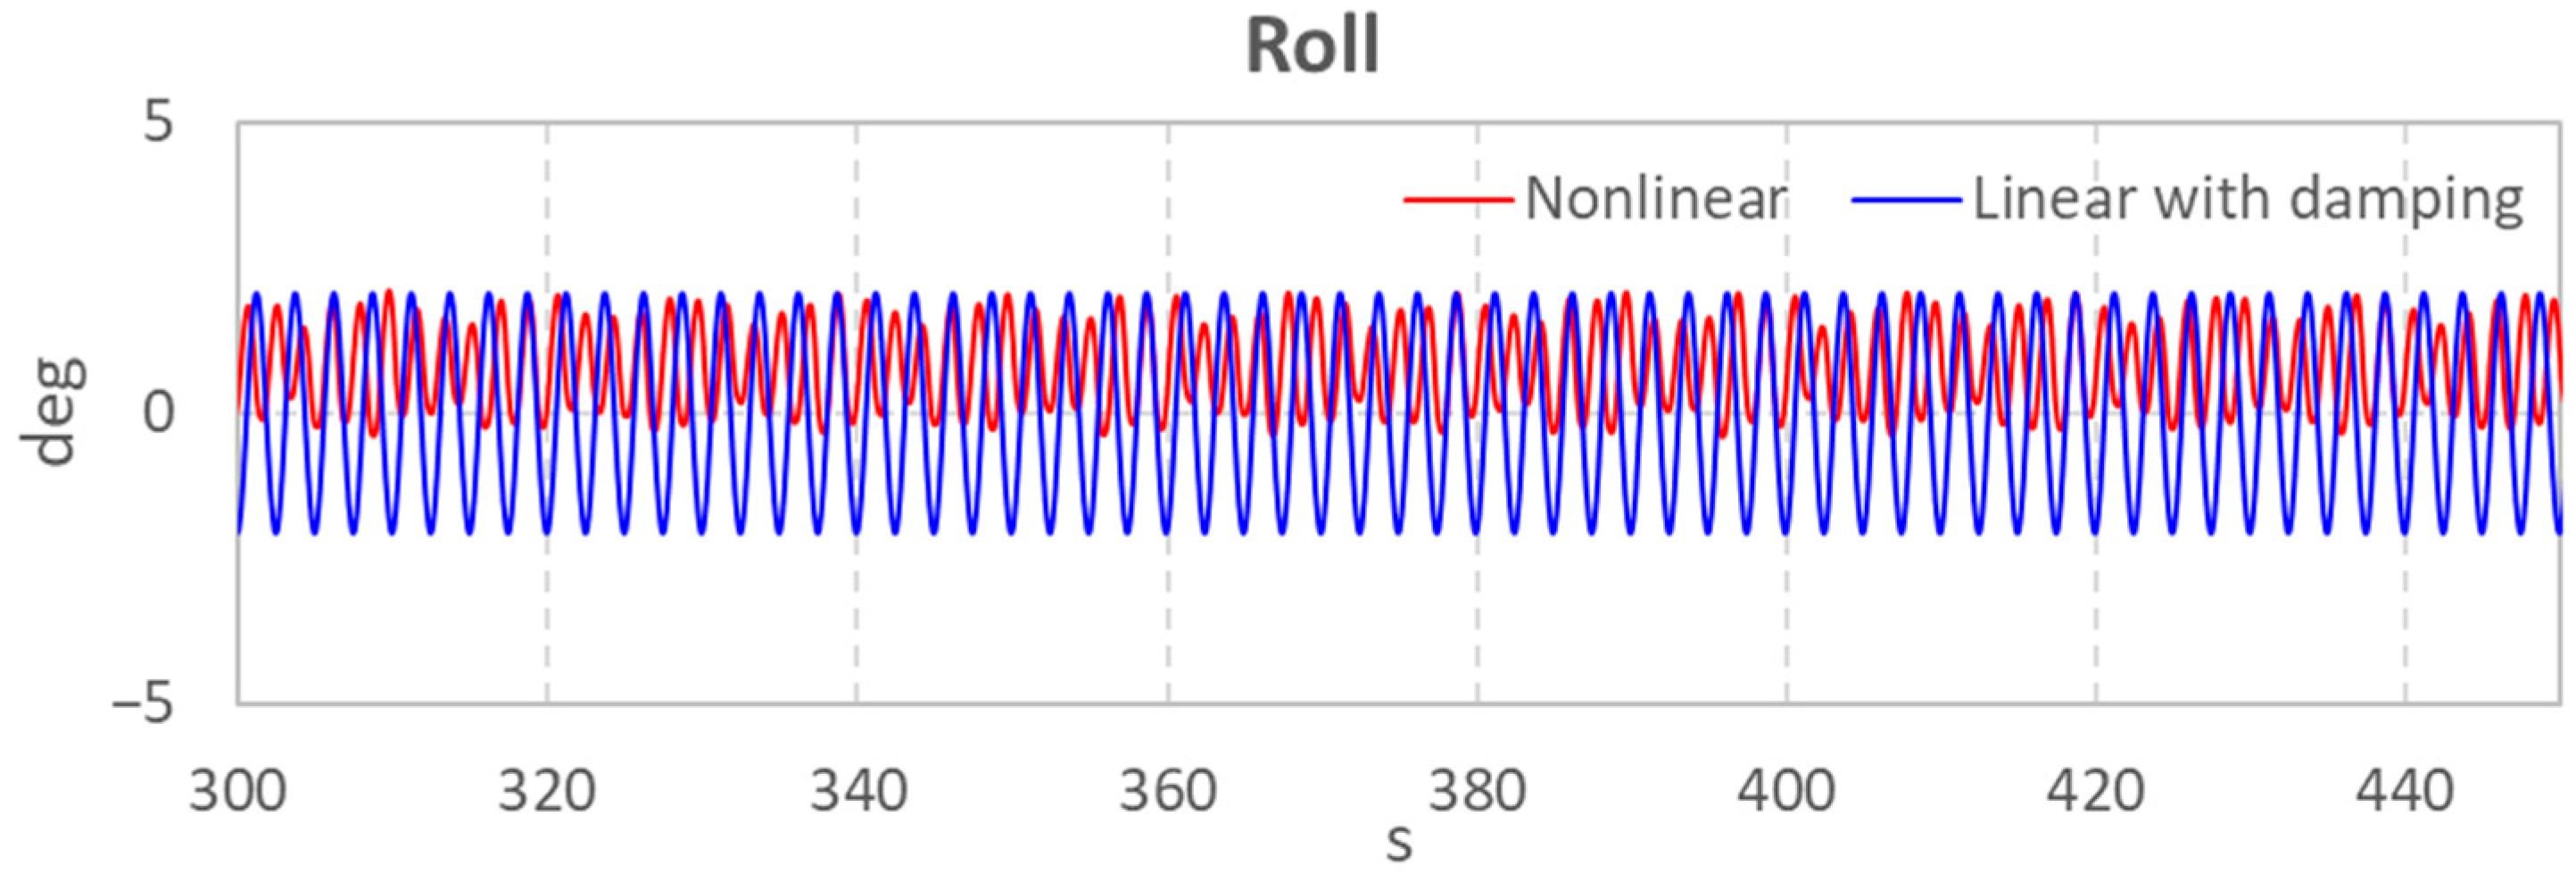
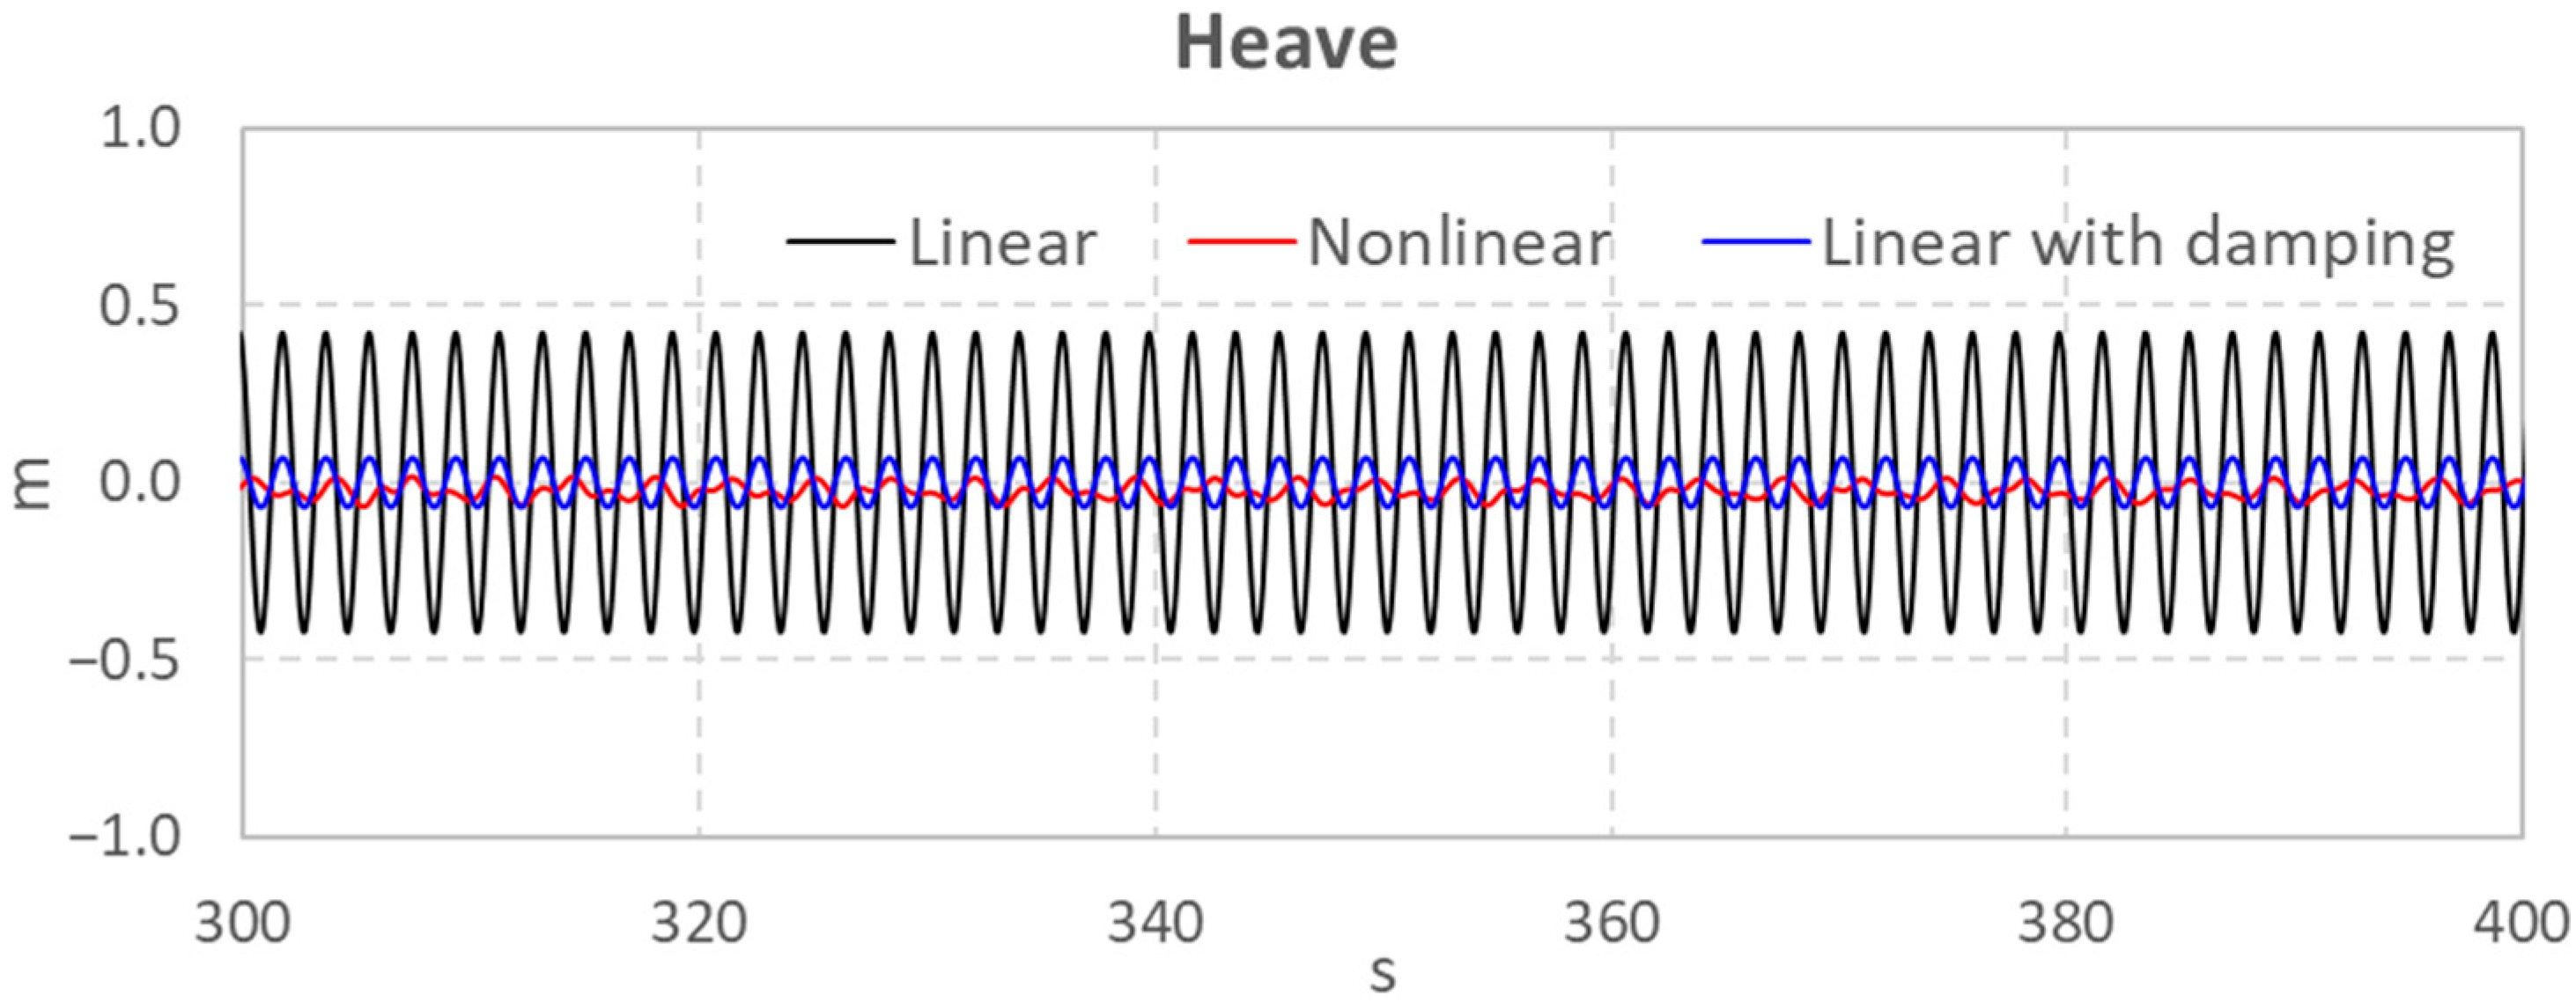
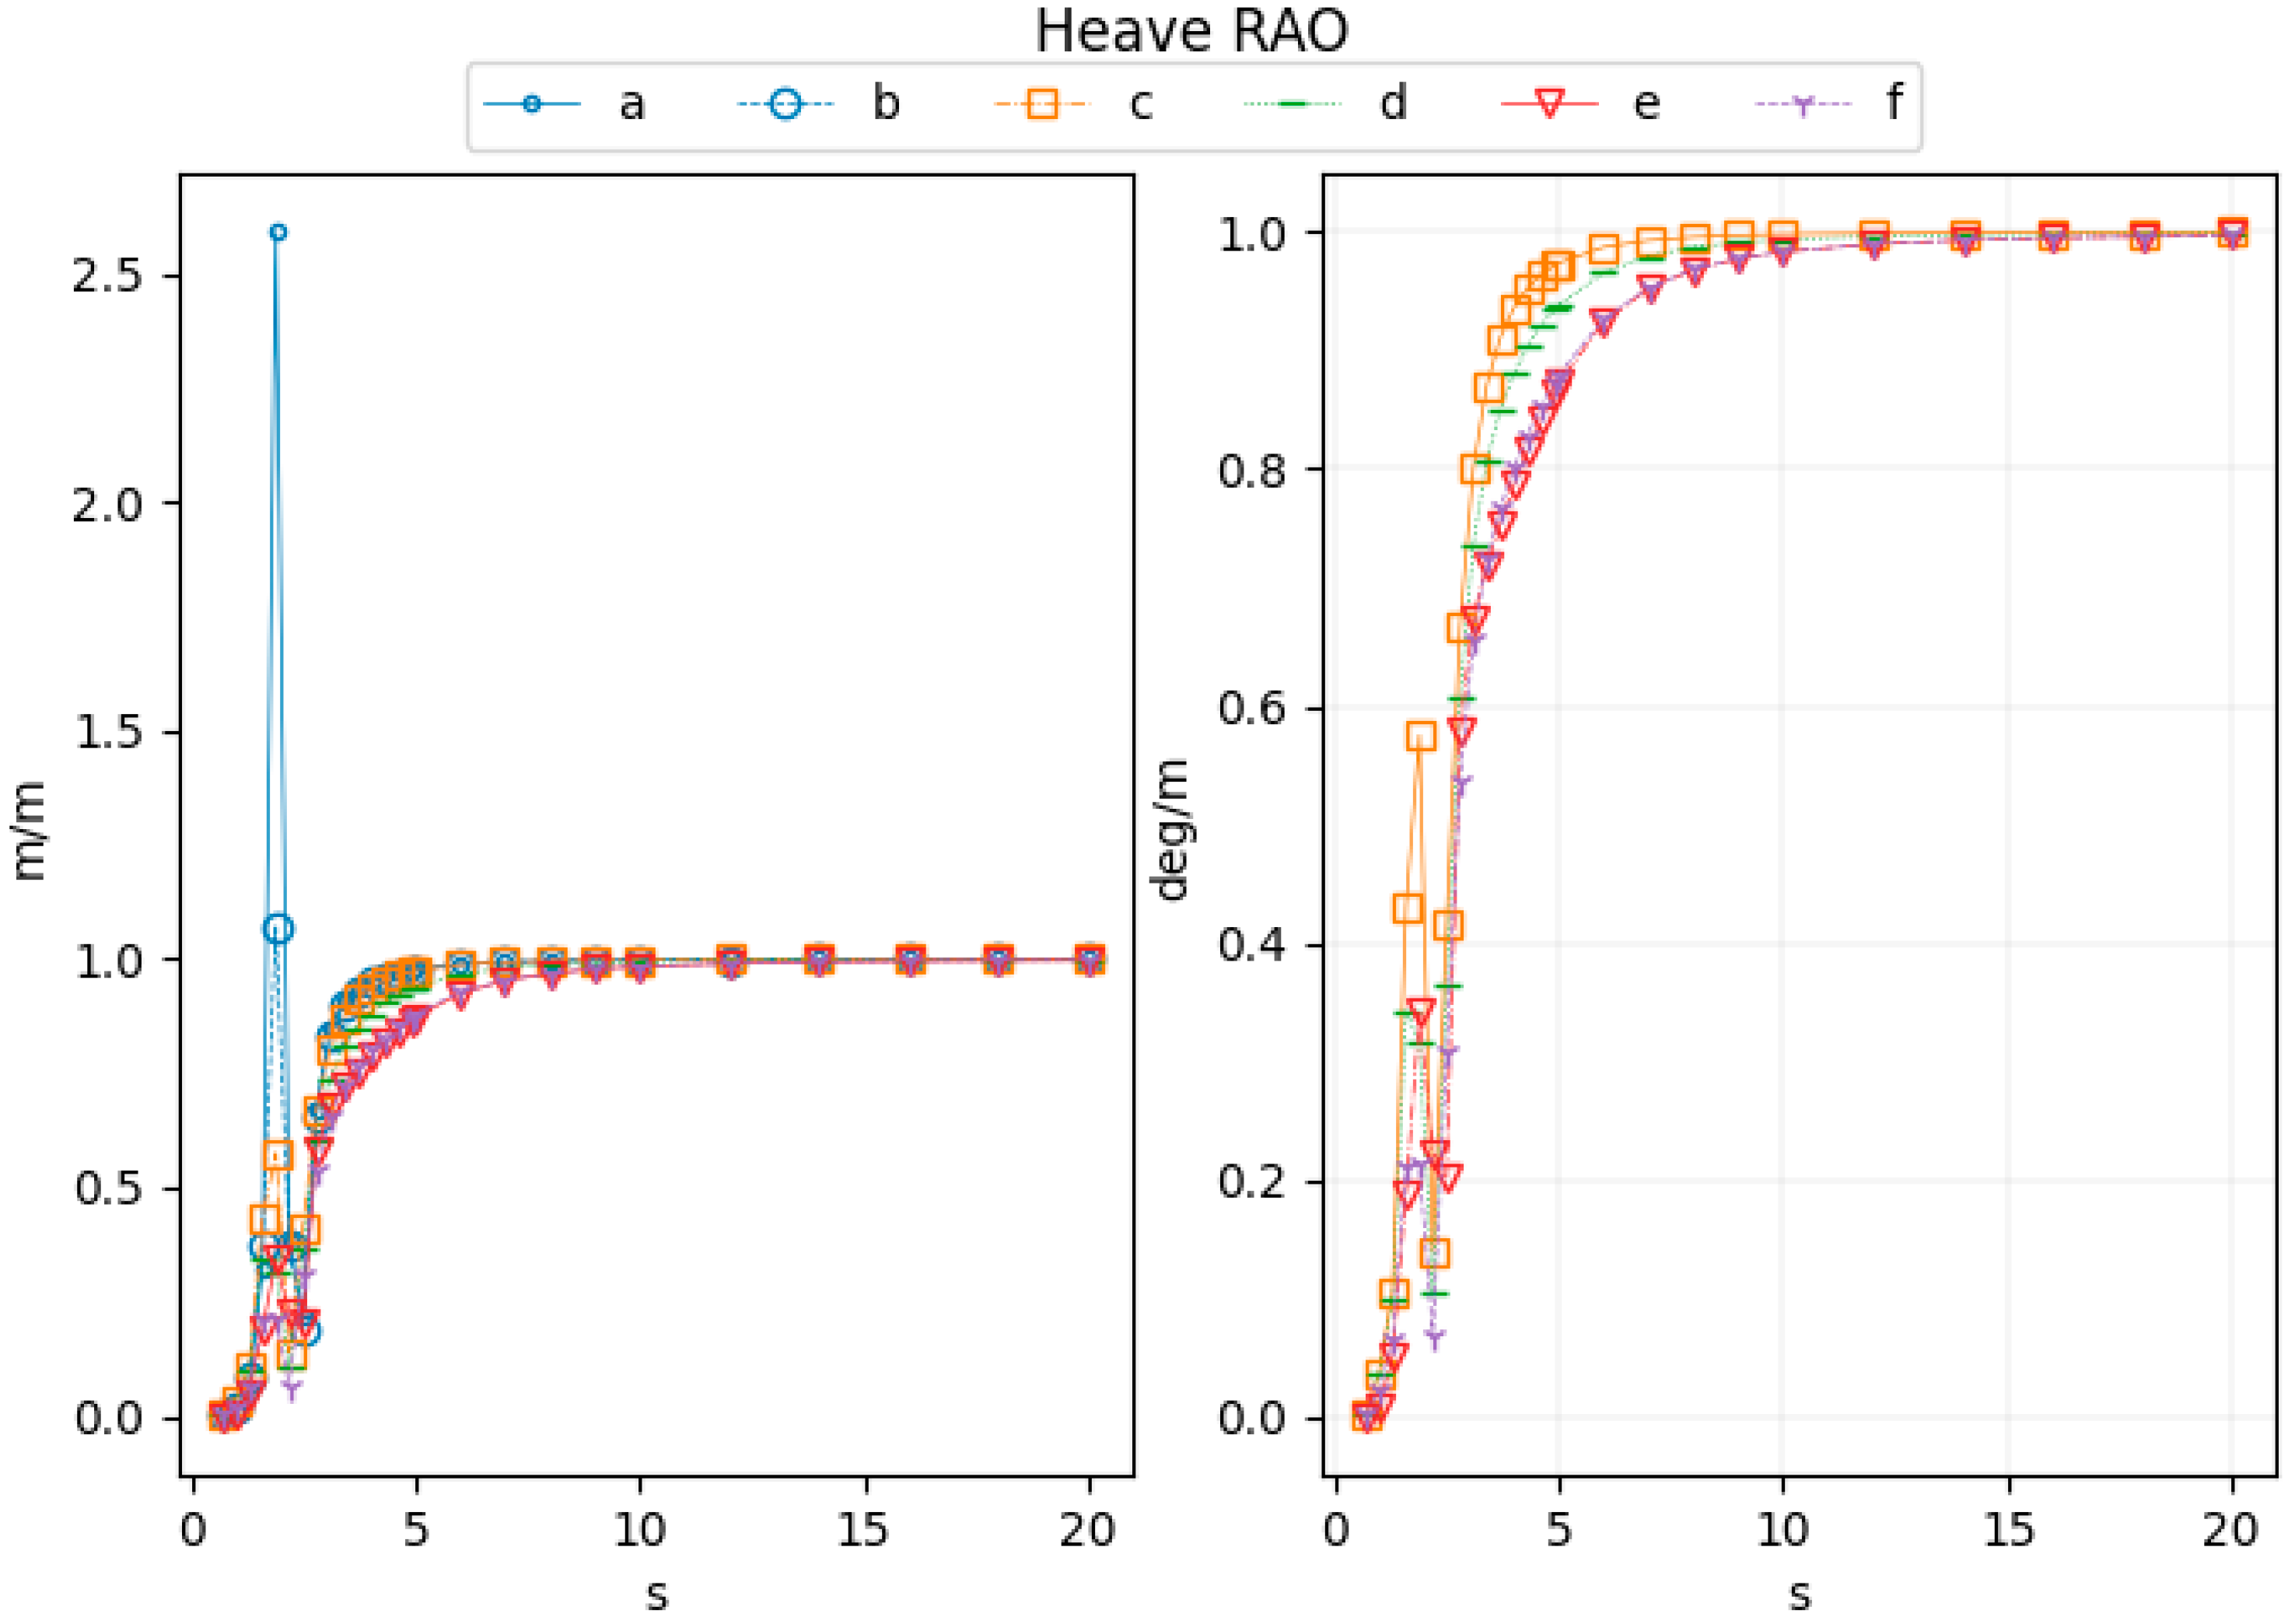
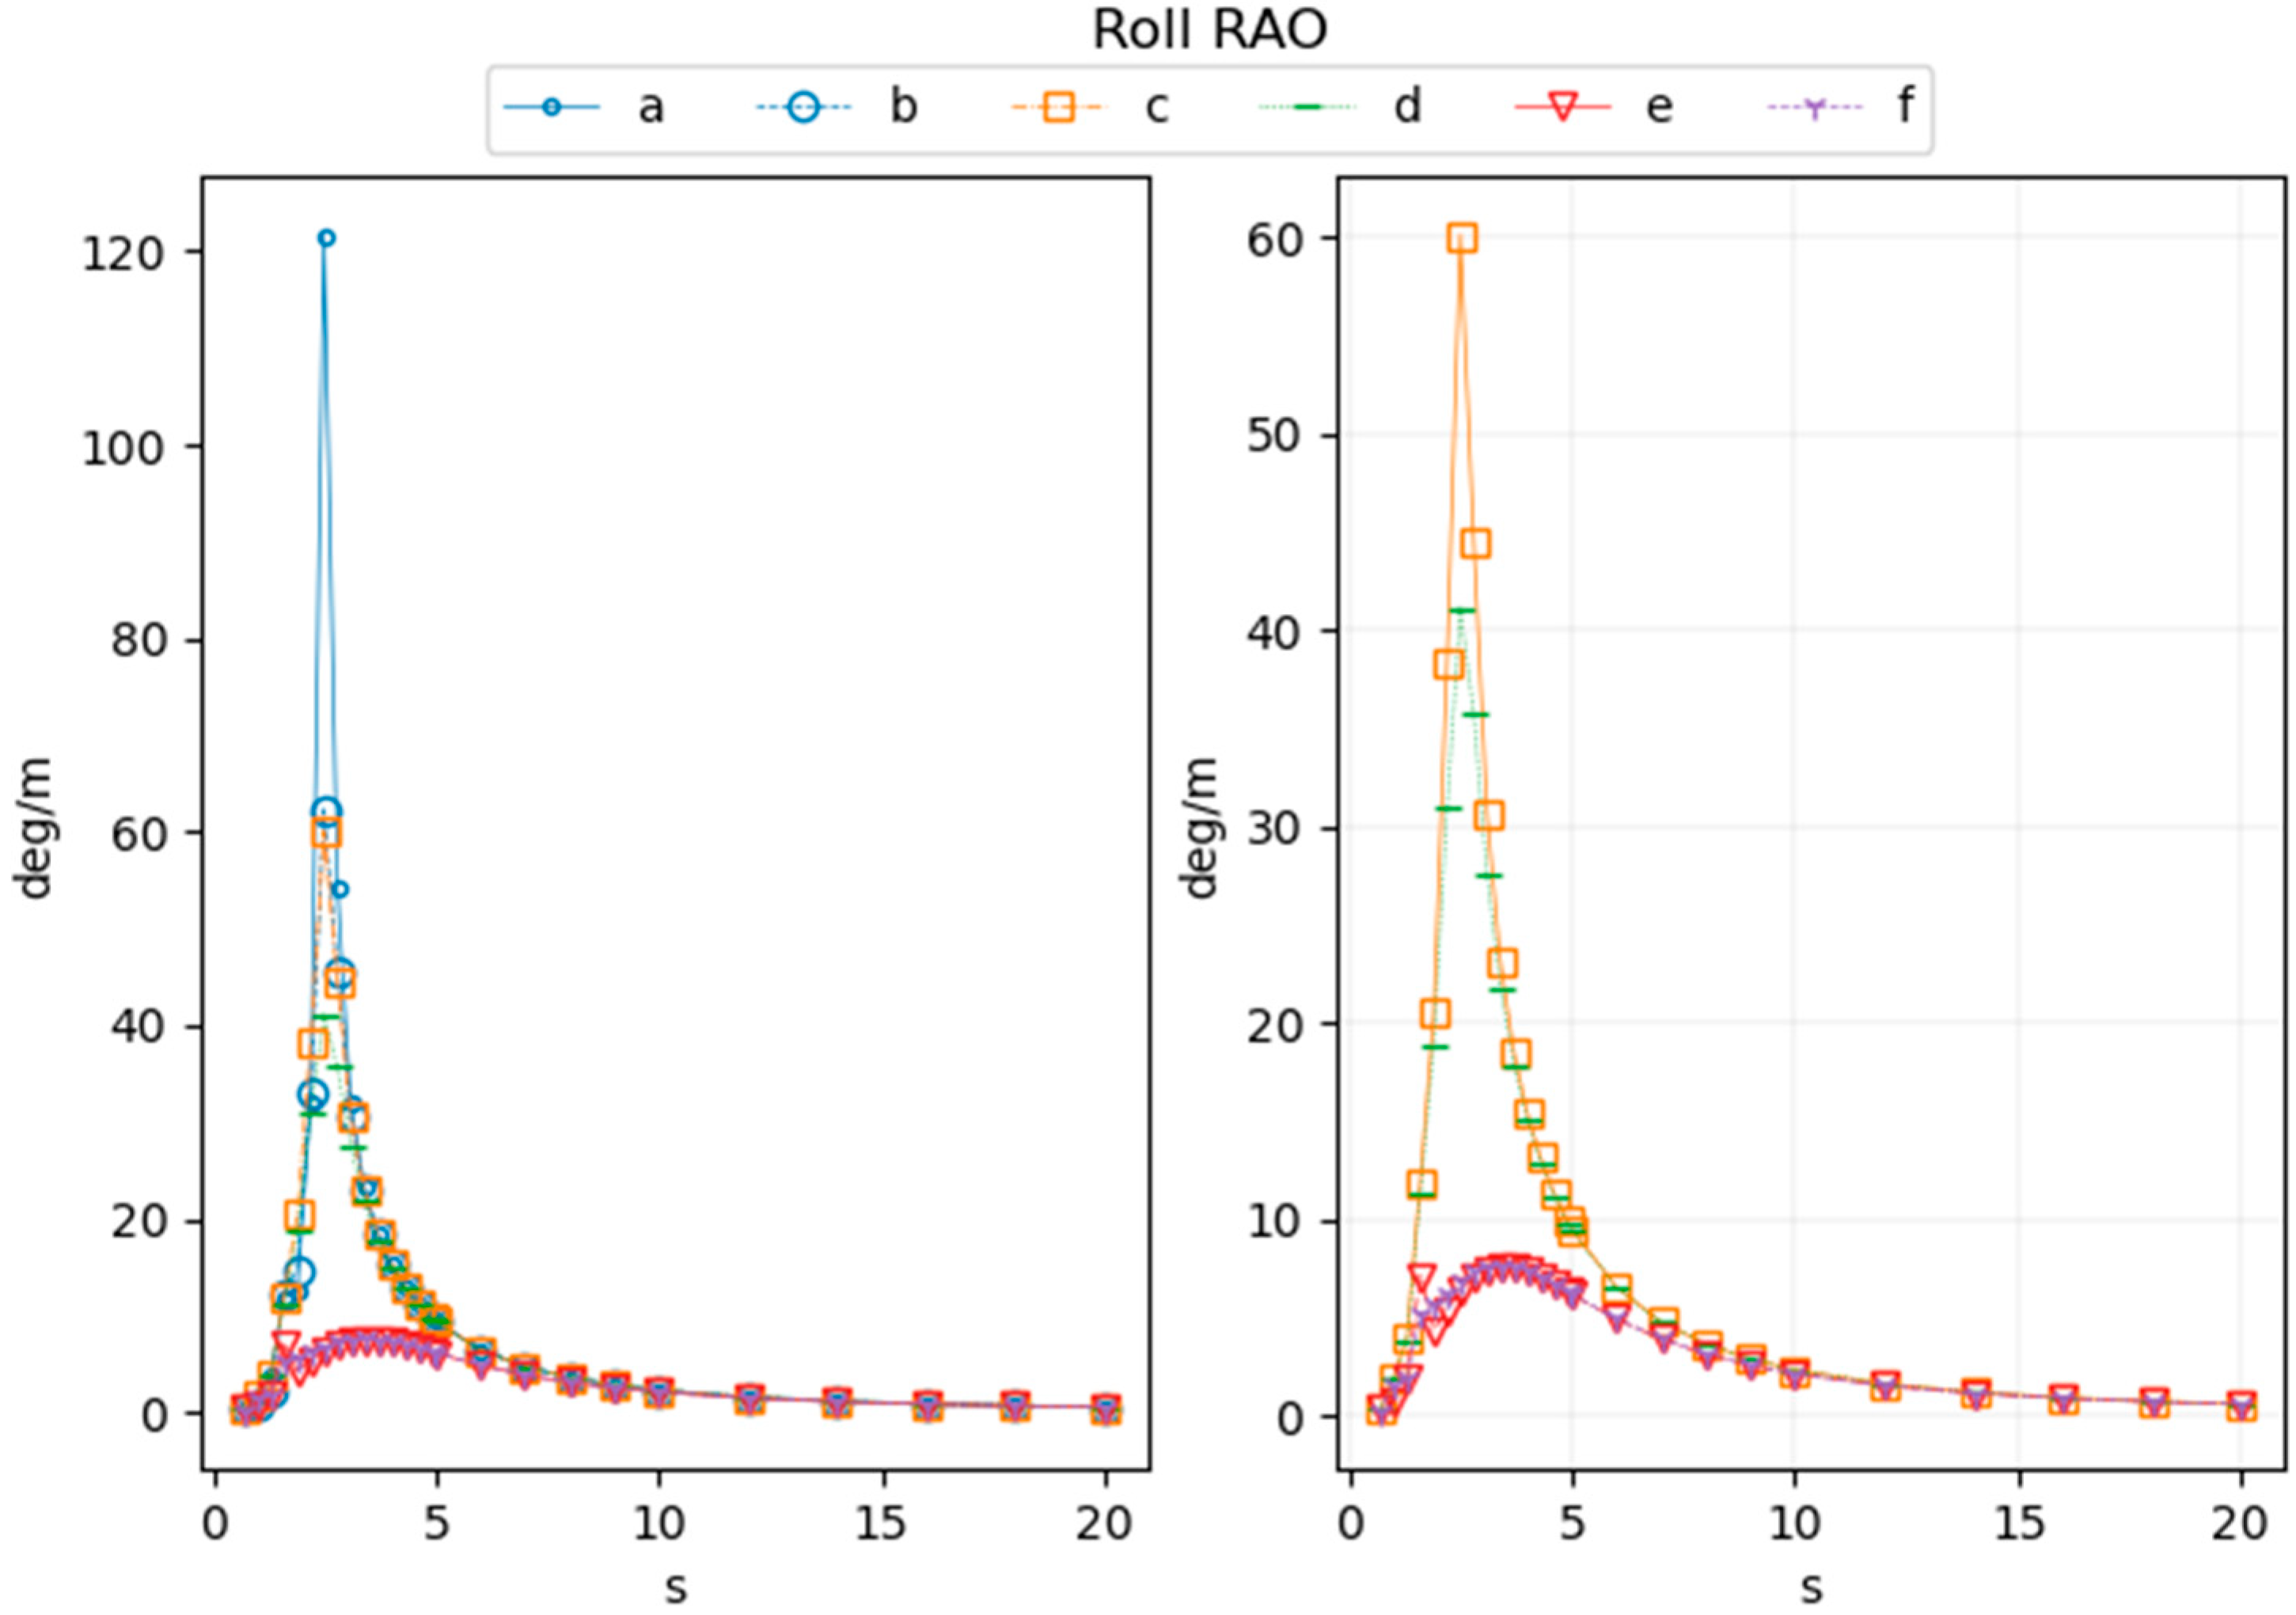
For this type of FPV (or similar design), the size of a single floater is relatively small. Due to the low freeboard and small air gaps in the area between the pontoons, a linear frequency domain approach may not easily provide realistic hydrodynamic results, even with an extra beam element calculated by Morison theory and/or damping coefficient with an empirical value from other industries. A resonance mode may be caused, which may bring in the wave impact on the bottom of the upper structure. For small waves, this might not be a concern for structure design, but it leads to unrealistic hydrodynamic coefficients, which makes the time domain system analysis (e.g., the mooring design) difficult. It is attempted to add some free surface damping, yet the outcome is not satisfactory.
Without a model test, the nonlinear hydrodynamic solver in the time domain becomes important in this study. It is found that, to obtain a similar response of the nonlinear analysis, a damping coefficient that is much larger than empirical values may need to be specified. Nevertheless, this still provides the opportunity to obtain the hydrodynamic coefficients in an efficient way, considering the time consumption of a nonlinear approach.
For multibody analysis, some large motions of the modules may be observed on the outer areas of the FPV array, which potentially may be caused by the gap resonances. Free surface damping on those gap surfaces could obviously eliminate the unrealistic responses though.
Compared to the previous studies, this is the first attempt to apply different free surface damping models, as well as the nonlinear potential solver to a floater with a relatively small size, also with a large number of bodies. It seems that larger damping coefficients may be needed to obtain reasonable responses, compared to conventional O&G structures. In addition, the change in water surface may have larger impacts on the load calculation and consequently the motion prediction. This is understandable though considering the relative scale of FPV modules and the incoming wavelength even under the small wave height. The results could be further used and refined in the later model test validation.

7. Preliminary Coupled Analysis with Mooring System

Based on all the discussions above, some further studies are carried out to check the global performance and mooring system of the FPV system. It is not within the scope of this paper to present the simulation and results in detail, while some initial descriptions and outcomes are listed below.
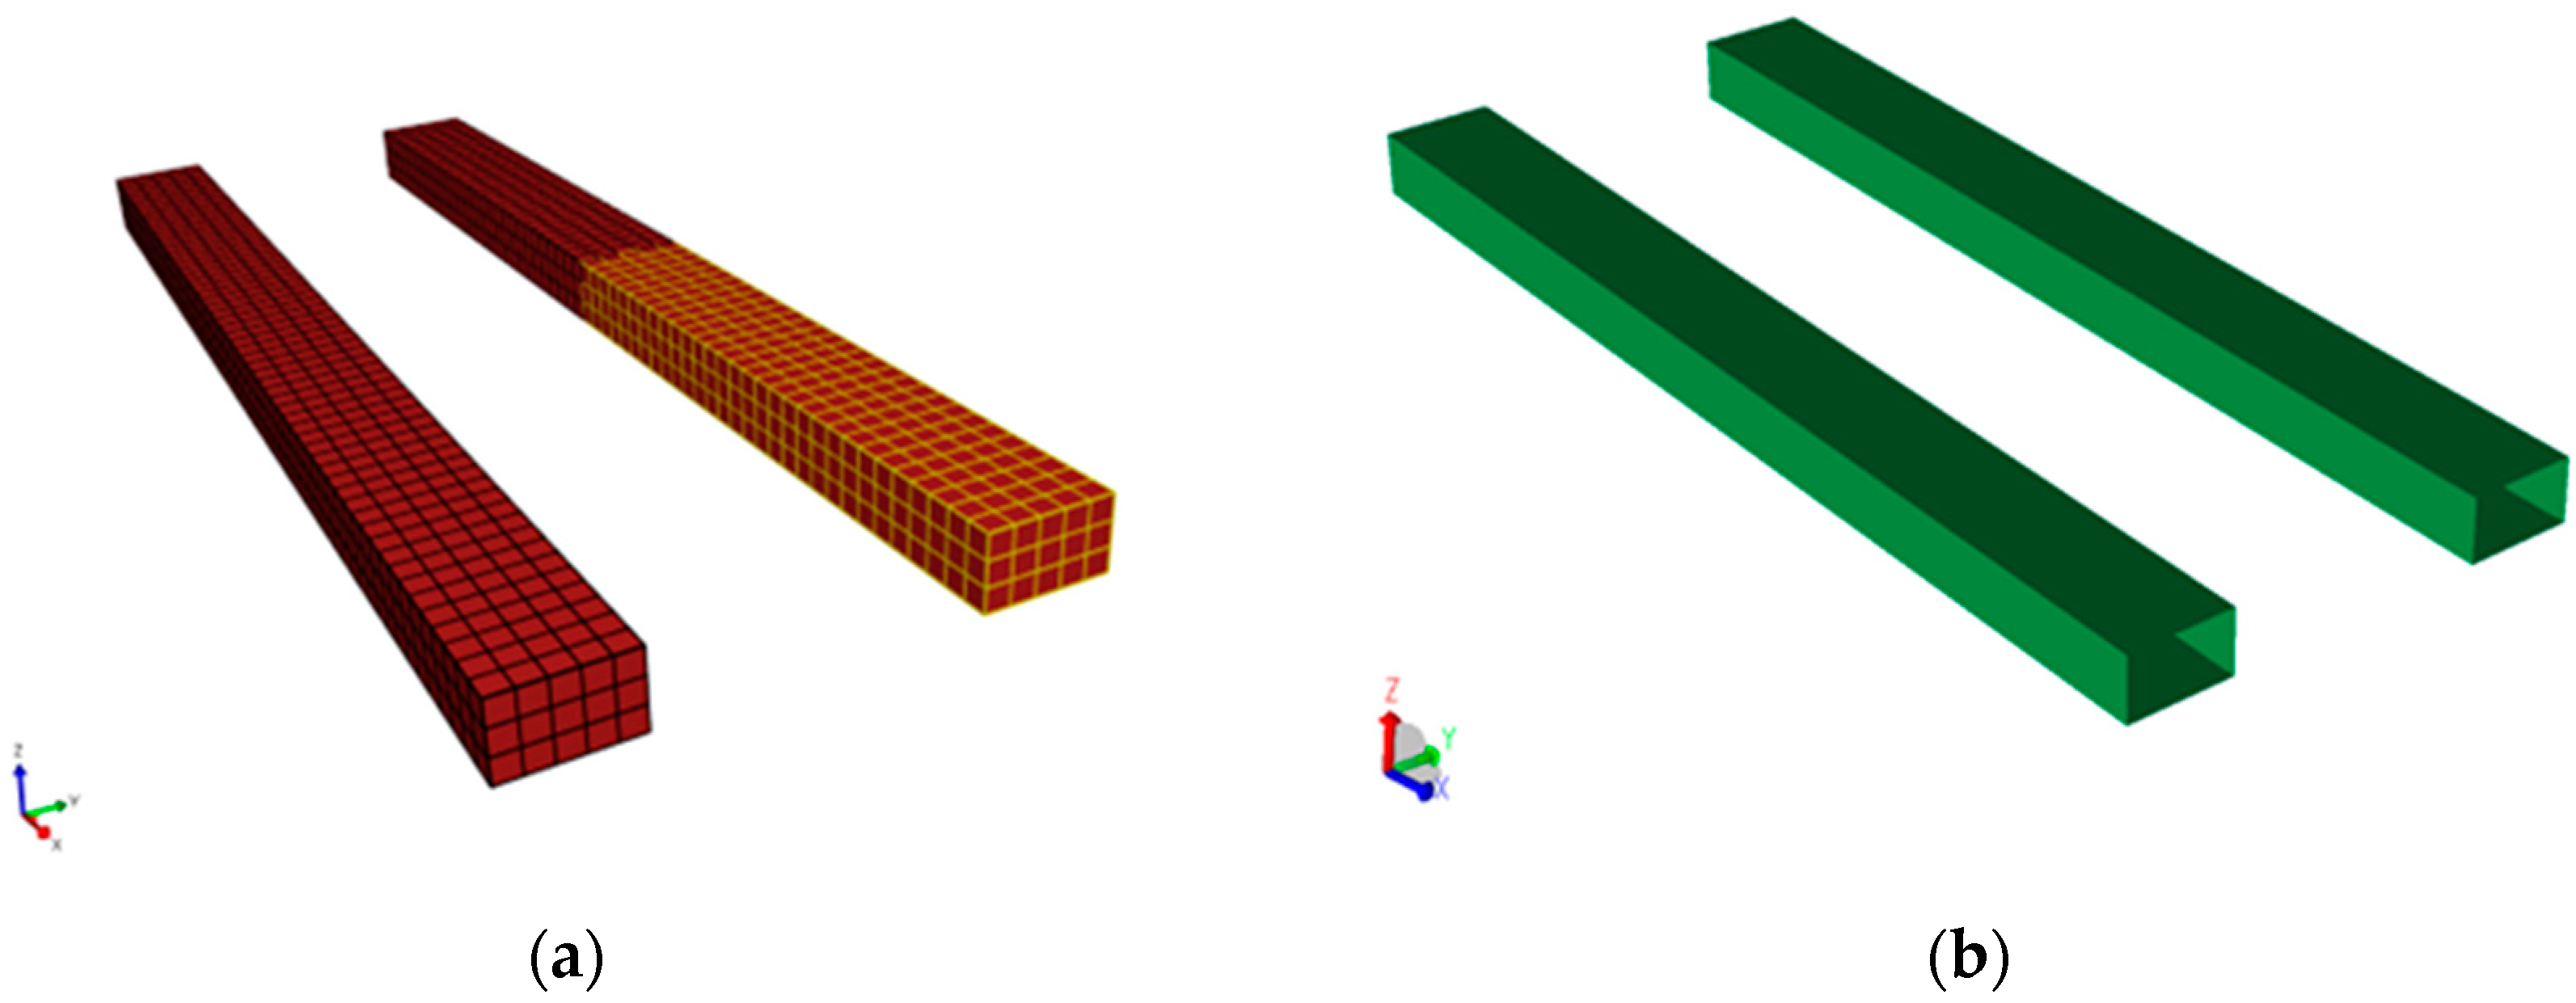
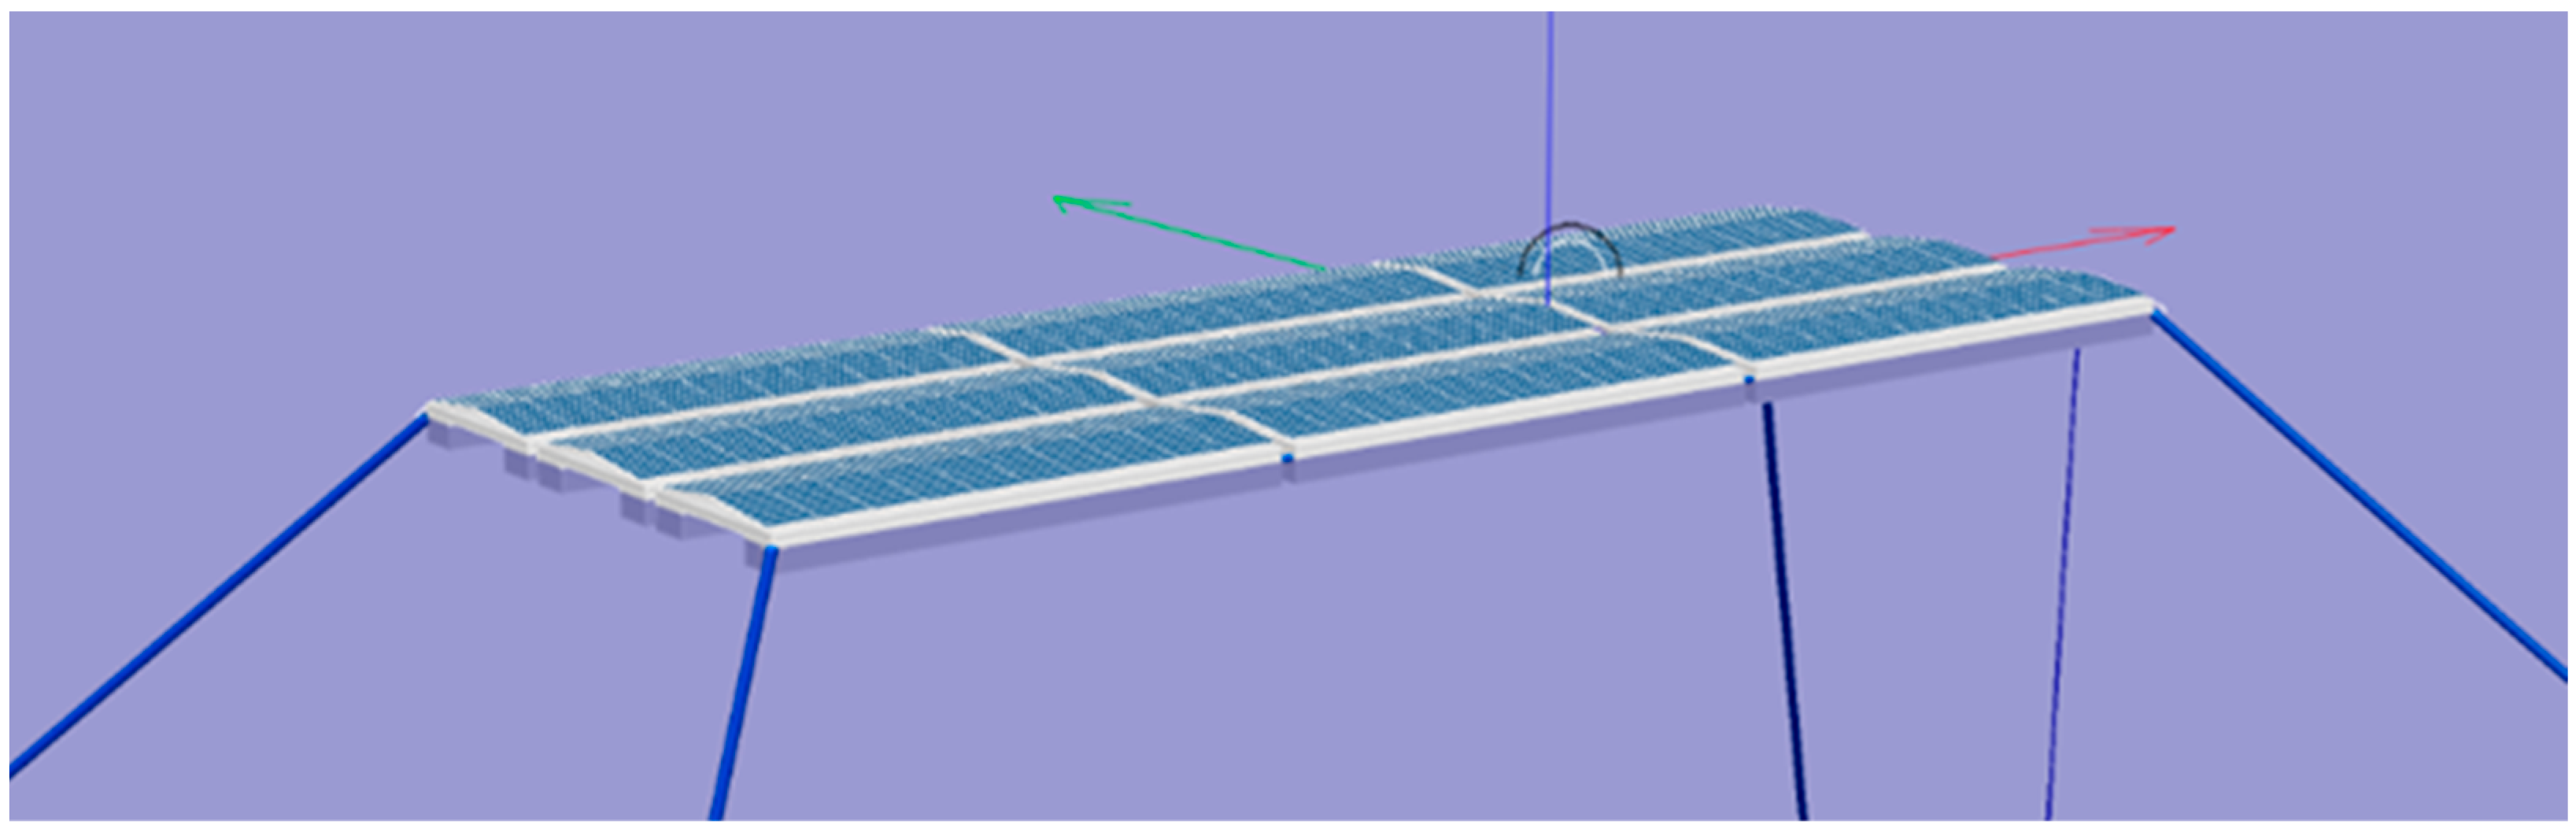
Corresponding to the hydrodynamic analysis, a simplified system with 9 modules and 4 mooring lines is first simulated to check the feasibility and convergence of the simulation, as shown in Figure 23. Connectors between modules are modeled with nonlinear stiffness, and different numerical models and parameters are also tested.
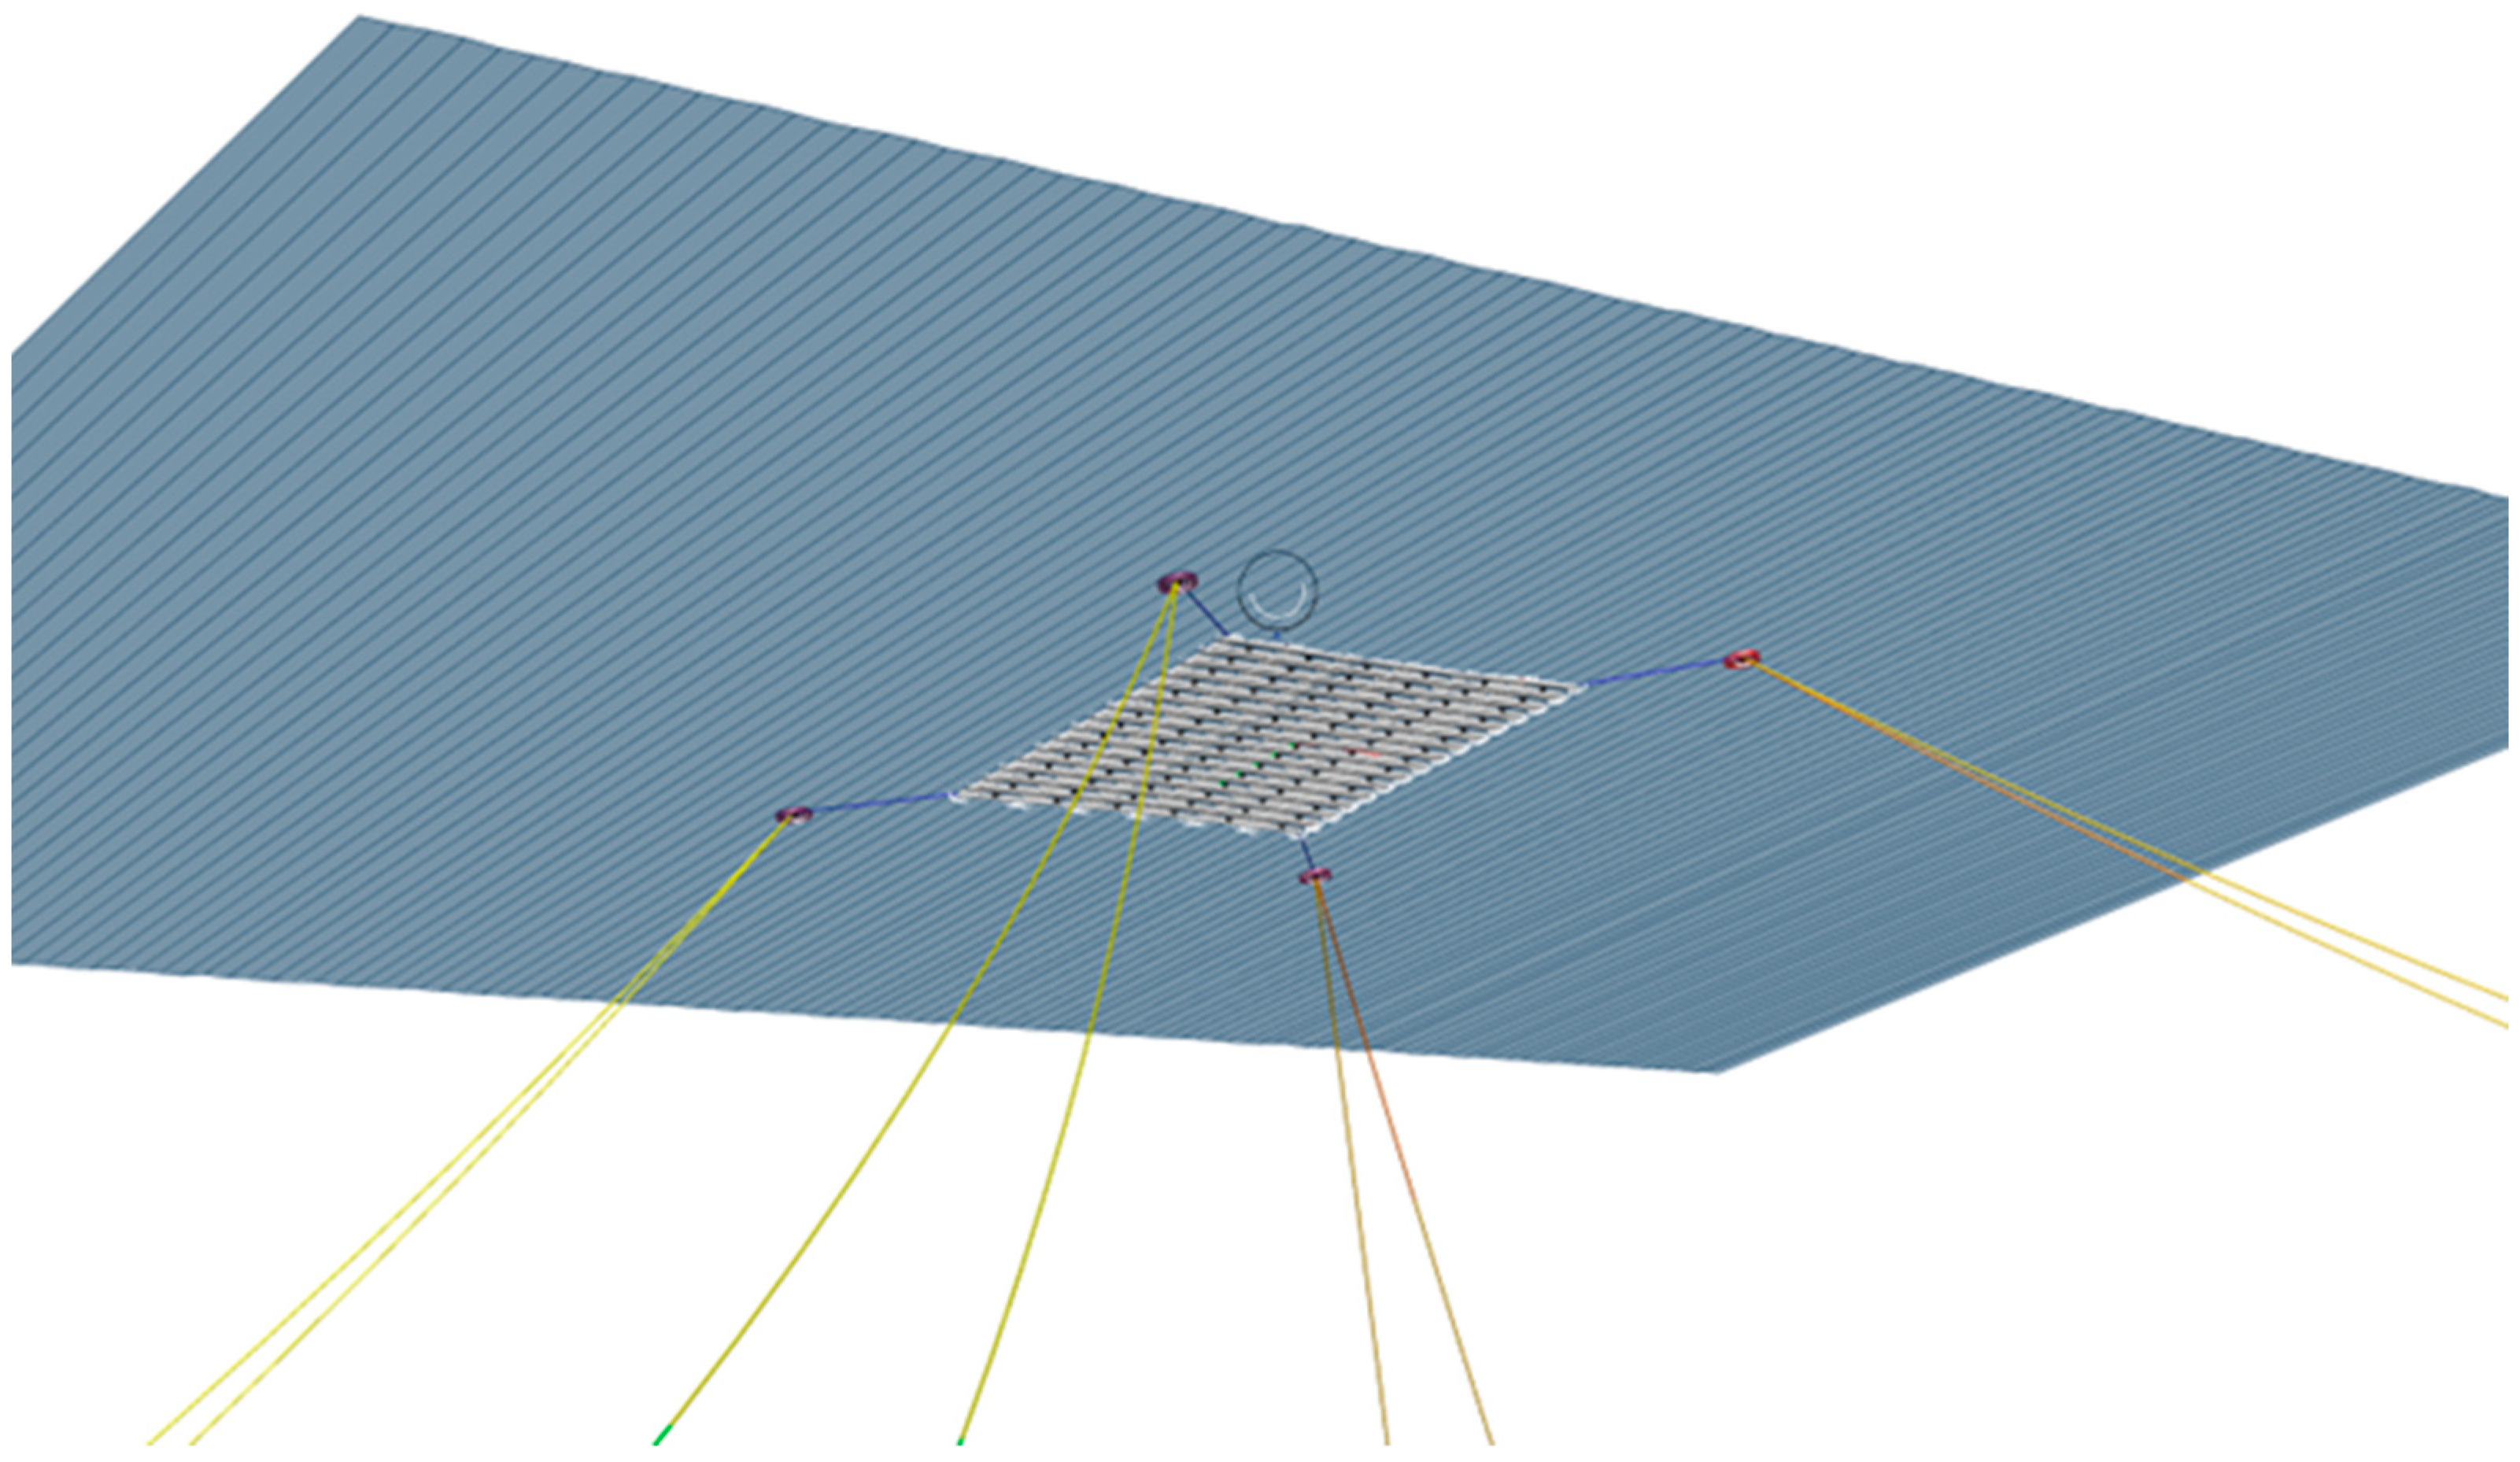
Based on the results from the simplified system, a complete system with 90 modules, 4 buoys, 4 connecting lines, and 8 mooring lines is built afterward, as shown in Figure 24.
The environment conditions for the seastate used in the testing run are listed in Table 6. The water depth for the example site is 300 m.
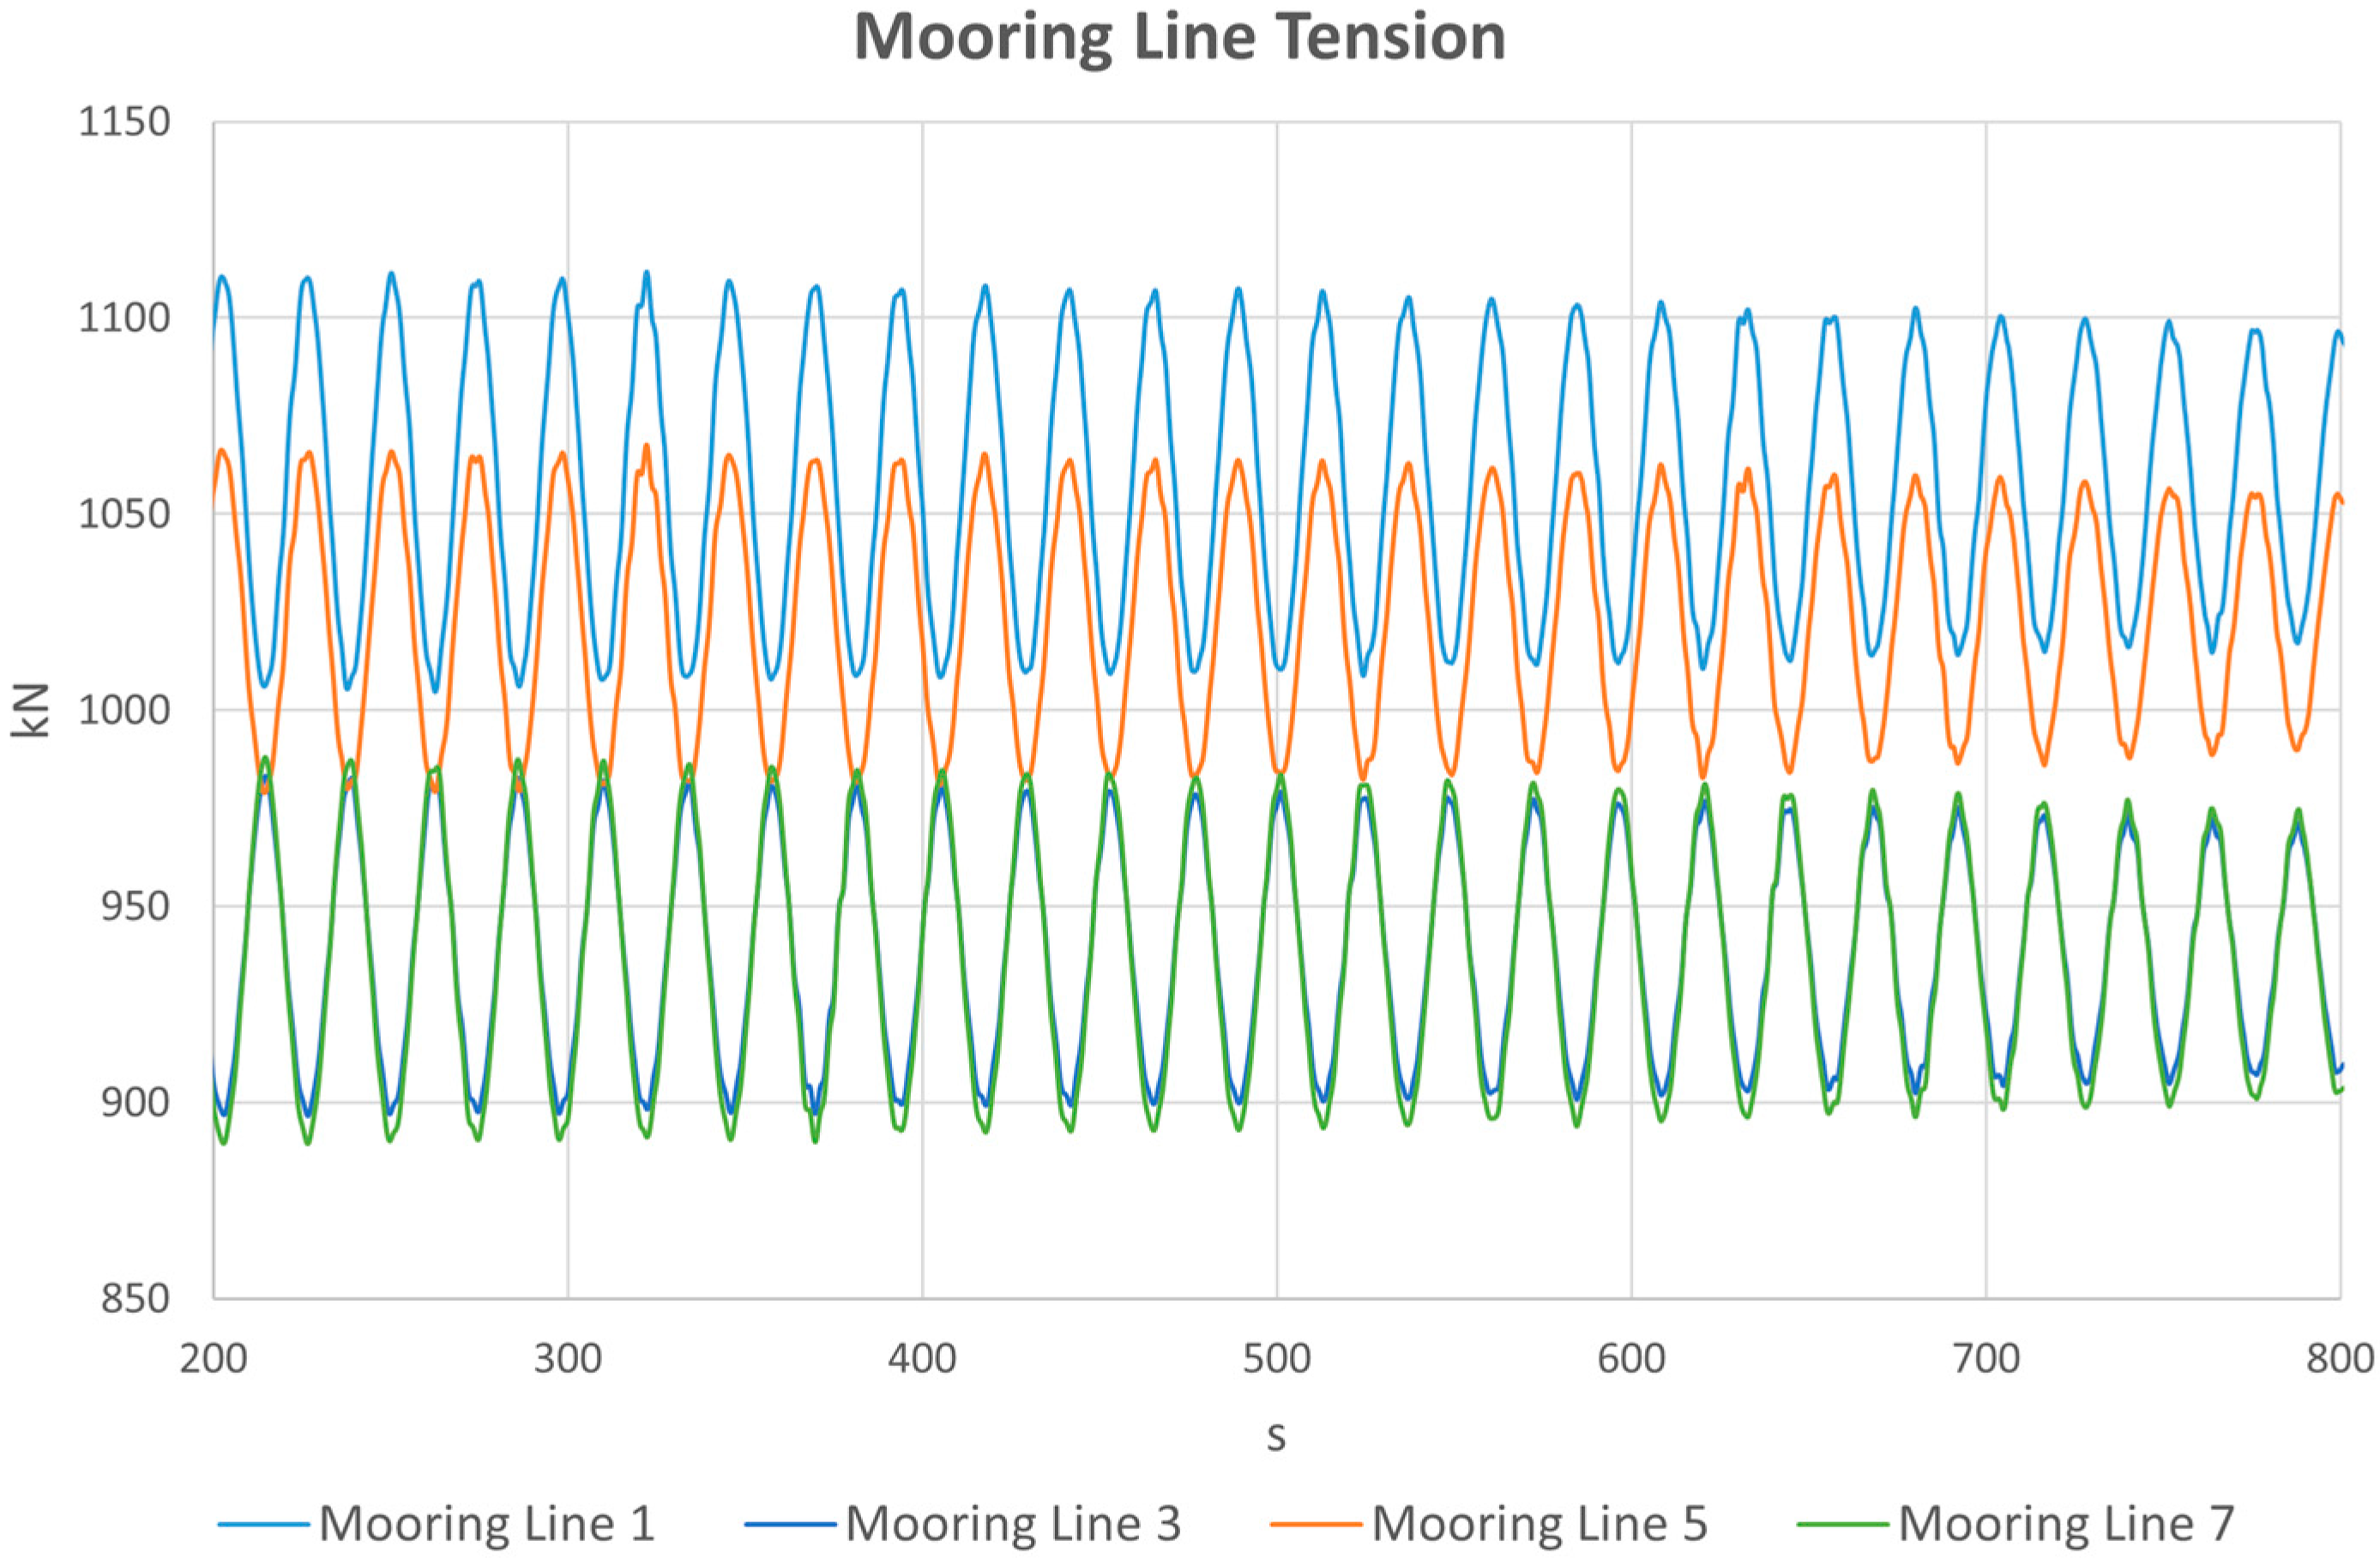
Figure 25 shows the mooring line tensions under an operation environment. In general, it seems the system is quite stable, and the tensions are well within design limits in the cases analyzed.
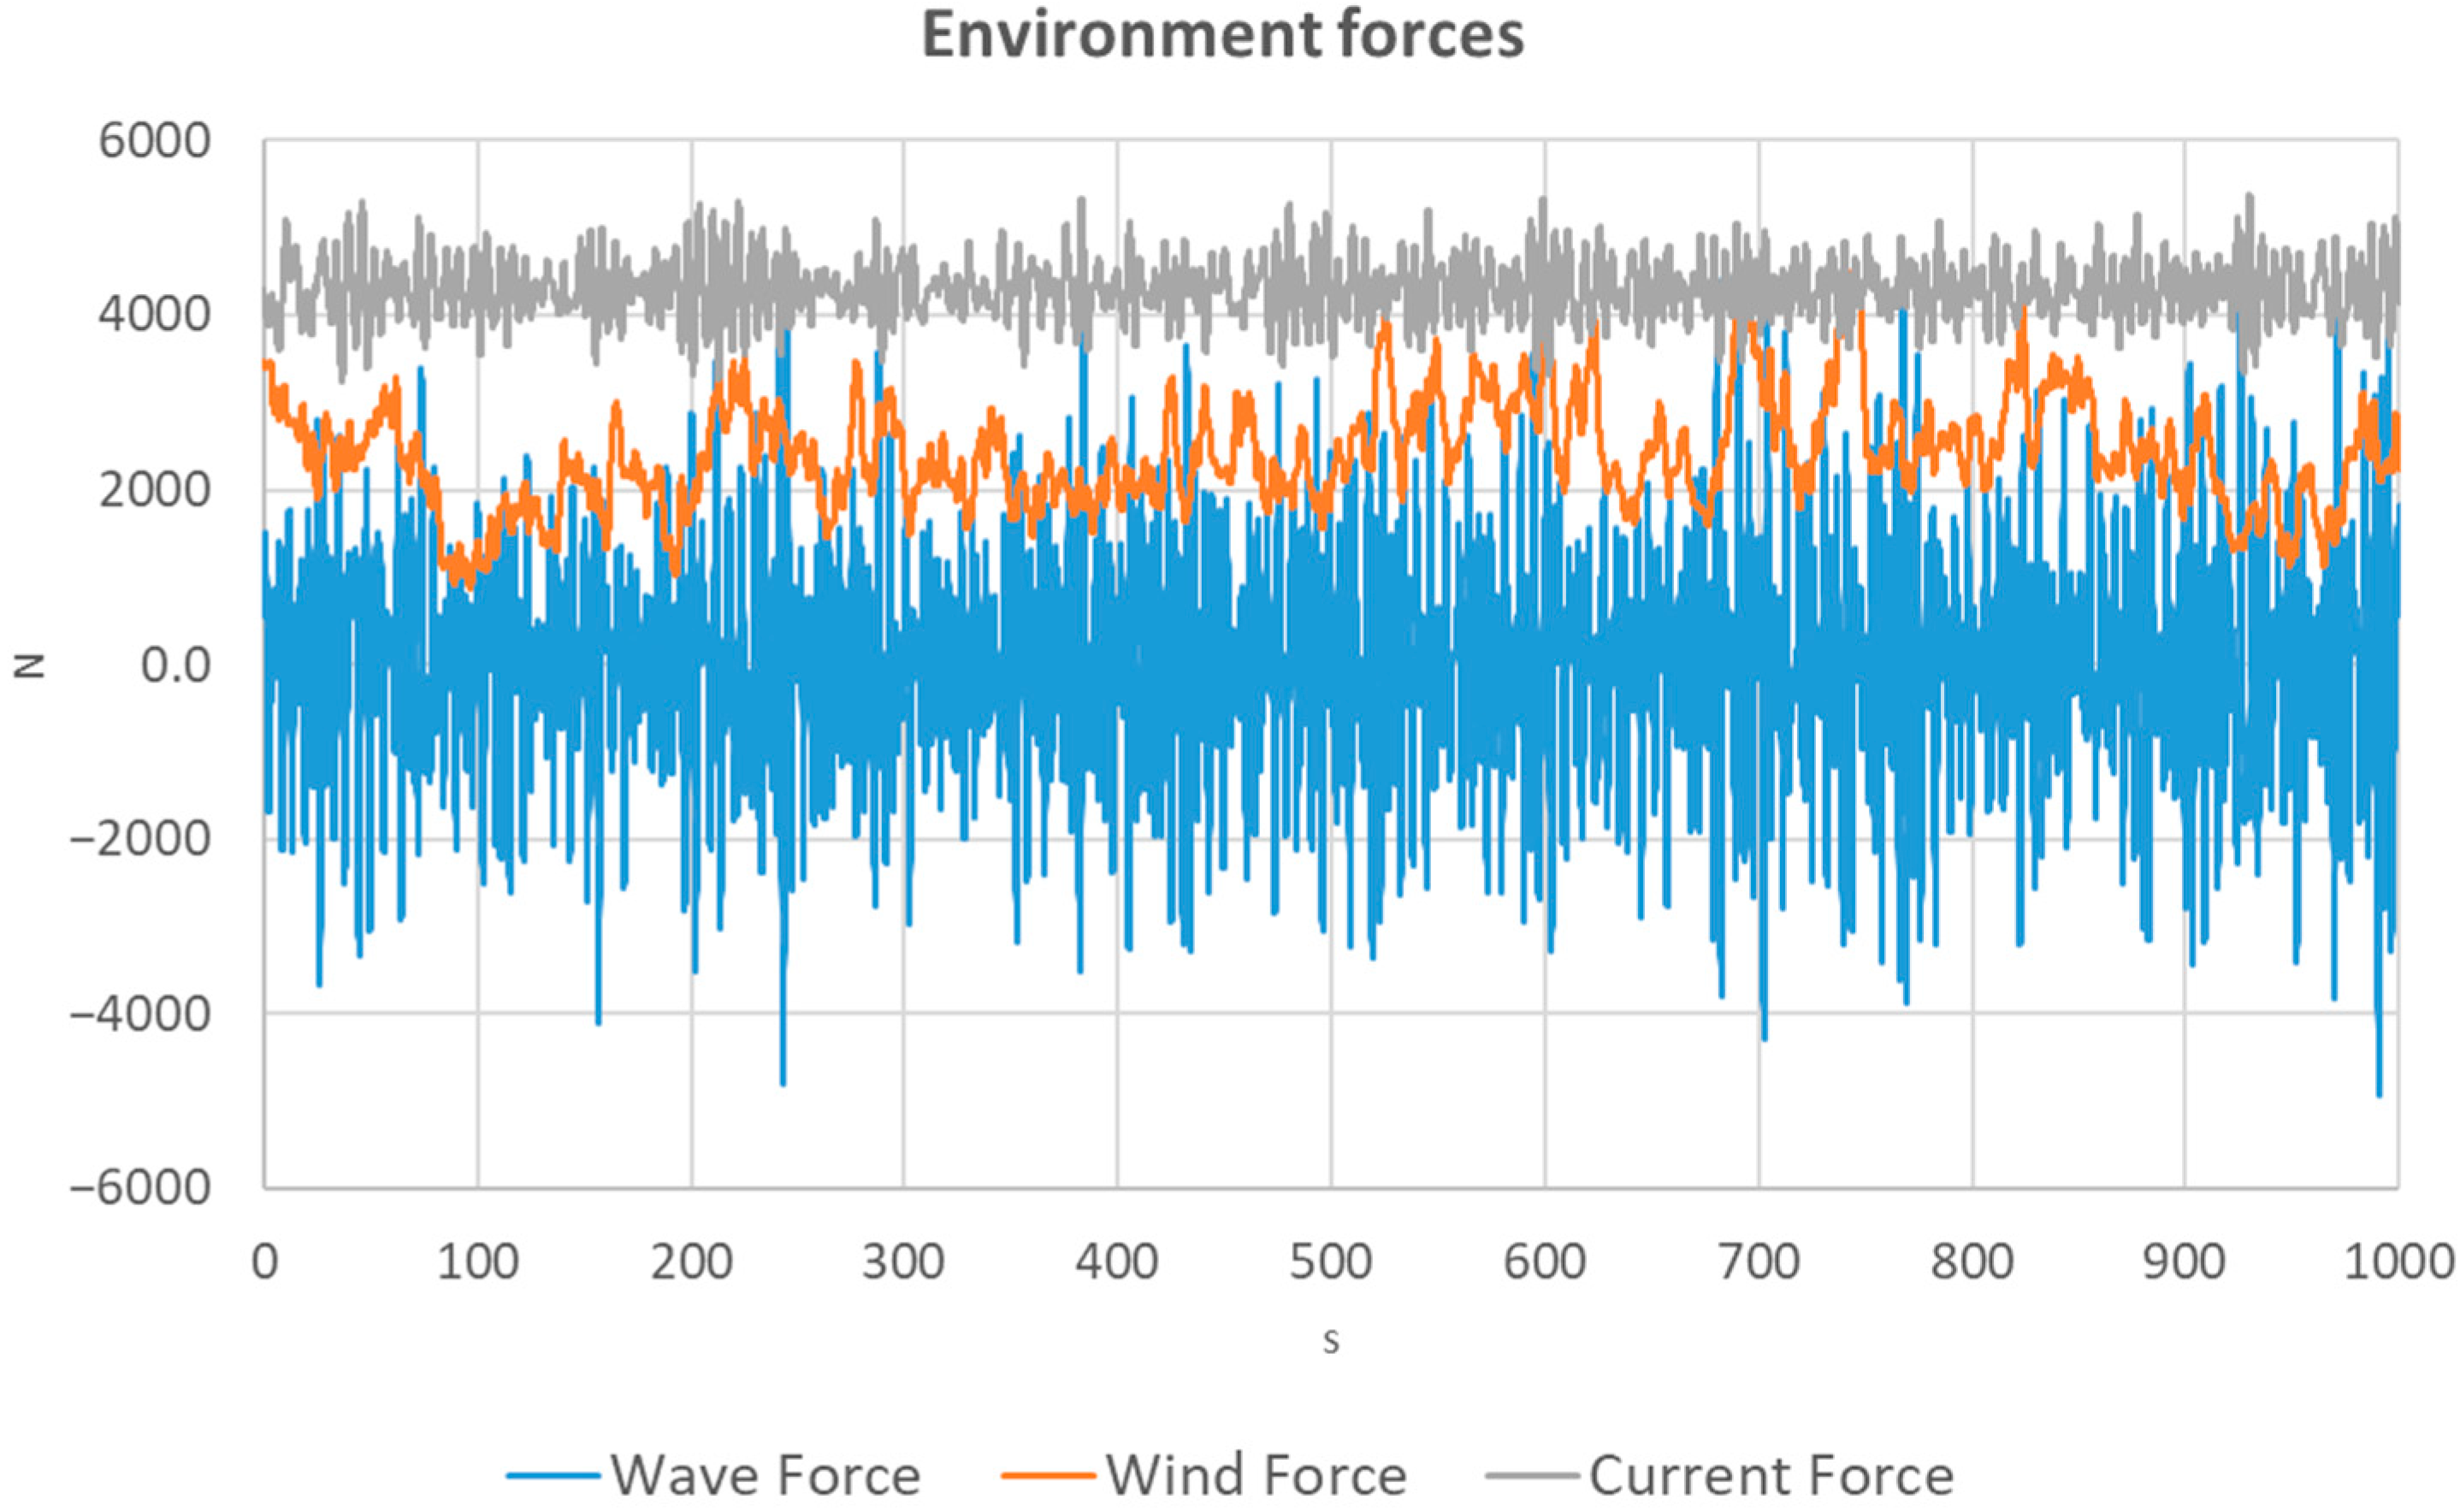
In another attempt, wind and current coefficients based on an empirical formula are added to the modules to check the effects from different environment loads.
Figure 26 shows the results from one of the modules. It seems that the wave loads (the blue curve) provide most of the dynamic part, while wind (the yellow line) and current (the gray line) loads are also in the same scale of magnitude.
Considering that this type of FPV is normally used in inland water, such as lakes or reservoirs, where waves are normally small, the design focus may drift to withstanding large winds. This aligns with the previous investigation on the feedback from some FPV manufacturers.
A more thorough analysis of the complete FPV system will be studied and summarized in follow-up papers.

8. Conclusions

In the previously reviewed study, there are many technical feasibility analyses for the assessment of electrical performance and optimization of efficiencies with cooling, tracking, and concentrating mechanisms. Technological variations in conceptual and installed designs of FPV installations were outlined. Some preliminary mooring design methods adapted to floating solar were presented from a quasi-static perspective, while it seems that the literature and technical data of designs and installations of FPVs are still very limited, especially the hydrodynamic analysis for single floater and coupling effects with a large number of modules, and the analytic approach for mooring design.
This paper studied the hydrodynamics and coupling effects of a multiple-floater-type FPV concept. Some conclusions are listed below:
  • Although the configuration of a single FPV module is relatively simple and small, the hydrodynamic performance can be complex, and some thorough studies may be needed.
  • Linear hydrodynamic analysis may not necessarily provide realistic results, due to the low freeboard, small airgap, and possible resonance of the water areas between the pontoons. And it is difficult to eliminate such effects by estimating the responses properly in a frequency domain approach, when a model test calibration is not available.
  • The main reasons could come from several aspects. For a single module, the structure size is relatively small, and even medium wave conditions could cause large motions, which could lead to nonlinear responses of the water surface between the pontoons. For the module array, due to the small gaps and large numbers of floaters, the water in between the inner modules could be shadowed from the outer ones, and the traditional frequency domain potential solver may not give accurate predictions.
  • The time domain potential solver with nonlinear analysis may provide much more reasonable estimations for such effects, including the change in wet surface, and effects from water impacts on the bottom or waves on-deck. It is also time-consuming to run a comprehensive nonlinear hydrodynamic analysis for all the incoming wave periods, and even more cumbersome for the analysis of multibody hydrodynamics with the nonlinear solver.
  • For single-module hydrodynamics, it could be good practice to use a frequency domain approach with proper damping coefficients, calibrated from model tests and/or nonlinear hydrodynamic analysis.
  • For the coupling hydrodynamic analysis with multiple modules, free surface damping should be considered to obtain reasonable responses of modules at different locations of the FPV array.
  • The next focus should be on the coupled analysis of the complete FPV system, including the modules and auxiliary buoys, mechanical connectors, bridles, and mooring lines. Furthermore, based on the application scenarios, the FPV responses under different kinds of environmental loads should also be carefully compared and investigated in the later studies.

Author Contributions

Conceptualization, F.Z., W.S. and Q.W.; methodology, F.Z.; writing—first draft preparation, F.Z. and W.S.; review and editing, F.Z., W.S. and Q.W.; project administration, F.Z.; funding acquisition, W.S. All authors have read and agreed to the published version of the manuscript.

Funding

This research was funded by the National Natural Science Foundation of China (grant No. 52071058, 51939002).

Institutional Review Board Statement

Not applicable.

Informed Consent Statement

Not applicable.

Data Availability Statement

The data are not publicly available due to confidential agreement of the project.

Conflicts of Interest

The authors declare no conflict of interest.

References

  1. BP Energy Economics. bp Energy Outlook, 2022nd ed.; BP: London, UK, 2022. [Google Scholar]
  2. DNV. More than the Sun: The Solar Outlook Report; DNV: Hovik, Norway, 2020. [Google Scholar]
  3. Rosa-Clot, M.; Tina, G.M. Floating PV Plants, 1st ed.; Academic Press: Cambridge, MA, USA, 2020. [Google Scholar]
  4. Kim, T.; Dean, L.M.; Helen, C.M.S. Novel offshore application of photovoltaics in comparison to conventional marine renewable energy technologies. Renew. Energy 2013, 50, 879–888. [Google Scholar]
  5. Lin, Z.; Liu, X. Sustainable development of decommissioned FPSO as a floating solar plant—Case study of the effects of tilt angle on energy efficiency. In Proceedings of the International Conference on Applied Energy, Västerås, Sweden, 12–15 August 2019. [Google Scholar]
  6. DNV. DNV-RP-0584—Design, Development and Operation of Floating Solar Photovoltaic Systems; DNV: Hovik, Norway, 2021. [Google Scholar]
  7. Patil (Desai) Sujay, S.; Wagh, M.M.; Shinde, N.N. A Review on Floating Solar Photovoltaic Power Plants. Int. J. Sci. Eng. Res. 2017, 219, 789–794. [Google Scholar]
  8. Yousuf, H.; Khokhar, M.Q.; Zahid, M.A.; Kim, J.; Kim, Y.K.; Cho, E.C.; Cho, Y.H.; Yi, J. Analytical method for loads determination on floating solar farms in three typical environments. Curr. Photovolt. Res. 2020, 8, 67–78. [Google Scholar]
  9. Choi, H.; Joo, H.; Nam, J.; Kim, K.; Yoon, S. Structural Design for the Development of the floating Type Photovoltaic Energy Generation System. Mater. Sci. Forum 2010, 654, 2803–2806. [Google Scholar] [CrossRef]
  10. Kim, S.; Yoon, S.; Choi, W. Design and Construction of 1 MW Class Floating PV Generation Structural System Using FRP Members. Energies 2017, 10, 1142. [Google Scholar] [CrossRef] [Green Version]
  11. Friel, D.; Karimirad, M.; Whittaker, T.; Doran, W.J.; Howlin, E. A review of floating photovoltaic design concepts and installed variations. In Proceedings of the 4th Int Conference on Offshore Renewable Energy, Glasgow, UK, 30 August 2019. [Google Scholar]
  12. Baderiya, N. Mooring Analysis of a Novel FSPV Plant in Offshore Environment; Liège University: Liege, Belgique, 2020. [Google Scholar]
  13. Ikhennicheu, M.; Danglade, B.; Pascal, R.; Arramounet, V.; Trebaol, Q.; Gorintin, F. Analytical method for loads determination on floating solar farms in three typical environments. Sol. Energy 2021, 219, 34–41. [Google Scholar] [CrossRef]
  14. DNV. Wadam User Manual; DNV: Hovik, Norway, 2022. [Google Scholar]
  15. DNV. Wasim User Manual; DNV: Hovik, Norway, 2022. [Google Scholar]
  16. Newman, J. Marine Hydrodynamics; The MIT Press: Cambridge, MA, USA, 1977. [Google Scholar]
  17. Vada, T.; Pan, Z. On the handling of moonpool resonances by green’s function methods. In Proceedings of the ASME 2018 37th International Conference on Ocean, Offshore and Arctic Engineering, Madrid, Spain, 17–22 June 2018. [Google Scholar]
  18. Buchner, B.; Dijk, A.; Wilde, J. Numerical Multiple-Body Simulations of Side-by-Side Mooring to an FPSO. In Proceedings of the Eleventh International Offshore and Polar Engineering Conference, Stavanger, Norway, 17–22 June 2001. [Google Scholar]
  19. Chen, X.; Duan, W. Multi-domain Boundary Element Method with Dissipation. J. Marine Sci. Appl. 2012, 11, 18–23. [Google Scholar] [CrossRef]
  20. Markeng, K.; Vada, T.; Pan, Z.Y. Investigation of free surface damping models with applications to gap resonance problems. In Proceedings of the ASME 2017 36th International Conference on Ocean, Offshore and Arctic Engineering, Trondheim, Norway, 25–30 June 2017. [Google Scholar]
  21. Zhao, W.; Pan, Z.; Lin, F.; Li, B.; Taylor, P.H.; Efthymiou, M. Estimation of gap resonance relevant to side-by-side offloading. Ocean. Eng. 2021, 219, 34–41. [Google Scholar] [CrossRef]
Figure 1. Share of primary energy [2].
Jmse 11 01491 g001
Figure 2. Type of FPV [6].
Jmse 11 01491 g002
Figure 3. Illustration and main parameters of a single module.
Jmse 11 01491 g003
Figure 4. FPV system with moorings and buoys.
Jmse 11 01491 g004
Figure 5. Illustration of the gap resonance.
Jmse 11 01491 g005
Figure 6. (a) Panel model; (b) Morison model.
Jmse 11 01491 g006
Figure 7. Comparisons of RAOs between without damping and with critical damping defined (panel + Morison beam model included). (a) is for Roll motion, (b) is for Heave motion.
Jmse 11 01491 g007
Figure 8. Surface elevations under 90° incoming wave.
Jmse 11 01491 g008
Figure 9. Damping surface for single module.
Jmse 11 01491 g009
Figure 10. Comparisons of RAOs between with only critical damping and with additional damping lid. (a) is for Roll motion, (b) is for Heave motion.
Jmse 11 01491 g010
Figure 11. Hydrodynamic model for nonlinear hydrodynamics analysis.
Jmse 11 01491 g011
Figure 12. Roll motion under a regular wave (linear vs. nonlinear).
Jmse 11 01491 g012
Figure 13. Snapshots of dynamic pressure in nonlinear time domain analysis. (a) is viewed from bottom, (b) is viewed from the top of the module.
Jmse 11 01491 g013
Figure 14. Pressure components in nonlinear time domain analysis.
Jmse 11 01491 g014aJmse 11 01491 g014b
Figure 15. Roll motion under a regular wave (nonlinear vs. linear with critical damping).
Jmse 11 01491 g015
Figure 16. Heave motion under regular wave (linear, nonlinear vs. linear with critical damping).
Jmse 11 01491 g016
Figure 17. Heave responses with different combinations of model and critical damping coefficients (left: all analyses; right: analyses (c)–(f)).
Jmse 11 01491 g017
Figure 18. Roll responses with different combinations of model and critical damping coefficients (left: all analyses; right: analyses (c)–(f)).
Jmse 11 01491 g018
Figure 19. Nine-body model for hydrodynamic coupling analysis.
Jmse 11 01491 g019
Figure 20. Heave and roll RAO for 9-body analysis without gap surface damping.
Jmse 11 01491 g020
Figure 21. Damping surface in the gaps.
Jmse 11 01491 g021
Figure 22. Heave and roll RAO with damping surface between modules.
Jmse 11 01491 g022
Figure 23. Simplified system with 9 modules and 4 mooring lines.
Jmse 11 01491 g023
Figure 24. Complete FPV system with 90 modules.
Jmse 11 01491 g024
Figure 25. Mooring line tension under operational environment.
Jmse 11 01491 g025
Figure 26. Environmental loads on one floater.
Jmse 11 01491 g026
Table 1. Main parameters of single module.
ValueUnit
Length12.0m
Width4.4m
Depth0.8m
Pontoon width1.0m
Mass (Total)12,300kg
COG_Z (Total)0.4m
RX (Total)1.73m
RY (Total)3.47m
RZ (Total)3.87m
Table 2. Main parameters of FPV system.
ValueUnit
No. of modules90/
Array layout15 × 6/
No. of buoys4/
Diameter of buoy6m
No. of bridle lines4/
Length of bridle lines27.0m
Water depth300.0m
Table 3. Mooring line properties.
Parameter UnitsValue
Anchor depthm−300
Fairlead depthm0
Horizontal distancem1425.9
Nominal diameterm0.2
Unit line dry weightN/m1000.0
Modulus of elasticityN/m22 × 1010
Line unstretched lengthm1500
Fairlead pretensionN1 × 106
Transvers drag coefficient-1.2
Longitudinal drag coefficient-0.8
Table 4. Directions and periods for RAO calculation.
FirstLastStep
Direction (deg)034515
Period (s)1201
Table 5. Analyses with different models and damping effects.
AnalysisMorison ModelCritical DampingFree Surface Damping
aNANANA
bYESNANA
cYESNAYES
dYESMatrix 1YES
eNAMatrix 2NA
fNAMatrix 2YES
Table 6. Environmental conditions.
EnvironmentDirectionParameters
Wave90 degJonswap SpectrumHs = 0.5 mTp = 6 sGamma = 3.3
Wind90 degNPD Windv = 25 m/sProfile exponent = 0.11Friction = 0.002
Current90 degRegular currentv = 0.75m/s
Disclaimer/Publisher’s Note: The statements, opinions and data contained in all publications are solely those of the individual author(s) and contributor(s) and not of MDPI and/or the editor(s). MDPI and/or the editor(s) disclaim responsibility for any injury to people or property resulting from any ideas, methods, instructions or products referred to in the content.

