Article

Coastal Environments: Mine Discharges and Infringements on Indigenous Peoples’ Rights

1
Great Lakes Research Center and Department of Biological Sciences, Michigan Technological University, Houghton, MI 49931, USA
2
Keweenaw Bay Indian Community (KBIC) Natural Resources Department, Baraga, MI 49908, USA
3
Department of Social Sciences, Michigan Technological University, Houghton, MI 49931, USA
4
Great Lakes Research Center and Department of Civil and Environmental Engineering, Michigan Technological University, Houghton, MI 49931, USA
*
Author to whom correspondence should be addressed.
J. Mar. Sci. Eng. 2023, 11(7), 1447; https://doi.org/10.3390/jmse11071447
Submission received: 11 March 2023 / Revised: 9 May 2023 / Accepted: 11 May 2023 / Published: 19 July 2023
(This article belongs to the Special Issue Remote Sensing for Coastal Management)

Abstract

:
Over a century ago, copper mills on the Keweenaw Peninsula of Lake Superior sluiced 64 million metric tonnes (MMT) of tailings into coastal waters, creating a metal-rich “halo”. Here we show that relatively small discharges can spread widely in time and space. Mass Mill (2.9 MMT) dumping into Lake Superior also illustrates the complexity of interactions with Indigenous Peoples. A combination of aerial photos, LiDAR, and a microscope technique for distinguishing end-member particles traces the migration of tailings. The clay fraction spread rapidly across Keweenaw Bay and curled into terminal L’Anse Bay, within tribal Reservation boundaries. The coarse stamp sand fraction moved more slowly southward as a beach sand deposit onto Sand Point, a sacred burial ground. Despite the partial recovery of northern beaches and southern sediments, concerns continue about chemical contamination. Mass Mill provides an excellent example of Indigenous Peoples’ territorial and resource issues with mining. A major difficulty with “legacy” discharges is that there are no longer any “responsible parties”. Initially, federal and state officials were fearful that treaty rights might warrant reparations. Recently, multiple agency/state funding programs supported international (IJC) award-winning restoration efforts by tribal members, illustrating how Indigenous Peoples and governments can work together to safeguard treaty rights.

1. Introduction

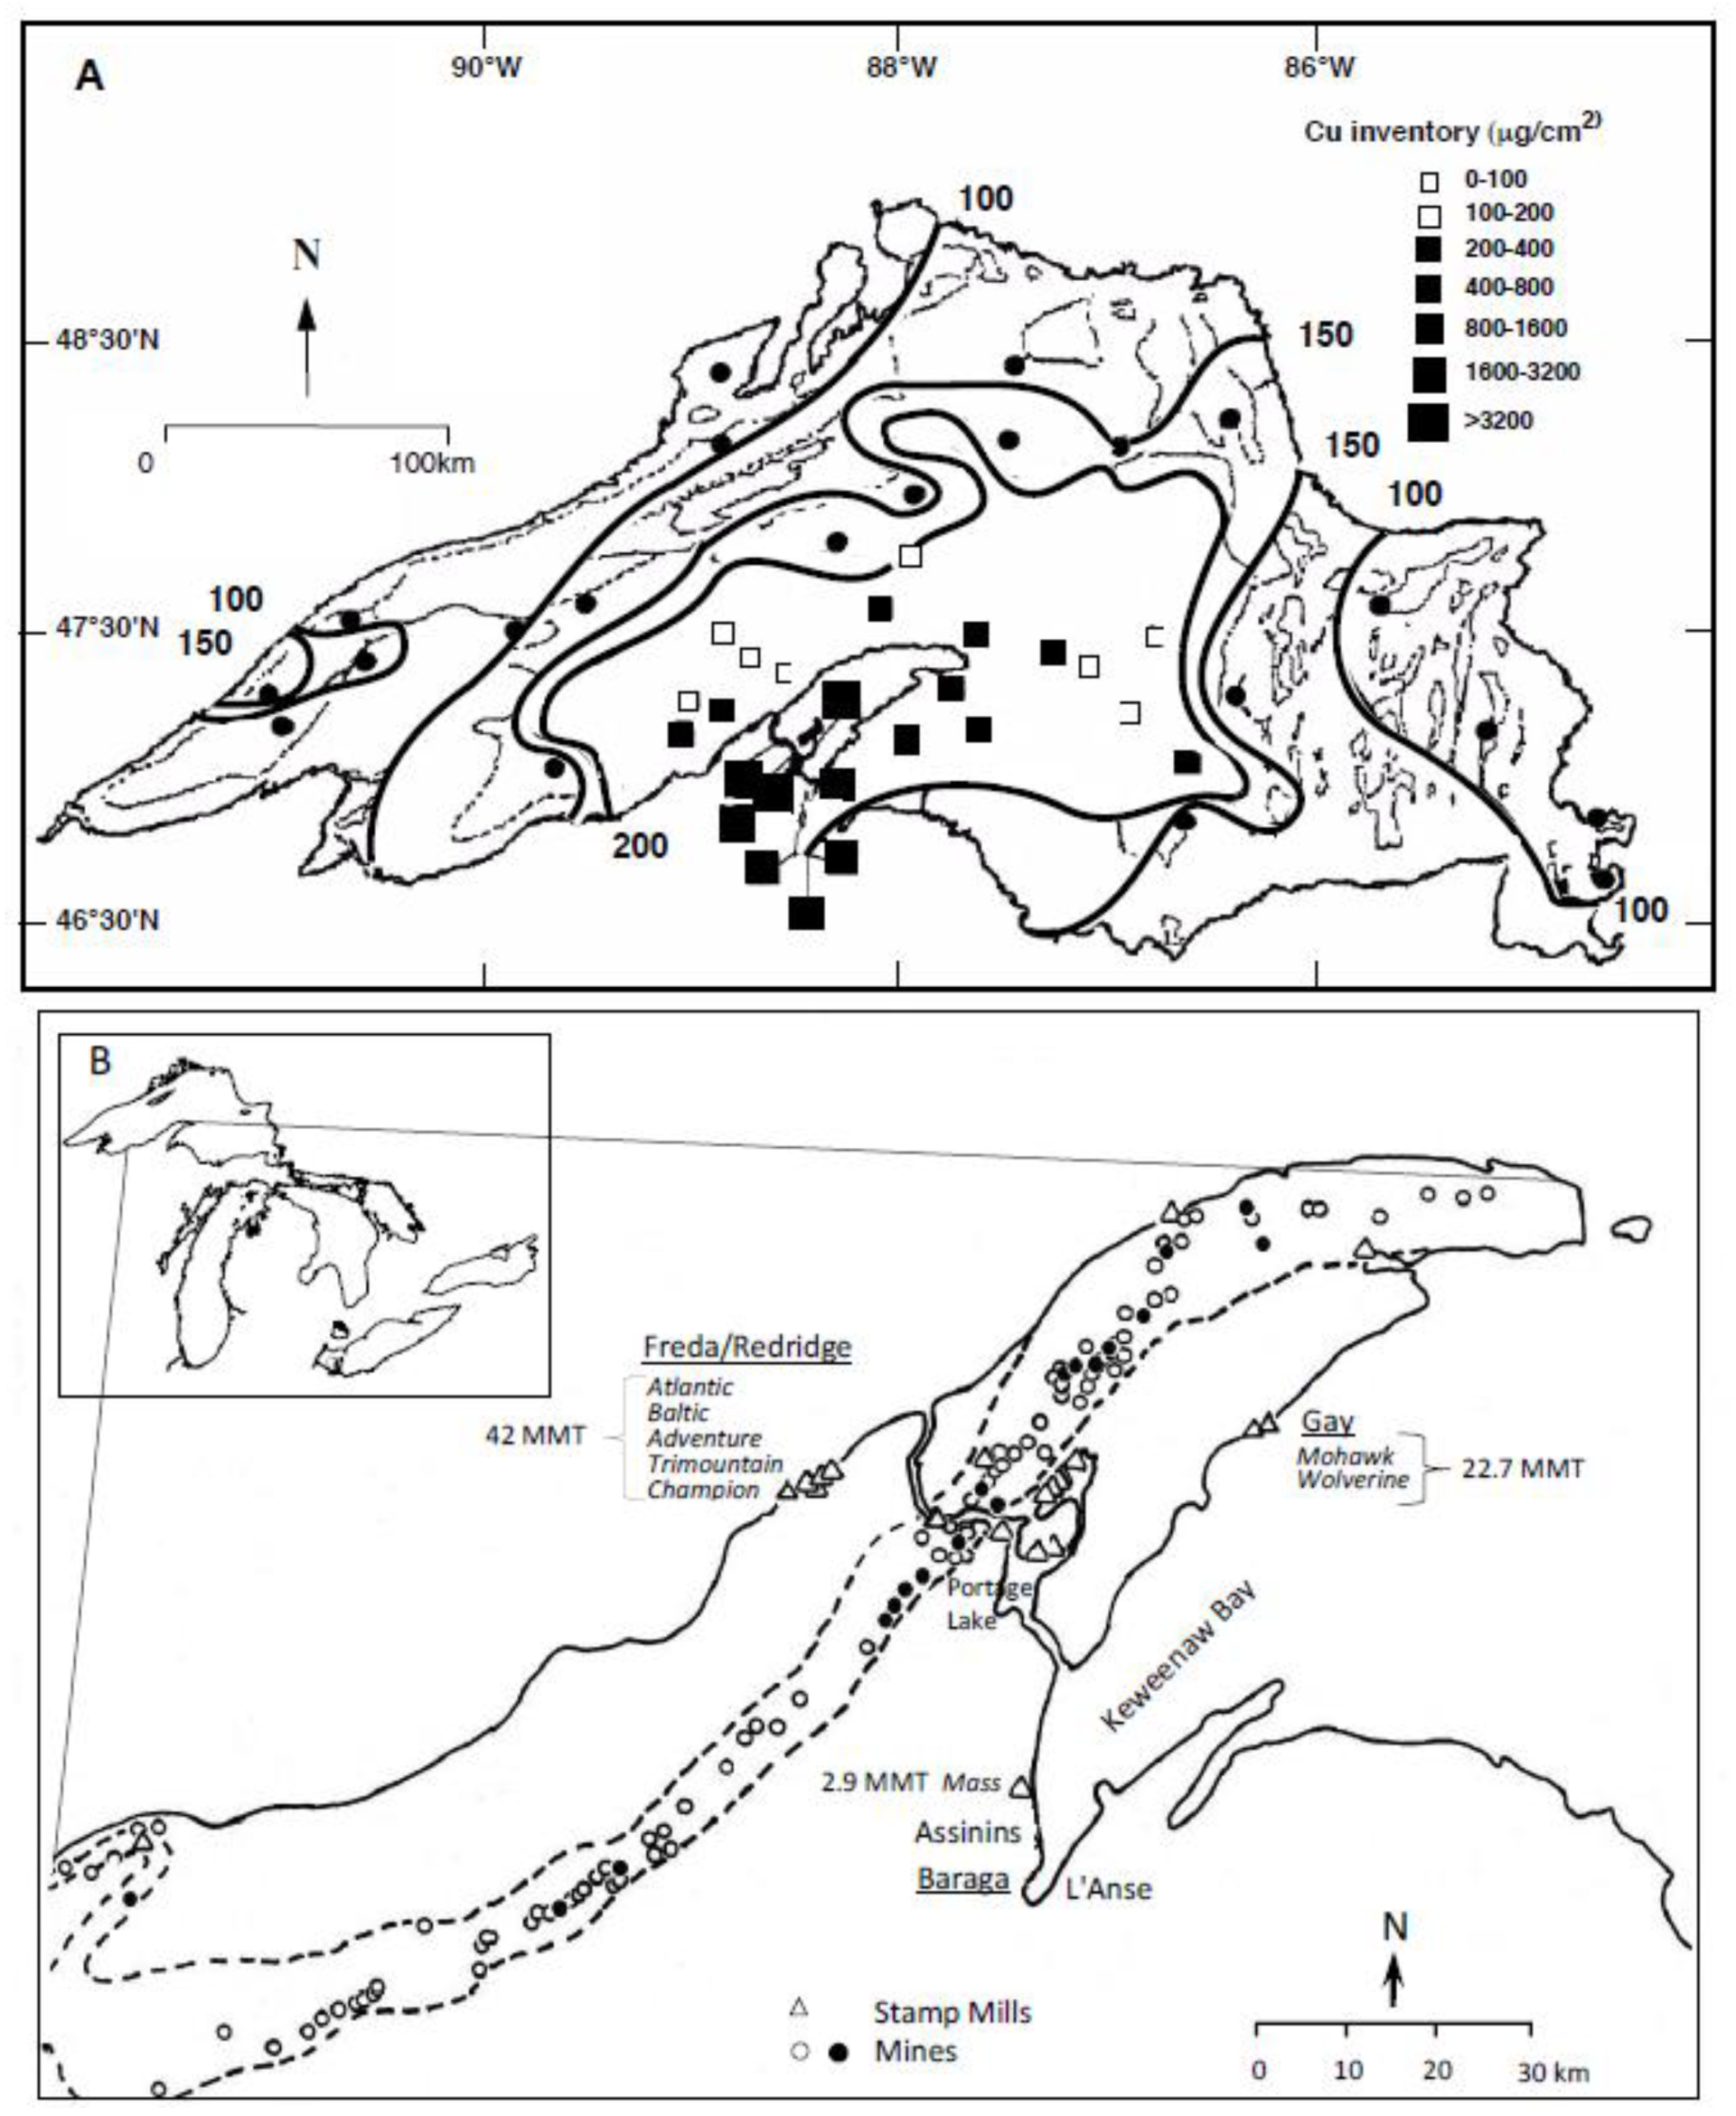
The Keweenaw Peninsula of Michigan juts into Lake Superior (Figure 1A) and was once one of the great metal mining regions of North America, contributing to the Industrial Revolution. Between 1850 and 1929, the district was the second-largest producer of copper in the world [1,2]. Native copper in the Portage Lake Volcanic Series came from two principal kinds of ore: basalt lava flows (amygdule deposits) and inter-bedded sediments (conglomerates) associated with a midcontinental rift [3,4]. Both ores were crushed with early gravity and later giant steam-driven stamps to release native copper and silver, producing “stamp sand” tailings [5]. During the native copper and silver mining interval (1844–1968), mines, mill sites, and stamp sand piles dotted the regional landscape (Figure 1B). More than 140 mines worked the central deposits, and >40 mills released stamp sands [6]. Smelters produced 4.4 million metric tonnes of copper, whereas stamp mills sluiced around 360 million metric tonnes (MMT) of copper-rich tailings into rivers and waterways, including 64 MMT directly along Lake Superior shorelines [6,7,8,9].
To place the Keweenaw copper mining era into perspective with international mining efforts, Table 1 includes examples of large coastal tailing discharges, plus notes on interactions with Indigenous Peoples. The international list includes discharges that range from 4 to 1300 million metric tonnes, with many copper operations. The series could have been much longer, as coastal mine tailing inputs, either from direct sluicing or from failed tailing dams, present a genuinely global problem [10]. Mounting concern about discharge of mine tailings into coastal environments prompted the report “International Assessment of Marine and Riverine Disposal of Mine Tailings” by Vogt [11] for the UNEP Global Programme of Action for the Marine Environment. However, a remarkable feature of another compendium, “The Guiliver File” (1992), a 900-page book that lists mining projects and companies around the world, is that so many of the operations involve Indigenous Peoples. According to the United Nations Department of Economic and Social Affairs (Indigenous Peoples): “Even where Indigenous Peoples have the legal title deeds to their lands, these lands are often leased out by the state as mining or logging concessions without consultation of Indigenous Peoples, let alone their free and prior informed consent”.
As a local example on the Keweenaw Peninsula, Mass Mill discharges involve numerous jurisdictional boundary issues with federal/state priorities and Indigenous Peoples that persist to this day. For example, at the very beginning, Keweenaw mining efforts were aided by discovery of hundreds to thousands of shallow mining pits on the Keweenaw Peninsula and Isle Royale. This observation is relevant for the Mass Mill and Mass Mine complex, as the term “Mass” came from the early large masses of copper found in the pits that became the mine locations. The geographically widespread Ojibwe/Chippewa are known historically for their birchbark canoes and scrolls, trade in copper, cultivation of wild rice, and production of maple syrup. Their use of copper across the continent included a large trading network that took place for thousands of years, at least as far back as the Hopewell Culture, 2000 years ago (Wikipedia; Hopewell Culture National Historical Park). The 1842 La Pointe Treaty between the United States and the Ojibwe Nation ceded Keweenaw Ojibwe territory to the federal government but retained “homeland” status (Supplementary Materials Figure S1). Later court action guaranteed hunting, fishing, and “gathering” rights for the tribe, without specifying what was included in the terms. Shortly after the treaty was signed, the federal government set up operations at Copper Harbor to process industrial claims for copper mining across the Peninsula, ushering in the Keweenaw “Copper Land Rush”. Tribes were not included in the process. Some international examples of infringements are listed in Table 1. Indigenous Peoples’ rights and specific Ojibwe historical involvements will be revisited in the Discussion. The Mass Mill history serves to stress how tailings spread widely over both time and space, even as the source (Mass Mill) disappeared from the landscape. Because of the relatively small discharge, the coastal toxic stamp sands were partially diluted by some natural processes but remain a concern in several areas. The major legal difficulty with mitigation of such old tailing releases is that there are no longer existing “responsible parties”.
In the Keweenaw Peninsula, the mine tailings known locally as “stamp sands” were discharged into streams, lakes, waterways, and along shorelines. The original releases from shoreline stamp mills contributed to a copper “halo” around the Keweenaw Peninsula (Figure 1A), one that extends out 10 to 90 km into Lake Superior [6,7,8,9,12,13,14]. In sediment cores, anthropogenic inventories with mining-derived copper are three- to ten-fold greater than inventories found generally in the top 20 cm of nonimpacted Lake Superior sediments [12,13]. Moreover, stamp sands contain high levels of copper that are highly toxic to fish and invertebrates. Here we look at one of the coastal mills (Mass Mill, Figure 1B) to illustrate the long temporal and large spatial spread of tailing effects even from this relatively small operation.
Mass Mill: Cycle Of A Mining Town—The Mass Mill operations were typical of the “boom and bust” cycle of mining on the Keweenaw Peninsula. The Mass Consolidated Mining Company originated in 1899, combining several older mining properties (Ridge, Mass, Ogima, Merrimac, and Hazard) purchased by a group of investors from Boston [5,15,16,
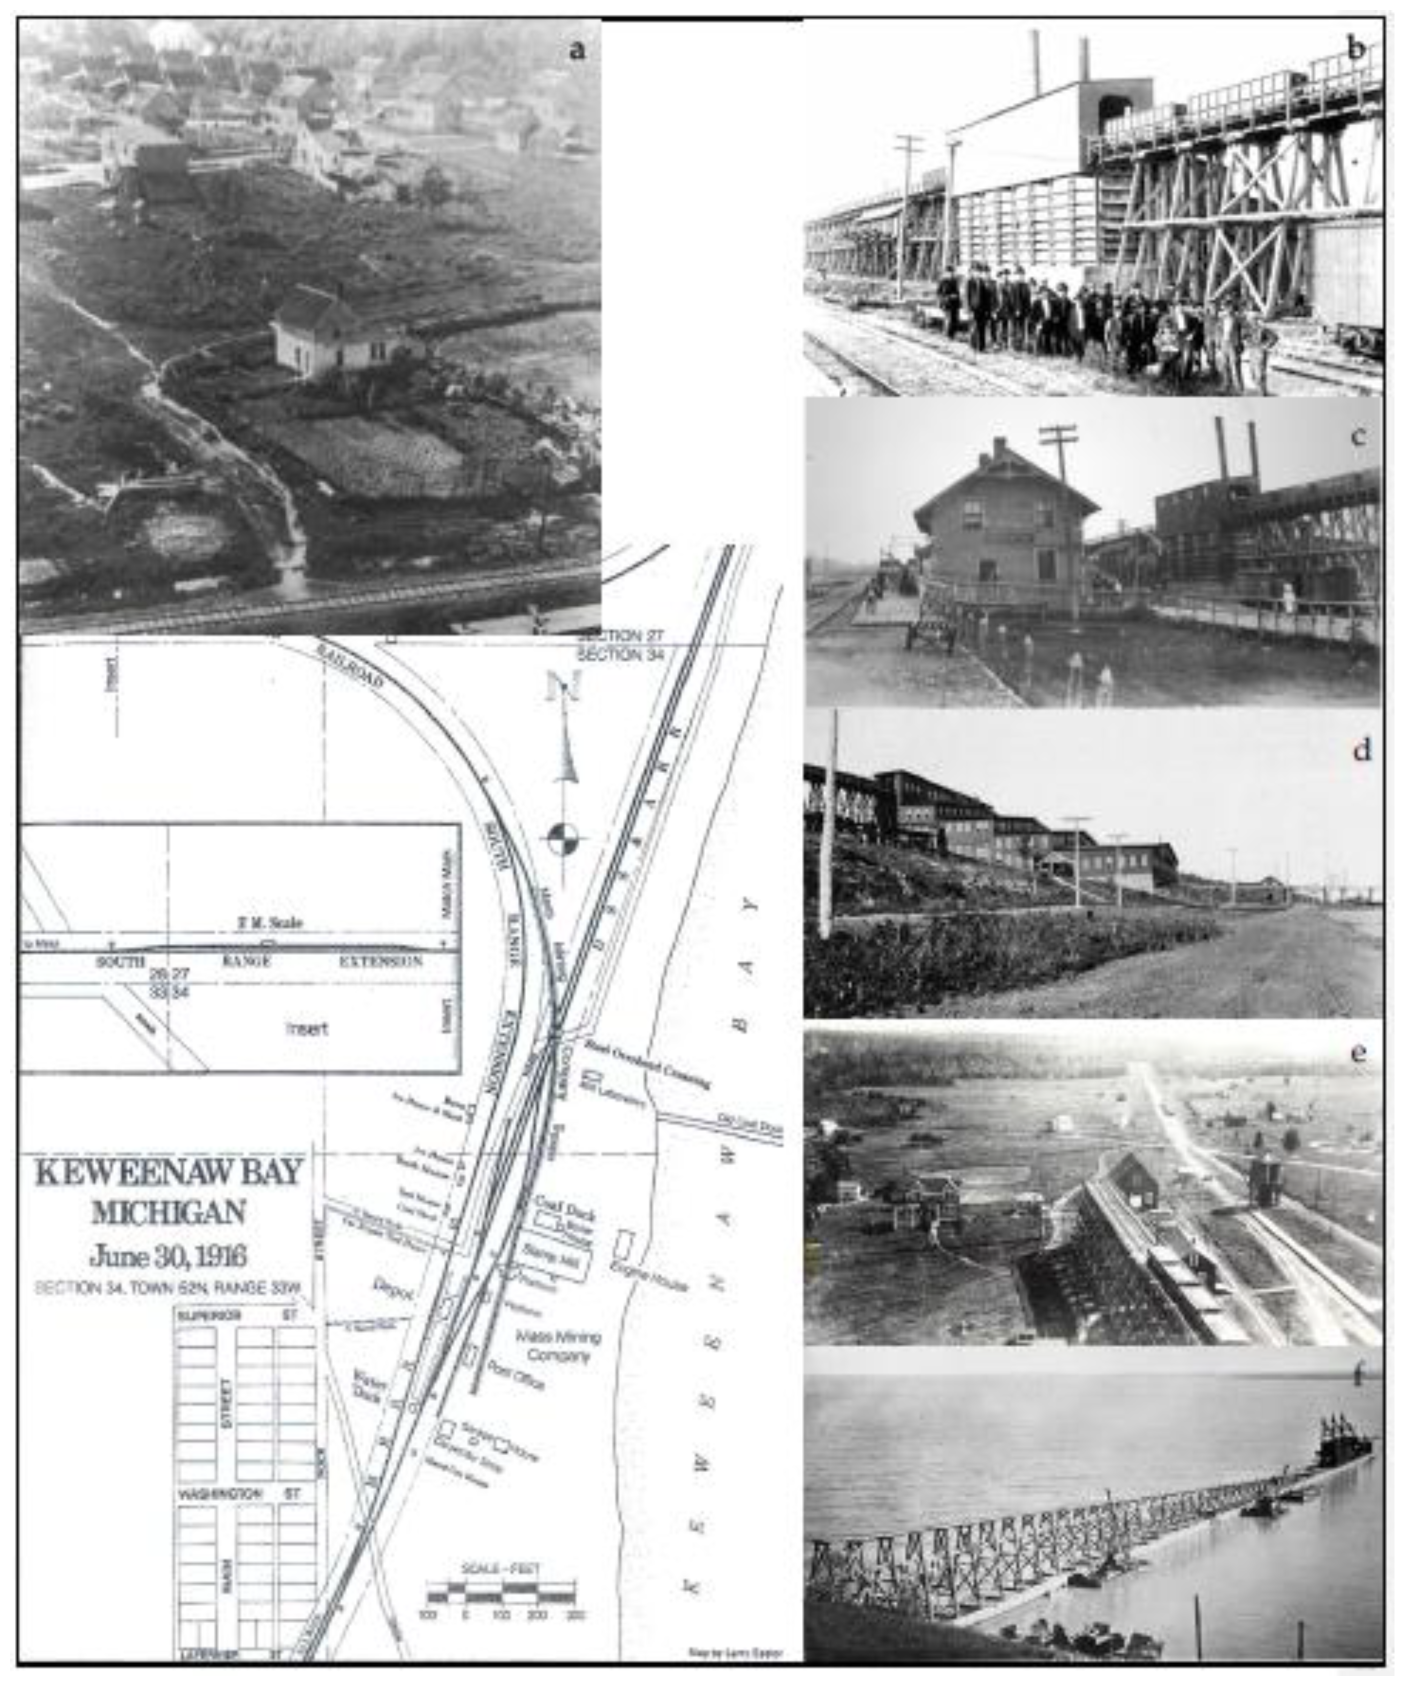
17]. The old mines were clustered together west of a town site known as Mass City. The Mass Mill was built in 1900–1902, and was located 55 km northeast of Mass City and 9 km north of Baraga, Michigan. Keweenaw Bay offered an inexhaustible supply of water from Lake Superior, essential for milling operations and a “convenient” place to dump tailings. A small town, named the “Community of Keweenaw Bay”, was constructed west of the Mill and Keweenaw Bay Depot (Figure 2a–c). Mass Consolidated erected 30–40 company houses for employees, a hotel, four saloons, a boarding house, a grocery store, and a general store. By 1904, the population grew to a peak of 200 [17].
Copper ore came from multiple lodes (Evergreen, Knowlton, and Ogima; i.e., in seven amygdaloid beds [3]) of the Portage Lake Volcanics Series (basalt lava flows). Two railways, the Duluth, South Shore & Atlantic Railway (DSS&A) and the Mineral Range Railroad South Range Extension (the latter constructed to convey stamp rock to the mill from Mass City mines), intersected at the town site (Figure 2). Past the depot, railroad lines led southward to Baraga and northward to Portage Lake, while a coal dock (“Old Coal Dock”) extended out into the waters of Lake Superior (Figure 2e,f).
Starting on 3 January 1901, the South Range railroad made daily trips from Mass City to the mill [15,16,17]. Arriving from the north, the train reached the stamp mill by crossing over the DSS&A main line onto a 1361 m long wooden trestle (Figure 2b). Rail cars dropped ore into bins (Figure 2b,d). Inside the mill, large steam-driven stamps crushed the ore. The crushed rock then moved through a series of jigs and tables, which separated copper-laden particles from lighter particles by specific gravity. Jigging involved flowing a stream of liquid-suspended particles over a screen while subjecting the screen to a vertical hydraulic pulsation. Dense particles would separate from less dense particles [5]. A laundry sluice directed tailings down to the bay [17]. Ashes from fireboxes were first dumped into an iron chute, then washed via a launder into the lake [17]. Floor space in the stamp mill was initially modest, ca. 27 m by 64 m. One stamp ran until 1907, then two afterward. Mass Consolidated built a 22-foot extension onto the mill in 1905 to house additional jigs and concentrating tables. More details on yearly mining and milling operations can be found in company reports (Michigan Tech University Archives), period Engineering & Mining Journal accounts, a book by Benedict (1955), and a chapter in the Sand Point Report by Schneider (2023).
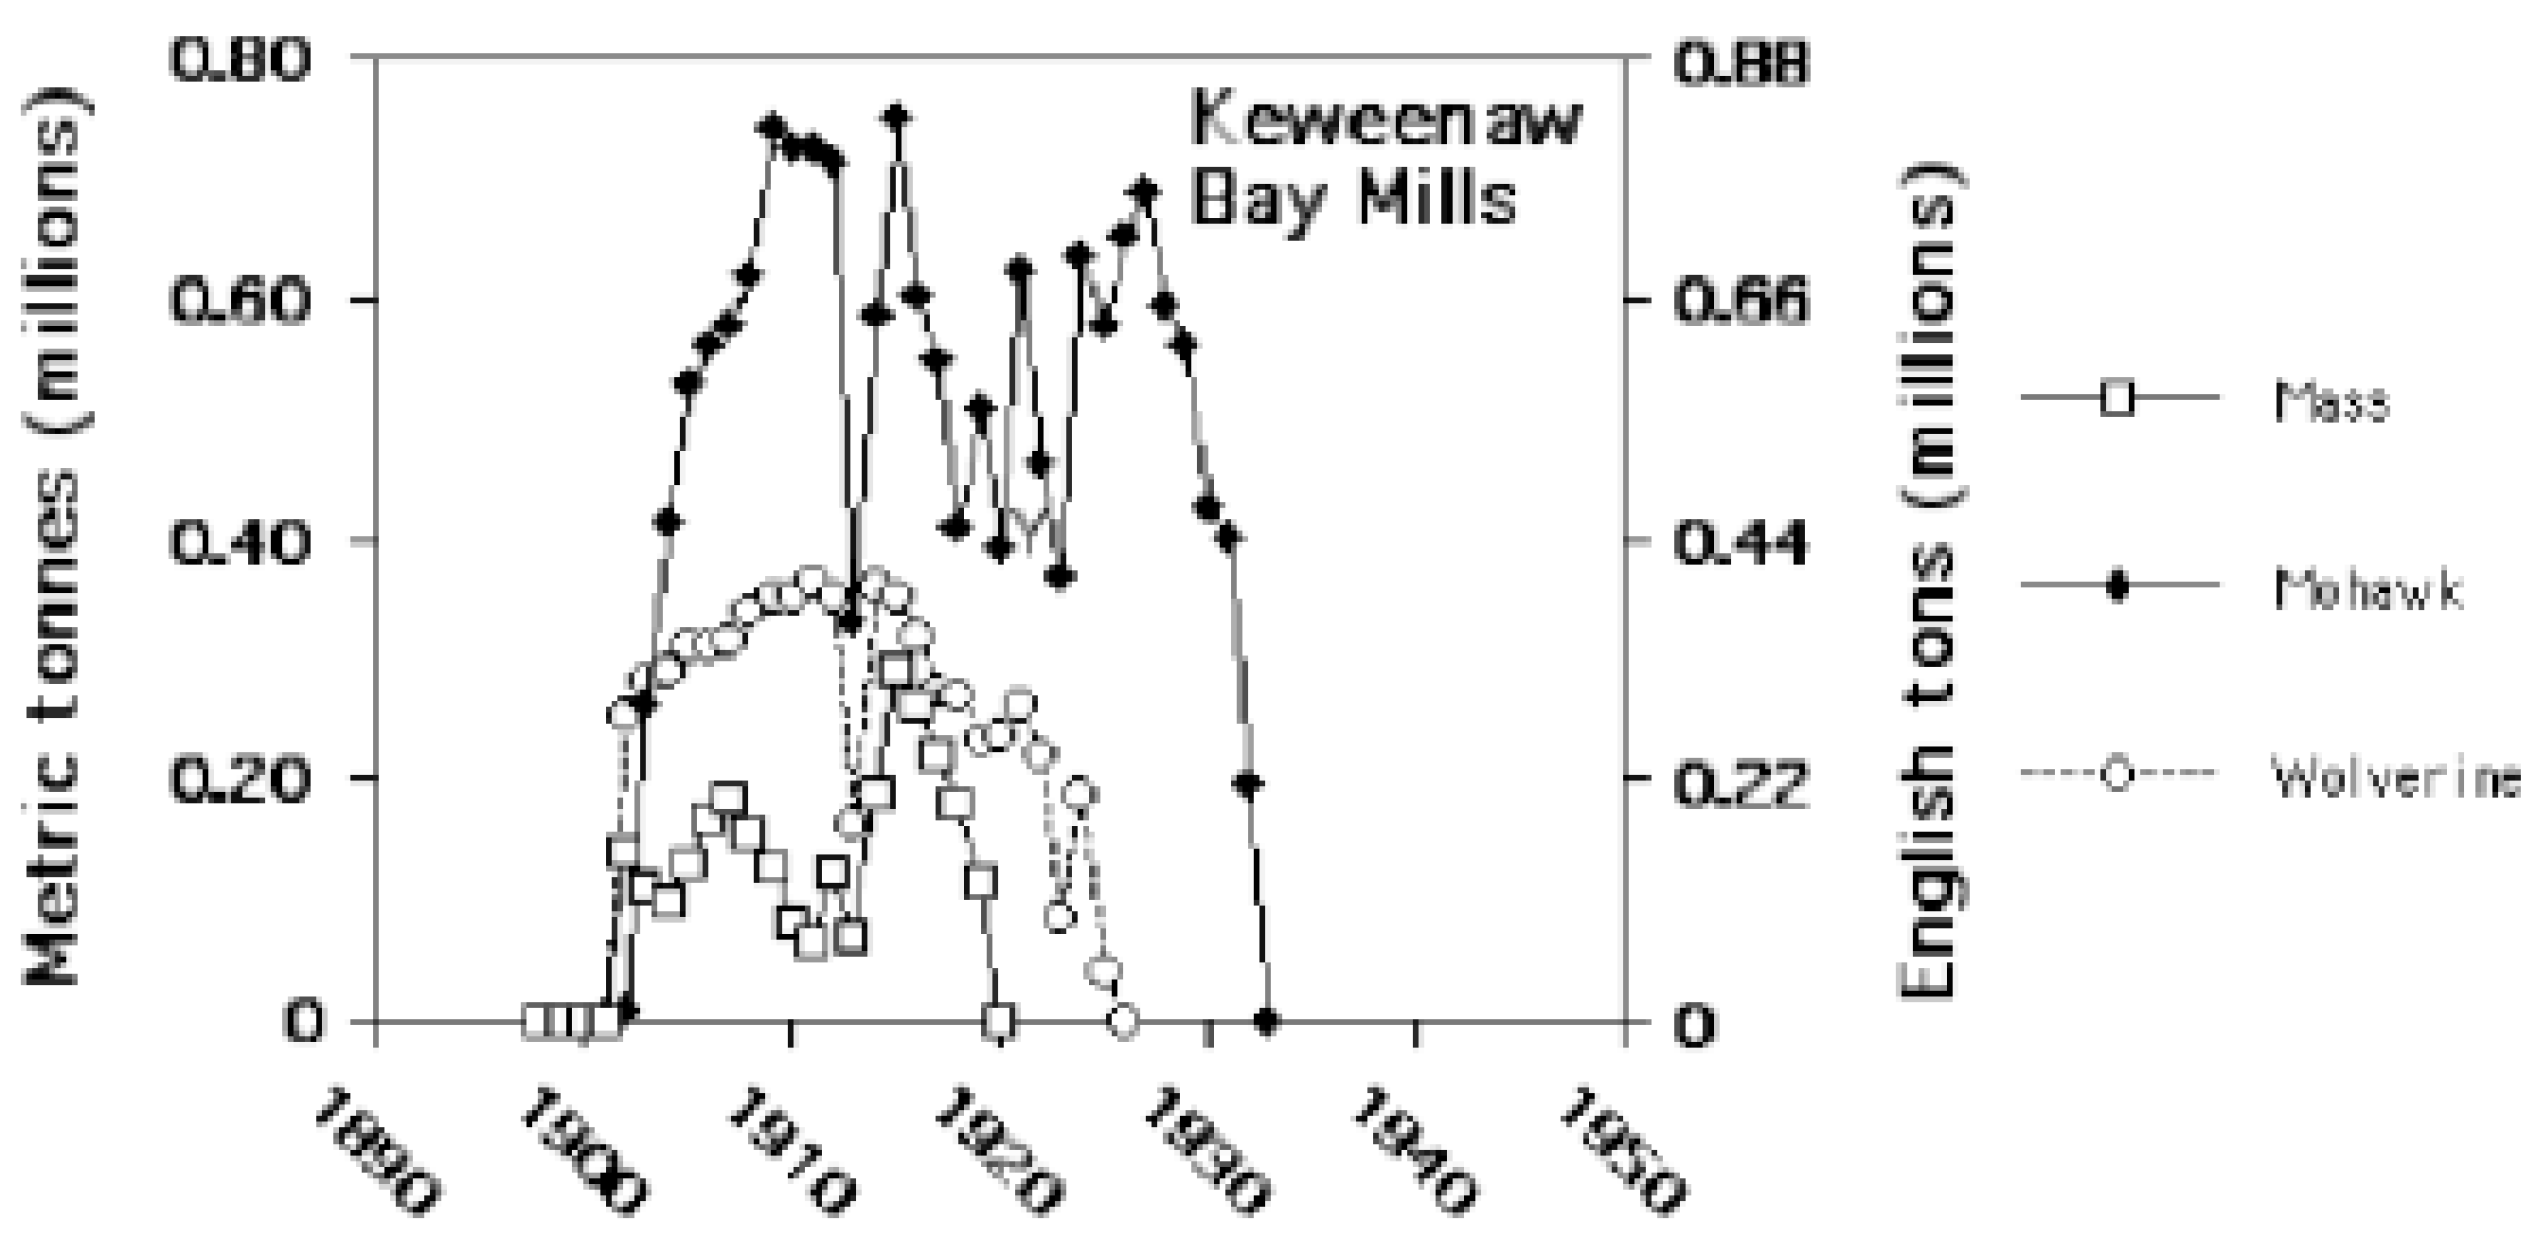
Compared to international operations and other mills along the Keweenaw Peninsula shoreline (Table 1), the amounts released during discharge (1902–1919) were relatively small. Company reports for the Mass Consolidated Mining Company record 2,709,000 tonnes (ca. 2.7 MMT) of ore between 1902 and 1919 (Figure 3), whereas custom work for the Michigan Mill (1902–1906) added another 354 thousand tonnes from the Calico, Branch, and Minesota [sic] lodes, giving a grand total of around 3.1 MMT. Releases occurred in two peaks, interrupted by a district-wide copper miners’ strike in 1913 [17] and trestle repairs. Soon after the strike, the company shipped 1143 tonnes of rock to the mill per day, reaching a maximum of 1800 tonnes of ore hoisted per day as World War I began. Copper concentrate was sent northward to the Quincy Smelter at Ripley or to the Coles Creek Smelter at Houghton, both on the shores of Portage Lake [15]. The Michigan Mine utilized one of the stamp heads at the Mass Mill to process rock (1902–1906), while it constructed what became a nonoperational Mill north of the Mass Mill (1906). By 1911, stamp sand accumulating around the Old Coal Dock was interfering with the water intake crib, and became a nuisance. Mass Consolidated had its peak copper production in 1916. Monthly production from 1916 through 1918 remained between 17,200 to 20,000 tonnes of stamp rock, yielding an average grade of 7.45 kg of copper per tonne of ore. Nearly all the rock mass, at least 2.92 million tonnes of stamp sands, left the mill as tailings deposited into Keweenaw Bay.
The Mass Mill operated until after WWI, when the cost of production exceeded the price of copper [16,17]. The mill closed down on 2 December 1919, and was dismantled in 1931. The post office remained until 1987. The original town site of the mill is now hardly recognizable, one of many “ghost towns” on the peninsula. Only the remodeled Assay (Laboratory) House and remnants of the Old Coal Dock cribbing mark the site. However, a long-term legacy of stamp sand migration, elevated Cu and metal contamination persists along the shoreline and in lake sediments, which we will now describe. A serious issue with modern-day mitigation is that with the passage of time, there are no longer any “responsible parties” to share the costs of clean-up.
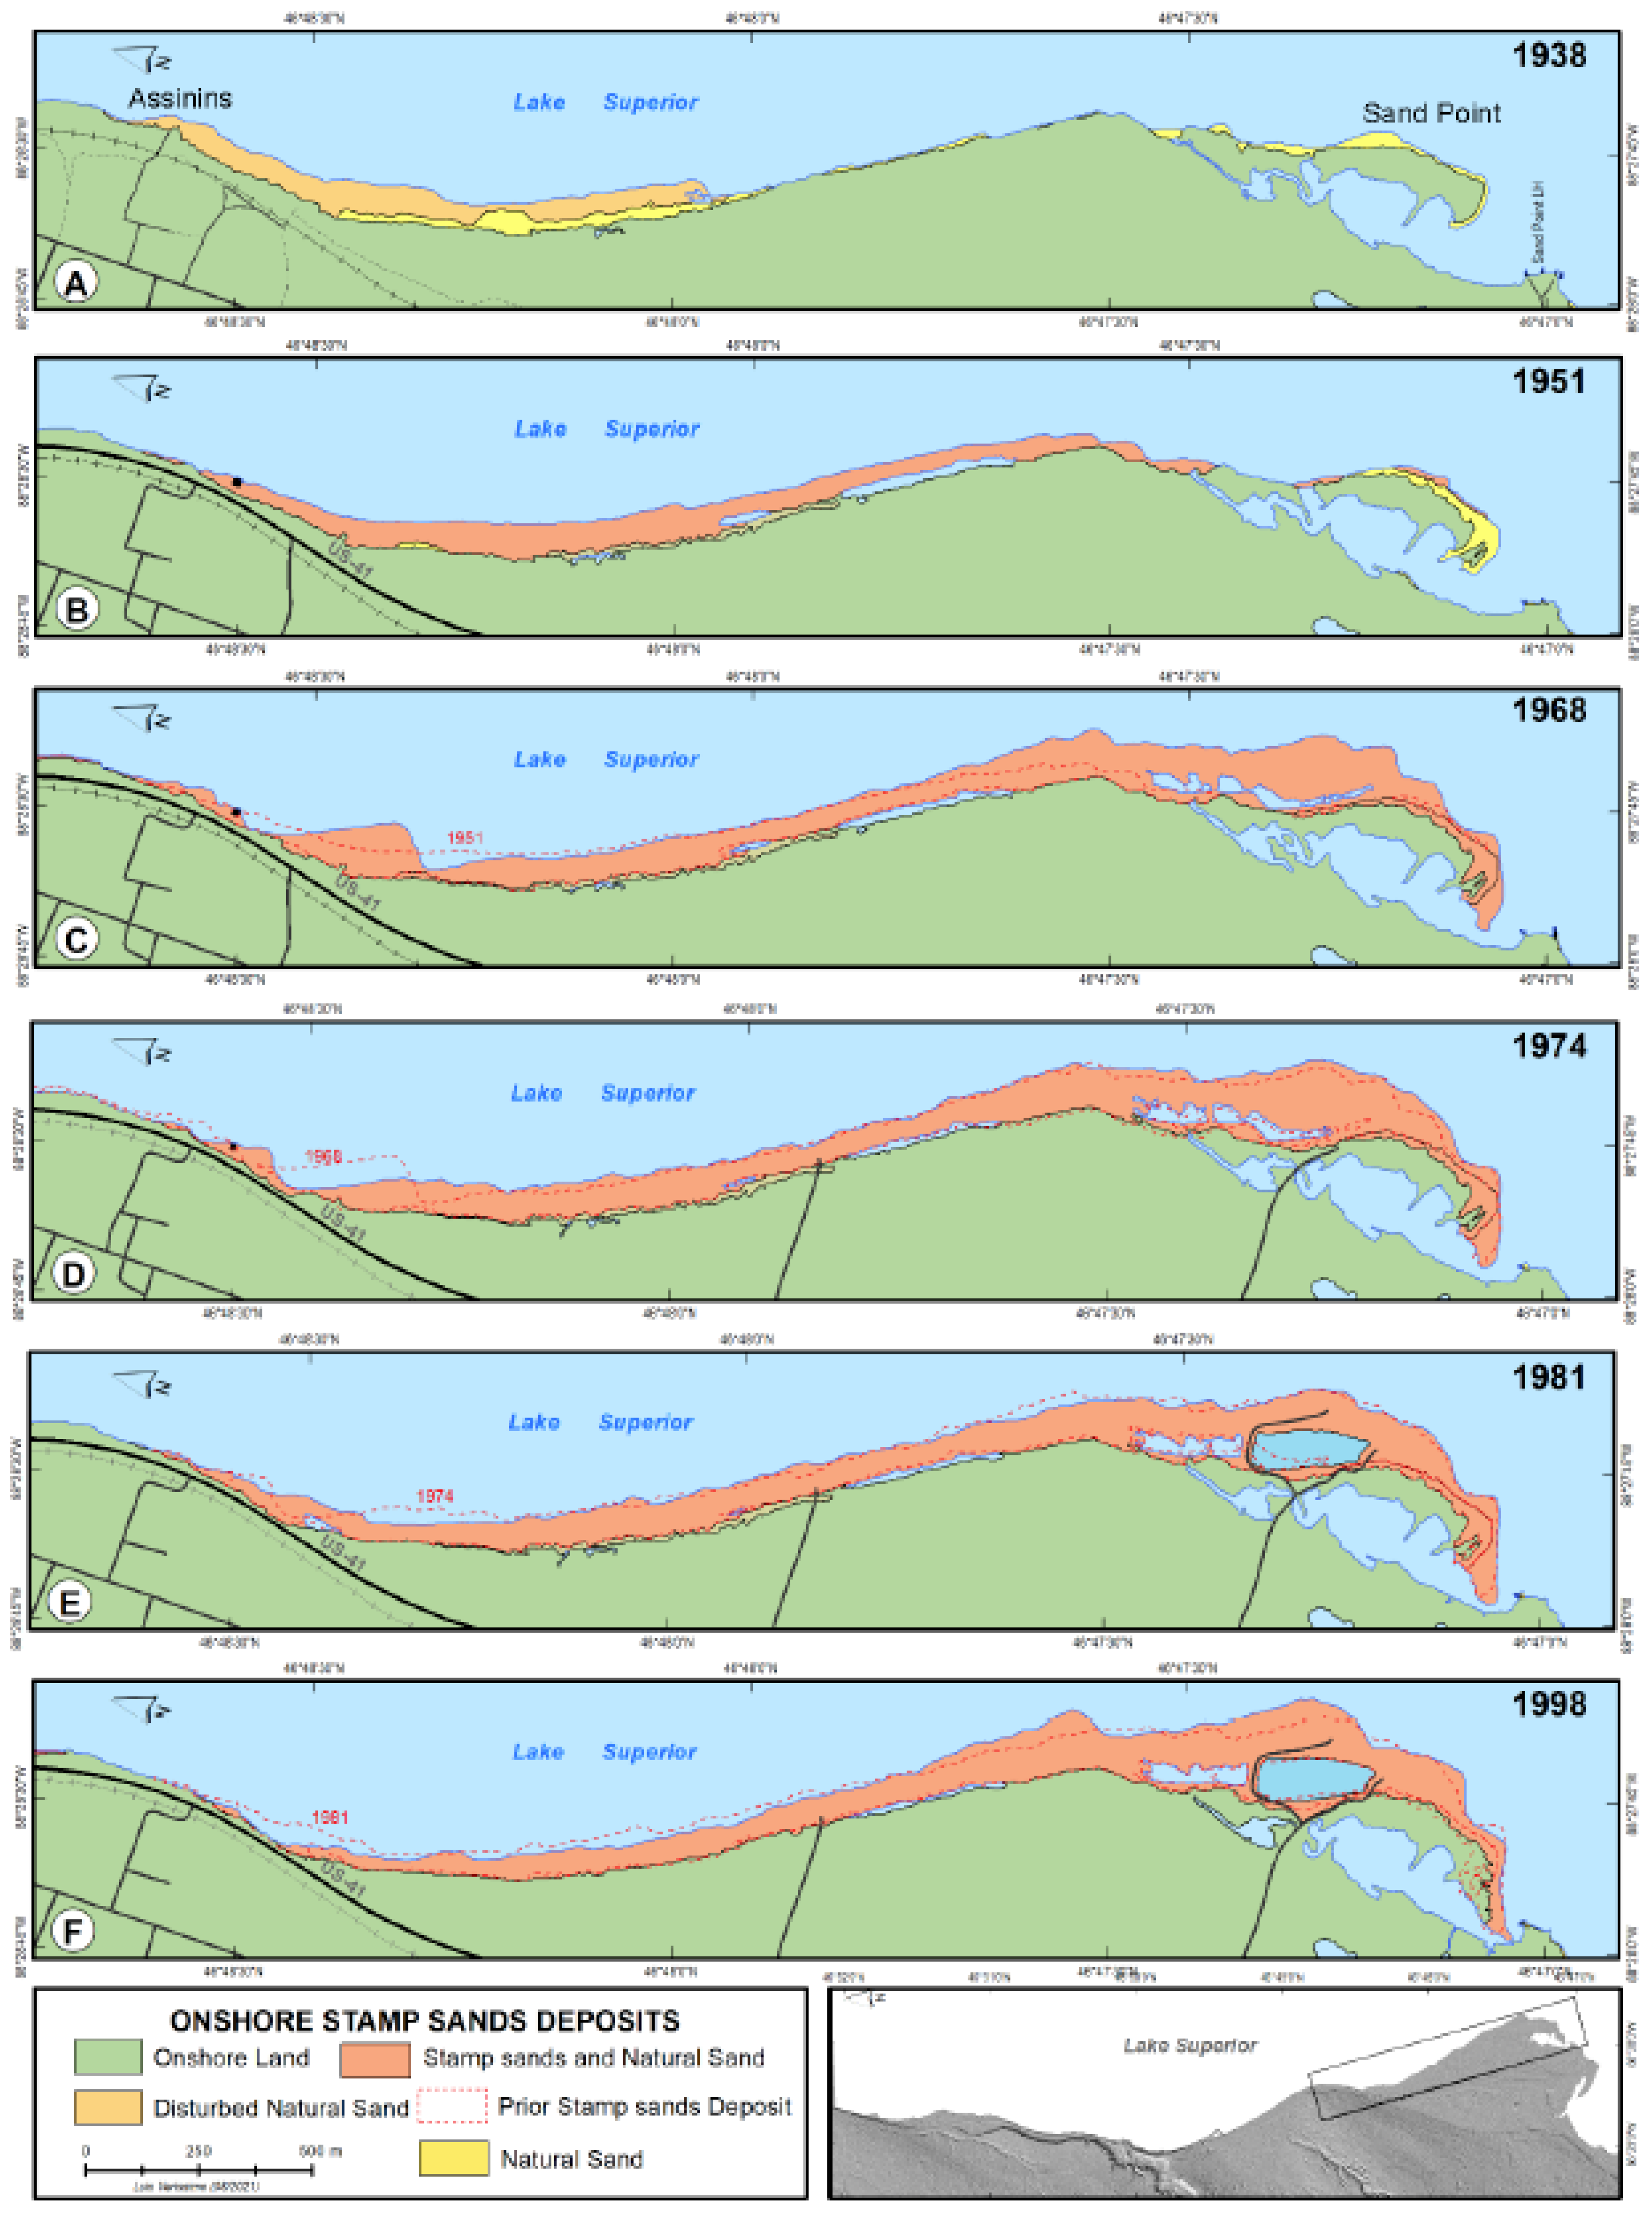
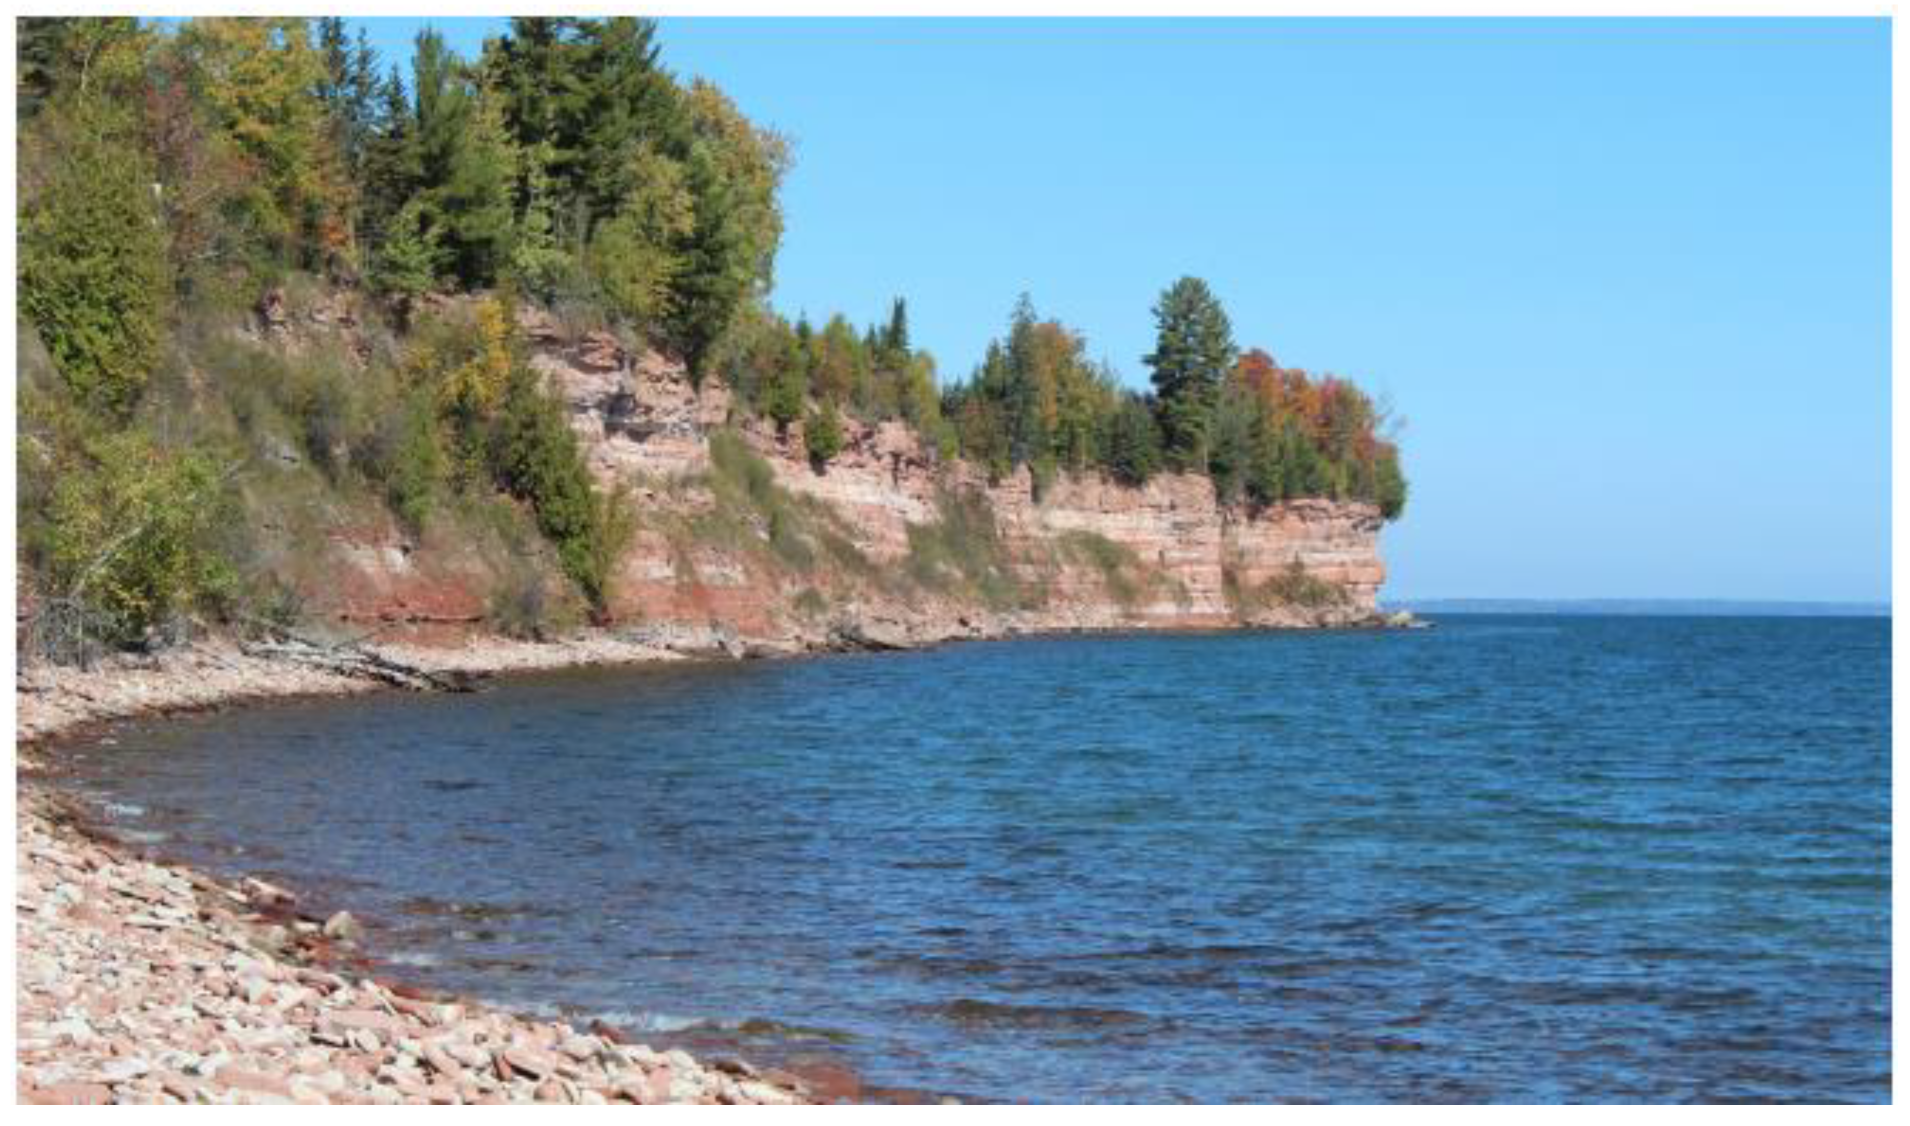
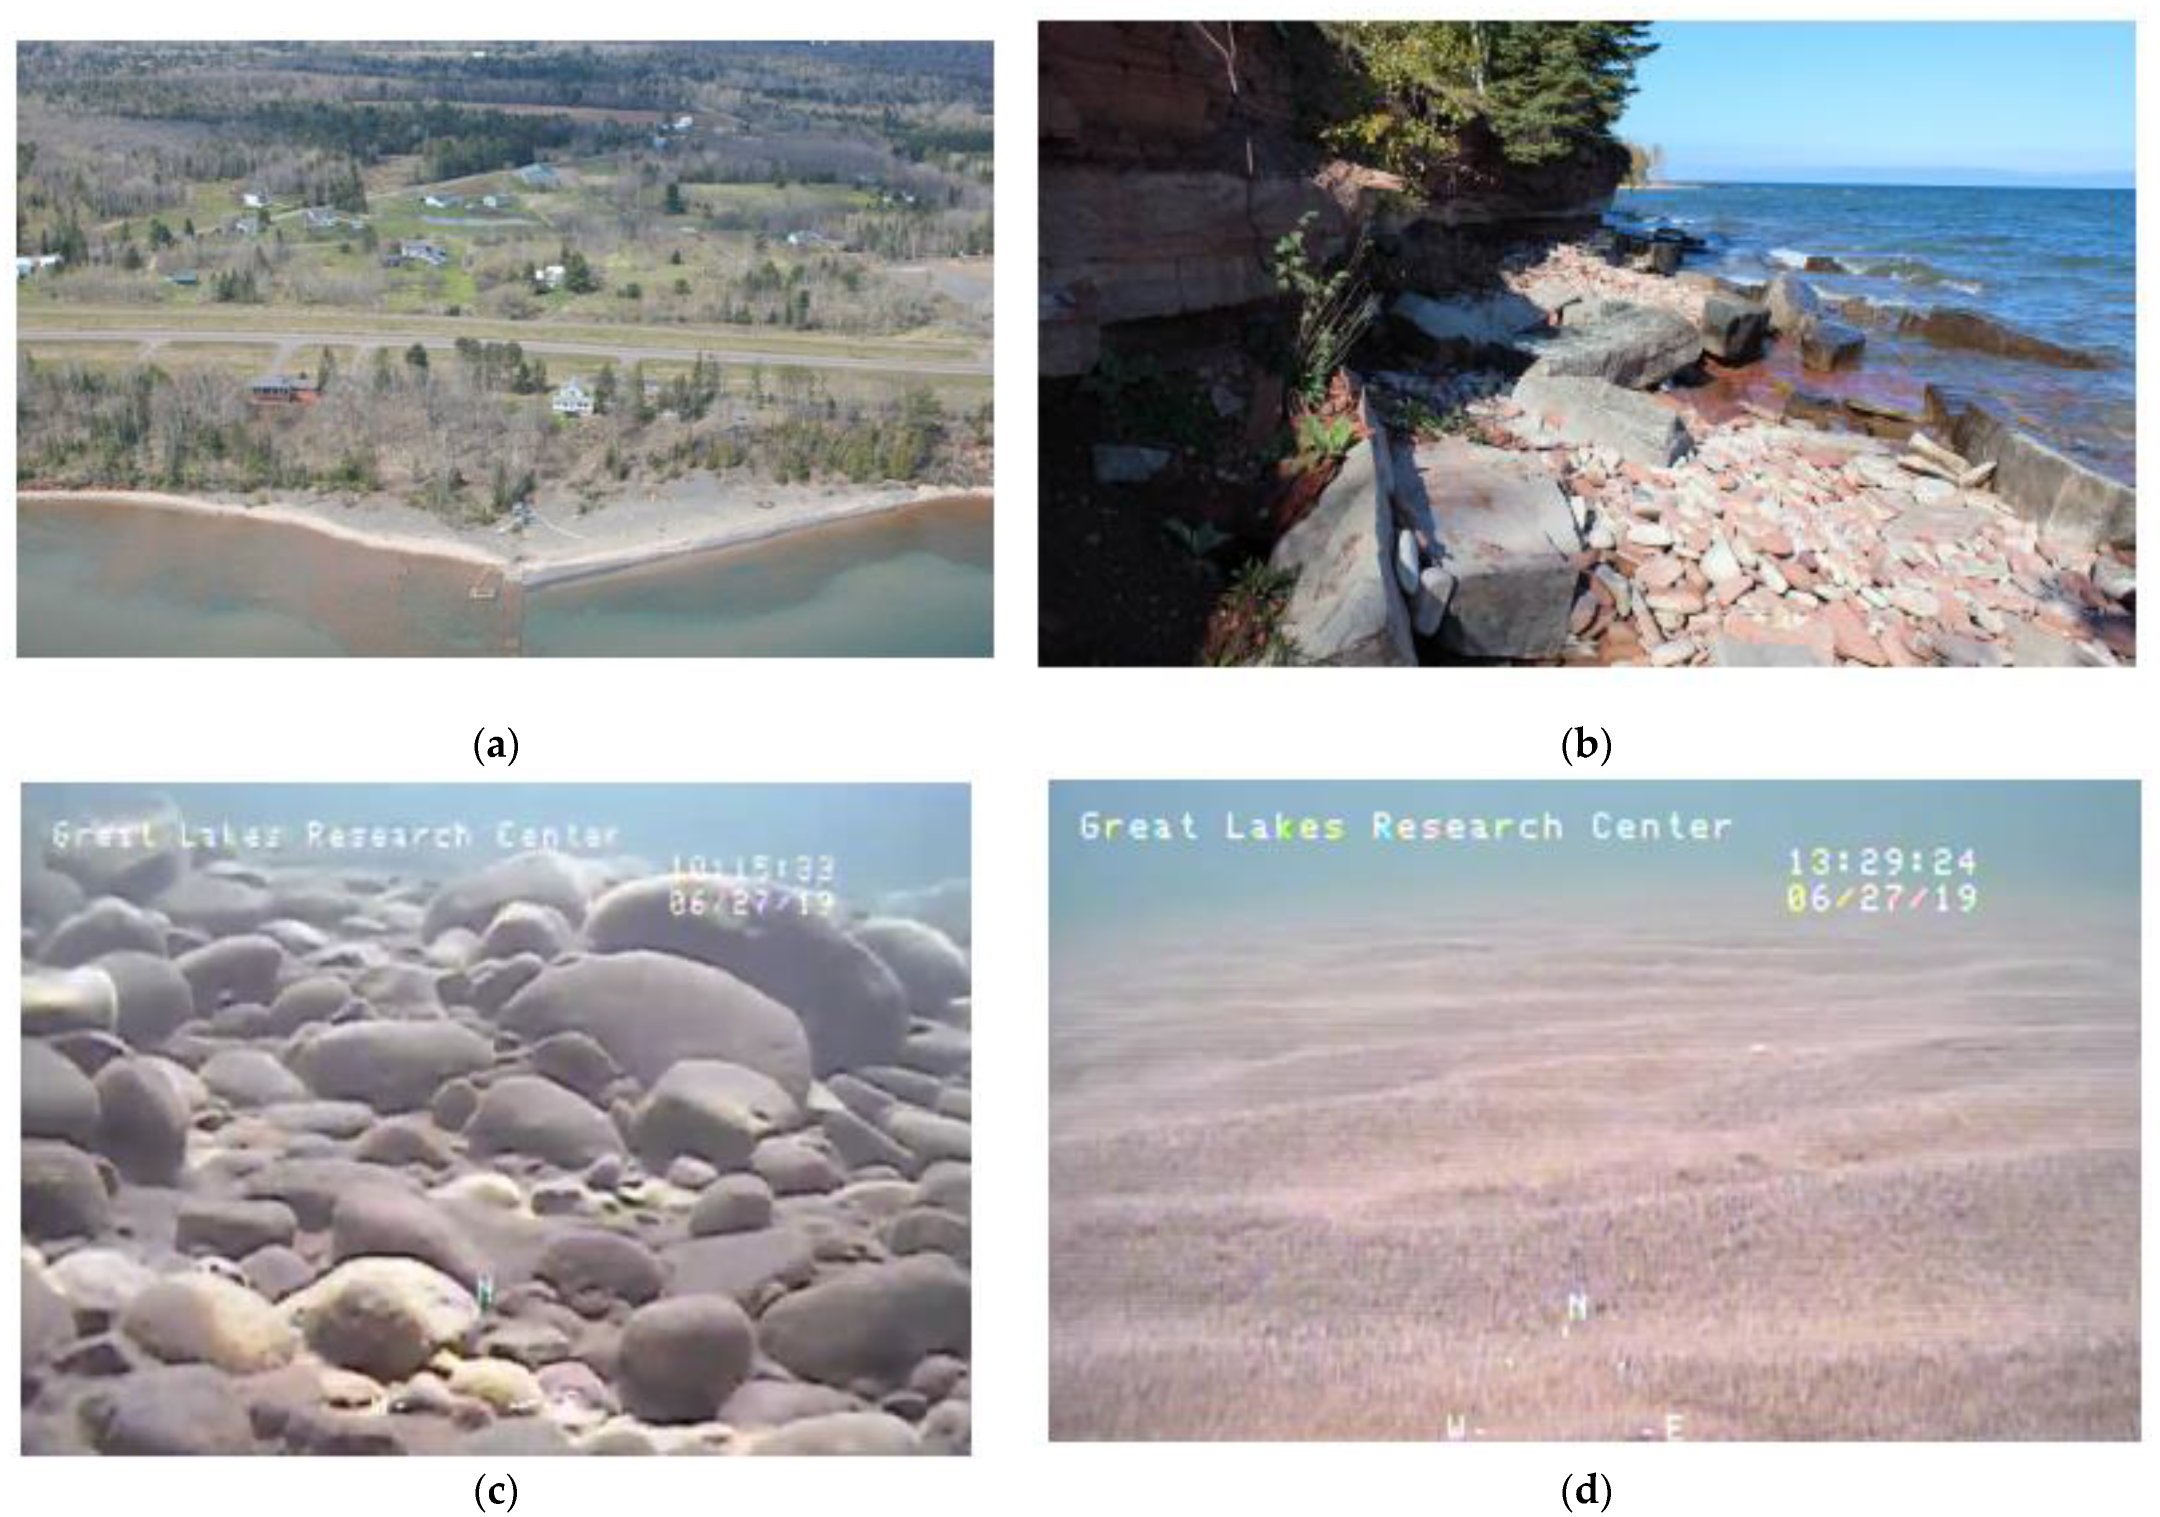
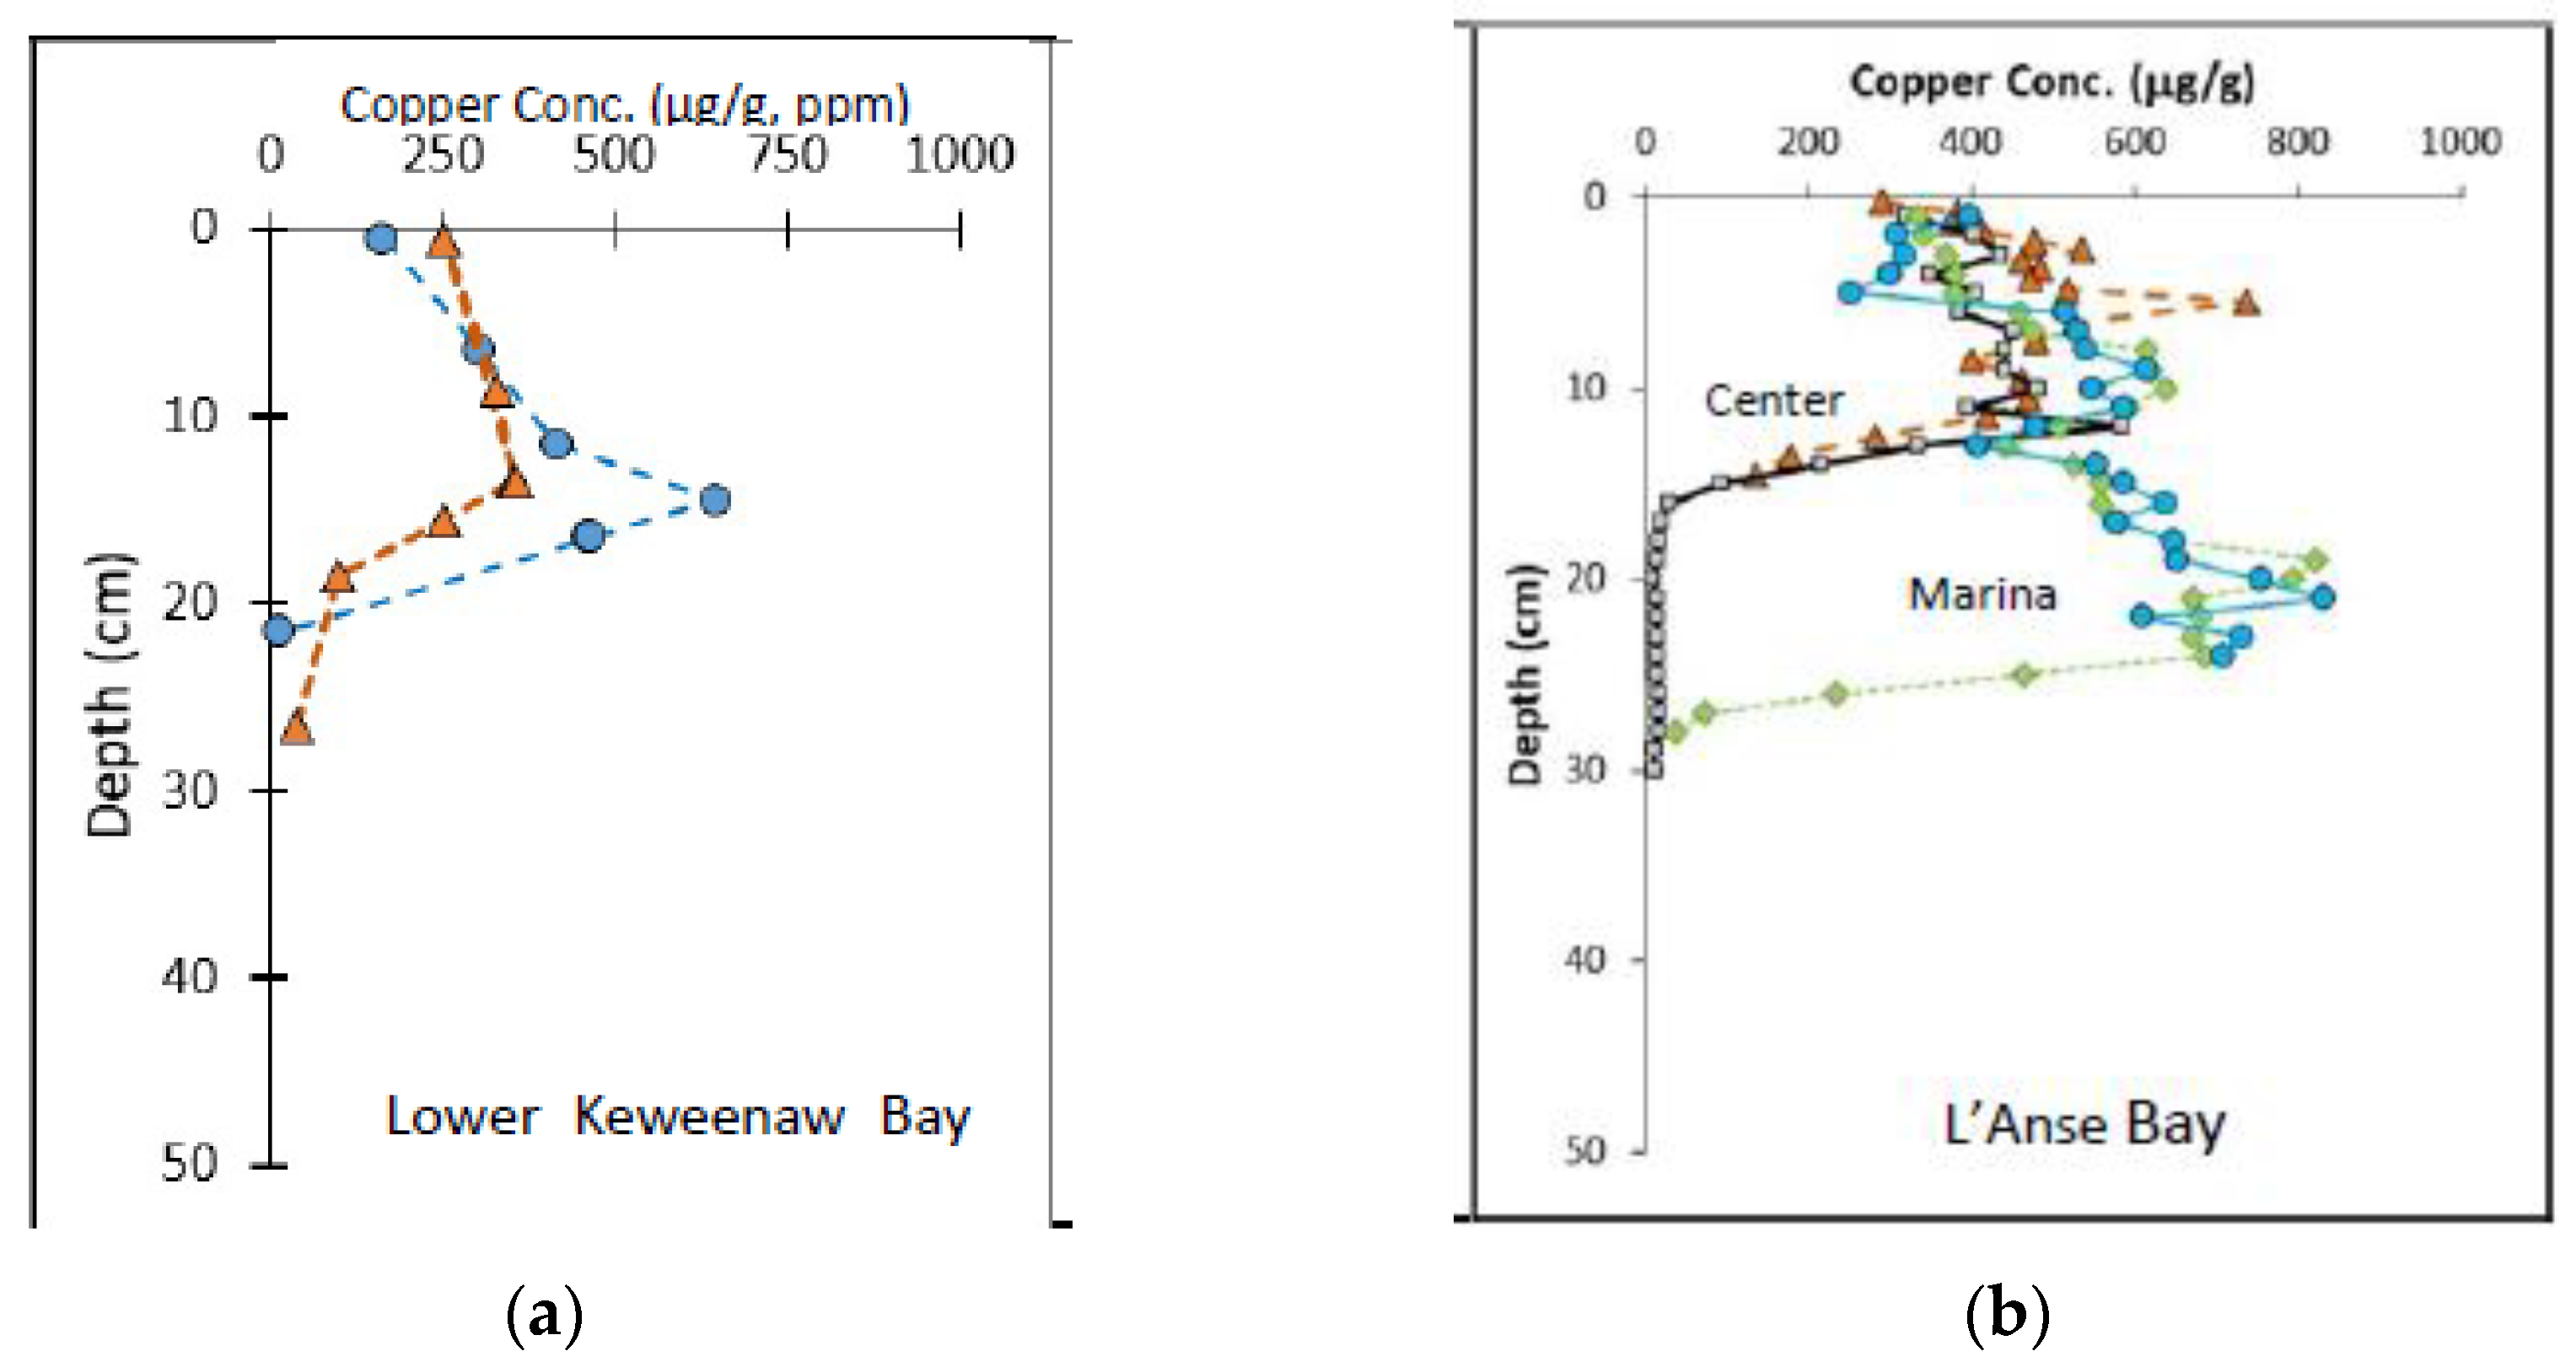
At present, there are only scattered stamp sand patches along the stretch from the Keweenaw Bay Community (Mill Site) to Assinins. Natural pebble to cobble sandstone (Jacobsville Sandstone) beaches are recovering along northern shorelines, replacing beaches once covered by tens to hundreds of meters of stamp sand. During migration, beach stamp sands followed the path of natural quartz sand eroding from shoreline Jacobsville Sandstone cliffs and glacial till. The sands moved southward to create a beach off Assinins and an addition onto the original mass of sand at “Sand Point”. Here we utilize a sequence of remote sensing applications (aerial photographs, LiDAR, side-scan sonar, and ROV images), Ponar samples, and sediment cores to reconstruct the historical spread and fate of tailings along the southern shoreline of Keweenaw Bay. Migration of beach stamp sand masses is traced historically southward to Sand Point. LiDAR imagery, ROV underwater photographs, shipboard Ponar sampling, and side-scan sonar transects help describe shallow-water bottom surfaces (bedrock, cobble/boulder beds, migrating natural sand fields) on the coastal shelf out into Keweenaw Bay. Modern beach sediments are sampled along the shoreline and offshore transects. We use a unique microscope particle counting procedure (see Methods) to determine the percentage of stamp sand in sediment sand mixtures, then predict Cu concentrations from the percentage stamp sand calculations. We then cross-compare the predicted against directly assayed Cu concentrations. Finally, sediment cores from southern Keweenaw Bay and L’Anse Bay document changing metal concentrations and fluxes over time, allowing the comparison of past with modern-day Cu concentrations, thus quantifying recovery and present status. We discuss the century-long unfolding of stamp sand impacts on both the coastline and aquatic environments, the time course of recovery, and modern mitigation and restoration efforts.

2. Materials and Methods

2.1. Use of Aerial Photography, LiDAR, Plus Shipboard ROV and Side-Scan Sonar Transects to Characterize Movement of Stamp Sands in Southern Traverse Bay and L’Anse Bay and Substrate Types

The primary objectives of the project included: (1) use of historical aerial photography and LiDAR to produce ArcGIS-georeferenced geodatabases of Keweenaw Bay, including shoreline beaches, infrastructures (roads, highways, buildings) and types of offshore structures; (2) document the chronological sequence of stamp sand migration and discuss ablation and deposition processes; (3) use bathymetric LiDAR and ROV/Side-scan Sonar surveys to derive high (2 m) resolution topo-bathymetric models of Keweenaw Bay underwater substrate types to a shelf depth of approximately 20–22 m; and (4) conduct beach and Ponar sampling of sand mixtures to determine the percentage of stamp sand, predict copper concentrations, then compare the predicted with directly determined (AA) Cu analyses. From 1938 to the present, the state of Michigan has conducted multiple aerial photographic surveys of shorelines, whereas the Army Corps of Engineers and NOAA have produced bathymetric surveys. In addition, sonar surveys from CCIW (Canadian Center for Inland Waters) characterized basic bathymetry and sediment features of the southern Keweenaw and L’Anse Bays [18,19]. However, the combination of recent LiDAR, shipboard ROV underwater photography, and side-scan sonar, plus bottom Ponar sediment sampling provides better visualization of coastal bathymetric features and greatly aids stamp sand percentage and Cu concentration determinations. Here we update how the two remote sensing techniques (aerial surveys, LiDAR) complement each other and shipboard Ponar transect studies.
The laser technique, LiDAR, is an active remote sensing technique used over Traverse Bay in the ALS (airborne laser scanning) version, where an airborne laser-ranging system acquires high-resolution elevation and bathymetric data [
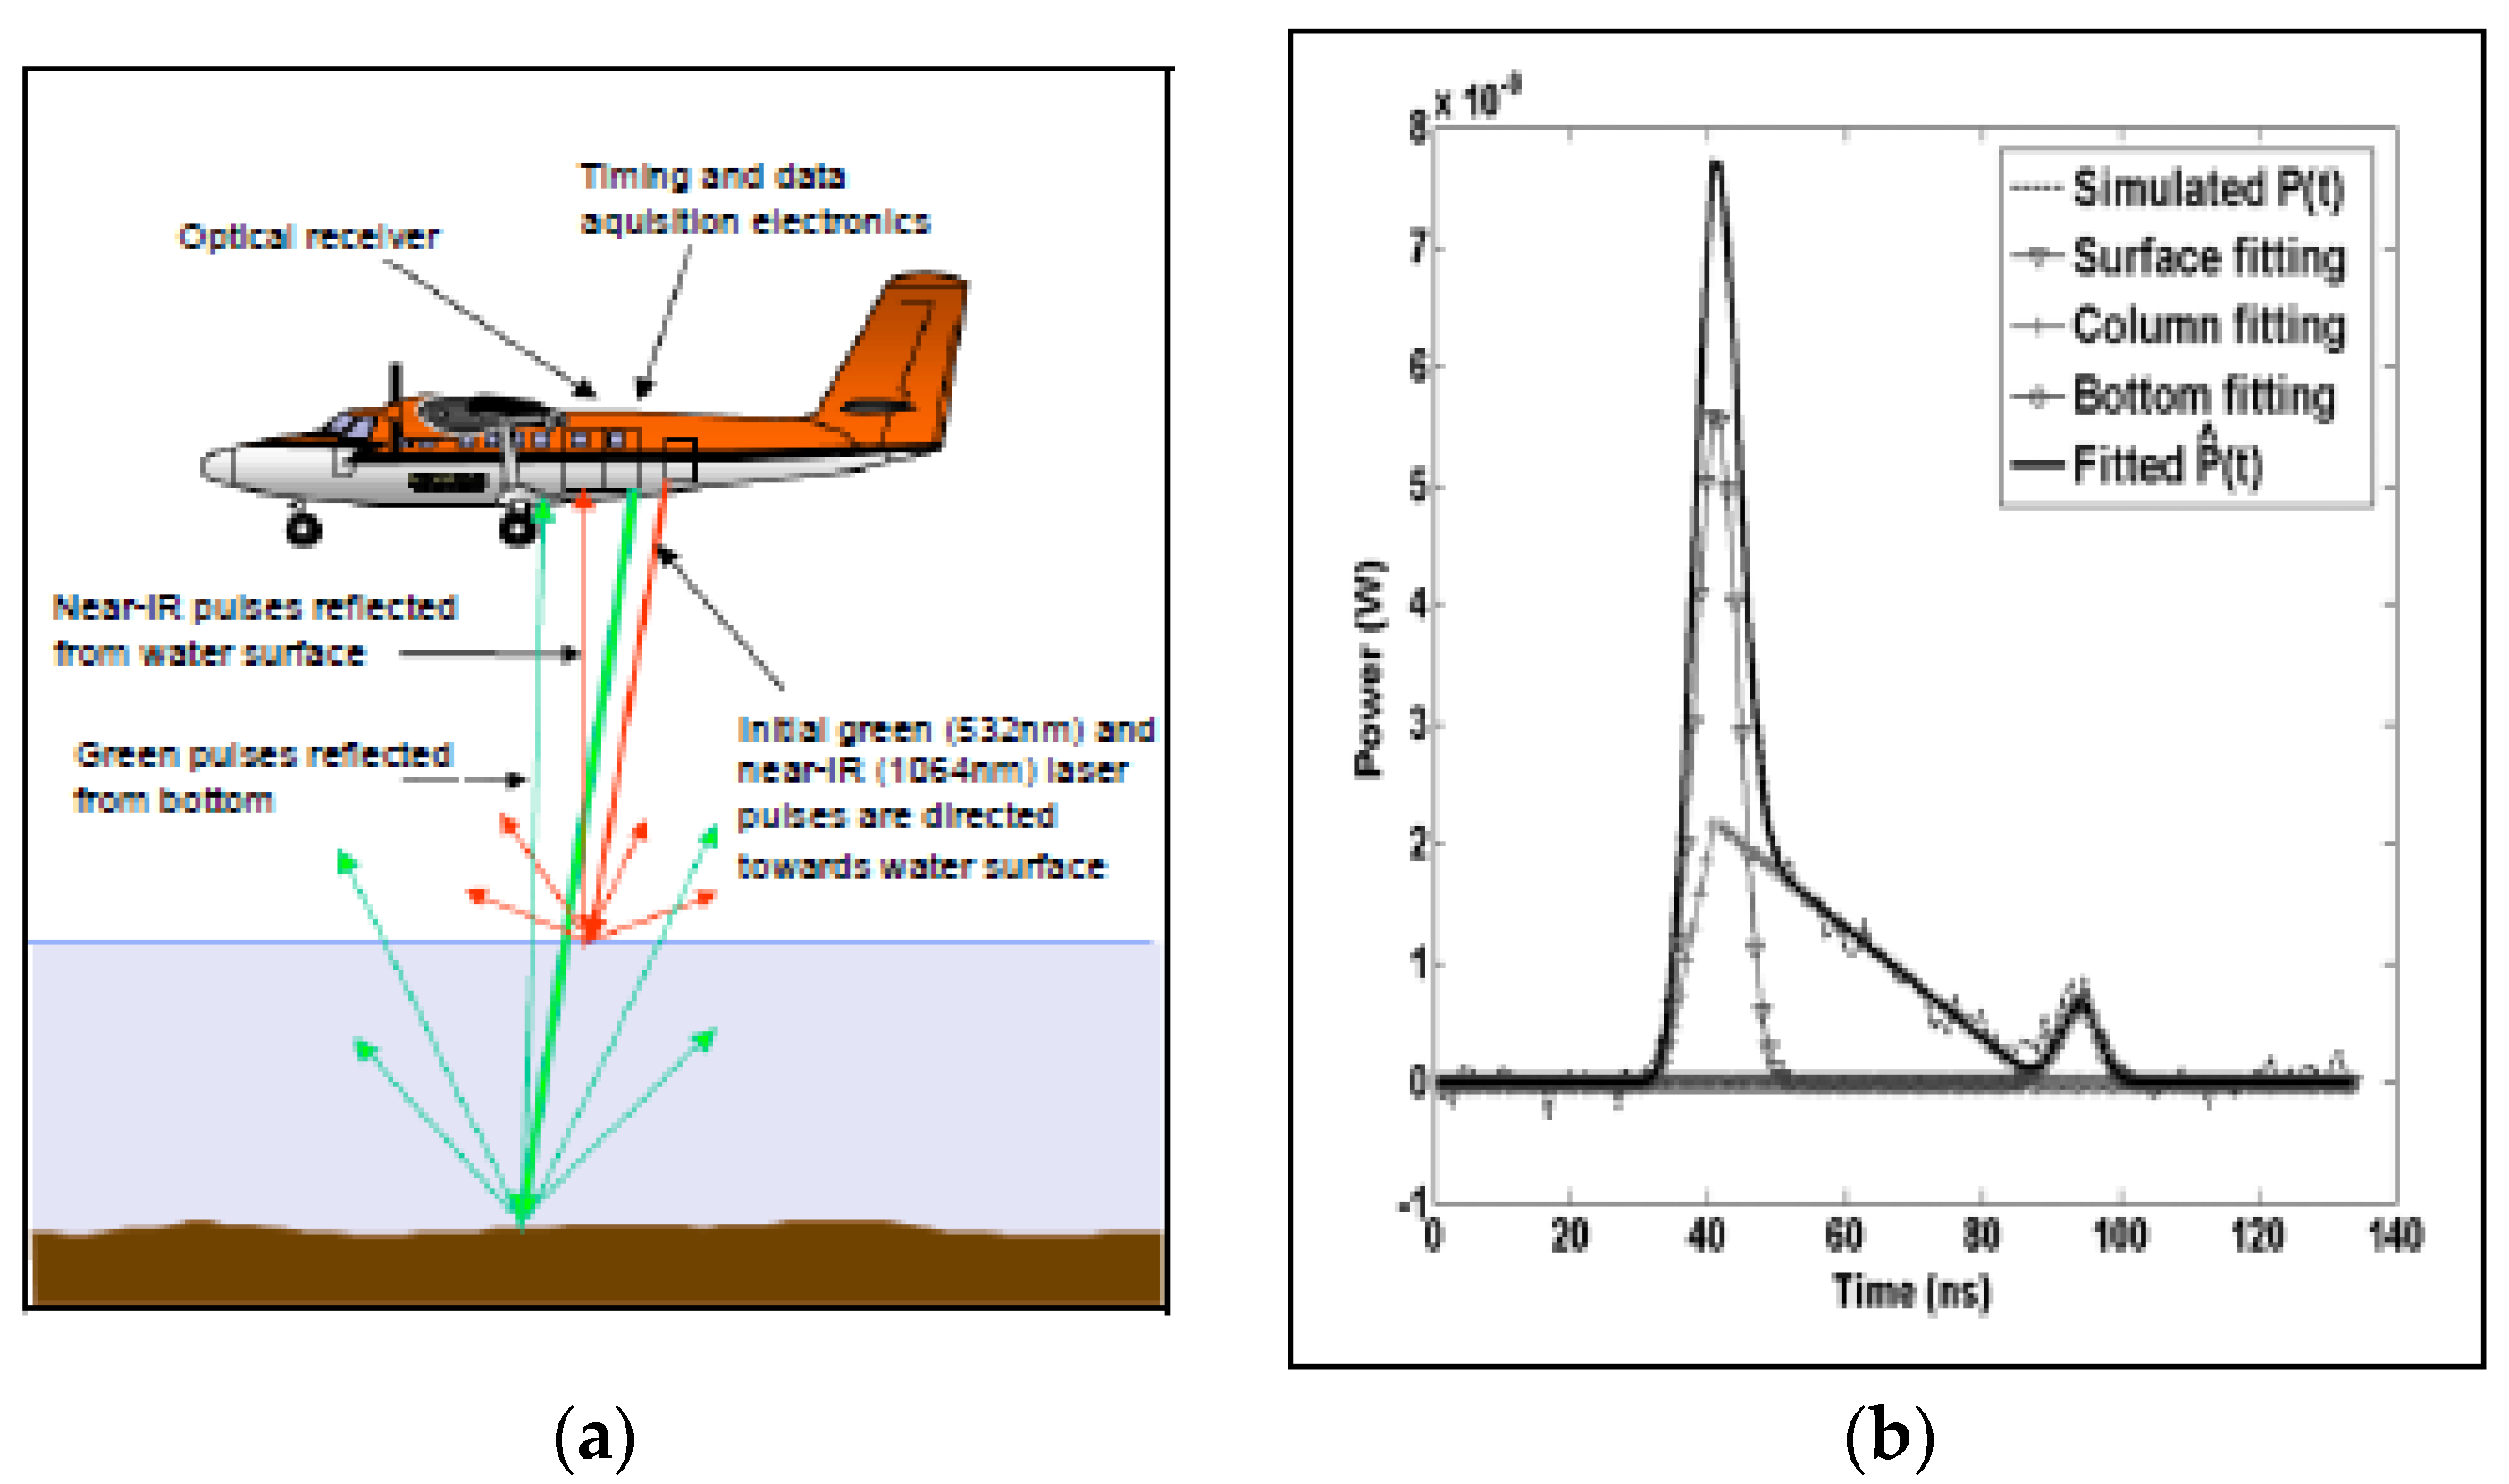
20]. The Compact Hydrographic Airborne Rapid Total Survey (CHARTS) and the Coastal Zone Mapping and Imaging LiDAR (CZMIL) systems are separate integrated airborne sensor suites used to survey coastal zones, in which bathymetric LiDAR data are collected with aircraft-mounted lasers (Figure 4). In coastal surveys, an aircraft travels over a water stretch at an altitude of 300–400 m and a speed of about 60 m s−1, pulsing two varying laser beams in a sweeping fashion toward the Earth through an opening in the plane’s fuselage: an infrared wavelength beam (1064 nm) that is reflected off the water surface and a narrow, blue-green wavelength beam (532 nm) that penetrates the water surface and is reflected off the underwater substrate surface (Figure 4, left). The two-beam system produces a complex wave form (Figure 4, right) that when processed, quantifies the time difference between the two signals (water surface return, bottom return) to derive detailed spatial measurements of bottom bathymetry in addition to ancillary light scattering data.
Laser energy is lost due to refraction, scattering, and absorption at the water surface and lake bottom, placing limits on depth penetration as the pulse travels through the water column. Corrections are incorporated for surface waves and water level fluctuations. LiDAR surveys from 2009, 2015, and 2019 were used for this Project (Supplementary Materials Figure S2). USACE 2009 and 2019 LiDAR overflight data were preprocessed by the U.S. Army Corps of Engineers Joint Airborne Lidar Bathymetry Technical Center of Expertise (JALBTCX). Quality control and editing were done in GeoCue’s LP360, bulk datum transformations with NOAA’s VDatum, then products were generated using Applied Imagery Quick Terrain Modeler and ESRI ArcGIS (ArcMap and ArcGIS Pro). However, the error associated with LiDAR DEMs (digital elevation/bathymetry models) is sensitive to several variables: mechanical collection (GPS coordinate system, scan altitude and speed, scan pattern, pulse-repetition rate, aircraft yaw, and roll) and signal processing, weather, sea state, depth, water clarity, and wave-form clarity. Depth is important; for example, the horizontal and vertical accuracy of the CZMIL system has been described as 3.5 + 0.05 × d meters and [0.32 + (0.013 × d)2]1/2 m (Optech Manual), respectively, where d is the water depth. Details of resolution and accuracy in oceanic projects are discussed in several recent works [21,22,23,24,25]. With multiple instrument measurements, vertical LiDAR accuracy can be enhanced to 0.2 m in shallow coastal waters [25], and can be as good as 0.22 (range 0.16–0.31 m) along terrestrial strips [26]. In particular, under low-flying, high-density scanning characteristics of coastal and Great Lakes shorelines, horizontal resolution is listed by JALBTCX as 0.5–1.0 m (0.7 m) along inland beach environments, with vertical accuracy of 15 cm (Optech Manual) [27]. Spatial resolution decreases to ca. 2 m in deeper waters (10–20 m). Underwater DEMs are usually delivered with tiled 3 m resolution. For high-resolution coastal topographic data, we used MISAL Airborne LiDAR 2015.
Under ideal conditions in coastal waters, blue-green laser penetration allows detection of bottom structures down to approximately three times Secchi (visible light) depth. Previously, in Grand Traverse Bay studies, ca. 60 km N. of the Mass Mill site, JALBTCX LiDAR repeatedly achieved around 20–23 m penetration [28]. The depth was somewhat less than the 40 m recorded from oceanic environments [29], yet adequate enough in Lake Superior to clearly characterize shallow coastal shelf regions and to highlight critical details of tailing migration. The LiDAR DEM construction for the lower Keweenaw Bay penetrated similarly down over 20 m (23–25 m) and revealed excellent substrate details. Here we use USACE 2009, 2010, and 2019 LiDAR for general bathymetric rendering, across which we plot our percentage stamp sand survey results. Postprocessing bathy-topographic data used for shoreline to shelf details included the Digital Bathy-Terrain Model, Digital Bathy-Terrain Hillshade Model, Bathy-Slope-Slope models (degree and percent), and Bathy-Aspect Model. KBIC 2013 Airborne LiDAR and Baraga Airborne MISAL 2015 LiDAR were used for topographic details. The 2015 high-resolution (1 m spatial) coastline topographic data were used with the Digital Terrain Model, Digital Terrain Hillshade Model, Slope models (degree and percent), and the Aspect Model to render good topographic contours and features.

2.2. Microscopic Determination of Percentage Stamp Sand in Sand Mixtures

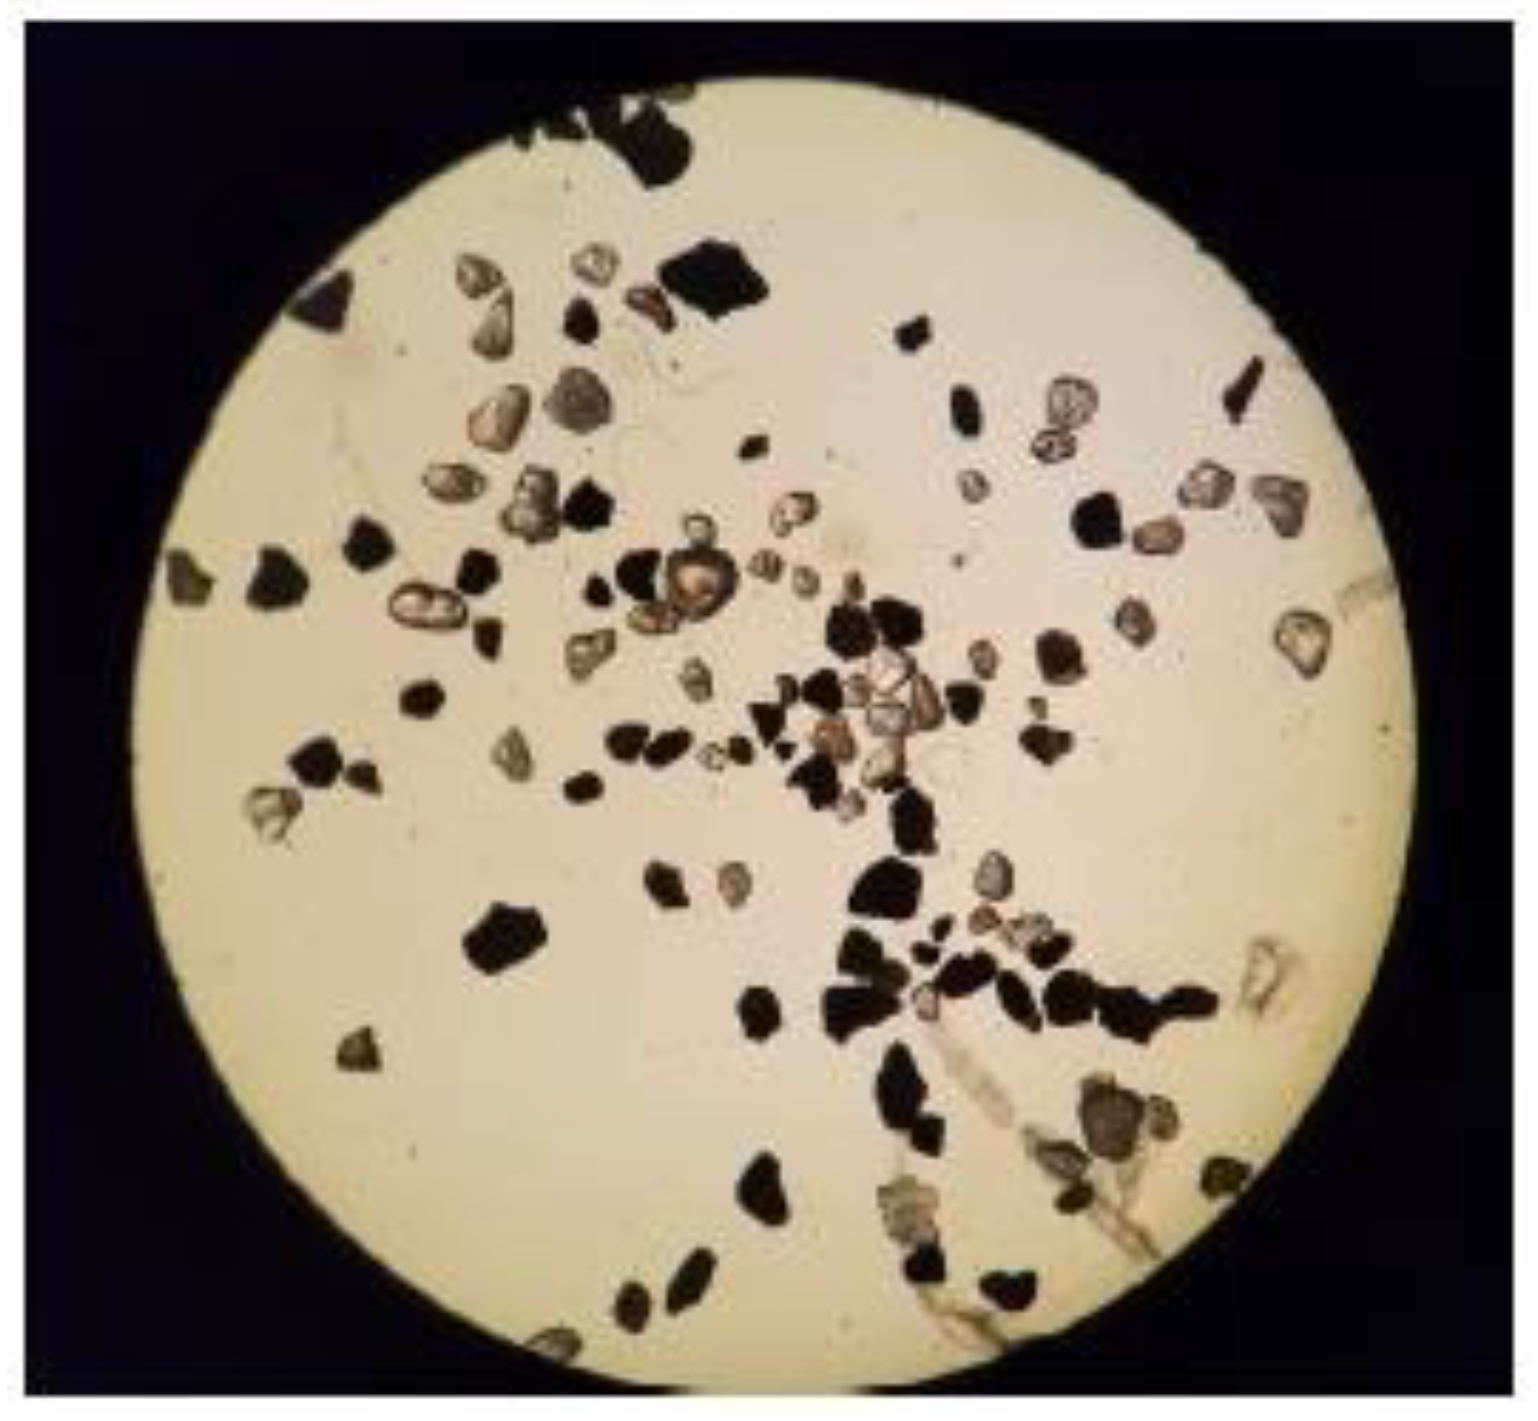
The two major sand types in the bay come from quite different end members. The crushed Portage Lake Volcanics, the so-called “stamp sands”, are basalts (K, Fe, Mg plagioclase silicates; augite, and minor olivine), whereas the coastal bedrock (Jacobsville Sandstone) and glacial till produces rounded quartz sands that make up the white beach sands. Under a microscope (Olympus LMS225R, 40–80X), particle grains from beach or Ponar samples could be separated into crushed opaque (dark) basalt versus rounded, transparent quartz grain components (Figure 5), allowing calculation of the percent of stamp sand particles in particle (sand) mixtures (see 
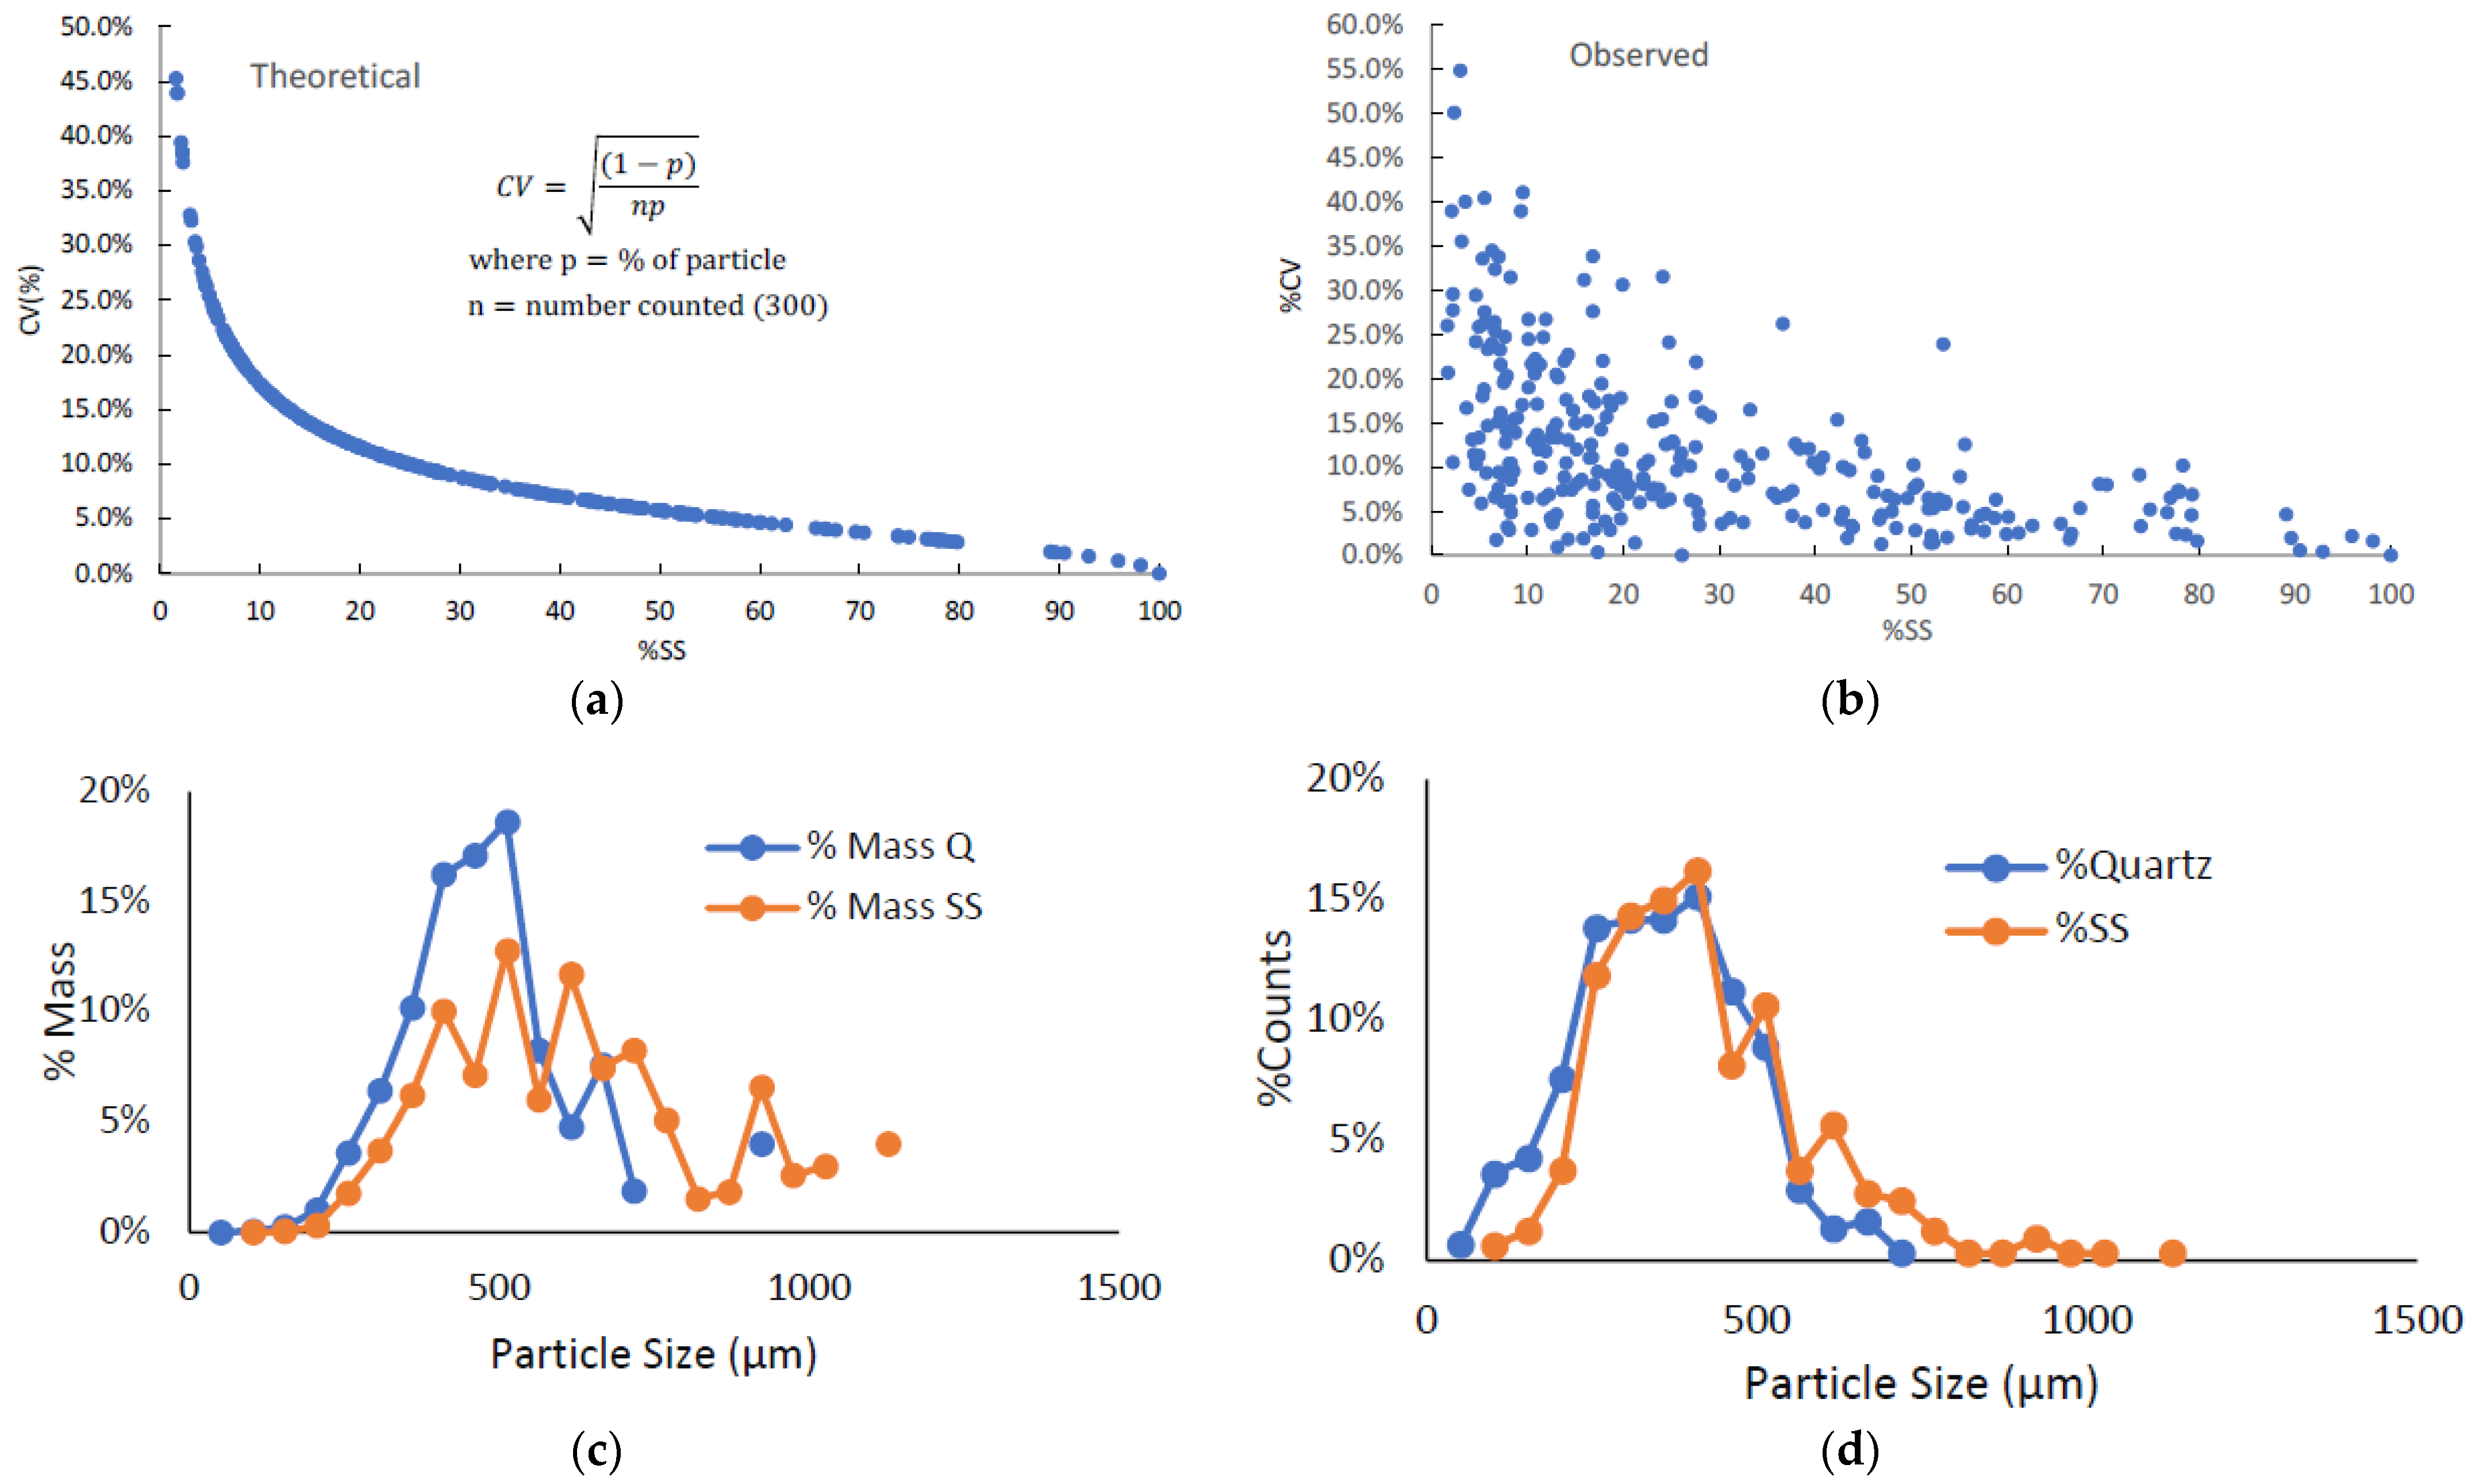
Supplementary Materials Tables S1 and S2). Percentage stamp sand values were based on means of randomly selected subsamples, with 3–4 replicate visual counts, around 300 total grains in each subcount. Standard deviations and errors were calculated for individual samples and the means used to calculate confidence intervals for typical counts. Technically, mixed grain counts followed a binomial distribution, where there was an inverse relationship between the coefficient of variation (CV = mean/SD) and the mean % stamp sand (Figure 6a,b). That is, if the mean % stamp sand is high (>50%), the coefficient of variation (CV = mean/SD) is relatively low (3.1%, n = 12), but if it is <10%, the value could be much higher (mean = 25.3%, n = 30).

2.3. Particle Size Distributions & Specific Gravities

In selected beach and Ponar samples along Assinins transects, we measured particle sizes for mixtures of stamp sands and natural quartz sands, to compare relative sizes of particles from the two end members (e.g., Figure 6c,d). Otherwise, we used Wildco Stainless Steel Sieves (5 Mesh, 4000 µm; 10 Mesh, 2000 µm; 35 Mesh, 500 µm; 60 Mesh, 250 µm; 120 Mesh, 125 µm) on a Cenco-Meinzer Sieve Shaker Table (Central Scientific) to separate particles from mixed grain samples into specific size classes. See Supplementary Materials Table S3 for locations and particle size distributions.
Along Traverse Bay, beach stamp sand density differences were similar to expected density differences between pure basalt and quartz grains (pure basalt = 2.9 g/cm3; pure quartz = 2.65 g/cm3). Particle grains dispersed similarly, probably because both basalt and quartz particles were largely silicates of similar density. At the Gay Stamp Sand Pile (100%SS) in Grand Traverse Bay, the mean particle density was 2.88 g/cm3, whereas at the “natural” Schoolcraft white beach site (0% SS) in the bay, the mean density of natural quartz beach sand particles was 2.55 g/cm3. Thus, for the basalt/quartz standards, the expected mean density difference was only 8.6–9.0%. Based on the 10 field measurements (Gay Pile vs. Schoolcraft beach), the observed mean difference was 0.33 g/cm2, for a relative difference of only 11.5–12.2%, a bit larger, but still a relatively small increment. The coefficient of variation (CV; i.e., SD/mean) was around 3.8–4.9% for the standards. That is, trying to determine the percentage of stamp sands solely by density when dealing with grain types with such slight density differences would involve a relative error of around 20–30%, which is probably not a good idea. Hence, we developed the particle counting technique, which has much better precision (<10% error).
Unfortunately, beach sands often include slight percentages of manganese sands (manganese dioxide-MnO2 grains; [
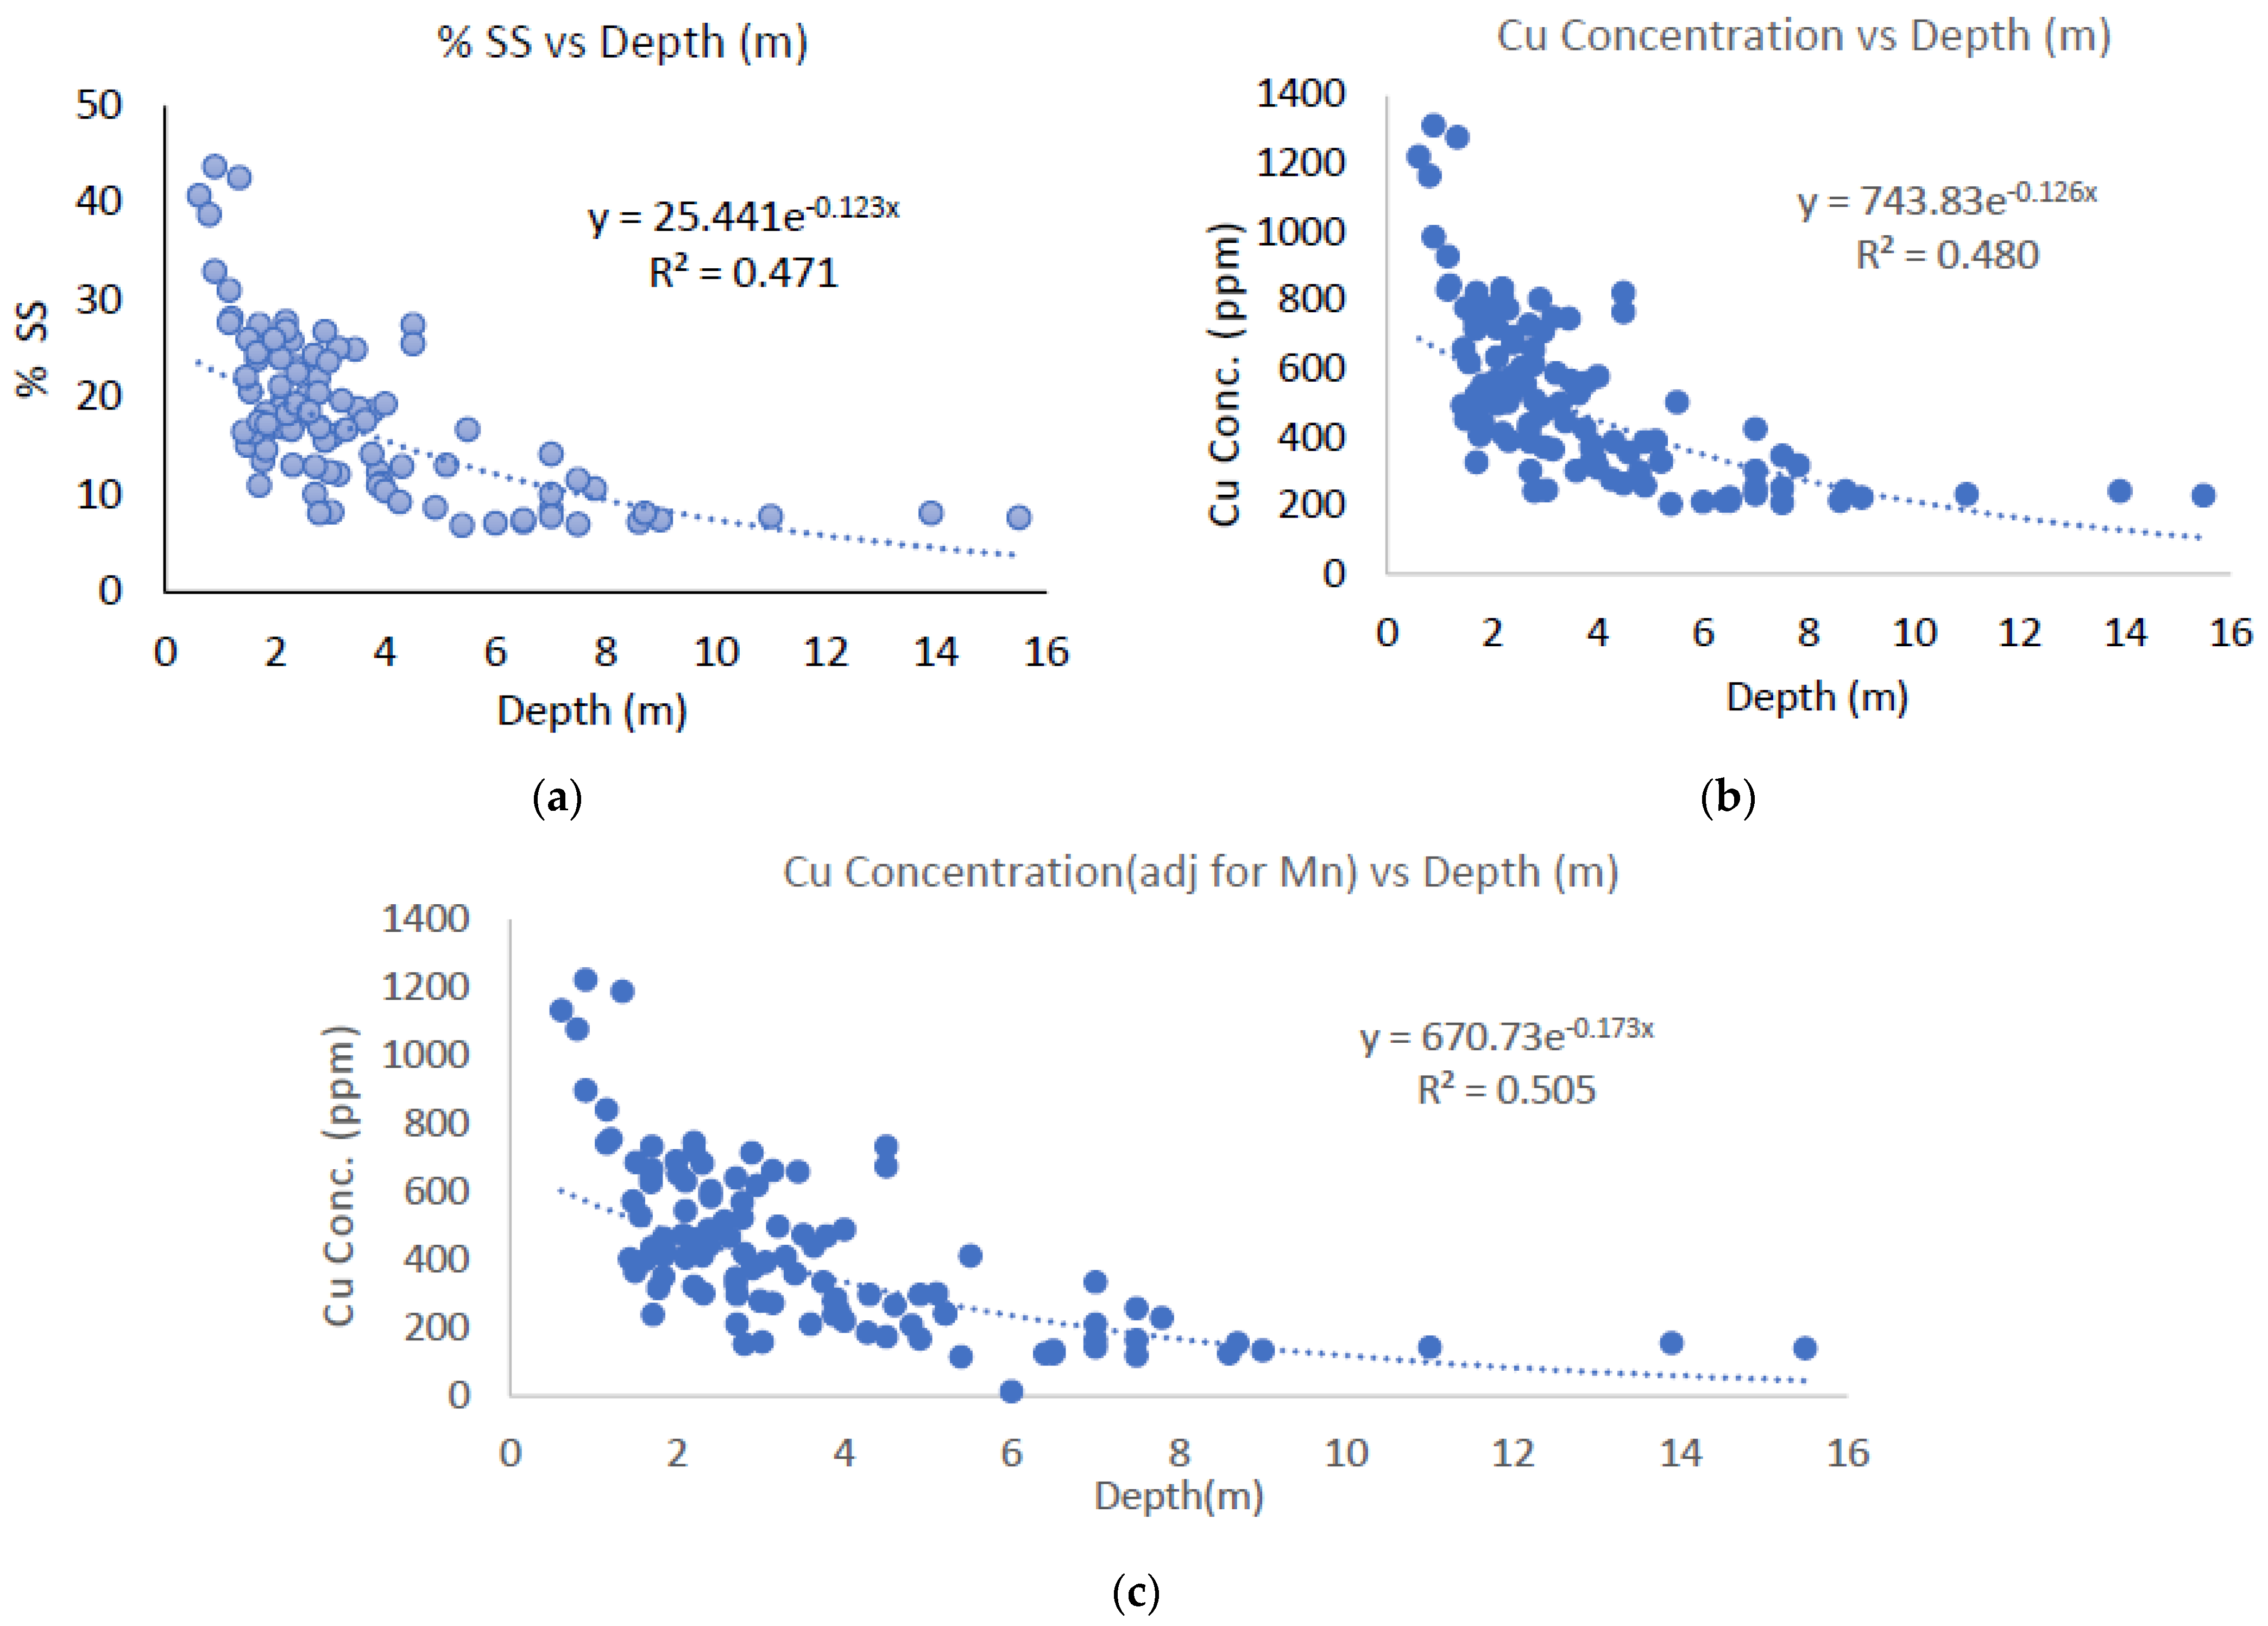
30]). Because they are highly opaque, the inadvertent inclusion (misidentification) of natural manganese sands as stamp sands under the microscope technique could influence low-end calculations of SS%. However, we found that under the microscope, reflected light could be used to distinguish natural manganese sand (distinctive grey metallic color) from basalt particles (dark brown, greenish). Manganese grain corrections are important for beach samples, but are rather low in underwater samples (an average of only 1.8% in grain counts). See Supplementary Materials Table S4 for examples of Mn counts and corrections.

2.4. Predicted versus Directly Determined Cu Concentrations

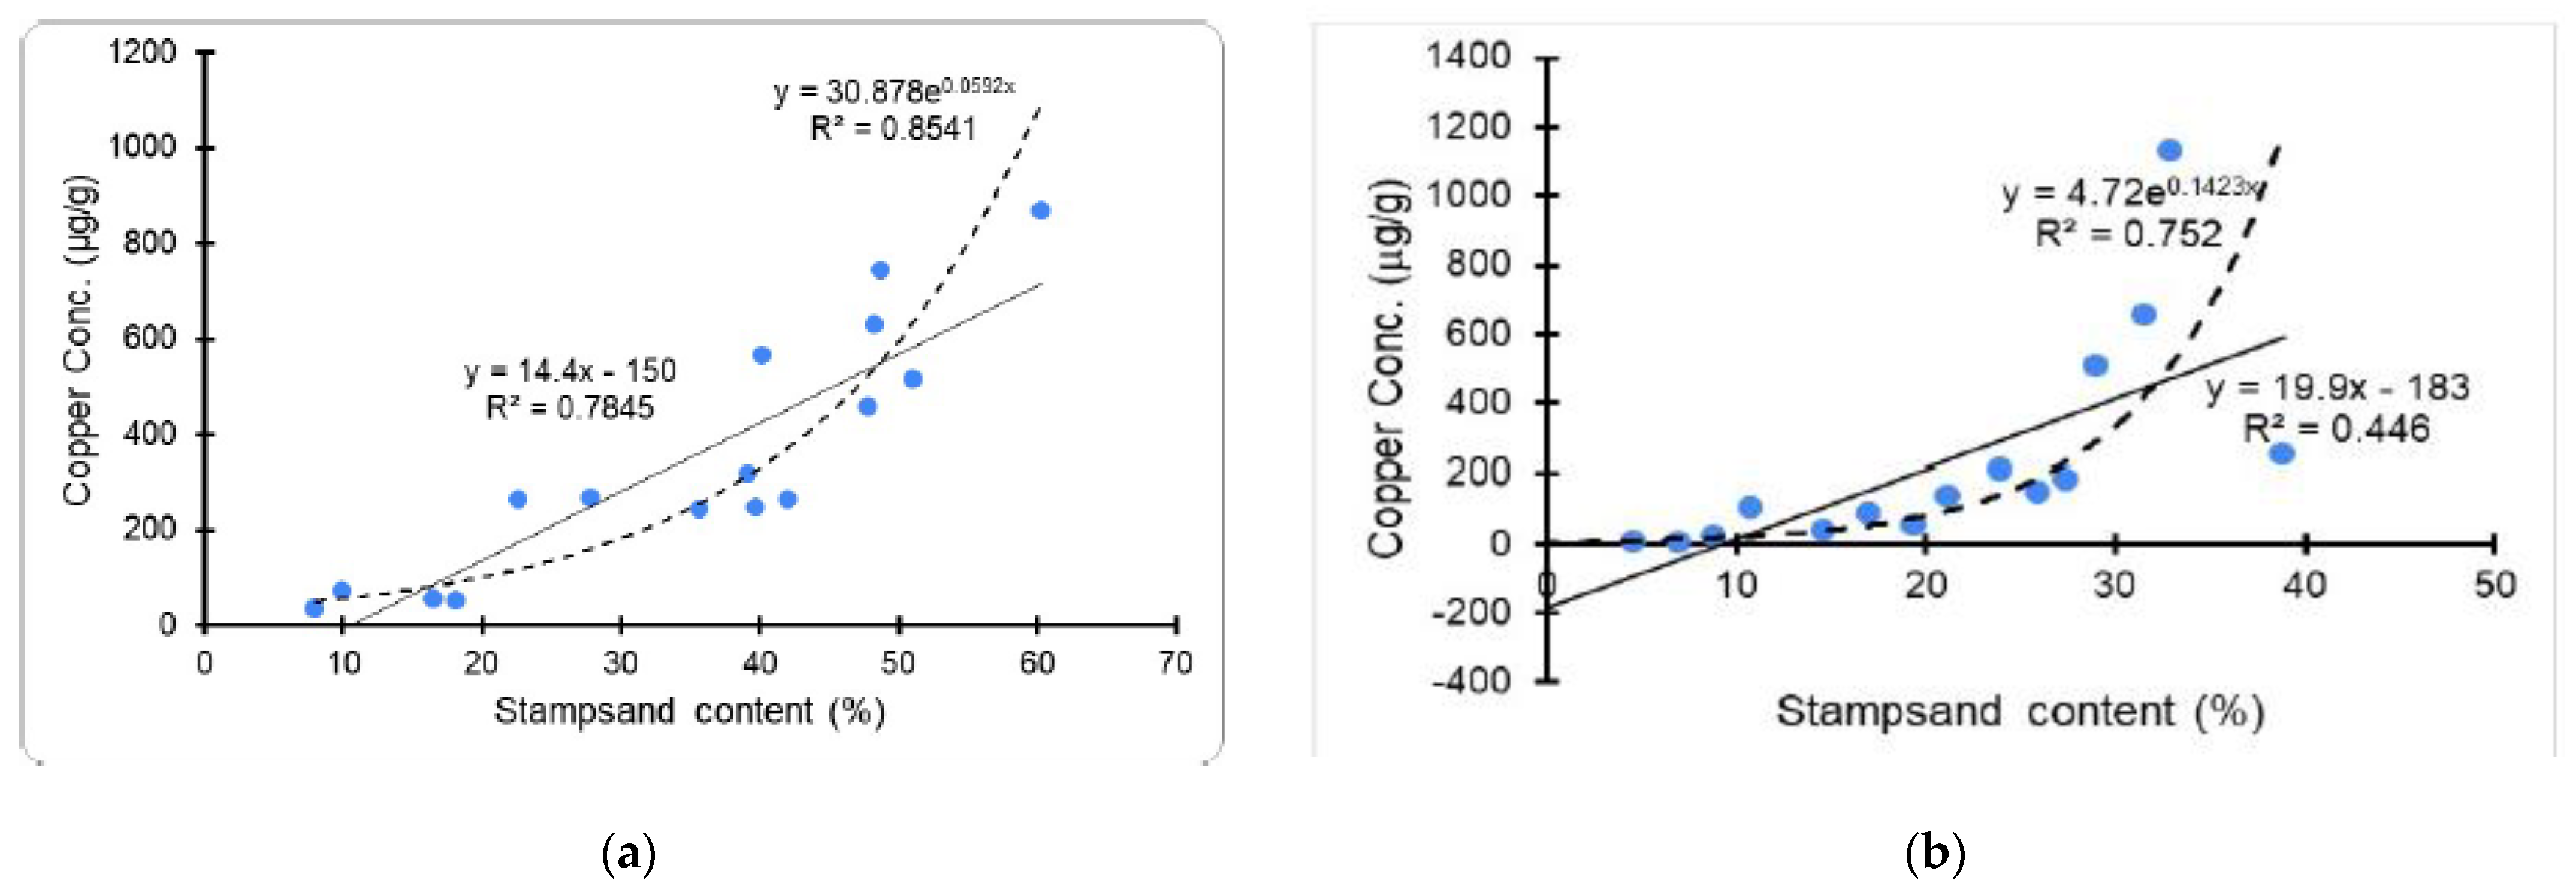
After discharge, tailing particles (stamp sands) readily mixed with shoreline natural sands (quartz grains) that eroded from Jacobsville Sandstone bedrock and glacial till. Yet, the two end members (basalt stamp sands; natural quartz grains) were readily distinguishable (Figure 5). First of all, recording the percentage of stamp sand in sand mixtures (Supplementary Materials Tables S1 and S2) is an important variable, as it tells us where sand-sized tailings dispersed. Secondly, if there is no differential sorting of particles, the percentage of stamp sand allows for a preliminary prediction of sediment copper concentrations, important for determining potential environmental effects. The high percentage stamp sand samples from the Mass Mill location allow an initial concentration of Cu in discharged tailings (ca. 0.28–0.30% Cu). However, there were multiple ore bodies processed at the Mass Mill. Because we could not determine a single original discharge pile at the Mass Mill site, we favored using an 8-pile mean from other sites (8 amygdaloid stamp sand piles average of 0.3% Cu or ca. 3000 µg/g or ppm; a fairly similar value; [18]). Using the 0.3% Cu value and the percentage stamp sand values at various sites, a simple multiplication allows a prediction of copper concentrations for beach sand and underwater sediments (e.g., % SS × 3000 ppm Cu). However, this simple calculation assumes that copper particles are randomly distributed, not subject to particle sorting by wave action, i.e., particle size or density. Two concerns were that more dense particles with higher Cu concentrations might remain near the original discharge site and that waves might winnow out clay-sized particles (known to contain slightly higher Cu concentrations; [31]).
To check the % stamp sand-predicted Cu concentrations, we determined Cu concentrations directly for several samples, constructing a “calibration curve” (for a previous example from Grand Traverse Bay, 50 km to the north [31]. Direct determinations of Cu concentrations were also done in many deep-water Ponar and sediment core samples from southern Keweenaw Bay and L’Anse Bay (for earlier measurements, see [18]).
The finest, so-called “slime-clay”, fraction of tailings comprises 7–14% of total mass [32,33,34]. This fraction will spread furthest in bay waters. Our microscope technique was not suitable for clay-sized particles, but worked well for beach and shelf samples, where sand-size particles dominate. In the original studies, we sampled bottom sediments in Keweenaw Bay, off Pequamming Bay, and in L’Anse Bay with a Ponar grab sampler. See that paper [18] for details of sampling locations and specific values. The Ponar grab sampler (area = 522 cm2) penetrated to a sediment depth of 6–10 cm (Wildco Catalog; [35]). We used a plastic trowel to ladle contents into polyethylene plastic bags, then stored the samples at 4 °C until laboratory analysis. In the bay, many Ponar casts bounced off rocks or cobbles, although 35 were taken successfully from Keweenaw Bay. Total copper was measured with an Atomic Absorption Spectrophotometer (Perkin-Elmer Co., Waltham, MA, USA, Model AAS 3100) using flame atomization (3100 Automatic Burner Control; EPA SW-846 Method 7211 Copper). The accuracy of Cu standards was checked against NIST standard reference material (SRM 3172a Multi-element Mix B-1). Standards were within ±6% of the SRM value. Copper concentrations were also checked by running replicate samples. There was 93.7% (range 90.1–97.5%) correspondence among replicate samples.
In shelf sediments, which were largely sand-sized particles, we could cross-compare our directly determined Cu concentrations with the percentage stamp-sand (%SS) predictions of Cu concentrations. There were generally good correlations between % stamp sand-predicted Cu concentrations and directly measured Cu concentrations. However, directly determined values tended to be slightly lower than predicted values (see Results), suggesting spatially heterogeneous distribution of particles. For determining effects of stamp sands and copper concentrations on organisms (invertebrates and fish), we used measurements from the Gay (Buffalo Reef) site in Grand Traverse Bay, 50 km to the north (Figure 2).

2.5. Coring, Ponar, ROV, and Side-Scan Sonar Sampling

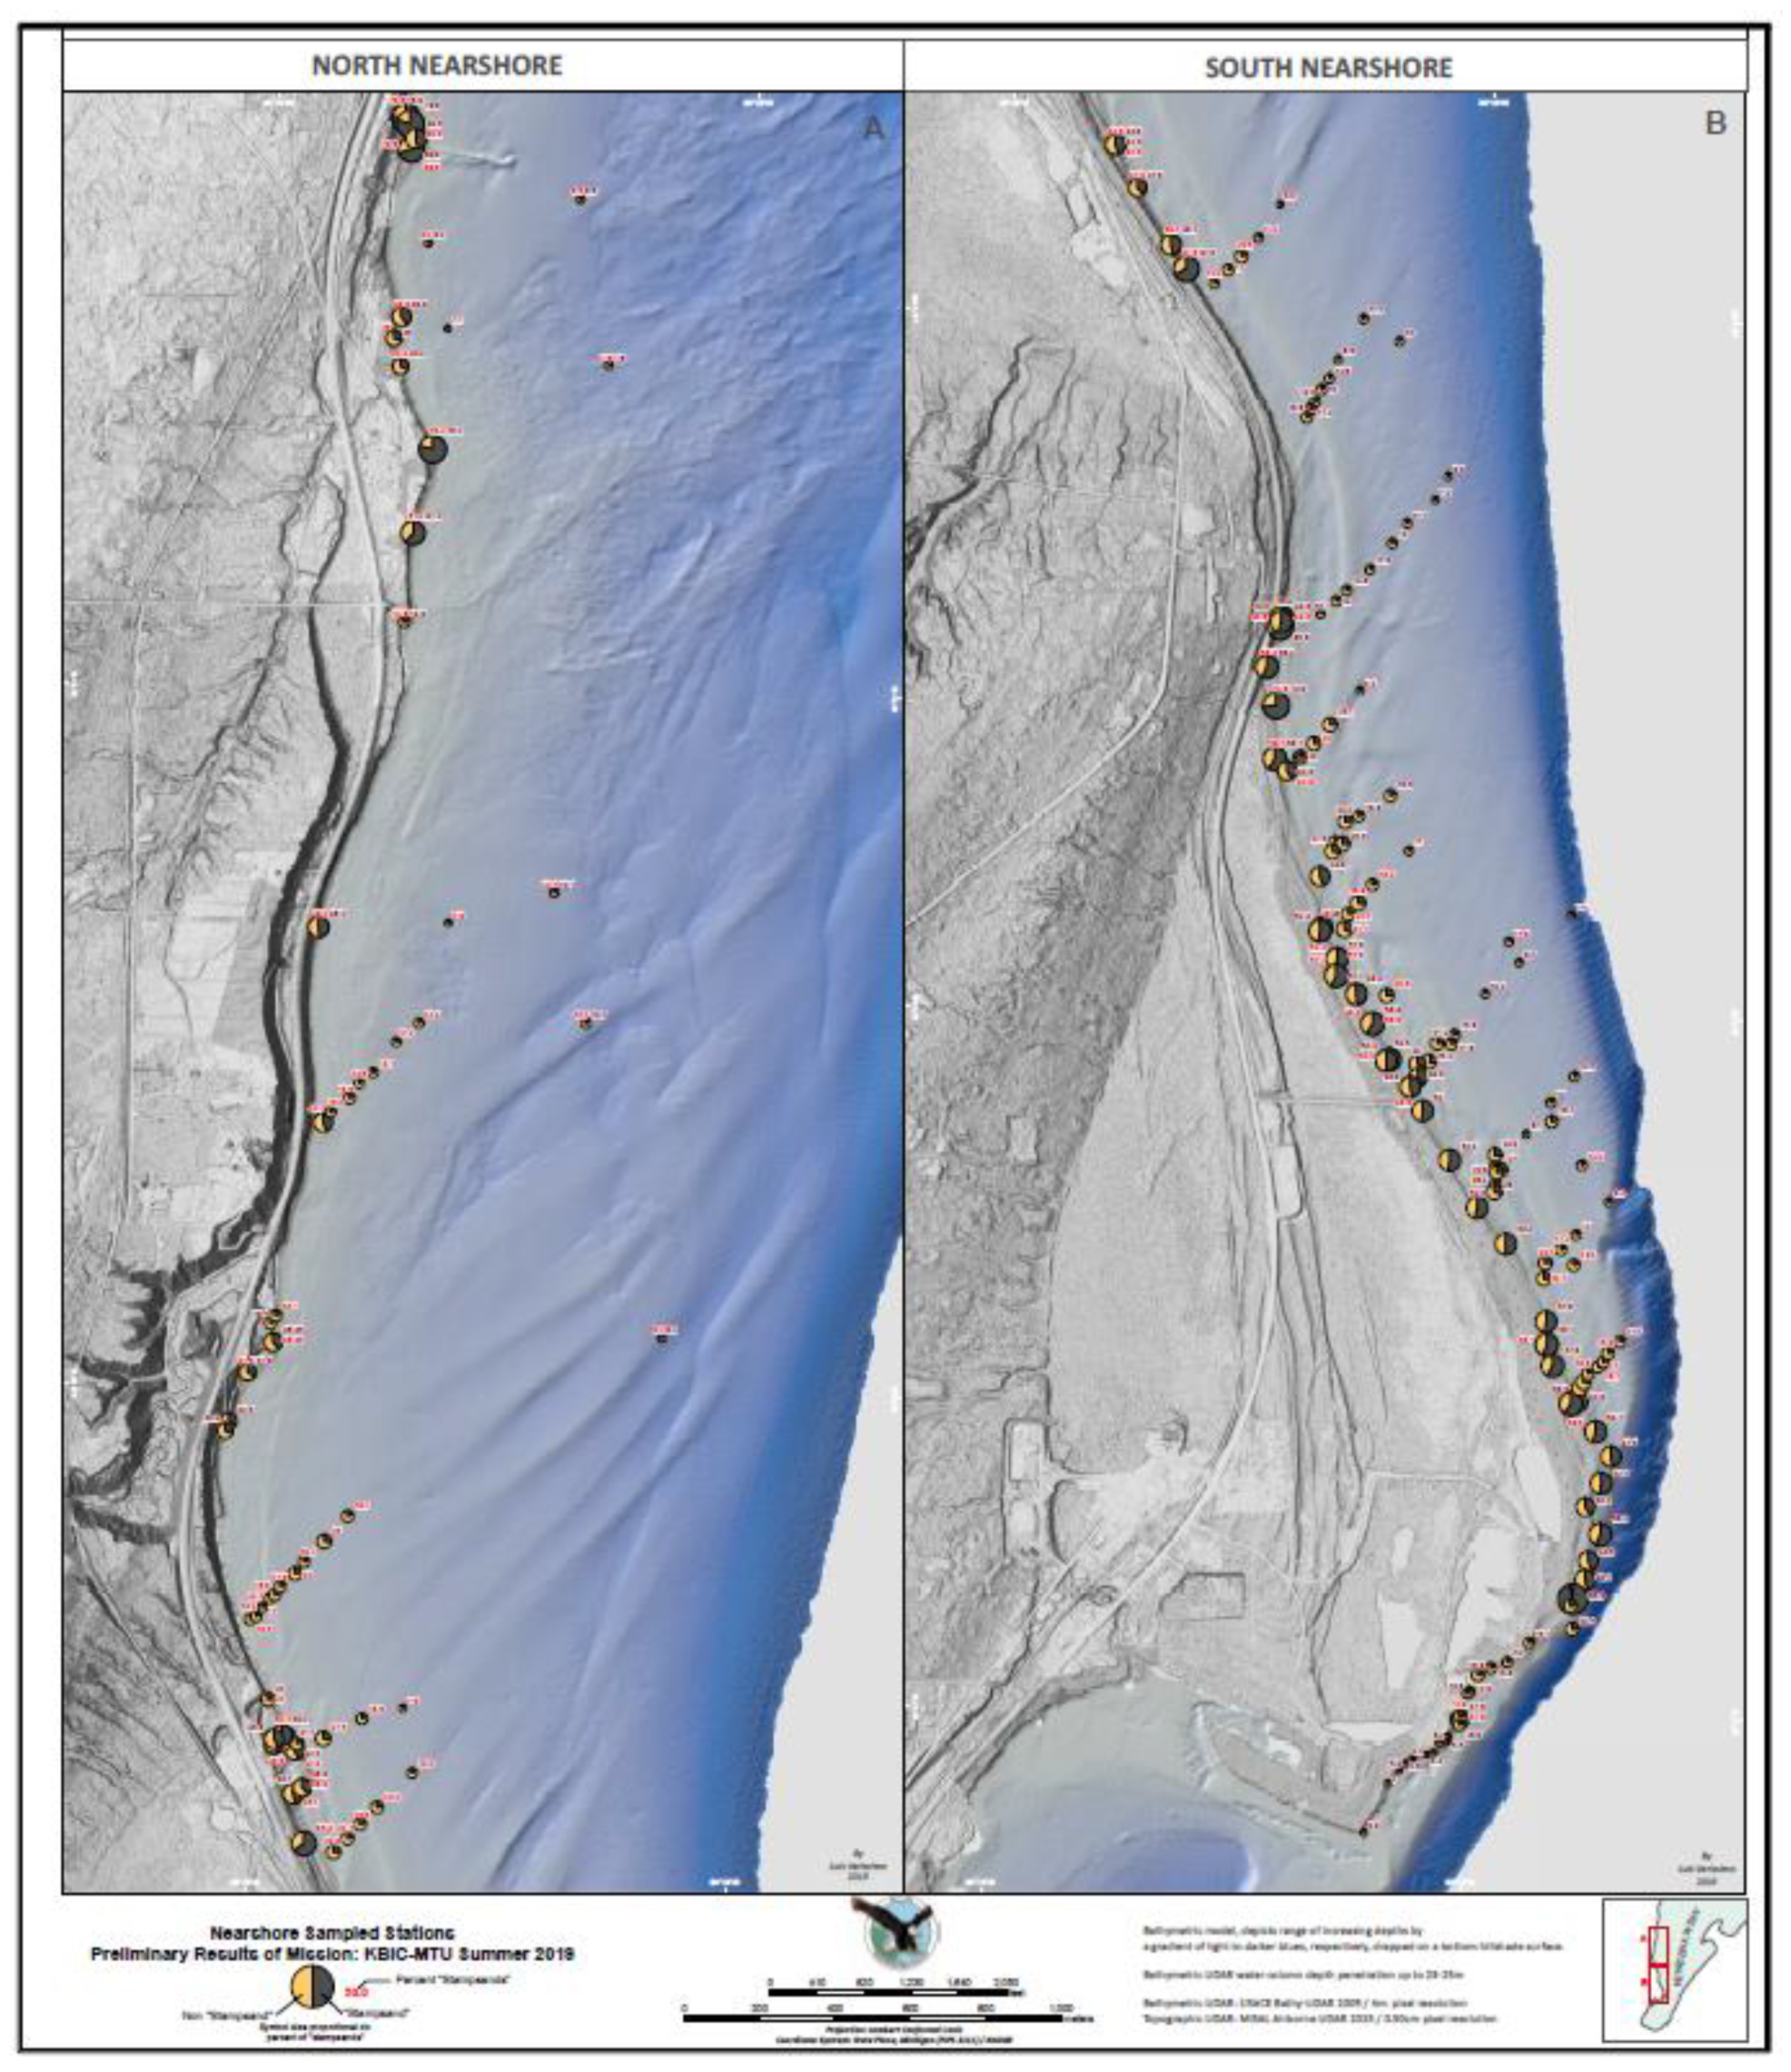
In June 2019, locations were identified for collection of side-scan sonar transects, seafloor videos (ROV), Ponar grab samples, and sediment cores. Seven shore-parallel transects off Keweenaw Bay, Assinins, and Sand Point were planned for side-scan sonar tows. Locations for videos from the ROV were planned to image specific bottom forms that were tentatively identified from LIDAR imagery and recorded with side-scan sonar. About 96 sites were identified for collection of sediment grab samples with the Ponar; sites were perpendicular transects either down the coast or along the side-scan sonar paths. Nine potential sediment core locations were identified but were to be confirmed based on the sediment type revealed by Ponar samples (see Results). Following completion of sampling of these planned sites, an additional 44 sites for Ponar samples were selected to fill the gaps in the original sampling plan during 2020–2021.
On 25 and 26 June 2019, side-scan sonar imagery was collected using MTU’s RV Agassiz. On 6/25, the three northern transects off of Keweenaw Bay were imaged. On 6/26, the three transects along Sand Point and the middle transect off Assinins were traversed and successfully imaged. On 6/27, an ROV with a high-resolution video was deployed from MTU’s RV Osprey at three locations.
Sediment cores were retrieved from four sites off of Sand Point on 26 June 2019 using the RV Agassiz. A KB-style gravity corer was used with 4.6-cm inner diameter polyethylene core liners. Cores were capped onboard, and descriptions based on visual examinations were recorded. Cores were X-rayed at Portage Hospital on 16 July 2019 to reveal laminations before being extruded individually and sliced into 1 cm increments. One-half of each increment was dried (60 °C overnight), ground (mortar and pestle), and analyzed for loss on ignition (3 h at 550 °C). The other half of each increment was bagged and refrigerated. Grab samples of surface sediments were retrieved on 27 June 2019 using a Ponar onboard the RV Osprey. A total of 56 samples were retrieved with about five stations sampled on each of eight shore-oblique transects and additional samples taken from along the side-scan sonar transects. Samples were bagged onboard and refrigerated until analyses of sediment grain size (sieve analysis) and counting of percentage stamp sands were made.
Extrusion and measurements of bulk density, porosity, loss-on-ignition, X-ray profiles, copper, and mercury were completed in summer 2019 for all cores collected in 2018. For both sediment core and Ponar grab samples, sediments were first dried to a constant weight at 60 °C. Microwave digestion of 0.1–0.5 g samples in 10 mL of concentrated HNO3 followed EPA Method 3051A. Digested samples were filtered through 0.4-μm Nuclepore membrane filters, diluted to 30–40 mL total volume with ultra-pure water, and stored in acid-washed polyethylene bottles. Samples were analyzed for copper by flame atomic absorption spectrophotometry (FAAS). Quality Assurance measures included digestion blanks, duplicate samples, sample spikes (250 μg Cu added as 250 μL of 1000 ppm Cu AAS standard), and certified standards (PACS-3 Marine Sediment from NRC Canada, NIST 2702 Inorganics in Marine Sediments). Fully 20% of digestions consisted of QA samples (5% of each category).

3. Results

3.1. Stamp Sand Beach Migration

Side-by-side aerial photos in Figure 7 (North Sheet) compare a 1938 image of the coastline with a modern-day 2018 image. The coastline stretches from the Mass Mill location on the north to Assinins. The Mass Mill stamp sand discharges were an 18-year (1902–1919) massive point release of particles with two fractions. The fine fraction (slime clay; 10–17% of mass; [32,33]) dispersed widely and rapidly, whereas dispersal of the coarse fraction (sand; 83–90% of mass) was slower and followed the path of natural shoreline sand erosion, migrating down to and adding onto Sand Point [18]. On the 1938 aerial image, we see scattered houses around the former town of “Keweenaw Bay Community”, a working railway, several small roads, and a minor highway (M-15). A large triangular wedge of stamp sand lies against the northern side of the “Old Coal Dock”. The coal dock stamp sand beach diminished with time, leaving only a slight bulge in 2018. By 1938, the stamp sands have migrated halfway down to Sand Point as an extensive grey beach with a width of 50–100 m and are near Assinins (Figure 7).
Aerial photos in Figure 8 provide more details about the northern coal dock stamp sand beach remnant through time (1962, 1968, and 1986). The large wedge dwindles down to a small triangular bulge at the base of the dock. Over a span of 40 years, the wide stamp sand beach, similar to one at Gay to the north [36,37], was an anomaly that momentarily protected the nearby cliff and coast from wave erosion. Recently, there has been great concern about enhanced, or more appropriately, resumed, coastal erosion threatening Highway #41, the large highway in Figure 7 (2018) and a scenic heritage route. The recent erosion is evident in comparisons of the 1960s with the 1986 cliff edge. Cliff erosion [38] resulted in the relocation of Highway #41 some 30 m inland, at a cost of $2.3 million, near the Mass Mill site in 2010. The 1938 coastline image (Figure 7, left), shows that a wide southern band of stamp sand formed a beach deposit stretching from the Mass Mill site halfway down to Sand Point. In the 2018 image (Figure 7, right), the upper coastal regions have now reverted to rocky coastline with only a few remnants of stamp sand.
Details of the stamp sand beach movement down to, and onto, Sand Point are presented in Figure 9. Original quartz sand beaches are indicated by yellow, whereas migrating stamp sand beaches are indicated by red shading. The original shoreline stretch was lined with majestic Jacobsville Sandstone bluffs, lower Jacobsville Sandstone outcrops, sand beaches, and thin overlying glacial till, plus a few stream outlets, producing a natural beach stretch down to Assinins and Sand Point. In the 1998 image, stamp sands have a narrow beach at Assinins, which broadens to border most of Sand Point. On Sand Point, stamp sands lay over the original shallow shelf and original narrow white beach (1938–1951), creating a much more extensive dark grey beach (1968–1998). Moreover, stamp sand encroaches into a wetland region and creates a new pond complex. The outer shoreline margin of the stamp sand beach shows occasional collapse, producing slope furrows. The stamp sand beach has also crept up to and into the second pond inlet, just north of the Sand Point Lighthouse (LH; 1938).
By 1998, there were only scattered remnants of the stamp sand beach left north of Assinins. During migration, an important point is that the migrating beach stamp sands incorporated substantial coastal natural sand, arriving at Sand Point in the late 1950s to early 1960s (Figure 9). Stamp sands continued to add onto Sand Point, creating the new pond complex by 1981, and doubling the original width of the beach deposit by 1998. Along the southern shoreline, there is now additional concern about coastal erosion (Figure 9). Highway #41 appears to run within only a few meters of the water’s edge and is subject to flooding from high waves.
Between 2008 and 2018, there was only slight growth in the width of the Sand Point stamp sand beach, presumably because stamp sand losses began to match migration gains. Some sands were lost by periodic shoreline collapse into deeper waters, whereas other sands curled into the second pond on Sand Point, right before the Lighthouse. Slippage down the underwater slope into the deep offshore “Keweenaw Trough” (Supplementary Materials Figure S2) was originally forecast by the U.S. Army Corps of Engineers Detroit Office [39], leading to an initial “no action” judgment about the accumulation of stamp sand on Sand Point. However, our sequence of images documents an alternative: that most of the migrating sands now form a consolidated beach deposit on Sand Point that extends from the northern tip nearly to the Sand Point Lighthouse. One could argue that stamp sands have been added onto Sand Point, similar to the original accumulation of white quartz sands that originally made up the structure. Today, the stamp sands remain perched precariously along the shoreline of Sand Point. The beach sands on Sand Point include ca. 55% stamp sand (Figure 5, equivalent to ca. 1650 ppm copper), making leaching and Cu contamination along the shoreline an issue. To better quantify the distribution of stamp sand and associated copper concentrations, we conducted a series of intensive shoreline and offshore surveys around remnant patches and the southern continuous beach region.
We sampled the remnant and continuous stretches of stamp sand beaches with plastic spades, as well as conducting surveys of underwater sediments with Ponar grabs. The percentages of stamp sand at various north to south beach sites are shown from slightly north of the Old Coal Dock to the lee of Sand Point in Figure 10. Stamp sand percentages are low in beaches north of the Old Coal Dock, whereas they are highest at the Coal Dock (70–80%), in the remnant small triangular patch of dark grey beach sands at the base of the dock. Values decline in other remnant spots between the Old Coal Dock and Little Carp River, ranging between 50 to 20%, then increase slightly to 30–50% from Assinins to Sand Point. On Sand Point before the Lighthouse, stamp sand percentages appear similar, ranging between 40% to 60%, with a couple of spurious points. South of the Lighthouse along the white beach region to the lee side of Sand Point, there is a major decline from 50% stamp sand down to around only 5% stamp sand. Clearly, one of the major processes that distinguishes Mass Mill beaches from other larger mill sites is the active incorporation of natural sands that dilutes stamp sand concentrations.

3.2. Shoreline Recovery, Stamp Sand Percentages & Predicted Copper Concentrations

Here we utilize the LiDAR DEM in Figure 11 to document modern-day details of shoreline features, elevations, and corresponding shallow offshore underwater bathymetric surfaces (Coastal Shelf) from slightly north of the Mass Mill to Sand Point. We have superimposed surveys of percentage stamp sand upon the LiDAR topographic and bathymetry panorama. The first section (North Nearshore) stretches from slightly north of the Mass Mill site, where Jacobsville Sandstone bluffs dominate, down to the Little Carp River and Assinins. Currents and waves aided southward migration of the coarse stamp sand beach material, now leaving only a few lingering remnants of once pervasive stamp sand beaches, indicated by sampling locations. LiDAR DEMs aided construction of benthic substrate maps (Supplementary Materials Figure S3).
In recovery, immediately north of the Old Coal Dock site, modern impressive Jacobsville Sandstone bluffs contribute rocks to basal talus piles (Figure 12). The sandstone talus blocks are ground up and rounded by wave action into beach cobbles, pebbles, and sands. Just north of the Coal Dock site, naturally rounded pink and white pebbles cover the shoreline in a band from the cliff outcrops to the stamp sand remnants around the base of the Coal Dock. At the Coal Dock, the shoreline band of pink and white pebbles bends outwards around the remaining slight triangular wedge of stamp sands (Figure 13a). Both the size and dark area of pie diagrams indicate the percentage of stamp sand in the sand mixtures. A large, full dark circle signifies 100% stamp sand percentage (%SS), whereas a half circle indicates 50% SS. The first cluster of large circles is located at the base of the Coal Dock, where residual hillside stamp sand patches contain as much as 74–80% stamp sand (Figure 13a).
Today, the particle size distribution from what looks to be a remnant of the original stamp sands discharge stuck on the slope behind the Coal Dock (Figure 13a) ranges from above 5 mm to clay-sized particles. The percentage of stamp sands left at this hillside pile below the site of the original Assay (Laboratory) Office is the highest along the beach shoreline, above 70–80% (Figure 10; see Supplementary Materials Tables S1 and S2). When sieved (n = 3 subsamples), the particles fall into the following mean size classes: 5.3 mm mesh or above (4.3%), 3.0 mm (19.0%), 1.25 mm (41.5%), 0.38 mm (13.3%), 0.19 mm (13.5%), 0.09 mm (6.1%), and 0.05 mm (2.4%). Because the high levels of copper in stamp sands at the discharge site (70% SS × 0.3% Cu = 2100 ppm Cu) can adversely affect benthic organisms and aquatic food webs, there is a legitimate concern about contamination around remnant patches. Remains of the Old Coal Dock cribbing still stretch out from the shoreline into Keweenaw Bay (Figure 11 and Figure 13a), creating a nautical hazard. Because of the great fetch, severe waves batter offshore underwater surfaces near the Mass Mill site. Bottoms are dominated by bedrock and cobble/boulder fields (Figure 11 and Figure 13c). Hence, good Ponar sampling sites are few and scattered. Sand patches that are sampled indicate low percentages of stamp sand (<10%; Figure 11; Supplementary Materials Table S2). Along beach margins down to the Little Carp River, shoreline stamp sands are scarce. Offshore, there is a north–south transition from bedrock and boulder fields to large offshore sand bars and fields (Figure 11 and Figure 13d) that cover the Assinins shelf to the edge of the Keweenaw Trough. The migrating underwater natural sand fields and bars allow long offshore sediment surveys, and observations of substrates with ROV and side-scan sonar. Underwater observations aided the construction of a benthic substrate map (Supplementary Materials Figure S3).
Today, as one moves south from the Mass Mill site along the shoreline, 1–2 m elevated Jacobsville Sandstone outcrops produce boulder and pink cobble–pebble beaches that now cover the shorelines (Figure 13b). The percentages of stamp sand in surveys vary greatly, not only from north to south (Figure 10) but within remnant patches. Near the beach terrestrial side, stamp sand percentages generally range from 40 to 60%, but have lower amounts (20–30% SS) along the shoreline beach edges, marking active dilution by natural sands. LiDAR suggests that the submerged natural sand bars are inclined at a NE/SW angle of ca. 40–50°, forming a series of migrating long mounded fields or bars (Figure 11). Ponar surveys show that % SS declines rapidly from the beach stamp sand deposits across underwater sediments, as the stamp sand is mixed and diluted by the offshore natural sand beds (Figure 14). Along the Assinins Shelf, the percentage of stamp sand declines rapidly from 40% to 10% at 8 m depth. Thus, the modern continuous stamp sand beach region near the shoreline contains only a narrow strip of highly contaminated sands.
However, from Assinins onto Sand Point, there is still a continuous stretch of stamp sand beach. In the LiDAR DEM (Figure 11), notice that Highway #41 comes very close to the coastline at several spots, causing the USACE (U.S. Army Corps of Engineers) to temporarily armor the shorelines with concrete boulders and to construct fortifications (walls, revetments) to reduce shoreline erosion. On the Sand Point portion of the shoreline (Figure 11, South Nearshore), there is a large continuous dark grey stamp sand beach that stretches down to the Lighthouse, then a natural thin white quartz sand beach that curls around the corner into L’Anse Bay and the Baraga Marina region. Samples along the grey beach generally range from 40 to 60% stamp sand, with a mean % SS of ca. 55% (Figure 10 and Figure 11). Past the Lighthouse and along the white sand beach, samples start at 10–20% SS, whereas around the corner, the furthest are generally below 5–10% SS. The coastal shelf becomes a nearly vertical face right before the Lighthouse, with a 24 m drop-off along the beach edge. Past the Lighthouse and the underwater sill that marks the beginning of L’Anse Bay, the sediments are much more shallow, more organic, and filled with macrophyte beds and wood fragments from early sawmill activity [19]. Moreover, L’Anse Bay has a separate bay circulation pattern, plus more fine-grained sediments, a consequence of lower wave action plus sedimentation from several streams and a river (Six Mile, Menge, and Linden Creeks; Falls River). The 4–5 large ponds on Sand Point are surrounded by wetlands, now managed by the KBIC tribe (see Section 4).
Percentage stamp sand (% SS) values for beach and underwater Ponar samples are listed in Supplementary Materials Tables S1 and S2, by latitude and longitude. However, for each site, the % SS determination can be converted into predicted Cu concentrations by taking the % value × 0.3% Cu or ca. 3000 ppm Cu concentration (Figure 14b; Supplementary Materials Tables S1 and S2). In beach sand collections, Mn particle concentrations can be relatively high in some beach samples, but high values are localized and sporadic. In underwater samples, Mn particle concentrations are relatively low and can be used to correct Cu vs. depth plots (Figure 14c; Supplementary Materials Table S4).
Because of both low mass from the Mass Mill and widespread mixing with natural sand eroding from Jacobsville Sandstone Bluffs and till, predicted Cu concentrations decline rapidly out from the shoreline into shelf waters. Ranging as high as 2180 ppm on the beach (Supplementary Materials Tables S2 and S3), predicted Cu concentrations drop to 500 ppm at 2 m water depth, then fall below 200 ppm from 7 m depth outwards (Figure 14b,c). The distribution of stamp sands argues for strong biological effects from Cu, mainly along a narrow strip of coastal shoreline. Cu concentrations in beach stamp sand deposits are most important, because percentages of stamp sand range from 74% (near the Coal Dock) to ca. 55% on Sand Point (see Figure 10 and Supplementary Materials Table S1 for beach % stamp sand; Supplementary Materials Table S2 for underwater Ponar sample Stamp Sand Percentages and calculated Cu concentrations). Manganese-corrected values are in Supplementary Materials Table S4. Using the 3000 ppm predicted value for 100% stamp sands, 74% SS would translate into 2220 ppm, whereas 55% SS would give 1650 ppm Cu, i.e., relatively high values that are very likely to have copper contamination effects.

3.3. Directly Determined Copper Concentrations in Bay and Sediment Cores

Figure 15 shows a map of modern-day surface sediment Cu concentrations across southern Keweenaw Bay and into L’Anse Bay. Copper concentrations are highest in the Keweenaw Trough off of Mass Mill (400–600 ppm) and in the lee of Sand Point in L’Anse Bay (400–500 ppm). Maximum surface values in the Keweenaw Trough reduce toward the southern end, at the L’Anse Bay sill (300–400 ppm). In L’Anse Bay, sediment cores between Sand Point and the marina possess basal laminated sediments [18], apparently marking early penetration of the stamp sand fine clay fraction into L’Anse Bay. Copper concentrations peak deeper in the sediments (600–800 ppm), then reduce to around half the peak values (400 ppm) in surface sediments. The “fines” fraction thus appears to have dispersed early and rapidly, accumulating into the “Trough” region offshore and around the lee side of Sand Point, off the Marina.
In Figure 16, direct measurements of Cu concentrations are compared with “predicted” values from two different locations in Traverse Bay. Copper concentrations in sediment grab (Ponar) samples across Grand Traverse Bay (Buffalo Reef) range from 20 to 860 μg/g (ppm) and are regressed against “predicted” concentrations from the microscope particle counting technique (Figure 16a). The negative intercept for the linear curve (R2 = 0.785) might suggest that there are some false positives (perhaps manganese grains) in the counts. An exponential curve fit has a slightly higher R2 value (0.854), although both are statistically significant with a similar magnitude of prediction error (p < 0.05, RMSE 115 vs. 118). The intercept for the exponential curve is close to the “background” copper concentrations in Lake Superior sediments (37–77 μg/g, ppm; [13]). In Grand Traverse Bay (Gay) sites, the nonlinear regression correlation (r = 0.924) between observed Cu and “predicted” Cu is relatively high [36].
Nearshore sediments south of the Mass Mill in southern Traverse Bay showed a similar range of concentrations (2–1130 μg/g; Figure 16b). The linear model relating copper concentrations to stamp sand content also had a negative intercept. Unfortunately, the lack here of samples beyond 50% SS causes a problem. The nonrandom distribution of residuals suggests that the linear model is inaccurate. Again, the exponential model (Cu vs. % SS) has a higher and statistically more significant correlation, r = 0.867 vs. 0.668, than does the linear model (p = 0.00011 vs. 0.012). Copper concentrations were not measured in samples with stamp sand content greater than 40% because the sediments were too coarse (>1 mm mass median diameter, MMD) to be completely digested. The “background copper” in this region, taken as the intercept of the exponential curve (4.7 μg/g), is lower than that observed in the Buffalo Reef region. Although highly correlated, the observed concentrations are less than that predicted by the simple 0.3% Cu × % SS formula. At Gay, even more extensive recent cross comparisons (>168 samples, manuscript in preparation) suggest actual copper concentrations from beach and shelf samples are lower, around 65–80% of “predicted” values. This finding suggests that copper-rich particles probably had a tendency to stay near the original site of deposition and that most clay fractions were winnowed out into deep waters, or drifted around Sand Point, i.e., that there is some spatial heterogeneity in particle distribution that influences Cu concentrations. In any event, the results confirm that Cu concentrations remain relatively high in stamp sand beach deposits and in at least two shelf locations (Trough off Mass Mill, lee of Sand Point off the Baraga Marina).
Many of the measured copper concentrations represent toxic conditions for sediment organisms. The sediment copper concentration at which sensitive organisms first show toxicity, the threshold effects level (TEL or TEC), ranging from 16 to 70 μg/g, and the concentration at which biotic effects are probable (PEL or PEC) ranges from 36 to 390 μg/g [40,41]. Figure 15 indicates that locations with more than 30–40% stamp sands are likely to experience toxic conditions for sediment biota. As illustrated earlier, a narrow strip along the coastline from the Mass Mill site to Sand Point would definitely experience such toxic effects. However, unlike marine systems, the Great Lakes have no intertidal zone with enriched abundance or diversity of organisms. Juvenile fish and benthic macroinvertebrates generally are in maximum abundance at water depths of 30–100 m in Lake Superior [42,43,44]. Because the depth of the highest benthic invertebrate biomass varies with wind fetch, there is a need to map invertebrate densities and juvenile fish abundance in the lower regions of Keweenaw Bay. Mapping of benthic diversity and seining of YOY fish along Grand Traverse Bay (Buffalo Reef, Gay) shorelines have demonstrated severe depression of both groups where stamp sand concentrations are high [36,37]. This will be reviewed in more detail in the Discussion.
Core profiles taken from the Keweenaw Trough and L’Anse Bay (Figure 17) show buried peaks and elevated surface Cu concentrations. Buried peaks range from 300 to 700 μg/g (ppm) Cu in the southern Trough region, whereas buried peaks in L’Anse Bay cores range from 600 to 850 μg/g Cu concentrations. The core depth differences off the Marina and center (24 cm vs. 15 cm), are likely a result of different site sediment deposition rates, as the relative Cu profiles are very similar. Laminae in the core profile in the lee of Sand Point suggest that a portion of the slime clay fraction arrived early into L’Anse Bay, possibly between 1902–1920. Core profiles show a few large stamp sand particles arriving later, around the 1950s to 1960s, similar times as indicated by aerial photographic records of the stamp sand beach arrival on Sand Point [18]. Both sets of cores indicate elevated copper concentrations in surface sediments, although concentrations have reduced about 50% or more from the buried peaks, indicating recovery is also underway in the southern part of the bay. However, in L’Anse Bay, all but one measured surface copper concentration exceeded the TEC (34–37 μg/g), and 75% were above the Probable Effects Concentration (PEC 36–390 μg/g; [40,41]). If copper fluxes and inventories are calculated for L’Anse Bay cores, and compared with other sites (Table 2), the mining Mass Mill discharge is placed into better perspective. A comparison of L’Anse Bay with Portage Lake (part of the Super Fund Site) shows that L’Anse Bay Cu fluxes are only 57% and inventories only 31% of one of the most disturbed sites, Portage Lake. Moreover, copper inventories are well above (13 times) the inventory characteristic of offshore Lake Superior (Figure 1), although only 31% of the Portage Lake inventory. Even after a century, large areas of southern Traverse Bay and L’Anse Bay contain copper concentrations that can affect biota.
Moreover, stamp sands include a secondary suite of metals along with high copper concentrations. ICP analysis of multiple elements from a core in L’Anse Bay see [18], showed correlated peaks of several metals (Fe, Mn, Ni, V, Zn, Pb, Cd) routinely found in amygdaloid-derived stamp sands. All these metals show maximum peaks that are highly correlated with the buried Cu peak. The patterns are expected if the fine clay fraction of the Mass Mill stamp sand discharges moved early into L’Anse Bay. In the associated suite of metals found with Cu concentrations, we have measured mercury (Hg) concentrations extensively because of this element’s ability to bioaccumulate, and because high sediment concentrations occur in nearby Torch and Portage Lakes (Torch Lake Superfund Site). Mercury concentrations are significantly correlated with Cu concentrations in southern Keweenaw Bay (r = 0.780 [8,18], but range from background values around 20 µg/kg (ppb) to only 200 µg/kg at peak levels or just above the Threshold Effects Concentration (TEC, 170–180 µg/kg; [40,41]). The primary difference between L’Anse Bay and the Superfund (Torch/Portage Lake) regions is probably related to smelter discharges, as the Hg forms a natural amalgam with copper and silver and is released during smelting [12,13]. Recall that Mass Mill sent its concentrates to Portage Lake smelters away from Traverse Bay. There were no smelters around the southern Traverse Bay region (Baraga, L’Anse), and this helps explain the relatively low local levels of Hg.

4. Discussion

4.1. Tailings Dispersal, Contamination Concerns, Differences between Stamp Sand Beaches and Natural Beaches

Over the globe, tailings account for 99.9% of processed material in gold production, 99% in copper production, and 60% percent in iron production. Most companies dispose of tailings in big open pits behind dams. In comparison, as of 2015, 16 of 1950 mines worldwide in eight countries practiced coastal discharge, including Chile, Indonesia, Norway, and Turkey [45,46]. Moreover, in copper production, when crushing is used, 1.0% Cu by weight is the minimum grade for exploitation, yet tailings often contain 0.1–0.3% Cu, equivalent to 1000–3000 ppm. Even in Chile, which produces the greatest amount of copper, researchers are unaware of the full scope of the negative consequences when mine tailings are dumped into coastal sites or at sea [47,48]. In Chile, around 603 mine tailings sites were reported in 2015, of which 215 were active, with the rest abandoned waste. In the Chanaral region, metal levels were elevated in residents of a nearby coastal city 31 years after dumping, presumably via contaminated seafood ingestion [49], although another site experienced contamination of indigenous villages through wind-blown dust deposition [50]. In Spain and the Mediterranean coast, tailings from acid mine drainage spread spatially and temporally along coastlines, reducing biodiversity as metals accumulated through food webs and into fish [51]. In the Keweenaw, similar circumstances are found in amygdaloid copper tailing deposits. Minimum concentrations in ore were around 2.0–1.0% Cu by weight, yet stamp sand tailings contained between 0.2–0.3% Cu by weight. Hence 10–20% of the Cu in ore was lost in tailings, similar to international loses, and relatively inefficient. Moreover, Cu concentrations were relatively high in tailings, between 2000 and 3000 ppm, way above TEC and PEL levels for aquatic organisms and ecosystems.
The issue of coastal disposal is emerging as a great concern for oceanography. Recent reviews include a report titled “International Assessment of Marine and River Disposal of Mine Tailings” by Vogt [11], commissioned by the International Maritime Organization and the United Nations Environmental Program, Global Program of Action. Vogt called for more detailed studies of tailings spread over time and the effects on resident organisms. He and others want more examples of risk assessment and studies of ecotoxicological interactions [45,47]. Moreover, in addition to legacy examples of tailing discharges, unintentional discharge often involves tailing dam failures worldwide [52,53]. An estimated 3500 mine tailing impoundments/dams exist worldwide [11]. Globally, there are around 2–4 failures a year, often with catastrophic results (e.g., the “Aznalcollar Disaster”, Guadalquivir Estuary, Spain [54]; the “Marcopper Mining Disaster”, Calancan Bay, Philippines [55]; and the Mount Polley Spill”, Likely Fjord, Canada [56]; Table 1). At Elliot Lake, north of Lake Huron, Canada, more than 30 tailing reservoir failures at 14 uranium mining operations prompted the International Joint Commission to describe the drainage system as a major source of radium contamination in the Great Lakes [57]. The region contains nearly 165 MMT of heavy metal-laced tailings, seriously impacting First Nation tribes.
In Traverse Bay of the Keweenaw Peninsula, stamp sands had a specific gravity around 2.88 (g/cm3), close to basalt (2.9 g/cm3), whereas natural beach sand was slightly lighter with a specific gravity around 2.55 g/cm3, close to quartz (2.65 g/cm3). That is, both grain types (basalt and quartz) were silicates, of similar density and size. Stamp sands were slightly heavier than natural sands, and were originally flattened and crushed. Coastal waves sorted both particle types into roughly similar size distributions, although the stamp sand particles averaged slightly larger than the natural sand (Figure 5; Supplementary Materials Table S3). Once discharged, the fine fraction (slime clay portion) dispersed widely across Traverse Bay and into L’Anse Bay, covering over 50 km
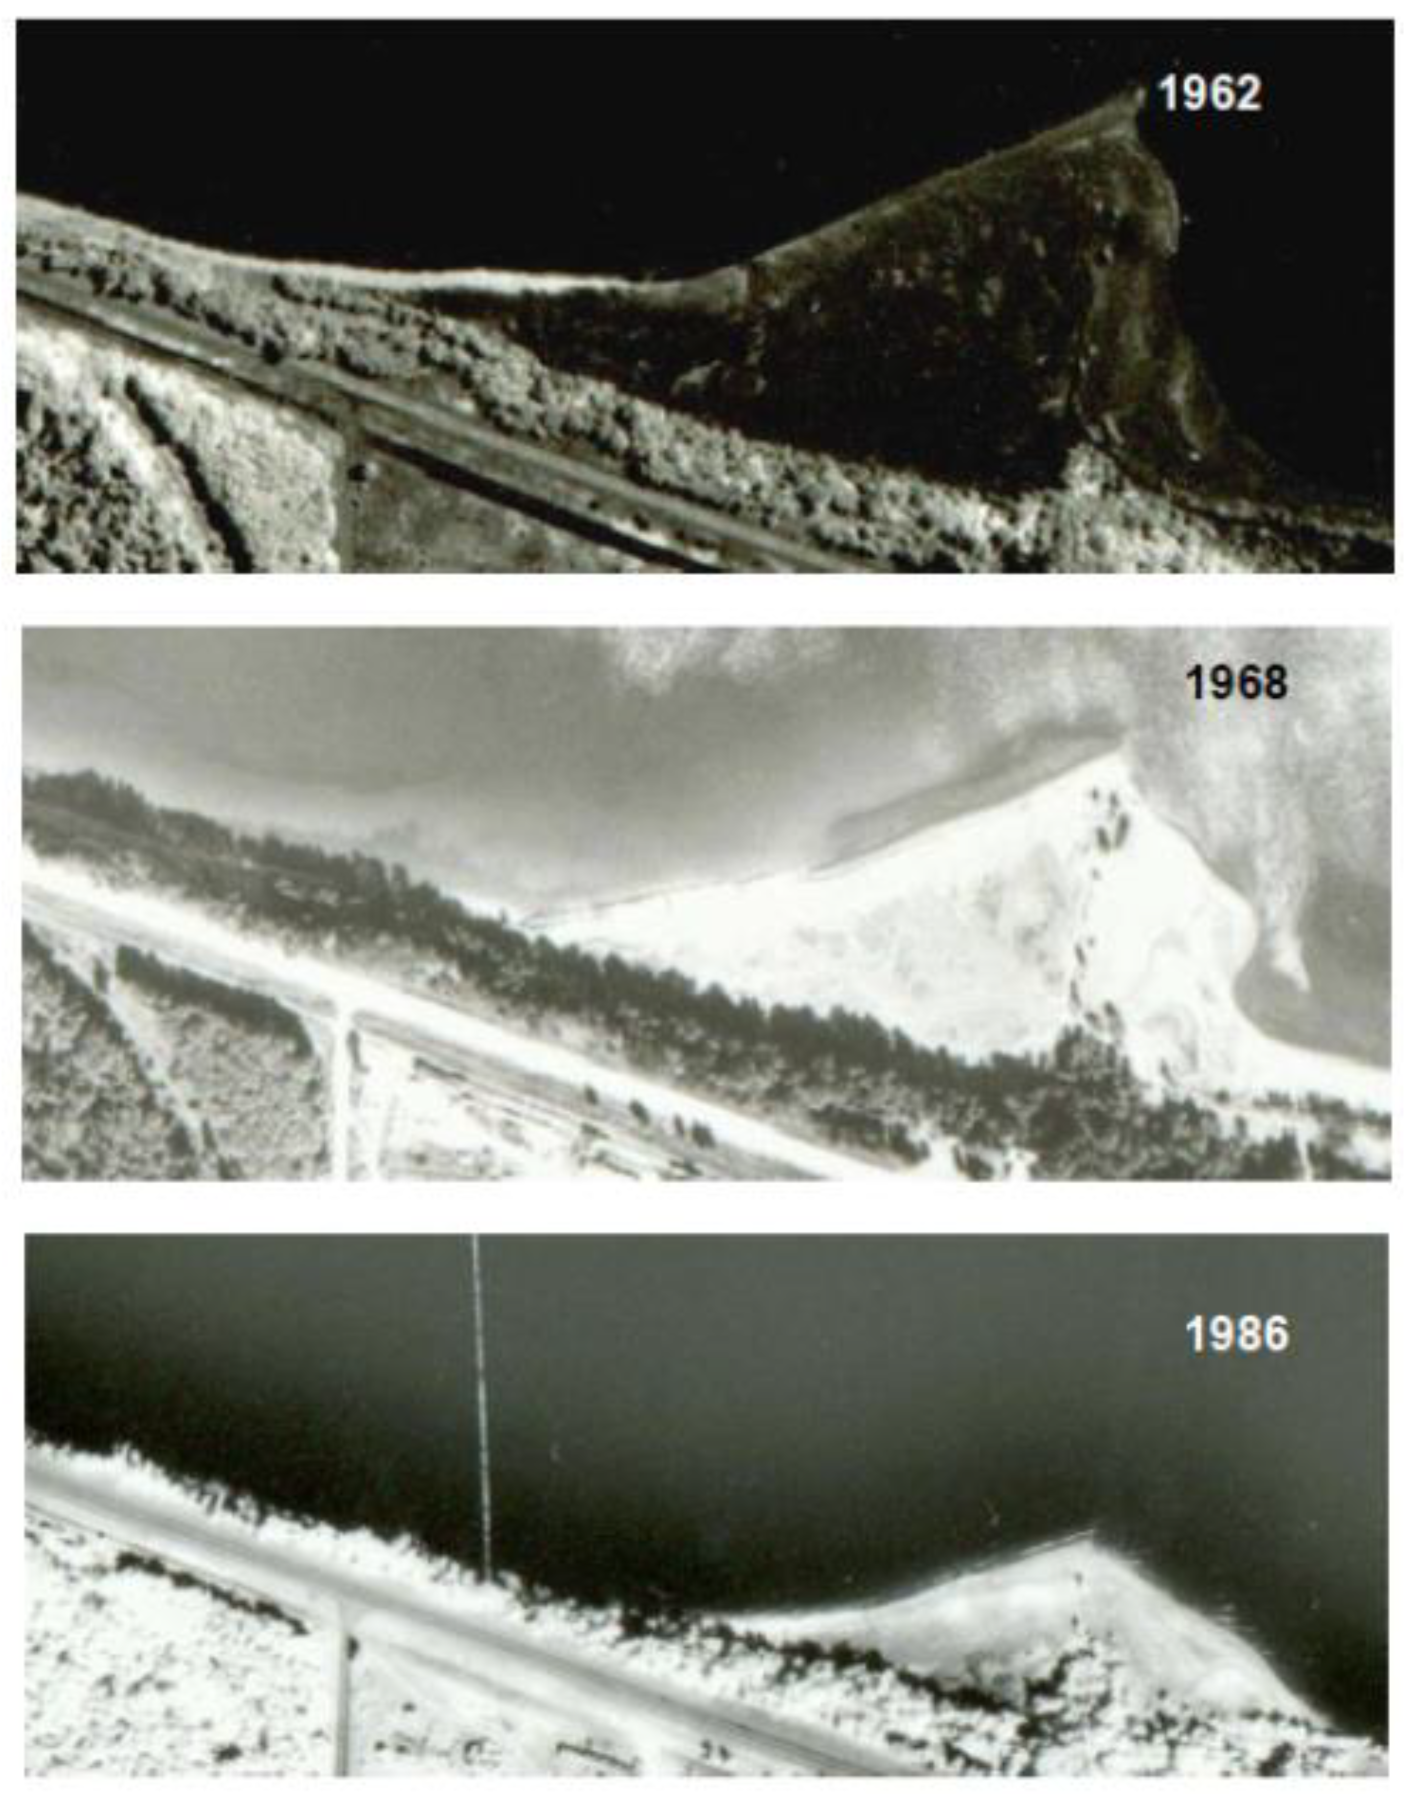
2. However, under prevailing wave and current directions, the coarser sand-sized fraction migrated southward as a beach deposit, traveling over 7 km from the source, taking 30–40 years to reach Sand Point (Figure 9).
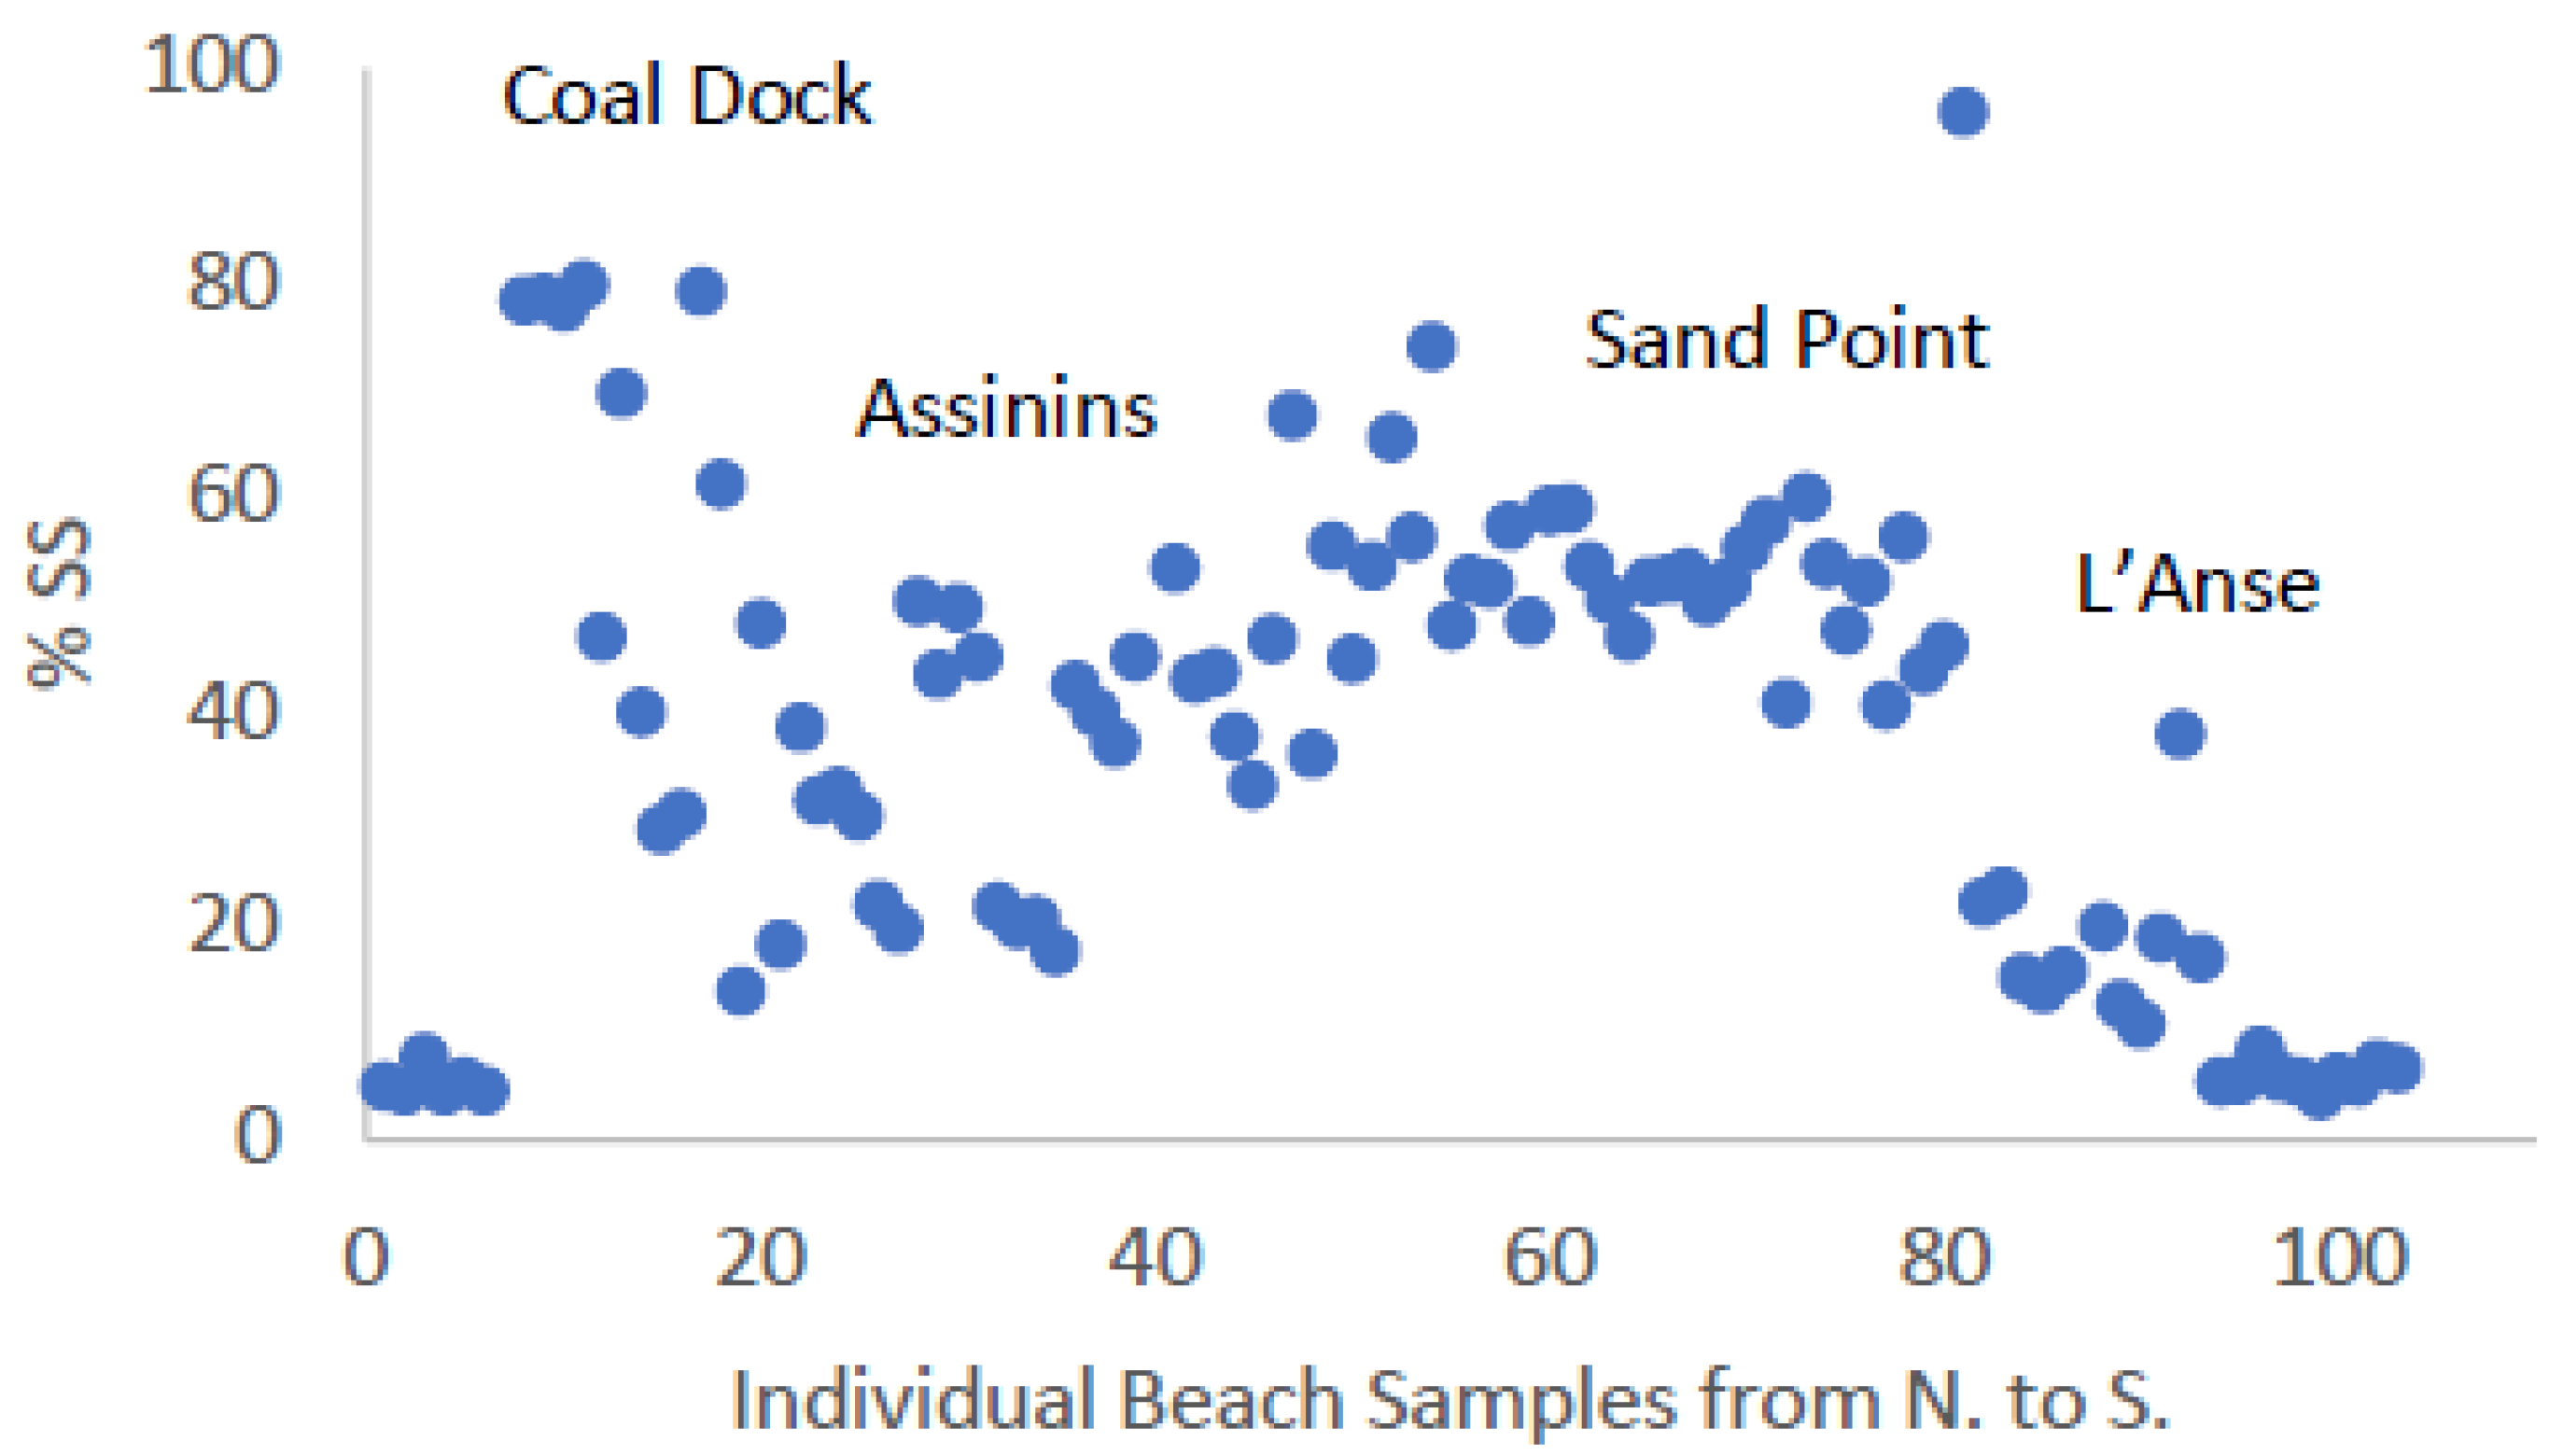
Despite only vestiges of stamp sand beach along the northern coastline, stamp sand percentages in some residual pockets, such as at the Mass Mill hillside, still record 70–80% stamp sand. Even at scattered locations between Mass Mill and Assinins, mixtures reach 40–60% stamp sand. The isolated pockets are heterogeneous, as inner margins are dark, representing original stamp sands from the major migrating mass, whereas shoreline margins are lighter, often with stamp sand percentages declining to 22–32% at edges. Fortunately, shoreline edge dilution indicates incorporation of natural sand. Neighboring underwater sand bars contain much lower stamp sand percentages, around 27–11.4%, again suggesting natural sand dilution. Ponar transects across the wide Assinins shelf document stamp sand percentages below 10%. However, high % SS in most coastal remnant patches and along the continuous Assinins to Sand Point beaches remain above accepted copper contaminant levels.
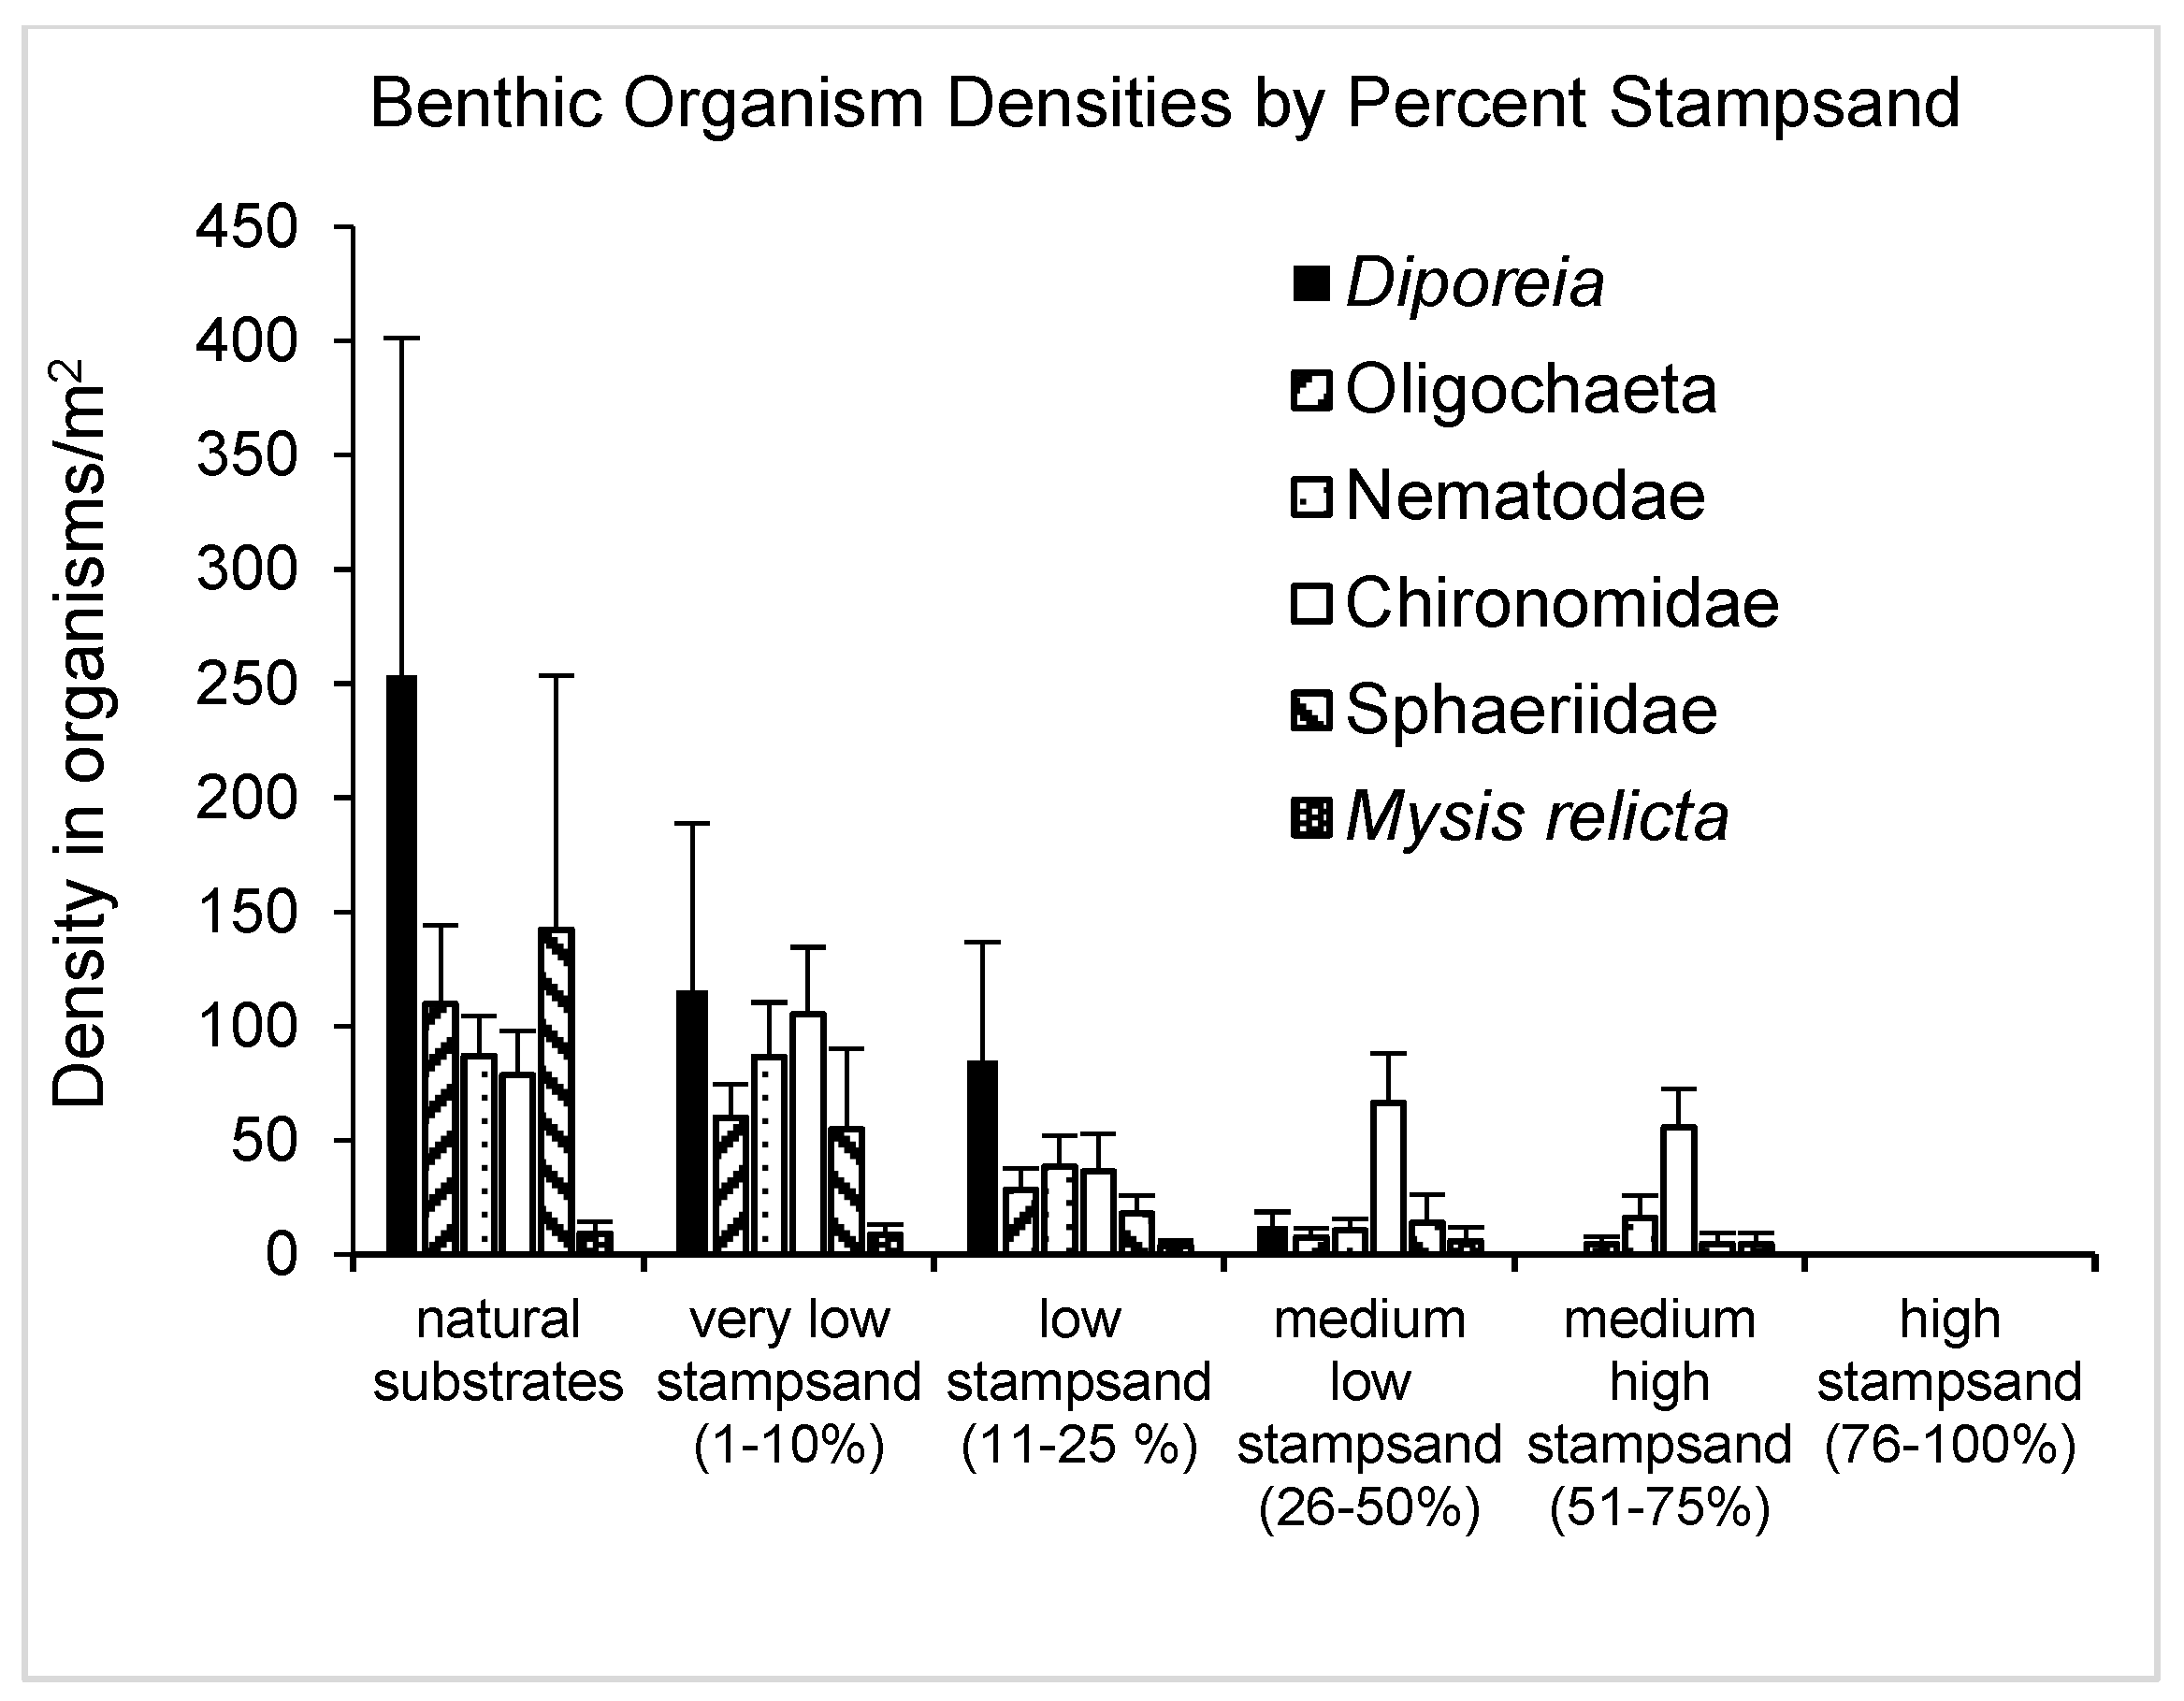
Agency TEC (170–180 µg/g or ppm) and PEL (36–390 µg/g or ppm) levels for Cu raise concerns about contamination at three principal sites in lower Traverse Bay: stamp sand beach deposits, Keweenaw Trough deep sediments, and sediments in the lee of Sand Point near the Baraga Marina. From measurements at Buffalo Reef (Buffalo Reef Project, Big Traverse Bay; [34,36]), responses of benthic taxa to stamp sand concentrations are nonlinear (Figure 18). Levels above 20–30% stamp sand strongly depress benthic biota densities, whereas levels above 50–70% stamp sand eliminate most taxa. Moreover, YOY fishes off the Gay (Buffalo Reef) stamp sand beaches (>80–90% stamp sand) are almost nonexistent, whereas six taxa are found off of natural sand beaches [34,36]. Although benthic and YOY fish surveys have not been surveyed in detail over the lower Traverse Bay region, we expect that we will find similar patterns to those discovered to the north in Grand Traverse Bay.
Details of beach profiles for stamp sands differ from normal quartz sand beaches. Stamp sand beaches are wider and higher, with deeper waters in the swash zone, whereas natural quartz sand beach edges are less elevated and possess intricate shallow circular structures with “cusps” and an underwater berm offshore (see LiDAR DEMs, [34,36]). Waves break further offshore in natural beaches, off the berms, whereas wave action can be severe off stamp sand beaches. LiDAR contours in Grand Traverse Bay show the differences between the two types of beach contours [28,34]. Although residents believe the greater width of stamp sand beaches creates greater protection from waves under high-water conditions, practical experience in Grand (Big) Traverse Bay argues otherwise. A severe storm of 17 October 2017 in Grand (Big) Traverse Bay threw stamp sands across cottage lots in the bay and across remediated regions of Sand Point [18,34]. In contrast, lots fronted by natural beach in Grand Traverse Bay received relatively little damage because waves broke offshore on the natural shallow underwater berm. On Sand Point, stamp sands were thrown over previously remediated sections, at some locations burying previous surfaces to a depth of 2–3 feet. Although we showed evidence for coastal erosion protection near the Mass Mill site, those effects were transitory.
Which variables—(1) the higher particle density, (2) the fragmented and flattened grain nature, or (3) the accompanying mineral heterogeneity—account for the greater height and cohesiveness of stamp sand beaches is unknown at present, as we have not conducted wave tank experiments. However, stamp sands contain calcium carbonate, which can dissolve and remineralize, creating malachite (copper carbonate; a green mineral). Malachite and CaCO3 may help cement stamp sand particles together.

4.2. Treaty Interpretations & Tribal Rights

The United Nations (Declaration On The Rights Of Indigenous Peoples) states: “The rights to lands, territories and resources are at the heart of Indigenous Peoples’ struggles around the world. Indigenous Peoples’ relationships to ancestral lands are the source of cultural, spiritual and social identity, and form the basis of their traditional knowledge systems. There is an urgent need to advance these rights to improve Indigenous Peoples’ well-being but also to address some of the most pressing global challenges, including climate change and environmental degradation. Advancing rights to lands, territories and resources is also an effective way to protect critical ecosystems, waterways and biological diversity”. Recently, several articles have stressed that indigenous knowledge should be a component of effective impact assessment reports [58,59]. Because of valuable natural experience, indigenous knowledge of ecosystems is highly relevant; moreover, incorporation contributes to stakeholder engagement and public participation.
An estimated 1000–5000 pits up to 10 m deep on the Keweenaw Peninsula and Isle Royale documented ancient copper mining [60,61,62]. Moreover, the pits guided early successful explorations in the Keweenaw “Copper Mining Rush”, including the South Range mines (Minesota [sic] & Mass Mines; [63,64]). Pit charcoal dates back to ca. 4000 years ago [64]. Recent lake sediment cores from Isle Royale and the Keweenaw contain Cu and Pb spikes that suggest early pit working ca. 5400–6500 years ago [65,66]. Stratigraphic records from pit material include dates between 4000 to 1500 years ago [67]. One major question often raised is which tribes worked the early pits? It is known that Ojibwe/Chippewa copper trading continued into the 1500’s, until European colonization. Furthermore, Europeans were initially told of the copper deposits by Ojibwe/Chippewa Indians in the early 16th–17th centuries. Copper artifacts from pits have been dated to as recently as 1470 yr B.P. [68].
There is evidence from the diversity of copper implements that Algonquian Indians worked copper deposits for hundreds to thousands of years [69,70]. Recent findings at Ojibwe Hopewell Culture burial mounds, 2000 years old, confirm active expeditions to Lake Superior for native copper and exchange among extensive North American trading networks. In the Ojibwe Hopewell scrolls, there is a lore about copper that is very relevant. The Hopewell Culture National Historical Park states: “The metal is associated with Mishippeshu, the great lynx or water panther, the protector of copper. In the Ojibwe oral tradition, the great lynx is a powerful dragon-like animal with a feline face and paws, its deer-like horns are made of copper, and its body is covered with scales and dagger-like spikes running down its back and long copper tail. This being has the power to create storms and drown humans. Mishipeshu must be revered through offerings so that one may pass safely along the waters of Lake Superior and acquire its precious metal, copper”.
The Hopewell Culture in the Scioto River Valley of Ohio left burial mounds filled with copper artifacts (beautiful earspoons, headdresses, buttons, tinkers-i.e., rattle-like ornaments, axes, plates, falcon effigies). Moreover, the journey to Lake Superior was distant, around 600–800 km. The tales offer a solution to the dilemma of how mining pits could be so abundant on the Keweenaw and Isle Royale without evidence of numerous local tribal settlements. Many tribal sites throughout the extensive trading network sent warriors across Lake Superior to work the copper locations and then most returned with their treasure. The reference in Whittlesey’s (1863) account, which includes a “Chippeway” (sic) chief saying tribal members visited Isle Royale for copper, now gains additional credence. Historic Ojibwe/Chippewa tribes continued to view copper as a sacred metal with spiritual powers, and dispatched warriors from scattered locations to gather the metal.
The mining region discussed in this report lies on land ceded under the La Pointe Treaty of 1842 (Supplementary Materials Figure S1). There is considerable dispute about how both parties in the agreement understood the use of the term “territory”, whether the treaty involved “cessation” of lands, or merely “sharing” of lands. In Chosa’s essay “Native American History of Keweenaw Bay” [71], a member of the Ojibwe Tribe in 1854 discusses tensions associated with loss of land: “This [loss of land] is due to the fact that large portions of land have been supposedly sold but the tribe contends that these deals were made without their knowledge and further, that they never have received any compensation for this land. We knew not that we were giving so much for so little. We did not know that such great treasures of copper were hidden in our land. The white men have grown rich by the bargain”.
How close the Ojibwe tribe came to receiving compensation is an intriguing tale [72]. Gouverneur Kemble, a New York foundry owner and Democratic Congressman, wrote to President Van Buren’s Secretary of War, Joel R. Poinsett, recommending employing Chippewa men instead of whites as mine workers and paying the Indians a percentage of the money earned from the copper mining. But Commissioner of Indian Affairs T. Hartley Crawford, who served both the Van Buren and Harrison–Tyler administrations, flatly rejected Kemble’s plan of joint Ojibwe/Chippewa and Native American involvement in Lake Superior mining efforts because it would have perpetuated Ojibwe/Chippewa ownership of the southern shore mineral resources [73].

4.3. Concern about Environmental Effects; Remediation Efforts

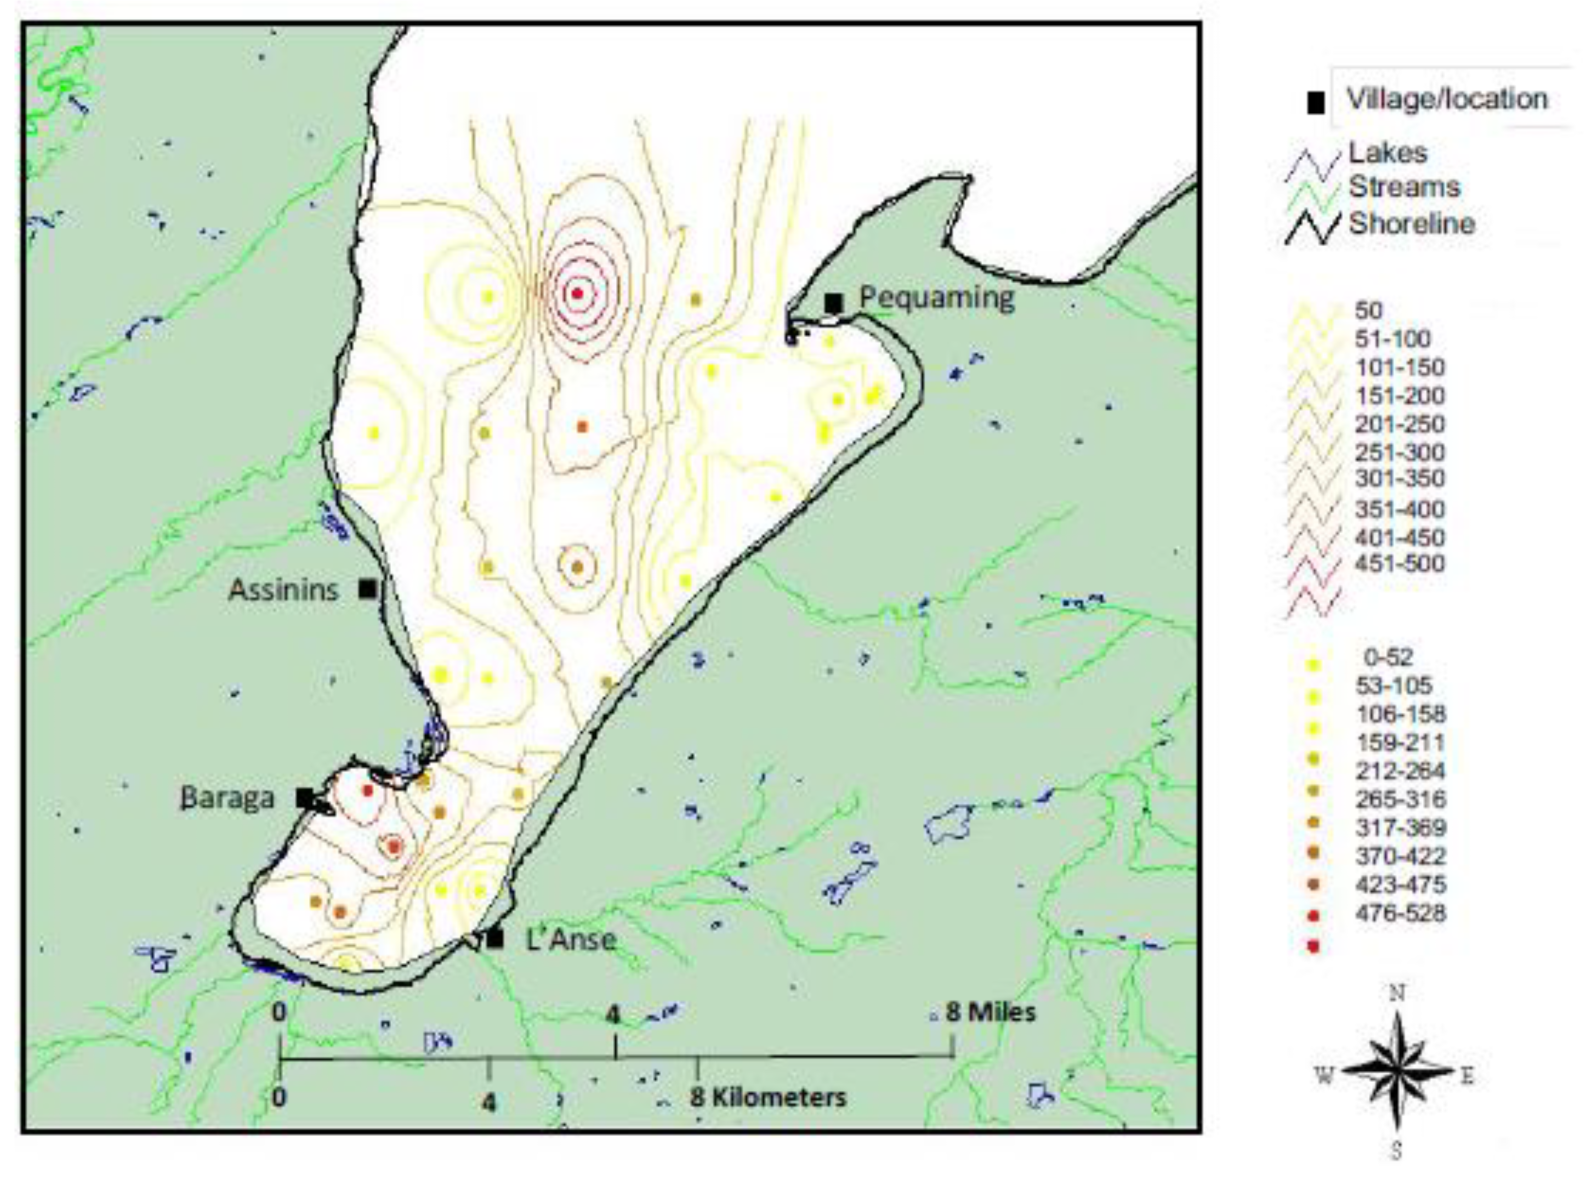
Guided by long-shore waves and currents, tailings from Mass Mill, both fine and coarse fractions, funneled down toward L’Anse Bay, contaminating deep (Keweenaw Trough) and shoreline sediments (Sand Point, Baraga Marina), respectively. The L’Anse Indian Reservation is both the oldest and largest reservation in Michigan (Supplementary Materials Figure S1). The reservation was established under the Chippewa Treaty of 1854. The United States Supreme Court interpreted the treaty as creating permanent homelands for the Chippewa (Ojibwe Anishinaabeg) band signatories to the treaty (for “homeland territory”, see 
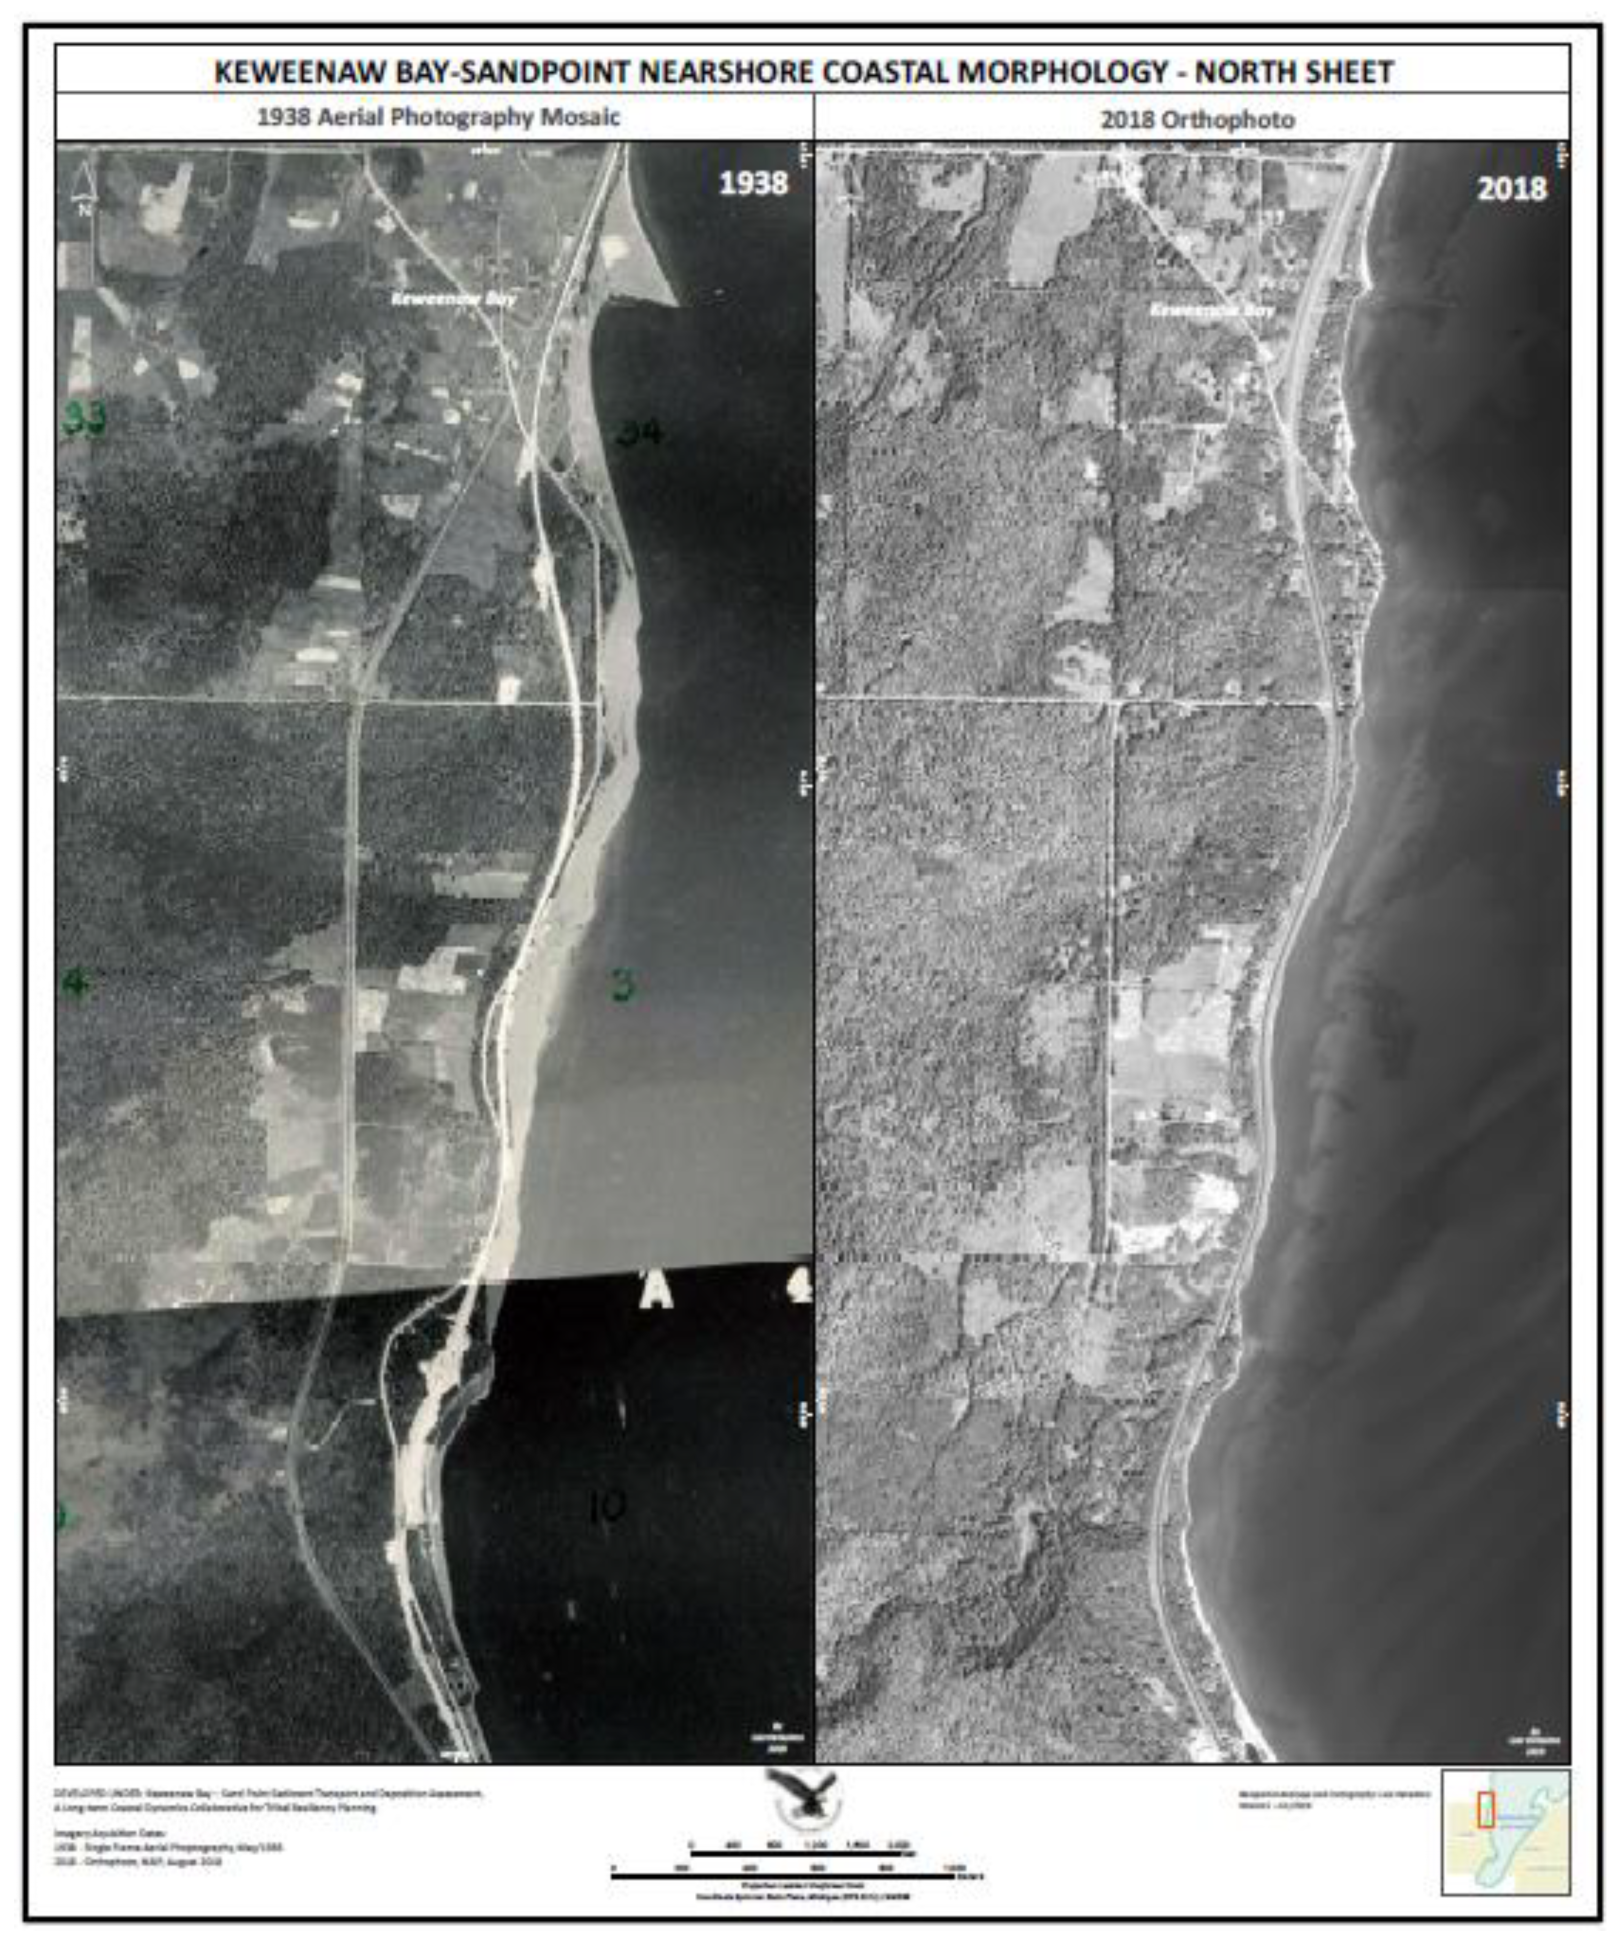
Supplementary Materials Figure S1). The Keweenaw Bay Indian Community (KBIC) was defined in 1934 by the Indian Reorganization Act as the successor apparent of the L’Anse and Ontonagon bands (Inter-Tribal Council of Michigan, 2012). Discharge and dispersal of Mass Mill tailings (see 1938 aerial photo, Figure 7) infringed upon tribal treaty rights by influencing Lake Superior waters and sediments, and later moving directly into L’Anse Indian Reservation boundaries (water column, sediments, shoreline). The L’Anse Indian Reservation covers 220 km2, nearly one-third of Baraga County (Figure 19). However, the Mass Company operations were relatively short-lived, with small discharges and marginal earnings. In company records between 1902 and 1919, officials were concerned mainly about ore grade from the various lodes, mine and mill expenses and safety, continued employment, and profits for investors. There was no mention of long-term environmental consequences of discharges nor concern about tribal rights. Moreover, the short life span of the company meant there were no “responsible parties” when concern about environmental effects became an issue after the Clean Water Act (1972).
Despite the relatively low release from Mass Mill compared to other large coastal mills (Figure 3), the presence of such large stamp sand discharges changed the shoreline environment for over a century. Natural coastal shorelines were once covered by meters of stamp sand beach extending out into shallow waters, across mouths of rivers and streams, and onto sacred lands (Sand Point). Fish and benthic organisms were undoubtedly depressed along the stamp sand migration strip, as has been documented repeatedly at Gay and Buffalo Reef to the North ([34,36,37] Figure 18). Not only is there concern about elevated copper concentrations, but also biomagnification from other metals found in the secondary suite that accompanies copper in tailings. For example, lead (Pb), mercury (Hg), and arsenic (As) are all known to bioaccumulate up aquatic food chains. Unfortunately, there is now evidence that arsenic from stamp sands has bioaccumulated in the roots of wild rice occurring in the ponds on Sand Point, but not necessarily in the rice [74]. Concern about copper contamination is pervasive at Gay (Buffalo Reef), 60 km N of Mass Mill, where the Mohawk and Wolverine Mills discharged 10× more stamp sand (22.7 MMT, Figure 3). The Task Force for the Buffalo Reef Project is conducting dredging to remove stamp sands, at an initial cost of around 14 million dollars.
On the Mass Mill shoreline, not all impacts were negative, however, as stamp sand beaches slowed coastal erosion in a transitory fashion between 1910 and the 1960s. But who would opt for a contaminated beach over a natural sand or pebble beach? As the stamp sand migrated southward, coastal erosion resumed. More recently, the Department of Transportation and the Army Corps of Engineers have had to shift highways (Highway #41) and roads away from the immediate exposed shoreline, dumping concrete blocks and boulders to “armor” shoreline stretches and have erected revetments to slow coastal erosion along the Mass Mill to Sand Point stretch. In some spots, landowners have constructed modest seawalls to protect against erosion of their backyards. The state has had to handle costs (ca. $2.1 million) for the Highway #41 shift.
Coastal remediation involves controlling damage resulting from misuse of the land. Clear assignment of responsibility is normally a cornerstone of mitigation, especially when contamination simultaneously influences shorelines, sediments, and water columns. Unfortunately, here there were no “responsible parties” and, moreover, regulation of environmental responsibilities between the overlying water column and sediment was often a contentious issue between the State of Michigan and the tribe (e.g., litigation during a 1990’s proposed buried log removal program). Mass Mill stamp sand migration includes progressive historical infringement upon tribal treaty rights plus eventual direct exposure of reservation lands to environmental impacts. Early on, tailing releases fell within the jurisdiction of the L’Anse Band of the Lake Superior Band of Chippewa Indians. The Treaty of 1842 ceded Chippewa lands, yet subsequent court hearings inserted provisions that the Chippewa retain their rights to fish, hunt, and gather on ceded lands. The Keweenaw Peninsula and surrounding Lake Superior are included in the ceded territory (Supplementary Materials Figure S1). Any impacts to Keweenaw Bay infringe on the Ojibwe right to harvest natural resources (fish, wild rice) under the treaty interpretations. Moreover, this caveat applies to all other Ojibwe bands that are signatories of the treaty, especially the Wisconsin tribes that fish in Keweenaw Bay.
KBIC found additional ways to overcome potential obstacles. Although within the Reservation, in the 1990’s, KBIC purchased Sand Point from the State of Michigan, helping resolve many potential jurisdictional issues. Sand Point is a sacred site for KBIC, as it includes Pow-Wow grounds, wild rice ponds, a traditional healing clinic, ancient burial grounds, and modern campgrounds. Initial studies by UP Engineers & Associates [75] during a Brownfields Pilot Project Assessment Grant indicated high levels of copper in sediments, surface water, and groundwater near stamp sands. The KBNRD (Keweenaw Bay Indian Community Natural Resources Department) was awarded a Brownfield Cleanup Grant to begin assessment of contamination at Sand Point in 2001. In 2006, the KBIC was granted funds from the U.S. Fish and Wildlife Service, the EPA Great Lakes Restoration Program, and the U.S. Department of Agriculture to begin restoration from mine tailing impacts.
The project was called the “Sand Point Restoration Project” and cost around 
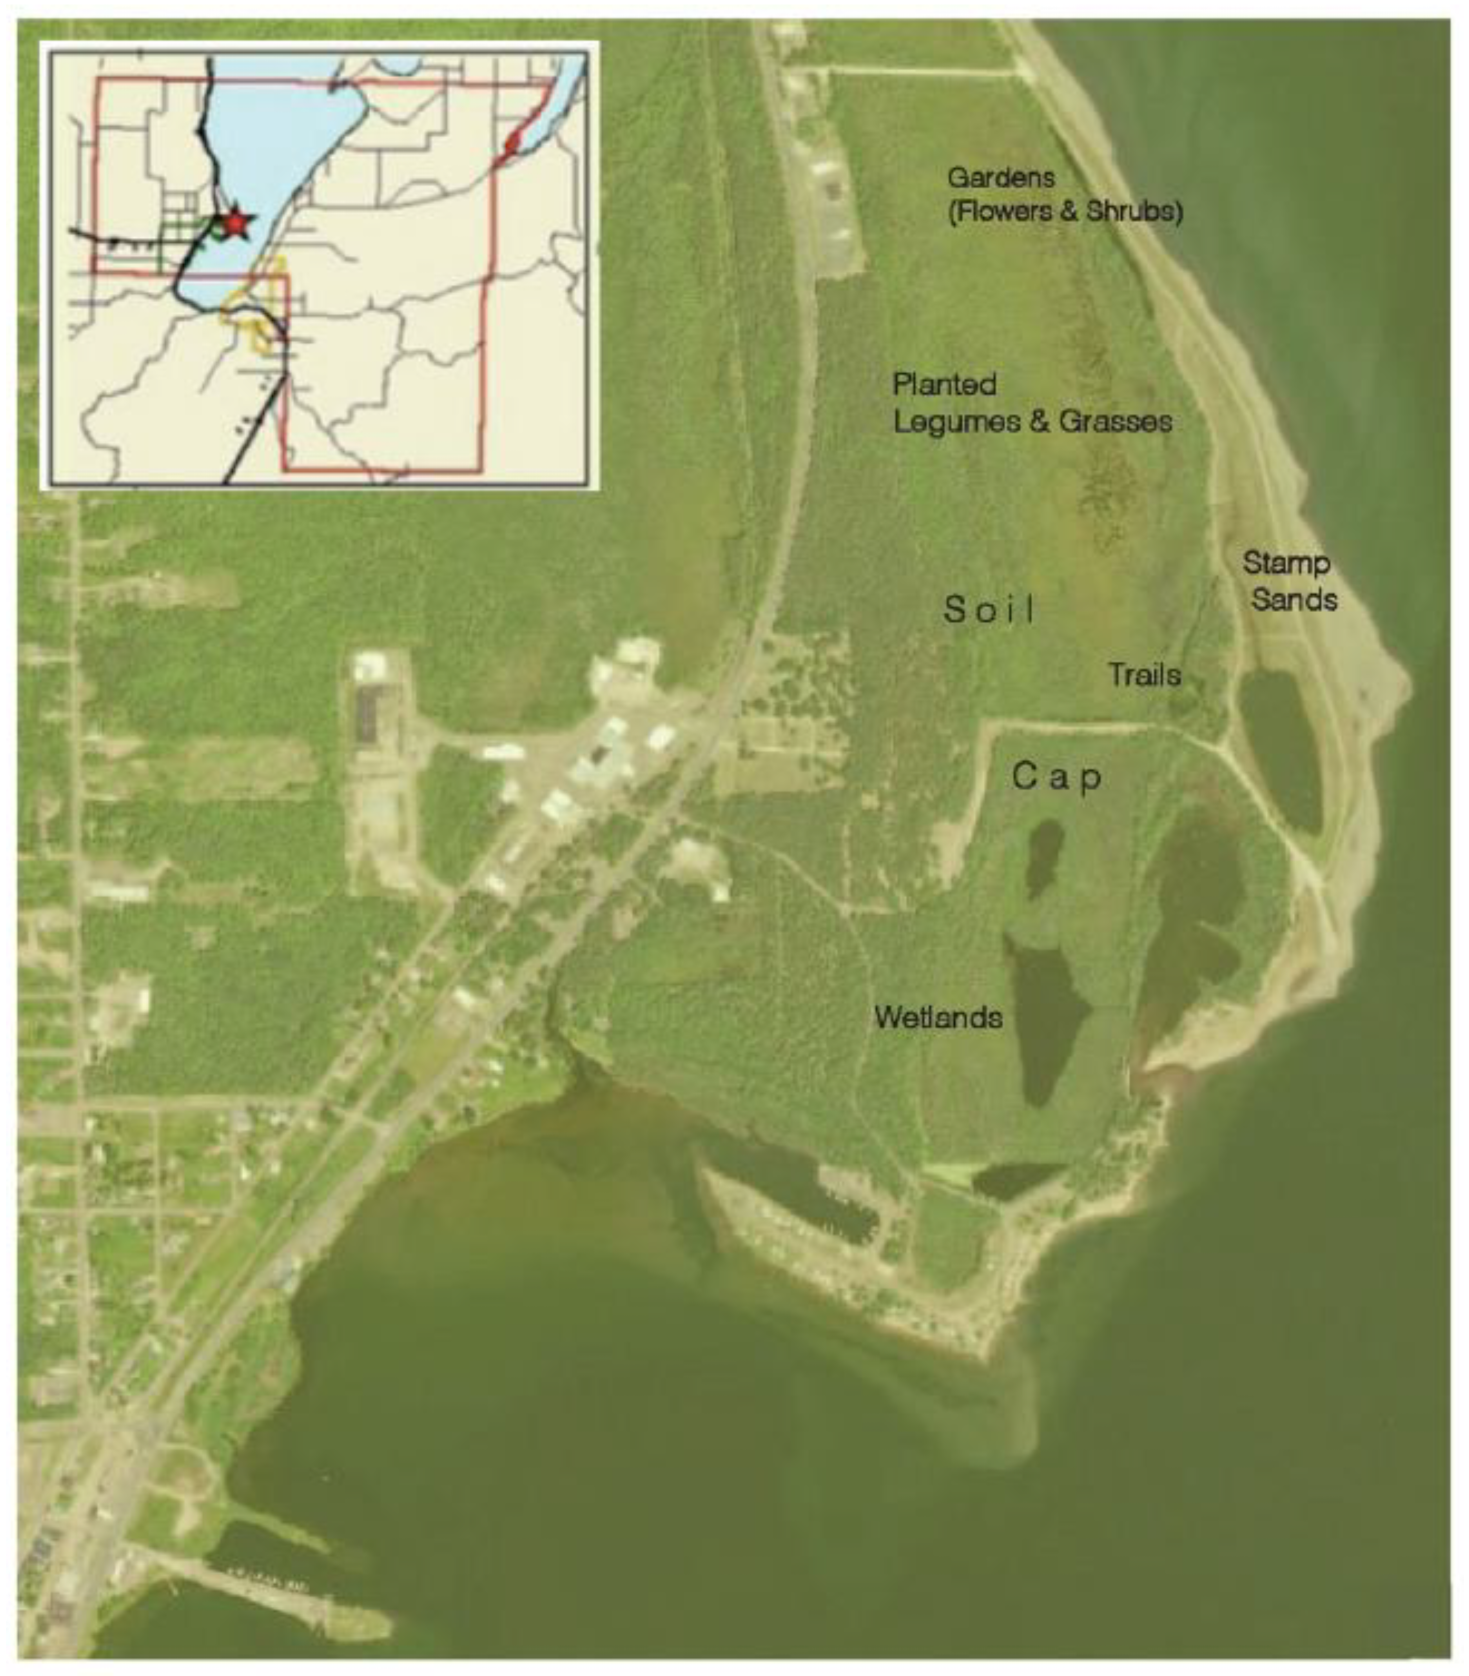
$1 million dollars. The KBIC Natural Resources Department subsequently capped nearly 36 acres of contaminated beach, over a length of 3.2 km, with 15–20 cm of soil and planted legumes and grasses (red clover, alfalfa, trefoil, ryegrass, and fescue). The purpose of capping was to reduce erosion, protect vulnerable coastal wetlands, and increase biodiversity ([76]; Supplementary Materials Figure S4). In 2011, restoration began with the installation of seed plots, mound plots, a two-acre native plant demonstration garden, and trails. The KBNRD planted over 30 varieties of plant species (e.g., Aster species, Garden tansy, Forget me not, Spotted cat’s ear, Wild columbine, Big bluestem, Common milkweed, Goldenrods, Silky dogwood, Nanny berry, Red Oak, Beaked hazelnut), investigating which taxa were resistant to stamp sands. The soil cap and trails transformed much of the impacted area into green space and enhanced the recreational area for the community (Figure 19). The topsoil cap was planted with thousands of native grasses, flowers, trees, and shrubs to filter contaminants and stabilize the eroding shoreline. Walking trails (Figure 18; Wetland Trail, 0.6 km; Lake Superior Trail, 2.5 km) were established, complete with exercise stations and interpretive placards. A “Day-use Beach and Picnic Area” and a “Camping Area”, in addition to a “Wetland Natural Area”, were constructed along the lee side of Sand Point. The shoreline construction includes dredging up white sands from L’Anse Bay to restore the original white beach on Sand Point. A “Camping & Pow Wow Area” and “Cultural Center” were established next to the historic Tribal Cemetery. The final year of the GLRI grant was 2012, which included final plantings of trees and shrubs (13,380 seedlings, including Quaking Aspen, Red Maple, White Birch, Balsam fir, Chokecherry, Pin cherry, Ninebark, Sandbar willow), irrigation, boulder placement, and final trail installation. More details about the Sand Point Restoration Project are available on a Power Point presentation by Erin Johnston available from the KBIC Natural Resources Department and in a paper by Gagnon and Ravindan [77]. The latter treatment discusses treaty contingencies, negotiations between the tribe and governmental agencies, and many more details of the Sand Point Project.
KBNRD received a prestigious award for the Sand Point Project in 2014. A panel of U.S. and Canadian judges from the Binational Forum selected the “stamp sands restoration project” as the recipient of its 11th Annual Environmental Stewardship Award in the U.S. Tribal Category. Judges were impressed by the ambitious goals of the project: “the capping, the use of native plants (many grown in the KBNRD greenhouse) to restore the native landscape and enhance wildlife habitat, and work toward expanding human recreation opportunities”.
Yet additional issues remain. Our research group recommended a list of actions for the KBIC Tribal Council to consider: (1) remove stamp sand from the shoreline and compensate by adding sand from the Assinin’s large sand fields; (2) remove scattered stamp sand deposits where they significantly impact vulnerable wetlands on Sand Point or Little Carp River; (3) remove or relocate “armoring” concrete blocks along the shoreline; (4) conduct fish shoreline surveys off Assinins stamp sands, to see if YOY fish diversity is depressed; and (5) work together with MDOT and Army Corps in a comprehensive intergovernmental study to relocate U.S. Highway #41. In the last recommendation, perhaps the removed stamp sands could be used as a bedding road material in construction, much as is routinely practiced by MDOT in Keweenaw County.
Moreover, periodic high water levels, storm intensity, and increasing storm frequency are creating complications. These conditions are occurring throughout the Great Lakes, including Lake Superior [78,79]. Sand Point is prone to wave action that compromises capping efforts. Increased susceptibility to stamp sand deposition was shown in the late October 2017 storm. Moreover, hydrodynamic modeling is needed to predict the eventual resting place of Sand Point beach stamp sands. The USACE study [39] that recommended ‘‘no action” predicted migrating stamp sands would slide off Sand Point into the Keweenaw Trough. However, the stamp sand beach is adhering onto Sand Point with minimal sloughing and with curling movement into one pond. Another issue with stamp sand beaches is that tailings react with DOC in groundwater, leading to elevated dissolved metal concentrations [80,81]. Recent work by the USACE ERDC-EL (Engineer Research & Development Center-Environmental Laboratory) at Vicksburg [82] suggests that the combination of high DOC and low pH can lead to 20× more leaching of Cu from stamp sands. Since high DOC is characteristic of local wetlands and streams, leaching of copper may be commonplace around the shoreline dunes. The suite of additional metals associated with Cu in stamp sands may cause additional concerns. Bioaccumulation of lead, mercury, and arsenic up food chains may also be an issue. Fortunately, there are no smelters nearby associated with the Mass Mill, as concentrates were shipped off to Portage Lake smelters. At Portage and Torch Lakes, mercury released from smelters reached as high as 1–3 ppm in sediments and has contaminated fish [12,81]. However, today, there is progress from mining operations to better acknowledge contamination sources (wind-blown dust, dam collapses) and to reduce releases [83,84].

5. Conclusions

Mining and milling operations are often “boom and bust”. As soon as the ore grade declines, companies cease local activity and close down. In “legacy” cases, excavations and poor-rock piles litter the terrestrial landscape. Yet tailing reservoir collapses and direct discharges of tailings into shoreline environments create international lingering dangers. Even if the operation is small and relatively few tailings are released, there is continual peril to aquatic ecosystems. The configuration of bays plus prevailing waves and currents may funnel contaminants into highly sensitive biological and cultural environments.
As an example, the fine fraction of Mass Mill tailings spread early and widely, gradually settling into deeper sediments (e.g., Keweenaw Trough) but also curling into a down-drift embayment, L’Anse Bay. Following a separate trajectory, the coarse stamp sand fraction moved more slowly southward along beaches. During its migration, the stamp sand beach mass extended out from shore as a consolidated beach deposit 100 m wide. Fortunately, because the amounts were relatively small, stamp sands mixed with abundant natural sands, diluting copper concentrations. Moreover, the stamp sand beach deposits intermittently protected the coastline from erosion. As soon as the southward-migrating contaminating mass moved on, coastline erosion resumed. Over a century, during the transition from railroad to car/truck transportation, construction placed highways close to shorelines, increasing conflicts. The northern third of the coastline is recovering from the presence of stamp sands, as beaches return to their pebble and cobble-stone character. Scattered patches of stamp sands still linger along the southern coastline, as a large mass of stamp sand beach is present from Assinins onto Sand Point. The southernmost stamp sand beach on Sand Point remains precariously perched on a narrow coastal shelf margin. Among future options, investigators suggested the removal of stamp sands from beaches. A creative solution is the local use of the stamp sand as deep bedding in relocated Highway #41 constructions.
Globally, Indigenous Peoples are often affected by mining. Repercussions include disregard for treaty rights, relocation, contamination of resources, and sometimes violent conflict. On the Keweenaw, although tribal lands probably warranted reparations, there was no compensation and little environmental awareness of Lake Superior degradation by mining corporations. Dating and scrolls at the Hopewell Culture sites provide historical evidence for extensive Ojibwe/Chippewa copper trading cultures 2000 years ago and removal of copper from Lake Superior sites [85,86]. Not until a century after Mass Mill operations was there multiple agency funding for mitigation of migrating stamp sands. The KBIC Reservation conducted an IJC award-winning restoration project on Sand Point, including soil capping, wetland, grassland and shrubland reconstruction, and construction of gardens and walking trails [77]. However, increasingly large storms may hinder Sand Point management by throwing stamp sands onto revegetated areas or may push stamp sands into L’Anse Bay. Stamp sand beaches provided intermittent relaxation from coastal erosion, yet recent shoreline armoring and revetment construction may enhance wave reflection and keep natural sand beaches from returning to Assinins stretches.
The Mass Mill discharges provide insight into the complexity of issues worldwide with progressive aquatic tailing impacts and interactions with Indigenous Peoples. When industrial mining creates shoreline tailing releases, either directly or inadvertently, through tailing reservoir collapse, there can be serious effects on shorelines, riparian zones, connecting rivers, deep offshore underwater environments, towns, or consumed resources (foodweb components, fish). Coastal discharges involve numerous logistical, institutional, political, and ecological challenges [11]. In the future, will Indigenous Peoples be invited to participate in environmental assessments? Awareness of tribal rights seems to be increasing around Lake Superior [87,88], Canada, and globally, but will this continue?

Supplementary Materials

The following are available online at https://www.mdpi.com/article/10.3390/jmse11071447/s1, Figure S1: 1842 Treaty Boundaries; Figure S2: LiDAR Coverage In Keweenaw & L’Anse Bays; Figure S3: Coastal Shelf Substrate Features; Figure S4: Sand Point Remediation. Table S1: Beach Stamp Sand Percentages From Particle Counts; Table S2: Stamp Sand Percentages From Ponar Samples & Predicted Cu Concentration; Table S3: Particle Size Measurements From Different Sites; Table S4: Mn Corrections For Stamp Sand Percentages.

Author Contributions

Conceptualization, E.J., W.C.K. and N.R.U.; methodology, W.C.K., L.M.V. and N.R.U.; software, L.M.V.; validation, W.C.K., L.M.V., N.R.U. and D.S.; formal analysis; W.C.K., L.M.V. and G.S.; investigation, D.S.; resources, E.J., C.A.M., W.C.K. and N.R.U.; writing—original draft preparation, W.C.K.; writing—review and editing, W.C.K. and C.A.M.; supervision, E.J. and C.A.M.; project administration, E.J. and C.A.M.; funding acquisition, E.J. All authors have read and agreed to the published version of the manuscript, plus the manuscript has been circulated and read by tribal reviewers (GLIFWC, KBIC).

Funding

This investigation was supported primarily under a KBIC and Michigan Technological University (MTU) grant, funded in 2019–2022 by the BIA (Bureau of Indian Affairs) Tribal Resiliency Program (Keweenaw Bay-Sand Point Sediment Transport and Deposition Assessment). High-resolution LiDAR was obtained under a Landscape Conservation Cooperative grant for KBIC with L.V. Additional support came from a 2017 U.S. EPA GLNPO/USACE study of stamp sands in Keweenaw Bay (largely Buffalo Reef), and a 2007 U.S. EPA Region V Grant to the Baraga Tribal Council passed through to W.C.K. and J. Jeong. On the 2007 tribal project, we thank Mike Sladewski and Mike Donofrio. We also thank the crews of the R/V Agassiz for assistance during Keweenaw Bay coring activities. We give credit to Lucille Zelazny for preparation of several figures. Luis Verissimo, working as a Geospatial Specialist expert with the KBIC Office, prepared many of the large Panels, which bear his name. The Baraga County Historical Museum contributed photographs of the “Keweenaw Bay Community”. Michigan Tech Archives supplied reports of Mass Mine and Mill operations. The paper is Contribution No. 102 of the Great Lakes Research Center, Michigan Tech University.

Institutional Review Board Statement

Not applicable.

Informed Consent Statement

Not applicable.

Conflicts of Interest

The authors declare no conflict of interest.

References

  1. Murdoch, W.A. Boom Copper: The Story of the First United States Mining Boom; Macmillan: New York, NY, USA, 1943. [Google Scholar]
  2. Benedict, C.H. Red Metal: The Calumet and Hecla Story; University of Michigan Press: Ann Arbor, MI, USA, 1952. [Google Scholar]
  3. Butler, B.S.; Burbank, W.S. The Copper Deposits of Michigan; Professional Paper 144; United States Geological Survey: Washington, DC, USA, 1929. [Google Scholar]
  4. Bornhorst, T.J.; Paces, J.B.; Grant, N.K.; Obradovich, J.D.; Huber, N.K. Age of native copper mineralization, Keweenaw Peninsula, Michigan. Econ. Geol. 1988, 83, 619–625. [Google Scholar] [CrossRef]
  5. Benedict, C.H. Lake Superior Milling Practice; Michigan College of Mining and Technology: Houghton, MI, USA, 1955. [Google Scholar]
  6. Kerfoot, W.C.; Lauster, G.; Robbins, J.A. Paleolimnological study of copper mining around Lake Superior: Artificial varves from Portage Lake provide a high resolution record. Limnol. Oceanogr. 1994, 39, 649–669. [Google Scholar] [CrossRef]
  7. Kerfoot, W.C.; Harting, S.; Rossmann, R.; Robbins, J.A. Anthropogenic Copper Inventories and Mercury Profiles from Lake Superior: Evidence for Mining Impacts. J. Great Lakes Res. 1999, 25, 663–682. [Google Scholar] [CrossRef]
  8. Kerfoot, W.C.; Jeong, J.; Robbins, J.A. Lake Superior Mining and the Proposed Mercury Zero-Discharge Region. In State Lake Superior; Munawar, M., Ed.; Aquatic Ecosystem Health and Management Society: Burlington, ON, Canada, 2009; pp. 153–216. [Google Scholar]
  9. Kolak, J.J.; Long, D.T.; Kerfoot, W.C.; Beals, T.M.; Eisenreich, S.J. Nearshore Versus Offshore Copper Loading in Lake Superior Sediments: Implications for Transport and Cycling. J. Great Lakes Res. 1999, 25, 611–624. [Google Scholar] [CrossRef]
  10. Martinez-Frias, J. Mine waste pollutes Mediterranean. Nature 1997, 388, 120. [Google Scholar] [CrossRef]
  11. Vogt, C. International Assessment of Marine and Riverine Disposal of Mine Tailings. In Proceedings of the Secretariat, London Convention/London Protocol, International Maritime Organization, London, England & United Nations Environment Programme-Global Program of Action, London, UK, 1 November 2012; p. 134. [Google Scholar]
  12. Kerfoot, W.C.; Rossmann, R.; Robbins, J.A. Elemental mercury in copper, silver, and gold ores: An unexpected contribution to Lake Superior sediments with global implications. Geochem. Explor. Environ. Anal. 2002, 2, 185–202. [Google Scholar] [CrossRef]
  13. Kerfoot, W.C.; Harting, S.; Jeong, J.; Robbins, J.A.; Rossmann, R. Local, Regional, and Global Implications of Elemental Mercury in Metal (Copper, Silver, Gold, and Zinc) Ores: Insights from Lake Superior Sediments. J. Great Lakes Res. 2004, 30, 162–184. [Google Scholar] [CrossRef]
  14. Gewurtz, S.B.; Shen, L.; Helm, P.A.; Waltho, J.; Reiner, E.J.; Painter, S.; Brindle, I.D.; Marvin, C.H. Spatial Distributions of Legacy Contaminants in Sediments of Lakes Huron and Superior. J. Great Lakes Res. 2008, 34, 153–168. [Google Scholar] [CrossRef]
  15. Bedner, B.; Parkila, D.; Dompier, J.; Hirzel, M.; Nebola, J.; Loosemore, D. Baraga Township Land Use Plan. Baraga Townsh. Plan. Comm. 2007, 1, 79. [Google Scholar]
  16. Gaertner, J.T. The Duluth, South Shore & Atlantic Railway: A History of the Lake Superior District’s Pioneer Iron Ore Hauler; Indiana University Press: Bloomington, IN, USA, 2008. [Google Scholar]
  17. Stevens, H.J. The Copper Handbook; University of Michigan, Self-Published: Ann Arbor, MI, USA, 1914; Volume 1, p. 1900. [Google Scholar]
  18. Kerfoot, W.C.; Urban, N.; Jeong, J.; MacLennan, C.; Ford, S. Copper-rich “Halo” off Lake Superior’s Keweenaw Peninsula and how Mass Mill tailings dispersed onto tribal lands. J. Great Lakes Res. 2020, 46, 1423–1443. [Google Scholar] [CrossRef]
  19. Biberhofer, J. Aquatic Substrate Mapping in Support of the Keweenaw Bay Indian Communities Conservation Management Objectives; Environment Canada, National Water Research Institute: Fountain Valley, CA, USA, 2002; p. 21. [Google Scholar]
  20. Ackermann, F. Airborne laser scanning-present status and future expectations. J. Photogram. Remote Sens. 1999, 54, 64–67. [Google Scholar] [CrossRef]
  21. LeRocque, P.E.; West, G.R. Airborne Laser Hydrography: An Introduction. In Proceedings of the ROPME/PERSGA/IHB Workshop on Hydrographic Activities in the ROPME Sea Area and Red Sea, Kuwait City, Kuwait, 24–27 October 1990. [Google Scholar]
  22. Abdallah, H.; Bailly, J.; Baghdadi, N.; Saint-Geours, N.; Fabre, F. Potential of space-borne LiDAR sensors for global bathymetry in coastal and inland waters. IEEE J. Sel. Top. Appl. Earth Obs. Remote Sens. 2012, 6, 202–216. [Google Scholar] [CrossRef] [Green Version]
  23. Guenther, G.C.; Cunningham, A.G.; LaRocque, P.E.; Reid, D.J. Meeting the Accuracy Challenge in Airborne Lidar Bathymetry. In Proceedings of the EARSel-SIG-Workshop LIDAR, Dresden, Germany, 15–17 June 2000. [Google Scholar]
  24. Zhao, J.; Zhao, X.; Zhang, H.; Zhou, F. Improved model for depth bias correction in airborne LiDAR bathymetry systems. Remote Sens. 2017, 9, 710. [Google Scholar] [CrossRef] [Green Version]
  25. Yeu, Y.; Yee, J.; Yun, H.S.; Kim, K.B. Evaluation of the accuracy of bathymetry on the nearshore coastlines of Western Korea from satellite altimetry, multi-beam, and airborne bathymetric LIDAR. Sensors 2018, 18, 2926. [Google Scholar] [CrossRef] [PubMed] [Green Version]
  26. Reutebuch, S.E.; McGaughey, R.J.; Andersen, H.E.; Carson, W.W. Accuracy of a high-resolution lidar terrain model under a conifer forest. Can. J. Remote Sens. 2003, 29, 527–535. [Google Scholar] [CrossRef]
  27. Gerhard, J. Vital Deployment of Lidar Data for Emergency Response-Rapid, Effective, Essential; Lidar Magazine. 2018. Available online: https://woolpert.com/resource/vital-deployment-of-lidar-data-for-emergency-response-rapid-effective-essential/ (accessed on 1 January 2021).
  28. Kerfoot, W.C.; Yousef, F.; Green, S.A.; Regis, R.; Shuchman, R.; Brooks, C.N.; Sayers, M.; Sabol, B.; Graves, M. Light detection and ranging (LiDAR) and multispectral studies of disturbed Lake Superior coastal environments. Limnol. Oceanogr. 2012, 57, 749–771. [Google Scholar] [CrossRef]
  29. Banks, K.W.; Riegl, B.M.; Shinn, E.A.; Piller, W.E.; Dodge, R.E. Geomorphology of the Southeast Florida continental reef tract (Miami-Dade, Broward, and Palm Beach Counties, USA). Coral Reefs 2007, 26, 617–633. [Google Scholar] [CrossRef]
  30. Johnson, T.C. Sedimentation in large lakes. Annu. Rev. Earth Planet. Sci. 1984, 12, 179–204. [Google Scholar] [CrossRef]
  31. Kerfoot, W.C.; Robbins, J.A. Nearshore Regions of Lake Superior: Multi-element Signatures of Mining Discharges and a Test of Pb-210 Deposition under Conditions of Variable Sediment Mass Flux. J. Great Lakes Res. 1999, 25, 697–720. [Google Scholar] [CrossRef]
  32. Kennedy, A.D.; Chernosky, F.J. Recovery of Copper From Michigan Stamp Sands: Volume III Concentration Tests; Institute of Mineral Research, Michigan Technological University: Houghton, MI, USA, 1970. [Google Scholar]
  33. Babcock, L.L.; Spiroff, K. Recovery of Copper from Michigan Stamp Sands: Volume I Mine and Mill Origin, Sampling and Minerology of Stamp Sand; Institute of Mineral Research, Michigan Technological University: Houghton, MI, USA, 1970. [Google Scholar]
  34. Kerfoot, W.C.; Hobmeier, M.M.; Green, S.A.; Yousef, F.; Brooks, C.N.; Shuchman, R.; Sayers, M.; Lin, L.; Luong, P.; Hayter, E.; et al. Coastal ecosystem investigations with LiDAR (Light Detection and Ranging) and bottom reflectance: Lake Superior reef threatened by migrating tailings. Remote Sens. 2019, 11, 1076. [Google Scholar] [CrossRef] [Green Version]
  35. Hudson, P.L. Quantitative sampling with three benthic dredges. Trans. Am. Fish. Soc. 1970, 3, 603–607. [Google Scholar] [CrossRef]
  36. Kerfoot, W.C.; Hobmeier, M.M.; Regis, R.; Raman, V.K.; Brooks, C.N.; Shuchman, R.; Sayers, M.; Yousef, F.; Reif, M. Lidar (light detection and ranging) and benthic invertebrate investigations: Migrating tailings threaten Buffalo Reef in Lake Superior. J. Great Lakes Res. 2019, 45, 872–887. [Google Scholar] [CrossRef]
  37. Kerfoot, W.C.; Hobmeier, M.M.; Swain, G.; Regis, R.; Raman, V.K.; Brooks, C.N.; Grimm, A.; Cook, C.; Shuchman, R.; Reif, M. Coastal Remote Sensing: Merging Physical, Chemical, and Biological Data as Tailings Drift onto Buffalo Reef, Lake Superior. Remote Sens. 2021, 13, 2434. [Google Scholar] [CrossRef]
  38. Vitton, S.; Williams, A. Estimate of Cliff Recession Rates for the Baraga Cliffs; Research Report R1526; Michigan Department of Transportation (MDOT): Lansing, MI, USA, 2008; p. 41. [Google Scholar]
  39. MDEQ 2001. Quantification and Fate of Keweenaw Stamp Sand. U.S. Army Corps of Engineers, Detroit District; USGS: Detroit, MI, USA, 2001; p. 14. [Google Scholar]
  40. Burton, G.A. Sediment quality criteria in use around the world. Limnology 2002, 3, 65–76. [Google Scholar] [CrossRef]
  41. MacDonald, D.D.; Ingersoll, C.G.; Berger, T.A. Development and Evaluation of Consensus-Based Sediment Quality Guidelines for Freshwater Ecosystems. Arch. Environ. Contam. Toxicol. 2000, 39, 20–31. [Google Scholar] [CrossRef]
  42. Auer, N.A.; Kahn, J.E. Abundance and Distribution of Benthic Invertebrates, with Emphasis on Diporeia, along the Keweenaw Peninsula, Lake Superior. J. Great Lakes Res. 2004, 30 (Suppl. 1), 340–359. [Google Scholar] [CrossRef]
  43. Auer, N.A.; Cannon, B.A.; Auer, M.T. Life history, distribution, and production of Diporeia near the Keweenaw Peninsula Lake Superior. J. Great Lakes Res. 2009, 35, 579–590. [Google Scholar] [CrossRef]
  44. Auer, M.T.; Auer, N.A.; Urban, N.R.; Auer, T. Distribution of the amphipod Diporeia in Lake Superior: Ring of fire. J. Great Lakes Res. 2013, 39, 33–46. [Google Scholar] [CrossRef]
  45. Hughes, D.J.; Shimmield, T.M.; Black, K.D.; Howe, J.A. Ecological impacts of large-scale disposal of mining waste in the deep sea. Sci. Rep. 2015, 5, 9985. [Google Scholar] [CrossRef] [Green Version]
  46. Dold, B. Submarine Tailings Disposal (STD)—A Review. Minerals 2014, 4, 642–666. [Google Scholar] [CrossRef] [Green Version]
  47. Rodríguez, F.; Moraga, C.; Castillo, J.; Gálvez, E.; Robles, P.; Toro, N. Submarine Tailings in Chile—A Review. Metals 2021, 11, 780. [Google Scholar] [CrossRef]
  48. Cacciuttolo, C.; Atencio, E. Past, Present, and Future of Copper Mine Tailings Governance in Chile (1905–2022): A Review in One of the Leading Mining Countries in the World. Int. J. Environ. Res. Public Health 2022, 19, 13060. [Google Scholar] [CrossRef] [PubMed]
  49. Cortés, S.; Lagos, L.D.C.M.; Burgos, S.; Adaros, H.; Ferreccio, C. Urinary Metal Levels in a Chilean Community 31 Years After the Dumping of Mine Tailings. J. Health Pollut. 2016, 6, 19–27. [Google Scholar] [CrossRef] [PubMed] [Green Version]
  50. Zanetta-Colombo, N.C.; Fleming, Z.L.; Gayo, E.M.; Manzano, C.A.; Panagi, M.; Valdés, J.; Siegmund, A. Impact of mining on the metal content of dust in indigenous villages of northern Chile. Environ. Int. 2022, 169, 107490. [Google Scholar] [CrossRef] [PubMed]
  51. Koski, R.A. Metal dispersion resulting from mining activities in coastal environments: A pathways approach. Oceanography 2012, 25, 170–183. [Google Scholar] [CrossRef]
  52. Williams, D.J. Lessons from tailings dam failures-where do we go from here? Minerals 2021, 11, 853. [Google Scholar] [CrossRef]
  53. Lin, S.-Q.; Wang, G.-J.; Liu, W.-L.; Zhao, B.; Shen, Y.-M.; Wang, M.-L.; Li, X.-S. Regional Distribution and Causes of Global Mine Tailings Dam Failures. Metals 2022, 12, 905. [Google Scholar] [CrossRef]
  54. Grimalt, J.O.; Ferrer, M.; Macpherson, E. The mine tailing accident in Azalcollar. Sci. Total Environ. 1999, 242, 3–11. [Google Scholar] [CrossRef]
  55. Marges, M.; Su, G.S.; Ragragio, E. Assessing heavy metals in the waters and soils of Calancan Bay, Marinduque Island, Philippines. J. Appl. Sci. Environ. Sanit. 2011, 6, 45–49. [Google Scholar]
  56. Petticrew, E.L.; Albers, S.J.; Baldwin, S.A.; Carmack, E.C.; Déry, S.J.; Gantner, N.; Graves, K.E.; Laval, B.; Morrison, J.; Owens, P.N.; et al. The impact of a catastrophic mine tailings impoundment spill into one of North America’s largest fjord lakes: Quesnel Lake, British Columbia, Canada. Geophys. Res. Lett. 2015, 42, 3347–3355. [Google Scholar] [CrossRef]
  57. Wynn, G. Canada and Arctic North America: An Environmental History; ABC-CILO, Inc.: Santa Barbara, CA, USA, 2007. [Google Scholar]
  58. Dahl, P.P.E.; Hansen, A.M. Does Indigenous Knowledge Occur in and Influence Impact Assessment Reports? Exploring Consultation Remarks in Three Cases of Mining Projects in Greenland. Arct. Rev. Law Politics 2019, 10, 165–189. [Google Scholar]
  59. CCME (Canadian Council of Ministers of the Environment). Canadian Environmental Quality Guidelines; Canadian Council of Ministers of the Environment: Winnipeg, MB, Canada, 1999. [Google Scholar]
  60. Whittlesey, C. Outline Map Showing the Positions of the Ancient Mine Pits, of the Point Keweenaw, Michigan; Smithsonian Institution: Washington, DC, USA, 1862. [Google Scholar]
  61. Whittlesey, C. Ancient Mining on the Shores of Lake Superior; Smithsonian Institution: New York, NY, USA; Collins Printer: Philadelphia, PA, USA, 1863. [Google Scholar]
  62. Gillman, H. Ancient Works at Isle Royale, Michigan; Appleton’s Journal: New York, NY, USA, 1873; pp. 125–173. [Google Scholar]
  63. Driver, H.E. Indians of North America; University of Chicago Press: Chicago, IL, USA, 1969. [Google Scholar]
  64. Wilband, J.T. The Copper Resources of Northern Michigan; Department of Geology, Michigan State University: East Lansing, MI, USA, 1978. [Google Scholar]
  65. Pompeani, D.P.; Abbott, M.B.; Steinman, B.A.; Bain, D.J. Lake Sediments Record Prehistoric Lead Pollution Related to Early Copper Production in North America. Environ. Sci. Technol. 2013, 47, 5545–5552. [Google Scholar] [CrossRef]
  66. Pompeani, D.P. Human Impacts on the Environment over the Holocene in Michigan and Illinois Using Lake Sediment Geochemistry. Ph.D. Thesis, Geology & Planetary Science Department, Dietrich School of Arts and Sciences, University Pittsburgh, Pittsburg, PA, USA, 2015. [Google Scholar]
  67. Vall, K.; Murphy, C.; Pompeani, D.P.; Steinman, B.A.; Schreiner, K.M.; Bain, D.J.; DePasqual, S.; Wagner, Z. Ancient mining pollution in early to middle Holocene lake sediments from the Lake Superior region, USA. Anthropocene 2022, 39, 100348. [Google Scholar] [CrossRef]
  68. Martin, S.R. 20KE20: Excavations at a prehistoric copper workshop. Mich. Arch. 1993, 39, 127–193. [Google Scholar]
  69. Kellogg, L.P. Copper mining in the early Northwest. Wis. Mag. Hist. 1924, 8, 146–159. [Google Scholar]
  70. Chastain, M.L.; Deymier-Black, A.C.; Kelly, J.E.; Brown, J.A.; Dunand, D.C. Metallurgical analysis of copper artifacts from Cahokia. Jour. Archeol. Sci. 2011, 38, 1727–1736. [Google Scholar] [CrossRef]
  71. Chosa, D. Indian History: The Native American History of Keweenaw Bay, Trestles and Tracks II—A History of Keweenaw Bay and Arnheim Community. 1988. [Google Scholar]
  72. Satz, R. Chippewa Treaty Rights: The Reserved Rights of Wisconsin’s Chippewa Indians in Historical Perspective; University of Wisconsin Press: Madison, WI, USA, 1991; p. 15. [Google Scholar]
  73. Keller, R.H. Chippewa Treaty Rights: Chapter 3, The 1842 Copper Treaty; Wisconsin Academy of Sciences, Arts & Letters: Madison, WI, USA, 1978; pp. 33–49. [Google Scholar]
  74. Sarkar, R.D.; Zhang, Z.; Warke, M.; Datta, R. Health Risk from Toxic Metals in Wild Rice Grown in Copper Mining-Impacted Sediments. Appl. Sci. 2022, 12, 2937. [Google Scholar] [CrossRef]
  75. UP Engineers & Associates; KBIC Natural Resources Department: Baraga, MI, USA, 2004; Available online: https://www.upea.com/ (accessed on 8 May 2023).
  76. KBIC Sand Point Restoration Site Receives Binational Stewardship Award. Babaamaajimowin Akiing: News From the Earth, Keweenaw Bay Indian Community Natural Resources Department, Baraga, Michigan 2017. Available online: https://nrd.kbic-nsn.gov/sites/default/files/spring_17_Final.pdf (accessed on 8 May 2023).
  77. Gagnon, V.S.; Ravindan, E.H. Restoring human and more-than-human relations in toxic riskscapes: “Inperpetuity” within Lake Superior’s Keweenaw Bay Indian Community. Sand Point. Ecol. Soc. 2023, 28. [Google Scholar] [CrossRef]
  78. Anderson, J.D.; Wu, C.H.; Schwab, D.J. Wave climatology in the Apostle Islands, Lake Superior. J. Geophys. Res. Oceans 2015, 120, 4869–4890. [Google Scholar] [CrossRef] [Green Version]
  79. As-Salek, J.A.; Schwab, D.J. High-frequency water level fluctuations in Lake Michigan. J. Waterw. Port Costal Ocean Eng. 2004, 130, 45–53. [Google Scholar] [CrossRef]
  80. Jeong, J.; Urban, N.R.; Green, S. Release of Copper from Mine Tailings on the Keweenaw Peninsula. J. Great Lakes Res. 1999, 25, 721–734. [Google Scholar] [CrossRef]
  81. Kerfoot, W.C.; Urban, N.R.; McDonald, C.P.; Zhang, H.; Rossmann, R.; Perlinger, J.A.; Khan, T.; Hendricks, A.; Priyadarshini, M.; Bolstad, M. Mining legacy across a wetland landscape: High mercury in Upper Peninsula (Michigan) rivers, lakes, and fish. Environ. Sci. Process. Impacts 2018, 20, 708–733. [Google Scholar] [CrossRef] [PubMed] [Green Version]
  82. Schroeder, P.; Ruiz, C. Stamp Sands Physical and Chemical Screening Evaluations for Beneficial Use Applications; Environmental Laboratory, U.S. Army Engineer Research and Development Center: Vicksburg, MS, USA, 2021. [Google Scholar]
  83. Golik, V.I.; Gashimova, Z.A.; Liskova, M.Y.; Kongar-Syuryun, C.B. To the problem of minimizing the volume of mobile dust in the development of pits. Tr. V Promyshlennosti 2021, 11, 23–28. [Google Scholar] [CrossRef]
  84. Khayrutdinov, M.M.; Golik, V.I.; Aleksakhin, A.V.; Trushina, E.V.; Lazareva, N.V.; Aleksakhina, Y.V. Proposal of an Algorithm for Choice of a Development System for Operational and Environmental Safety in Mining. Resources 2022, 11, 88. [Google Scholar] [CrossRef]
  85. Seeman, M.F.; Nolan, K.C.; Hill, M.A. Copper as an essential and exotic Hopewell metal. J. Archaeol. Sci. Rep. 2019, 24, 1095–1101. [Google Scholar]
  86. Hill, M.A.; Seeman, M.F.; Nolan, K.C.; Dussubieux, L. An empirical evaluation of copper procurement and distribution: Elemental analysis of Scioto Valley Hopewell copper. Archaeol. Anthropol. Sci. 2018, 10, 1193–1205. [Google Scholar] [CrossRef]
  87. Lord, G. Successful tribal opposition to mining projects in the Upper Midwest. Nat. Resour. Environ. 2019, 34, 7–11. [Google Scholar]
  88. Rothhorn, K. Progression of indigenous environmental conflicts in the UP in correlation to the national development of indigenous legal and social power. Conspec. Boreal. 2021, 7, 7. [Google Scholar]
Figure 1. (A) Copper “halo” around the Keweenaw Peninsula of Michigan. The peninsula protrudes into Lake Superior and is surrounded by high sediment inventories of copper. Units of anthropogenic copper inventory in sediments are in µg/cm2 (see scale, upper right). (B) Distribution of copper mines and major shoreline stamp mills along the Keweenaw Peninsula midrib (Portage Volcanics Series). Three major Lake Superior locations (Freda/Redridge, Gay, and Mass Mill) list amounts discharged into coastal environments (MMT, million metric tonnes).
Jmse 11 01447 g001
Figure 2. Mass Mill at the “Keweenaw Bay” town location: (a) photo of the town of “Keweenaw Bay” inserted along with a period map (1916), which shows locations of the mill, depot, rail lines, and coal dock; (b) workers in front of the trestle that delivered ore to the top mill level; (c) depot with Mass Mill trestle in the background; (d) Mass Mill descending from the trestle works down to the bay, (e) water tank, carpenter shop, and train tracks leading south to Baraga; (f) elevator track from the Old Coal Dock (all photos courtesy of Baraga County Historical Museum).
Jmse 11 01447 g002
Figure 3. Amounts and times of tailings (stamp sand) discharges from the 3 large Traverse Bay mills (22.7 MMT total from the Mohawk and Wolverine Mills at Gay, Michigan; 2.7 MMT from the Mass Mill at “Traverse Bay Community”). Notice the effects of the 1913 Strike on production from all three mills.
Jmse 11 01447 g003
Figure 4. For LiDAR, two laser pulses (blue-green 532 nm and near-IR 1064 nm) sweep across the lake surface: (a) The near-IR reflects off the water surface, whereas the blue-green penetrates through the water column and reflects off the lakebed. The difference between the two returning pulses gives the depth of the water column and details of bathymetry (modified from LeRocque and West [21]); (b) Simulated LiDAR waveform fitted with Gaussian function (water surface peak), a triangle function (water column reflectance), and a Weibull function for bottom reflectance (after Abdallah et al. [22]).
Jmse 11 01447 g004
Figure 5. Sample of sand grains from Sand Point (ca. 55% stamp sands) under transmitted light from a microscope, showing the contrast between rounded natural sand (transparent quartz) and dark stamp sand grains (dark, irregular, slightly larger).
Jmse 11 01447 g005
Figure 6. In a mixed sand sample, grain counts (natural sand, stamp sand) follow a binomial distribution: (a) the coefficient of variation for the % stamp sand calculation is known (see equation under “Theoretical”); (b) field counts closely correspond to the expected values (“Observed”). For particle sizes, see comparison of (c) % particle counts and (d) % particle mass from the Sand Point beach sample. Particle sizes are similar, but notice the slightly larger sizes and mass for stamp sands (SS) compared with natural quartz (Q) sands in the mixed sand sample.
Jmse 11 01447 g006
Figure 7. Aerial photos, comparing the coastlines of the Lower Keweenaw Bay in 1938 (left) and more recently in 2018 (right). In the 1938 northern image, broad stamp sand beaches extend down the shoreline halfway to Sand Point.
Jmse 11 01447 g007
Figure 8. Tailings accumulated around the Mass Mill Coal Dock during operations (1901–1919). Tailings eventually interfered with water intake operations, causing suspension of the “Coal Dock” operations. Subsequent erosion of this remnant mass is caught by aerial images (1962, 1968, and 1986). For an interval, the stamp sands were so pervasive, they protected the shoreline from erosion (Vitton & Williams [38]). The Coal Dock cribbing still reaches out into Lake Superior at right angles to the shoreline and remains a nautical hazard. The main Highway is U.S. 41. Notice how the northern bluff cliff edge eroded closer to the highway through time (compare 1960s to 1986), resulting in a slight relocation (in 2010, 30 m) of the highway.
Jmse 11 01447 g008
Figure 9. Migration of stamp sand southward along the coast from Assinins to Sand Point (AF: 1938–1998). Yellow represents natural sand beach; orange is a mixed (stamp sand/natural grains) beach; whereas reddish indicates a largely stamp sand beach. The various panels also show the progressive transformation of the coastline and Sand Point to a mixed wetland and multiple pond environment.
Jmse 11 01447 g009
Figure 10. Stamp sand percentages from shoreline beach deposits plotted from north to south along the western side of the lower Keweenaw Bay onto Sand Point. Tallies start north of the Mass Mill site, reach a 70–80% peak at the Coal Dock, then decline across scattered remnant patches. Around site 40, continuous beach deposits from Assinins to Sand Point show values between 40 and 60% SS. At the Lighthouse on Sand Point, stamp sand values decline along the lee white beach region into L’Anse Bay. Points are plotted by their site number from north to south, not by latitude.
Jmse 11 01447 g010
Figure 11. LiDAR DEM of Lower Traverse Bay (west coastline) with superimposed beach and Ponar offshore transect surveys. Left panel (A) shows the upper portion of the shoreline, whereas the right panel (B) shows the lower portion. LiDAR surfaces include shelf bathymetry and distribution of underwater structures (bedrock, cobble/boulder fields, migrating sand bars and fields), plus detailed topography and infrastructure (highway, roads, trails, river, streams, woods). Note the close proximity of Highway #41 to the shoreline north of Sand Point. Percentage stamp sand is indicated for beach site sand mixtures by both the pie diagram size and shading (fully black = 100% SS).
Jmse 11 01447 g011
Figure 12. Jacobsville Sandstone bluff just north of the Mass Mill and Old Coal Dock site. Rock below the bluff accumulates as a talus slope. Waves break and grind the rocks into small round pink and white pebbles, distributed along the recovering shoreline.
Jmse 11 01447 g012
Figure 13. Recent views of the former Mass Mill and northern coastline sites. (a) A sandstone cobble beach is developing along the shoreline and around the remaining triangular wedge of residual stamp sands at the base of the Coal Dock. Cribwork for the Coal Dock still protrudes out into Keweenaw Bay. The original mill, town, train station, and railroad complex are absent, only a remodeled Assay (Laboratory) House and a few scattered new homes remain. Highway #41 runs over ground once occupied by the extensive railroad tracks and trestles. (b) Sandstone block and cobble shoreline south of Mass Mill. The site includes a mixture of natural sandstone pebbles, cobbles, and capstone boulders eroding from the 5′ Jacobsville Sandstone shoreline edge. The beach width was once covered by hundreds of feet of stamp sand during mill discharge, but is now in recovery. (c) ROV photo of extensive underwater large cobble and boulder fields on the shelf region off the Mass Mill site. The rounded cobble and boulder beds are sites where fish drop eggs. (d) Off Assinins, ROV photos of massive migrating sand bars show pronounced ripples. Offshore there is little stamp sand in the moving bars, often less than 20–10% of particles. The sand surface appears a grainy, mottled light pink.
Jmse 11 01447 g013
Figure 14. Stamp Sand percentages and predicted Cu concentrations plotted against water depth across the Assinins Shelf (exponential regression fits). (a) Stamp Sand percentages determined by microscopic counting technique; (b) Cu concentrations predicted assuming the mean concentration of 0.3% copper in stamp sand; (c) Cu concentrations corrected for Mn (see Supplementary Materials Table S4). These diagrams are underwater values and do not include shoreline stamp sand beach deposits.
Jmse 11 01447 g014
Figure 15. Ponar sediment copper concentrations in underwater sediments across southern Keweenaw Bay and in L’Anse Bay. Values for Cu contours and points are provided in the right-hand legend. Copper appears enhanced in the deep “Keweenaw Trough” region, and around the lee of Sand Point, off the Baraga Marina.
Jmse 11 01447 g015
Figure 16. Relationship between directly determined copper concentrations and stamp sand content for sediment grab samples: (a) These samples were collected in 2019 from the northern Keweenaw Bay area (Gay) by Buffalo Reef; (b) These samples were collected in 2019 from lower Traverse Bay and Sand Point.
Jmse 11 01447 g016
Figure 17. Directly determined copper profiles from sediment cores: (a) two cores from the southern region of Keweenaw Bay; (b) profiles from four L’Anse Bay cores, two off the Marina and two from the center of the bay. All core profiles have a buried maximum. Surface concentrations from both regions have decreased substantially since the historical maximum peak, yet remain elevated far above background (~35 mg/kg; ppm) at all locations.
Jmse 11 01447 g017
Figure 18. Relationship of various benthic invertebrate taxa to increasing percentages of stamp sands in bottom sediments. Samples are from sieved Ponar grabs; the bars give mean density (numbers/m2) with 95% C.L. for six different taxa. See more details of surveys in [34,35,36].
Jmse 11 01447 g018
Figure 19. Sand Point Remediation Project. Upper left insert shows boundaries of Reservation lands, from Pequaming at the North to Baraga and L’Anse regions at the south. Red star marks the Sand Point Lighthouse location. The image shows wetlands, beaches, ponds, walking trails, and gardens on Sand Point. The Baraga Marina is on the bottom left, across a stretch of L’Anse Bay. Highway #41 runs across the middle of the photo. The town of Baraga is also to the left.
Jmse 11 01447 g019
Table 1. Selected large legacy mine discharges into coastal environments around the globe, showing site locations, dominant metal, and conflicts with Indigenous Peoples.
LocationTailingsYearsDominant MetalsIndigenous Conflict
North America
Gay, Keweenaw Peninsula, MI, USA22.7 MMT1901–1932Copper, SilverOjibwe, Buffalo Reef (Salmon, Whitefish)
Freda-Redridge, Keweenaw Peninsula, MI, U.S.A.42.4 MMT1901–1947Copper, SilverOjibwe, Ontonagon Reservation, Salmon-Trout R., Relocation
Reserve Mining, Silver Bay, Minnesota, U.S.A.500 MMT1955–1980IronFond Du Lac, Grand Portage, Bois Forte Bands; fishing rights
Rupert Inlet, British Columbia, Canada353 MMT1971–1995CopperTsimshia, Gitxaala, Ehattesaht First Nations; Salmon fishing
Britannia Beach, Howe Sound, British Columbia, Canada44 MMT1904–1974Copper, ZincSquamish Nation; contamination, Pink Salmon fishing
Mount Polley spill, Fraser River and Likely Fjord, British Columbia, Canada24.4 MMT2014Gold, CopperXat’sull, T’exelceme, Lhatko Dene First Nations tribes; Salmon fishing
South America
Chanaral Bay, Atacama Region, Chile150 MMT1938–1989Copper, Arsenic, ZincAtacama Indigenous Council, Atacameno, Quechua, Aymaras; beach and human contamination, fisheries
Europe
Qaumaujuk and Agfardlikavsa Fjords, Greenland11.8 MMT1973–1990Lead, Zinc, SilverInuit; contamination, fisheries
Sydvaranger Mine, Bokfjorden Fjord, Kirkenes, Norwayca. 100 MMT2009–2034Magnetite IronNR; Deep Marine Disposal, Ecosystem contamination
Aznalcollar, Guadalquivir Estuary, Spain4–5 MMT1988Lead, ZincNR; Tailings Dam Failure, contamination
New Guinea, Philippines
Calancan Bay, Marinduque Island, Luzon, Philippines200 MMT1975–1991CopperMarinduque Island Residents, Mogpog People; pollution, fish kills
West Papua, Indonesia1.3 Billion MT1987–2014Gold, CopperAmungme, displaced, lost lands, violence against protests
Nueva Vizcaya, Oceanagold, Manila, Philippinesfuture operations2015–2044Gold, CopperBugkalot, Tuwali; Dinauyan/Surong Rivers; pollution, relocation, violence
Table 2. Upper-strata copper fluxes (mg/m2/yr) and inventories (µg/cm2) from sediment cores. The sites compare L’Anse Bay (Mass Mill influenced) versus less mining-impacted sites (Control = Huron Bay; Lake Superior) and more disturbed sites (Portage Lake, part of Superfund Site). The N column is the number of cores; C.I. is the 95% confidence interval for the mean; SD is the standard Deviation.
Surface Fluxes (mg/m2/yr)
SiteNRangeMean ± 95% C.I.SD
Portage Lake1830–570255 ± 82348
L’Anse Bay1177–198144 ± 11.817
Huron Bay1416–5934.9 ± 8.514.2
Lake Superior1617–7731.1 ± 10.218.6
Anthropogenic Inventories (µg/cm2)
SiteNRangeMean ± 95% C.I.SD
Portage Lake201081–20,1638711 ± 23074934
L’Anse Bay32315–29682665 ± 742329
Coastal Keweenaw2210–68497 ± 407896
Lake Superior3045–472161 ± 3490
Disclaimer/Publisher’s Note: The statements, opinions and data contained in all publications are solely those of the individual author(s) and contributor(s) and not of MDPI and/or the editor(s). MDPI and/or the editor(s) disclaim responsibility for any injury to people or property resulting from any ideas, methods, instructions or products referred to in the content.

