Article

Experimental Study on Liquefaction Characteristics of Coral Gravelly Soils with Different Particle Size Distributions

College of Civil Engineering, Guangzhou University, Guangzhou 510006, China
*
Author to whom correspondence should be addressed.
J. Mar. Sci. Eng. 2023, 11(7), 1356; https://doi.org/10.3390/jmse11071356
Submission received: 7 June 2023 / Revised: 29 June 2023 / Accepted: 30 June 2023 / Published: 3 July 2023

Abstract

:
Many laboratory studies have shown that particle size distribution (PSD) affects the liquefaction susceptibility of granular materials. However, few studies have focused on the impact of PSD on coral particles. In this study, two different soil families were prepared: one with three levels of mean particle size (D50) with identical uniformity coefficient (Cu)and the other with four levels of Cu with the same D50 for coral gravelly soils. In addition, a series of undrained cyclic triaxial tests were conducted on coral gravelly particles with two groups of PSDs at a relative density of 40% and an adequate confining pressure of 100 kPa. The test results indicated that D50 with identical Cu can affect the undrained cyclic behavior of coral gravelly particles. In contrast, Cu with identical D50 does not impact the undrained cyclic behavior of coral gravelly particles. The developing pore water pressure was uniform when the sample was subjected to the same cyclic loading. For samples with changing D50 values of 2.35, 4.70, and 7.05 mm, increasing D50 improved the cyclic liquefaction resistance. For samples with changing Cu, increasing Cu in the range of 1.06–5.00 first increased and then decreased the liquefaction resistance.

1. Introduction

As a result of earthquakes, liquefaction can cause catastrophic damage to infrastructure and financial losses worldwide. Several laboratory researchers have indicated that the liquefaction susceptibility of granular soils depends on many factors, including but not limited to particle size distribution (PSD), soil shape, inherent fabric, initial static state, density, confining pressure, cyclic shear stress amplitude, and drainage condition [1,2,3,4,5,6,7]. It is widely accepted that the mean particle size (D50) and the uniformity coefficient (Cu) are the two most important PSD factors for the liquefaction susceptibility of a granular material. Meanwhile, the impact of the two factors on liquefaction susceptibility has been investigated with laboratory experiments. Regarding the effect of Cu, Vaid et al. [8] conducted a series of undrained tests on three medium sand samples with varying particle size distributions and Cu concentrations between 1.5 and 6.0. To isolate the coefficient of uniformity alone, other factors including PSD curve shape, mean particle size, mineralogy, and relative densities were held constant. They reported that liquefaction resistance increases as Cu rises at low relative densities, while the trend was opposite at high relative densities. However, Kukosho et al. [9] reported only a small difference in liquefaction resistance for specimens with the same relative density when the specimen particles were not easily crushed, and they also indicated that a larger Cu could decrease the cyclic liquefaction resistance for poor-quality and crushable soil particles. In contrast, regarding the effect of D50, Yilmaz et al. [10] investigated two different group-grade sand samples at identical Dr = 60% to discuss the influence of PSD on liquefaction resistance. One of the group-grade samples comprised a mixture of one subgroup of sand with six others at various weight percentages. They reported that D50 is a primary factor that affects liquefaction resistance between any two samples, and a decrease in D50 tends to decrease liquefaction resistance.
The above experimental results show that the effect of PSD on liquefaction susceptibility appears contradictory due to the application of various soil types. In addition, only onshore foundation soils were considered in these studies. Therefore, marine soil was chosen to investigate if PSD always impacts liquefaction resistance when soil is at low relative density and under isotropic consolidation conditions. As an essential marine resource, coral soil is widely deposited in many countries (e.g., the United States (US), Australia, Egypt, Japan, and China). Numerous port facilities and offshore structures, such as ports, resorts, and military dwellings, have been constructed in coral soil sites over the past 30 years. However, many coastal defenses and harbor facilities were destroyed in the 1993 Guam [11], the 2006 Hawaii [12], and the 2010 Haiti [13] earthquakes due to the occurrence of widespread liquefaction in the coral soil. Therefore, increasing attention has been paid to dynamic behavior investigation and research on coral soil, including liquefaction resistance. In addition, coral soil particles have remarkable irregular particle shapes and intraparticle voids because they are composed of bioclastic materials and the skeletal remains of marine organisms [14,15,16,17]. Coral soil particles are more angular and have easier breakage than terrigenous soil particles, such as silica sand. Accordingly, coral soil’s dynamic behavior significantly differs from terrigenous soil due to the particles’ properties [18,19,20,21]. Salem et al. [22] investigated the effect of main factors, including relative density (Dr), confining pressure ( σ c ), and cyclic stress ratio (CSR) on the dynamic behavior of coral soil. Furthermore, Li et al. [23] reported that the liquefaction resistance of well-graded PSD coral soil specimens is higher than that of poorly graded PSD and gap-graded PSD specimens. Although previous studies improved the understanding of coral soil’s dynamic behavior, these focused only on coral sand (sand particle size < 2 mm). In contrast, coral gravelly soils with particle sizes between 2 and 60 mm can be implemented more extensively as fill material for offshore and coastal facilities. However, the seismic response of coral gravelly soils is little known. In particular, the relationship between cyclic liquefaction resistance and different PSDs in coral gravelly soils has not yet been reported.
In this study, an attempt was made to evaluate the dynamic behavior of reconstituted coral gravelly soils under undrained cyclic loading conditions. In addition, the effects of two groups of PSDs on dynamic behavior are discussed. By comparing the results of the cyclic tests on coral gravelly soils with two groups of PSDs, the development of undrained cyclic behavior and the trend of cyclic liquefaction resistance with changes in D50 and Cu could be investigated. Moreover, how different D50 and Cu levels affect pore water pressure generation under cyclic loading was investigated. Subsequently, the issue of whether a difference in Cu level also affects the cyclic liquefaction resistance of marine soil was explored. A main aim of this study was to assess the cyclic behavior of coral gravelly soils and understand the impact of PSD the liquefaction susceptibility of marine soils. Furthermore, this study can serve as a reference for the seismic design of offshore and coastal facilities.

2. Cyclic Triaxial Testing
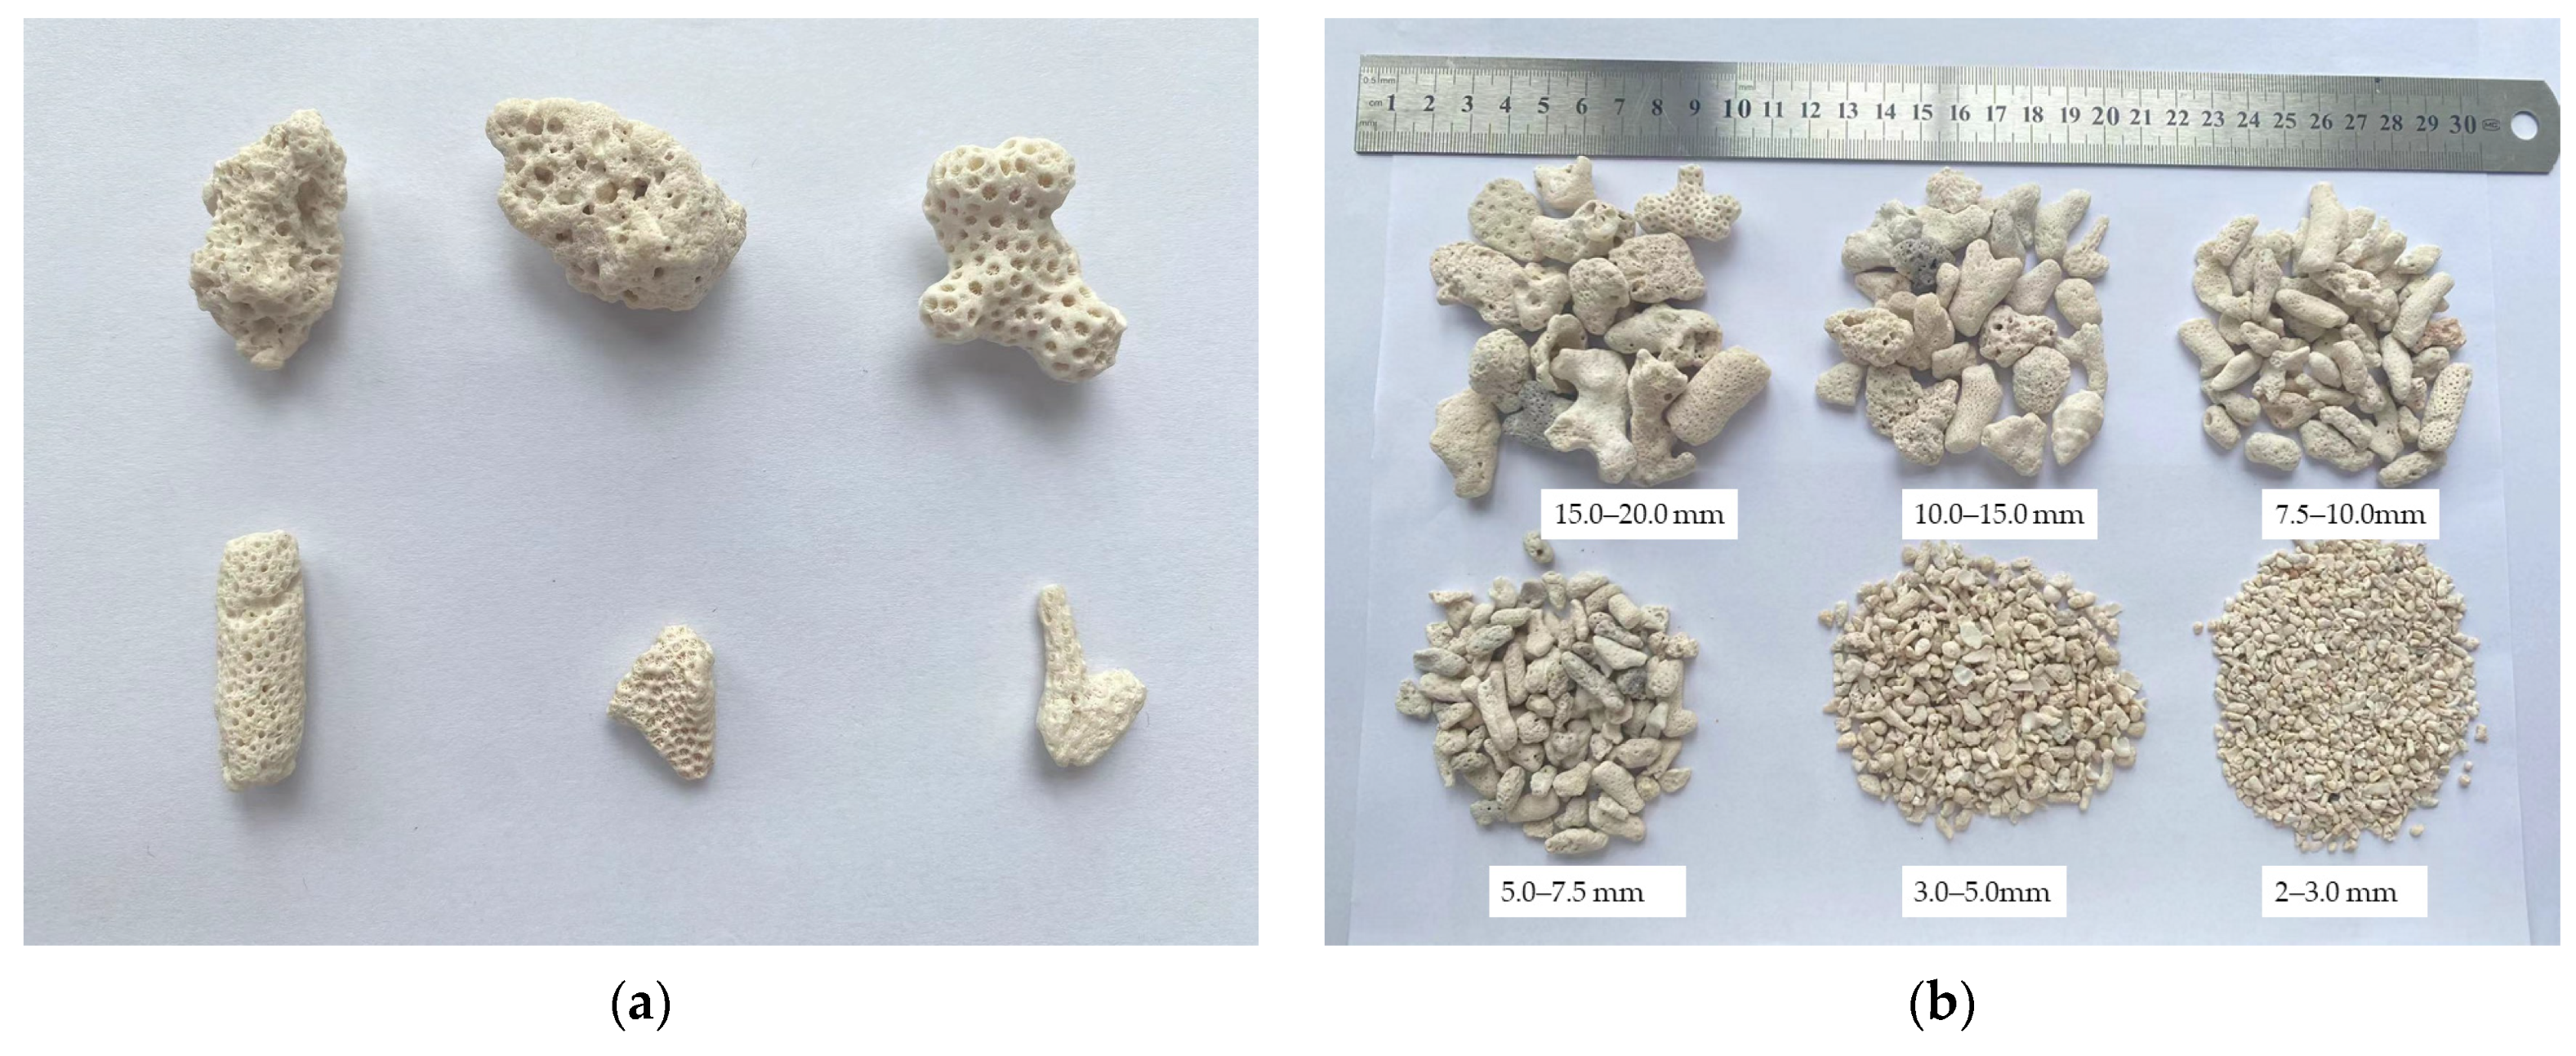
2.1. Material

The coral gravelly soils used in these tests had an irregular and angular shape with 95% carbonated content. The coral gravelly soils are shown in Figure 1. The particle surface had remarkable intraparticle void space, as depicted in Figure 1a. The effect of two soil groups was investigated (Figure 2), and the original PSD curve was derived from an actual coral soil PSD curve from Japan. The two soil groups were (a) Soil A with three values of D50, including 2.35, 4.70, and 7.05 mm with identical Cu and (b) Soil B with four values of Cu including 1.06, 3.40, 3.62, and 5.00 with identical D50. Figure 2 compares the PSD curves of the materials tested with the limiting curves suggested by international and national guidelines to identify potentially liquefying soils [24]. In addition, specimen 1A could be expected to liquefy, while other PSDs were outside the boundary of potentially liquefied soils. Table 1 lists the physical property indices of all samples. Specific gravity (Gs) values of all samples and the maximum (ρd,max) and minimum (ρd,min) dry density values of all samples were determined based on the literature [25,26].

2.2. Test Method

This study used a cyclic triaxial apparatus (DYNTTS-5Hz/64KN, GDS Instruments, Hampshire, UK), and the specimen size was 150 mm in diameter and 300 mm in height. The diameter of 150 mm was approximately five times the maximum particle size of specimen 3A. The reconstituted specimens for the triaxial tests were prepared using air pluviation to achieve the desired density (Dr = 40%). Each specimen was prepared in five layers within the sample spilt mold, using a procedure similar to the under-compaction technique proposed in [27].
The intraparticle void structure of coral gravelly soil makes it challenging to saturate this type of soil. Thus, all samples were fully saturated before cyclic triaxial testing in two crucial steps. Initially, a sample was flushed with CO2 for at least 8 h, followed by de-aired water to reach the initial degree of saturation. Second, the sample was entirely saturated by adopting a stair-step procedure for saturation, where the cell and back pressure increased by 50 kPa every hour. The sample was then maintained for about 12 h at a cell pressure of 430 kPa and a back pressure of 380 kPa. The Skempton’s B-value was greater than 0.95 when the sample was subjected to a back pressure of 380 kPa. After ensuring complete saturation, all specimens were isotropically consolidated under an effective stress of 100 kPa.
In order to understand the cyclic undrained behavior of the materials tested, all consolidated specimens were subjected to cyclic axial loading under undrained conditions, which was controlled by sinusoidal waves with a frequency of 0.1 Hz. The desired cyclic stress ratio (CSR), which was calculated by dividing the deviator stress (q) by twice the adequate confining pressure ( σ c )   (i.e.,   CSR = q /   2 σ c ), was held constant and varied from as low as 0.18 to as high as 0.25 for tests 1A–3A and tests 1B–3B, and a CSR range from 0.18 to 0.23 for test 4B.

3. Results and Analysis

3.1. Undrained Cyclic Triaxial Response

There are two ways to define a sample’s liquefaction based on the undrained cyclic triaxial response: (a) From a pore water pressure point of view, liquefaction or initial liquefaction is usually defined as the condition when the excess pore water pressure ratio ( r u = Δ u / σ c ) ( Δ u is excess pore water pressure (EPWP) during the cyclic loading and σ c is the effective confining stress) reaches 0.95–1.0, and at the same time, the effective stress is almost zero. (b) From the standpoint of the development of axial strain, liquefaction is defined when the value of double amplitude (DA) axial strain ( ε DA ) achieves 5% ( ε DA = 5 % ) . In this study, two thresholds were assumed as ε DA = 5 % and r u = 0.9 [28,29]. The cyclic tests were terminated when both thresholds were satisfied.
Figure 3 depicts the results of CSR = 0.2 on Soil A, which was selected to represent the typical response of pore pressure and axial strain for all tests (1A–3A) that liquefied. Figure 3a reveals that the ru for all specimens reached 0.9. The sample could undergo more loading cycles as the D50 of test 1A to test 3A increased. For instance, test 3A required at least 143 cycles to liquefy, whereas test 1A liquefied after only 25 cycles. Test 3A developed pore water pressure gradually in an “s” shape, the number of cycles (N) reached 10, excess pore water pressure ratio and ru reached about 0.3, while the EPWP developed rapidly and caused initial liquefaction. In test 1A, there was an immediate increase in EPWP, followed by a gradual increase, almost linear, until initial liquefaction. Several researchers have proposed that an initial high excess pore water pressure development is caused by eliminating instability at the particle contact points and rearrangement [30,31]. Hence, a small particle size is easier to rearrange than a larger one at the same level of CSR. In addition, the EPWP development of test 2A followed the same trend as the sample of test 3A, whereas the N of test 1A was less than test 3A. In terms of axial strain development, as illustrated in Figure 3b, the axial strain and pore water pressure increment were mutually consistent, as r u = 0.9 and ε DA = 5 % were reached at a similar number of cycles. N reaching ε DA = 5 % increased with the specimen increasing from test 1A to test 3A. The axial strain development of test 3A remained stable until about 130 cycles, after which it increased rapidly until ε DA achieved 5%. In contrast, the ε DA of test 1A reached 5% after 20 cycles. N when ε DA   reached 5% of test 2A was between test 1A and test 3A. The change in D50 can positively impact the undrained cyclic behavior of coral gravelly soils.
Figure 4 illustrates the development of excess pore water pressure and axial strain in Soil B when CSR = 0.23. Figure 4a indicates that all tests (1B–4B) reached the initial liquefaction state under cyclic loading. Unlike the undrained cyclic behavior of Soil A, the undrained cyclic behavior of Soil B was unaffected by an increase in Cu. In other words, the effect of Cu on undrained cyclic behavior is not considered significant compared to the effect of D50. For example, N increased from test 1B to test 3B. Only three cycles were required for test 1B to liquefy, while N for test 3B took almost 44 cycles to reach the liquefaction state. Notably, N for test 4B was less than for test 3B when this specimen attained the initial liquefaction state. Figure 4b illustrates the axial strain development for Soil B under the same conditions. It demonstrates that an immediate deformation to reach ε DA = 5 % occurred after three cycles for test 1B, whereas the axial strain gradually increased stepwise until ε DA = 5 % in test 3B. However, the axial strain trend was similar between the specimens of test 4B and test 2B. The same N was required to ε DA = 5 % for test 4B and test 2B under the same CSR level. These results indicate that Cu does not affect the cyclic behavior of coral gravelly soils. This observation may be crucial for Cu and requires further evaluation as more data are collected on coral gravelly soils.

3.2. Pore Pressure Development

Figure 5 displays the trend of pore pressure development under an undrained cyclic triaxial test. The ru was selected at the end of the loading cycle as a function of the normalized cycles ratio N/NL (at ε DA = 5 % ). The number of cycles (N) was normalized to the number of cycles (NL) to liquefaction when ε DA = 5 % occurred. Figure 5 indicates three stages in the EPWP development curve when the CSR was between 0.18 and 0.20. First, all samples showed an increase in ru after initial cyclic loading. Second, the ru trend was developed gradually with increasing cyclic loading until r u     0.8 0.9 . Finally, an immediate increase in ru was observed when N/NL = 0.8–1.0. Figure 5 shows that the ru in any specimen improved almost linearly with increasing N/NL, and the CSR was 0.23 for all samples. In addition, Figure 5 compares the trend of ru development in all samples subjected to a higher level of CSR. It exhibits that ru rapidly approached 0.90 during the initial loading cycles in the EPWP development curve when all samples were subjected to a CSR of 0.25, followed by a gradual increase to 1.0. Based on a small number of tests, the trend of the EPWP development curve is consistent when samples undergo comparable CSR levels. Figure 5 displays the EPWP development upper and lower bound curves for siliceous sand [32] and gravel [33]. It demonstrates that the EPWP development pattern of the tested materials exceeded the upper bound curves of siliceous sand and fell below the upper bound curves of gravel.
In order to gain a better understanding of the relationship between ru and N/NL, Seed et al. [34] proposed an empirical model using data from undrained, stress-controlled cyclic triaxial tests in siliceous sand. The empirical model is given in Equation (1) as follows:
r u = 1 2 + 1 π arcsin 2 N   N L 1 / θ   1
where θ is an empirical constant that is a function of the soil properties and test conditions, whose value is listed in Table 2 to fit the experimental data. Booker et al. [35] proposed an alternative and simplified version in Equation (2) as follows:
r u = 2 π arcsin ( N N L ) 1 2 θ
A comparison of this study’s test results to a limiting curve predicted by the model [34] is displayed in Figure 6 as a solid blue line. Seed’s model captures the experimental data relatively well when CSR = 0.18–0.20. However, the model proposed in [34] did not capture the measured generation of pore pressure for this research when the value of CSRs was between 0.23 and 0.25. Ma et al. [36] discussed a modified Seed’s model using data from undrained cyclic triaxial tests conducted on Nansha Island coral sand and obtained its Equation (3) as follows:
r u = a × 2 π arcsin ( N N L ) 1 / 2 θ + b × arctan ( N N L )
where a, θ, and b are three fitting parameters for defining different CSR levels (Table 2).
Table 2. Fitting parameters reconstructed based on Seed’s model [34] and the modified Seed’s model proposed by [36].
ReferenceCSRaθbR2
Seed et al. [34]0.18–0.20NA1.2NA0.93
0.23NA1.83NA0.89
0.25NA3.1NA0.77
Present study
Ma et al. [36]
0.18–0.201.7981.059−0.6060.97
0.231.1140.980.250.98
0.250.8200.450.610.95
Experiment data from this research (Figure 6) agree with the prediction of the proposed modified Seed’s model by [36], and the regression analysis yielded values for parameters a, θ, and b, as reported in Table 2. Therefore, the EPWP development upper and lower bound curves of the tested materials are shown in Figure 7. For comparison with existing EPWP development upper and lower bound curves, Figure 7 reveals that the EPWP development upper and lower bound curves for soil materials range from sand [32] and sand-silt mixtures [37,38] to gravels [33,39,40,41]. The gradation characteristics of the soil materials are summarized in Table 3. Figure 7 depicts the EPWP development upper and lower bound curve for various soil materials as reported in the literature. This study’s undrained cyclic triaxial test data exhibited the EPWP upper and lower bounds for coral gravelly soils between the EPWP upper bound of [32] for sands and the EPWP upper bound of [41] for gravels. For instance, the lower bound for the materials tested fell above that for sands [32] and gravels [39] when N/NL was approximately 0.70. In contrast, the upper bound from this study fell almost below the upper bound of [41] when N/NL was less than approximately 0.70 and fell near the upper bound of [37]. In addition, Banerjee et al.’s [33] data and Haeri et al.’s [41] data had a higher upper bound than the gravel and coral gravelly soils in this study. The gravelly sand [41] lower boundary fell near the lower bound from this study. As shown in Table 3, Orville gravel tested by Banerjee et al. [41] had the highest Cu of 47. The next highest Cu was of Tehran alluvium (Cu = 28) that was tested by Haeri et al. [41]. Folsom gravel tested by Hynes [40] had a Cu of 14. The gravel tested by Evans et al. [39] had a Cu of 1.3. Additionally, the sand-silt mixtures tested by Porcino et al. [37] had a Cu that ranged from 2.8 to 24. The gravel-sand mixtures tested by Huber et al. [40] had a Cu that ranged from 1.4 to 26. Coral gravelly soils had a Cu from 1.06–5.00 in this study. The upper and lower boundary of coral gravelly soils were within the upper and lower boundary of gravels. Meanwhile, Hubler et al. [38] explained that EPWP development responses can have a wide range due to the gradation characteristics of materials.

3.3. Cyclic Liquefaction Resistance

Cyclic liquefaction resistance plays a vital role in liquefaction susceptibility. The liquefaction resistance curve determines the relationship between CSR and NL (N to liquefaction at ε DA = 5 % ). Figure 8 depicts the liquefaction resistance curve of Soil A with σ c = 100   kPa   and   D r = 40 % . Each test-related data point was fitted with a power-law function [42]:
CSR N L b
where b is a fitting parameter.
The dashed lines in Figure 8 represent the fitted curves for liquefaction resistance curves during tests 1A–3A. It indicates that as the CSR increased for any sample, N required to reach ε DA = 5 % decreased. In addition, the samples’ liquefaction resistance grew as D50 increased.
Figure 9 illustrates the liquefaction resistance curves for Soil B with σ c = 100   kPa and D r = 40 % . The discrete data points related to the same test were fitted by Equation (4), and the fitted curves (dashed lines) represent the liquefaction resistance curves for tests 1B–4B. The liquefaction resistance curve of Soil B is more complicated than that of Soil A. The liquefaction resistance curves intersect when the value of Cu = 5.00 (test 4B), indicating that the effect of Cu on NL depends on CSR. The liquefaction resistance curve moves rightwards as Cu = 1.06 (test 1B) and increases to Cu = 3.62 (test 3B), then leftwards until Cu = 5.00 (test 4B). Hence, the liquefaction susceptibility of coral gravelly soils first rises and then reduces with the increase in Cu.
In order to observe the effect of PSD on strength, Figure 8 depicts the relationship between cyclic liquefaction resistance and D50, whereas Figure 9 illustrates Cu for the same Dr and σ c . The sample’s cyclic liquefaction resistance from the liquefaction resistance curves is defined as the cyclic resistance ratios (CSR) for 5% DA axial strain corresponding to NL = 20, CRR20 ( ε DA = 5 % ) [43].
Figure 10 depicts the impact of D50 on CRR20 for each Dr = 40%. CRR20 increases as D50 rises. The data points of [10] in Figure 10 reveal a similar trend for sand, although Dr differed from the experiment in this study. In other words, a smaller D50 for coral gravelly soil can be less cyclic liquefaction resistance. Figure 11 shows the effect of Cu on CRR20 for each Dr = 40%. An increase in Cu from 1.06 increased CRR20 until Cu = 3.62 and then decreased CRR20 upon further increase in Cu. In addition, the effect of Cu on CRR20 for coral gravelly soils and the impact of Cu on CRR20 reported in the literature [8,9,44] were compared, as shown in Figure 11. The results in Figure 11 indicate that the cyclic liquefaction resistance curves have a turning point for certain soils with large Cu, i.e., river soils (RS) at Dr = 35% [9]. In this study, the cyclic liquefaction resistance tended to increase as Cu grew before Cu = 3.62, while an opposite behavior was observed after Cu = 3.62. Meanwhile, Earl Greek sand [8] also had a similar liquefaction resistance trend. Data from [44] indicate that the liquefaction susceptibility initially increases as Cu rises until Cu = 3.0, and then the cyclic liquefaction resistance presents an opposite trend with an increase in Cu. Although decomposed granite soils (DGS) [9] and coral gravelly soils are different soil materials, Figure 11 displays the same test result for DGS, where an increase in Cu caused a slight decrease in cyclic liquefaction resistance. In addition, when Cu > 3.79, an increase in Cu decreased cyclic liquefaction resistance for soil materials, as seen in Figure 11. However, the impact of Cu on cyclic liquefaction resistance can depend on the type of soil materials when Cu < 3.79. Meanwhile, the cyclic liquefaction resistance largely depends on the relative density in the same soil materials, i.e., river soils at Dr = 20% and Dr = 35%. It will be interesting to know whether the phenomenon can be observed in other soil materials. In addition, more undrained cyclic triaxial tests should be utilized to explain why an increase in Cu raises the cyclic liquefaction resistance for coral gravelly soils when Cu < 3.62, and the opposite trend occurs with an increase in DGS.

4. Conclusions

This study uses a series of undrained cyclic loading triaxial tests to investigate the effect of two groups of PSDs on the undrained behavior and the cyclic liquefaction resistance of coral gravelly soils under a 100 kPa initial confining pressure and at a 40% relative density. Within the study context, two groups of PSDs are developed: one including D50 values of 2.35, 4.70, and 7.05 mm with identical Cu and one including Cu values of 1.06, 3.40, 3.62, and 5.00 with identical D50. All samples are subjected to varying levels of CSR until the liquefaction state is reached. Samples of undrained cyclic behavior under comparable CSR levels are observed. Then, the EPWP development is investigated under various CSR values. Finally, the effect of two groups of PSDs on the cyclic liquefaction resistance is compared and discussed. The primary findings of this study are as follows:
(1).
The PSD characteristics of coral gravelly soils affect their dynamic behavior under the same conditions. The undrained cyclic behavior exhibits a positive trend for different D50 values with identical Cu. However, Cu with identical D50 does not affect undrained cyclic behavior for coral gravelly particles.
(2).
Material gradation characteristics cause a various range of EPWP generation. The upper bound of coral gravelly soils exceeds the upper bound of siliceous sands, while the upper bound falls below the upper bound of gravels. Additionally, when the samples are exposed to the same CSR levels, the trend of EPWP development is consistent.
(3).
Various PSDs also impact the cyclic liquefaction resistance of marine soil. Especially, an increase in D50 improves CRR20 for samples with various D50 at the same Cu. In contrast, for samples with various Cu, an increase in Cu from 1.06 initially raises CRR20 until Cu = 3.62 and then reduces CRR20 upon a further increase in Cu. A similar trend can be seen in onshore foundation soils. The cyclic liquefaction resistance provides a reference for the seismic design of port and harbor facilities.
This study’s results explain the relationship between PSD and the liquefaction susceptibility of coral gravelly soils. However, some limitations are noteworthy. For instance, the current tested materials are limited to coral gravelly soils, and the Cu range is small. Hence, future research should utilize more soil materials with a wide range of Cu to evaluate PSD’s impact on liquefaction susceptibility.

Author Contributions

Conceptualization, S.G., J.C., Y.S. and Y.L.; data collection, S.G., K.C. and K.Y.; data analysis, S.G., Y.S. and K.C.; data interpretation, S.G., J.C., Y.S. and Y.L.; writing—original draft preparation, S.G., J.C., Y.S., K.C. and K.Y.; writing—review and editing, S.G., J.C., Y.S. and Y.L. All authors have read and agreed to the published version of the manuscript.

Funding

This research was supported by the National Key Research and Development Program of China (No. 2022YFC3003601), the National Natural Science Foundation of China (No. 52008121), the Key International (Regional) Joint Research Project (No. 52020105002), and the Natural Science Foundation of Guangdong Province under the Program on the Surface (grant No. 2023A1515012163).

Institutional Review Board Statement

Not applicable.

Informed Consent Statement

Not applicable.

Data Availability Statement

The data are available on request.

Acknowledgments

The authors would like to express their gratitude for the provision of the cyclic triaxial apparatus and laboratory at Guangzhou University.

Conflicts of Interest

The authors declare no conflict of interest.

Nomenclature

PSDParticle size distribution
CuUniformity coefficient
D50Mean particle size (unit: mm)
D60Diameter that corresponds to 60% finer in the particle size distribution curve (unit: mm)
D30Diameter that corresponds to 30% finer in the particle size distribution curve (unit: mm)
D10Diameter that corresponds to 10% finer in the particle size distribution curve (unit: mm)
CcCurvature coefficient
GsSpecific gravity
ρd,maxMaximum dry density
ρd,minMinimum dry density
DrRelative density (unit: %)
CSRCyclic stress ratio
qDeviator stress (unit: kPa)
σ c Effective confining pressure (unit: kPa)
ruExcess pore water pressure ratio
ΔuExcess pore water pressure (unit: kPa)
εDADouble amplitude strain (unit: %)
NNumber of cycles
NLNumber of cycles to liquefaction at ε DA = 5 %  
aFitting parameter
θFitting parameter
bFitting parameter
CRR20Cyclic stress ratio (CSR) for 5% double amplitude axial strain corresponding to NL = 20
EPWPExcess pore water pressure
DADouble amplitude
SASingle amplitude
RSRiver soils
DGSDecomposed granite soils

References

  1. Castro, G.; Poulos, S.J. Factors affecting Liquefaction and cyclic mobility. J. Geotech. Eng. Div. 1977, 103, 498–510. [Google Scholar] [CrossRef]
  2. Vaid, Y.P.; Chern, J.C.; Tumi, H. Confinement pressure, grain angularity and liquefaction. J. Geotech. Eng. 1985, 111, 1229–1235. [Google Scholar] [CrossRef]
  3. Ishihara, K. Liquefaction and flow failure during earthquake. Géotechnique 1993, 43, 351–451. [Google Scholar] [CrossRef]
  4. Chiaro, G.; Koseki, J.; Sato, T. Effects of initial static shear on liquefaction and large deformation properties of loose saturated Toyoura sand in undrained cyclic torsional shear tests. Soils Found. 2012, 52, 498–510. [Google Scholar] [CrossRef] [Green Version]
  5. Witchmann, T.; Triantafylidis, T. An experimental database for the development, calibration and verification of constitutive models for sand with focus to cyclic loading: Part I-tests with monotonic loading and stress cycles. Acta Geotech. 2016, 11, 739–761. [Google Scholar] [CrossRef]
  6. Vargas, R.R.; Ueda, K.; Uemura, K. Influence of the relative density and K0 effects in the cyclic response of Ottawa F-65 sand-cyclic Torsional Hollow-Cylinder shear tests for LEAP-ASIA-2019. Soil Dyn. Earthq. Eng. 2020, 133, 106111. [Google Scholar] [CrossRef]
  7. Banerjee, S.K.; Yang, M.; Taiebat, M. Effect of coefficient of uniformity on cyclic liquefaction resistance of granular materials. J. Comput. Geothech. 2023, 155, 105232. [Google Scholar] [CrossRef]
  8. Vaid, Y.; Fisher, J.; Kuerbis, R.; Negussey, D. Particle gradation and liquefaction. J. Geotech. Eng. 1990, 116, 698–703. [Google Scholar] [CrossRef]
  9. Kokusho, T.; Hara, T.; Hiraoka, R. Undrained shear strength of granular soils with different particle gradations. J. Geotech. Geoenviron. Eng. 2004, 130, 621–629. [Google Scholar] [CrossRef]
  10. Yilmaz, Y.; Mollamahmutoglu, M. Characterization of liquefaction susceptibility of sands by mean of extreme void ratios and/or void ratio range. J. Geotech. Geoenviron. Eng. 2009, 135, 1986–1990. [Google Scholar] [CrossRef]
  11. Mejia, L.H.; Yeuang, R. Liquefaction of coralline soils during the 1993 Guam Earthquake. In Proceedings of the Earthquake-Induced Movements and Seismic Remediation of Existing Foundations and Abutments, San Diego, CA, USA, 23–27 October 1995; Soils Dynamics Committee of the Geotechnical Engineering Division; ASCE: Reston, VA, USA, 1995. [Google Scholar]
  12. Medley, E.W. Geological engineering reconnaissance of damage caused by the October 15, 2006, Hawaii earthquakes. Int. J. Geoeng. Case Hist. 2007, 1, 89–135. [Google Scholar]
  13. Green, R.A.; Olson, S.M.; Cox, B.R.; Rix, G.J.; Bachhuber, J.; Martin, N. Geotechnical aspects of failures at Port-au-Prince seaport during the 12 January 2010 Haiti earthquake. Earthq. Spectra 2011, 27 (Suppl. S1), 43–65. [Google Scholar] [CrossRef] [Green Version]
  14. Buddemeier, R.W.; Kinzie, R.A. Coral growth. Ocenogr. Mar. Biol. Annu. Rev. 1976, 14, 183–225. [Google Scholar]
  15. Nalin, R.; Bracchi, V.A.; Basso, D.; Massari, F. Persistisstrombus latus (Gmelin) in the upper Pleistocene deposits of the marine terraces of the Crotone peninsula. Ital. J. Geosci. 2012, 131, 95–101. [Google Scholar]
  16. Coop, M.R.; Airey, D.W. Carbonate sands. In Characterization and Engineering Properties of Natural Soils; Tan, T.S., Phoon, K.K., Hight, D.W., Leroueil, S., Eds.; Taylor and Francis: London, UK, 2002; pp. 1048–1086. [Google Scholar]
  17. Datta, M.; Guhati, S.K.; Rao, G.V. Engineering behavior of carbonate soils of India and some observations on classification of such soils. ASTM Spec. Tech. Publ. 1982, 777, 113–140. [Google Scholar]
  18. Hyodo, M.; Hyde, A.F.L.; Aramaki, N. Cyclic strength and deformation of crushable carbonate sand. Soil Dyn. Earthq. Eng. 1996, 15, 331. [Google Scholar] [CrossRef]
  19. Hyodo, M.; Hyde, A.F.L.; Aramaki, N. Liquefation of crushable soils. Géotechnique 1998, 48, 527–543. [Google Scholar] [CrossRef]
  20. Sandoval, E.A.; Pando, M.A. Experimental assessment of the liquefaction resistance of calcareous biogenous sands. J. Earth Sci. Res. 2012, 16, 55–63. [Google Scholar]
  21. Sharma, S.S.; Ismail, M.A. Monotonic and cyclic behavior of two calcareous soils of different origins. J. Geotech. Geoenviron. Eng. 2006, 132, 1581–1591. [Google Scholar] [CrossRef]
  22. Salem, H.; Elmamlouk, H.; Agaiby, S. Static and cyclic behavior of North Coast calcareous sand in Egypt. Soil Dyn. Earthq. Eng. 2013, 55, 83–91. [Google Scholar] [CrossRef]
  23. Li, Y.B.; Lin, Z.H.; Li, B.; He, L.; Gong, J. Effects of gradation and grain crushing on the liquefaction resistance of calcareous sand. Geomech. Geophys. Geo-Energ. Geo-Resour. 2012, 7, 12. [Google Scholar] [CrossRef]
  24. Ministry of Transportation of Japan. Design standard for port and harbour facilities and commentaries. In Japan Port and Harbour Association, English Edition (2001); The Overseas Coastal Area Development Institute of Japan: Tokyo, Japan, 1999; p. 1181. [Google Scholar]
  25. GB/T50123-2019; Chinese Ministry of Water Resources. Chinese National Standard of Soil Test Method. China Planning Press: Beijing, China, 2019. (In Chinese)
  26. SL237-1999; Nanjing Hydraulic Research Institute. Chinese National Standard Specification of Soil Test. China Water and Power Press: Beijing, China, 1999. (In Chinese)
  27. Ladd, R.S. Preparing test specimens using undercompaction. Geotech. Test. J. 1978, 1, 16–23. [Google Scholar]
  28. Kong, X.J.; Xu, B.; Zou, D.G. Experimental study on the behavior of and-gravel composites liquefaction. In Soil Stress-Strain Behavior: Measurement, Modeling and Analysis, Proceedings of the Geotechnical Symposium, Rome, Italy, 16–17 March 2006; Ling, H.I., Callisto, L., Leshchinsky, D., Koseki, J., Eds.; Solid Mechanics and Its Applications; Springer: Dordrecht, The Netherlands, 2007; Volume 146. [Google Scholar]
  29. Flora, A.; Lirer, S.; Silvestri, F. Undrained cyclic resistance of undisturbed gravelly soils. Soil Dyn. Earthq. Eng. 2012, 43, 366–379. [Google Scholar] [CrossRef]
  30. Alarcon-Guzman, A.; Leonards, G.A.; Chameau, J.L. Undrained monotonic and cyclic strength of sand. J. Geotech. Eng. 1998, 114, 1089–1109. [Google Scholar] [CrossRef]
  31. Geogiannou, V.N.; Tsomokos, A.; Stavrou, K. Monotonic and cyclic behaviour of sand under torsional loading. Geotechnique 2008, 58, 113–124. [Google Scholar] [CrossRef]
  32. Lee, K.L.; Albaisa, A. Earthquake induced settlements in saturated sands. J. Geotech. Geoenviron. Eng. 1974, 100, 387–406. [Google Scholar]
  33. Banerjee, N.G.; Seed, H.B.; Chan, C.K. Cyclic Behavior of Dense Coarse-Grained Materials in Relation to the Seismic Stability of Dams; University of California: Berkeley, CA, USA, 1979. [Google Scholar]
  34. Seed, H.B.; Martain, P.P.; Lysmer, J. The Generation and Dissipation of Pore-Water Pressures during Soil Liquefaction; University of California: Berkeley, CA, USA, 1975. [Google Scholar]
  35. Booker, J.R.; Rahman, M.S.; Seed, H.B. GADFLEA: A Computer Program for the Analysis of Pore Pressure Generation and Dissipation during Cyclic or Earthquake Loading; University of California: Berkeley, CA, USA, 1976. [Google Scholar]
  36. Ma, W.J.; Chen, G.X.; Lei, L. Experimental study on liquefaction characteristics of saturated coral sand in Nansha Island under cyclic loading. Chin. J. Geotech. Eng. 2019, 41, 982–988. (In Chinese) [Google Scholar]
  37. Porcino, D.; Diano, V. Laboratory study on pore pressure generation and liquefaction of low-plasticity silty sandy soils during the 2012 earthquake in Italy. J. Geotech. Geoenviron. Eng. 2016, 142, 04016048. [Google Scholar] [CrossRef]
  38. Hubler, J.F.; Adda, A.Z.; Zekkos, D. Pore pressure generation of Gravelly soils in constant Volume Cyclic Simple Shear. J. Geotech. Geoenviron. Eng. 2022, 149, 04022130. [Google Scholar] [CrossRef]
  39. Evans, M.D.; Seed, H.B. Undrained Cyclic Triaxial Testing of Gravels—The Effect of Membrane Compliance; University of California: Berkeley, CA, USA, 1979. [Google Scholar]
  40. Hynes, M.E. Pore Pressure Generation Characteristics of Gravel under Undrained Cyclic Loading; University of California: Berkeley, CA, USA, 1988. [Google Scholar]
  41. Haeri, S.M.; Shakeri, M.R. Effects of membrane compliance on pore water pressure generation in gravelly sands under cyclic loading. J. Geotech. Test. 2010, 33, 375–384. [Google Scholar]
  42. Idriss, I.M.; Boulanger, R.W. Soil Liquefaction during Earthquakes; Earthquake Engineering Research Institute: Oakland, CA, USA, 2008. [Google Scholar]
  43. Martin, G.R.; Finn, W.D.L.; Seed, H.B. Fundamentals of liquefaction under cyclic loading. J. Geotech. Eng. Div. 1975, 101, 423–438. [Google Scholar] [CrossRef]
  44. Tanaka, Y.; Kokusho, T.; Yoshida, Y.; Ikemi, M.A. Study on the Mechanical Properties of Sandy Gravel—Dynamic Properties of Reconstituted Sample; Research Report; Central Research Institute of Electric Power Industry: Abiko, Japan, 1987. (In Japanese) [Google Scholar]
Figure 1. Coral gravelly soils: (a) coral gravelly soil (b) ranges of particle size of coral gravelly soils.
Jmse 11 01356 g001
Figure 2. Particle size distribution (PSD) curves: (a) ranges of PSD of original coral sand and Soil A; (b) ranges of PSD of Soil B, along with boundaries of liquefaction susceptibility by the Ministry of Transportation of Japan [24].
Jmse 11 01356 g002
Figure 3. Typical undrained cyclic behavior of Soil A: (a) the development of EPWP versus N; (b) the development of axial strain versus N.
Jmse 11 01356 g003
Figure 4. Typical undrained cyclic behavior of Soil B: (a) the development of EPWP versus N; (b) the development of axial strain versus N.
Jmse 11 01356 g004
Figure 5. Generation curves of EPWP for materials tested [32,33].
Jmse 11 01356 g005
Figure 6. Comparison between experimental data and prediction data for EPWP development of coral gravelly soils under various values of CSRs: (a) CSR = 0.18–0.20; (b) CSR = 0.23; (c) CSR = 0.25 [34,36].
Jmse 11 01356 g006
Figure 7. Comparison of upper and lower bound values of ru versus N/NL for materials from the literature and this study [32,33,37,38,39,40,41].
Jmse 11 01356 g007
Figure 8. Relationship between CSR and NL for Soil A with identical Dr and σ c . The dashed lines are power-law fits to the data points. Solid lines at NL = 20 inform the plots of cyclic liquefaction resistance.
Jmse 11 01356 g008
Figure 9. Relationship between CSR and NL for Soil B with the same Dr and σ c . The dashed lines are power-law fits to the data points. Solid lines at NL = 20 inform the plots of cyclic liquefaction resistance.
Jmse 11 01356 g009
Figure 10. Effect of D50 on liquefaction resistance quantified by CRR20 [10].
Jmse 11 01356 g010
Figure 11. Effect of Cu on liquefaction resistance quantified by CRR20 [8,9,44].
Jmse 11 01356 g011
Table 1. Physical properties of the materials tested and original coral sand.
PSD
Curves
SpecimenD60
(mm)
D50
(mm)
D30
(mm)
D10
(mm)
CuCcρd,max
(g/cm3)
ρd,min
(g/cm3)
Gs
(g/cm3)
Original coral sand 0.540.470.340.252.170.830.821.532.77
Soil A1A2.732.351.691.262.170.831.3521.2412.79
2A5.474.703.392.522.170.831.2401.110
3A8.217.055.073.872.170.831.1010.942
Soil B1B8.007.507.507.501.060.931.0580.969
2B8.507.505.572.503.401.461.1631.019
3B10.007.505.002.763.620.911.1711.020
4B15.007.504.143.005.000.381.1821.022
Table 3. Summary of index properties of soils materials as reported in the literature [33,37,38,39,40,41].
ReferenceSoil MaterialD50CuCc
Banerjee et al. [33]Gravel9.53473.85
Porcino et al. [37]Sandy silt0.03–0.322.8–241.48–4.05
Huber et al. [38]Sand-gravel mix0.37–9.001.4–260.10–1.67
Evans et al. [39]Gravel6.001.31.03
Hynes et al. [40]Gravel22.2143.00
Haeri et al. [41]Gravelly sand4.00281.80
Disclaimer/Publisher’s Note: The statements, opinions and data contained in all publications are solely those of the individual author(s) and contributor(s) and not of MDPI and/or the editor(s). MDPI and/or the editor(s) disclaim responsibility for any injury to people or property resulting from any ideas, methods, instructions or products referred to in the content.

