Article

A Smart Risk Assessment Tool for Decision Support during Ship Evacuation

by
Nikolaos P. Ventikos
,
Alexandros Koimtzoglou
*,
Konstantinos Louzis
,
Nikolaos Themelis
and
Marios-Anestis Koimtzoglou
*
School of Naval Architecture and Marine Engineering, National Technical University of Athens (NTUA), 157 80 Athens, Greece
*
Authors to whom correspondence should be addressed.
J. Mar. Sci. Eng. 2023, 11(5), 1014; https://doi.org/10.3390/jmse11051014
Submission received: 30 March 2023 / Revised: 24 April 2023 / Accepted: 4 May 2023 / Published: 10 May 2023

Abstract

:
In case of a ship emergency situation and during its evolvement that might result in an evacuation, the master and the bridge command team of a ship have to continuously assess risk. This is a very complex procedure, as crucial decisions concerning safety are made under time pressure. The use of a decision-support tool would have a positive effect on their performance, resulting in an improvement in the way ships are evacuated. The purpose of this paper is to present the PALAEMON smart risk assessment platform (SRAP). SRAP is a real-time risk assessment platform developed to assist the decision-making process of the master and bridge command team of a ship regarding the evacuation process. Its purpose is to provide decision support for the following aspects: (1) the decision to sound the general alarm (GA) following an accident, (2) monitoring the progress of the mustering process in order to take any additional actions, and (3) the decision to abandon the ship or not. SRAP dynamically assesses the risk to the safety of the passengers and crew members in the different phases of the evacuation process, so one model in the form Bayesian networks (BNs) was developed for each stage of the evacuation process. The results of a case study that was implemented reflect how various parameters such as injuries, congestion, and the functionality of the ship’s systems affect the outcome of each model.

1. Introduction

The evacuation of a ship is a high-risk and very challenging process, especially for the people that have to make decisions regarding the safety of everyone onboard. Each stage of the process, as an incident evolves, has its own challenges and issues that need to be addressed in order to perform a successful evacuation, basically in terms of time and crowd management [1]. In case of an accident that leads to the sounding of the general alarm, all passengers need to be alerted, proceed towards the closest/safest muster stations in an orderly manner, assemble, be counted, be provided with life jackets, and be briefed regarding the situation. This is a high-risk and time-consuming process that needs to be effectively monitored by the crew members [2].
There are several approaches to trying to deal with these aspects, but the integration of smart devices with innovative methods, besides the existing ship legacy systems, is currently the way forward. In such a context, Liu et al. [3] proposed a new evacuation mechanism that considers the spatial areas of a ship together with people’s behaviour. Their goal was to generate a model of the evacuation capacity of a ship and provide an emergency decision-making system for the evacuation of crew members and passengers. Moreover, Yue et al. [4] proposed a general model and framework to simulate the entire process of cruise ship evacuation, L. Liu et al. [5] proposed an improved ant colony system (IACS) to solve the evacuation route planning of crowds on cruise ships, and Y. Liu et al. [6] proposed an evacuation strategy that considers the path capacity and risk level to guide evacuees in case of a fire. In addition, Zhang et al. [7] presented a dynamic model to quantify the domino effect of ship engine room fires.
Different quality indicators allow a comparison of different evacuation mechanisms. There are several studies approaching this subject, and some are briefly presented in the following section.
The purpose of this paper is to present the smart risk assessment platform (SRAP) as a whole. SRAP is a dynamic risk assessment digital tool that provides decision support to the master and the bridge command team of a ship during emergencies throughout all phases of the evacuation process. Specifically, the output of SRAP is a color-coded indication to the PALAEMON dashboard that provides assistance for the following decisions that should be taken after the occurrence of an accident:
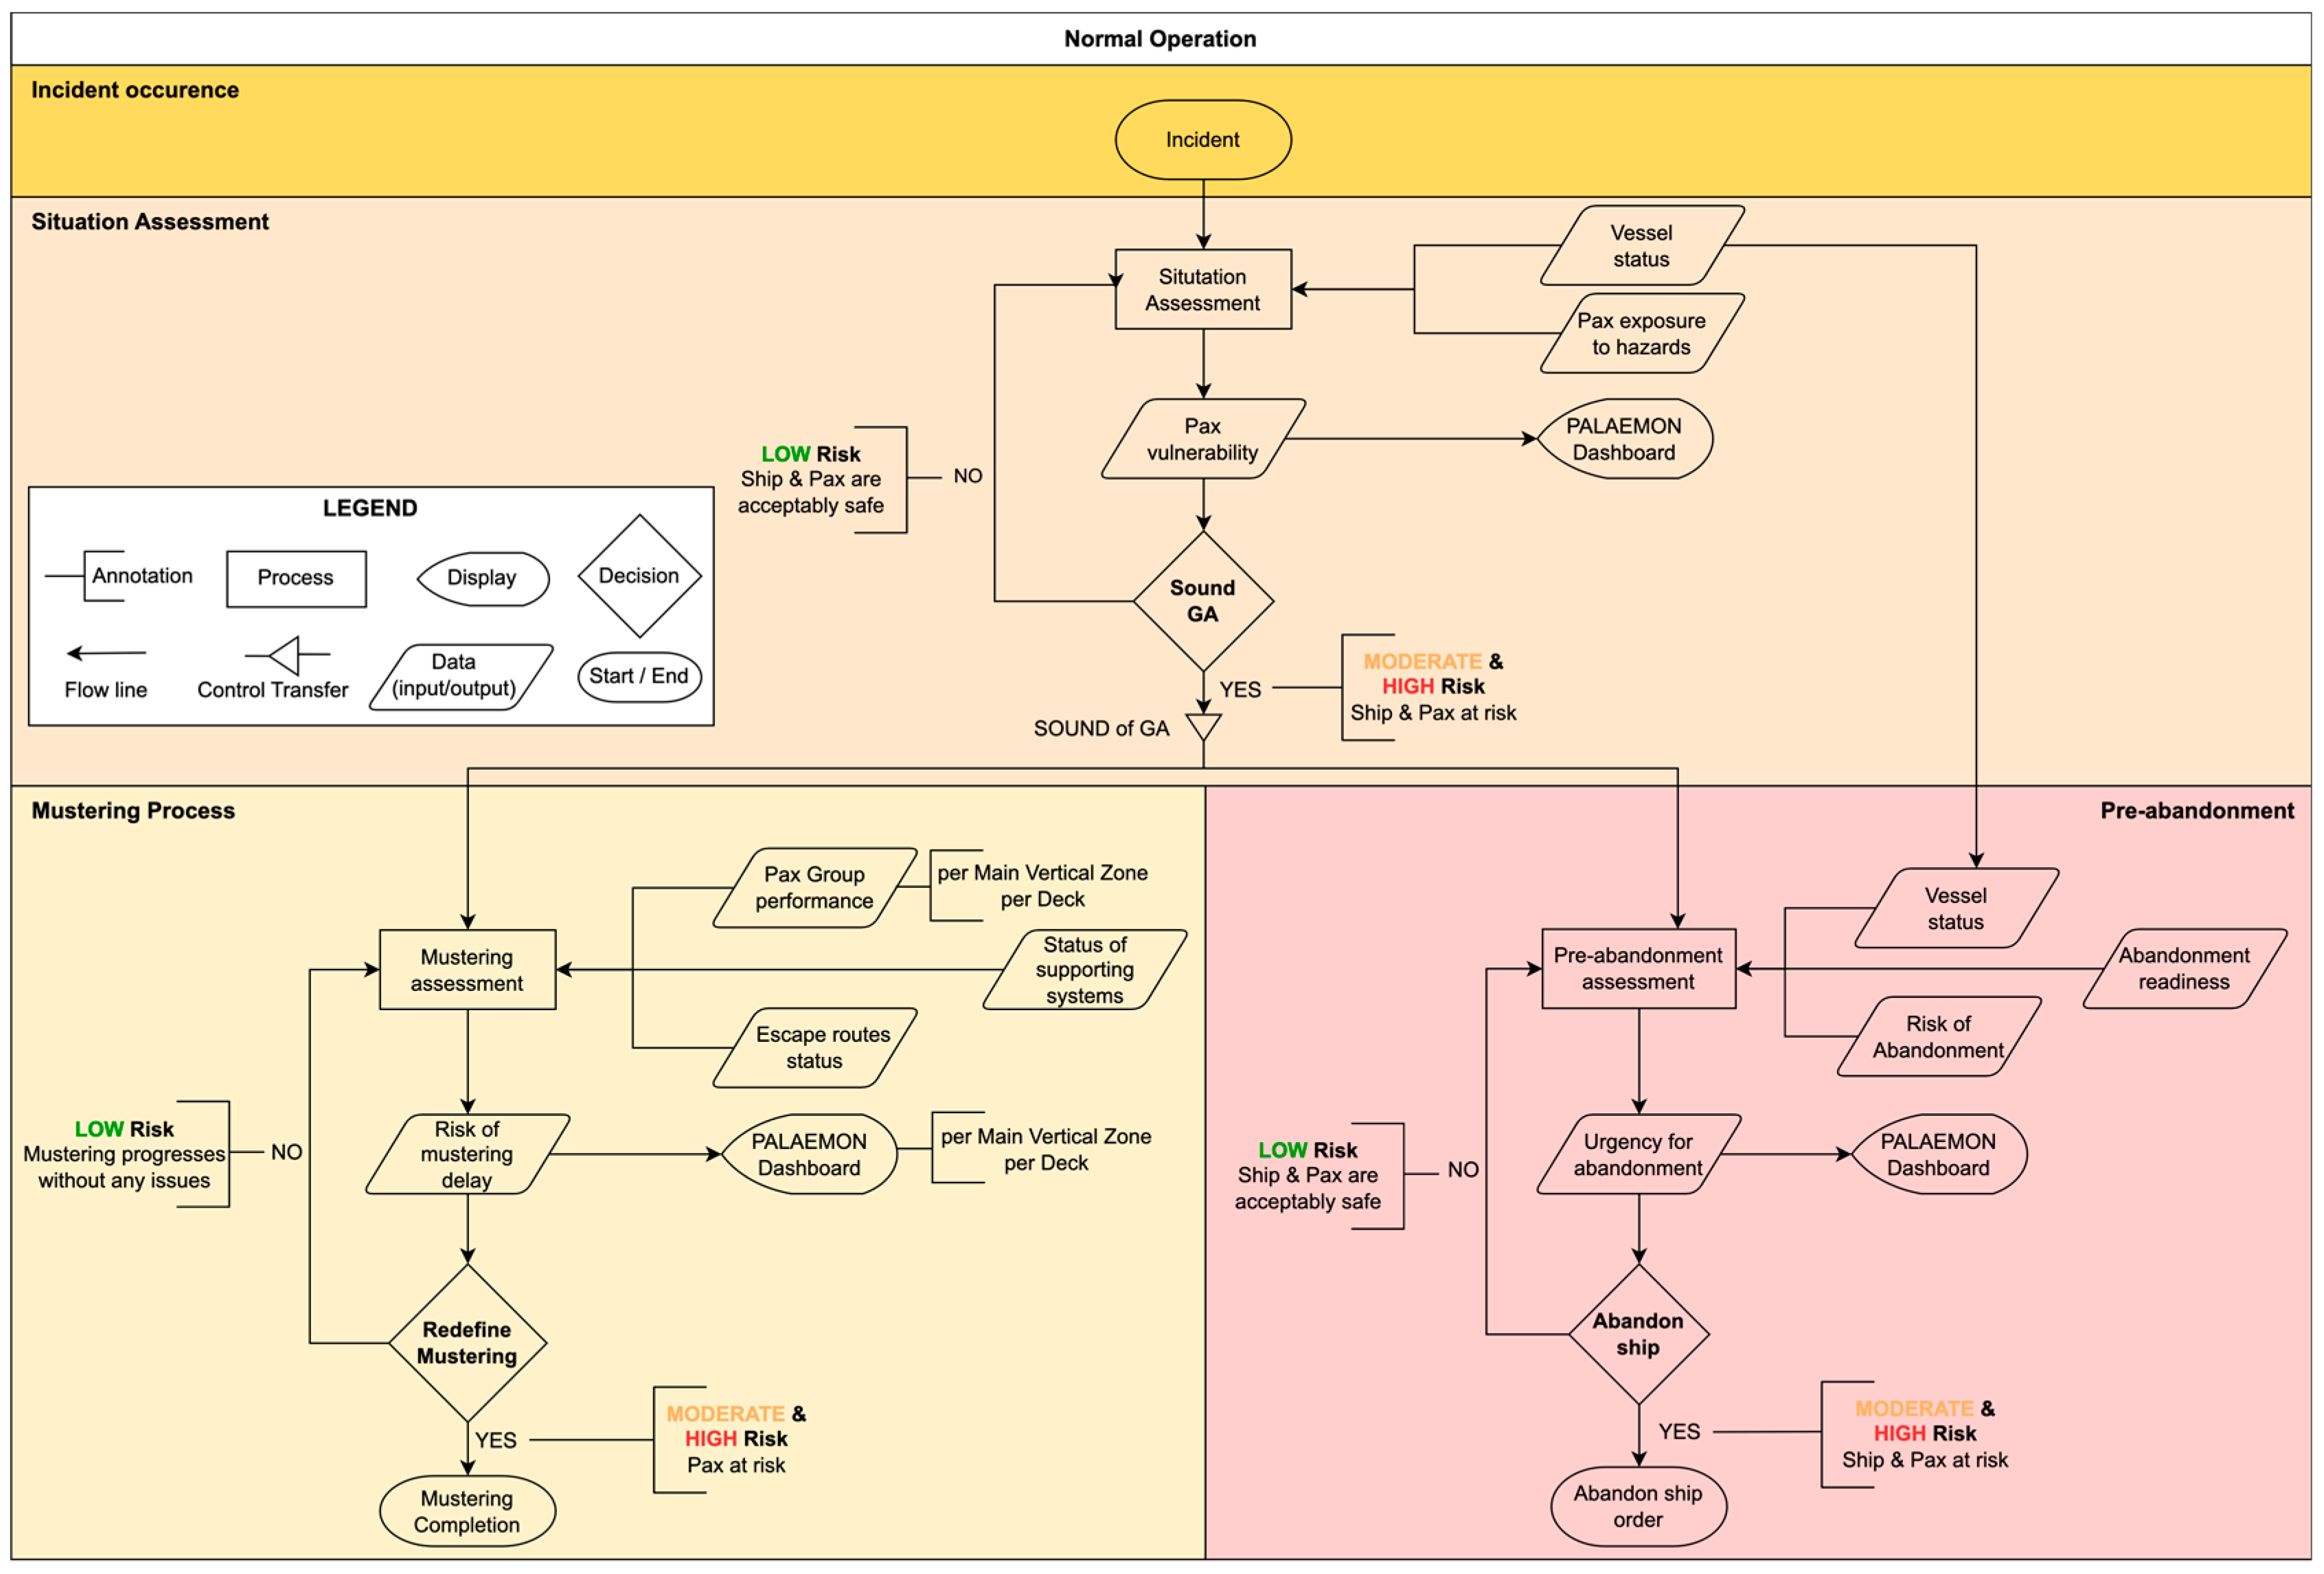
  • Whether to sound the general alarm (GA);
  • Monitoring the progress of the mustering process in order to take any additional actions if required;
  • Whether to abandon the ship or not.
The rest of the paper is structured as follows: Section 2 gives a brief overview of the literature review of studies approaching risk assessment in the maritime domain through the use of Bayesian networks (BNs). Section 3 presents the conducted accident analysis of different incidents that can lead to an evacuation. Section 4 presents the concept of the SRAP by giving the most important information for each developed risk model separately. The next five sections are dedicated to the description of the applied methodology of the development of the risk models. Section 5 provides an overview of the methodology as a whole, and Section 6, Section 7, Section 8 and Section 9 provide a detailed description of the way the risk factors were established and the way the Bayesian networks were developed, quantified, and validated, respectively. Section 10 provides a concise description of the testing of the functionality and output of all the developed risk models in one indicative case study and a commentary on the provided results, while the results are presented and discussed in Section 11. The paper concludes with an insight into the use of digital tools in the maritime domain and by presenting future work actions concerning the developed risk models. Finally, Appendix A contains a detailed description of the individual nodes of the mustering and pre-abandonment assessment BN models, as well as the assumptions that were employed in their development process.

2. Using Bayesian Networks for Risk Assessment in the Maritime Domain

BNs have proven to be useful tools for analysing the risk during an evacuation in the maritime domain [8]. There are a series of conducted studies which have used BNs in order to perform a risk assessment aiming to assist in different aspects of the maritime domain, some of them specifically considering ship evacuation.
Sarshar, Granmo, et al. [9] presented a Bayesian network model for the evacuation time during a ship fire, Sarshar, Radianti, and Gonzalez [10] developed a dynamic Bayesian network model for predicting congestion during a ship fire evacuation, which is relevant to the mustering model presented in this paper, and Sarshar, Radianti, et al. [11] also used dynamic BNs to model panic in a ship fire evacuation.
In addition, something relevant to the subject of BN utilisation projects is SmartRescue [12], the aim of which is the development of an application that can facilitate rescue teams’ coordinated threat assessment and evacuation planning by obtaining feedback on threats through smartphones. In the context of the project, BN modelling was selected to analyse the process of evacuation due to the occurrence of a ship fire. The factors causing any delay in the evacuation procedure were identified according to a literature review including the guidelines on evacuation analysis by the International Maritime Organisation (IMO) [13], real data, and practical experiences.

3. Analysis of Accidents

In the context of the study performed for this paper, five accidents were examined involving passenger ships where an evacuation was conducted. The objective of the study and the analysis of the accidents was to identify the key contributing risk factors and the prevailing conditions that affected the evacuation process in each case. So, the study of these accidents served as a basis to the applied methodology, which is thoroughly presented in the next section. Towards this end, the information items that were considered from each accident report were the incident type and location, the time of the day they occurred, the way they affected the vessel’s status, and the mitigative actions that were taken by the crew. The results of the analysis of the accident were utilised for the development of the risk factors of the SRAP models based on the methodology presented in the next section.
The studied cases were the accidents of Sorrento [14], Viking Sky [15], Carnival Liberty [16], Costa Concordia [17], and Queen of the North [18]. The selected accidents occurred after the year 2000 and included cases where the events following the accident did not unfold rapidly (i.e., there was enough time for the crew to assess the situation and carry out the evacuation process). The analysis of the accident reports resulted in identifying parameters that affected the decision-making process with respect to initiating the evacuation process. The most influential factor, which affected the decision to initiate the evacuation process, seemed to be the severity of the incident and the resulting damage to the vessel. Another important parameter was the time (day or night) the incident occurred. It was noted that, during night-time, the reaction of passengers and crew members may be delayed, and the lack of light complicated the mustering process. In the Queen of the North accident, most passengers were asleep when the ship grounded. In addition, an incorrect assessment of the situation and of the effectiveness of the mitigation actions could be a factor of major importance. For example, if a fire gets out of control, it may damage the life-saving appliances (LSAs), which was the case in the Sorrento accident. Considering that the decision to evacuate is usually made after efforts to mitigate the incident are unsuccessful, an incorrect assessment may also lead to actions being taken too late (e.g., sounding the GA).

4. The SRAP Concept

The aim of SRAP is to enhance the situational awareness of the master and bridge command team of a ship under the adverse prevailing conditions of the evacuation process and provide decision support on the incident/accident management lifecycle. In order to achieve this, SRAP performs a dynamic risk assessment to quantify in real time the risk associated with the activities before and during the evacuation process. To this end, SRAP consists of three different models, which cover the main phases of the evacuation (i.e., situation assessment, mustering, and pre-abandonment). Each model entails the dynamic calculation of a risk index on an ordinal scale. The risk characterization is provided in real time to the master and bridge command team for effective risk-informed decision support. The concept of SRAP is graphically presented in a flowchart in Figure 1.
The objective and main functionality of each model are separately described below:
  • Situation assessment model
The situation assessment model is activated after the occurrence of an incident/accident through a generated signal. Its main objective is to support the master’s decision whether to raise the general alarm (GA) in order to initiate the evacuation process. The assessment is based on the vessel’s safety status and the level of the passengers’ exposure to hazards.
  • Mustering assessment model
The mustering assessment model is activated following the sounding of the GA and aims at quantifying the mustering effectiveness in terms of delays and whether passengers are at risk as they move towards the muster stations. The main functionality is to assist crew members in identifying for which areas of the ship mitigative and/or corrective actions may be needed during the mustering process. The outcome is the level of the risk of delay and is calculated for the areas of the ship that are divided per the main vertical zone (MVZ) and the specific ship deck under examination and is visualised on a colour scale.
  • Pre-abandonment model
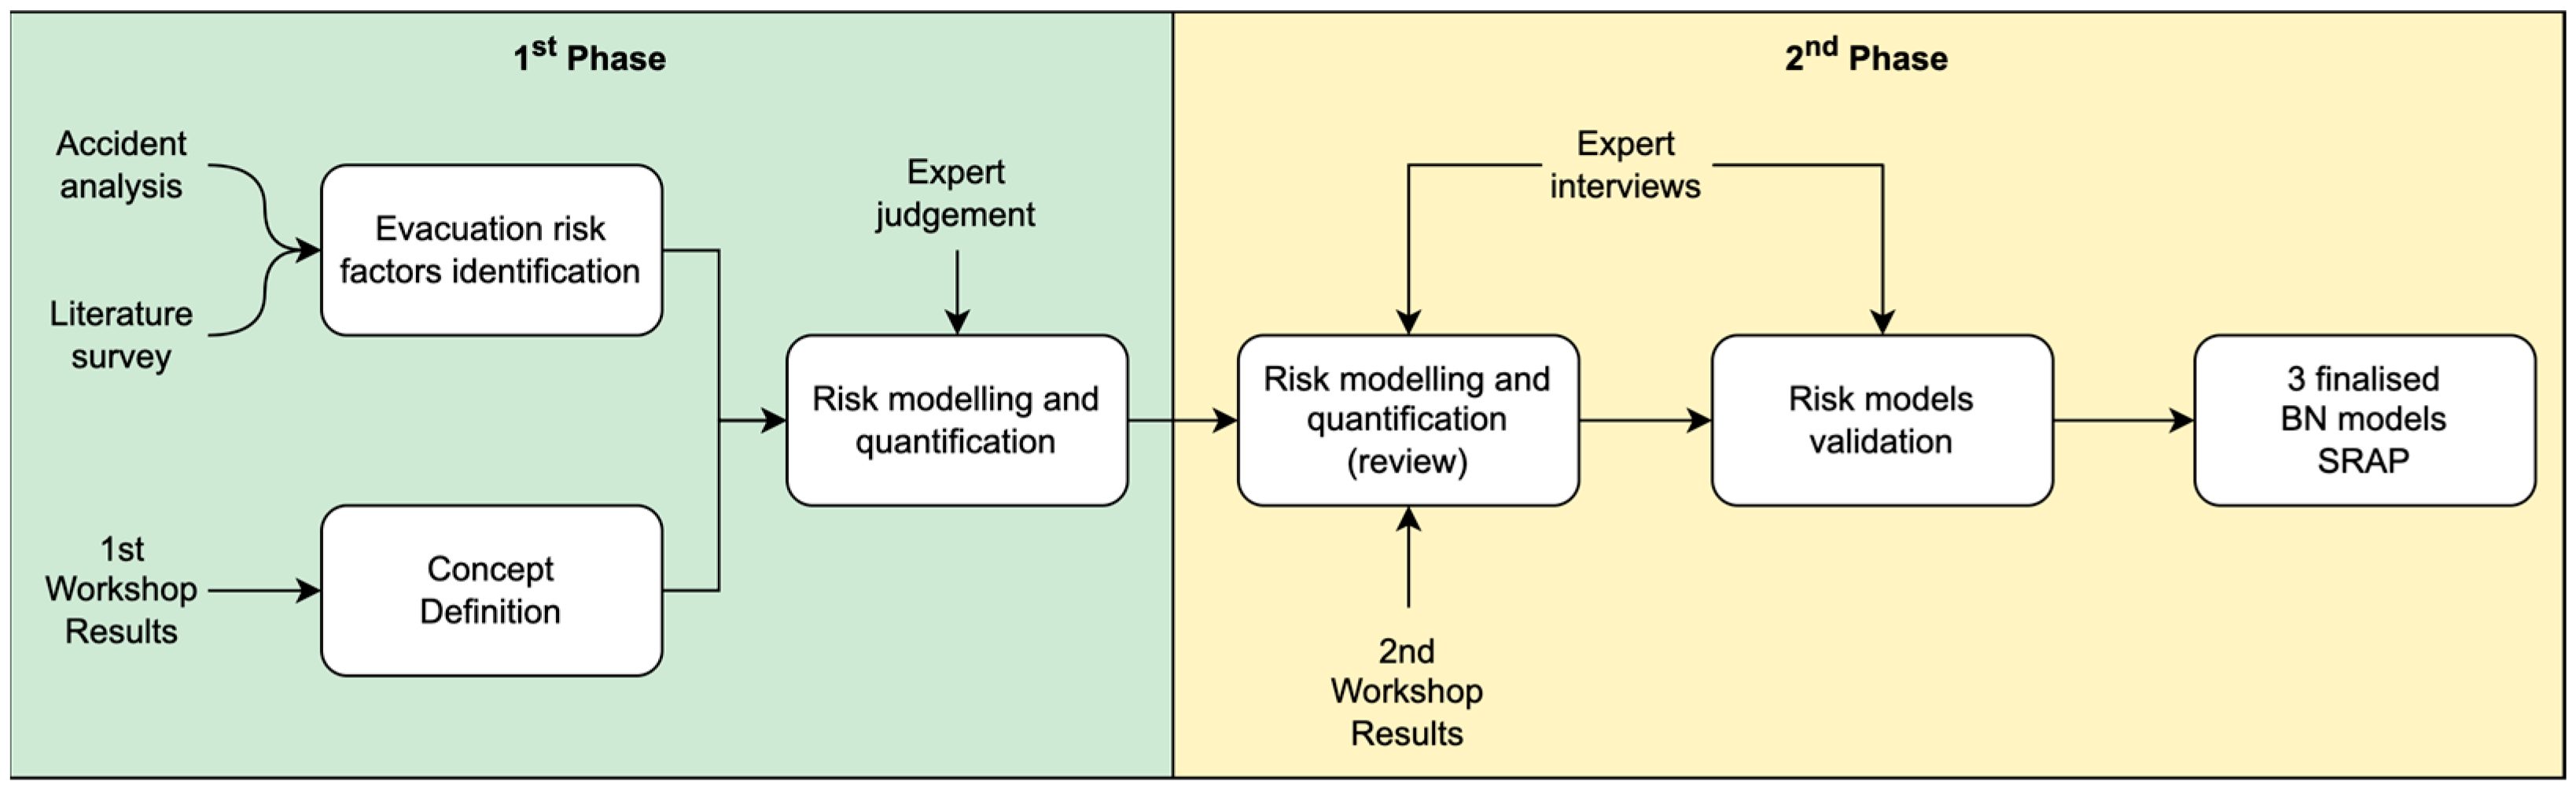
The pre-abandonment model is also activated following the sounding of the GA. It aims at providing insight on whether the ship is no longer safe for the people on board and supports the master’s decision to give the abandonment order. The assessment considers the status of the vessel (that is active since the identification of the incident), people’s vulnerability after the abandonment, and the abandonment readiness. The outcome of the assessment provides an indication to the master.
Both the mustering and the pre-abandonment assessment models are activated following the sounding of the GA and function simultaneously. Thus, the two models run in parallel serving different purposes, although aiming at the same ultimate goal, which is an as smooth as possible execution of the evacuation procedure. On the one hand, the mustering assessment model calculates and provides the risk of delay per deck and MVZ so that the master will know where and what kind of corrective actions are needed. On the other hand, the pre-abandonment assessment model processes different parameters including the way the mustering is progressing, the status of the vessel, the abandonment readiness, and the vulnerability of passengers after it in order to suggest whether it would be better to abandon the ship at a specific time frame or not.

5. Methodology

This section outlines the methodology applied to develop the SRAP risk models and provides a detailed description of the final versions of the models, including their structures, how they were quantified, and the way they were validated.
The methodology applied for the development of SRAP consists of two main phases as shown in Figure 2. The results of the first phase for the situation assessment model were presented in the paper of Ventikos et al. [19], together with the application of the methodology, but only for this specific model. The further evaluation of the methodology and the results of the application of the whole procedure for all the developed models are presented in this paper. All three SRAP models are Bayesian networks, which are directed acyclic graphs (DAGs) that include random variables and nodes that are connected with arrows that represent the probabilistic and causal relationship between them [20].
The first phase of the development of the SRAP risk models consisted of the following steps:
  • Identifying the factors and parameters that affect risk during a ship evacuation (through accident analysis, a literature survey, and the utilisation of the results of a workshop conducted in the context of the PALAEMON project). The workshop was attended by 44 participants from different sectors of the maritime domain who provided valuable feedback through a questionnaire and a series of discussions.
  • Developing the risk models, which included representing the relationships among the identified risk factors based on expert judgement, and quantifying the BNs.
  • Validating the developed risk models by engaging two experts (one principal surveyor of a classification society and one marine operations director and former cruise ship master) in interviews and revising the risk models. The interviewees expertise fully covered the validation process at this stage.
The second phase of the methodology included the following steps:
  • Reviewing and revising the models based on the experts’ comments from the first phase as well as from the results of a 2nd workshop conducted in the context of the PALAEMON project. The second PALAEMON workshop was hosted online due to COVID-19-related measures. It was attended by 25 participants representing stakeholders from various sectors of the maritime domain. Similarly to the 1st workshop, the attendees provided their input through a questionnaire and a series of discussions.
  • Validating and finalising the models by engaging 9 people in the maritime domain (including a master of a cruise ship) in additional interviews.

6. Risk Factors

In this section, the risks factors, which are the terms in which every model evaluates each stage of the evacuation procedure, are presented separately for each risk model.

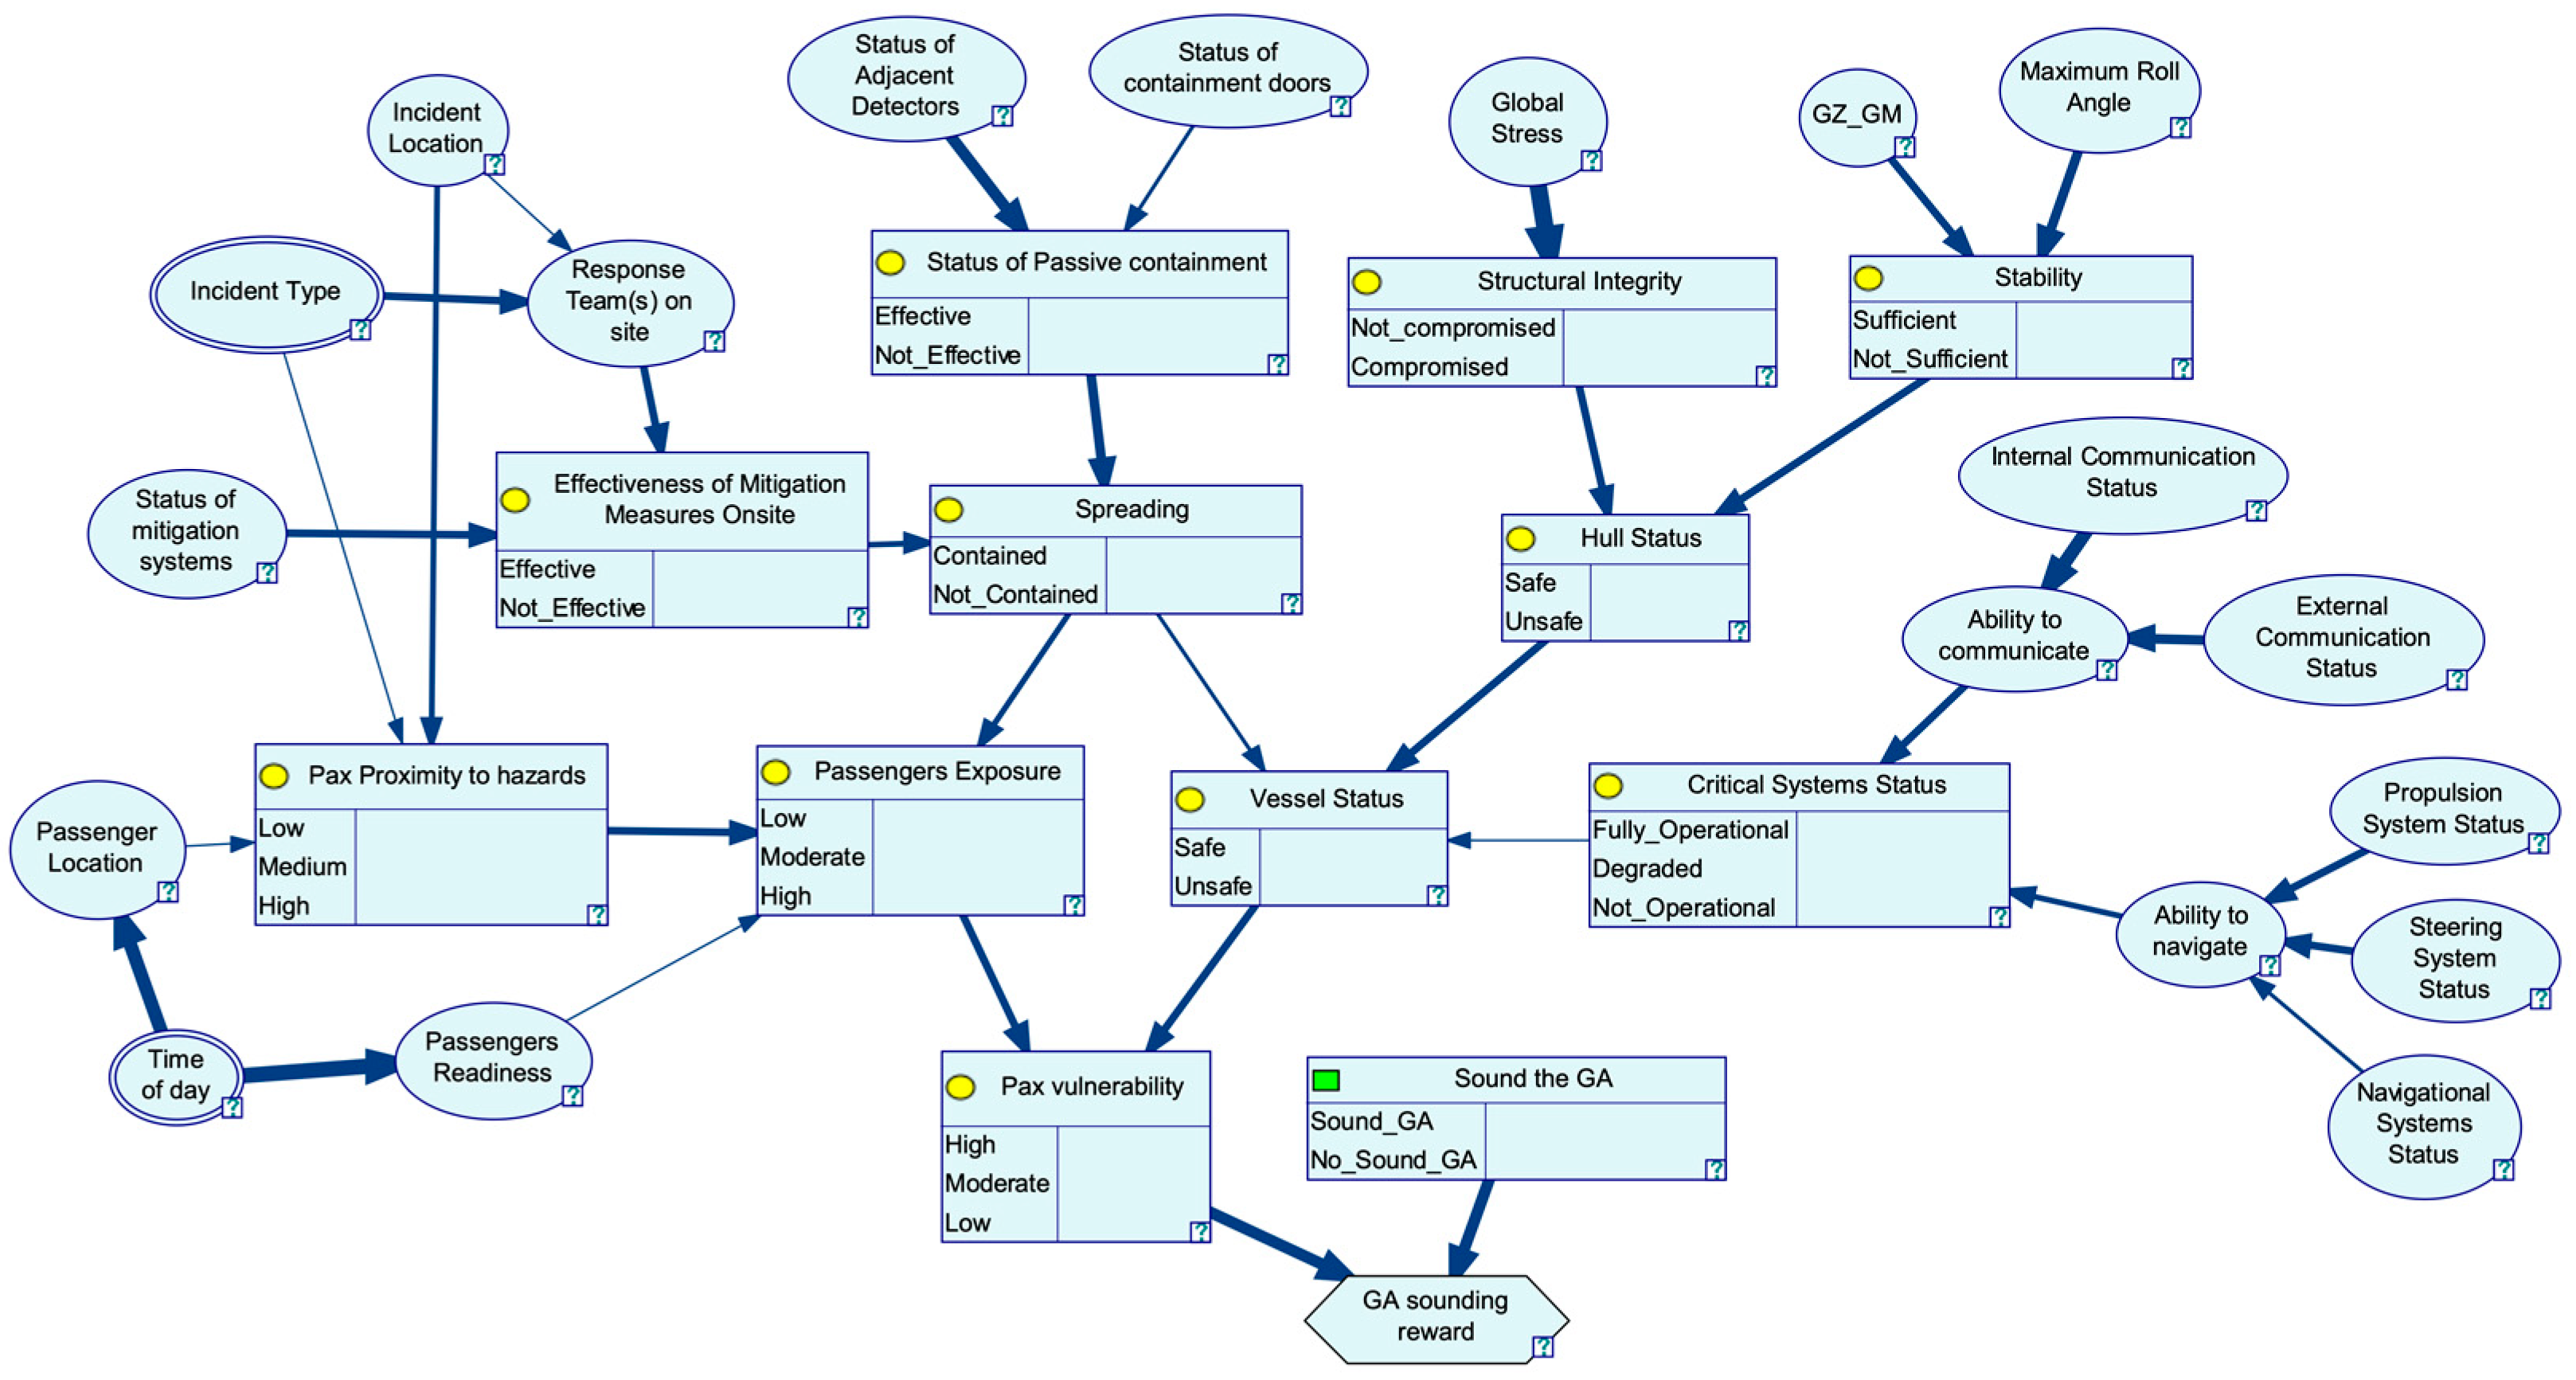
6.1. Situation Assessment Model

The aim of the situation assessment model is to provide an inference on the post-accident severity of the situation, which depends on whether the incident can be contained, whether passengers are directly exposed to hazardous conditions, and whether the vessel may provide safe conditions to the passengers and crew.
The risk factors that are considered in the situation assessment model were thoroughly analysed by Ventikos et al. [19]. Briefly, they are categorised as described below:
  • Floatability, stability, and watertight integrity;
  • Structural integrity;
  • Fire safety integrity;
  • Status of the critical systems for the ship’s controllability and navigation;
  • Status of the critical systems for communication (internal and external);
  • Passengers’ exposure and readiness.

6.2. Mustering Assessment Model

The mustering model aims at evaluating the effectiveness of the mustering process with respect to time and in terms of the aspects described below. The risk factors that are considered in the mustering assessment model were thoroughly analysed by Koimtzoglou et al. (2022) [1]. Briefly, they are categorised as described below:
  • Potential for individual injuries;
  • The efficient movement of individuals;
  • Individual status;
  • Group performance;
  • Status of supporting systems;
  • Status of escape routes;
  • The availability of muster stations;
  • Passenger flow in an area.

6.3. Pre-Abandonment Model

The risk factors that affect the urgency for abandonment are as follows: (1) the vessel status, which is affected by the containment of the incident, the status of the ship’s hull (inc. floatability, stability, watertight integrity, and structural integrity), and the status of the navigational systems (i.e., the ship’s ability to be navigated), (2) the vulnerability of the passengers being exposed to the external environment after abandonment, and (3) the level of abandonment readiness of the people and the mass evacuation vessels (MEVs). MEVs are bigger in size and passenger capacity compared to LSAs and they are proposed within the context of the PALAEMON project, aiming to replace them.
The following is a brief description of how each of the identified risk factors affects the results of the pre-abandonment assessment process and what are the critical conditions that need to be considered.
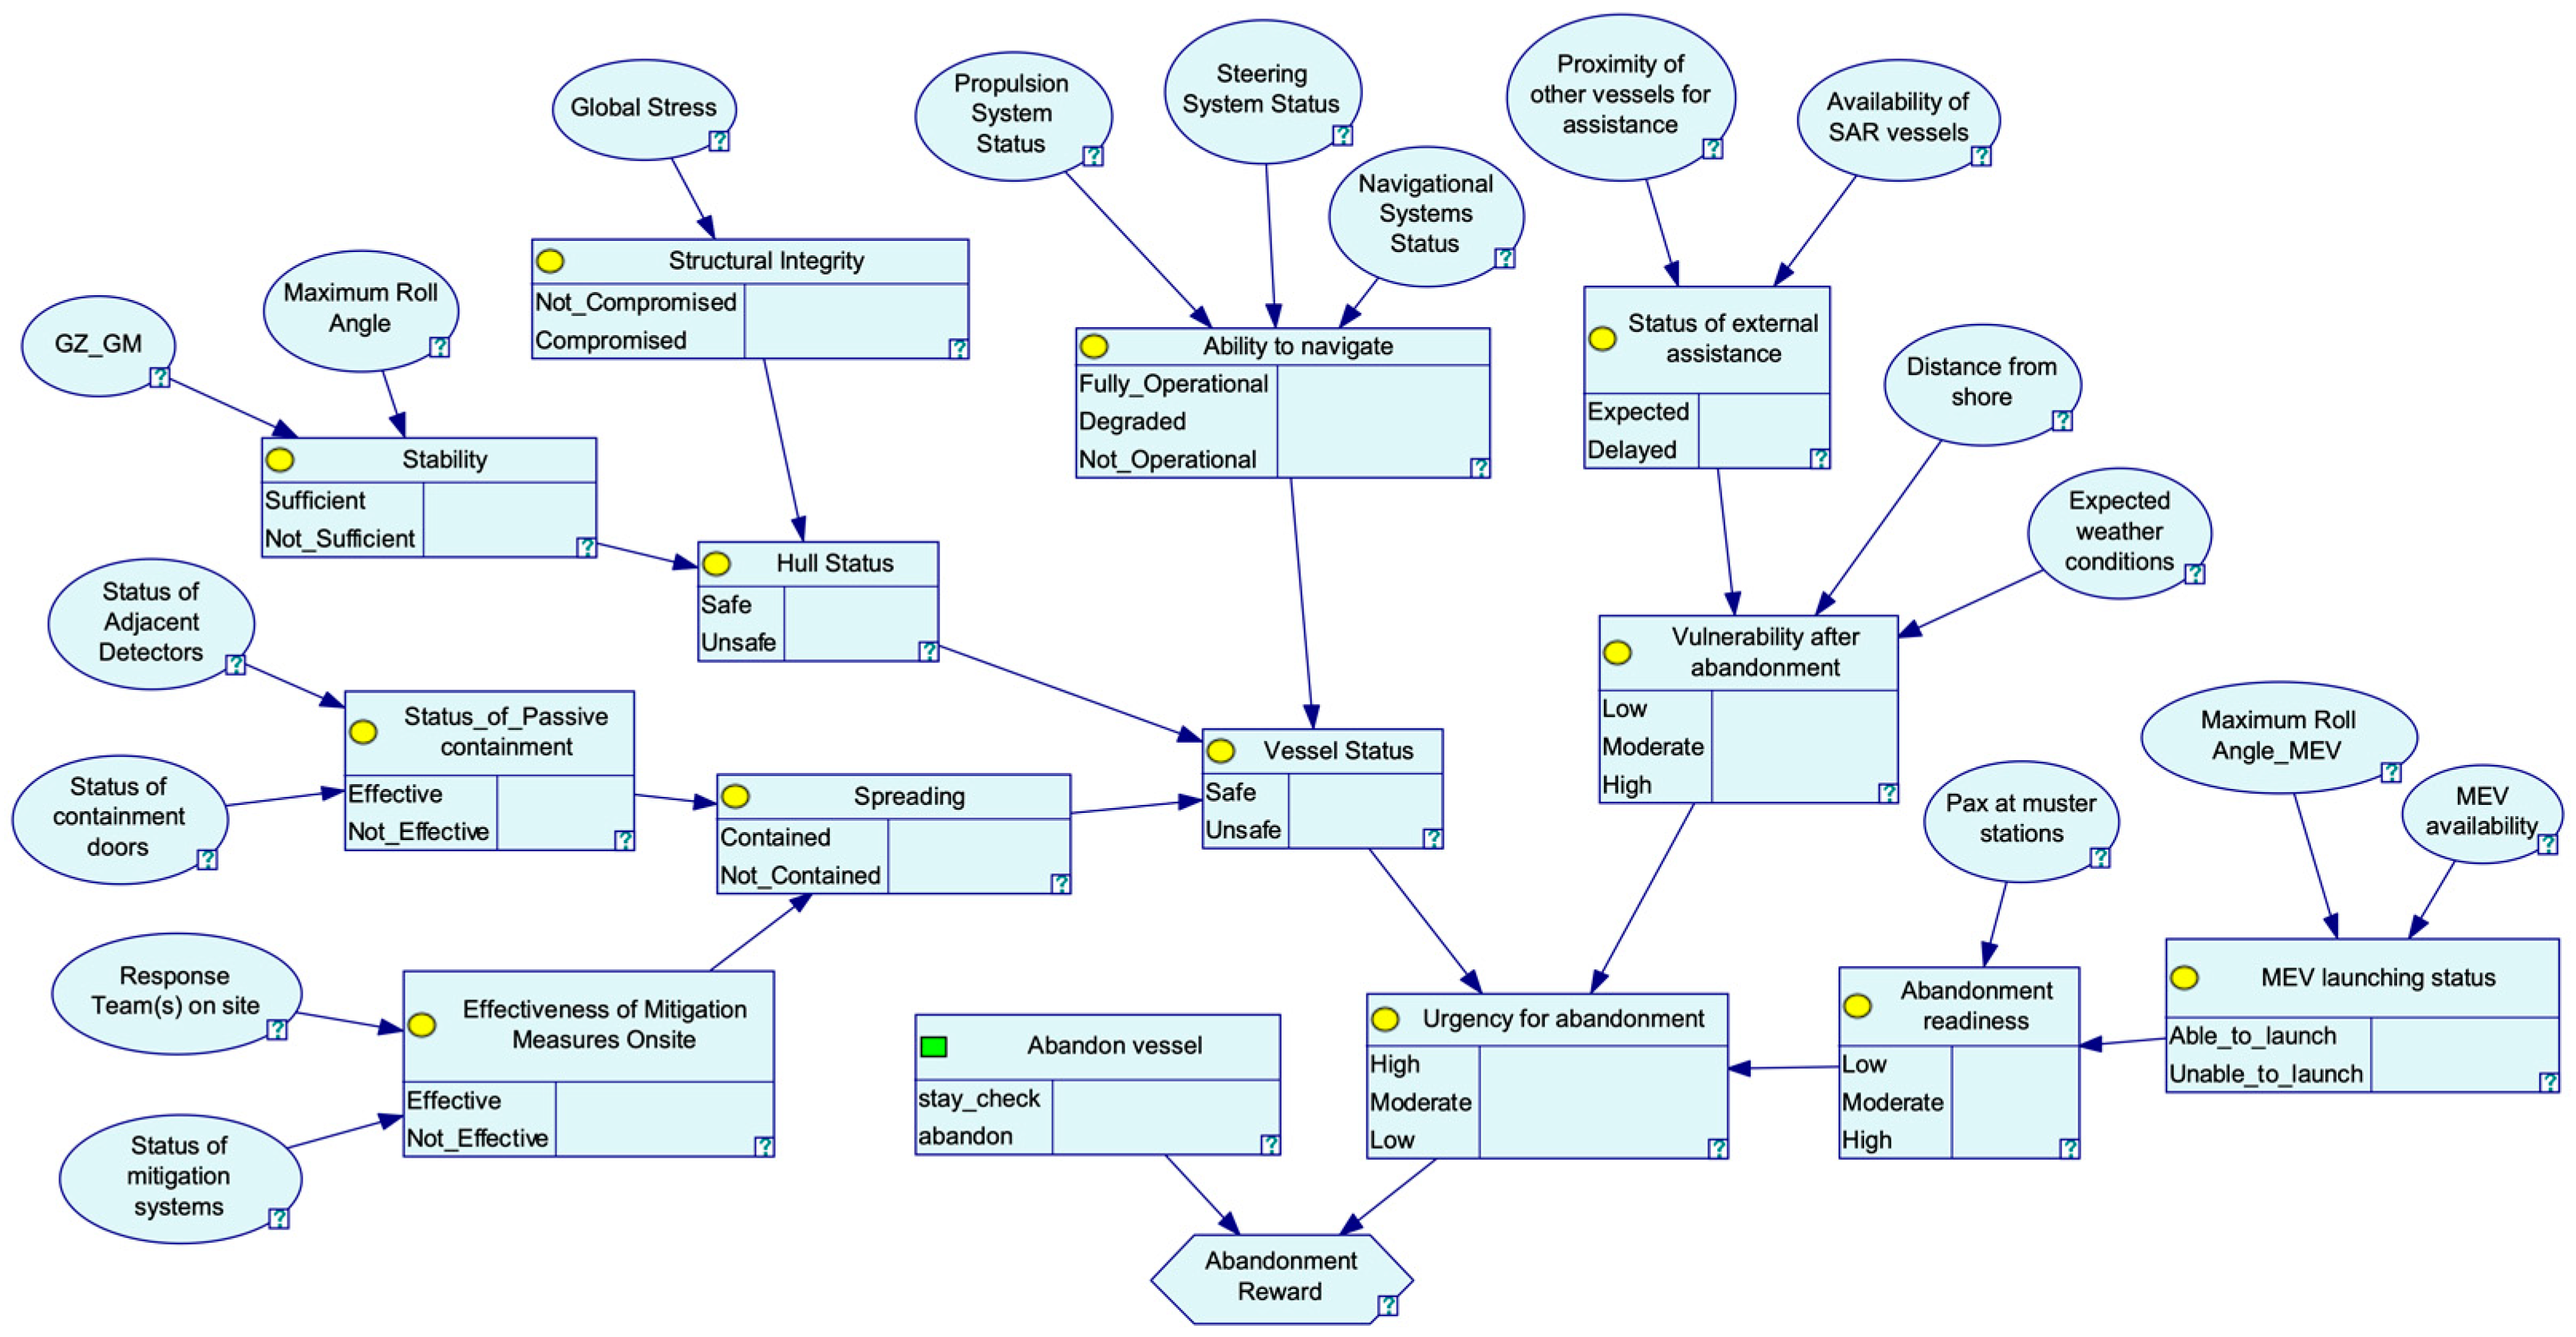
  • Vessel status: The status of the vessel given the occurrence of an incident is indicative of whether the safety of the passengers and crew on board may be directly affected by the conditions in the ship environment. If the people on board are in danger of being exposed to hazards, the urgency for abandonment increases. Exposure can occur if containing the incident (e.g., fire or flooding) has not been successful during the previous phases of the evacuation process. The critical condition to be considered is the uncontrollable spreading of the incident that makes the vessel unsafe, therefore leading to a great urgency for abandonment. Exposure can also occur if the stability and structural integrity of the vessel has been compromised to a point when there is an imminent danger of capsizing and a loss of watertight integrity and flooding, respectively. The critical conditions that would make the vessel unsafe and should be considered for the given damage, ship loading, and weather conditions are: (a) whether the ship will capsize, taking into account progressive flooding; and (b) whether the ship’s structure may collapse (globally).
The operational status of the navigational systems has an impact on the ship’s ability to be navigated and controlled, which may increase the probability of grounding and/or collision given the incident. The critical conditions that increase the urgency for abandonment relate to the operational status of the following sub-systems: propulsion, steering, and navigational systems (e.g., ECDIS, radar, etc.).
  • Vulnerability after abandonment: An important parameter that affects the master’s decision to order the abandonment process is the vulnerability of the people on board after abandoning the vessel, which indicates the potential adverse consequences to their health and safety given their exposure to environmental hazards. The importance of this factor was identified in the analysis of the marine accidents that involved an evacuation described in Section 3. The critical conditions that would increase vulnerability after abandonment relate to: (a) the expected duration of people’s exposure to environmental hazards, considering the adversity of the weather conditions, the availability of external help either for mitigating the incident, or providing immediate assistance to people after the abandonment, and (b) the potential consequences to people if they remain on board compared to being exposed to environmental hazards. In general, a high level of vulnerability after an abandonment combined with a safe vessel would lead to a low urgency for abandonment. However, an unsafe vessel could trigger an abandonment.
  • Abandonment readiness: The readiness to abandon the vessel depends on whether all people on board have assembled at the mustering stations, whether they can safely board the MEVs, and whether the MEVs can be safely launched. If any one of these preconditions are not met, then the master will most likely not order the abandonment of the vessel, according to the feedback obtained from the expert interviews. The importance of all people being accounted for in the mustering stations is also evident from the accident involving the Ro-Pax ferry Queen of the North in 2006. In that case, the lack of a clear and structured way of accounting for the mustered people led to the abandonment order being delayed until the correct total number of mustered passengers were counted. The critical conditions that would decrease the abandonment readiness relate to: (a) a small number (e.g., lower than 50% of the people on board) of assembled people at the mustering stations, (b) damages to the MEVs that affect their seaworthiness or conditions that prevent the mustered people from safely boarding the MEVs (e.g., fire spreading close to the MEVs), and (c) the capability of the launching system to operate as expected given the conditions on the vessel (e.g., power availability, large heel angle, etc.). Therefore, the readiness of the people and the escape means that to abandon the vessel is considered a very important factor that affects the decision to order the abandonment. For example, a small number of mustered people will likely not lead to an abandonment regardless of the level of vulnerability after the abandonment and the status of the vessel, except in cases where the incident is developing rapidly (e.g., rapid flooding leading to sinking).

7. Bayesian Network

In this section, a detail description of the Bayesian network and its development process for each of the three risk models is presented.

7.1. Situation Assessment Model

The analysis conducted that resulted in the Bayesian network shown in Figure 3 is thoroughly described by Ventikos et al. [19]. However, compared to the analysis presented there, a utility and a decision node were included in the BN model to evaluate the decision of whether to sound the GA based on its “utility” according to the states of the final chance node “Pax vulnerability”. Specifically, the final chance node is connected with a value node where the “utility” of each decision alternative is evaluated on a qualitative scale from 1 to 3 as a “reward” for sounding the GA considering the conditions of the situation. For example, sounding the GA when the vulnerability of the passengers is low is considered an undesirable outcome, which is penalised through the utility node because it would lead to unnecessary panic and would lower the possibility for effectively handling the situation. On the contrary, sounding the GA with a moderate and/or high passenger vulnerability is a desirable outcome, which is rewarded through the utility node, because it would help towards protecting the health and safety of the people on board. The evaluation of each decision alternative (i.e., sound the GA, do not sound the GA) results as the sum product of the utilities with the probabilities of each state of the final chance node. The alternative with the highest score is the decision that is proposed to the master.

7.2. Mustering Assessment Model

For the mustering assessment model, a stratified (bottom-up) approach was applied to characterize the status of the mustering process for the vessel, which is thoroughly presented in the published work of Koimtzoglou et al. (2022) [1].
The mustering assessment model consists of two separate BN models as shown in Figure 4. The first aims at assessing the individual status of each passenger, whereas the second aims at assessing the risk of delay for the areas of the vessel divided per MVZ and deck. Figure 4 shows the relationships between the identified risk factors that were stated in the previous section. A detailed description of the individual nodes of the BN model and the assumptions that were employed is presented Table A1 of Appendix A.
The first aims at assessing the individual status of each passenger, whereas the second aims at assessing the risk of delay for areas of the vessel divided per MVZ and deck.
The following categories of risk factors are considered in the analysis:
  • The passenger’s (individual) status with respect to the efficiency of his/her movement towards the muster station as well as his/her health status.
  • The group performance of the passengers in the examined deck considering an individual’s performance and the characteristics of the deck related to a passenger’s attempt to approach the muster station, such as the distance of the deck from the muster station and the existence of congested areas.
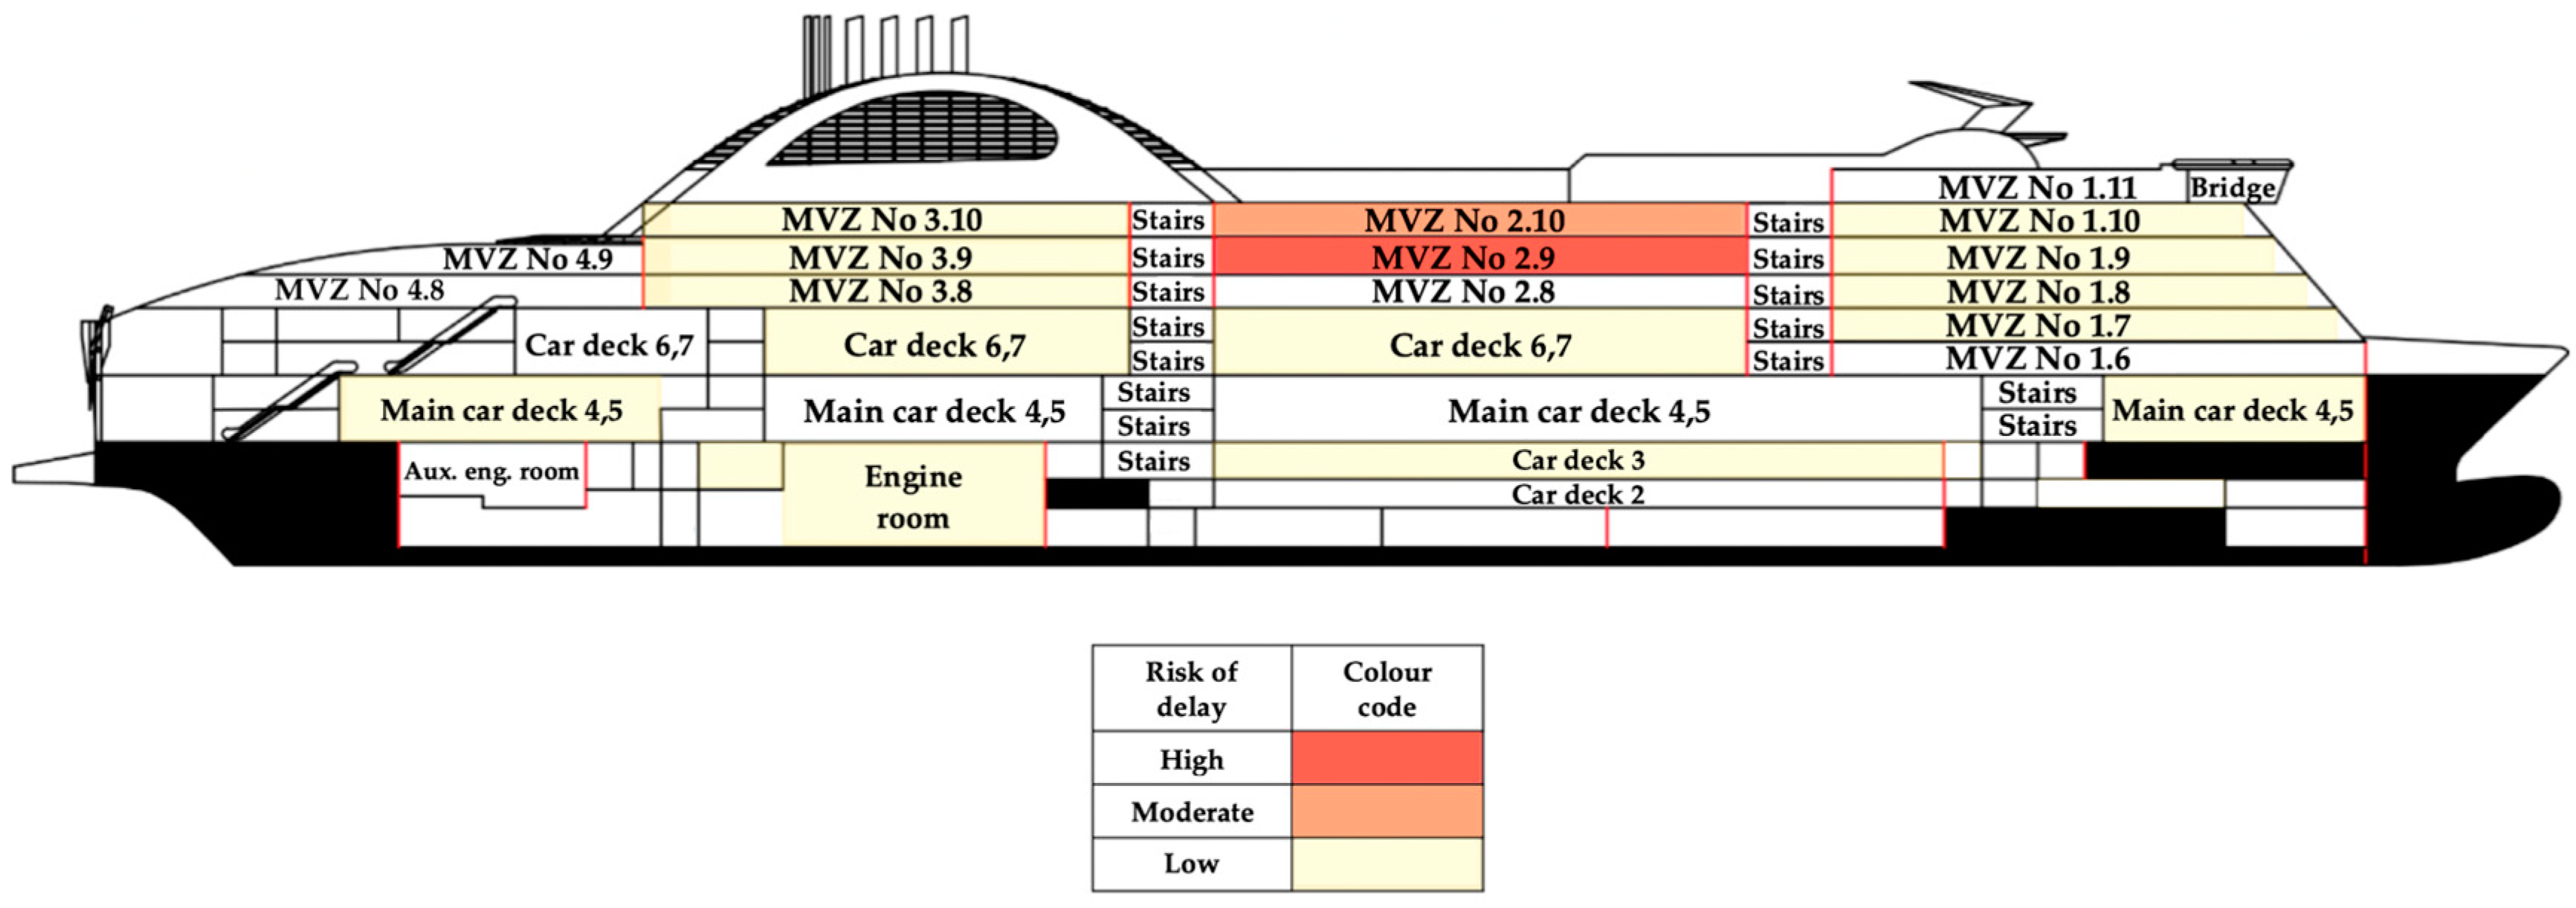
  • The risk of delay of the mustering process, which is assumed to be associated with the status of the evacuation routes and of the ship systems that support the mustering process. The risk of delay is also visually presented as shown in an indicative example in Figure 5.
By combining the group performance index with the risk of delay, an index that reflects the effectiveness of the process in the examined deck is derived.

7.3. Pre-Abandonment Model

The identification of the risk factors that affect the urgency for abandonment provided the basis for developing the structure of the BN model shown in Figure 6. Table A2 of the Appendix A provides a detailed description of the individual nodes of the BN model, including information about the discretization and the assumptions that were employed in the development.
Similarly to the situation assessment model, a utility and a decision node were included in the BN model to evaluate the decision of whether to give the abandonment order based on its “utility” according to the states of the final chance node “Urgency for abandonment”. Specifically, the final chance node is connected with a value node where the “utility” of each decision alternative is evaluated on a qualitative scale from 1 to 3 as a “reward” for ordering the abandonment. For example, giving the abandonment order when the urgency for abandonment is low is considered an undesirable outcome, which is penalised through the utility node because it may unnecessarily expose passengers to environmental hazards after the abandonment while, for example, the vessel is considered safe. This was also verified from the feedback obtained during the expert interviews. On the contrary, giving the abandonment order with moderate and/or high urgency for abandonment is a desirable outcome, which is rewarded through the utility node because it would help towards protecting the health and safety of the people on board. The evaluation of each decision alternative (i.e., abandon, stay and check) results as the sum product of the utilities with the probabilities of each state of the final chance node. The alternative with the highest score is the decision that is proposed to the master.

8. Quantification

For the quantification of the risk models, a qualitative rationale was applied to establish/develop the conditional probability tables (CPTs) of each model’s nodes. For example, with increasing the passenger proximity to hazards, the probability of their exposure is increased. The magnitude of the effect was assessed by qualitatively weighing the contribution of each risk factor, which was subsequently reflected in the CPTs. To this end, the CPTs were developed based on the conducted accident analysis (presented in Section 3), the information collected from the literature, and the experts’ judgment. After that, the CPTs were revised according to the results of the second PALAEMON workshop and the comments obtained from a second set of interviews. So, the importance of each risk factor is reflected in the CPTs of the model.
Thus, the results of each risk model indicate that the developed CPTs adequately reflect the relative weights among the risk factors. The results are also visually represented in Figure 3 for the situation assessment model, in Figure 4 for the mustering assessment model, and in Figure 6 for the pre-abandonment assessment model. The thicker arrows show a greater influence of the parent to the connected child node with respect to their probabilities.

8.1. Situation Assessment Model

The qualitative rationale that was applied to develop the CPTs of the model’s nodes is described in detail by Ventikos et al. [19]. Figure 3 shows the results of the strength of influence analysis for the situation assessment BN model.

8.2. Mustering Assessment Model

The extruded results of the aforementioned procedure concluded with the ranking of the following aspects from the most to the least important: blocked evacuation routed, number of trapped passengers, condition of muster stations (open/blocked), the presence of crew members to guide/assist passengers, and congested evacuation routes.
Figure 4 shows the results of the strength of influence analysis for the mustering assessment BN model, which reflect the relative weights of the employed parameters based on the quantification rationale described.
  • Movement efficiency (passenger speed, heart rate, O2 saturation): the most critical factor that affects movement efficiency is the passenger speed, followed by O2 saturation and heart rate, which can also affect movement.
  • Potential for injuries (the presence of hazards, fall detection): the probability that passengers may be injured is assumed as the combination of the presence of hazards and an alarm indicating whether a passenger has fallen or not.
  • Individual status (movement efficiency, potential for injuries): medium movement efficiency combined with medium potential for injuries leads to a delayed movement of the passenger towards the muster station. In the case of low movement efficiency and/or the presence of hazards, it is assumed that assistance by the crew will be required. Moreover, the potential of injuries is considered more critical compared to movement efficiency.
  • Passenger flow in an area: The flow of the passengers in the vessel area under examination relates to the individual status of every passenger located in that area. The aggregation of all the individual status indices in the specific area provides the basis for the CPT of the node “Passenger flow on area”.
  • Escape routes status (congestion, blockage): congestion is assumed to be more critical than blockage due to the fact that crew members expect that congestion issues will occur during the mustering stage of the evacuation process.
  • Status of supporting systems: to assess the status of supporting systems for the mustering process, the following nodes were considered: the status of the public announcement (PA) system, the status of the wayfinding system, and the presence of crewmembers.
  • Risk of delay (escape routes status, availability of muster Station, status of supporting systems): The risk of delay for each deck of every MVZ is calculated through the combination of these three nodes. The most critical is assumed to be the status of the escape routes.
  • Group performance (individual status, congestion, deck distance from muster station): The group performance is referred to as the summary of the individual status of the passengers in every deck of every MVZ of the vessel. Therefore, the most critical node is considered to be the aggregation of the individual status, followed by the distance from muster station in terms of decks and then the presence of congestion.
  • Mustering status (group performance, risk of delay): The main priority on cruise ships and Ro-Pax ferries during emergencies is the protection of life for the people onboard them; therefore, the passengers’ group performance is considered to be a more significant node compared to the risk of delay.

8.3. Pre-Abandonment Model

The CPTs of the following nodes are the same as in the situation assessment BN model:
  • Spreading (effectiveness of mitigation measures onsite, status of passive containment)
  • Hull status (stability, structural integrity)
  • Ability to navigate (propulsion system status, steering system status, navigational systems status)
  • Vessel status (spreading, hull status, ability to navigate)
Additionally, the extruded results of the workshop concerning the risk factors for the pre-abandonment assessment model was ranked as follows from the most to the least important: criticality of condition, percentage of passengers arrived in muster stations, weather conditions, MEVs conditions, nearby vessels, and distance from nearest port.
These aspects were also considered from a similar point of view by Solberg et al. in a study assessing the time to rescue (TTR) for different scenarios, utilizing different paths to survival (PTS), and investigates the factors influencing the outcome. In this study, it was stated that the time needed for a possible rescue depends on numerous variables, including the number of persons to be rescued, the number and type of evacuation platforms, and the meteorological and oceanographical conditions [21].
Figure 6 shows the results of the strength of influence analysis for the pre-abandonment assessment BN model, which reflect the relative weights of the employed parameters based on the quantification rationale for the nodes described below.
  • Status of external assistance (proximity of another vessel for assistance, availability of search and rescue—SAR—vessels): According to the requirements of the SAR convention, nearby vessels are required to provide assistance to any vessel in distress, and SAR vessels are required to respond to distress calls. Therefore, the influence of these parent nodes is considered to be equal with respect to their influence on whether external assistance is expected or delayed. This means that assistance is considered equally likely regardless of whether it comes from SAR or other nearby vessels.
  • Vulnerability after abandonment (status of external assistance, distance from shore, expected weather conditions): The probability of external intervention (i.e., SAR or other nearby vessels) arriving immediately and the distance from the shore affect the duration of people’s exposure to environmental hazards once they have abandoned the vessel on the MEVs. The adversity of the expected weather conditions affects the magnitude of the potential consequences to the people after the abandonment in terms of: (1) whether the integrity and floatability of the MEVs could be compromised, putting the people on the MEV at risk, and (2) for people stranded to sea, whether they are exposed to conditions that have an immediate danger to their health and safety (e.g., very low water temperatures). The effect of the expected weather conditions on people’s vulnerability after the abandonment was assigned a higher weight compared to the other two factors considering the higher possibility of immediate adverse effects compared to delayed external assistance.
  • MEV launching status (maximum roll angle_MEV, MEV availability): The maximum roll angle of the ship required for the MEV launching mechanism to operate as expected might result in an inability to launch the MEVs and render the abandonment process unfeasible. The same result can be obtained if the MEVs have been damaged by the incident (e.g., a fire) or if people cannot safely approach them for boarding, regardless of the status of the launching mechanism. Therefore, the effect of these factors on whether the MEV can be launched is considered to be equal.
  • Abandonment readiness (MEV launching status, Pax at muster stations): The percentage of people assembled at the muster stations plays a crucial role in the master’s decision to order the abandonment of the vessel. Therefore, this risk factor was attributed a higher weight compared to the effect of the MEV’s launching status to the abandonment readiness. Whether people are unable to board the MEVs or if the MEVs cannot be launched will also render the abandonment unfeasible. However, comparatively, it is considered to contribute less to the master’s decision.
  • Urgency for abandonment (vessel status, vulnerability after abandonment, abandonment readiness): The weights assigned to the contributors to the urgency for abandonment are considered in the following order of importance (from higher to lower): (1) vessel status, (2) abandonment readiness, and (3) vulnerability after abandonment. During an evacuation, the main objective is to protect the health and safety of the people on board. Therefore, whether the vessel status directly and immediately endangers the people on board has the greatest effect on the master’s decision to abandon. When a vessel is relatively safe, the master’s priority is to complete the mustering process and be ready for abandonment considering the potential development of the vessel’s safety. Vulnerability after abandonment plays a role mainly in the case where the vessel is relatively safe. In the case of an unsafe vessel, the priority is to abandon the vessel independently from the expected weather conditions and other hazards that are related with the vulnerability after abandonment.

9. Validation

Considering that the developed BN risk models were elicited from expert knowledge, a validation approach similar to the framework proposed by Pitchforth and Mengersen [22] was applied. This process includes evaluating the following types of validity:
  • Nomological validity to establish that the problem examined fits into a wider domain in the literature.
  • Face validity to determine whether the relationships between the random variables reflect the problem.
  • Content validity to establish that all important parameters that affect the problem have been included in the model.
  • Convergent validity to determine the similarity of the model in terms of structure to other models for similar purposes.
  • Discriminant validity that reflects the degree to which the model is different compared to other models, and
  • Predictive validity to establish that model behaviour and output is fit-for-purpose.
The nomological validity of the models was established based on a literature review. In addition, the developed models were validated in terms of face and content validity by conducting a discussion with an expert (crew member of a Ro-Pax ferry) (phase 1 of methodology) and, in terms of predictive validity, through a tested case study (presented in Section 10). In addition, the face and content validity were evaluated by feedback received from expert interviews. The evaluation of all three risk models in terms of their convergent and discriminant validity was established by comparing them to similar models identified in the literature.
The following subsections describe the results of the validation activities that were conducted for evaluating the convergent and discriminant validity of each risk model separately by comparing them to similar models in the relevant literature (briefly presented in Section 2).

9.1. Situation Assessment Model

The similar models identified take into consideration the fire location and condition and the extinguishing systems. The developed situation assessment model considers these aspects through the nodes “Incident location” and “Spreading”, which are affected by the nodes “Status of adjacent detectors”, “Status of containment doors”, and “Status of passive containment”, whereas the nodes referring to the extinguishing systems are “Status of mitigation systems”, “Effectiveness of mitigation systems”, and “Effectiveness of mitigation measures on site”. Some additional risk factors of the similar models include the passenger location, heat/smoke exposure, and the trim/heel. The similar points in the situation assessment model are the consideration of the passenger location, the interpretation of the “Passenger proximity to hazards” node, and the “GZ_GM” and “Maximum Roll Angle” nodes.
With respect to the discriminant validity, the main difference between the situation assessment model and the similar models from the literature is that the former includes factors that only affect the master’s decision to sound the GA, while the latter examine the evacuation procedure as a whole. The result is that some factors that were identified as important in the literature were been included in the situation assessment model.

9.2. Mustering Assessment Model

The similar models identified utilized risk factors considering the passenger condition and panic. These aspects were considered in the development process of the mustering assessment model by evaluating the passenger condition in terms of movement efficiency (speed and oxygen saturation) and in terms of potential injuries, which is indicated by factors such as the node “Fall detection” and by incorporating the “Heart rate” node. Two additional risk factors from the literature models that have common points with the developed model are the existence of a rescue team and the condition of the escape routes, which were taken into consideration through the nodes “Presence of crew members” and a combination of the nodes “Congestion” and “Blockage”, which affect the node “Escape route status”.
With respect to discriminant validity, it was noted that the main difference between the mustering assessment model and the similar models from the literature is that the former focuses on estimating the status of each passenger and the risk of delay for a specific area of the vessel, whereas the latter focus separately on issues including evacuation time, modelling panic, predicting congestion during the mustering process, or estimating the probability of a successful escape. In addition, the mustering assessment model considers the operational status of the ship systems that support the mustering process, while the similar models from the literature only consider the support and guidance provided by the rescue team to the passengers.

9.3. Pre-Abandonment Model

The similar models from the literature consider the severity of the accident and the rescue area and manner as risk factors. From the similar models found in the relevant literature, a model presented by Ping et al. [23] and a DNV model [24] were the most relevant to the pre-abandonment model. The similarity of these models with the developed one results from the fact that the node “Vessel status” is part of the developed model, as well as the nodes “Status of external assistance” and “Distance from shore”. It should be noted that the “Vessel status” node is the most important parameter affecting the decision. Furthermore, a similarity was also observed in the comparison of the “Pax at muster stations” and “Abandonment readiness” nodes with the literature risk factors considering the failure to muster, as well as in the comparison of “MEV availability”, “Maximum Roll Angle_MEV”, and “MEV launching status” with the literature risk factors regarding missing life-saving means.
In the pre-abandonment model, the effect of weather conditions with respect to the vulnerability of people on board after abandoning the vessel were also included. The latter is one of the three main parameters that affect the master’s decision to order the abandonment. Regarding the number of passengers assembled at the muster stations, the model includes this as a parameter that affects the node “Abandonment readiness”, which has the second highest importance among the three risk factors that affect the abandonment decision, as described in the quantification section (Section 8).
To determine the discriminant validity, the following is a brief description of the differences between the pre-abandonment model and the two similar models from the literature. One of the main differences is that the pre-abandonment model focuses only on the master’s decision to abandon the vessel following the initial assessment of the situation that leads to sounding the general alarm and starting the mustering process. The objective of the other two models is, respectively, to assess (1) the probability of success for the whole evacuation process (i.e., from the initial assessment to the abandonment), and (2) the probability of human losses considering all phases of the evacuation. On the other hand, the objective of the model described here is to support the specific decision to give the abandonment order, while aspects of the other evacuation phases are addressed by the other two risk models included in SRAP (i.e., situation and mustering assessment).
The different objective of the pre-abandonment model also led to excluding some risk factors from the similar models, even though they are considered important for the evacuation process, while some of these factors were included in the other two SRAP models. Specifically, the factor “Daytime/night-time” was considered in the situation assessment model, where it affects the passengers’ readiness to muster, and the factor “Accident during the evacuation process” was indirectly considered in the mustering assessment model as the potential for injuries due to exposure to hazards. For the pre-abandonment assessment phase, factors such as the time of day do not affect the decision of the master, which mainly depends on the status of the vessel. In addition, the similar models in the literature are not intended for real-time decision support but as tools to study the contribution of different risk factors and evaluate risk control options. In this context, other factors in the similar models, such as those referring to the number and type of survival suits and evacuation and rescue devices, were not included. What is considered more important for real-time decision support is the availability of evacuation and rescue devices (i.e., the MEVs) compared to the total number of passengers.

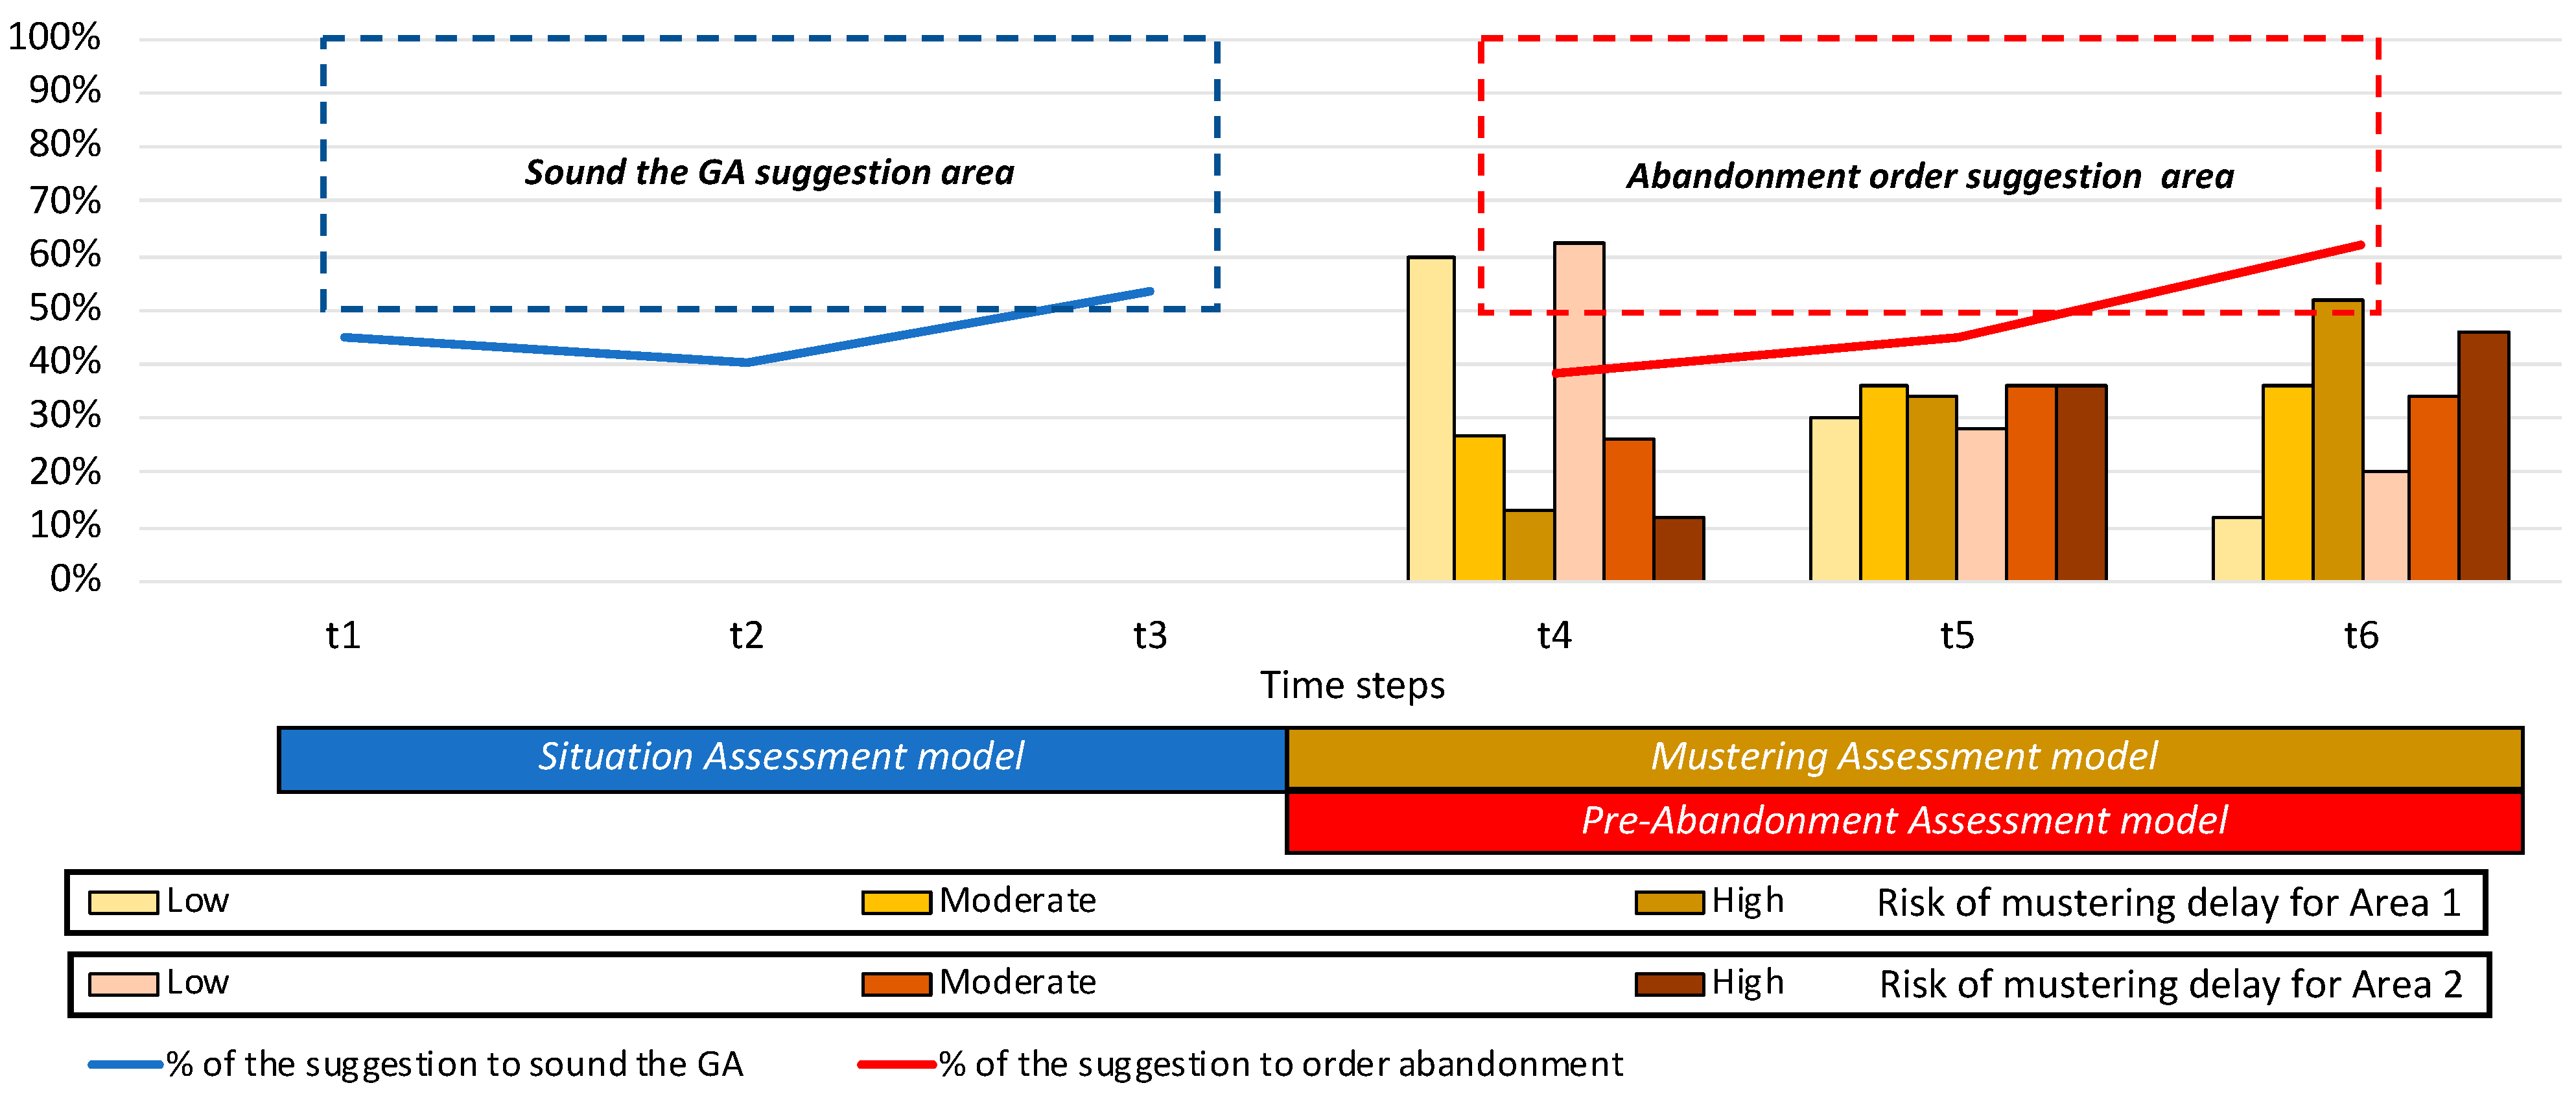
10. Case Study—Fire Scenario

The section presents the application of the BN risk models to one case study based on a fire incident scenario. The objective of this application was to test the functionality of the BN models and to illustrate their sensitivity. A brief description of the scenario is provided in this section and the results of its application are provided in the next one.
The scenario was divided into different periods of time by specific time stamps, i.e., t1 to t6. Table 1, Table 2, Table 3 and Table 4 show the state of each parent node of the risk models per time stamp. The purpose of this procedure was to illustrate, as realistically as possible, the way the incident evolves and to make clear which is the output of each risk model as the event unfolds. It was noted that the first three time stamps refer to the situation assessment model, but when this risk model gives its final result, the mustering assessment model and the pre-abandonment model start functioning simultaneously, where the t4, t5, and t6 time stamps refer to both of them.
The output of each of the three risk models is presented below:
  • The situation assessment model gives a suggestion to the Master on whether to sound the GA or not. The results are presented in percentages for two options, i.e., (a) sound the GA, or (b) do not sound the GA, so the master takes into account the suggestion with the higher percentage. If the “sound the GA” percentage exceeds 50%, the model suggests the initiation of the mustering process.
  • The mustering assessment model result is the percentage of the risk of delay per specific area of the ship, so the results are presented with percentages on whether the risk of delay is at a (a) low, (b) moderate, or (c) high level.
  • The pre-abandonment model gives a suggestion to the master on whether to order the abandonment of the vessel or not. The results are presented in percentages for two options, i.e., (a) order the abandonment, or (b) do not order the abandonment, so the master takes into account the suggestion with the higher percentage. If the “Order abandonment” percentage exceeds 50%, the model suggests the abandonment of the vessel.

10.1. Situation Assessment Model

Table 1 presents the input data of the situation assessment model per time stamp according to Figure 3. The results per time stamp are presented in the last row of the table. In this scenario, during daytime, a fire breaks out in the engine room and starts spreading inside of it, while a response team (fire patrol) immediately arrives on site (t1). The fire sprinklers (mitigation system) in the ER get activated, and it is assumed that all the ship’s legacy systems are working properly (t2). Smoke detectors have not yet been activated, while the doors of the ER have been closed. The efficient planning of the escape routes in this situation highly depends on mastering the spread of the fire in the ship and creating a fire information field Situations such as this usually generate a big amount of smoke in a relatively closed environment [25]. The smoke detectors get activated, but the fire is getting out of control and causes a problem with the steering system (t3). The status of the situation is circulated between the crew members as the internal communication is working properly. SRAP provides an indication to the master to sound the GA.

10.2. Mustering Assessment Model

As previously stated, this paper focuses on the application of a model aiming at assessing the risk of delay for the areas of the vessel divided per MVZ and deck. An application of the risk model considering the calculation of the individual status of every passenger separately, taking into account the heart rate, O2 saturation, speed, the presence of hazards, and fall detection, is presented by Koimtzoglou et al. (2023) [26].
Table 2 presents the input data for the mustering assessment model according to Figure 4. At this point in the scenario, the master has already sounded the GA, and the mustering process has been initiated due the fire incident. In this scenario, the deck with the longest distance to the muster stations of the MVZ, which are all available, is examined. At first, a low level of congestion occurs near the staircases that lead to the muster stations, there is no blockage, and the crew members are at their designated spots. In addition, the PA and wayfinding systems are operational (t4). All systems that support the mustering process are still available, and the crew is still present for assistance, but the congestion is getting worse, so the relevant parent node changes to “Moderate” (t5). Due to the prevailing conditions, the congestion is getting even worse as more people are heading towards the muster station, and the congestion parent node indication changes to “High” (t6). In this case, SRAP provides an indication to the master for this deck and MVZ of a “High risk of delay”. The results for this MVZ and deck of the mustering assessment model per time stamp are shown in the last row of Table 2.
In order to better illustrate the utilisation of this risk model, a scenario taking place simultaneously in a different MVZ and deck of the ship is also presented. As the event takes place at the same time, the time stamps remain the same (t4–t6). In this case, a deck with a moderate distance to the muster stations of the MVZ is examined. At first, a low level of congestion occurs near the staircases that lead to the muster stations, there is no blockage, and the crew members are at their designated spots. In addition, the PA and wayfinding systems are operational (t4). All systems that support the mustering process are still available, and the crew is present for assistance, but two people trying to reach their muster station get injured on their way. This initially causes congestion, and the parent node changes its state to “Moderate” (t5). Due to the injury of one of the two passengers, which happened in a hallway, there are a number of people who are trying to help them, but they cause the route to be blocked, so the blockage parent node status changes accordingly (t6). In this case, SRAP provides an indication to the master of a “High risk of delay” for the specific area. The results for this MVZ and deck of the mustering assessment model per time stamp are shown in the last row of Table 3.
Based on these representations, the master will be aware of the progress of the mustering process for these compartments of the vessel, and he/she will proceed to corrective/alternative actions to provide assistance to the areas requiring it.

10.3. Pre-Abandonment Model

Table 4 presents the input data for the pre-abandonment model according to Figure 6. At this point it, is assumed that the mustering process has started and is progressing, while the pre-abandonment model has also been triggered. At the beginning, it is assumed that the mitigation systems are activated, the response teams remain on site, the containment doors remain closed, the adjacent detectors are not activated, and the steering system has stopped working, as stated in the last time stamp of Table 1. The proximity of other vessels is characterized as high, SAR vessels have been informed, and they are on their way, the distance from shore is moderate, and the prevailing and expected weather conditions are fair. In addition, the maximum roll angle has not been exceeded, and all the MEVs are available. At this point, less than 50% of the passengers have reached the muster stations (t4). After a while, the adjacent detectors get activated, and as the fire cannot be successfully contained, the propulsion system also gets affected and is no longer operational. At this point, the number of passengers that have reached the muster stations has increased, reaching a percentage between 50–80%. Finally, the last time stamp is characterized by an increased percentage of passengers that have successfully reached the muster station, which exceeds 80%, and the model suggests to the master to order the abandonment of the vessel (t6). The results of the pre-abandonment model per time stamp are shown in the last row of Table 4.

11. Results and Discussion

As previously stated, the results of the application of the three risk models are presented in the last row of each of the tables (Table 1, Table 2, Table 3 and Table 4). The results are also visually presented in Figure 7.
It was noted that the engine room was a vulnerable space of the ship, as from the beginning of the incident (t1), the model came really close to proposing to the master to raise the GA, as it reached the 45% “Sound the GA” result compared to the 55% result, i.e., not to sound it. After that, due to the activation of the mitigation systems, the percentage proposing to sound the GA decreased to 44% (t2), but the fact that the fire affected the steering system of the ship (t3) was crucial and had an immediate effect on the percentage suggestion of sounding the GA. At this point, the risk model result to sound the GA reached 54%, so the master followed the proposed advice from SRAP and initiated the evacuation process.
Subsequently, the two remaining models got simultaneously triggered. The result of the mustering model, especially in the described scenario where the mitigation systems were operational and the crew members were at their designated spots, were highly affected by the congestion. At t4, as the congestion was characterized as “Low”, the passengers’ flow progressed within acceptable limits, resulting in a low risk of delay (60%). As the incident evolved and the congestion became “Moderate” at t5 and “High” at t6, the passenger flow was also affected and this resulted in an increased risk of delay. The risk of delay was characterized as “Moderate- 36%” for t5 and “High- 52%” for t6.
The application of the mustering assessment model in the second area was similar to the first one. The main difference was observed in the occurrence of the injuries of two passengers. Through the observation of the results, it was highlighted that an injury could be a highly effective parameter for the MVZ and the deck where it takes place, as it can highly and directly affect the passenger flow by causing congestion or even blockage. Specifically, when the injuries occurred, the risk of delay was converted from low to “Moderate 36%”, and, after a while, when the prevailing conditions led to the blockage of a hallway, the risk of delay was clearly characterized as “High 46%” due the large percentage of delayed passengers (70%). It was noted that although the risk of delay was high (46%), it was lower than the respective percentage of the scenario of the other area described in the previous paragraph, even though the conditions were worse due to the two injuries. This was justified by the fact that, in this case, the distance from the muster station was moderate, while in the previous case it was long.
Finally, considering the results of the pre-abandonment model, it was noted that the percentage of passengers that reached the muster stations was a parameter of major importance. When the propulsion system was affected by the fire and the percentage of passengers in the muster station was between 50 and 80%, the model was still proposing that the best option was not to abandon ship. However, when more than 80% of the passengers were ready to safely abandon the vessel also, taking into account the high proximity of other vessels, the assistance from SAR vessels that were notified in time, the moderate distance from shore, and the expected fair weather conditions, the model proposed that the abandonment of the ship was the proper decision with a percentage of 62%.

12. Conclusions

Ship evacuation is a very challenging process to handle, and the analysis of accident reports showed that it can have undesired consequences if an incident gets out of control due to a lack of situational awareness. It is believed that the way forward in the handling of such difficult situations is the interpretation of new technologies and digital tools, and, in this respect, various researchers are focusing on this aspect.
A dynamic risk analysis seems to be an appropriate approach for the evacuation process, which is a highly dynamic process. A dynamic risk assessment should be able to take any new information into account and to adjust to the dominant dynamic environment [27]. However, there are some challenges to face in the implementation of risk models and in performing such an analysis, such as those described in this paper. The most significant and common limitation is the lack of statistical data relevant to each application. This data forms the basis of the analysis and gives an indication of the frequency and the most likely consequences of the relevant accident scenario under consideration. An insufficiency of statistical data could result in large uncertainties in the outcomes of the analysis and the need to make simplifying assumptions in the modelling process. Expert judgment that can be employed for quantification purposes and to address the limited availability of statistical data, as in this study, can affect the reliability of risk models due to the inherent subjectivity and related uncertainties [28,29]. On the other hand, the use of Bayesian networks for the development of risk models also has a series of specific advantages. Some of the benefits of BNs include the explicit representation of dependencies among events, updating probabilities, and coping with uncertainties. BNs facilitate a flexible way to exploit expert knowledge by providing the ability to quantify conditional probability tables (CPTs), even with partial information [30]. Moreover, BNs have been used to dynamically update probabilities by continually taking into account new information [31].
SRAP is a risk-based, digital tool of the PALAEMON ecosystem that aims to enhance the situational awareness of the master and bridge command team of a ship under the adverse conditions of a ship evacuation process and to provide decision support for the incident/accident management lifecycle. This is achieved by performing a dynamic risk assessment to quantify the risk associated with the three main phases of the evacuation process in real time, i.e., a situation assessment, mustering, and a pre-abandonment assessment. For the development of SRAP, a structured methodology was applied, where three different BN models were developed and validated. This goes along with the opinion that the utilisation of technology is an efficient way to deal with the very challenging procedure of a ship evacuation due to accidents in the maritime domain.
The outcome of the case study showed that the application of SRAP gave promising results. In addition, there was confidence in the model’s predictive validity, considering that the outcome reflected the data and information collected from experts in the maritime field. Specifically, the case study results showed that at least 80% of the total number of passengers must be assembled before an abandonment order is proposed by the model.
Future work includes the application of the developed risk models in numerous simulations in order to enhance their sensitivity, reliability, and the robustness of their results even more.

Author Contributions

Conceptualization, N.P.V., A.K., K.L., N.T., and M.-A.K.; methodology, N.P.V., A.K., K.L., N.T., and M.-A.K.; software, A.K., K.L., and N.T.; validation, A.K., K.L., N.T., and M.-A.K.; formal analysis, A.K., K.L., N.T., and M.-A.K.; investigation, A.K., K.L., and M.-A.K.; resources, N.P.V.; writing—original draft preparation, M.-A.K., N.P.V., A.K., K.L., and N.T.; writing—review and editing, A.K., K.L., and N.T.; supervision, N.P.V. and A.K.; project administration, N.P.V. and A.K. All authors have read and agreed to the published version of the manuscript.

Funding

The work presented in this paper was supported by the project “PALAEMON: A holistic passenger ship evacuation and rescue ecosystem”, which has received funding from the European Union’s Horizon 2020 research and innovation programme, EU.3.4.—SOCIETAL CHALLENGES—Smart, Green, and Integrated Transport of the European Union under the Topic MG-2-2-2018—Marine Accident Response (grant agreement number 814962).

Institutional Review Board Statement

Not applicable.

Informed Consent Statement

Not applicable.

Data Availability Statement

No new data were created in this study.

Conflicts of Interest

The authors declare no conflict of interest.

Appendix A

Table A1 and Table A2 provide a detailed description of the individual nodes of the mustering assessment and pre-abandonment assessment BN models respectively, together with the assumptions that have been employed.
Table A1. Description of nodes and related assumptions of the mustering assessment BN.
NodeStatesDescription and Assumptions
Passenger speedAs expected
Below expected
Immobilized
Each state corresponds to a range of % deviation of the achieved walking speed of each passenger from the nominal one. Each passenger is assigned in a population category according to IMO MSC Circ. 1553 [32]. For each category, an expected walking speed is defined based on the type of terrain (corridor/staircase).
Presence of
hazards
Smoke, toxic gas
Fire
Water
No hazard
Indicates the presence of these hazards within the vicinity of the passenger location (impair the visibility of exit signs, reduce the walking speed due to a lack of oxygen, or the presence of water). It is assumed that hazards are present when a passenger is located within the coverage area of an activated sensor (e.g., a smoke detector).
O2 saturationNormal
Critical
Dangerous
Indicates the probability of a person being able to move based on the O2 saturation in his/her blood. It is assumed that there are three levels of criticality based on the O2 saturation. Normal: more than 90%, critical: between 80% and 90%, dangerous: below 80% [33].
Movement
efficiency
Low
Medium
High
The likelihood of an individual passenger’s movement being efficient in terms of individual safety, walking speed, and O2 saturation. The lower the walking speed deviation from the expected values, the higher the efficiency. The presence of hazards reduces the movement efficiency. A low movement efficiency contributes to potential delays. Low levels of O2 saturation indicate difficulties in movement.
Heart rateNormal
Panic
Heart rate is used as an indicator of stress. In particular, a higher heart rate than a specific threshold may indicate extreme stress (i.e., fight or flight zone). For each passenger group, a normal heart rate range is determined from the relevant literature based on the age of the passenger [34].
Fall
detection
Yes
No
Indicates whether a passenger has fallen. If the respective alarm is activated, then it is assumed that the passenger has an increased probability to suffer an injury, leading to a delayed arrival at the muster station.
Potential for
injuries
Low
Medium
High
Hazards in the vicinity of the passenger location, deviations from normal heart rate values, and the activation of the fall detection alarm increase the likelihood that a passenger has been injured.
Individual statusAssistance required
Movement delayed
Free movement
Likelihood of individual passengers requiring assistance for getting to the muster station and/or medical assistance. Individual status is inferred for each passenger separately and provides the input to the group status node in statistical terms. It is assumed that a passenger needs crew assistance when they move through hazardous areas, their speed is lower than expected, and their heart rate is abnormal.
Passenger flow in areaNormal
Delayed
Disrupted
The probability that the flow of passengers in an area is normal, delayed, or disrupted based on the percentage of the individual status of them in the area.
Deck distance from
muster station
Long
Moderate
Short
Acts as a measure of the duration of exposure to a hazardous environment. It is assumed that the longer the distance to be covered, the higher the direct exposure to hazards and the higher the impact from the conditions during the mustering process, such as anxiety, falls, and panic.
Group
performance
Low
Medium
High
An assessment of the passenger group performance is correlated with the performance of the mustering process in terms of delays and passenger exposure to hazards, as well as the distance of the group from the muster station. In addition, group performance is considered to be a function of individual status.
CongestionLow
Moderate
High
Congested areas in critical locations (e.g., exits, staircases) affect the performance of the group (e.g., disordering, anxiety, and the incurrence of injuries such as trampling). According to IMO MSC.1/Circ. 1533 [35], congestion occurs when the ratio of the number of passengers/square meter exceeds a value of 3.5.
BlockageYes
No
Indicates the availability of exits or part of a route on ship deck X due to the presence of a hazard that results in the accessibility of the exits/route. There is a direct effect on the delay of the mustering process, as passengers will need to be re-directed to other evacuation route(s). It is assumed that the presence of a hazard and/or an incident on a deck blocks the corresponding evacuation route(s).
Availability of muster stationAccessible
Not accessible
If a muster station of an MVZ is not accessible, this will possibly increase the time needed to arrive at alternative muster stations and, thus, increase the required time for completing the mustering process. A muster station may not be available or accessible due to hazardous conditions within its area or in case it cannot be used as an access point for the MEVs (e.g., fire on the deck outside the muster station).
Escape routes statusOpened
Disrupted
Closed
Escape routes are considered to be open when the likelihood of congestion is low and there are no blockages, they are considered to be disrupted when there is the existence of either congestion or blockages, and they are considered to be closed when passengers need to be redirected to alternative routes.
Status of PA systemOperational
Not operational
It is assumed that if the PA system is operational, the crew know how to use it and will use it appropriately for the specific situation.
Status of
wayfinding
system
Operational
Not operational
Indicates whether the wayfinding system is operational for supporting passengers with reaching their assigned muster station. The ship’s wayfinding system for evacuation includes low lights and exit signs that provide the necessary signage to follow through an escape route to the assigned or nearest muster station. This equipment is vital for the effectiveness of the mustering process, especially when visibility is low or when lights are not working (e.g., in the case of a blackout). It is assumed that the ship’s wayfinding system complies with SOLAS II-2/Reg. 13 [36].
Presence of crew
members
Present
Absent
Indicates whether crew members in an area under examination are present to assist and guide the passengers. Crew members provide guidance and assistance to passengers during the mustering process; thus, their absence will result in delays to the mustering process. In the context of this node it is assumed that crew members will be at their designated positions, according to the ship’s emergency procedures, and that they will carry out their duties as intended.
Status of supporting systemsOperational
Degraded
Not operational
The likelihood that the systems that support the mustering process are operational based on the status of the PA and wayfinding systems and the presence of the crew. If supporting systems are not fully operational, then the likelihood that the mustering process will be delayed is increased. Supporting systems are operational if the PA and wayfinding systems are operational and crew members are at their designated places, they are degraded if any one of the above are not operational, and they are not operational if all of the above are not operational.
Risk of
delay
Low
Medium
High
Represents the probability of a risk of delay for the specific area of the vessel depending on the status of escape routes and supporting systems, as well as the performance of the passengers in the area. A high risk of delay implies that immediate actions need to be taken to assist passengers and to restore passenger flow towards the muster stations. A medium risk implies there are specific areas where the mustering process could be delayed, and therefore special attention is required for this area. A low risk of delay indicates that the mustering process is developing smoothly, but continuous monitoring is required.
Table A2. Description of nodes and related assumptions of the pre-abandonment assessment BN.
NodeStatesDescription and Assumptions
Proximity of other vessels for assistanceLow
Moderate
High
Indicates the possibility of other vessels providing assistance with respect to rescuing passengers abandoning the vessel with lifeboats. The proximity of other vessels depends on the frequency of maritime traffic in the area. Vessels in the vicinity respond to distress calls as per the requirements of the SAR convention. A high proximity may decrease the amount of time that the passengers are exposed to environmental hazards after the abandonment.
Availability of SAR vesselsOn the way
Delayed
Indicates whether a search and rescue (SAR) operation has commenced from the competent authorities after a distress signal has been sent. The time it takes for the SAR vessels to arrive at the scene depends on the distance from the nearest marine rescue centre and the prevailing weather and sea conditions.
Status of external assistanceExpected
Delayed
Indicates whether assistance is expected once people have abandoned the ship on the lifeboats. This depends on the mobilization of a SAR operation and the distance to nearby vessels. External assistance is expected when at least some SAR vessels have been notified and are on the way and nearby vessels are close to the ship involved in the incident.
Distance from shoreLow
Moderate
High
Indicates whether passengers, after the abandonment, can reach the shore safely in a reasonable amount of time. If an incident happens near the shore, the passengers have a higher probability of getting rescued even in the worst-case scenarios (e.g., lifeboats are unavailable).
Expected weather conditionsFair
Moderate
Harsh
Information about prevailing weather conditions is taken in the form of a 3 h forecast. Fair, moderate, and harsh characterizations are based on the following sea states, as described by ITTC 7.5-04-01-01.1 [37]: 0–3 (fair), 4–6 (moderate), greater than 7 (harsh). Harsh weather conditions increase the probability of adverse consequences to human safety. Extreme temperatures (low or high) can also affect passenger vulnerability.
Vulnerability after abandonmentLow
Moderate
High
This aspect relates to potential adverse consequences to passenger safety after being exposed to environmental hazards. This depends on how quickly they can be brought to safety, either at shore or on board another vessel, as well as on the prevailing weather conditions. Low levels of vulnerability are related to minimum exposure, either due to fair environmental conditions (independently from the time until SAR) or due to a quick SAR (independently from the prevailing conditions).
MEV availabilityYes
No
Indicates whether MEVs are damaged, inaccessible, or unsafe to approach for the crew and passengers due to the incident. The MEVs are considered available if they have not suffered damages to an extent that their floatability and water tightness are affected and if they are safely accessible by the crew and passengers.
Maximum roll
angle_MEV
Exceeded
Not exceeded
Indicates whether safe limits for the maximum roll angle have been exceeded with respect to whether the launching system of the MEVs can operate as expected. The threshold values depend on the vessel and the MEVs’ characteristics.
MEV launching statusAble to launch
Unable to launch
Indicates whether the launching system of the MEVs is expected to operate as intended, considering the operational constraints with respect to the ship’s maximum roll angle (i.e., the ship’s heel) and damages that the system may have suffered from the incident. The MEVs will be able to launch if they have not suffered any non-extensive damage either to their launching system or to their structure and at a maximum ship heel angle that at least complies with the requirements set by the LSA code Ch. IV-4.4 §4.4.1 [38].
Pax at muster stationsBelow 50%
Between 50–80%
Over 80%
Indicates the number of passengers that have arrived at muster stations as a percentage of the total number of passengers on board. All expected passengers must have arrived at muster stations in order to be able to order vessel abandonment and for the mustered passengers to start boarding the MEVs. The specific percentages can be treated as a parameter that reflects the attitude of the decision maker towards risk aversion.
Abandonment readinessLow
Moderate
High
The level of abandonment readiness depends on the percentage of passengers at the muster stations that can start boarding the MEVs and on the capability of launching the MEVs. A high level of readiness implies that nearly all passengers have arrived at their designated muster station and can safely board the MEVs that can be launched.
Urgency for abandonmentLow
Moderate
High
An assessment of the pre-abandonment situation by considering the impact to passenger safety if they (1) remain on board at their designated muster stations, or (2) board the MEVs, evacuate the vessel, and wait for SAR. The assessment depends on the integrity of the vessel and the operational status of its subsystems given the incident and the degree to which it has been contained, the potential impact to human safety given an abandonment order, and the readiness to abandon. The decision alternatives for the master that are supported by the assessment are to delay and further evaluate the situation or immediately give the order to abandon the vessel.

References

  1. Koimtzoglou, A.; Themelis, N.; Ventikos, N.P.; Louzis, K.; Koimtzoglou, M.; Giannakis, K.; Panagiotidis, P.; Moustogiannis, S.; Ramiro, M.; Peña, J.; et al. Assessing the Risk during Mustering in Large Passenger Vessels: A Digital Tool for Real Time Decision Support. In Sustainable Development and Innovations in Marine Technologies; CRC Press: Boca Raton, FL, USA, 2022; pp. 269–276. [Google Scholar] [CrossRef]
  2. Koimtzoglou, A.; Louzis, K.; Michelis, A.; Koimtzoglou, M. Mass evacuation of large passenger ships: A state-of-the-art analysis- setting the foundations for the intelligent evacuation ecosystem Palaemon. In Proceedings of the Hellenic Institute of Marine Technology Annual Conference of Marine Technology, Athens, Greece, 2 December 2021; pp. 137–150. [Google Scholar]
  3. Liu, Z.; Li, Y.; Zhang, Z.; Yu, W. A New Evacuation Accessibility Analysis Approach Based on Spatial Information. Reliab. Eng. Syst. Saf. 2022, 222, 108395. [Google Scholar] [CrossRef]
  4. Yue, Y.; Gai, W.M.; Deng, Y.F. Influence factors on the passenger evacuation capacity of cruise ships: Model-ling and simulation of full-scale evacuation incorporating information dissemination. Process Saf. Environ. Protection 2022, 157, 466–483. [Google Scholar] [CrossRef]
  5. Liu, L.; Zhang, H.; Xie, J.; Zhao, Q. Dynamic Evacuation Planning on Cruise Ships Based on an Improved Ant Colony System (IACS). J. Mar. Sci. Eng. 2021, 9, 220. [Google Scholar] [CrossRef]
  6. Liu, Y.; Zhang, H.; Zhan, Y.; Deng, K.; Dong, L. Evacuation Strategy Considering Path Capacity and Risk Level for Cruise Ship. J. Mar. Sci. Eng. 2022, 10, 398. [Google Scholar] [CrossRef]
  7. Zhang, H.; Li, C.; Zhao, N.; Chen, B.-Q.; Ren, H.; Kang, J. Fire Risk Assessment in Engine Rooms Considering the Fire-Induced Domino Effects. J. Mar. Sci. Eng. 2022, 10, 1685. [Google Scholar] [CrossRef]
  8. Eleye-Datubo, A.G.; Wall, A.; Saajedi, A.; Wang, J. Enabling a Powerful Marine and Offshore Decision-Support Solution Through Bayesian Network Technique. Risk Anal. 2006, 26, 695–721. [Google Scholar] [CrossRef] [PubMed]
  9. Sarshar, P.; Granmo, O.-C.; Radianti, J.; Gonzalez, J.J. A Bayesian Network Model for Evacuation Time Analysis during a Ship Fire. In Proceedings of the 2013 IEEE Symposium on Computational Intelligence in Dynamic and Uncertain Environments (CIDUE), Singapore, 6–19 April 2013; pp. 100–107. [Google Scholar] [CrossRef]
  10. Sarshar, P.; Radianti, J.; Gonzalez, J.J. Modeling Panic in Ship Fire Evacuation Using Dynamic Bayesian Network. In Proceedings of the Third International Conference on Innovative Computing Technology (INTECH 2013), London, UK, 29–31 August 2013; pp. 301–307. [Google Scholar] [CrossRef]
  11. Sarshar, P.; Radianti, J.; Granmo, O.-C.; Gonzalez, J.J. A Dynamic Bayesian Network Model for Predicting Congestion During a Ship Fire Evacuation, In Proceedings of the Name of the World Congress on Engineering and Computer Science (WCECS), San Francisco, CA, USA, 23–25 October 2013.
  12. Lazreg, M.B.; Radianti, J.; Granmo, O.C. SmartRescue: Architecture for Fire Crisis Assessment and Prediction. In Proceedings of the ISCRAM Conference, Kristiansand, Norway, 24–27 May 2015. [Google Scholar]
  13. International Maritime Organization (IMO). Interim Guidelines for Evacuation Analyses for New and Existing Passenger Ships- MSC.1/Circ. 1033; International Maritime Organization (IMO): London, UK, 2007. [Google Scholar]
  14. Ministry of Infrastructures and Transports. Fire on Board Ro-Ro Pax SORRENTO—28 April 2015—Interim Report, 3rd ed.; Ministry of Infrastructures and Transports: Rome, Italy, 2015.
  15. Accident Investigation Board Norway. Interim Report 12 November 2019 on the Investigation into the Loss of Propulsion and Near Grounding of Viking Sky, 23 March 2019; Accident Investigation Board Norway: Lillestrøm, Norway, 2019.
  16. National Transportation Safety Board. Marine Accident Brief—Engine Room Fire Aboard Cruise Ship Carnival Liberty; National Transportation Safety Board: Washington, DC, USA, 2017.
  17. Ministry of Infrastructures and Transports. Cruise Ship Costa Concordia Marine Casualty on January 13, 2012 Report on the Safety Technical Investigation; Ministry of Infrastructures and Transports: Rome, Italy, 2012.
  18. Transportation Safety Board of Canada. Marine Investigation Report M06W0052-Striking and Subsequent Sinking Passenger and Vehicle Ferry Queen of the North Gil Island, Wright Sound, British Columbia 22 March 2006; Transportation Safety Board of Canada: Gatineau, QC, Canada, 2008. [Google Scholar]
  19. Ventikos, N.P.; Themelis, N.; Louzis, K.; Koimtzoglou, A.; Michelis, A.; Koimtzoglou, M.; Ragab, A. Evaluating Risk during Evacuation of Large Passenger Ships: A Smart Risk Assessment Platform for Decision Support. In Trends in Maritime Technology and Engineering Volume 2; CRC Press: London, UK, 2022; pp. 283–294. ISBN 978-1-00-332028-9. [Google Scholar] [CrossRef]
  20. Jensen, F.V.; Nielsen, T.D. Bayesian Networks and Decision Graphs, 2nd ed.; Spinger: New York, NY, USA, 2007. [Google Scholar]
  21. Solberg, K.E.; Jensen, J.E.; Barane, E.; Hagen, S.; Kjøl, A.; Johansen, G.; Gudmestad, O.T. Time to Rescue for Different Paths to Survival Following a Marine Incident. J. Mar. Sci. Eng. 2020, 8, 997. [Google Scholar] [CrossRef]
  22. Pitchforth, J.; Mengersen, K. A Proposed Validation Framework for Expert Elicited Bayesian Networks. Expert Syst. Appl. 2013, 40, 162–167. [Google Scholar] [CrossRef]
  23. Ping, P.; Wang, K.; Kong, D.; Chen, G. Estimating Probability of Success of Escape, Evacuation, and Rescue (EER) on the Offshore Platform by Integrating Bayesian Network and Fuzzy AHP. J. Loss Prev. Process Ind. 2018, 54, 57–68. [Google Scholar] [CrossRef]
  24. DNV GL. BMVI Study on Safety Model for Life Saving Appliances—Closing Report and Recommendations; DNV GL: Oslo, Norway, 2019. [Google Scholar]
  25. Ji, J.; Ma, Z.; He, J.; Xu, Y.; Liu, Z. Research on Risk Evaluation and Dynamic Escape Path Planning Algorithm Based on Real-Time Spread of Ship Comprehensive Fire. J. Mar. Sci. Eng. 2020, 8, 602. [Google Scholar] [CrossRef]
  26. Koimtzoglou, A.; Themelis, N.; Ventikos, N.P.; Louzis, K.; Koimtzoglou. A dynamic risk model for assessing the risk of delay during mustering phase of a passenger ship evacuation process. Proc. Ins. Mech. Eng. Part M J. Eng. Marit. Environ. (JEME), 2023; submitted. [Google Scholar]
  27. Khakzad, N.; Khan, F.; Amyotte, P. Dynamic Risk Analysis Using Bow-Tie Approach. Reliab. Eng. Syst. Saf. 2012, 104, 36–44. [Google Scholar] [CrossRef]
  28. Zhang, G.; Thai, V.V.; Yuen, K.F.; Loh, H.S.; Zhou, Q. Addressing the Epistemic Uncertainty in Maritime Accidents Modelling Using Bayesian Network with Interval Probabilities. Saf. Sci. 2018, 102, 211–225. [Google Scholar] [CrossRef]
  29. Hänninen, M. Bayesian Networks for Maritime Traffic Accident Prevention: Benefits and Challenges. Accid. Anal. Prev. 2014, 73, 305–312. [Google Scholar] [CrossRef] [PubMed]
  30. Khakzad, N.; Khan, F.; Amyotte, P. Safety analysis in process facilities: Comparison of fault tree and Bayesian network approaches. Reliab. Eng. Syst. Saf. 2011, 96, 925–932. [Google Scholar] [CrossRef]
  31. Hamza, Z.; Abdallah, T. Mapping Fault Tree into Bayesian Network in safety analysis of process system. In Proceedings of the 2015 4th International Conference on Electrical Engineering (ICEE), Boumerdes, Algeria, 13–15 December 2015; pp. 1–5. [Google Scholar] [CrossRef]
  32. International Maritime Organization (IMO). Shipboard Escape Route Signs and Emergency Equipment Location Markings—MSC.1/Circ. 1553; International Maritime Organization (IMO): London, UK, 2016. [Google Scholar]
  33. Schade, M. Oxygen Saturation: Normal Values & Measurement’, Cosinuss. Available online: https://www.cosinuss.com/en/measured-data/vital-signs/oxygen-saturation/ (accessed on 20 November 2022).
  34. Davis, M.; Eshelman, E.R.; McKay, M. The Relaxation and Stress Reduction Workbook, 6th ed.; New Harbinger Publications: Oakland, CA, USA, 2008. [Google Scholar]
  35. International Maritime Organization (IMO). Revised Guidelines on Evacuation Analysis for New and Existing Passenger Ships—MSC.1/Circ. 1533; International Maritime Organization (IMO): London, UK, 2016. [Google Scholar]
  36. International Maritime Organization (IMO). Summary of SOLAS Chapter II-2. Available online: https://www.imo.org/en/OurWork/Safety/Pages/summaryofsolaschapterii-2-default.aspx (accessed on 20 November 2022).
  37. International Towing Tank Conference (ITTC). Recommended Procedures and Guidelines, Preparation and Conduct of Speed/Power Trials 7.5-04-01-01.1; International Towing Tank Conference (ITTC): Zürich, Switzerland, 2014; Available online: https://ittc.info/media/4208/75-04-01-011.pdf. (accessed on 24 November 2022).
  38. International Maritime Organization (IMO). Life-Saving Appliances-LSA Code; International Maritime Organization (IMO): London, UK, 2017. [Google Scholar]
Figure 1. The concept of SRAP presented in a flow chart.
Jmse 11 01014 g001
Figure 2. SRAP risk modelling methodology.
Jmse 11 01014 g002
Figure 3. The situation assessment BN and strength of influence analysis.
Jmse 11 01014 g003
Figure 4. The mustering assessment BN and strength of influence analysis.
Jmse 11 01014 g004
Figure 5. Indicative figure of SRAP’s mustering process assessment output.
Jmse 11 01014 g005
Figure 6. The pre-abandonment assessment BN and strength of influence analysis.
Jmse 11 01014 g006
Figure 7. Visual representation of the results of the three risk models.
Jmse 11 01014 g007
Table 1. Parent node state and output per time stamp of the situation assessment model.
Parent Nodet1t2t3
Time of dayDayDayDay
Incident typeFireFireFire
Incident locationERERER
Response team onsiteYesYesYes
Status of mitigation systemsNot activatedActivatedActivated
Status of adjacent detectorsNot activatedNot activatedNot activated
Status of containment doorsClosedClosedClosed
Global stressesNot exceededNot exceededNot exceeded
Restoring capability (GZ/GM criteria)CoveredCoveredCovered
Maximum roll angleNot exceededNot exceededNot exceeded
Internal communicationOperationalOperationalOperational
External communicationOperationalOperationalOperational
Propulsion systemOperationalOperationalOperational
Steering systemOperationalOperationalNot operational
Navigational systemsOperationalOperationalOperational
Sound the GAYes: 45%
No: 55%
Yes: 44%
No: 56%
Yes: 54%
No: 46%
Table 2. Parent node state and output per time stamp of the Mustering Assessment model (a).
Parent Nodet4t5t6
Deck distance from muster stationLongLongLong
Accessibility of muster stationAccessibleAccessibleAccessible
CongestionLowModerateHigh
BlockageNoNoNo
Status of PA systemOperationalOperationalOperational
Status of wayfinding systemOperationalOperationalOperational
Presence of crew membersYesYesYes
Passenger flow on area80% Normal
20% Delayed
0% Disrupted
60% Normal
40% Delayed
0% Disrupted
30% Normal
70% Delayed
0% Disrupted
Risk of DelayLow: 60%
Moderate: 27%
High: 13%
Low: 30%
Moderate: 36%
High: 34%
Low: 12%
Moderate: 36%
High: 52%
Table 3. Parent node state and output per time stamp of the Mustering Assessment model (b).
Parent Nodet4t5t6
Deck distance from muster stationModerateModerateModerate
Accessibility of muster stationAccessibleAccessibleAccessible
CongestionLowModerateModerate
BlockageNoNoYes
Status of PA systemOperationalOperationalOperational
Status of wayfinding systemOperationalOperationalOperational
Presence of crew membersYesYesYes
Passenger flow on area80% Normal
20% Delayed
0% Disrupted
50% Normal
35% Delayed
15% Disrupted
30% Normal
70% Delayed
0% Disrupted
Risk of DelayLow: 62%
Moderate: 26%
High: 12%
Low: 28%
Moderate: 36%
High: 36%
Low: 20%
Moderate: 34%
High: 46%
Table 4. Parent node state and output per time stamp of the Pre-Abandonment model.
Parent Nodet4t5t6
Status of mitigation systemsActivatedActivatedActivated
Response team(s) on siteYesYesYes
Status of containment doorsClosedClosedClosed
Status of adjacent detectorsNot ActivatedActivatedActivated
GZ-GMCoveredCoveredCovered
Maximum roll angleNot exceededNot exceededNot exceeded
Global stressesNot exceededNot exceededNot exceeded
Propulsion system statusOperationalNot operationalNot operational
Steering system statusNot operationalNot operationalNot operational
Navigational system statusOperationalOperationalOperational
Proximity of other vessels for assistanceHighHighHigh
Availability of SAR vesselsOn the wayOn the wayOn the way
Distance from shoreModerateModerateModerate
Expected weather conditionsFairFairFair
Pax at muster stationsBelow 50%Between 50–80%Over 80%
Maximum roll angle_MEVNot exceededNot exceededNot exceeded
MEV availabilityYesYesYes
Abandon VesselYes: 38%
No: 62%
Yes: 45%
No: 55%
Yes: 62%
No: 38%
Disclaimer/Publisher’s Note: The statements, opinions and data contained in all publications are solely those of the individual author(s) and contributor(s) and not of MDPI and/or the editor(s). MDPI and/or the editor(s) disclaim responsibility for any injury to people or property resulting from any ideas, methods, instructions or products referred to in the content.

