
Study on the Micro-Mechanical Mechanism of Fine-Grained Marine Sediments Subjected to Shallow Gas Invasion

Abstract
:1. Introduction
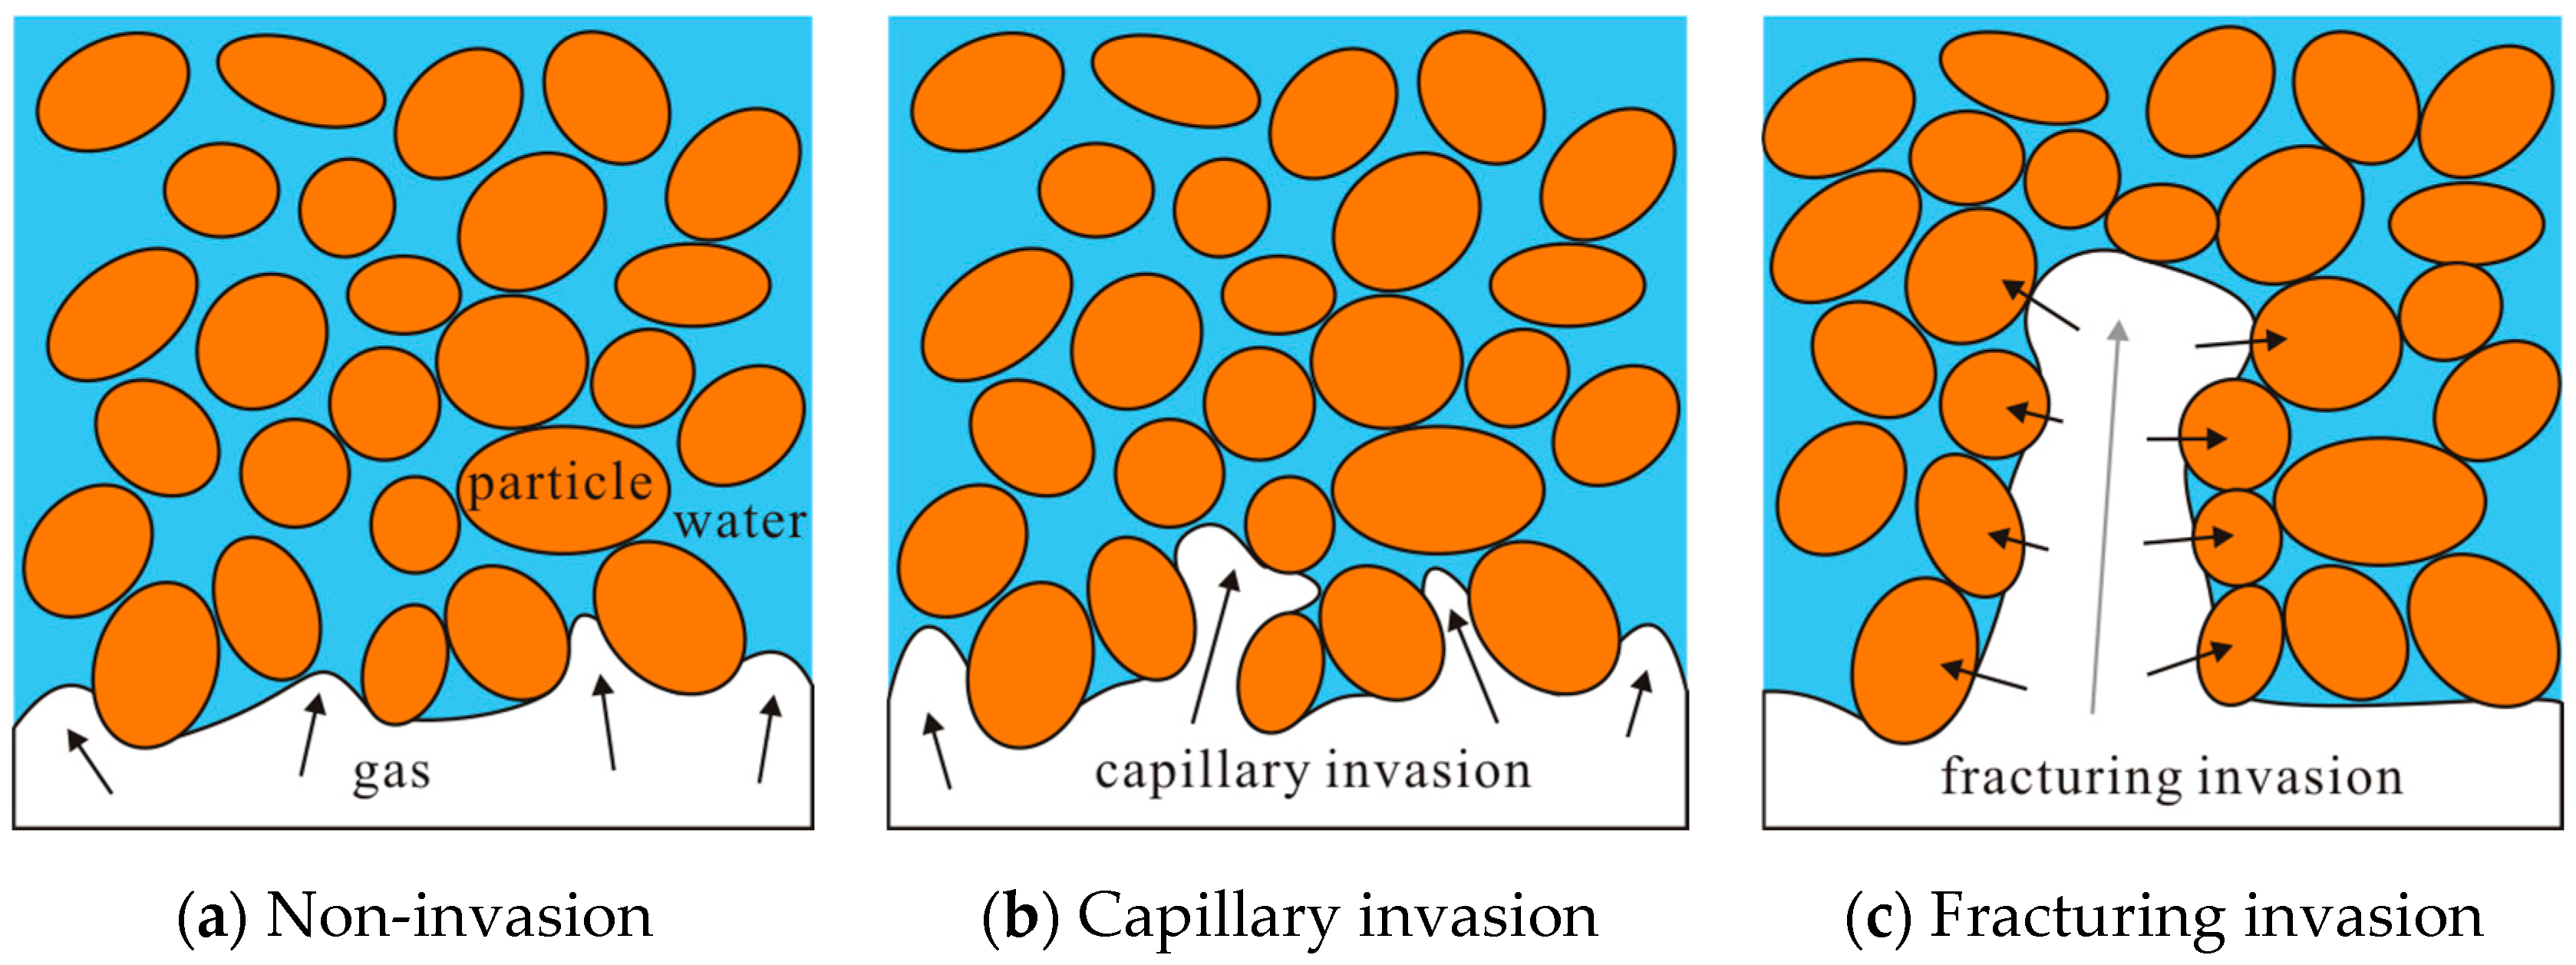
- (1)
- Capillary invasion: the gas invades into sediments along the pore space and displaces pore water with no skeleton deformation of the sediments [13].
- (2)
2. Materials and Methods
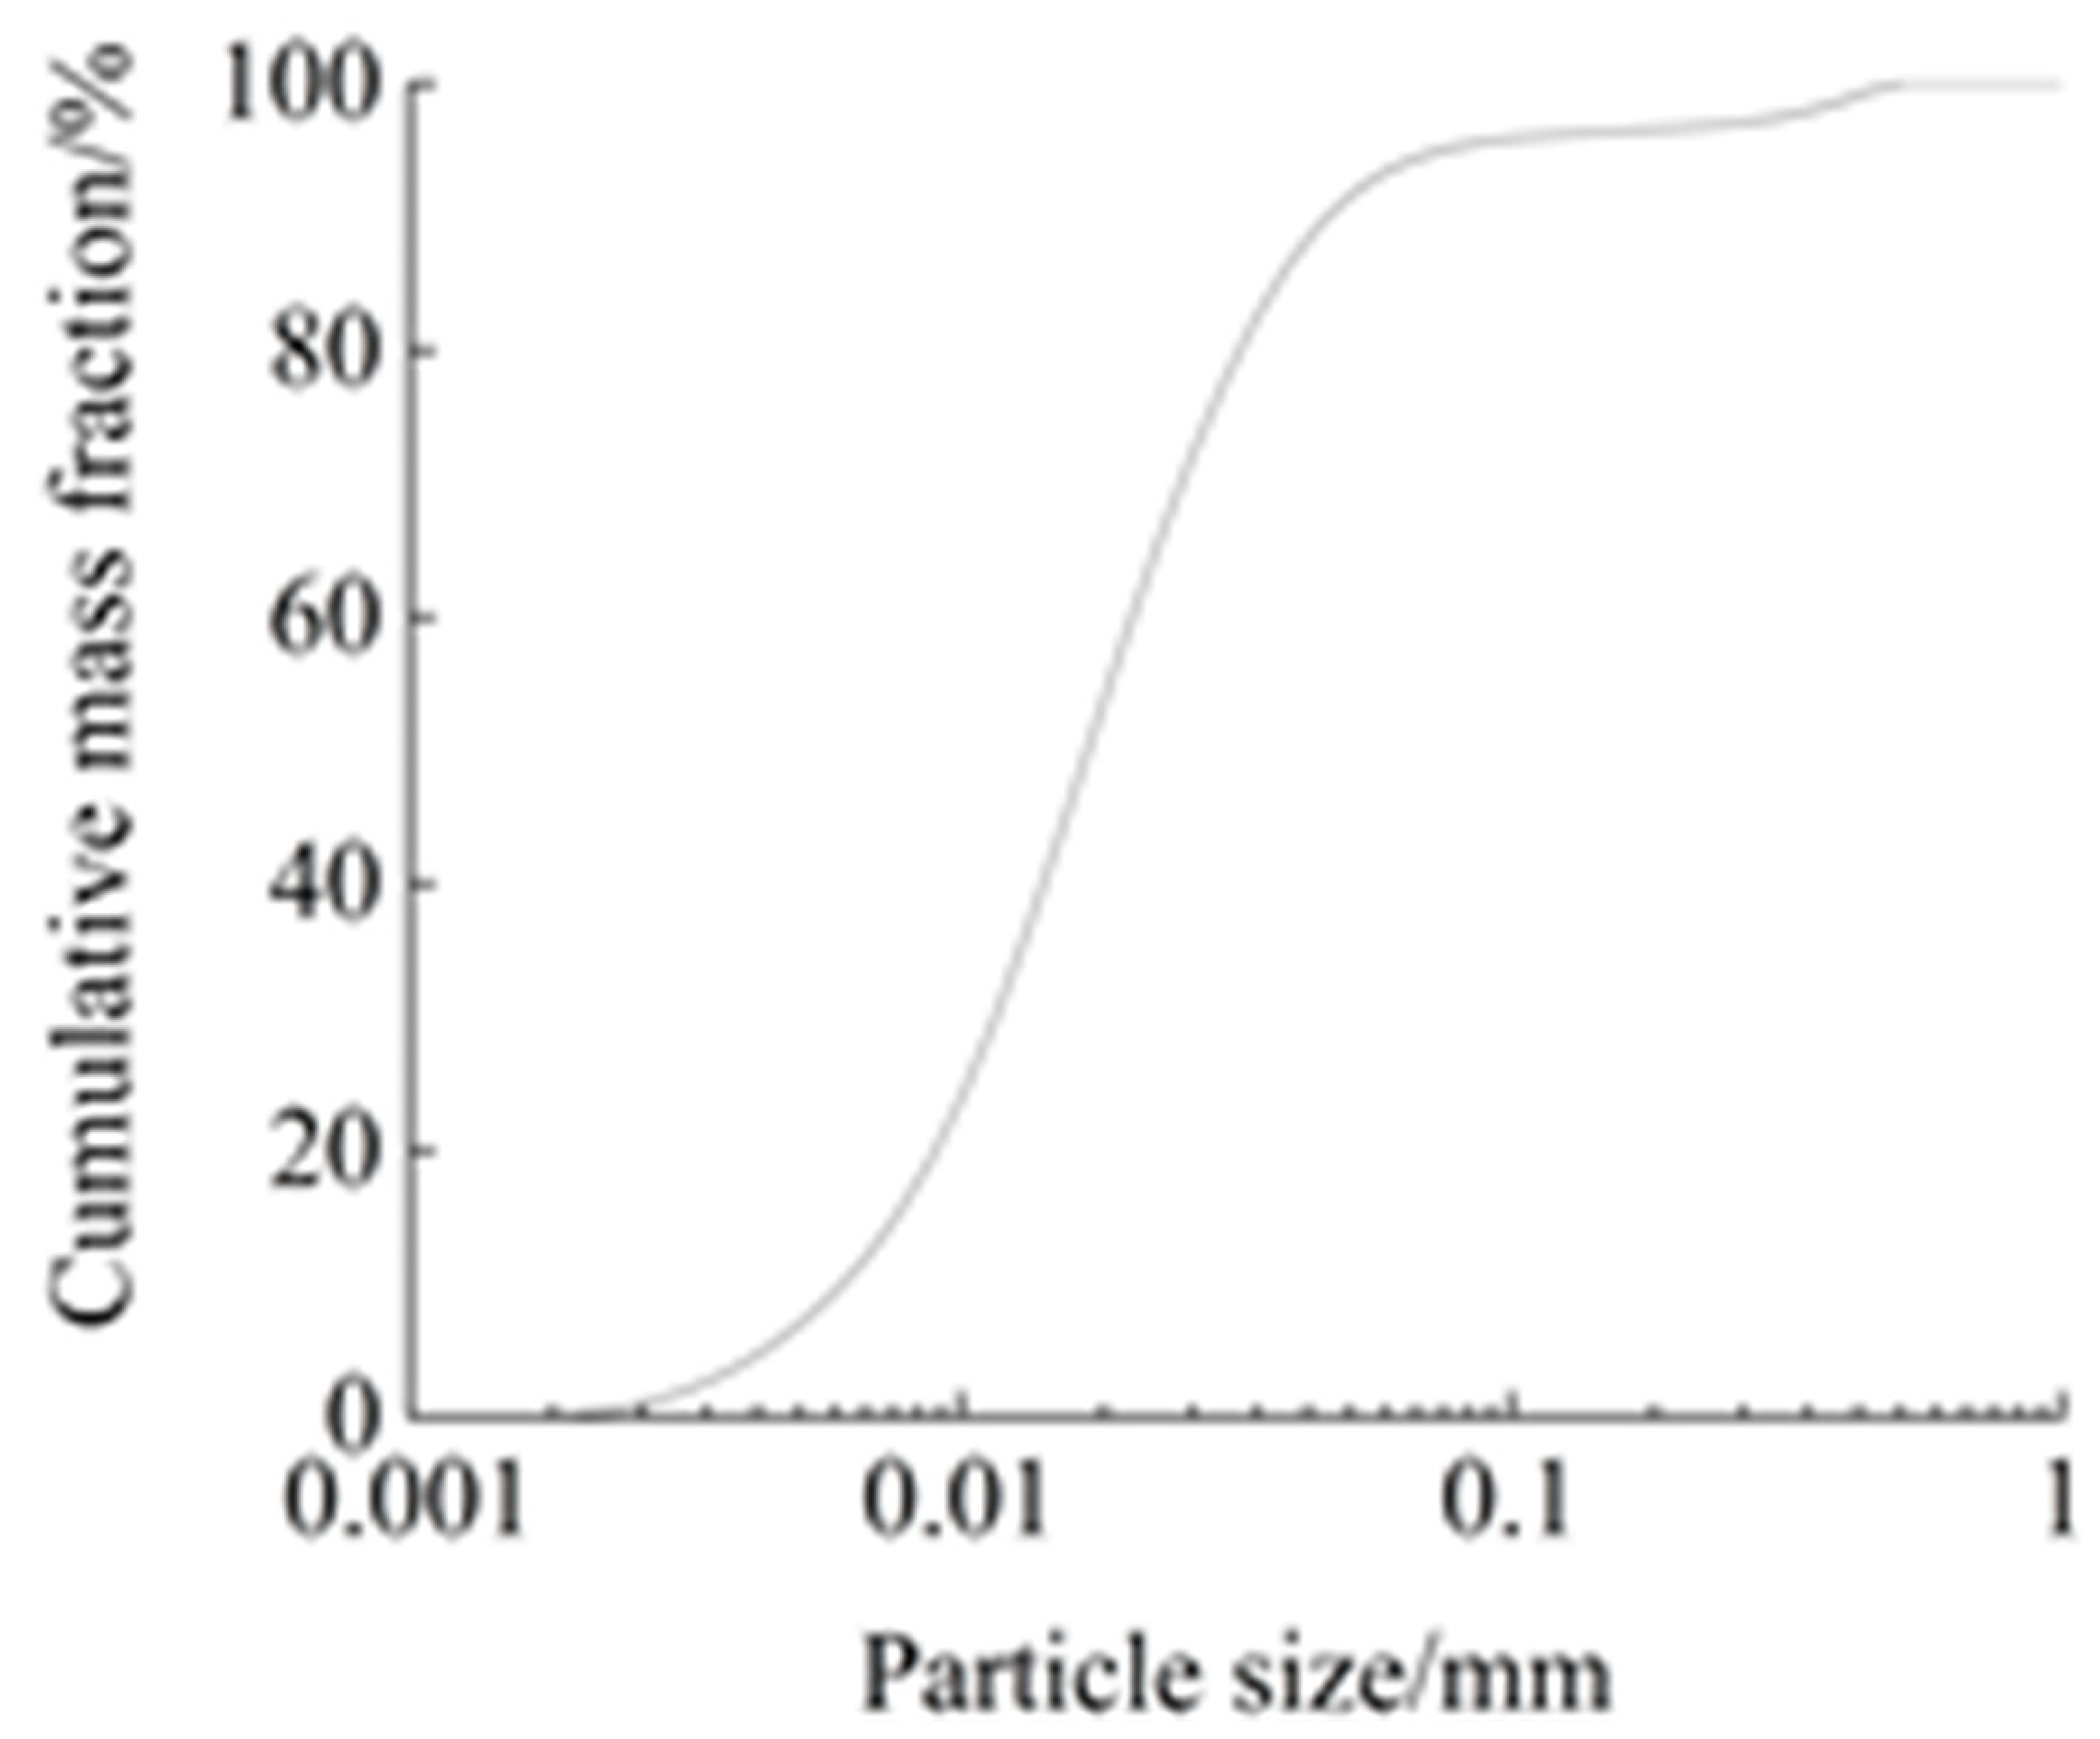
2.1. Test Materials
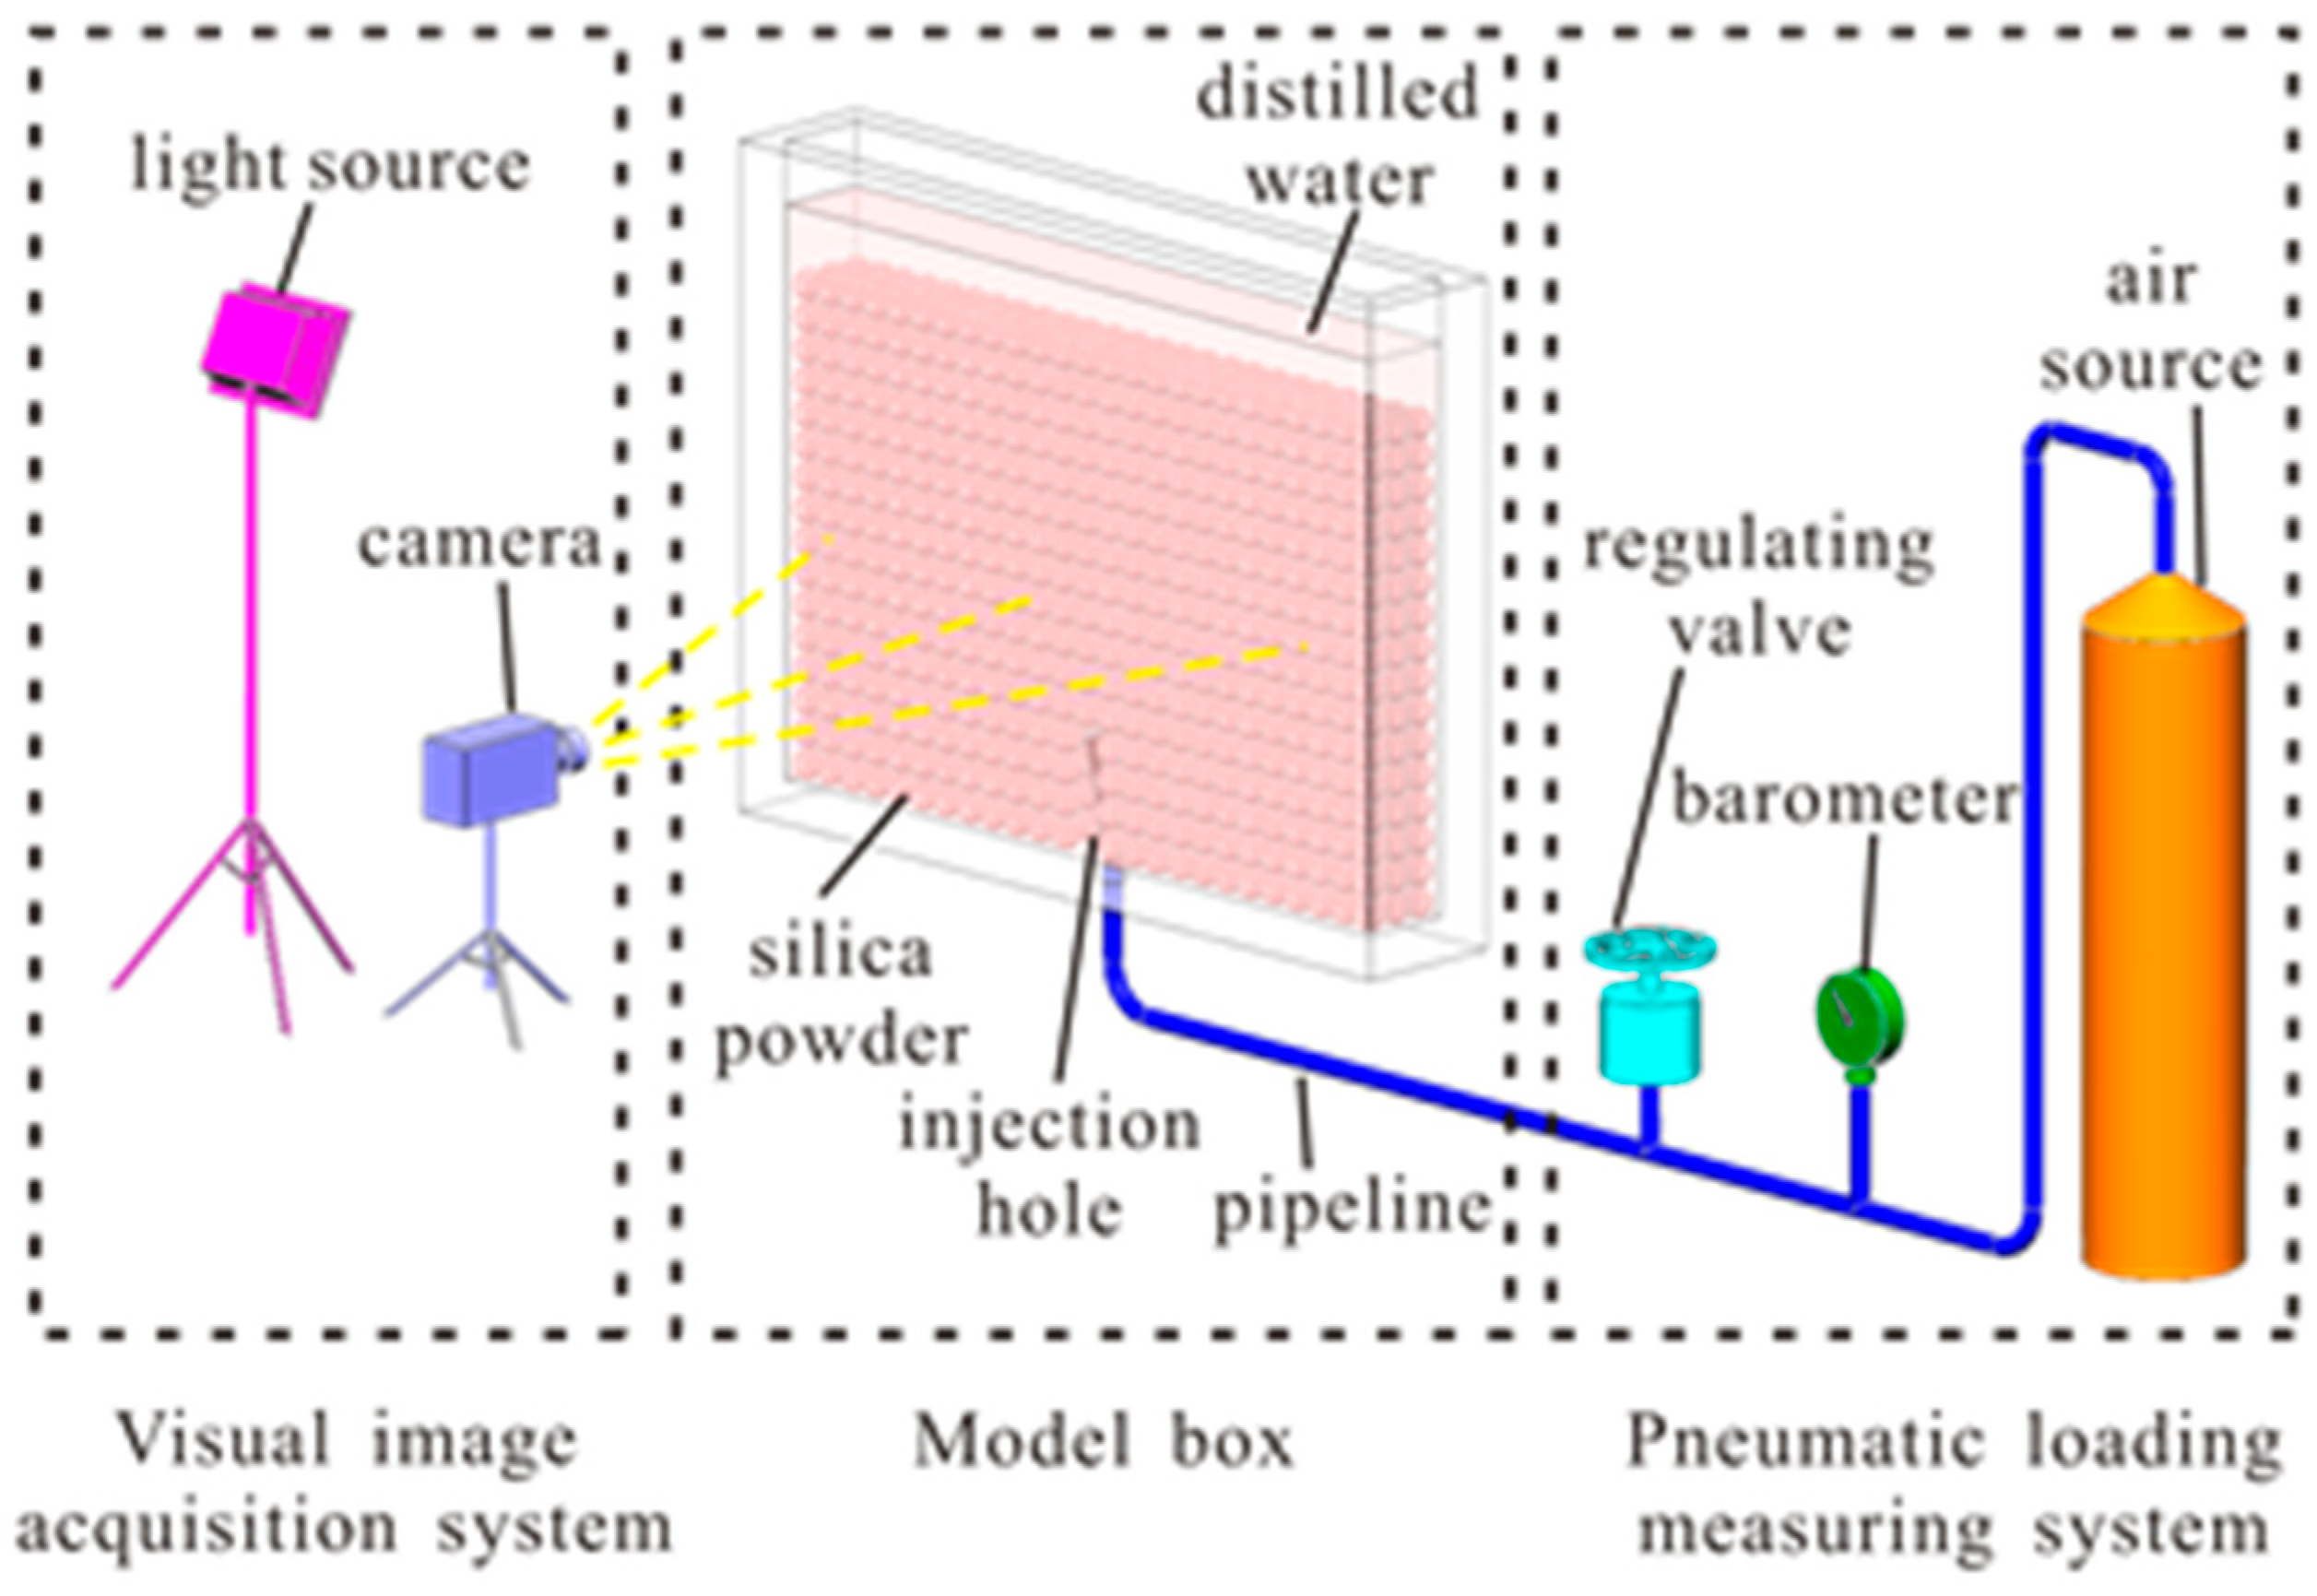
2.2. Test Apparatus
2.2.1. Model Box
2.2.2. Pneumatic Loading Measuring System
2.2.3. Visual Image Acquisition System
2.3. Test Methods
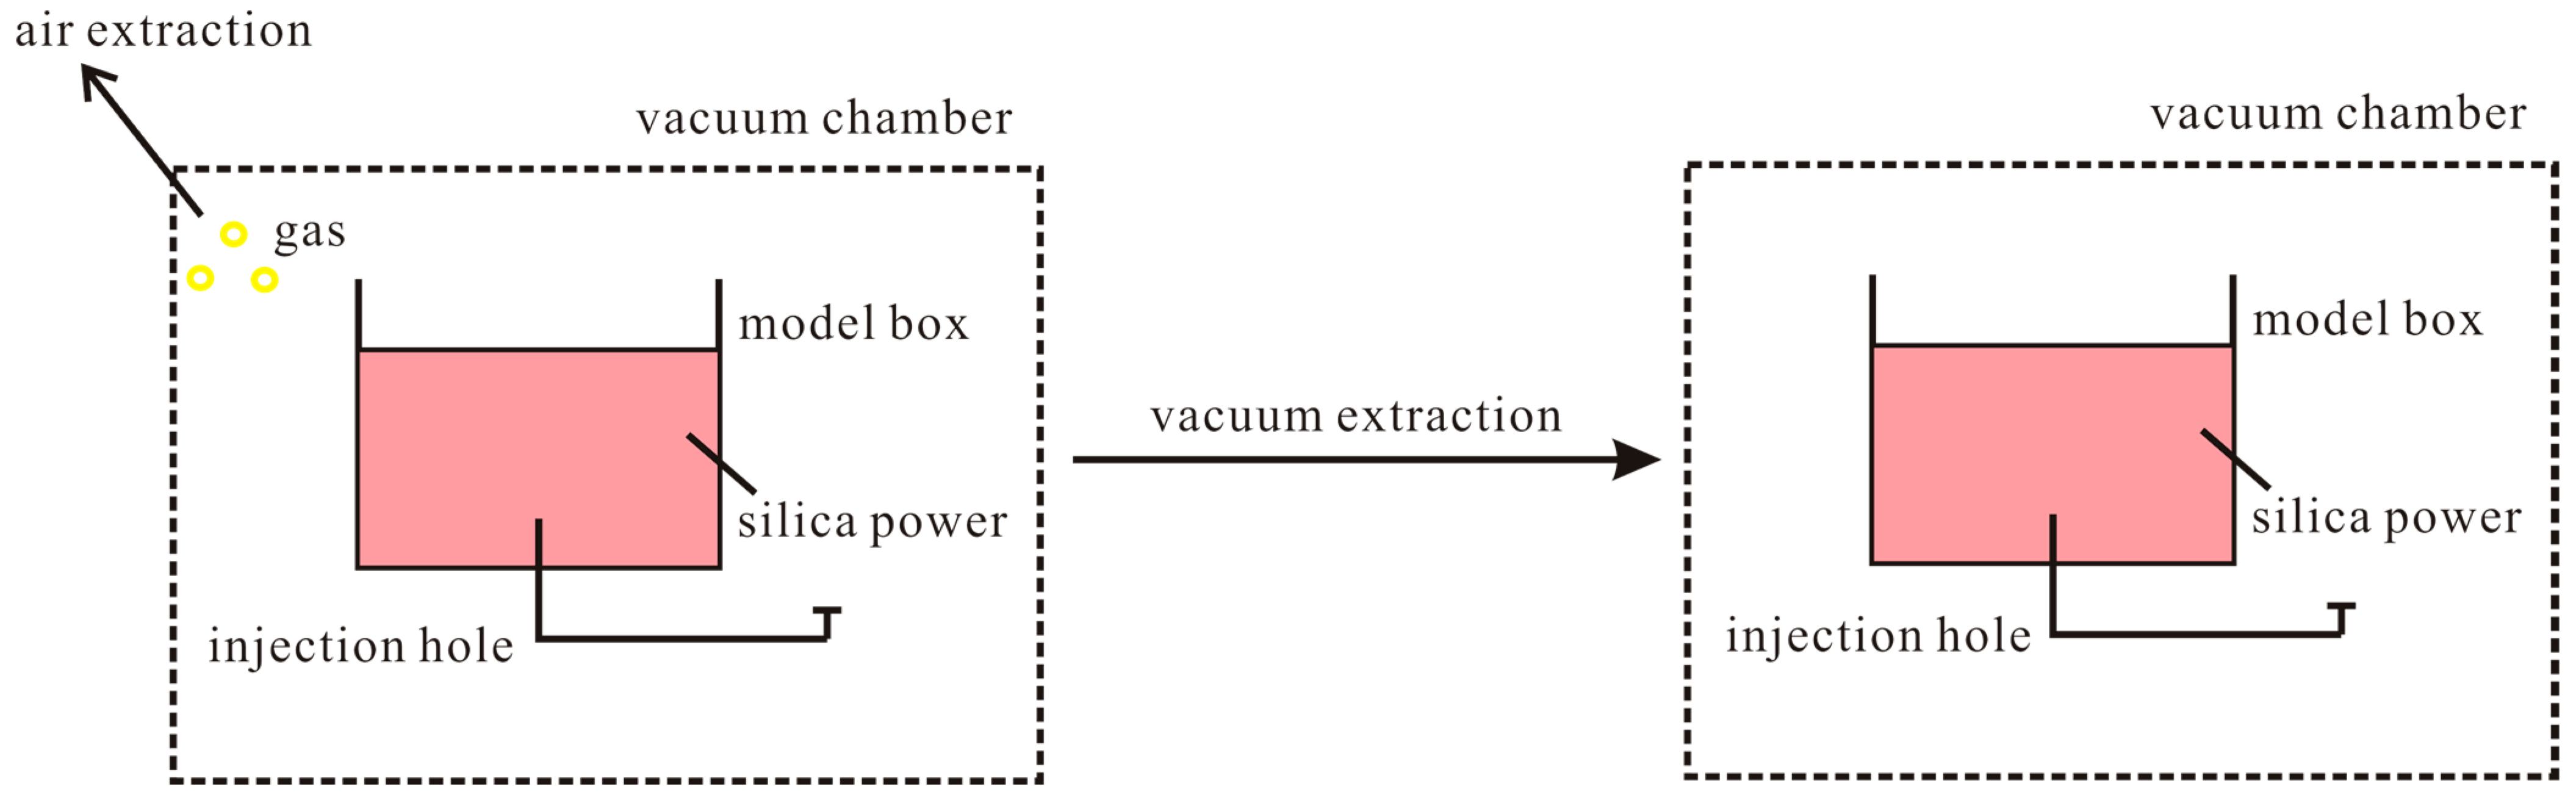
2.3.1. Sample Preparation
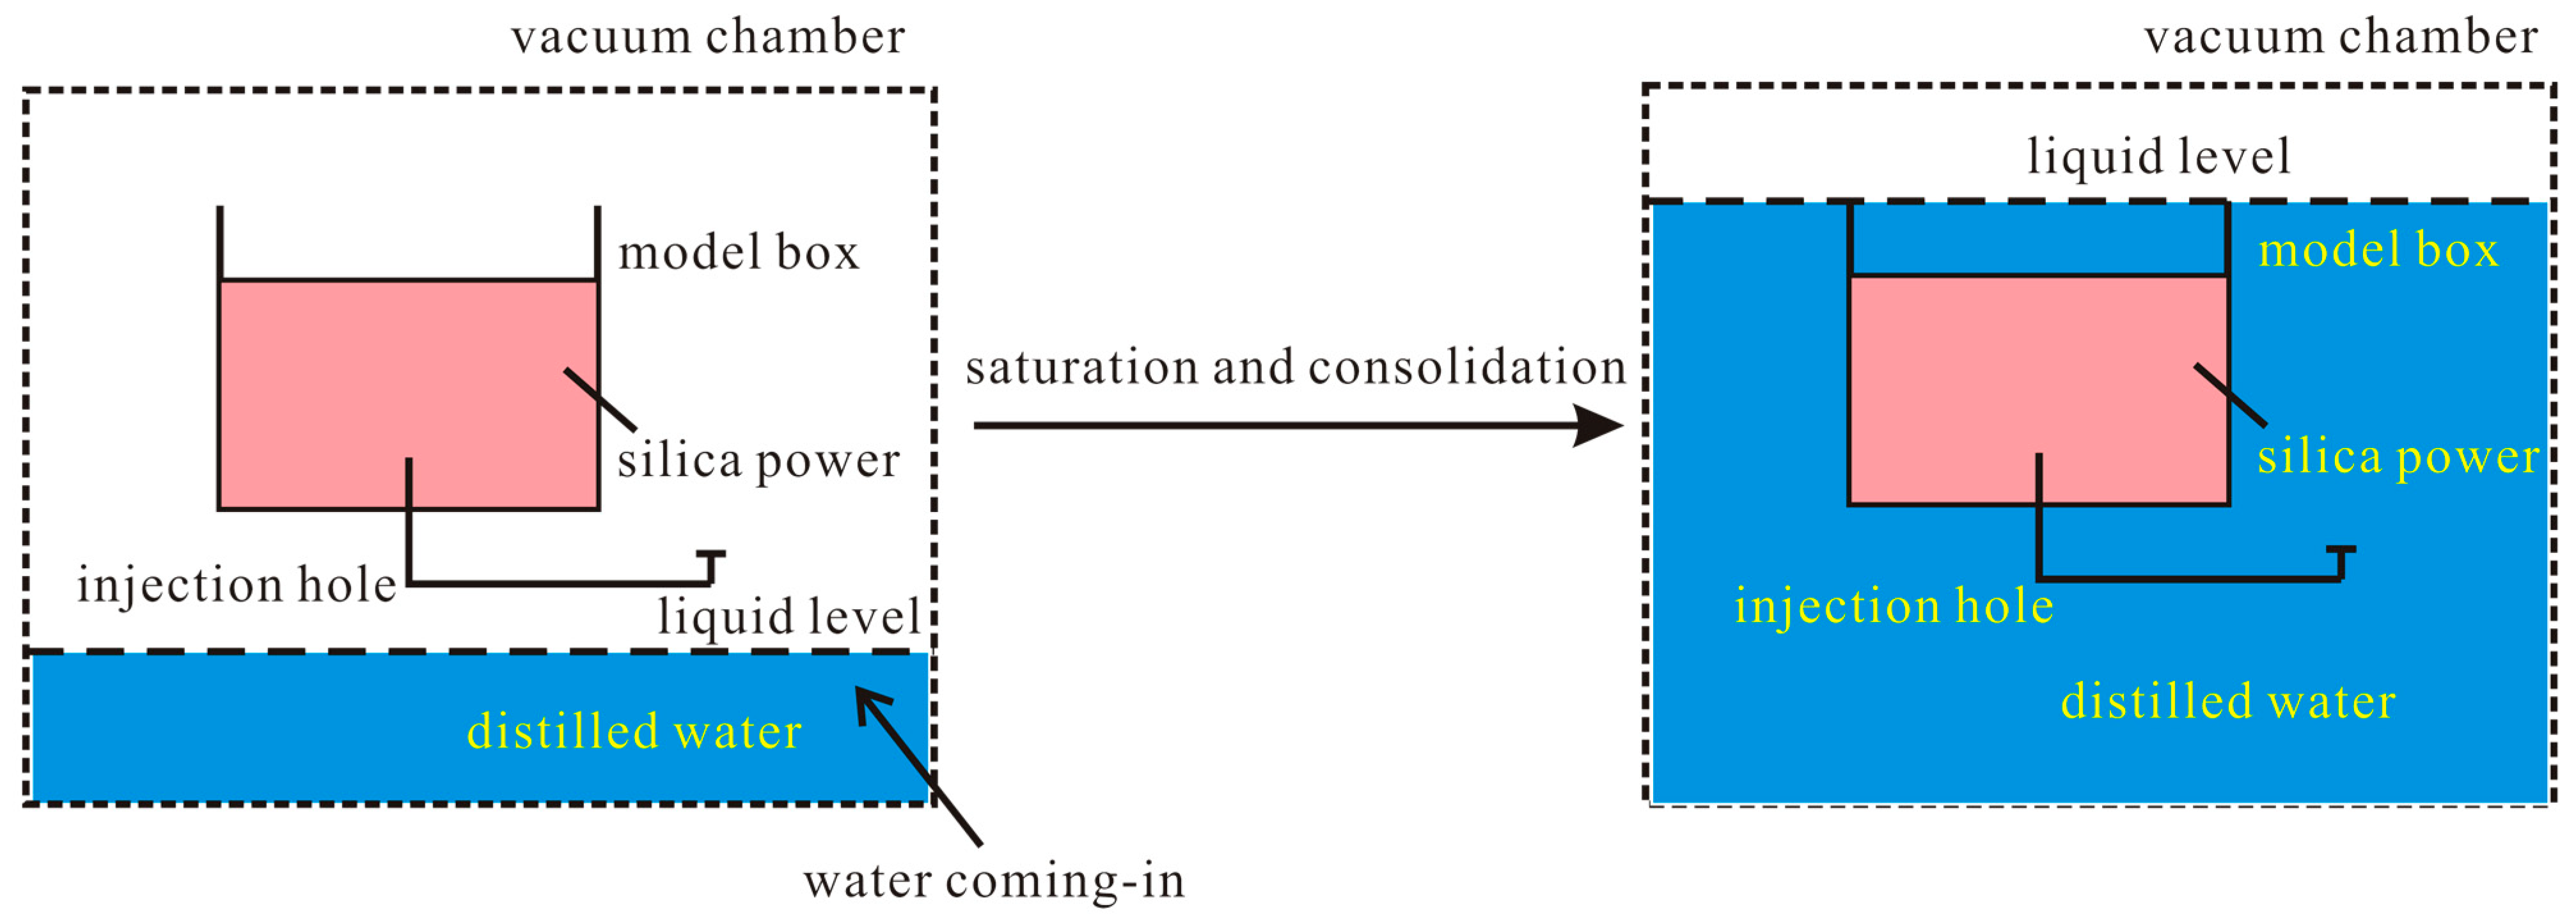
2.3.2. Saturation and Consolidation
2.3.3. Gas Injection Test
3. Results and Discussion
3.1. Test Phenomenon Analysis
- (1)
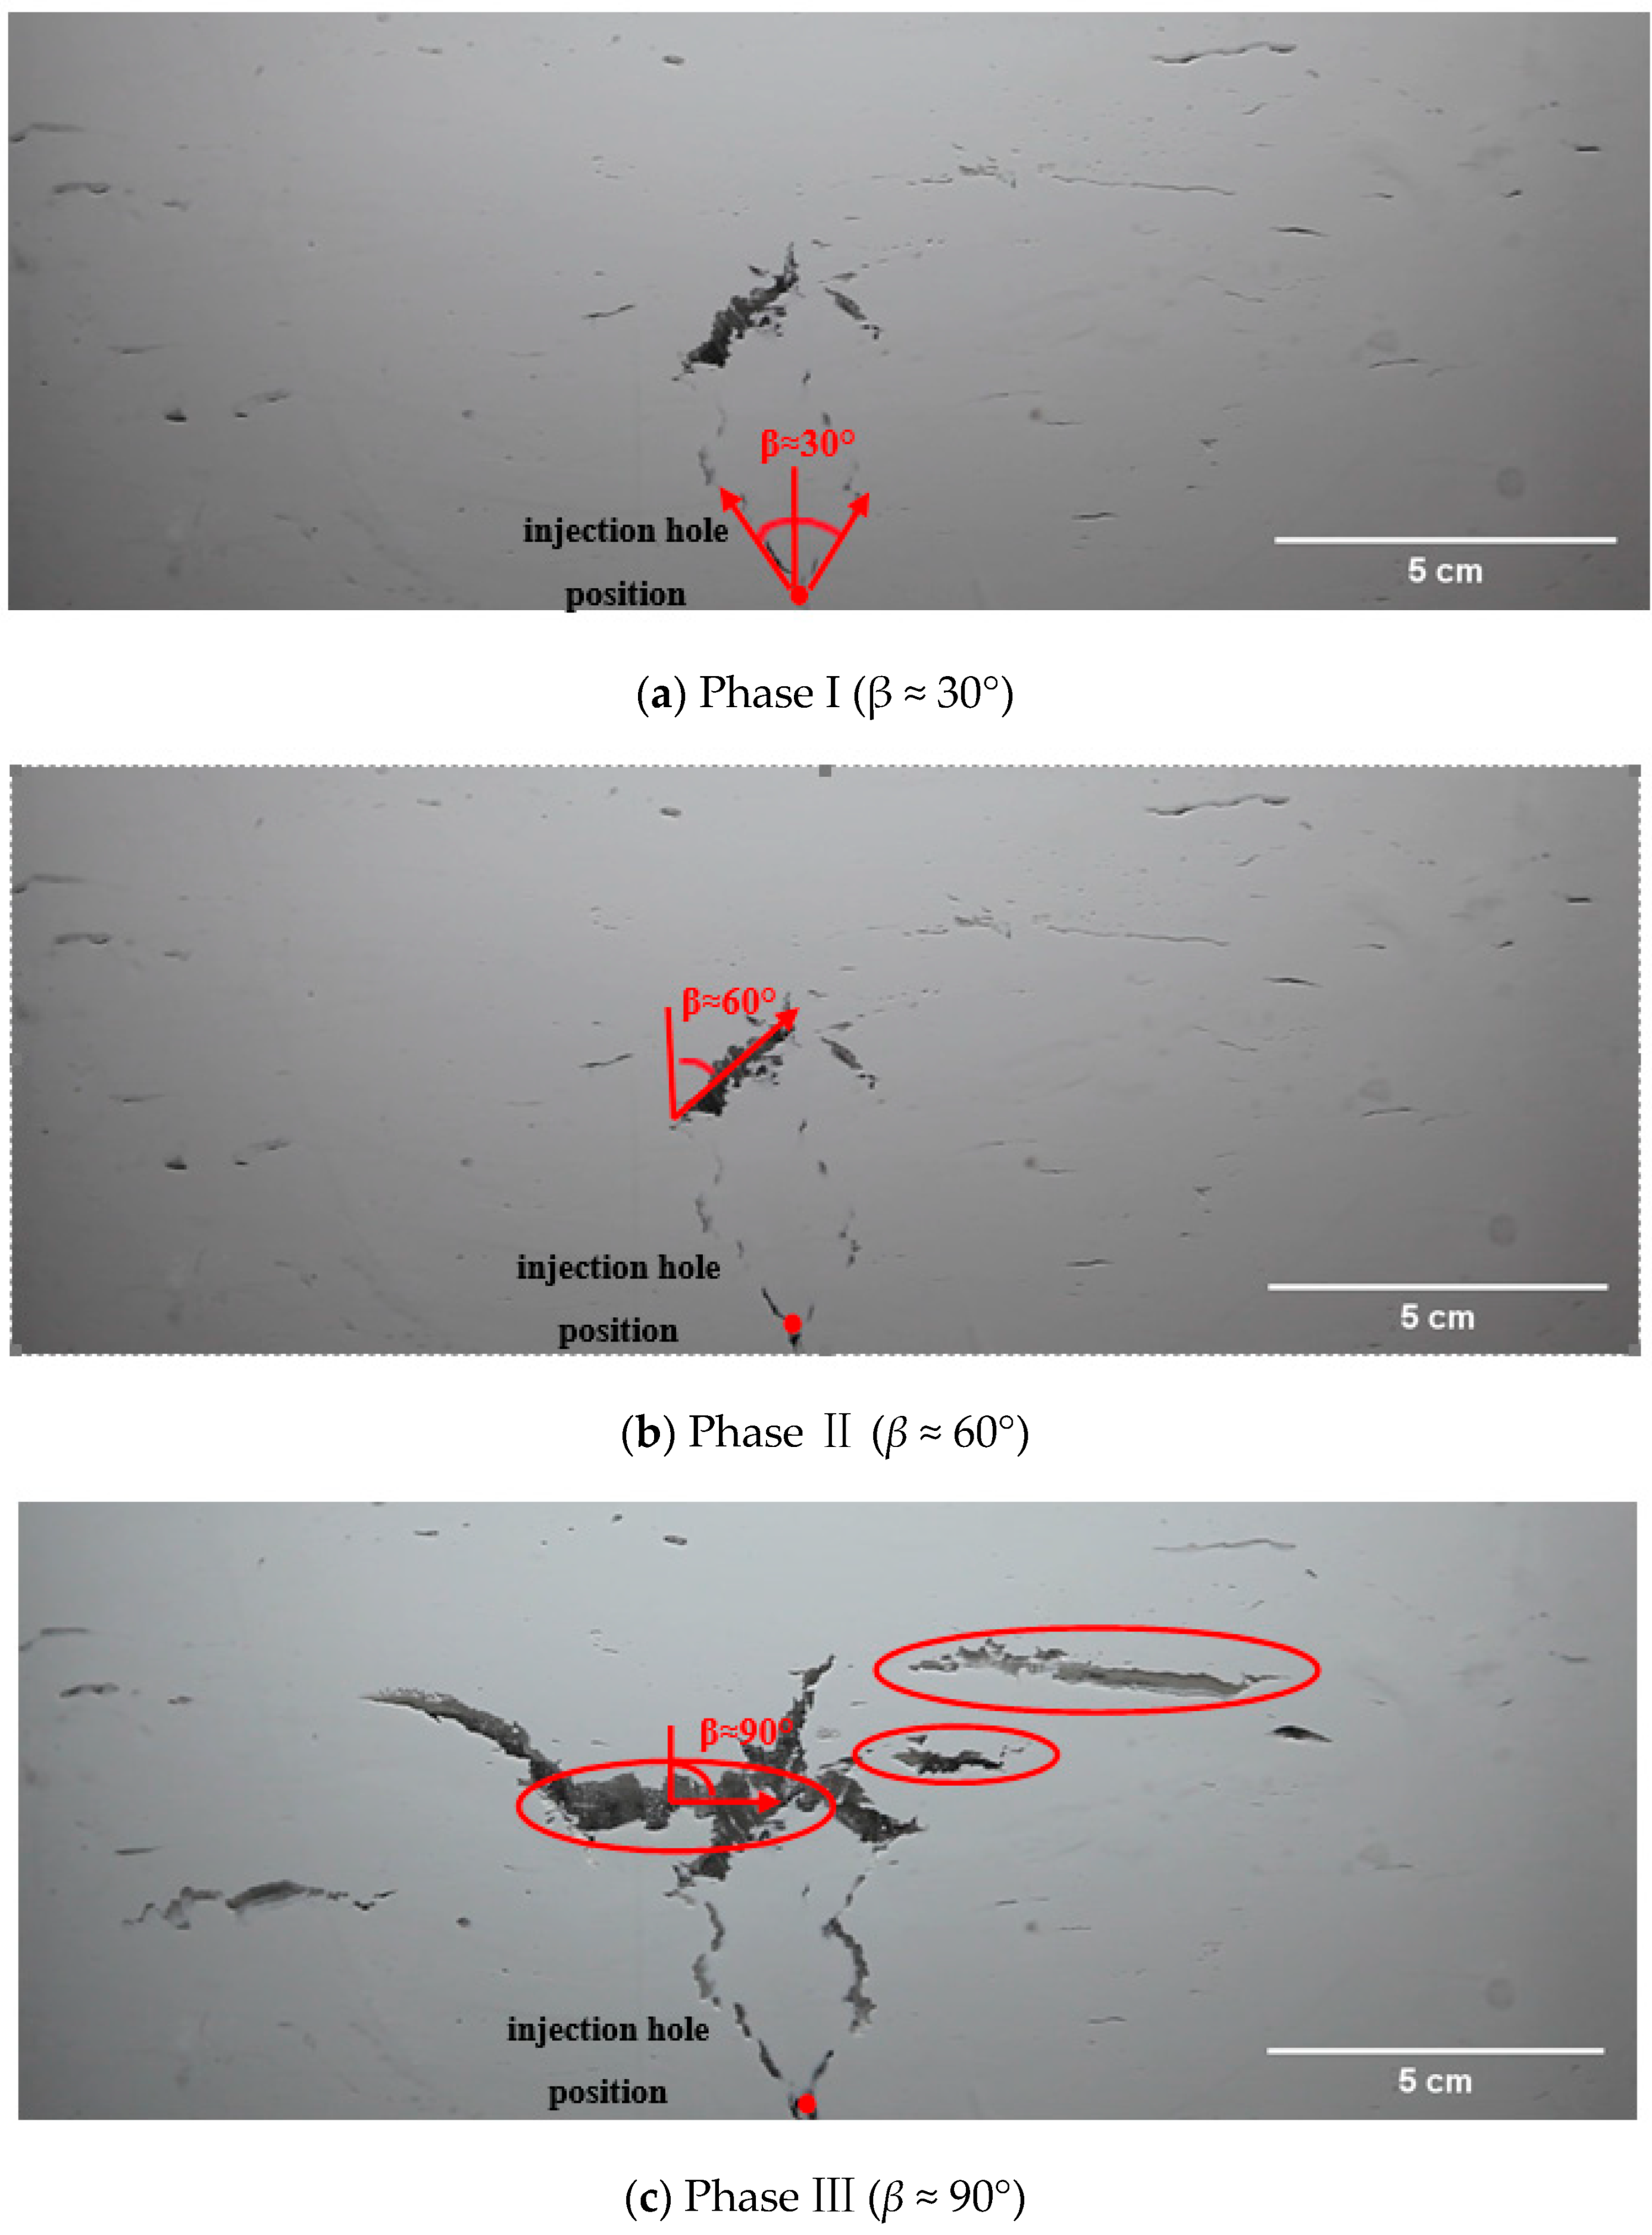
- Phase I
- (2)
- Phase II
- (3)
- Phase III
- (4)
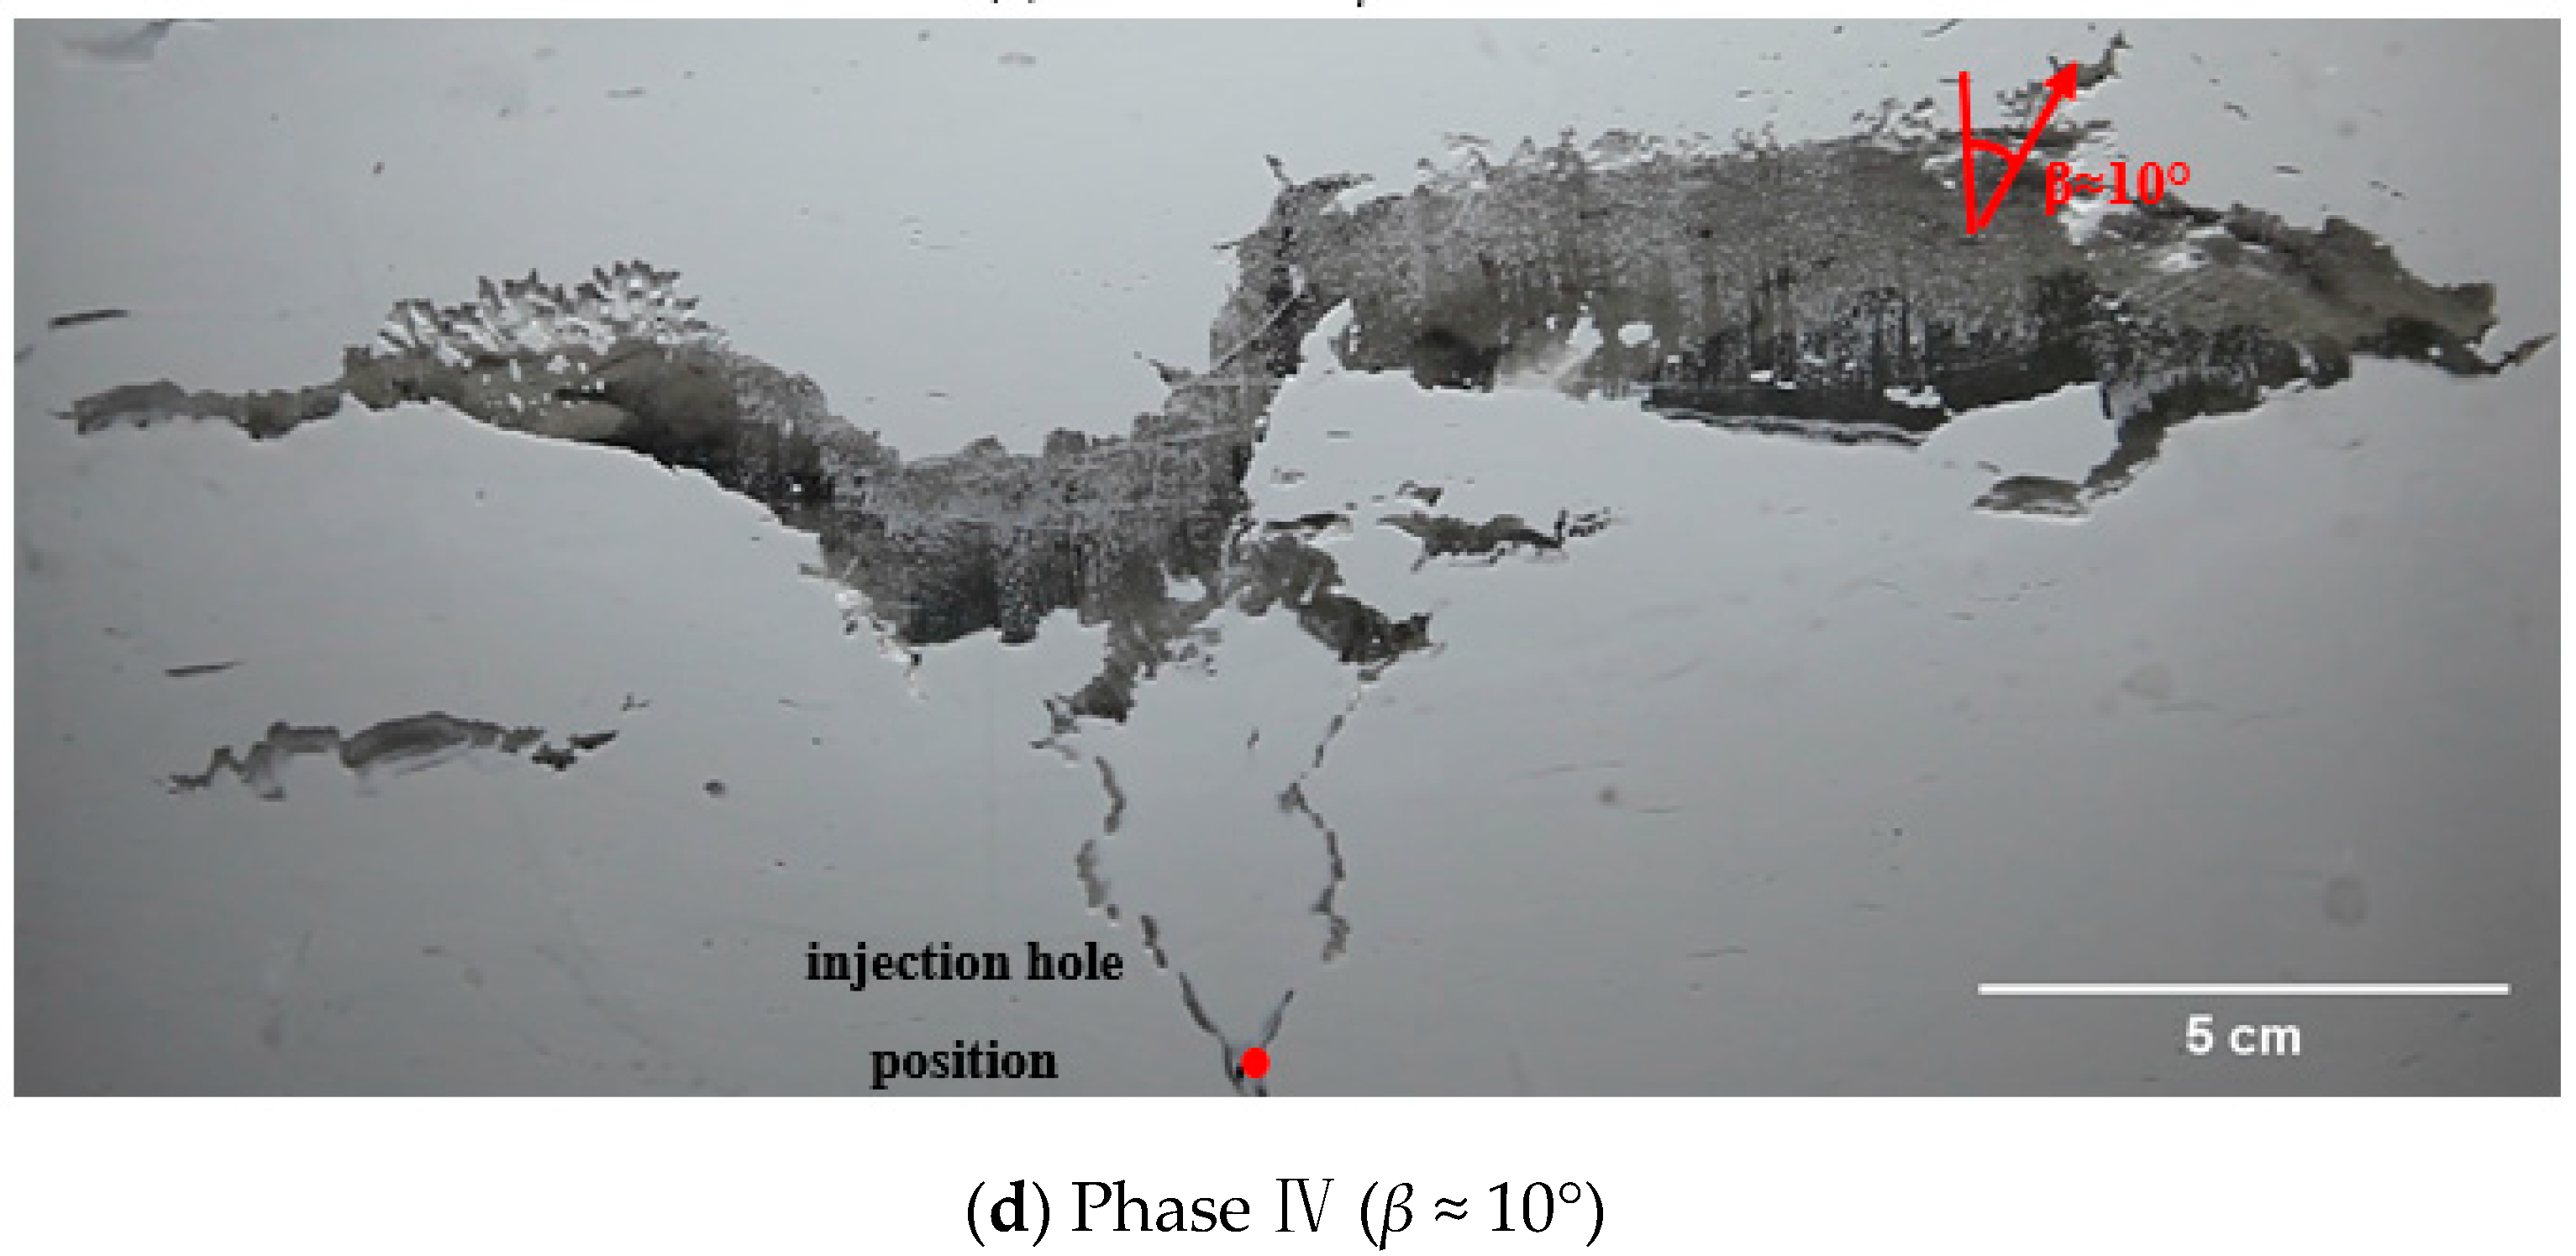
- Phase IV
3.2. The Criteria for Fracturing Invasion
3.3. Mechanism of Fracturing Invasion
- (1)
- Phase I
- (2)
- Phase II
- (3)
- Phase III
- (4)
- Phase IV
4. Conclusions
- (1)
- Gas mainly invaded into the fine-grained sediments in the form of fracturing invasion, and the behavior of gas fracturing invasion can be divided into four phases, in which the fracture direction β continuously transitions from vertical to horizontal. In phase I, the length of the crack far exceeds the width, with the fracturing direction close to the vertical direction; in phase II, both the length and width of the crack increase synchronically, and the fracturing direction develops horizontally; in phase III, the length and width of the crack further increase, with the fracturing direction close to the horizontal direction; in phase IV, the crack develops to a certain extent along the horizontal direction, and gas further fractures along the top of crack.
- (2)
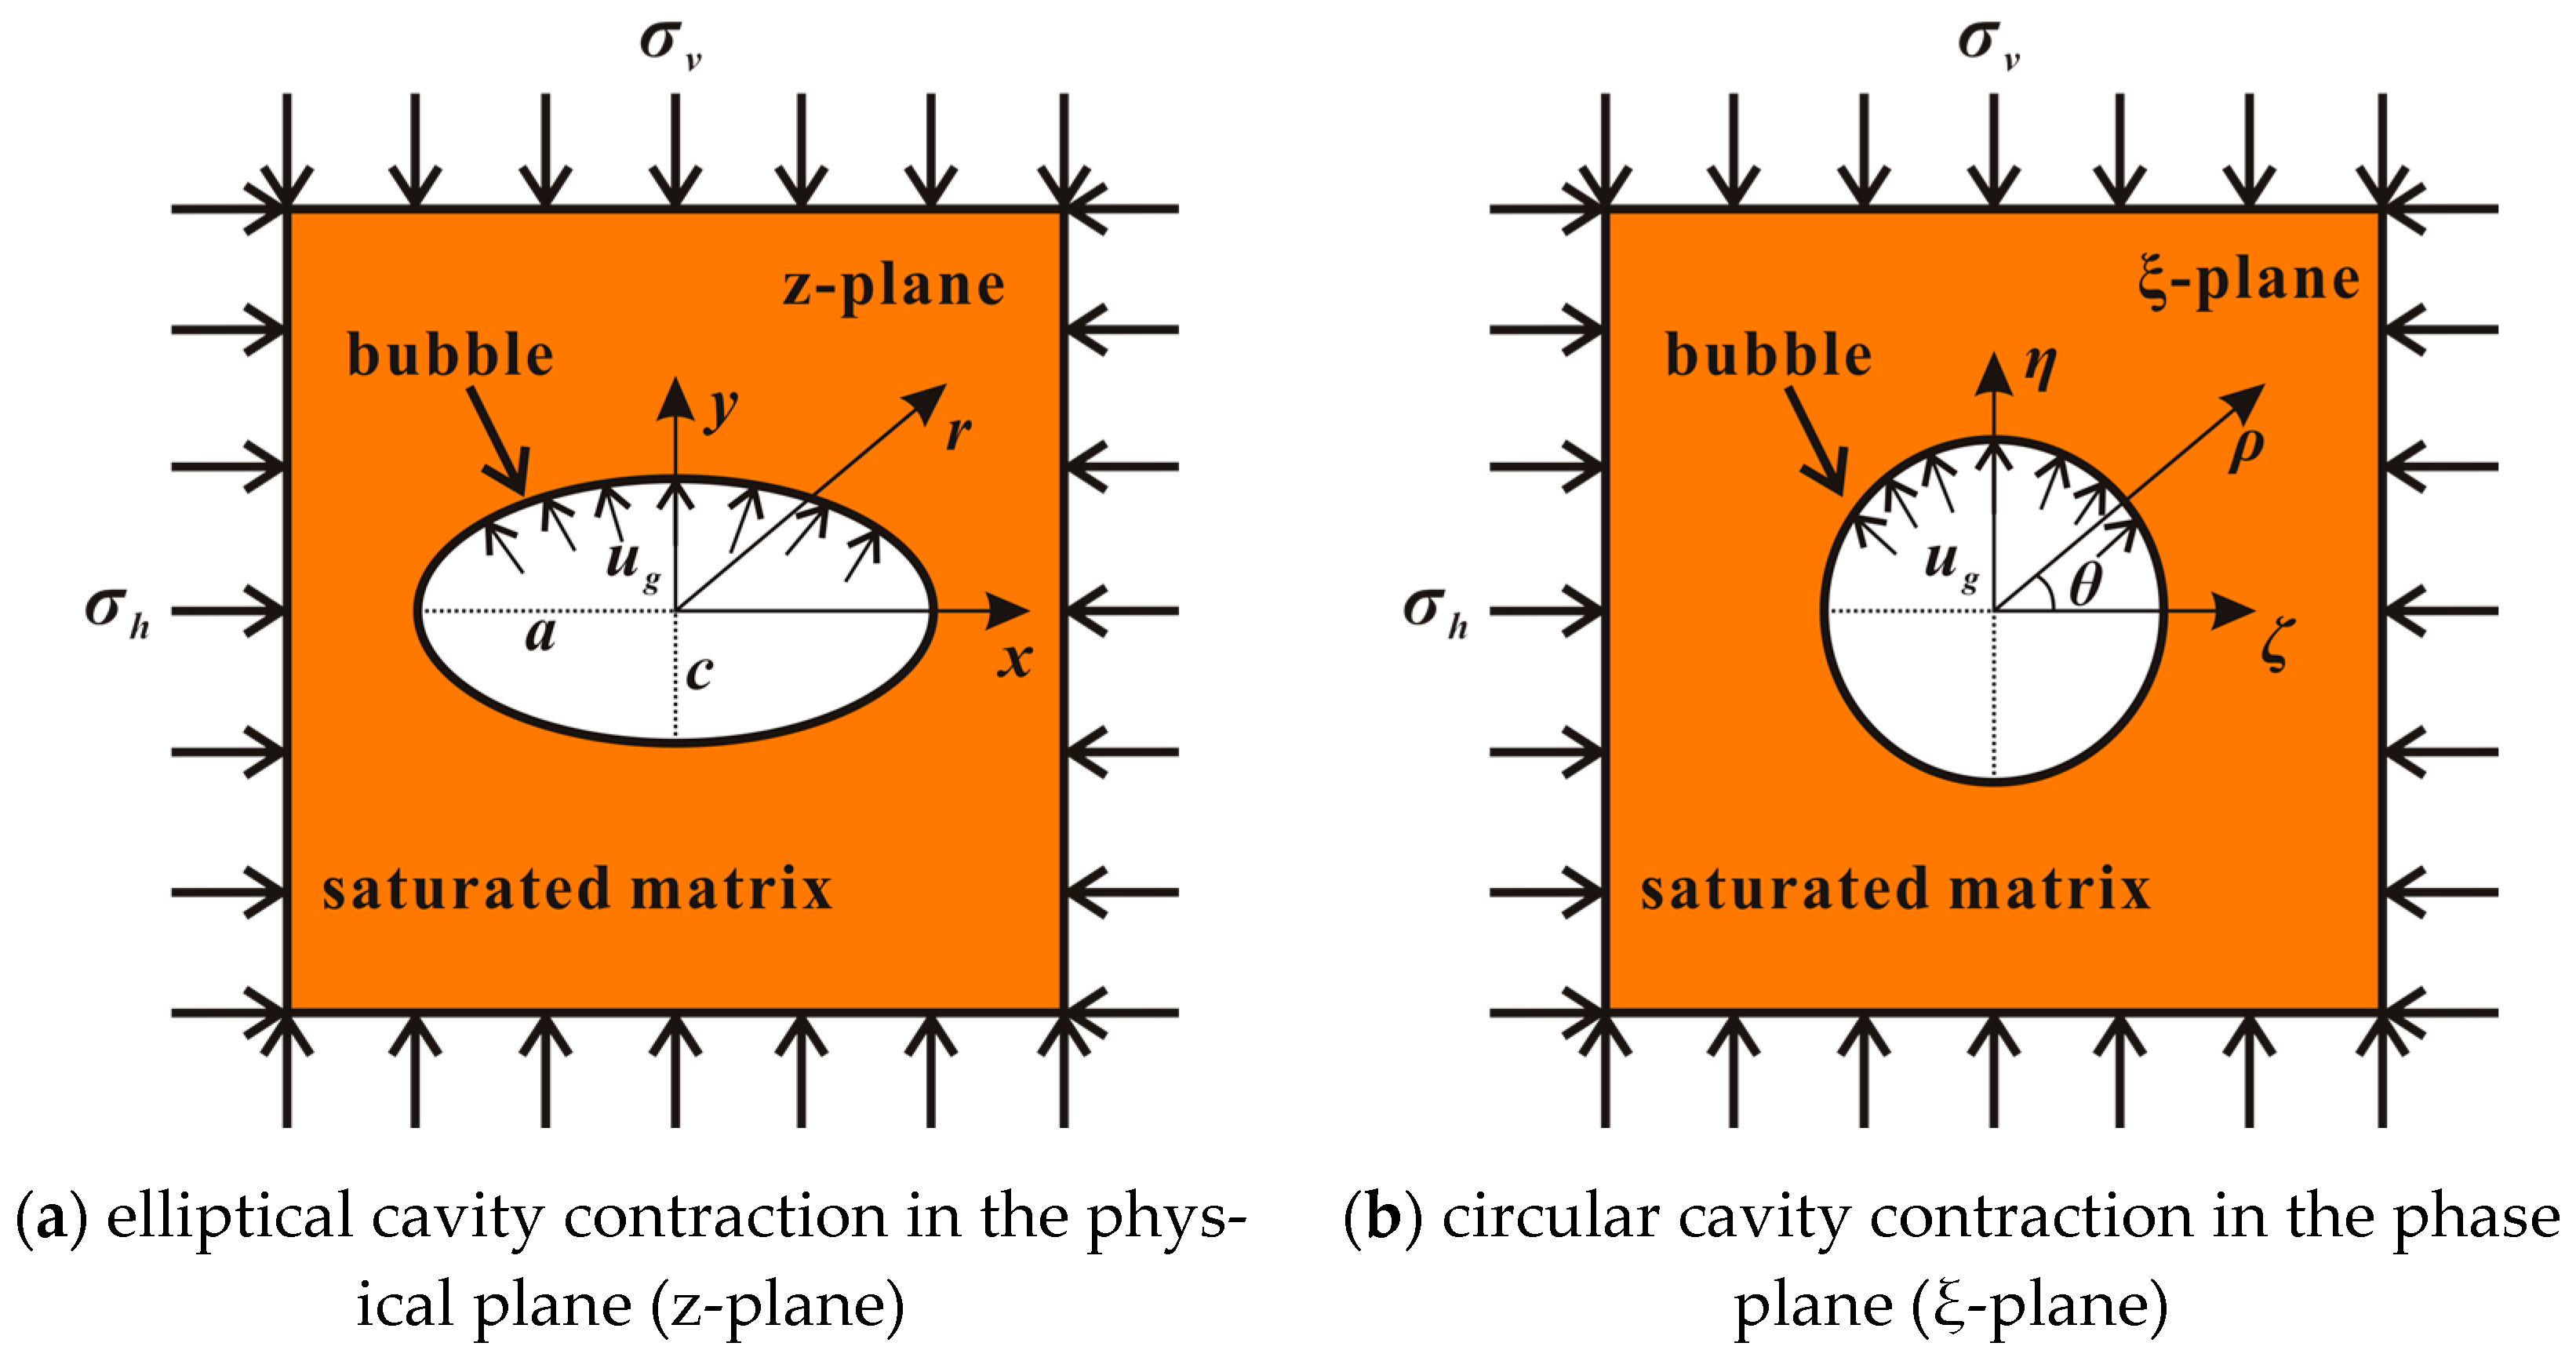
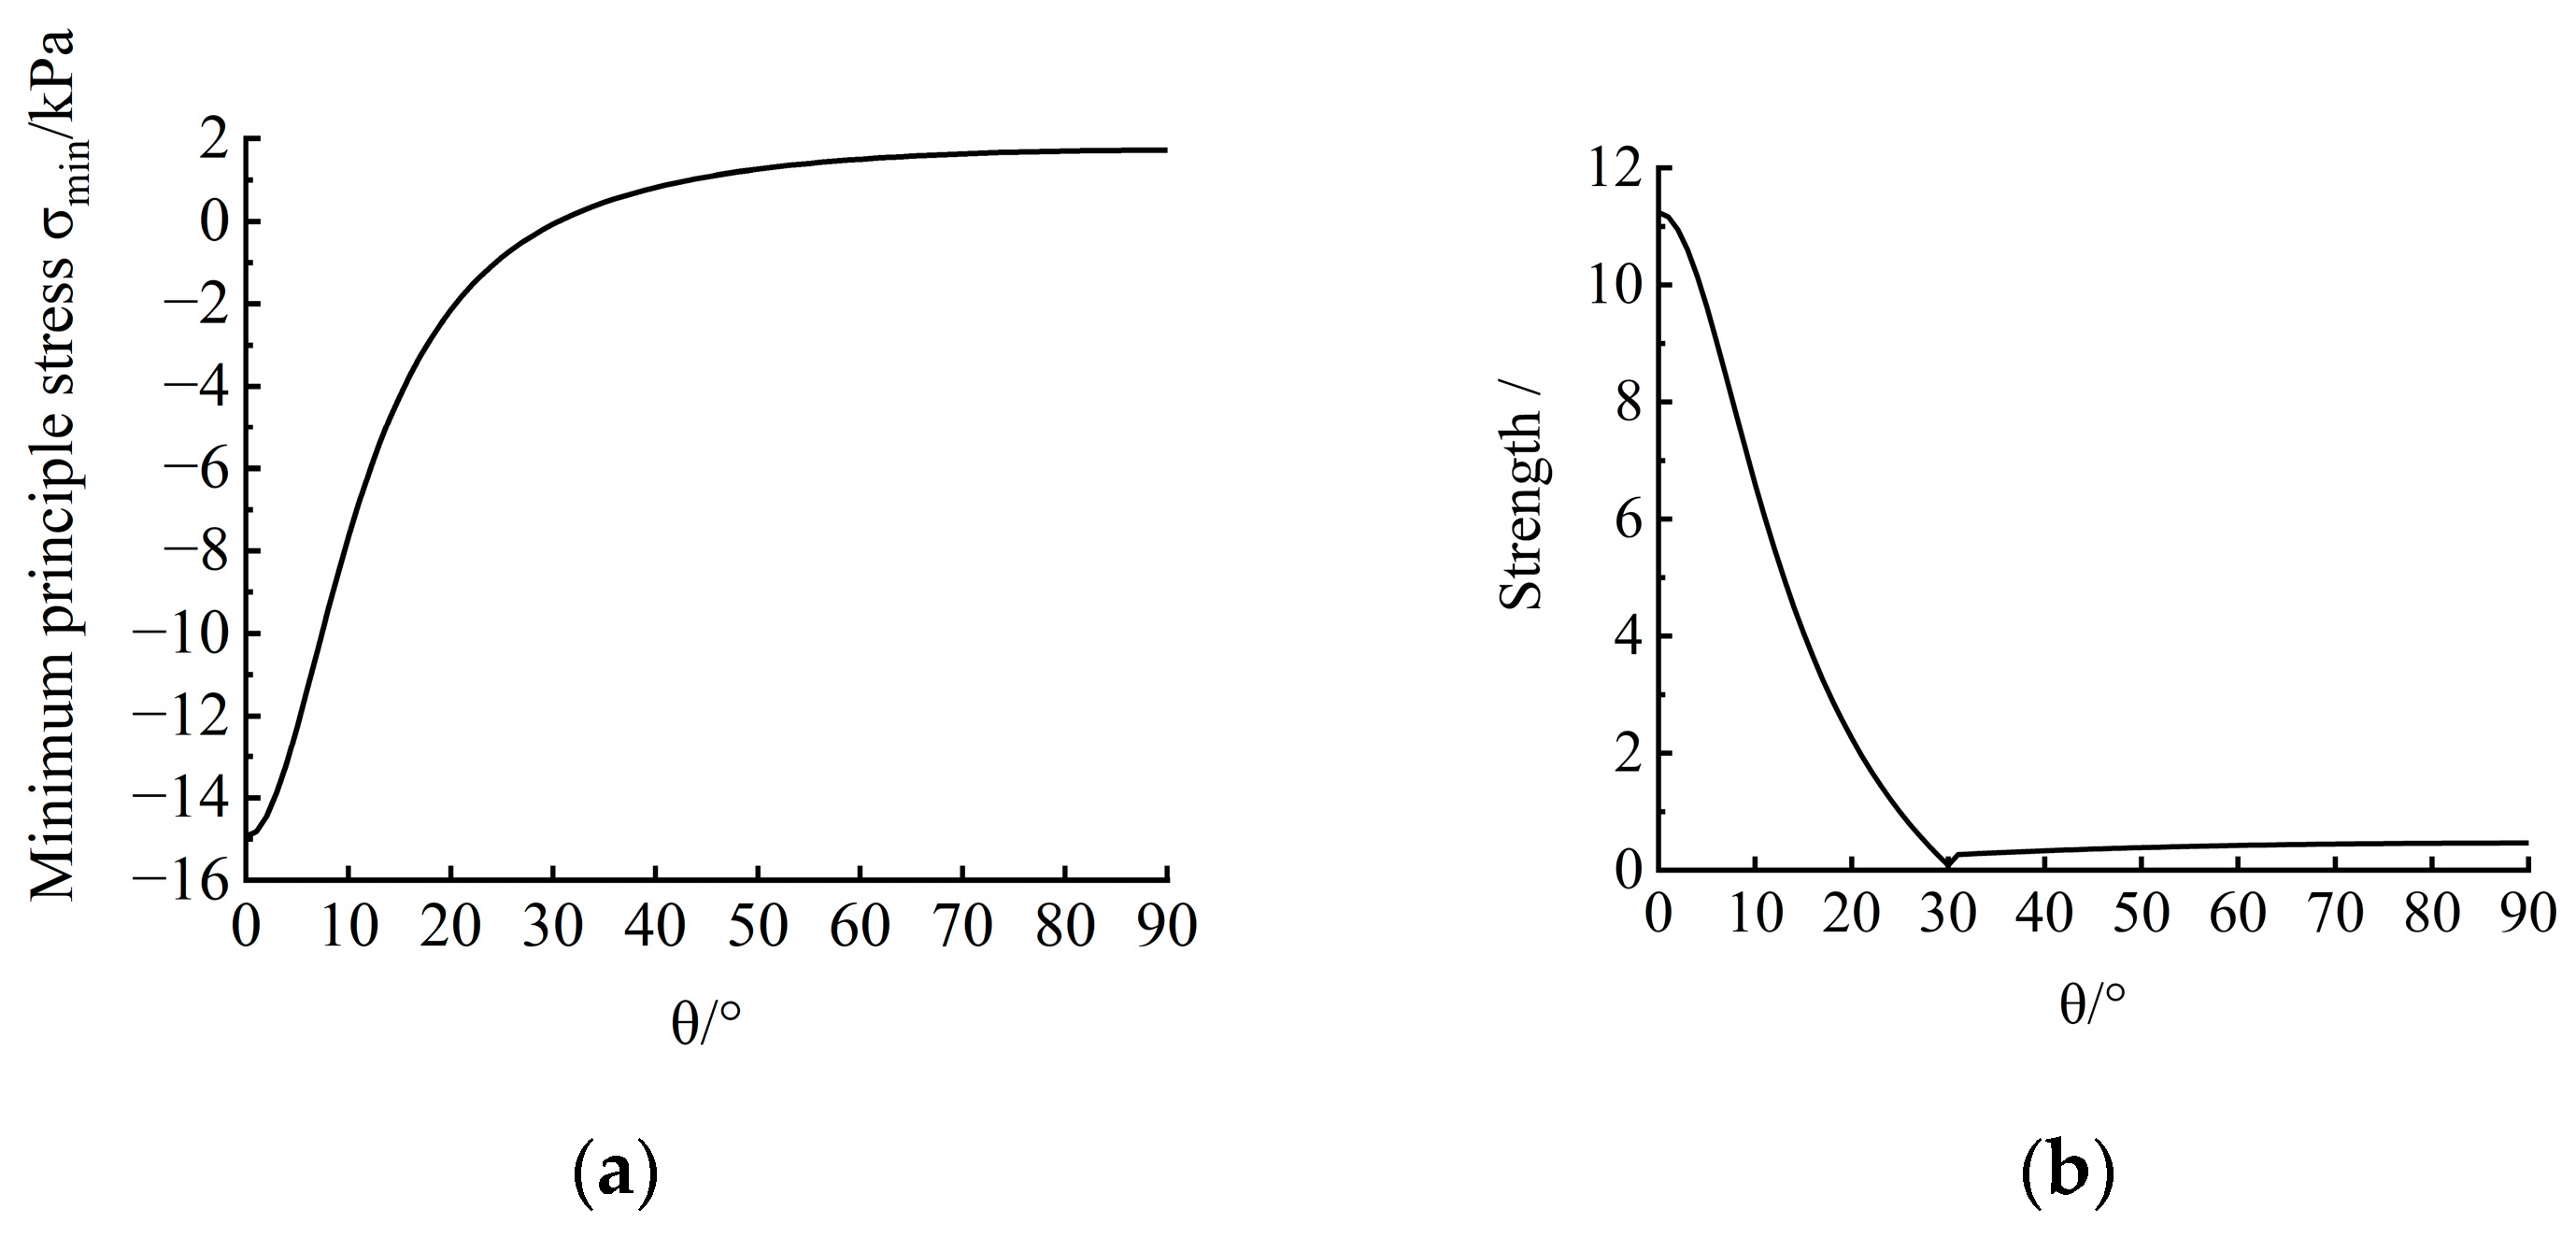
- The behavior of gas fracturing invasion in fine-grained sediments is controlled by both tensile and shear failure. Based on the 2D undrained elliptic cavity model and the tensile strength of sediments, an identification criterion for gas fracturing invasion was proposed; by combining the area with a strength distribution value exceeding 1 and positive or negative values of σmin, the failure mode can be determined as shear failure or tensile failure.
- (3)
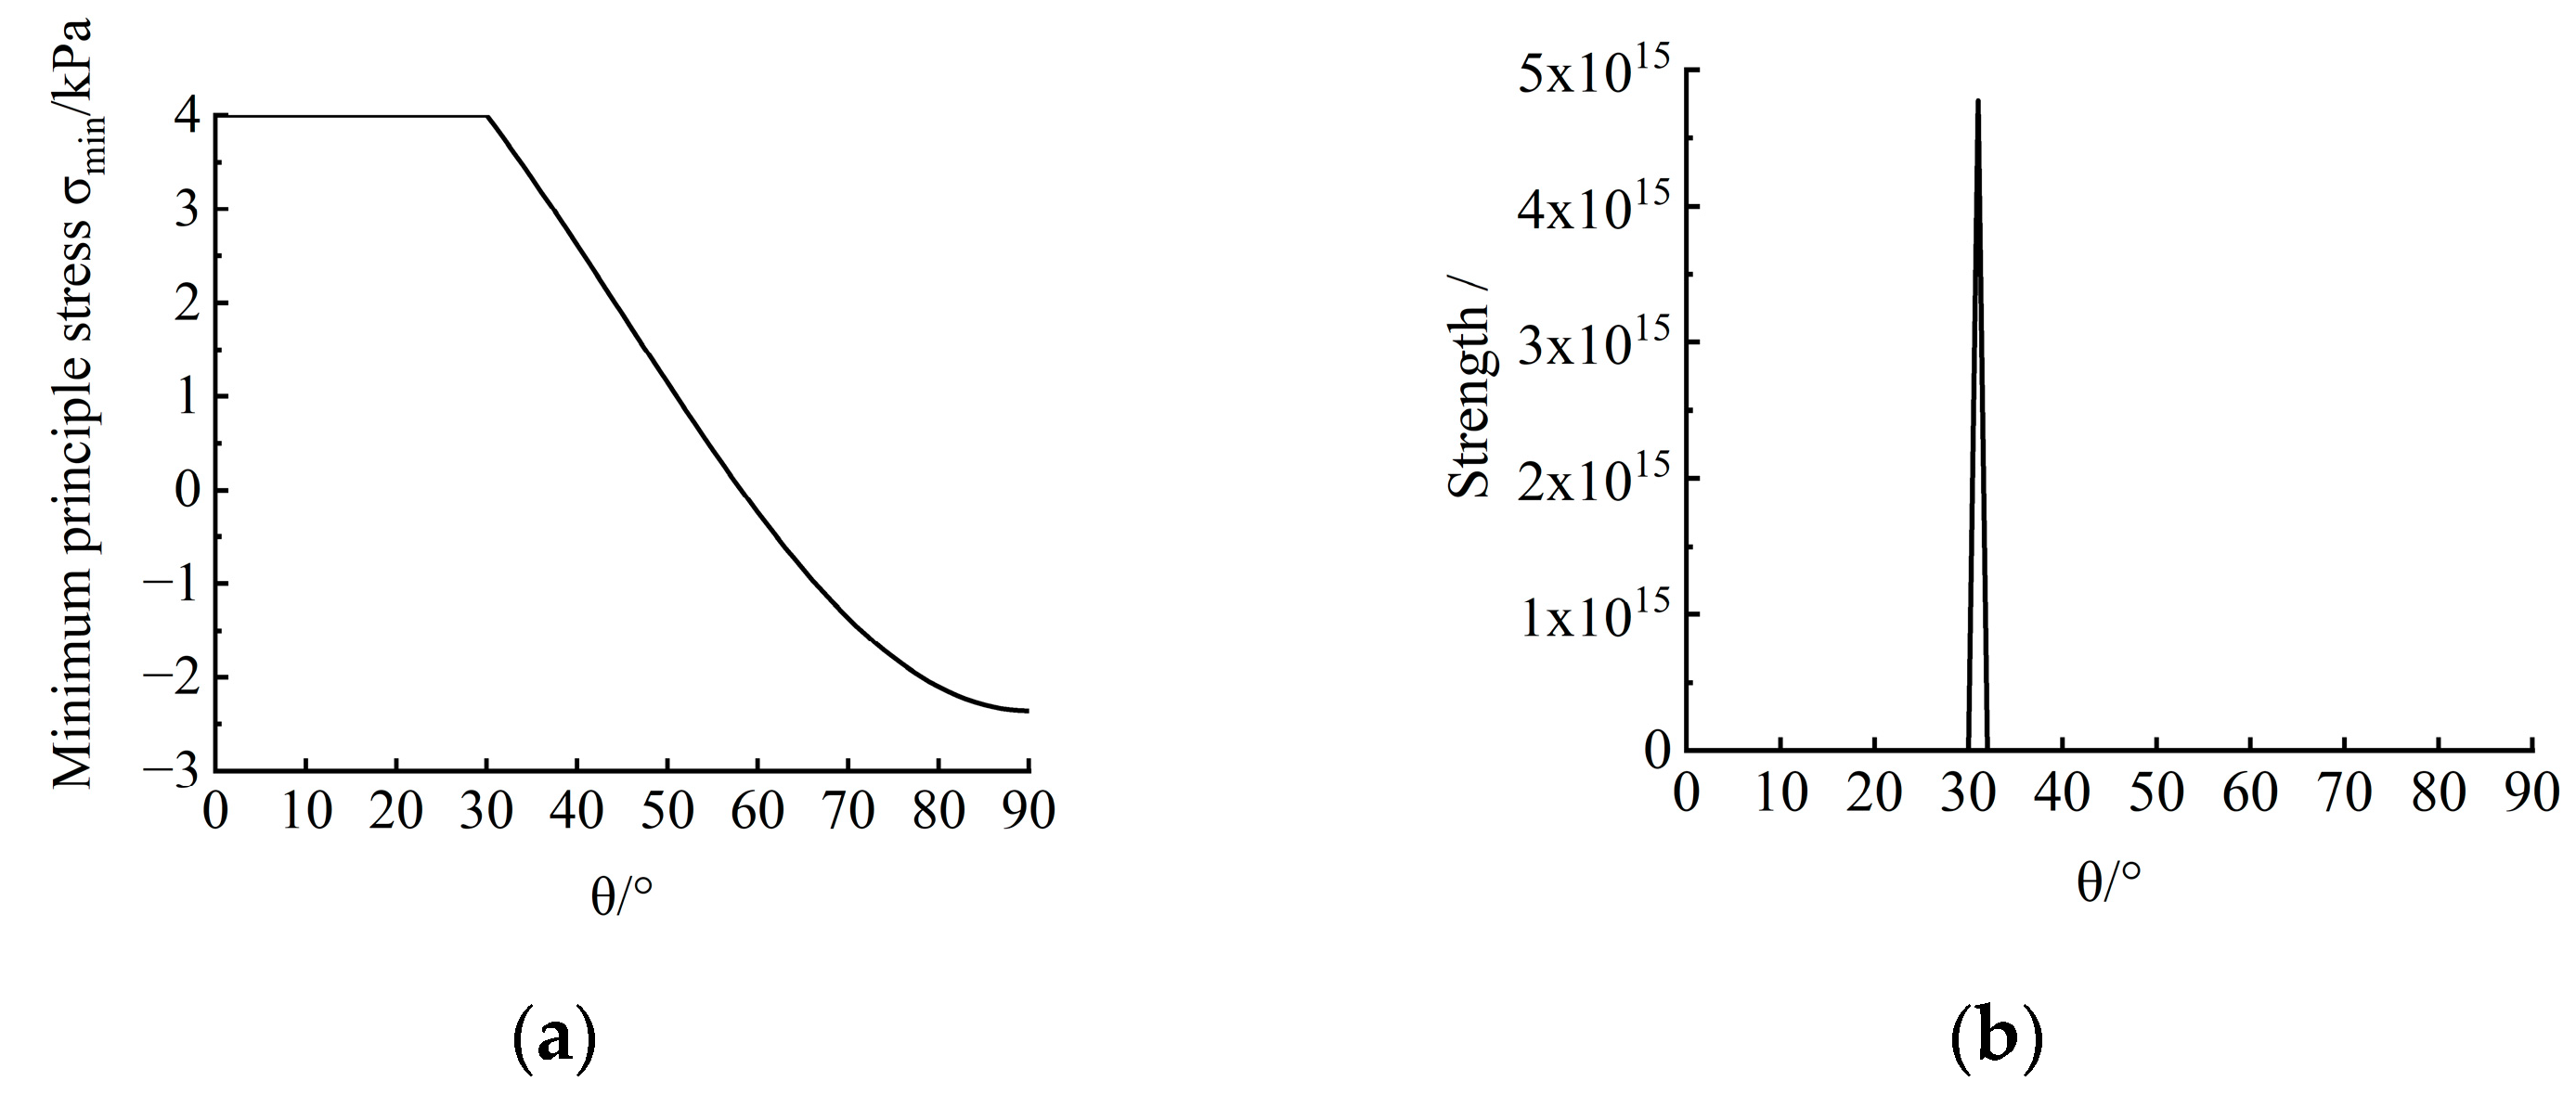
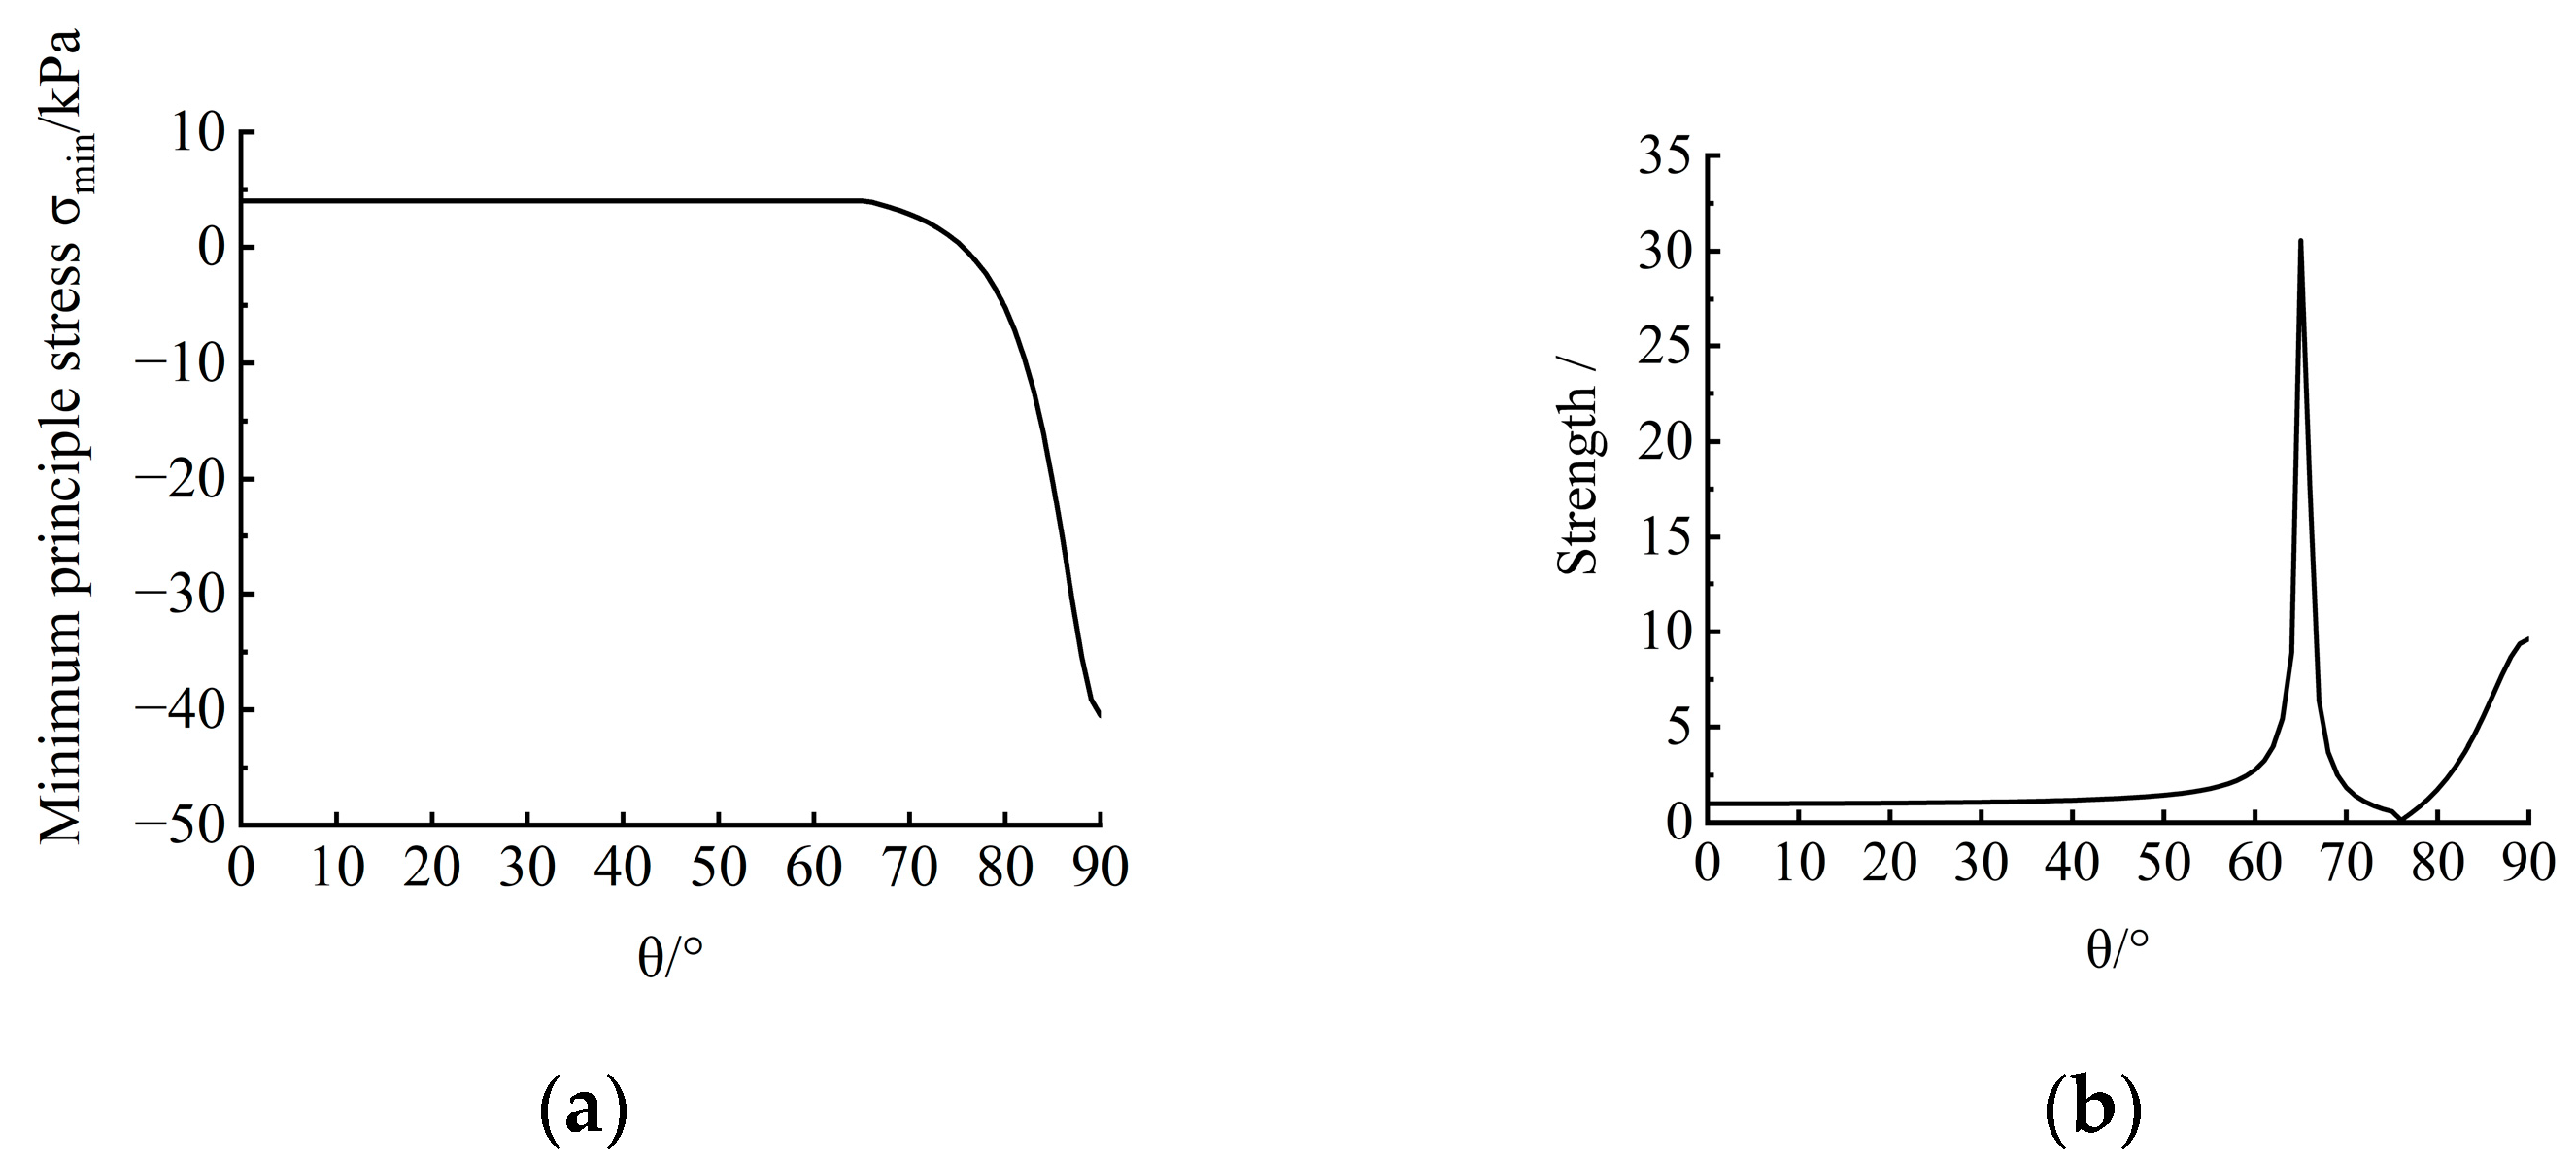
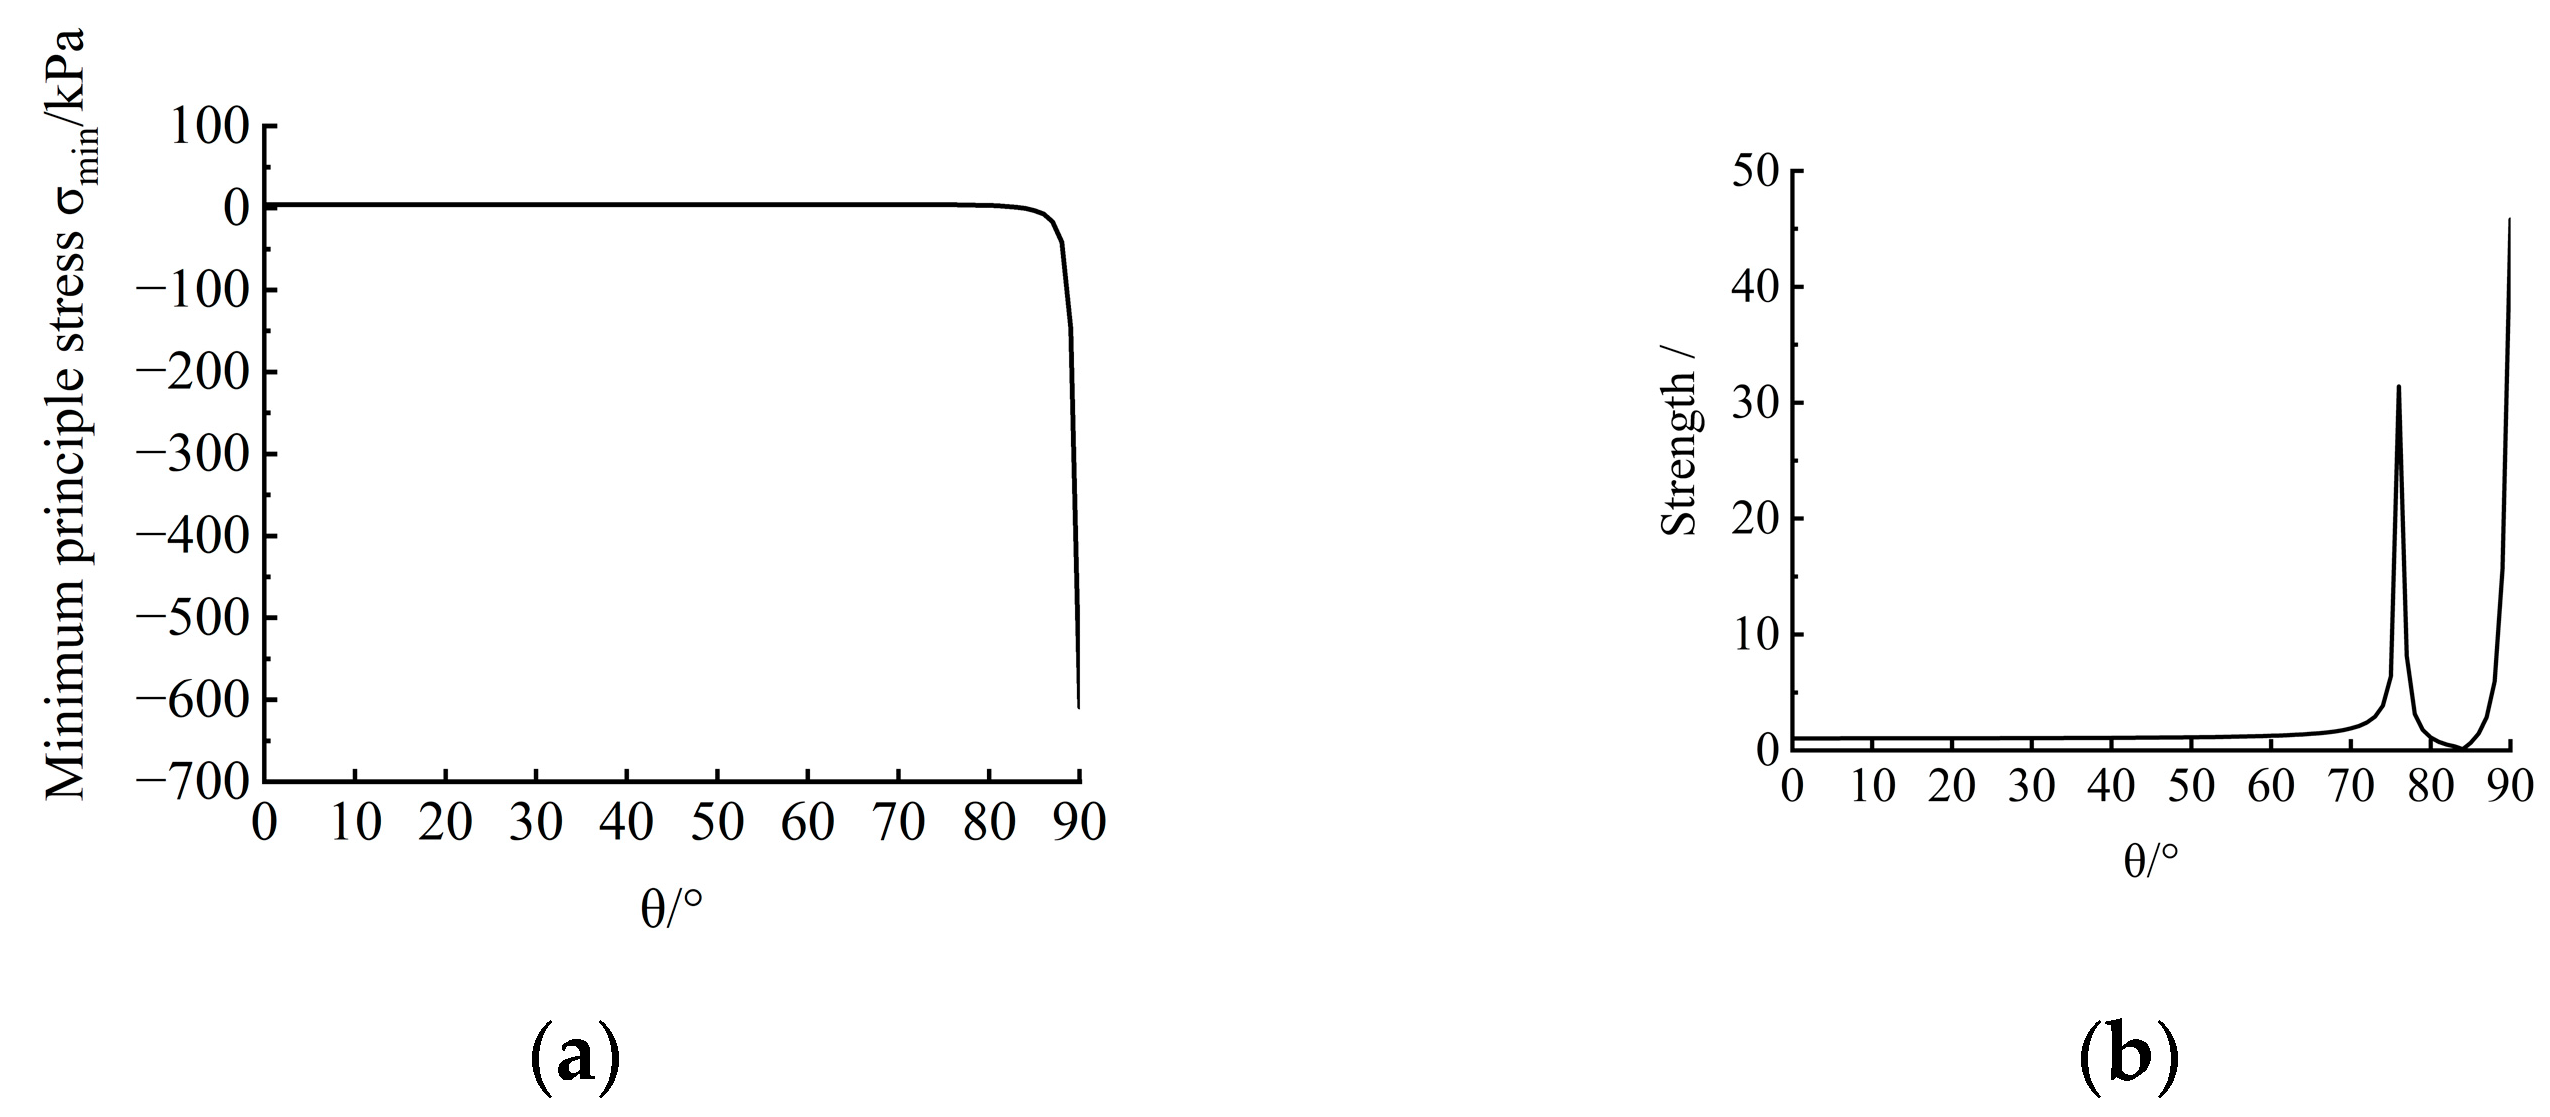
- Based on the identification criteria, the micro-mechanical mechanisms of fine-grained sediments subjected to gas invasion across four phases were revealed. In phase I, the shear failure occurred at θ ≈ 30°; in phase II, the shear failure occurred near θ ≈ 65°; in phase III, the tensile failure occurred near θ ≈ 90°; in phase IV, the tensile failure occurred around the roof of 0° < θ < 20°. This means that gas invasion gradually changes from shear failure to tensile failure. In addition, the fracturing angle θ predicted by the criteria was consistent with the fracturing direction β, which verifies the feasibility of the identification criteria.
Author Contributions
Funding
Institutional Review Board Statement
Informed Consent Statement
Data Availability Statement
Conflicts of Interest
References
- Ma, G.; Zhan, L.; Lu, H.; Hou, G. Structures in shallow marine sediments associated with gas and fluid migration. J. Mar. Sci. Eng. 2021, 9, 396. [Google Scholar] [CrossRef]
- Kopp, H.; Chiocci, F.L.; Berndt, C.; Çağatay, M.N.; Ferreira, T.; Fortes, C.J.E.M.; González Vega, A.; Kopf, A.; Sørensen, M.B.; Sultan, N.; et al. Marine Geohazards: Safeguarding Society and the Blue Economy from a Hidden Threat; Position Paper 26 of the European Marine Board; European Marine Board IVZW: Ostend, Belgium, 2021. [Google Scholar]
- Hovland, M.; Gardner, J.V.; Judd, A.G. The significance of pockmarks to understanding fluid flow processes and geohazards. Geofluids 2002, 2, 127–136. [Google Scholar] [CrossRef] [Green Version]
- Aiello, G.; Caccavale, M. New Seismoacoustic Data on Shallow Gas in Holocene Marine Shelf Sediments, Offshore from the Cilento Promontory (Southern Tyrrhenian Sea, Italy). J. Mar. Sci. Eng. 2022, 10, 1992. [Google Scholar] [CrossRef]
- Hovland, M. The Geomorphology and nature of seabed seepage processes. In Bathymetry and Its Applications; Blondel, P., Ed.; IntechOpen: Rjeka, Croatia, 2012; Chapter 4; pp. 79–104. [Google Scholar]
- Goswami, B.K.; Weitemeyer, K.A.; Bünz, S.; Minshull, T.A.; Westbrook, G.K.; Ker, S.; Sinha, M.C. Variations in pockmark composition at the Vestnesa Ridge: Insights from marine controlled source electromagnetic and seismic data. Geochem. Geophys. Geosystems 2017, 18, 1111–1125. [Google Scholar] [CrossRef]
- Turrini, L.; Jackson, C.A.L.; Thompson, P. Seal rock deformation by polygonal faulting, offshore Uruguay. Mar. Pet. Geol. 2017, 86, 892–907. [Google Scholar] [CrossRef]
- de Mahiques, M.M.; Schattner, U.; Lazar, M.; Sumida, P.Y.G.; de Souza, L.A.P. An extensive pockmark field on the upper Atlantic margin of Southeast Brazil: Spatial analysis and its relationship with salt diapirism. Heliyon 2017, 3, e00257. [Google Scholar] [CrossRef] [Green Version]
- Wang, Y.; Kong, L.; Wang, Y.; Wang, M.; Cai, K. Deformation analysis of shallow gas-bearing ground from controlled gas release in Hangzhou Bay of China. Int. J. Geomech. 2018, 18, 04017122. [Google Scholar] [CrossRef]
- Wang, Y.; Kong, L.; Wang, M.; Wang, Y.; Cheng, P. An improved specimen preparation method for marine shallow gas-bearing sand sediments and its validations. J. Rock Mech. Geotech. Eng. 2021, 13, 682–693. [Google Scholar] [CrossRef]
- Jain, A.K.; Juanes, R. Preferential mode of gas invasion in sediments: Grain-scale mechanistic model of coupled multiphase fluid flow and sediment mechanics. J. Geophys. Res. Solid Earth 2009, 114, B08101. [Google Scholar] [CrossRef]
- Fu, X.; Jimenez-Martinez, J.; Nguyen, T.P.; Carey, J.W.; Viswanathan, H.; Cueto-Felgueroso, L.; Juanes, R. Crustal fingering facilitates free-gas methane migration through the hydrate stability zone. Proc. Natl. Acad. Sci. USA 2020, 117, 31660–31664. [Google Scholar] [CrossRef]
- Zhang, Y.; Chen, Y.; Lv, H.; Hu, M.; Zhou, Y. Gas injection test of remolded saturated soil with consolidation. Mar. Georesources Geotechnol. 2021, 39, 1115–1124. [Google Scholar] [CrossRef]
- Shin, H.; Santamarina, J.C. Open-mode discontinuities in soils. Géotechnique Lett. 2011, 1, 95–99. [Google Scholar] [CrossRef]
- Sun, H.; Guo, X.J.; Wu, J.X. Progress in analysis and monitoring technology for gas migration in submarine sediments. Prog. Geophys. 2022, 37, 869–881. [Google Scholar]
- Ye, W.M.; Xu, L.; Ye, B.; Chen, B.; Chen, Y.G.; Cui, Y.J. Experimental investigation on gas migration in saturated Shanghai soft clay. Eng. Geol. 2017, 222, 20–28. [Google Scholar] [CrossRef]
- Choi, J.H.; Seol, Y.; Boswell, R.; Juanes, R. X-ray computed-tomography imaging of gas migration in water-saturated sediments: From capillary invasion to conduit opening. Geophys. Res. Lett. 2011, 38, L17310. [Google Scholar] [CrossRef]
- Wang, M.; Feng, Y.T.; Wang, Y.; Qu, T.M.; He, W. A hybrid discrete bubble-lattice Boltzmann–discrete element model for gas-charged sediments. Comput. Part. Mech. 2020, 7, 509–522. [Google Scholar] [CrossRef]
- Sun, Z.; Santamarina, J.C. Grain-displacive gas migration in fine-grained sediments. J. Geophys. Res. Solid Earth 2019, 124, 2274–2285. [Google Scholar] [CrossRef] [Green Version]
- Marchi, M.; Gottardi, G.; Soga, K. Fracturing pressure in clay. J. Geotech. Geoenvironmental Eng. 2014, 140, 04013008. [Google Scholar] [CrossRef]
- Bjerrum, L.; Nash, J.K.T.L.; Kennard, R.M.; Gibson, R.E. Hydraulic fracturing in field permeability testing. Géotechnique 1972, 22, 319–332. [Google Scholar] [CrossRef]
- Decker, R.A.; Clemence, S.P. Laboratory study of hydraulic fracturing in clay. In Proceedings of the 10th ICSMFE, Stockholm, Sweden, 15–19 June 1981; Volume 1, pp. 573–575. [Google Scholar]
- Jaworski, G.W.; Duncan, J.M.; Seed, H.B. Laboratory study of hydraulic fracturing. J. Geotech. Eng. Div. 1981, 107, 713–732. [Google Scholar] [CrossRef]
- Fukushima, S. Hydraulic fracturing criterion in the core of fill dams. Rep. Fujita Kogyo Tech. Inst. 1986, 22, 131–136. [Google Scholar]
- Lo, K.Y.; Kaniaru, K. Hydraulic fracture in earth and rock-fill dams. Can. Geotech. J. 1990, 27, 496–506. [Google Scholar] [CrossRef]
- Andersen, K.H.; Rawlings, C.G.; Lunne, T.A.; By, T.H. Estimation of hydraulic fracture pressure in clay. Can. Geotech. J. 1994, 31, 817–828. [Google Scholar] [CrossRef]
- Medeiros, C.H.A.C.; Moffat, A.I.B. A hydraulic fracturing test based on radial seepage in the Rowe consolidation cell. In Advances In Site Investigation Practice; Thomas Telford Publishing: London, UK, 1996; pp. 828–839. [Google Scholar]
- Mori, A.; Tamura, M. Hydrofracturing pressure of cohesive soils. Soils Found. 1987, 27, 14–22. [Google Scholar] [CrossRef] [Green Version]
- Panah, A.K.; Yanagisawa, E. Laboratory studies on hydraulic fracturing criteria in soil. Soils Found. 1989, 29, 14–22. [Google Scholar] [CrossRef] [Green Version]
- Yanagisawa, E.; Panah, A.K. Two dimensional study of hydraulic fracturing criteria in cohesive soils. Soils Found. 1994, 34, 1–9. [Google Scholar] [CrossRef] [Green Version]
- Atkinson, J.H.; Charles, J.A.; Mhach, H.K. Undrained hydraulic fracture in cavity expansion tests. In Proceedings of the 13th International Conference on Soil Mechanics and Foundation Engineering, New Delhi, India, 5–10 January 1994; pp. 1009–1012. [Google Scholar]
- Zervos, A.; Papanastasiou, P.; Vardoulakis, I. Shear localisation in thick-walled cylinders under internal pressure based on gradient elastoplasticity. J. Theor. Appl. Mech. 2008, 38, 81–100. [Google Scholar]
- Mitchell, J.K.; Soga, K. Fundamentals of Soil Behavior; John Wiley & Sons Publisher: New York, NY, USA, 2005; Volume 3. [Google Scholar]
- Soga, K.; Ng, M.; Gafar, K. Soil fractures in grouting. In Proceedings of the 11th International Conference on Computer Methods and Advances in Geomechanics, Torino, Italy, 19–24 June 2005; pp. 397–406. [Google Scholar]
- Vesic, A.S. Expansion of cavities in infinite soil mass. J. Soil Mech. Found. Div. 1972, 98, 265–290. [Google Scholar] [CrossRef]
- Daigle, H.; Cook, A.; Fang, Y.; Bihani, A.; Song, W.; Flemings, P.B. Gas-driven tensile fracturing in shallow marine sediments. J. Geophys. Res. Solid Earth 2020, 125, e2020JB020835. [Google Scholar]
- Hoek, E.; Brown, E.T. Practical estimates of rock mass strength. Int. J. Rock Mech. Min. Sci. 1997, 34, 1165–1186. [Google Scholar] [CrossRef]
- Rocco, S.; Woods, A.W.; Harrington, J.; Norris, S. An experimental model of episodic gas release through fracture of fluid confined within a pressurized elastic reservoir. Geophys. Res. Lett. 2017, 44, 751–759. [Google Scholar] [CrossRef] [Green Version]
- Stevens, J. Unified soil classification system. Civ. Eng.—ASCE 1982, 52, 61–62. [Google Scholar]
- Yang, J.J.; Liu, F.; Toyosawa, Y.; Horiyi, N.; Itoh, K. Particle size effects on bearing capacity of sandy ground in centrifugal tests. Chin. J. Geotech. Eng. 2007, 29, 477–483. [Google Scholar]
- Craig, W.H. Simulation of foundations for offshore structures using centrifuge modelling. In Developments in Soil Mechanics and Foundation Engineering: Model Studies; Applied Science Publisher: London, UK, 1983. [Google Scholar]
- Xu, G.M.; Zhang, W.M. Study on the grain-size effects and boundary effects in centrifugal test. Chin. J. Geotech. Eng. 1996, 18, 80–85. [Google Scholar]
- Kusakabe, O. Application of centrifuge modeling to foundation engineering. Foun Constr. 1993, 11, 1–10. [Google Scholar]
- Hong, Y.; Zhang, J.F.; Wang, L.Z.; Liu, T. On evolving size and shape of gas bubble in marine clay under multi-stage loadings: Microcomputed tomography (μCT) characterization and cavity contraction analysis. Can. Geotech. J. 2020, 57, 1072–1091. [Google Scholar] [CrossRef]
- Muskhelishvili, N.I. Some Basic Problems of the Mathematical Theory of Elasticity; Noordhoff Publisher: Groningen, The Netherlands, 1953; Volume 15. [Google Scholar]
- Johnson, B.D.; Boudreau, B.P.; Gardiner, B.S.; Maass, R. Mechanical response of sediments to bubble growth. Mar. Geol. 2002, 187, 347–363. [Google Scholar] [CrossRef]
- Zhang, Y.; Chen, Y.; Hou, Y.; Jin, Z.; Zhou, Y. Fracture toughness measurements of soft sediments based on gas injection tests. Mar. Georesources Geotechnol. 2022, 40, 847–855. [Google Scholar] [CrossRef]
- Barry, M.A.; Johnson, B.D.; Boudreau, B.P.; Law, B.A.; Page, V.S.; Hill, P.S.; Wheatcroft, R.A. Sedimentary and geo-mechanical properties of Willapa Bay tidal flats. Cont. Shelf Res. 2013, 60, S198–S207. [Google Scholar] [CrossRef]


| SiO2/% | TiO2/% | Al2O3/% | CaO/% | Fe2O3/% |
|---|---|---|---|---|
| 99.5 | 0.01 | 0.39 | 0.01 | 0.09 |
| Liquid Limit (%) | Plastic Limit (%) | Plasticity Index |
|---|---|---|
| 35.5 | 24.7 | 10.8 |
Disclaimer/Publisher’s Note: The statements, opinions and data contained in all publications are solely those of the individual author(s) and contributor(s) and not of MDPI and/or the editor(s). MDPI and/or the editor(s) disclaim responsibility for any injury to people or property resulting from any ideas, methods, instructions or products referred to in the content. |
© 2023 by the authors. Licensee MDPI, Basel, Switzerland. This article is an open access article distributed under the terms and conditions of the Creative Commons Attribution (CC BY) license (https://creativecommons.org/licenses/by/4.0/).
Share and Cite
Wang, Y.; Wang, Y.; Wang, Y.; Chen, C.; Kong, L.; Xu, M. Study on the Micro-Mechanical Mechanism of Fine-Grained Marine Sediments Subjected to Shallow Gas Invasion. J. Mar. Sci. Eng. 2023, 11, 822. https://doi.org/10.3390/jmse11040822
Wang Y, Wang Y, Wang Y, Chen C, Kong L, Xu M. Study on the Micro-Mechanical Mechanism of Fine-Grained Marine Sediments Subjected to Shallow Gas Invasion. Journal of Marine Science and Engineering. 2023; 11(4):822. https://doi.org/10.3390/jmse11040822
Chicago/Turabian StyleWang, Yehuan, Yong Wang, Yanli Wang, Cheng Chen, Lingwei Kong, and Mengbing Xu. 2023. "Study on the Micro-Mechanical Mechanism of Fine-Grained Marine Sediments Subjected to Shallow Gas Invasion" Journal of Marine Science and Engineering 11, no. 4: 822. https://doi.org/10.3390/jmse11040822