Article

Mechanical Properties and Constitutive Model of Calcareous Sand Strengthened by MICP

1
Yazhou Bay Innovation Institute, Hainan Tropical Ocean University, Sanya 572025, China
2
College of Marine Science and Technology, Hainan Tropical Ocean University, Sanya 572022, China
3
College of Ecology Environment, Hainan Tropical Ocean University, Sanya 572022, China
4
Faculty of Architecture, Civil and Transportation Engineering, Beijing University of Technology, Beijing 100124, China
*
Author to whom correspondence should be addressed.
J. Mar. Sci. Eng. 2023, 11(4), 819; https://doi.org/10.3390/jmse11040819
Submission received: 2 March 2023 / Revised: 31 March 2023 / Accepted: 4 April 2023 / Published: 12 April 2023
(This article belongs to the Special Issue Coastal Engineering: Sustainability and New Technologies)

Abstract

:
To improve the mechanical properties of calcareous sand, it is proposed that microbial induced calcium carbonate precipitation (MICP) technology be used. A series of solidification tests were conducted in natural seawater and freshwater environments. The standard stress path static triaxial apparatus was used to conduct shear tests on calcareous sand and solids under varying reinforcement conditions. The composite power-exponential (CPE) model is proposed to describe the stress–strain relationship curve of the solid, and the method for determining model parameters is presented. The experimental results showed that the strength of calcareous sand with solids increased with the increase in number of reinforcement times for both test environments. Owing to the high salinity of seawater, which inhibits the activity of urease in bacterial solutions, the reinforcement strength in the seawater environment was generally lower than that in the freshwater environment. The compactness had an evident effect on the strength of the added solids. With the increase in compactness, the strength of the sample also increased, but the rate of increase was reduced. The simulation results showed that the established constitutive model can accurately describe the stress–strain relationship of microbial-reinforced calcareous sand and verified the applicability of the model.

1. Introduction

Calcareous sand is a special geotechnical medium with high calcium carbonate content of marine biogenic origin, and it is widely distributed on the continental shelf and coast in low latitude areas [1,2,3]. Owing to specific marine biological and chemical causes, calcareous sand has multiple edges and corners, is easily breakable, and has a high void ratio and large specific gravity [4,5]. Microorganisms induce calcium carbonate precipitation to produce urease, based on bacterial metabolism, promoting the hydrolysis of urea to carbonate ions and ammonium ions. The carbonate ion combines with the calcium ion in the environment to form calcium carbonate deposits in situ. Through particle encapsulation and inter-particle bonding, loose sand particles are cemented into a whole with a certain strength. The physical and mechanical properties of calcareous sand columns strengthened by MICP have been greatly improved. These improvements have made the columns environment friendly, efficient, and sustainable, which is in line with the requirements of island and reef engineering construction [6,7,8,9].
Xiao, Y. investigated the bearing performance of precast concrete piles embedded within calcareous sands with bio-grouting at the pile toe. The total bearing capacity of the precast concrete pile with a bio-grouted toe was 4.4 times as large as that without bio-grout [10]. Zamani, A. found that the application of MICP can lead to a decrease in soil water conductivity, and the formation of the calcium carbonate precipitate can reduce soil pore volume while improving its strength and stiffness [11]. Karimian, A. studied the effect of MICP reinforcement on the mechanical properties and microstructure of loose sand and silt, and found that there was no significant difference in the amount of calcium carbonate precipitation between loose sand and silt, and the soil strength was significantly improved [12]. Kannan, K. found that the biological stimulation method was not effective in two selected marine clays, and the undrained shear strength of MICP-treated marine clays significantly increased under the ductile limit water content [13]. Tian, Z. found that MICP can effectively improve the settlement and consolidation uniformity of marine clay during electroosmotic consolidation [14]. Islam, M.T. studied the impact of clay content on the treatment effect of MICP by selecting soils with different clay content, and found that using biologically stimulated MICP can increase the strength of cohesive soil, while the amount of calcite precipitation increases with the increase in clay content [15].
Montoya, B. found that the shear strength and stiffness of MICP-treated soil significantly increased with the increase in MICP cementation [16].
To capitalize on marine resources and reduce the use of fresh water, some seawater is added during the preparation process for MICP cementitious calcareous sand materials. The high pH value of seawater and the presence of various ionic components in seawater have a direct impact on the activity of bacteria and the mineral composition of sediment. It is, hence, necessary to study the MICP method for cementitious calcareous sand in a seawater environment. Peng Jie [17] studied the solidification effect of MICP reinforcement of coral sand in a simulated seawater environment and found that the seawater environment inhibits the production of calcium carbonate in the MICP reaction, thus inhibiting the reinforcement effect. Dong Bowen [18] found that natural seawater causes the growth of microorganisms to lag, and the effect of using seawater MICP to strengthen calcareous sand is not different from that under freshwater conditions, which verifies the feasibility of MICP reinforcement technology under seawater conditions. Gao Xinyu [19] found that the grouting round is an important influencing factor in the grouting reinforcement of sand columns in seawater environments through technical research on the reinforcement of coral sand by microbial-induced struvite under a high salt environment. With the increase in the number of grouting rounds, the unconfined compressive strength of a sand column also increases. Cheng, L. [20] considered the calcium ion in seawater as the only calcium source and found that MICP, after repeated seawater treatment, can significantly improve the strength of the sand column. At the same time, some researchers proposed that using MICP technology to modify calcareous sand with fiber reinforcement can effectively improve the toughness and ductility of the sample [21,22,23,24,25,26]. Wang, Y. conducted a rainfall erosion model test on MICP-reinforced calcareous sand, revealing the enhanced strength and erosion resistance of coastal coral sand after biological stimulation MICP treatment [27].Through simulated coastal erosion experiments, it was found that soil erosion decreased exponentially with the increase in calcium carbonate content. Under mild to moderate wave and dune slope conditions, EICP and MICP can significantly reduce dune erosion [28,29]. Hai-Lei Kou [30] and others found that the sand slope strengthened by MICP after adding recycled coconut silk (RSC) could better resist wave erosion and improve the erosion resistance of the simulated coastal slope. Xiao Yao [31] conducted a multi-gradient artificial acclimation culture test with Bacillus pasteurii in an artificial seawater environment and found that a seawater environment inhibits the formation of bacteria and the synthesis of urease. Moreover, the gradient acclimation could cause the bacteria to gradually adapt to the seawater environment, and the reinforcement effect of the bacterial solution after the gradient acclimation was better than that in fresh water. Yang Simeng [32] and other researchers found that when the amount of urea is three times the content of calcium ions in concentrated seawater, the efficiency of using calcium ions in the cement solution to produce precipitation can be improved.
The above research shows that using MICP to reinforce calcareous sand in a seawater environment is feasible, and the reinforcement effect is significant. The reinforcement of calcareous sand by MICP in a seawater environment is affected by water temperature, salinity, calcium source, reinforcement process and other factors. Due to previous studies focusing mainly on the reinforcement effect of calcareous sand in land environments, there are few studies on the mechanical properties of MICP-reinforced calcareous sand in seawater environments, and the main tests are unconfined compressive strength tests. Therefore, it is necessary to understand the mechanical behavior of calcareous sand treated by MICP in a seawater environment more deeply and comprehensively through triaxial experiments. Hence, in this work, for different water environment conditions, different reinforcement degree and degree of compaction, the reaction process, influence law and stress–strain relationship of consolidated sand strengthened by MICP were thoroughly studied by indoor triaxial experiments, using the CPE model to fit the relationship curve. The research results comprehensively revealed the mechanical characteristics of a microbial-reinforced calcareous sand roadbed in a seawater environment and provided a reference for the reinforcement design of a coral island reef calcareous sand roadbed in the South China Sea.

2. Materials and Methods

2.1. Reaction Principle of MICP Technology

According to the results from research conducted by Ronghui et al. [33], the MICP reaction process in a deionized water environment is as follows. Ca2+ in the nutrient salt first attaches to the surface of bacterial cells. After the urea is gradually hydrolyzed into an ammonium ion and carbonate ion, Ca2+ and CO32− in the cell are combined to form crystals, such as CaCO3. The reaction process is shown in Figure 1, which can be simplified as follows:
Ca 2 + + Cell Cell Ca 2 +
CO ( NH 2 ) 2 + 2 H 2 O 2 NH 4 + + CO 3 2
Cell Ca 2 + + CO 3 2 Cell CaCO 3
In the MICP mineralization reaction process in a seawater environment, Ca2+ in nutrient salt and a small amount of Mg2+ and Ba2+ in seawater first attach to the surface of bacterial cells. After urea is hydrolyzed into ammonium ions and carbonate ions in steps, owing to the weak alkaline environment of seawater, ions such as Ca2+, Mg2+, and Ba2+ of cells are combined with CO32− and OH to form CaCO3, Mg5(CO3)4(OH)2·4H2O, BaCO3, and other crystals. The reaction process can be simplified as follows:
Ca 2 + + Cell Cell Ca 2 +
Mg 2 + + Cell Cell Mg 2 +
Ba 2 + + Cell Cell Ba 2 +
CO ( NH 2 ) 2 + 2 H 2 O 2 NH 4 + + CO 3 2
Cell Ca 2 + + CO 3 2 Cell CaCO 3
Cell Mg 2 + + OH + CO 3 2 Cell Mg 5 ( CO 3 ) 4 ( OH ) 2 4 H 2 O
Cell Ba 2 + + CO 3 2 Cell BaCO 3

2.2. Bacteria and Culture

The bacterium used for the experiment was Bacillus pasteurii, which is widely distributed in natural soil and is the most widely used bacterium in the field of geotechnical engineering MICP. The bacterium can promote the hydrolysis of urea from the highly active urease produced by its metabolism, thus causing the rapid deposition of calcium carbonate. The main components and content of the bacterial culture medium were: 20 g/L of urea, 15 g/L of peptone, 5 g/L of soybean peptone, and 5 g/L of sodium chloride. The pH of the medium was adjusted to 7.3 with NaOH solution. The prepared culture medium was sterilized for 30 min in a 120 °C autoclave and then cooled to room temperature on an ultra-clean table. The bacteria were inoculated into the culture medium at a ratio of 1.0% (volume fraction) and cultured for 36 h on a constant-temperature shaking table at 30 °C at a rotational speed of 220 r/ min. Thereafter, the concentration of the bacterial solution and the urease activity of the bacterial solution were measured.

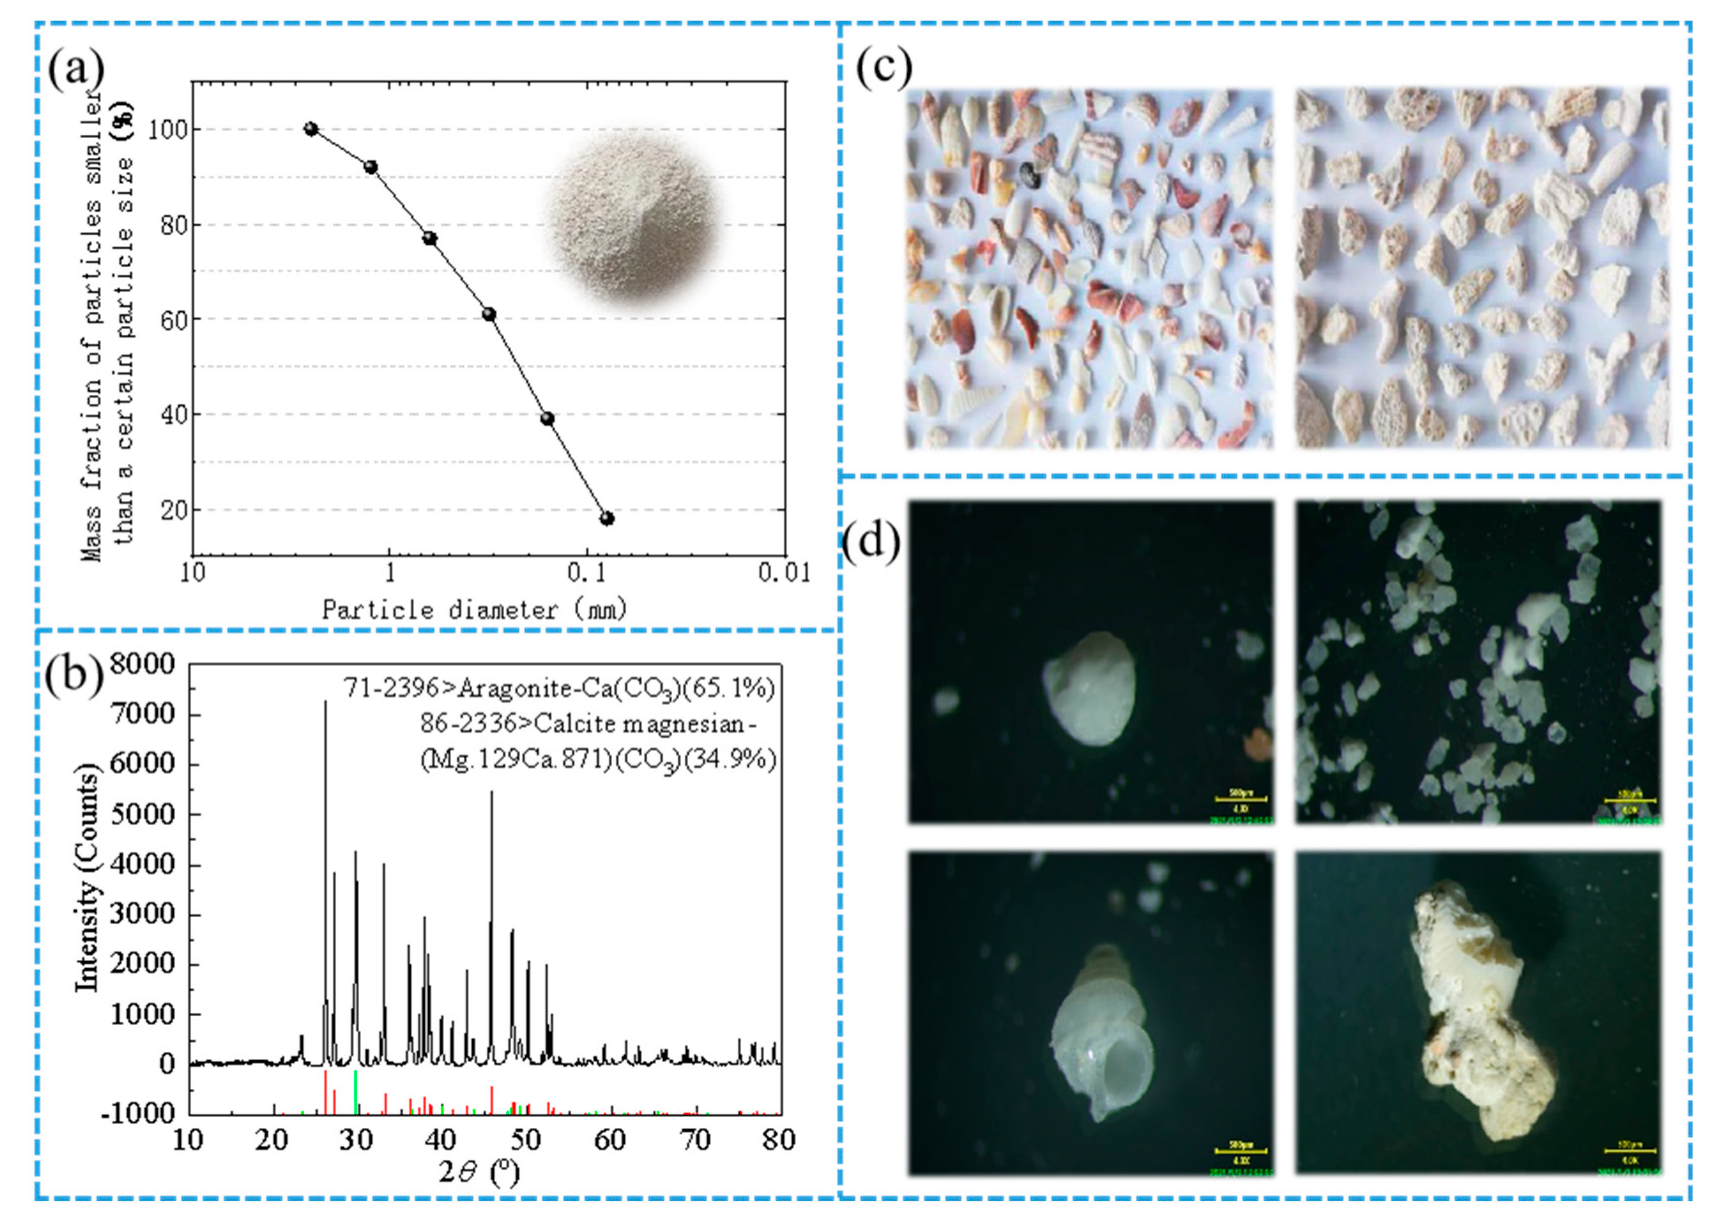
2.3. Calcareous Sand

The calcareous sand used in the experiment was obtained from an island and reef in the South China Sea. The maximum dry density of the sample was 1.65 g/cm3, the minimum dry density was 1.20 g/cm 3, the specific gravity was 2.73, the maximum and minimum void ratios were 1.27 and 0.63, respectively, and the particle distribution curve is shown in Figure 1a. The calcareous sand was mainly composed of coral debris and marine animals such as seashells and foraminifera. The main chemical components were calcium carbonate and magnesium carbonate. The calcium content accounted for more than 90% of the total volume, as shown in Figure 1b–d.

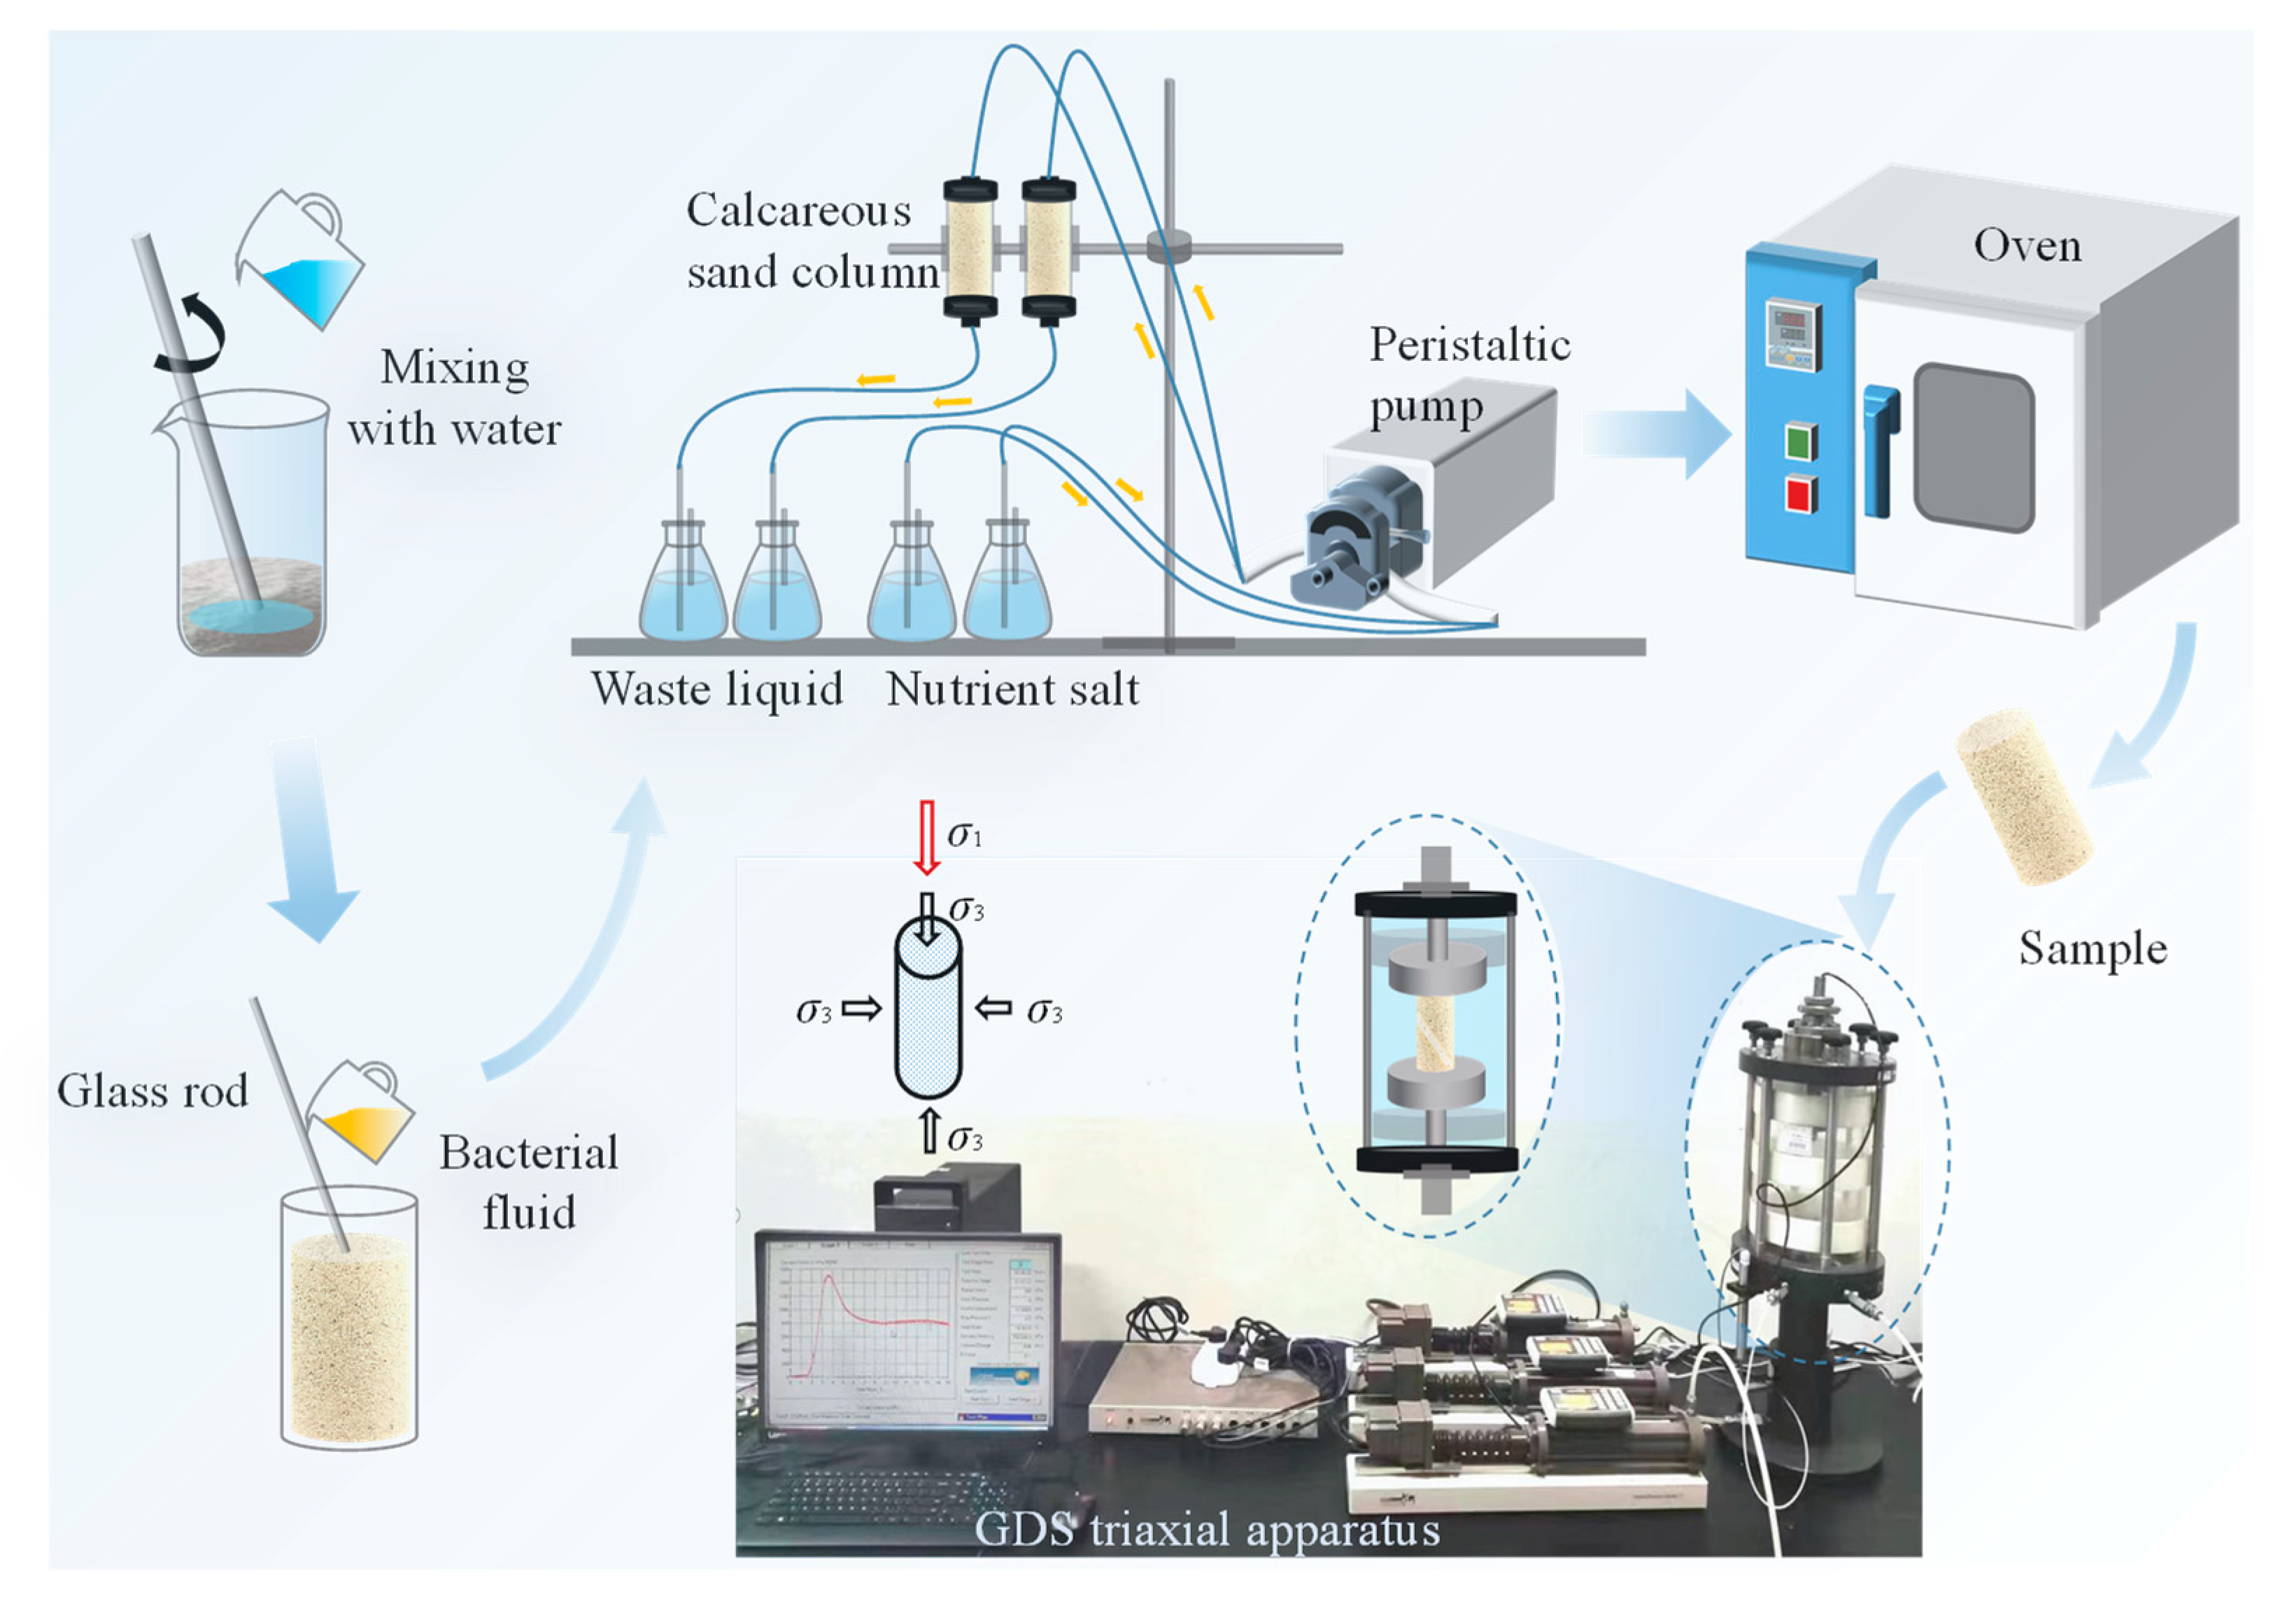
2.4. Experimental Procedure

2.4.1. Determination of Microbial Concentration and Activity

A spectrophotometer was used to determine the bacterial concentration. Briefly, 5 mL of bacterial solution was extracted and combined with 10 mL of deionized water, and then its absorbance (OD600) at the wavelength of 600 nm was measured. To test the urease activity of bacterial liquid, the probe of a conductivity meter was cleaned with distilled water, then placed in a prepared mixture consisting of 5 mL of bacterial liquid combined with 1.1 mol/L urea solution, which was 9 times the volume of bacterial liquid. The conductivity change in the mixed solution was measured for 5 min. The hydrolysis ability of urease was directly proportional to the change in conductivity, and the relationship between the two can be expressed as follows:
Urea hydrolysis amount (mM/min) = conductivity change value (ms/cm) × 11.11
The average conductivity change value measured within 5 min multiplied by the dilution factor (10 times) was the initial enzyme activity of the bacterial solution. The absorbance (OD600) of the bacterial solution measured during the experiment was 1.52, and the conductivity changed to 0.96 mmol/(L·min) within 5 min.

2.4.2. Strengthening Calcareous Sand Column with MICP

The mold selected for the test was rigid PVC round pipe, with a height of 8.8 cm and a diameter of 3.9 cm. A specified amount of calcareous sand was weighed and combined with water. A specified water content sand sample was prepared and loaded into the mold one layer at a time, and the dry density of the sand column was controlled. The cultivated bacterial solution was manually injected, and the nutrient salt was intermittently injected using the peristaltic pump grouting method to conduct the consolidation test for the calcareous sand column. The experimental steps were as follows: (1) For sample preparation, after the sample was loaded, the peristaltic pump was used for 24 h to inject natural seawater into the seawater group sample at a rate of 0.1 mL/min as the seawater curing environment. Deionized water was injected for 24 h into the freshwater group sample as the freshwater curing environment. (2) The bacterial solution and nutrient salt were injected. A glass rod was used to drain and evenly inject a mixed solution consisting of 80 mL bacterial solution and 10 mL 0.05 mol/L calcium chloride solution. After standing for 12 h, a peristaltic pump was used to inject 60 mL of nutrient salt into the sample at a rate of 0.1 mL/min. The interval between two injections of nutrients was 24 h. (3) The sample was removed and after grouting, the peristaltic pump was used to wash the sample with deionized water for 24 h. The residual ions in the sample were washed, and the continuous generation of calcium carbonate precipitation was halted. The mold was removed, and the sample was placed in a 60 °C oven for 48 h. An illustration of the experimental process is shown in Figure 2.

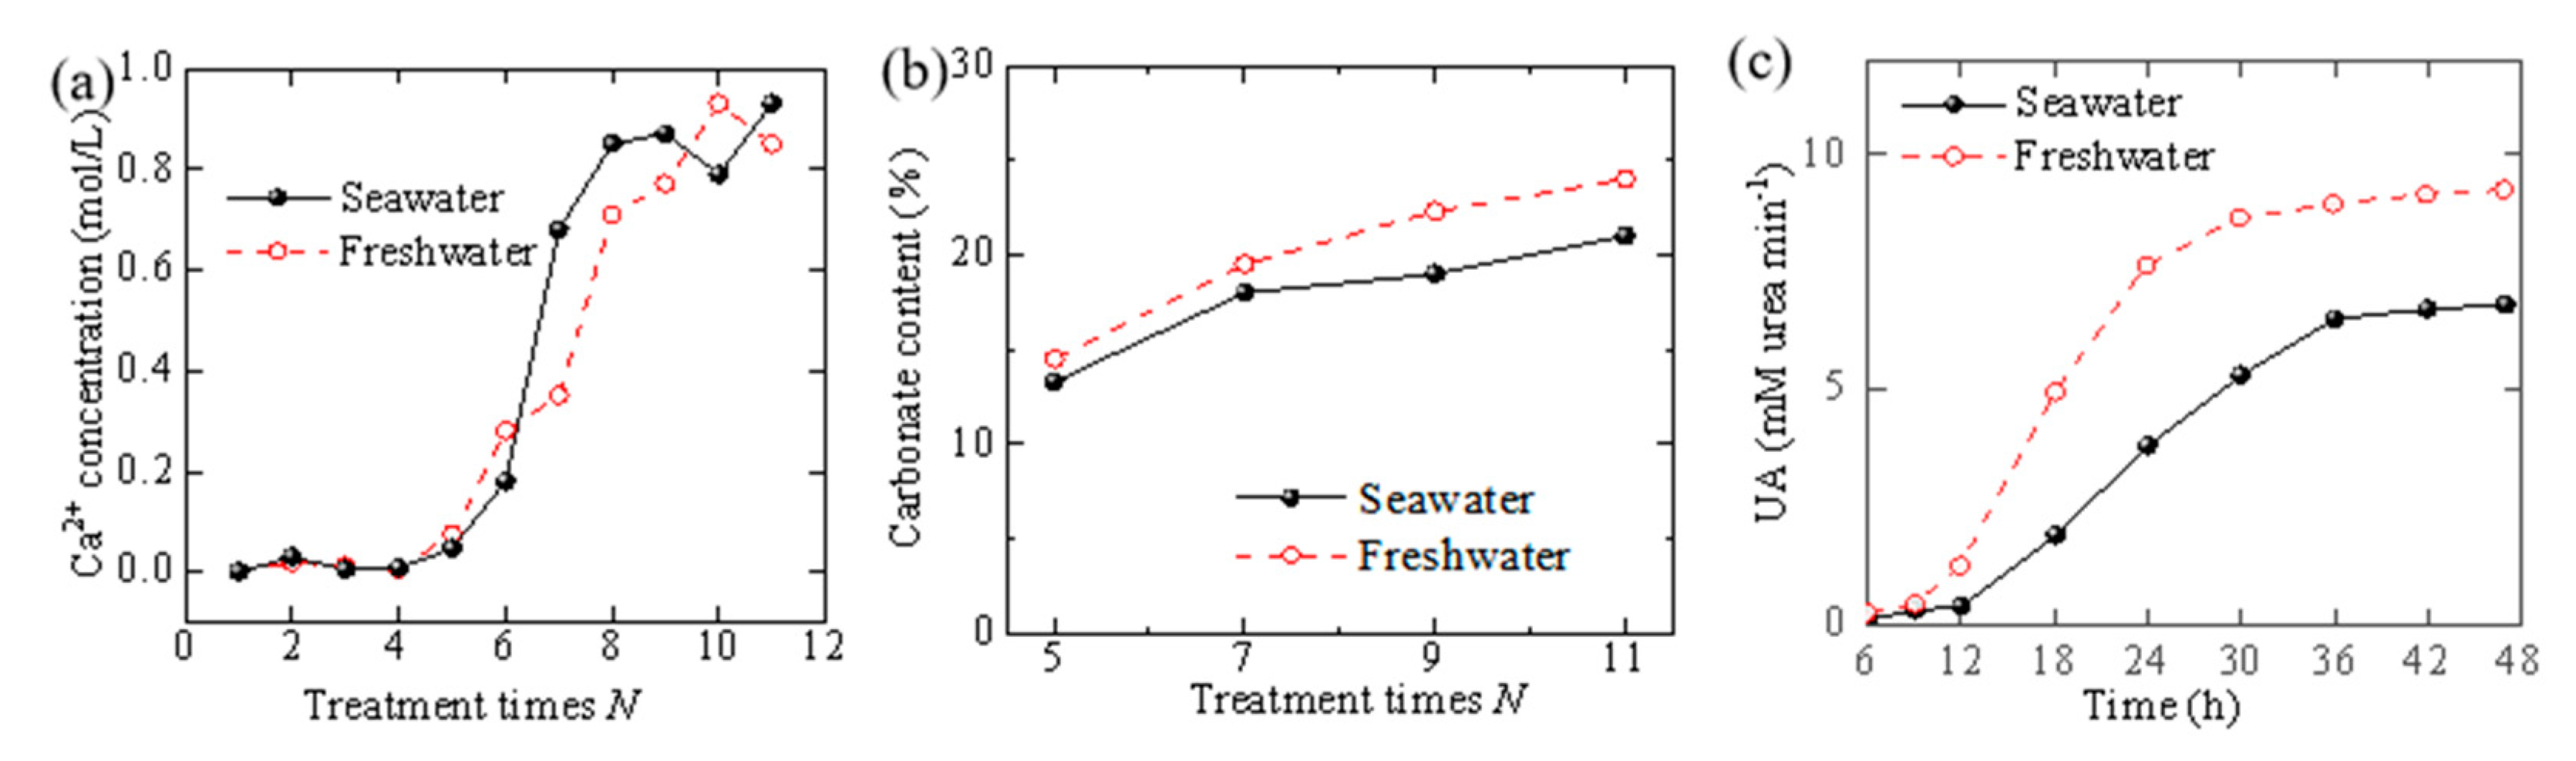
2.4.3. Determination of Ca2+ Concentration

After each grouting procedure, the effluent liquid at the bottom of the sample was collected, and the concentration of Ca2+ in it was measured to analyze the degree of the MICP mineralization reaction. The concentration of Ca2+ was measured using a PXS−270 (ion meter), Pca−1−01 (calcium ion electrode), and 232−01 (reference electrode). The ion meter was calibrated with the standard solution before each measurement. Because the lowest measurement range of the ion meter was 0.1 mol/L, the solution to be measured was diluted accordingly before measurement.

2.4.4. Determination of Carbonate Content

The main component of calcareous sand is calcium carbonate; therefore, it was not suitable to measure the quantity of raw carbonate using the acid washing method. In this study, the weighing method was used to calculate the calcium carbonate content, C, generated by the mineralization reaction, by obtaining the difference between the initial mass M1 of the sand column and the final mass M2 of the sand column after MICP reinforcement, cleaning and drying. The expression for C is given by
C = M 2 M 1 M 2 × 100 % .

2.4.5. Triaxial Compression Test and Constitutive Model Study

The standard stress path static triaxial apparatus was used to conduct loading tests on calcareous sand and solids under different confining pressures and different reinforcement conditions, and the stress–strain relationship curves of solid under different reinforcement conditions were obtained. The composite power-exponential (CPE) model was proposed to describe the triaxial-drained shear test of MICP-strengthened calcareous sand. CPE model fitting of stress–strain curves was obtained from conventional triaxial tests under different numbers of reinforcement days, compactness and confining pressure. From these, the strain-softening type curve of calcareous sand plus solids for different numbers of reinforcement days and compactness and the strain-hardening type curve of the stress–strain CPE model considering confining pressure were obtained.

3. Results

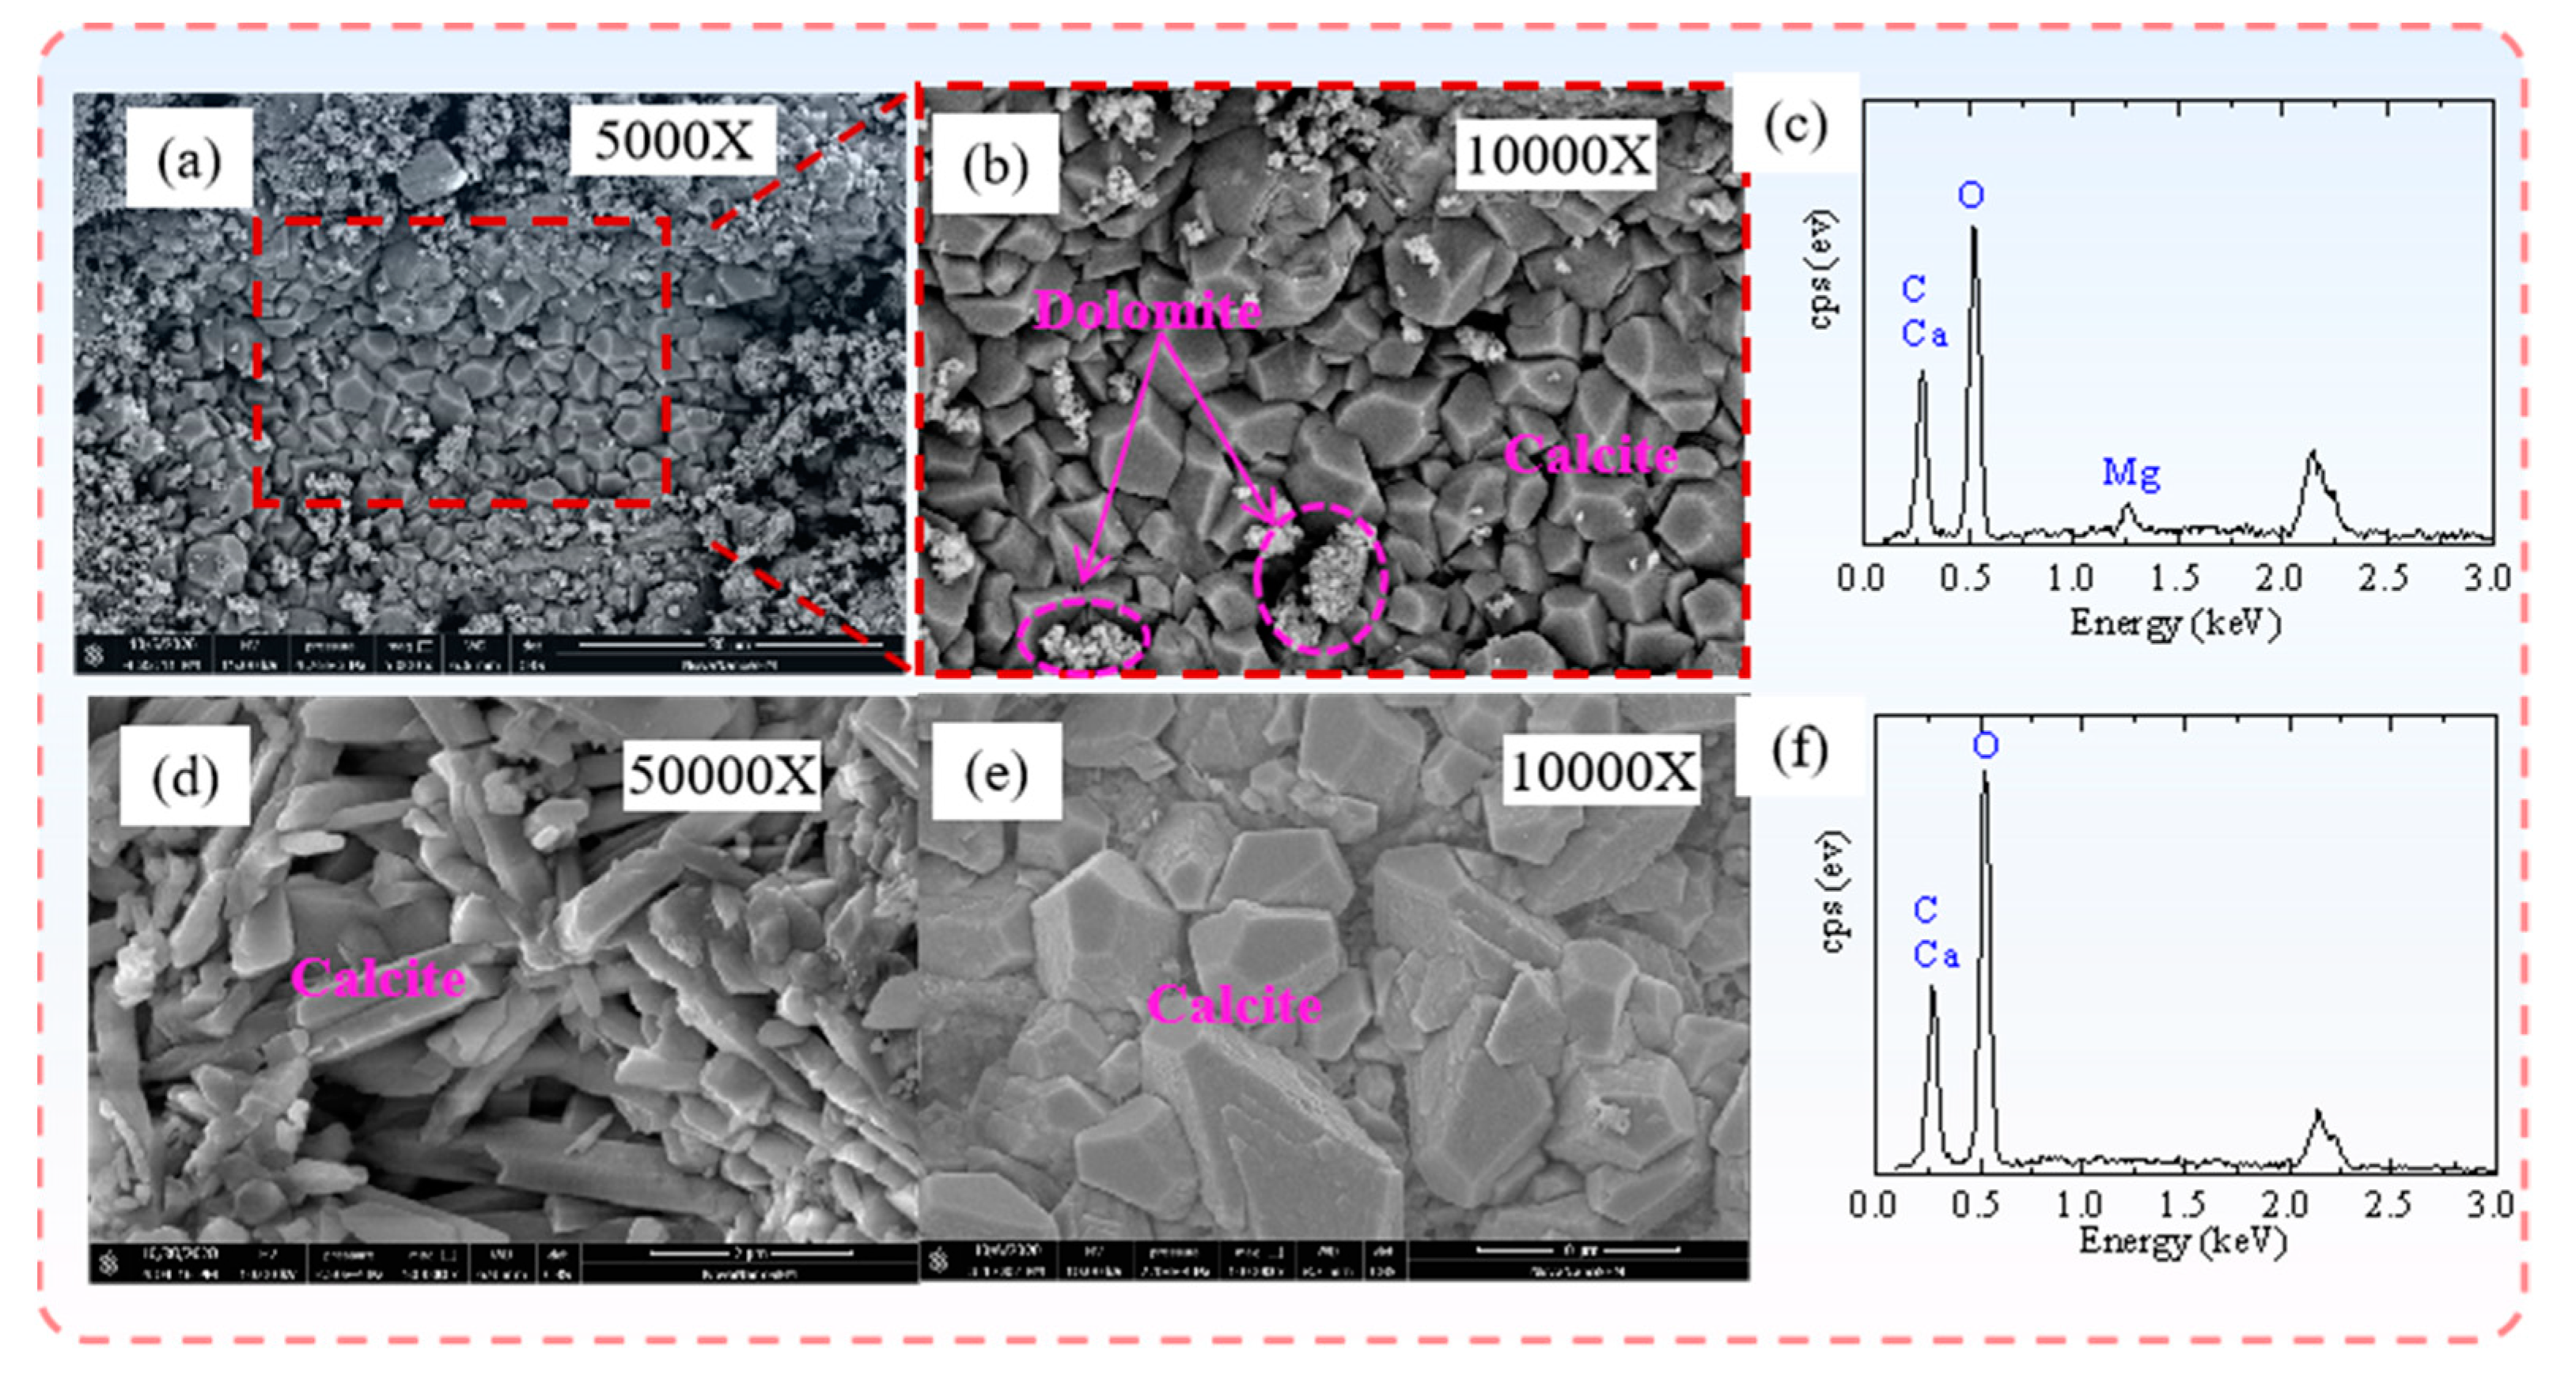
3.1. Degree of Mineralization Reaction and Amount of Carbonate Precipitation

The degree of a mineralization reaction in different water environments can be determined by measuring the concentration of calcium ion in the liquid flowing out of the sand sample after the mineralization reaction. This is achieved by collecting the effluent liquid of the sand sample after reaction with a container and measuring the concentration of Ca2+ in the residual liquid. It is evident from Figure 3a that the concentration of calcium ions in the effluent on the first and fourth days was very low (below 0.05 mol/L), which indicates that the mineralization reaction efficiency was high during those days, and the calcium ions in the nutrient salt were consumed to form carbonate precipitate. From the fifth day, the concentration of Ca2+ in the effluent increased significantly with the increase in the number of reinforcement times. When the number of reinforcement times was greater than 8, the concentration of Ca2+ in the effluent was between 0.8−1.0 mol/L, indicating that the mineralization reaction efficiency was low and that the amount of calcium carbonate precipitation was small. Comparing the concentration of Ca2+ in the outflow liquid of sand samples in both water environments, it was found that the reaction degree in both water environments was approximately equal when the number of reinforcement times was between 0 and 4. When the number of reinforcement times was greater than 5, the concentration of Ca2+ in the seawater environment increased marginally faster than that in the deionized water environment. This was caused by the different activity of bacteria in different water environments with time and resulted in different degrees of the mineralization reaction. With the increase in the number of reinforcement times and the decrease in bacterial activity, the mineralization reaction efficiency decreased.
It is evident in Figure 3b that for both water environments, the amount of carbonate formation in the calcareous sand column increased significantly with the increase in the number of reinforcement times, while the increase rate decreased gradually. The degree of the mineralization reaction and total amount of carbonate formation in the seawater environment differ from those in the freshwater environment. It is shown in Figure 3c that the urease activity in the seawater environment was typically lower than that in the freshwater environment. This is because the higher salinity of the seawater inhibited bacterial activity. Thus, the degree of the mineralization reaction and total amount of carbonate formation in the seawater environment were typically lower than those in the freshwater environment.
Figure 4a,b show the scanning electron microscope images of the sample in the seawater environment, and Figure 4c shows the energy spectrum images of the sediment in the seawater environment; Figure 4d,e show the scanning electron microscope images of the sample in the deionized water environment, and Figure 4f shows the energy spectrum images of the sediment in the deionized water environment. Figure 4e shows that under the scanning electron microscope with 10,000 times magnification, the calcium carbonate that precipitated in the freshwater environment formed a large number of relatively complete calcite crystals, as indicated by the purple dotted line in the figure. Figure 4f shows that a large number of precipitated calcium carbonate crystals were generated in the deionized water environment. As shown in Figure 4b, under the scanning electron microscope with 10,000 times magnification, in addition to the generation of a large number of calcite crystals in the seawater environment, a small number of dolomite crystals were also attached between the crystals. It is clear from Figure 4c that the mineral components generated in the seawater environment consisted of more magnesium, barium, and other elements than in the deionized water. This is because small amounts of magnesium ions and barium ions in the seawater make the reaction process produce not only calcium carbonate, but also a small amount of magnesium carbonate, barium carbonate and other mineral components.

3.2. Triaxial Compression Test

The peak strength and stress–strain relationship of MICP-strengthened specimens for different strengthening conditions were analyzed. It is evident in Figure 5a,b that the stress–strain curves of calcareous sand with respect to different reinforcement degrees in both water environments were mainly of the hardening type and softening type. When the confining pressure was 50 kPa, 100 kPa and 200 kPa, the stress–strain relationship of the reinforcement depicted a softening type, and when the confining pressure reached 400 kPa, it depicted a hardening type. It is evident from Figure 5a–c that the peak strength and residual strength of the sample increased with the increase in confining pressure in both seawater and freshwater environments.
The carbonate generated by the microbial mineralization reaction cemented the loose particles into a whole. Under the same conditions, the variation trend in the amount of carbonate generated was consistent with the peak strength, that is, the more carbonate generated, the higher the overall strength of the sample, as shown in Figure 5d. Figure 5d is a comparison diagram of the calcium carbonate content–peak strength relationships found by other research teams [18,34,35,36,37] and this study. With the increase in calcium carbonate precipitation generated by the sample, the deviatoric stress of calcareous sand plus solid increased, and the variation trend was consistent with that of existing studies. The slope of the curve was different with different reinforcement conditions.
Figure 5e,f show that the rigidity and deviatoric stress of the calcareous sand without MICP reinforcement were significantly lower than those of the sample after reinforcement, and the range of the shear band was wide. The shear-failure band of the sample with MICP reinforcement was more evident and narrower than that of the sample without MICP reinforcement.

3.3. Effect of Seawater on Stress–Strain Relationship

Figure 5c shows that under different conditions, the trend of shear strength variations in both seawater and freshwater environments was the same, and the shear strength in the seawater environment was less than that in the freshwater environment for the same parameter. This is because natural seawater inhibits the growth of Bacillus pasteurii and urease activity. These effects reduced the reaction rate and affected the reinforcement effect.
Figure 5a,b show that the samples’ shear strength with respect to the number of reinforcement days in the seawater environment decreased by 7.9%, 13.6%, 14% and 12% compared with that in the freshwater environment. The strength increased with the increase in number of reinforcement days. After 11 days of reinforcement, the strength of the sample reached the maximum, 2.43 MPa and 2.13 MPa in seawater and freshwater, respectively. In both water environments, the shear strength of the sample increased with the increase in the number of reinforcement times, and the rate of increase decreased gradually. This is because with the increase in the number of nutrients injected, the amount of carbonate generated in the particle pores gradually increased, and the density and strength of the added solids increased. At the same time, as the gaps between the sand particles were gradually filled and blocked by the generated carbonate precipitation, variations in the surrounding environment of the bacteria led to the gradual reduction in bacterial activity, thus reducing the efficiency of the mineralization reaction and weakening the strength growth trend. From Figure 5c, it is evident that the strength growth rate of the specimens that were strengthened for approximately 7 days was the fastest. This is the optimum number of strengthening days to balance the strengthening effect and economic cost. The axial strain corresponding to the peak strength of the sample is defined as the failure strain. The failure strain of the sample in the seawater environment had insignificant variation compared with that in the freshwater environment. Both values were between 2% and 4%, indicating that the deformation and settlement of the calcareous sand strengthened by MICP may be easily monitored and controlled in the application of marine engineering.
The stress–strain curve of the sample under low confining pressure depicted a softening type, while that under high confining pressure depicted a hardening type and a significant increase in the peak strength. The shear strength of samples under 400 kPa confining pressure in seawater and freshwater environments increased by 75.9% and 82.3%, respectively, compared with those under 50 kPa confining pressure. The increase in strength of samples in the seawater environment was small. Therefore, in seawater or freshwater environments, the greater the confining pressure, the greater the residual strength of the sample, and the higher the deviatoric stress after reaching the peak strength. This shows that increasing the confining pressure can effectively improve the bearing capacity of calcareous sand in marine engineering.
The density had little influence on the shape of the stress–strain curve of calcareous sand samples but had a significant influence on their peak strength. In general, the higher the initial dry density of the sample, the greater its peak strength. The densities of the samples in seawater and fresh water were 1.34 g/cm3 and 1.46 g/cm3, respectively. Compared with the sample with a density of 1.34 g/cm3, the strength of the sample with a density of 1.46 g/cm3 in seawater and fresh water environments increased by 32.3% and 24.1%, respectively. Although the strength of the samples in the seawater environment was still not very large, the increase was large.

3.4. Constitutive Model

3.4.1. Model Establishment and Parameter Solution

The stress–strain relationship of consolidated calcareous sand samples under different confining pressures was characterized primarily by hardening and softening. The characteristics of the softening stress–strain curve include the following. (1) The curve passes through the coordinate origin. (2) With the gradual increase in the axial strain, the partial stress q increases monotonically and nonlinearly at first, decreases gradually after reaching the peak strength, and finally becomes stable after reaching the residual stress, that is, the first derivative of the model function approaches 0 when the strain is infinite. For the hardening type, the deviatoric stress q increases linearly with the axial strain and remains unchanged when it reaches the peak strength. Therefore, compared with the softening-type curve, the deviatoric stress of the hardening type does not decrease. In this model, the hardening type is considered as a particular form of the softening type.
In this paper, the CPE model proposed by Wang Lijin [38] was used to fit and analyze the stress–strain curve of calcareous sand. The function expression of the CPE model is
q = σ 1 σ 3 = f ε 1 = a ε 1 m k e b ε 1 n + k p a
where q is the deviatoric stress, σ 1 is the axial stress, σ 3 is the confining pressure, ε 1 is axial strain, p a is the standard atmospheric pressure, and a, b, k, m, and n are test parameters. The test parameters are defined as follows:
(1) Softening-type stress–strain curve
(a) Parameter k = q r
When ε 1 ,   f ε 1 k p a , when the stress–strain curve shows a softening type, k = q r / p a , where qr is the residual strength.
(b) Parameters a and m
Before the peak strength q p , the shape of the stress–strain curve is mainly affected by a ε 1 m , thus the measured data before the peak strain ε p conform to q / p a = a ε 1 m , and the logarithms on both sides of the equation are obtained as follows:
ln q / p a = ln a + m ln ε 1
It is evident that ln q / p a ln ε 1 is linear, where ln a is the intercept of the straight line on the vertical axis, and m is the slope of the straight line.
(c) Parameters b and n
After the axial strain ε 1 exceeds the peak strain ε p , the shape of the descending section of the stress–strain curve is primarily controlled by e b ε 1 n . Therefore, the measured data of the falling section after peak strain ε p should conform to ln a ε 1 m k q / p a k = b ε 1 n . Let q * = ln a ε 1 m k q / p a k , taking the logarithms on both sides of the equation yields
ln q * = ln b + n ln ε 1
It is evident that ln q * ln ε 1 also has a linear relationship, where ln b is the intercept of the straight line on the vertical axis, and n is the slope of the straight line.
(2) Hardened stress–strain curve
For the axial strain ε 1 < 2.5 % , the data points are fitted as above, but the parameter a is opposite. In general, the value of parameter a is approximately 0 at this time; thus, let parameter a = 0, then Equation (3) can be simplified as follows:
q = σ 1 σ 3 = F ε 1 = k 1 e b ε 1 n p a .
Equation (6) is the simplified CPE model expression of the hardening stress–strain curve.
(a) Parameter k = q u when ε , F ε 1 k p a , and when the stress–strain curve depicts the hardening type, k = q u / p a = σ 1 σ 3 u / p a , where q u = σ 1 σ 3 u is the ultimate strength.
(b) Parameter b and n
The hardening-type stress–strain curve parameter a ≈ 0; therefore, q * = ln a ε 1 m k q / p a k = ln k k q / p a . Similarly, ln b is the intercept of the straight line ln q * ln ε 1 on the longitudinal axis, and n is the slope of the straight line.

3.4.2. Model Parameter Solution

The CPE model was applied to the data measured in the experiment to fit and analyze the calcareous sand reinforcement samples under different conditions. Figure 6a–c show the fitting curves of the stress–strain relationship of samples under different conditions. Table 1 shows the values of the CPE model parameters a, b, k, m, n and R 2 . The R 2 values are all above 0.96, indicating that the CPE model can adequately simulate the MICP solidified calcareous sand sample q ε curve. Parameter a reflects the shape of the stress–strain curve before peak failure of rock and soil mass, while parameters b and n reflect the shape of the stress–strain curve after peak failure of rock and soil mass. The parameter k in the strain softening curve represents the residual strength. The final strength is depicted in the strain-hardening curve. The parameter m reflects the nature of the small-strain stage of the calcareous sand sample. When 0 < m < 1, the curve is concave, and the greater the concave degree of the curve, the greater the m value. If m > 1, the curve is convex, and the larger the convex degree of the curve, the smaller the m value. It is evident in Table 1 that the m value of most calcareous sand and solids is greater than 1, which generally corresponds to the stress–strain curve of rock and soil mass with developed fissures.

3.4.3. Model Validation

The deviatoric stress in the actual data was considered the abscissa, and the deviatoric stress obtained by the fitting function was considered the ordinate. The comparison diagram of the actual deviatoric stress and the fitting deviatoric stress verified the fitting effect of the model on the stress–strain relationship of calcareous sand. As shown in Figure 6d, the black line in the figure is the expression of the function y = x. The closer in value the abscissa and ordinate are, the closer the data point is to the line, and the better the fitting effect. In contrast, if the deviation of data points from the straight line is large, the fitting effect is poor. Through comparison, it was found that the fitting difference mainly occurred at the beginning of a triaxial test, that is, at the stage of elastic deformation of calcareous sand, which indicated that the fitting effect of the CPE model on the failure form of calcareous sand at the later stage was better than that at the earlier stage, and the overall evaluation of the CPE model could adequately describe the stress–strain relationship of calcareous sand.

4. Conclusions

In this paper, the effects of various factors on the physical and mechanical properties of the reinforcement of calcareous sand by microbial-induced carbonate precipitation were analyzed by varying the number of reinforcement days, sample density, confining pressure, and other conditions during the experimentation of MICP-solidified calcareous sand in seawater and freshwater environments. Using the CPE model to simulate the static test results of MICP-reinforced calcareous sand, the following interpretations were obtained:
(1)
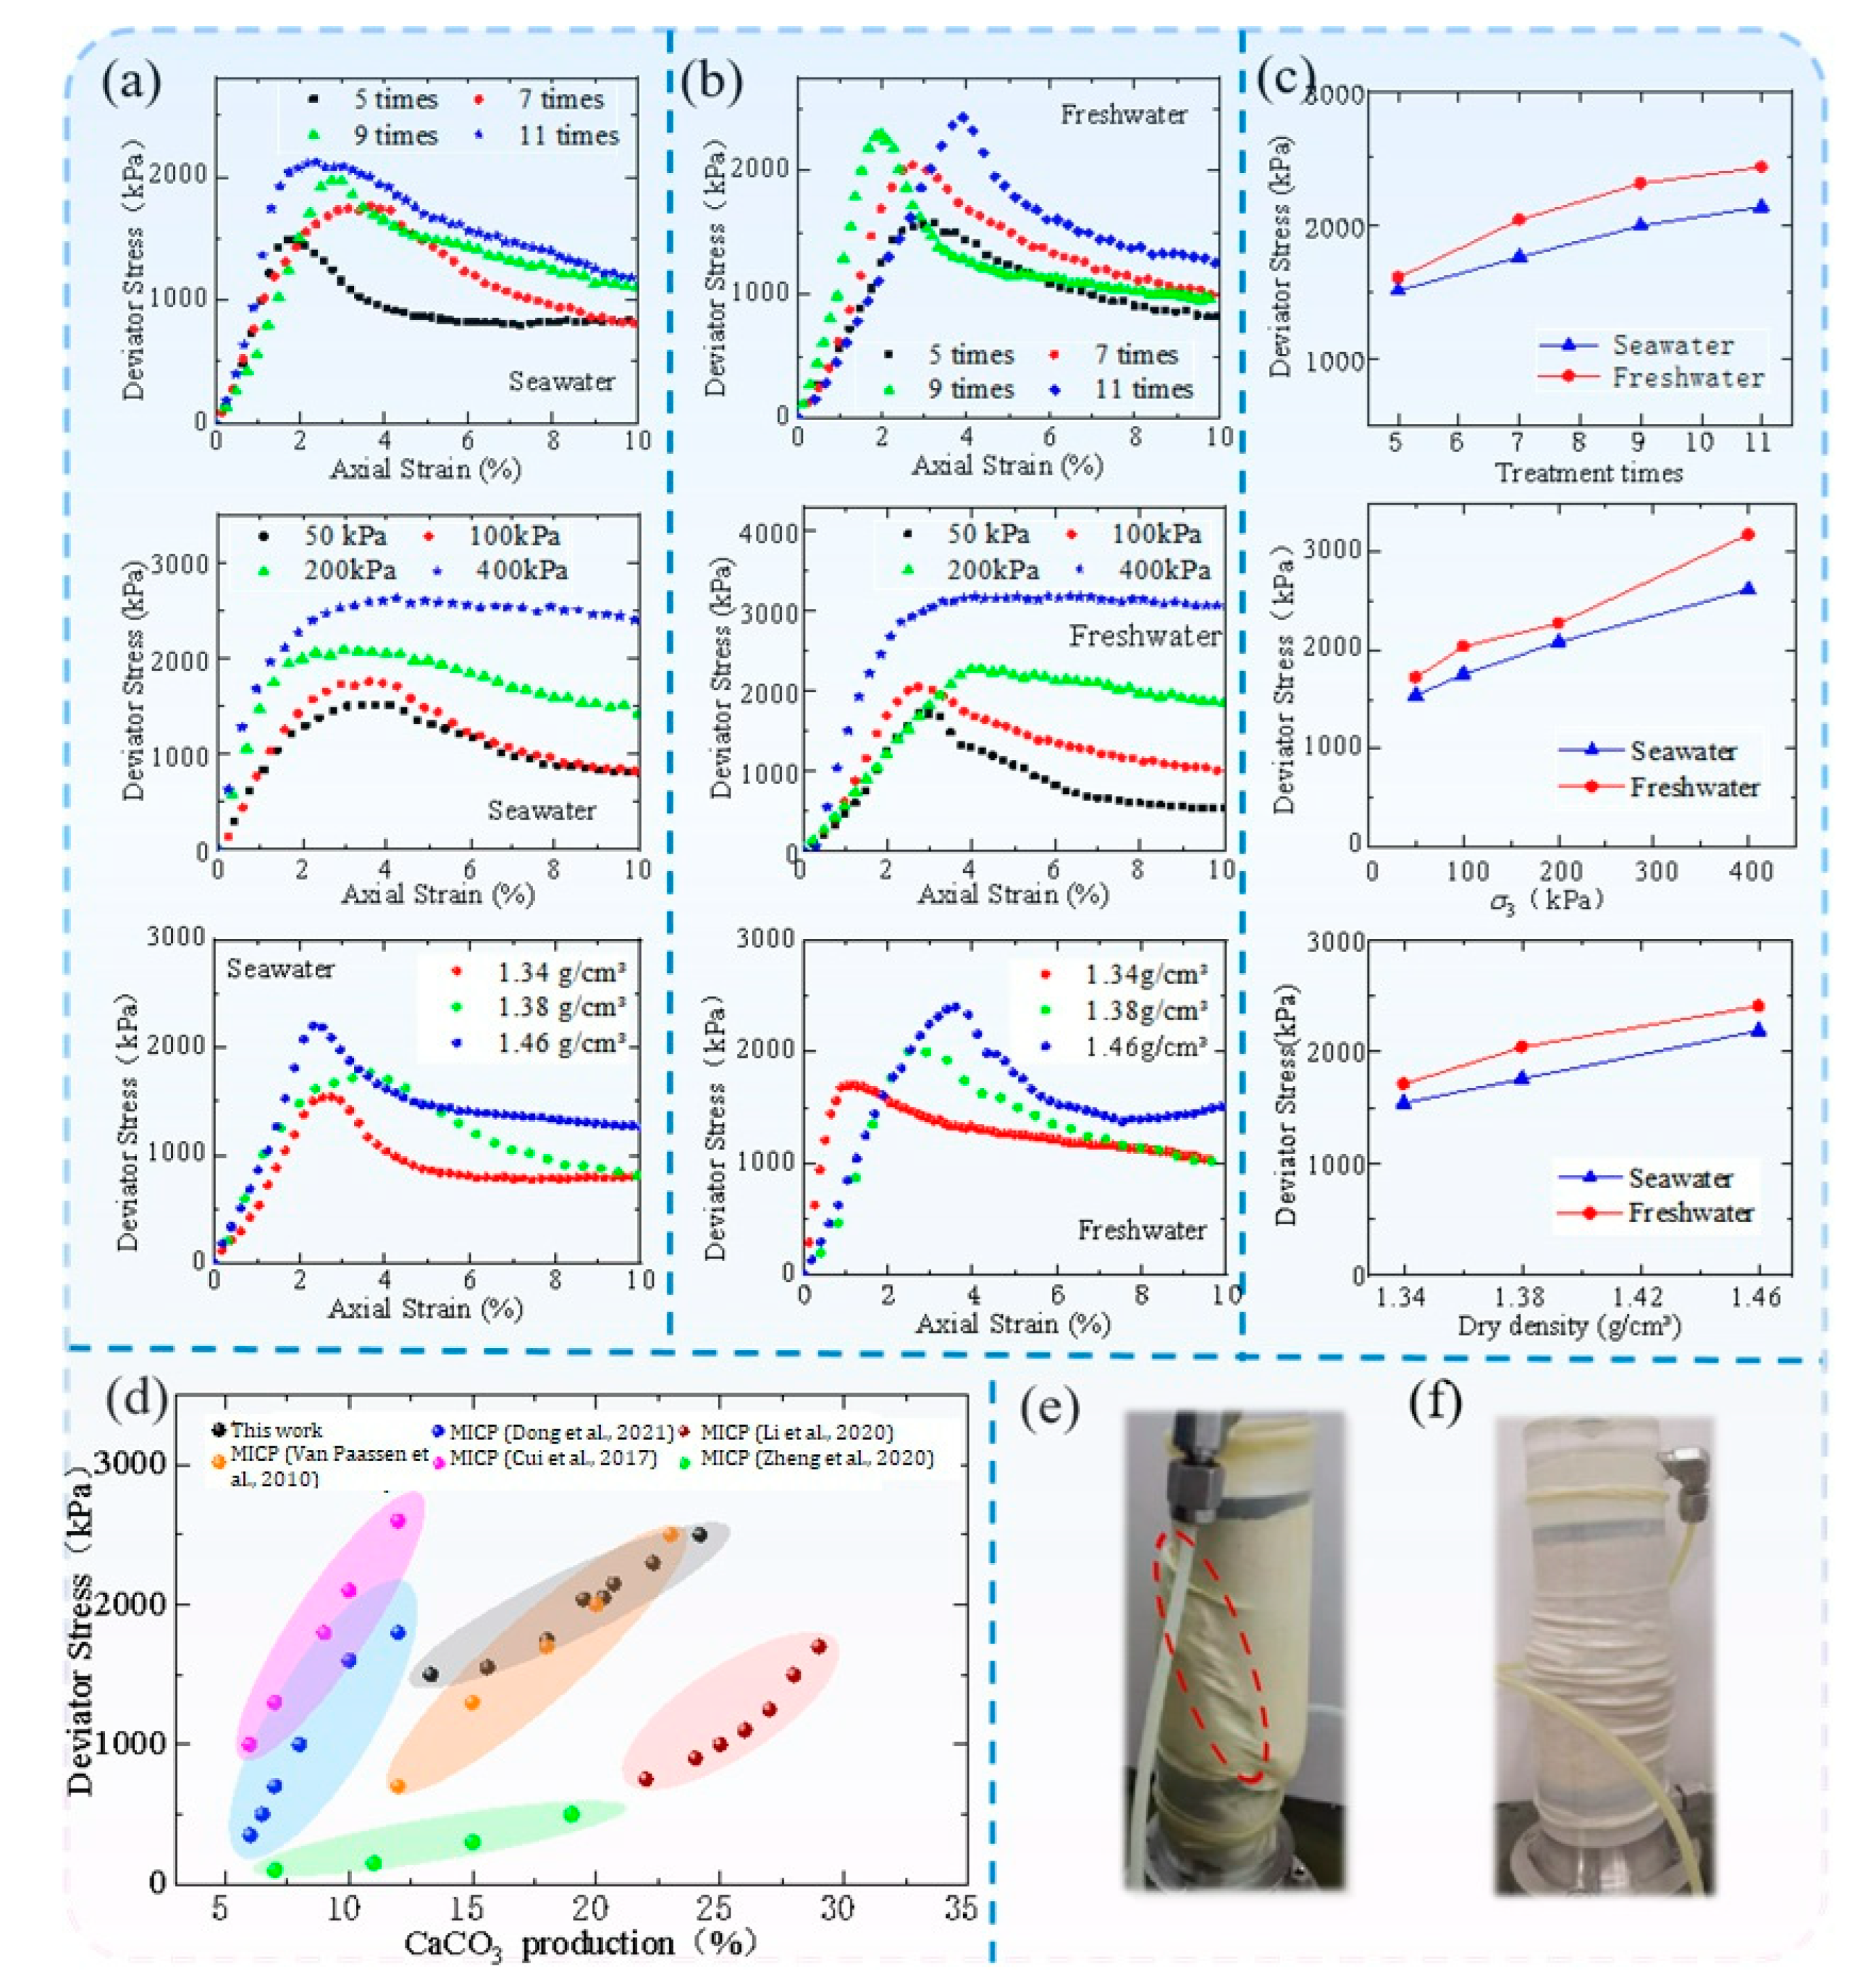
It was found that the failure strength of MICP-strengthened calcareous sand samples was affected by the degree of compaction, reinforcement effect, water environment and confining pressure. Under the same conditions, the curing effect of the freshwater environment sample was better than that of the seawater environment sample. The shear strength in the seawater environment reached more than 1.4 MPa, which meets the standard for practical application in marine engineering and shows that it is feasible to strengthen calcareous sand with MICP under seawater conditions.
(2)
The strength of the calcareous sand sample strengthened by MICP increased with the increase in the number of reinforcement days, confining pressure, and density. The best number of reinforcement days was 7 days after curing, at which time the strength of the sample increased the quickest, the bearing capacity was large, and the material loss was small. With the increase in confining pressure, the failure strain of the sand column increased continuously, the hardening effect was more evident, and the residual strength also increased. These results can effectively improve the bearing capacity of calcareous sand in marine engineering. The compactness had a clear effect on the strength of the added solid. With the increase in the sample density, although the strength of the seawater environment sample was small, the increase in strength was large, indicating that the MICP curing effect can be optimized by improving the compactness of the foundation in marine engineering.
(3)
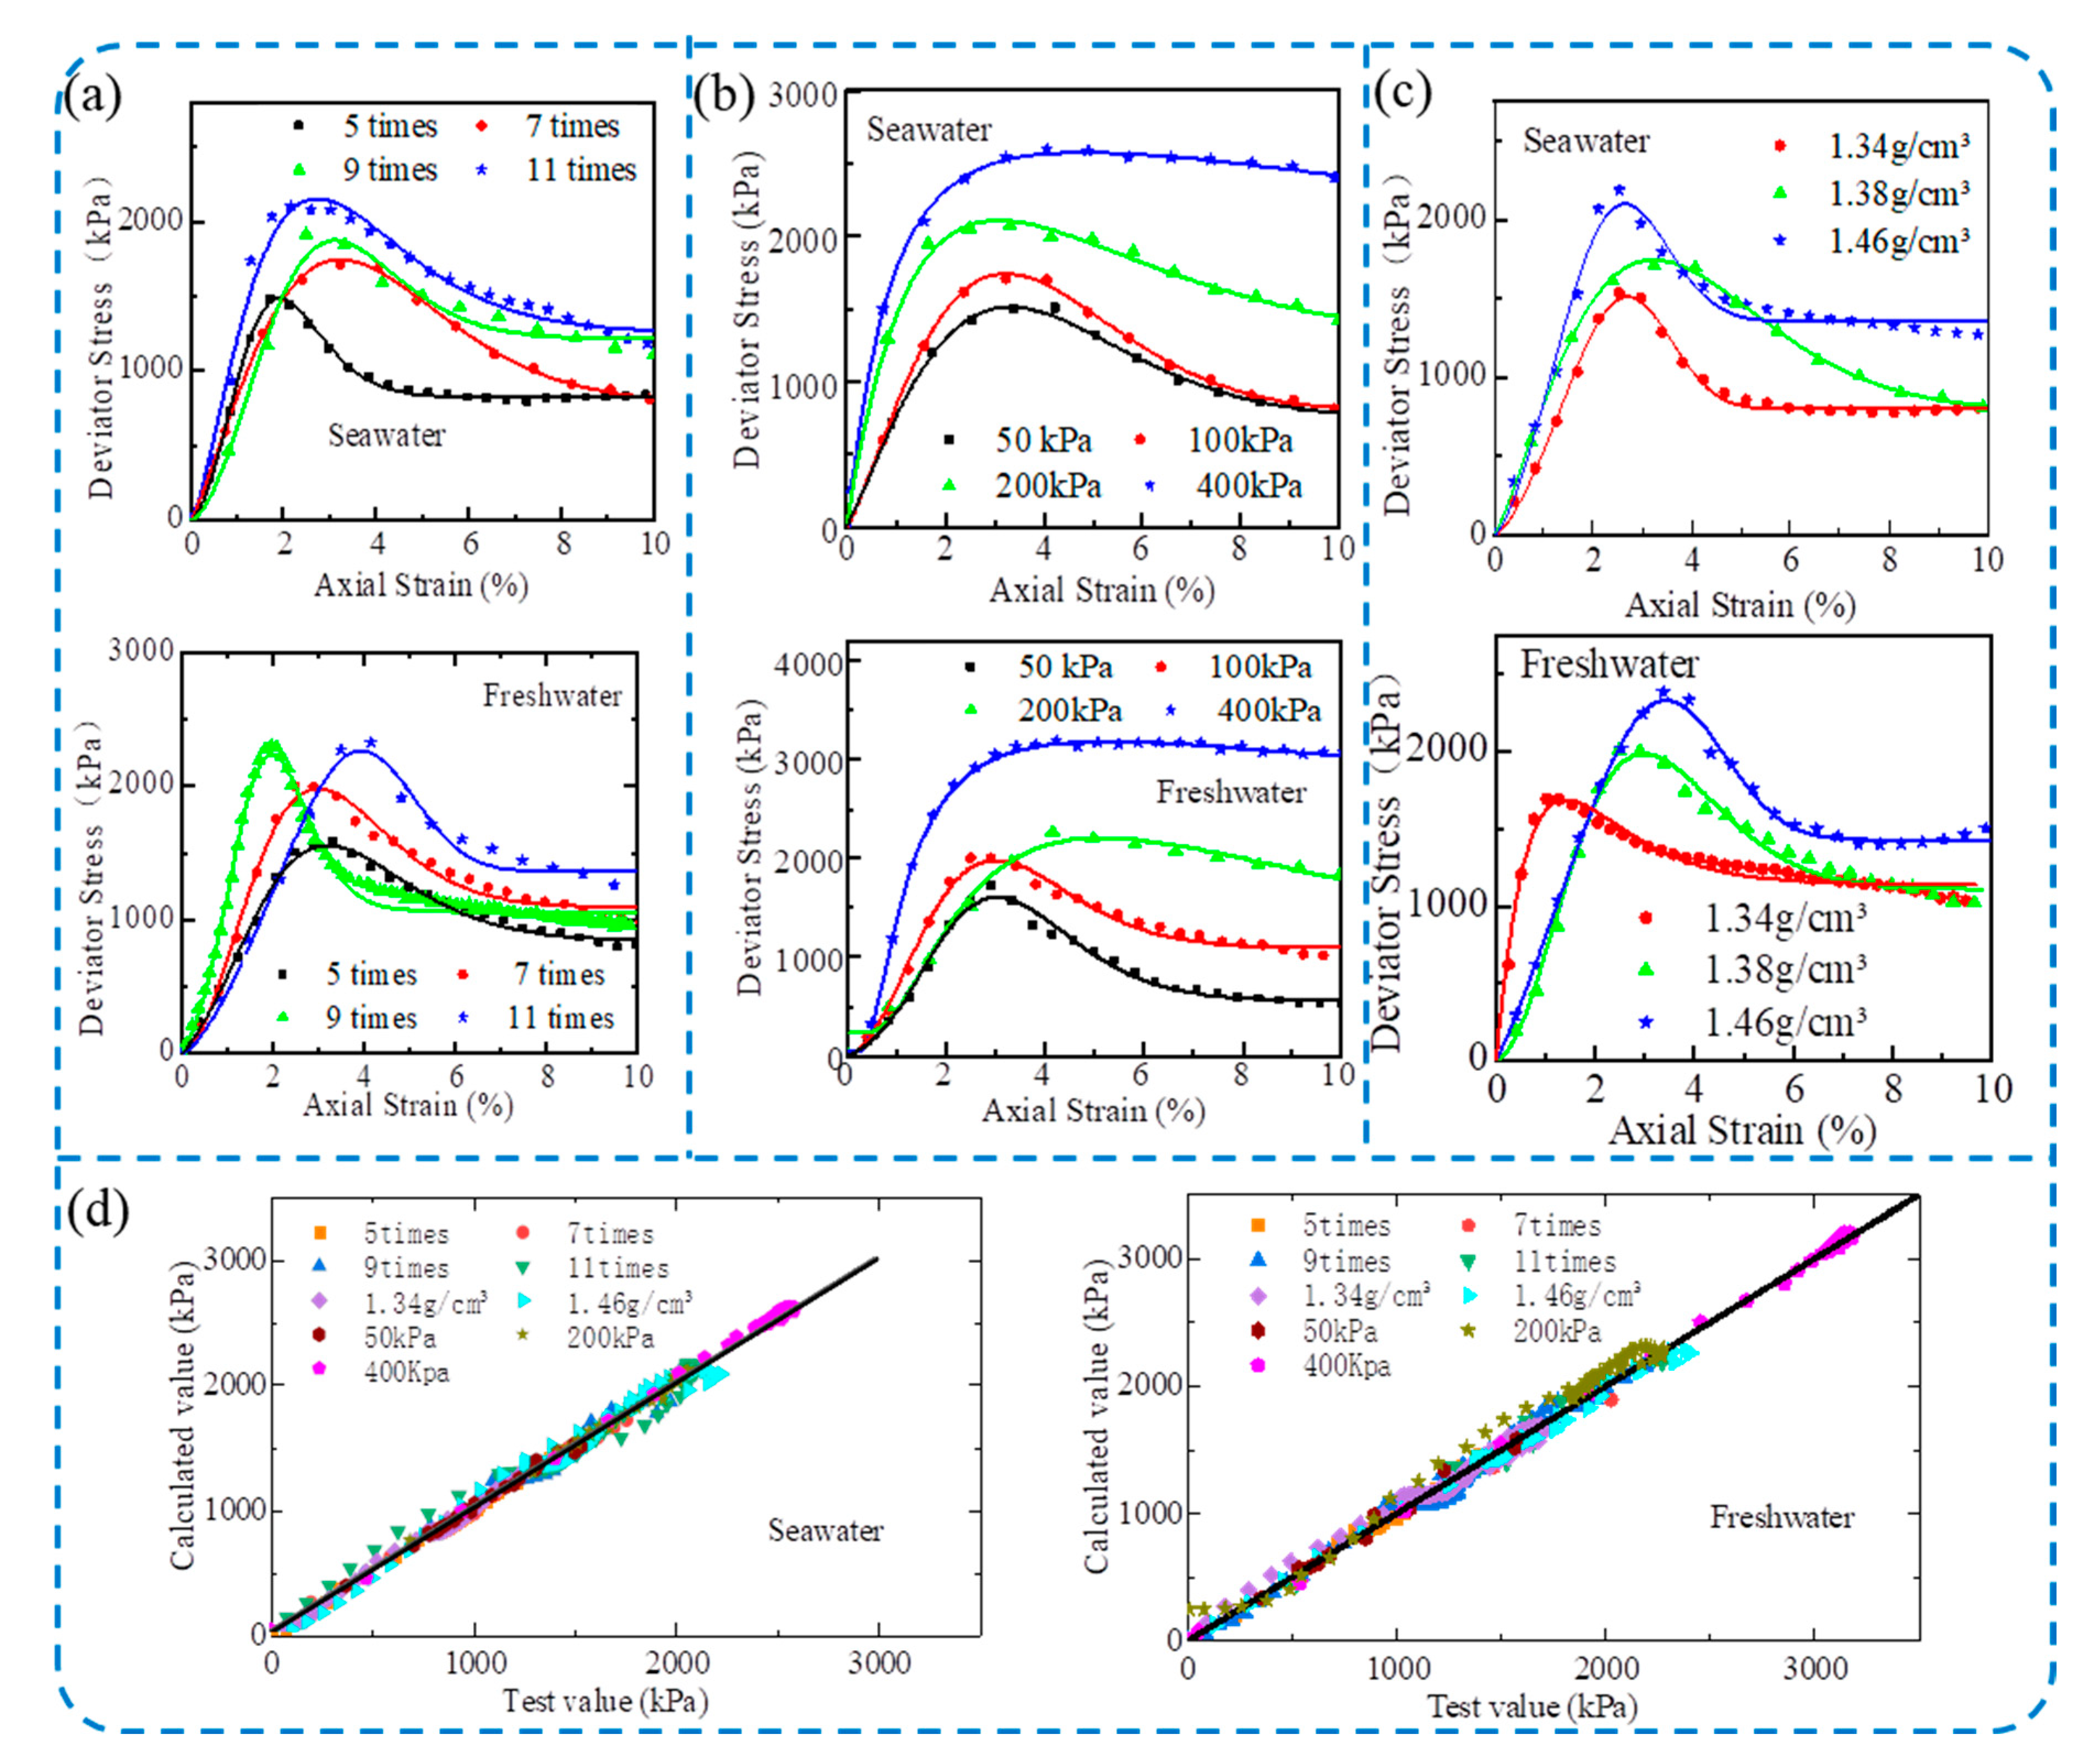
In this study, the CPE model was used to fit the triaxial experimental results of calcareous sand, and the overall fitting accuracy was high. This indicates that the model can accurately predict the stress–strain relationship during the loading process of the sample and show the process of calcareous sand sample damage, and thus can reasonably predict the application of calcareous sand in marine engineering.

5. Discussion

Although in the seawater environment, the use of microorganism-induced calcium carbonate precipitation to strengthen calcareous sand can achieve good results, there are still some unsolved technical problems that will be further studied in the follow-up work.
(1) In the process of MICP reinforcement, the by-product NH4+ is difficult to recover, and its large-scale application will have an impact on the environment. In order to eliminate the adverse effects of NH4+, the improvement of MICP technology will be the focus of future research.
Mohsenzadeh washed and recovered ammonium from soil through a two-stage treatment process and found that 86.8% of the ammonium ions could be recovered as high-purity struvite [39]. Keykha found that using zeolite suspension to pretreat sand is an effective method for preparing ammonium-free carbonate-producing bacteria. The negatively charged zeolite (natural aluminosilicate) can absorb NH4+ from the cement solution, bringing it to a standard level [40]. Gowthman and Yamamoto acid-dissolved bone meal (an excellent and low-cost source of calcium and inorganic phosphates) and injected it with urea and acid urease into a sand sample. It was found that the release of ammonium ions into the environment was reduced by about 50%, and the emission of toxic gaseous ammonia was reduced by about 90%, making it more environmentally friendly [41].
(2) Due to the high temperature, salinity and humidity in the coastal areas of tropical islands, coral reefs and beaches, it is also important to study the application and response of MICP-solidified calcareous sand in extreme environments.
Gowthman simulated the durability of MICP-reinforced slope soil under acid rain exposure through indoor experiments, and found that the corrosion rate mainly depends on the pH of acid rain and that lower pH conditions lead to higher corrosion rates. The intensity of acid rain also has a significant impact on the corrosion rate. The lower the transport rate, the more severe the corrosion [42]. Li found that MICP-cemented calcareous sand bodies in seawater environments have higher resistance to dry–wet cycles than those cemented in freshwater environments. Dry–wet cycles weaken the surface roughness of particles and the strength of interparticle cementation. Macroscopically, the strength and stiffness of MICP-cemented calcareous sand bodies decrease [43].

Author Contributions

Investigation, writing original draft preparation and data curation, X.Z.; writing review and editing, resources, data curation, project administration, and funding acquisition, Z.W.; formal analysis, X.C.; investigation, P.C.; visualization, L.C.; software, W.C. All authors have read and agreed to the published version of the manuscript.

Funding

This research was supported by the National Natural Science Foundation of China (Grant No. 42162024, 41602322), the Hainan Provincial Natural Science Foundation of China (Grant No. 421RC592), key research and development projects in Hainan Province (Grant No. ZDYF2017100), and Student innovation project of Yazhou Bay Innovation Institute of Hainan Tropical Ocean University (Grant No. 2022CXYXSCXXM06).

Informed Consent Statement

Written informed consent has been obtained from the patient(s) to publish this paper.

Data Availability Statement

The data used during the study are available from the first author and corresponding author by request.

Conflicts of Interest

The authors declare no conflict of interest.

References

  1. Xiao, P.; Liu, H.L.; Xiao, Y.; Stuedlein, A.W.; Evans, T.M. Liquefaction resistance of bio-cemented calcareous sand. Soil Dyn. Earthq. Eng. 2018, 107, 9–19. [Google Scholar] [CrossRef]
  2. Wang, X.Z.; Weng, Y.L.; Wei, H.Z.; Meng, Q.S.; Hu, M.J. Particle obstruction and crushing of dredged calcareous soil in the Nansha Islands, South China Sea. Eng. Geol. 2019, 261, 105274. [Google Scholar] [CrossRef]
  3. Qin, Y.; Yao, T.; Wang, R.; Zhu, C.Q.; Meng, Q.S. Analysis of high-pressure consolidation deformation of calcareous sediment based on particle breakage. Rock Soil Mech. 2014, 35, 3123–3128. [Google Scholar] [CrossRef]
  4. Shahnazari, H.; Rezvani, R. Effective parameters for the particle breakage of calcareous sands: An experimental study. Eng. Geol. 2013, 159, 98–105. [Google Scholar] [CrossRef]
  5. Li, X.; Liu, J.K. One-dimensional compression feature and particle crushability behavior of dry calcareous sand considering fine-grained soil content and relative compaction. Bull. Eng. Geol. Environ. 2021, 80, 4049–4065. [Google Scholar] [CrossRef]
  6. Liu, L.; Liu, H.A.; Stuedlein, A.W.; Evans, T.M.; Xiao, Y. Strength, stiffness, and microstructure characteristics of biocemented calcareous sand. Can. Geotech. J. 2019, 56, 1502–1513. [Google Scholar] [CrossRef]
  7. Xiao, Y.; Stuedlein, A.W.; Xiao, Y.; Ran, J.Y.; Evans, T.M.; Cheng, L.; Liu, H.L.; van Paassen, L.A.; Chu, J. Effect of Particle Shape on Strength and Stiffness of Biocemented Glass Beads. Am. Soc. Civ. Eng. 2019, 145, 06019016. [Google Scholar] [CrossRef]
  8. Bu, C.M.; Lu, X.Y.; Zhu, D.X.; Liu, L.; Sun, Y.; Wu, Q.T.; Zhang, W.T.; Wei, Q.K. Soil improvement by microbially induced calcite precipitation (MICP): A review about mineralization mechanism, factors, and soil properties. Arab. J. Geosci. 2022, 15, 863. [Google Scholar] [CrossRef]
  9. Qian, C.X.; Wang, X.; Yu, X.N. Research and Application Development of Microbe Cement. J. Mater. Eng. 2015, 43, 92–103. [Google Scholar] [CrossRef]
  10. Xiao, Y.; Stuedlein, A.W.; Pan, Z.Y.; Liu, H.L.; Matthew Evans, T.; He, X.; Lin, H.; Chu, J.; van Paassen, L.A. Toe-Bearing Capacity of Precast Concrete Piles through Biogrouting Improvement. J. Geotech. Geoenviron. Eng. 2020, 146, 06020026. [Google Scholar] [CrossRef]
  11. Zamani, A.; Montoya, B.M.; Gabr, M.A. Investigating challenges of in situ delivery of microbial induced calcium carbonate precipitation (MICP) in fine-grain sands and silty sand. J. Can. Geotech. J. 2019, 56, 1889–1900. [Google Scholar] [CrossRef]
  12. Karimian, A.; Hassanlourad, M. Mechanical behaviour of MICP-treated silty sand. Bull. Eng. Geol. Environ. 2022, 81, 285. [Google Scholar] [CrossRef]
  13. Kannan, K.; Bindu, J.; Vinod, P. Engineering behaviour of MICP treated marine clays. Mar. Georesources Geotechnol. 2020, 38, 761–769. [Google Scholar] [CrossRef]
  14. Tian, Z.; Tian, Z.F.; Tang, X.W.; Li, J.; Xiu, Z.L.; Xue, Z.J. Improving settlement and reinforcement uniformity of marine clay in electro-osmotic consolidation using microbially induced carbonate precipitation. Bull. Eng. Geol. Environ. 2021, 80, 6457–6471. [Google Scholar] [CrossRef]
  15. Islam, M.T.; Chittoori, B.C.S.; Burbank, M. Evaluating the applicability of biostimulated calcium carbonate precipitation to stabilize clayey soils. J. Mater. Civ. Eng. 2020, 32, 04019369. [Google Scholar] [CrossRef]
  16. Montoya, B.; DeJong, J.T. Stress-Strain Behavior of Sands Cemented by Microbially Induced Calcite Precipitation. J. Geotech. Geoenviron. Eng. 2015, 141, 04015019. [Google Scholar] [CrossRef]
  17. Peng, J.; Tian, Y.M.; Yang, J.G. Experiments of coral sand reinforcement using MICP in seawater environment. Adv. Sci. Technol. Water Resour. 2019, 39, 58–62. [Google Scholar] [CrossRef]
  18. Dong, B.W.; Liu, S.Y.; Yu, J.; Xiao, Y.; Tu, B.X. Evaluation of the effect of natural seawater strengthening calcareous sand based on MICP. Rock Soil Mech. 2021, 42, 1104–1114. [Google Scholar] [CrossRef]
  19. Gao, X.Y. Study on Microbial-Induced Struvite Solidification of Coral sand in High Salt Environment. Master’s Thesis, Huaqiao University, Quanzhou, China, 2020. [Google Scholar]
  20. Cheng, L.; Shahin, M.A.; Cord-Ruwisch, R. Bio-cementation of sandy soil using microbially induced carbonate precipitation for marine environments. Géotechnique 2014, 64, 1010–1013. [Google Scholar] [CrossRef]
  21. Yao, D.F.; Wu, J.; Wang, G.W.; Wang, P.B.; Zheng, J.J.; Yan, J.Y.; Xu, L.; Yan, Y.J. Effect of wool fiber addition on the reinforcement of loose sands by microbially induced carbonate precipitation (MICP): Mechanical property and underlying mechanism. Acta Geotech. 2021, 16, 1401–1416. [Google Scholar] [CrossRef]
  22. Fang, X.W.; Yang, Y.; Chen, Z.; Liu, H.L.; Xiao, Y.; Shen, C.N. Influence of Fiber Content and Length on Engineering Properties of MICP-Treated Coral Sand. Geomicrobiol. J. 2020, 37, 582–594. [Google Scholar] [CrossRef]
  23. Xiao, Y.; He, X.; Evans, T.M.; Stuedlein, A.W.; Liu, H.L. Unconfined Compressive and Splitting Tensile Strength of Basalt Fiber-Reinforced Biocemented Sand. Am. Soc. Civ. Eng. 2019, 145, 04019048. [Google Scholar] [CrossRef]
  24. Xiao, Y.; Chen, H.; Stuedlein, A.W.; Evans, T.M.; Chu, J.; Cheng, L.; Jiang, N.J.; Lin, L.; Liu, H.L.; Aboel-Naga, H.M. Restraint of P-article Breakage by Biotreatment Method. Am. Soc. Civ. Eng. 2020, 145, 04020123. [Google Scholar] [CrossRef]
  25. Wang, R.; Pan, X.H.; Tang, C.S.; Lu, C.; Wang, D.L.; Dong, Z.H.; Shi, B. Dynamic behaviors of MICP and fiber-treated calcareous sand under dynamic triaxial testing. Rock Soil Mech. 2022, 43, 2643–2654. [Google Scholar] [CrossRef]
  26. Yin, L.Y.; Tang, C.S.; Zhang, L. Experimental Study on Mechanical Behavior of Micp-fiber Reinforce Treated Calcareous Sand. Geol. J. China Univ. 2021, 27, 679–686. [Google Scholar] [CrossRef]
  27. Wang, Y.J.; Jiang, N.J.; Han, X.L.; Liu, K.W.; Du, Y.J. Biochemical, Strength and Erosional Characteristics of Coral Sand Treated by Bio-Stimulated Microbial Induced Calcite Precipitation. Acta Geotech. 2022, 17, 4217–4229. [Google Scholar] [CrossRef]
  28. Dubey, A.A.; Jack, H.P.; Ravi, K.; Dhami, N.K.; Mukherjee, A. Biopolymer-biocement composite treatment for stabilisation of soil against both current and wave erosion. Acta Geotech. 2022, 17, 5391–5410. [Google Scholar] [CrossRef]
  29. Liu, K.W.; Jiang, N.J.; Qin, J.D.; Wang, Y.J.; Tang, C.S.; Han, X.L. An experimental study of mitigating coastal sand dune erosion by microbial- and enzymatic-induced carbonate precipitation. Acta Geotech. 2021, 16, 467–480. [Google Scholar] [CrossRef]
  30. Kou, H.L.; Liu, J.H.; Zhang, P.; Wu, C.Z.; Ni, P.P.; Wang, D. Ecofriendly improvement of coastal calcareous sandy slope using recycled shredded coconut coir (RSC) and bio-cement. Acta Geotech. 2022, 17, 5375–5389. [Google Scholar] [CrossRef]
  31. Xiao, Y.; Deng, H.F.; Li, J.L.; Cheng, L.; Zhu, W.X. Study on the domestication of Sporosarcina pasteurii and strengthening effect of calcareous sand in seawater environment. Rock Soil Mech. 2022, 43, 395–404. [Google Scholar] [CrossRef]
  32. Yang, S.M.; Peng, J.; Wen, Z.L.; Liu, Z.M.; Leng, M.; Xu, P.X. Application of concentrated seawater as calcium source solution in sand reinforcement using MICP. Rock Soil Mech. 2021, 42, 746–754. [Google Scholar] [CrossRef]
  33. Rong, H.; Qian, C.X. Characterization of microbe cementitious materials. Chin. Sci. Bull. 2012, 57, 770–775. [Google Scholar] [CrossRef]
  34. Li, H.; Tang, C.S.; Liu, B.; Lu, C.; Cheng, Q.; Shi, B. Mechanical behavior of MICP-cemented calcareous sand in simulated seawater environment. Chin. J. Geotech. Eng. 2020, 42, 1931–1939. [Google Scholar] [CrossRef]
  35. Van Paassen, L.A.; Ghose, R.; van der Linden, T.J.M.; van der Star, W.R.L.; van Loosdrecht, M.C.M. Quantifying Biomediated Ground Improvement by Ureolysis: Large-Scale Biogrout Experiment. J. Geotech. Geoenviron. Eng. 2010, 136, 1721–1728. [Google Scholar] [CrossRef]
  36. Cui, M.J.; Zheng, J.J.; Zhang, R.J.; Lai, H.J.; Zhang, J. Influence of cementation level on the strength behaviour of bio-cemented sand. Acta Geotech. 2017, 12, 971–986. [Google Scholar] [CrossRef]
  37. Zheng, J.J.; Wu, C.C.; Song, Y.; Cui, M.J. Study of the strength test and strength dispersion of MICP-treated calcareous sand. J. Harbin Eng. Univ. 2020, 41, 250–256. [Google Scholar] [CrossRef]
  38. Wang, L.Q.; Lu, Z.G.; Shao, S.J. Composite power-exponential nonlinear model of rock and soil mass. Chin. J. Rock Mech. Eng. 2017, 36, 1269–1278. [Google Scholar] [CrossRef]
  39. Mohsenzadeh, A.; Afaki, E.; Gowthaman, S.; Nakashima, K.; Kawasaki, S.; Ebadi, T. A two-stage treatment process for the management of produced ammonium by-products in ureolytic bio-cementation process. Int. J. Environ. Sci. Technol. 2022, 19, 449–462. [Google Scholar] [CrossRef]
  40. Keykha, H.A.; Mohamadzadeh, H.; Asadi, A.; Kawasaki, S. Ammonium-Free Carbonate Producing Bacteria as an Ecofriendly Soil Biostabilizer. In Geotechnical Testing Journal; ASTM International: West Conshohocken, PA, USA, 2018; Volume 42. [Google Scholar] [CrossRef]
  41. Sivakumar, G.; Moeka, Y.; Kazunori, N.; Volodymyr, I.; Satoru, K. Calcium phosphate biocement using bone meal and acid urease: An eco-friendly approach for soil improvement. J. Clean. Prod. 2021, 319, 128782. [Google Scholar] [CrossRef]
  42. Sivakumar, G.; Kazunori, N.; Satoru, K. Durability analysis of bio-cemented slope soil under the exposure of acid rain. J. Soils Sediments 2021, 21, 2831–2844. [Google Scholar] [CrossRef]
  43. Li, Y.L.; Guo, Z.; Xu, Q.; Li, Y.J. Experimental study on dry and wet cycling of MICP cemented calcareous sand in seawater environment. J. Zhejiang Univ. 2022, 56, 1740–1749. [Google Scholar] [CrossRef]
Figure 1. Gradation and composition diagram of calcareous sand. (a) Grain grading curve of calcareous sand sample; (b) X-ray fluorescence spectrum analysis diagram of calcareous sand; (c) images of coral reefs and shells; (d) calcareous sand debris under body microscope with 4 times magnification.
Jmse 11 00819 g001
Figure 2. Schematic diagram of the reinforcement process for the MICP calcareous sand column.
Jmse 11 00819 g002
Figure 3. Variation diagram of calcium ion concentration, calcium carbonate content and urease activity. (a) Variation in Ca2+ concentration with increasing number of reinforcement days; (b) variation in calcium carbonate content with increasing number of reinforcement days; (c) urease activity with time.
Jmse 11 00819 g003
Figure 4. Scanning electron microscope images of samples and energy spectrum diagram. (a) Scanning electron microscope (5000 times magnification) image of seawater environment sample; (b) scanning electron microscope (10,000 times magnification) image of seawater environment sample; (c) energy spectrum of sediment in seawater environment; (d) scanning electron microscope (50,000 times magnification) image of deionized water environment sample; (e) scanning electron microscope (10,000 magnification) image of deionized water environment sample; (f) energy spectrum of sediment in deionized water environment.
Jmse 11 00819 g004
Figure 5. Stress–strain curve and failure mode diagram of sample. (a) Stress–strain curve of seawater environment sample; (b) stress–strain curve of samples in freshwater environment; (c) peak strength of samples under different conditions; (d) comparison diagram of calcium carbonate content–stress relationship [18,34,35,36,37]; (e) failure mode of MICP-strengthened specimen; (f) failure mode of the non-strengthened specimen.
Jmse 11 00819 g005
Figure 6. Fitting diagram and comparison diagram of stress–strain curve of sample. (a) Stress–strain fitting diagram of samples with number of reinforcement days; (b) stress–strain fitting diagram of samples under different confining pressures; (c) stress–strain fitting diagram of samples at different densities; (d) bias stress–fitting bias stress comparison chart.
Jmse 11 00819 g006
Table 1. Parameters of CPE model for stress–strain curve of calcareous sand column.
Water EnvironmentNumber of Days (d)Density (g/cm3)Cell Pressure (kPa)abmnk R 2
Freshwater51.38100314.60.693.21.2845.90.992
7490.20.432.51.431094.50.985
91482.31.274.631.421065.20.976
11450.50.0041.413.681368.60.977
71.343186.81.451.360.891135.20.966
1.46793.10.011.13.391430.10.995
1.3850340.50.733.761.28562.50.983
200479,7397.76−1.7−0.65246.10.999
4005672.31.42−0.23−1.242.570.998
Seawater51.381001112.80.983.121.4826.30.996
7834.90.151.171.59785.90.997
9303.50.422.851.471217.10.972
1111950.581.761.1512550.975
71.34529.20.021.423.4801.20.991
1.46818.90.051.372.861354.90.975
1.3850762.20.131.11.59746.10.995
20016850.691.20.831219.20.993
40076,4493.9−0.78−0.35245.390.998
Disclaimer/Publisher’s Note: The statements, opinions and data contained in all publications are solely those of the individual author(s) and contributor(s) and not of MDPI and/or the editor(s). MDPI and/or the editor(s) disclaim responsibility for any injury to people or property resulting from any ideas, methods, instructions or products referred to in the content.

