Article

Safe Design of a Hydrogen-Powered Ship: CFD Simulation on Hydrogen Leakage in the Fuel Cell Room

1
Wuhan Rules and Research Institute, China Classification Society, Wuhan 430022, China
2
Changjiang Ship Design Institute, Wuhan 430062, China
3
Australian Maritime College (AMC), College of Sciences and Engineering, University of Tasmania, Launceston, TAS 7248, Australia
*
Author to whom correspondence should be addressed.
J. Mar. Sci. Eng. 2023, 11(3), 651; https://doi.org/10.3390/jmse11030651
Submission received: 2 March 2023 / Revised: 16 March 2023 / Accepted: 17 March 2023 / Published: 20 March 2023

Abstract

:
Adopting proton exchange membrane fuel cells fuelled by hydrogen presents a promising solution for the shipping industry’s deep decarbonisation. However, the potential safety risks associated with hydrogen leakage pose a significant challenge to the development of hydrogen-powered ships. This study examines the safe design principles and leakage risks of the hydrogen gas supply system of China’s first newbuilt hydrogen-powered ship. This study utilises the computational fluid dynamics tool FLACS to analyse the hydrogen dispersion behaviour and concentration distributions in the hydrogen fuel cell room based on the ship’s parameters. This study predicts the flammable gas cloud and time points when gas monitoring points first reach the hydrogen volume concentrations of 0.8% and 1.6% in various leakage scenarios, including four different diameters (1, 3, 5, and 10 mm) and five different directions. This study’s findings indicate that smaller hydrogen pipeline diameters contribute to increased hydrogen safety. Specifically, in the hydrogen fuel cell room, a single-point leakage in a hydrogen pipeline with an inner diameter not exceeding 3 mm eliminates the possibility of flammable gas cloud explosions. Following a 10 mm leakage diameter, the hydrogen concentration in nearly all room positions reaches 4.0% within 6 s of leakage. While the leakage diameter does not impact the location of the monitoring point that first activates the hydrogen leak alarm and triggers an emergency hydrogen supply shutdown, the presence of obstructions near hydrogen detectors and the leakage direction can affect it. These insights provide guidance on the optimal locations for hydrogen detectors in the fuel cell room and the pipeline diameters on hydrogen gas supply systems, which can facilitate the safe design of hydrogen-powered ships.

1. Introduction

The International Maritime Organization (IMO) has set a decarbonisation strategy aimed at reducing the carbon intensity of all ships by at least 40% by 2030 and cutting total GHG emissions from global shipping by 50% (compared to 2008 levels) by 2050 [1,2]. To this end, various actions based on clean energy technologies should be implemented [3,4,5]. Hydrogen’s emission-free properties make it a promising alternative fuel for the shipping industry [6,7]. Among various hydrogen energy technologies, proton exchange membrane fuel cells (PEMFC) are promising due to their high energy efficiency and zero emissions [8,9,10,11,12,13].
Numerous research projects across Europe, North America, and Asia have yielded significant results in the marine fuel cell (FC) field, including developing industrialised marine FCs and practical demonstration projects [14,15]. Recent research efforts have focused on assessing the feasibility and reliability of ship power systems utilising FCs [16,17,18,19], energy management for FC-powered ships [20,21], and optimising ship power system design related to FCs, including hybrid systems [22,23,24,25,26]. These studies have examined various aspects of FC technology for use on ships, providing valuable insights for developing hydrogen-FC-powered ships. However, relatively little research has focused on hydrogen safety for FC ships. Hydrogen is highly hazardous due to its extreme flammability and explosiveness [27,28,29,30]. Previous research has identified several factors that impede the development and use of hydrogen FCs on ships, including inadequate risk management to mitigate the risks of leakage and the formation of flammable gas clouds (FGC) [31,32], as well as insufficient international regulations and standards for hydrogen supply chains [33]. The risk of hydrogen FGC explosions is anticipated to rise significantly in enclosed or confined spaces, including hydrogen gas supply systems (HGSS) located in the engine room or fuel cell room (FCR) [34,35,36].
Figure 1 presents the hydrogen leakage event tree in enclosed or confined spaces. Leakage, detection, ignition sources, and cloud formation are the initiating events in the development of hydrogen accidents. Therefore, investigating the evolution characteristics of these events is crucial for controlling hydrogen safety and is a key focus of research on hydrogen-powered ships [37]. For example, L.E. Klebanoff et al. analysed the safety properties of liquid hydrogen using the “SF-BREEZE” high-speed FC ferry as a case study. They emphasised preventing hydrogen fuel leaks [38]. Meanwhile, F. Li et al. conducted computational fluid dynamics (CFD) simulations on hydrogen leakage in cabins of the “SF-BREEZE”, and the findings offered guidance for the general arrangement of FC ships [39]. Similarly, Mao, X et al. predicted overpressure and high temperature after hydrogen explosions caused by FGC in different rooms of the “SF-BREEZE” ferry using ANSYS fluent software. They found that the hydrogen FCR was most affected [40]. Park, S et al. compared the explosion overpressure caused by hydrogen and hydrocarbon-based gases in ship ventilation pipes. They found that hydrogen caused higher overpressure [41]. Yuan, Y et al. investigated the effectiveness of a fine water mist in suppressing the temperature of hydrogen jet fires on FC ships using the CFD software FDS. They found that while the mist could reduce the fire field temperature, it did not extinguish the fires [42]. The IMO issued the Interim Guidelines for the Safety of Ships Using Fuel Cell Power Installations in 2022 to meet the growing demand for FC ships [43]. The guidelines provided safety design requirements for ships using FC installations but not for hydrogen storage and supply on ships. Chen, L. et al. calculated the minimum ventilation capacity for the hydrogen FCR on a ship under normal operating conditions based on IMO guidelines and IEC 60079-10-1:2020. Safe design measures were proposed to reduce the level of the hazardous area in the FCR [44]. Feng, Y. et al. used the CFD software FLACS to predict the dispersion distance of hydrogen FGC in a bunkering station on a cargo ship. The safety recommendations for the hydrogen bunkering operation were proposed based on the prediction [45].
Overall, previous studies have yet to provide detailed information about hydrogen piping systems and equipment in the FCR on ships powered by large-capacity hydrogen PEMFCs. Current studies have not accounted for various leakage diameters and directions, leading to incomplete leakage scenarios. Additionally, the dispersion and concentration of hydrogen in the FCR require more detailed investigation, including the detection time of hydrogen detectors at different locations. To address these gaps, this study uses the CFD software FLACS to investigate hydrogen safety in the FCR of a 560 kW hydrogen-PEMFC-powered ship. The following aspects regarding hydrogen leakage in the FCR were investigated:
  • The effect of leakage diameter on hydrogen concentration.
  • The optimal location for hydrogen detectors.
  • Safety design recommendations for future engineering applications of hydrogen-powered ships.
In this paper, Section 2 outlines the methodology. Section 3 presents the mathematical model and its validation. Section 4 discusses the results. Finally, Section 5 presents the conclusions.

2. Methodology

The study framework, presented in Figure 2, involves three stages. Firstly, the design philosophy of HGSS was analysed based on the function structure of the hydrogen fuel system and the safety requirements of IMO guidelines. This analysis helped to determine the hydrogen leakage scenarios and calculation parameters. Secondly, this study focused on the analysis of the theory of hydrogen leakage and dispersion, including the mathematical model of numerical calculation. The previous study results were used to validate the CFD simulation model, and the input parameters were established in the CFD model. Thirdly, the simulation results were used to analyse the impacts of various factors on hydrogen dispersion and concentration in the FCR. Based on the findings, safety design recommendations for the ships were proposed.

2.1. Research Object

The “San Xia Qing Zhou 1 (Three Gorges Hydrogen Boat 1)” is a catamaran passenger ship that is currently being constructed [14]. The ship uses hydrogen FCs as its primary power source and lithium batteries for energy storage. This study focuses on the safety analysis of FCR and HGSS, as their design directly impacts the safety of ships. Table 1 displays the main parameters of the ship. Figure 3 shows the general arrangement of the vessel, and Figure 4 illustrates the arrangement of the FCR.

2.1.1. Hydrogen Fuel System and Leakage Risk

The ship’s HGSS consists of four functional modules, namely hydrogen bunkering, storage, fuel supply, and hydrogen FCs, as depicted in Figure 5. During bunkering, compressed hydrogen gas is injected into cylinders with a pressure of 35 MPa. Control valves are installed on the pipelines to prevent hydrogen from entering the cylinders in case of an emergency. The storage system consists of 32 hydrogen cylinders with a pressure of 35 MPa, fixed with a metal frame and with a capacity of 240 kg. Before entering the PEMFCs, the hydrogen gas is reduced to 0.8 MPa from 35 MPa to meet the demand of the FCs [46]. The FCR contains eight FC modules of 70 kW each, enclosed in a box with an independent ventilation system.
Hydrogen leakage in the FCR may occur from the FC modules, valves, and pipe joints such as threaded or jacketed joints. Table 2 lists various reasons for the possible leakage of valve fittings and pipe components in the hydrogen piping systems [47].
Under normal operations, valves and pipe joints do not release hydrogen but may leak hydrogen gas during accidents, as indicated in Table 2. Compared to other alternative fuel supply systems, the HGSS has a higher probability of leakage due to high permeability, hydrogen embrittlement effects, and high pressure [48]. Furthermore, using more valves in the hydrogen supply system increases the likelihood of hydrogen leakage.

2.1.2. Design of Fuel Cell Room

The IMO guidelines proposed design concepts for FCR and piping arrangement for FC power systems. However, these concepts are based on the amount of fuel leakage under normal operating conditions and do not consider accidental hydrogen leakage, as shown in Table 2.
According to the IMO guidelines, the design scheme of the hydrogen-fuelled ship should assess the degree of hazardous areas in the FCR following IEC 60079-10-1:2020. The FC modules should be designed to be airtight, and the mechanical exhaust vents of the cabinets should be arranged in safe areas [44]. The FCRs in “San Xia Qing Zhou 1” were designed to be non-hazardous areas based on the IMO guidelines and the IEC standard. For this purpose, a minimum ventilation rate of 90 air changes per h is required [44]. Increasing the ventilation rate further, in relation to the potential release rates, can lower the probability of an explosive gas atmosphere. However, this comes at the cost of increased electricity consumption and noise levels. Ventilation systems of natural intake and mechanical extraction (5000 m3/h) were used in each FCR. The working pressure of the hydrogen system was described in Section 2.1.1, and the pipeline diameter is 10 mm.
Considering the high risk of hydrogen leakage [47], the double-wall piping type was used to reduce the probability of hydrogen leakage in the FCR. The probability of hydrogen leakage was not studied because this work focuses on the consequences of hydrogen leakage.

2.2. Parameters and Leakage Scenarios

2.2.1. Parameters of Hydrogen Fuel Cell Room

The simulation object selected for this study was one of the FCRs on the port side. The boundary conditions for hydrogen leakage scenarios in the FCR are presented in Table 3. The dimensions of the selected FCR are 6500 mm in length, 3200 mm in width, and 2000 mm in height. The equipment size parameters provided by the shipyard were used for the simulation. The equipment, which had a roughly cuboid shape, was modelled as a cuboid in the simulation. The dimensions and positions of the equipment in the FCR are displayed in Table 4.

2.2.2. Hydrogen Leakage Scenarios

Various factors impact the hydrogen dispersion behaviour in an enclosed space, such as release pressure, leakage flow rate [49], leakage diameter [50], ventilation conditions, direction of leakage, and obstacles in the space [51,52]. To achieve the research objective, different leakage diameters and directions were included in the scenarios. The following hypotheses were established for this study: (1) the leaked hydrogen was not ignited, (2) the hydrogen was released with a constant pressure of 0.8MPa for 100 s, which was longer than the time required for the concentration to exceed 1.6%, (3) circular leakage holes with diameters of 10%, 30%, 50%, and 100% of the hydrogen pipeline diameter (10 mm) were considered, (4) the scenario of vertical downward leakage was excluded due to the presence of a valves module with a fixed base plank at the bottom of the FCR, and (5) five directions of leakage were considered, resulting in twenty-four hydrogen leakage scenarios, as presented in Table 5.

3. Mathematical Model and Model Validation

FLACS-Hydrogen (v10.6), a specialised computational fluid dynamics (CFD) tool for hydrogen safety engineering, was used for numerical simulations. It can be used for simulating hydrogen dispersion and assessing the potential FGC risk in various leakage scenarios. FLACS utilises the porosity distributed resistance theory to model complex geometrical features, such as porosities for a control volume on relatively coarse meshes, which is a unique feature distinguishing it from other CFD software. The compressible Navier–Stokes equations are solved on a three-dimensional grid using a finite volume method in FLACS. The standard k-Ɛ model for turbulence is utilised with some modifications, which are turbulence generation behind sub-grid objects and turbulent wall functions [53]. The steps performed during the modelling phase are summarised as follows:
  • A computational geometry model was built using the equipment dimensions and locations in the FCR.
  • Grid sizes of the FCR were selected for computational geometry model.
  • The simulation was performed using scenarios that involved a combination of leakage parameters and computational geometry models.

3.1. Mathematical Model

The mathematical model utilised in this study includes the continuity, motion, energy, concentration transfer, and ideal gas state equations. These equations have been discussed in detail in previous studies [54,55]. The main governing equations are briefly outlined.
The mass conservation equation:
t ( β v ρ ) + x j ( β j ρ u j ) = 0
where β v is the volume porosity; β j is the area porosities; ρ is the gas density; and x j and u j denote the spatial coordinate variable and velocity component in j -th direction, respectively.
The transportation equations for the momentum, enthalpy, and mass fraction of the fuel and mixture fraction are described as follows:
t ( β v ρ u i ) + x j ( β j ρ u i u j ) = β v p x i + x j ( β j σ i j ) + F o , i + β v F w , i + β v ( ρ ρ 0 ) g i
t ( β v ρ h ) + x j ( β j ρ u j h ) = x j ( β j μ eff σ h h x j ) + β v D p D t + Q ˙ V
t ( β v ρ Y fuel ) + x j ( β j ρ u j Y fuel ) = x j ( β j μ eff σ fuel Y fuel x j ) + R fuel
where β v is the volume porosity, ρ is the gas density, p is the pressure, h is the enthalpy, Q ˙ is the heat flow rate, V is the volume, x j is the j -coordinate spatial variable, β j is the area porosity, and u i and u j are the velocity components in the i and j directions, respectively. σ i j is the stress tensor, σ fuel and σ h are the Prandtl–Schmidt numbers of fuel and enthalpy, respectively, both at 0.7, μ eff is the effective viscosity of fuel, F o , i is the flow resistance due to sub-grid obstructions, F w , i is the flow resistance produced by friction of the wall, Y fuel is the fuel mass fraction, and R fuel is the fuel reaction rate.
The gas turbulence in FLACS-Hydrogen was modelled according to the standard k - ε model to obtain the turbulent kinetic energy and its dissipation. The Reynolds stress tensor was modelled using the eddy viscosity based on the eddy viscosity assumption.
Classical k - ε model is used to deal with turbulence, which involves two transport equations: one for turbulent kinetic energy and one for dissipation of turbulent kinetic energy:
t ( β v ρ k ) + x j ( β j ρ u j k ) = x j ( β j μ eff σ h k x j ) + β v P k β v ρ ε
P k = G s + G w + G b + G o  
t ( β v ρ ε ) + x j ( β j ρ u j ε ) = x j ( β j μ eff σ ε ε x j ) + β v ( C 1 ε ε k P k ( 1 + C 3 ε R f ) ) C 2 ε β v ρ ε 2 k  
ρ u i u j ˜ = μ eff ( u i ˜ x j + u j ˜ x i ) ρ 2 3 k δ i j  
where k is the turbulent kinetic energy, ε is the dissipation of turbulent kinetic energy, P k is the overpressure, G s is the flow shear stress, G w is the wall shear stress, G b is the buoyancy, G o represent the sub grid objects, σ h and σ ε are the Prandtl numbers of turbulence for k and ε , given as 1.0 and 1.3, respectively, C 1 ε , C 2 ε , and C 3 ε are constants, taken as 1.44, 1.92, and 0.8, respectively, R f is the model for the buoyancy term, u i u j ˜ is the mean velocity in the i and j directions, and δ i j is the Kronecker delta function ( δ i j = 1 if i = j , otherwise δ i j = 0 ).

3.2. Model Validation

The accuracy and validity of hydrogen dispersion prediction by the CFD tool FLACS-Hydrogen were demonstrated through various validation techniques, including comparisons between experimental and numerically simulated concentrations. Additionally, some of the simulations were performed as blind predictions. The validation tests include experiments involving free jets of hydrogen [56], gas leak dispersion and subsequent explosions [53], and hydrogen gas leakage in confined spaces [37]. These simulations showed good agreement with experimental results for various scenarios of hydrogen release and dispersion. Sandia National Laboratories performed experiments to validate FLACS simulations of hydrogen release at a scaled warehouse facility, and good agreement was found between the simulation and experimental results [57,58]. Moen et al. summarised that the Standard k-ε turbulence model performed best in validating gas dispersion after accidental releases, particularly for hydrogen jet dispersion scenarios [59]. An analytical model was also established to predict gas flow behaviours in different hydrogen leakage scenarios, providing high accuracy compared to numerical simulations [60,61].
This study used the experimental work by Ji, H.W et al. to verify the accuracy of the hydrogen leakage simulation model. In their study, a volume of 11.484 m3 of enclosed spaces was built to test hydrogen leakage in the FC rooms [62]. Simulation of case 27 showed similar results to the experiment (Figure 6), with hydrogen concentration peaks of 10% and 3% in agreement. However, there were some differences in the time to reach the concentration, likely due to lag time of the hydrogen detectors. Overall, the agreement between predictions and experiments was considered sufficient to verify the model’s accuracy.

3.3. Grid Size

A numerical study of hydrogen leakage and dispersion demonstrated grid independence verification for core domain grid sizes of 0.1 m, 0.2 m, and 0.4 m for a 5 mm diameter release [63]. The study found that grid sizes of 0.1 m and 0.2 m were appropriate for the simulation, and in this study, a grid size of 0.1 m was chosen for achieving higher accuracy. The pseudo-source model (also known as notional nozzle) is used for simulating hydrogen releases from small orifices, to bypass the compute-intensive Mach disk zone next to the nozzle exit. The concept of the notional nozzle and sub-grid models in FLACS was validated by the experimental campaign for the second blind prediction study in the HySEA, supported by the European Union’s Horizon 2020 research and innovation programme [64]. The 3D model, grid sizes of the FCR, and the internal equipment are shown in Figure 7.

4. Results and Discussion

This section discusses the dispersion behaviour of hydrogen gas in scenarios 1 to 4, as presented in Table 5. Section 4.1 analyses the phenomenon of hydrogen gas dispersion within the FCR. Section 4.2 examines the impact of different leakage hole sizes on hydrogen gas concentration within the FCR. Section 4.3 analyses the arrangement of hydrogen detectors in scenarios 5 to 24, as presented in Table 5.
According to the IMO guidelines, this section considers the distribution of flammable hydrogen gas at the following three volume concentration values [43]:
  • 20% lower flammable limit (LFL) (volume concentration: 0.8%).
  • 40% LFL (volume concentration: 1.6%).
  • 100% LFL (volume concentration: 4.0%).
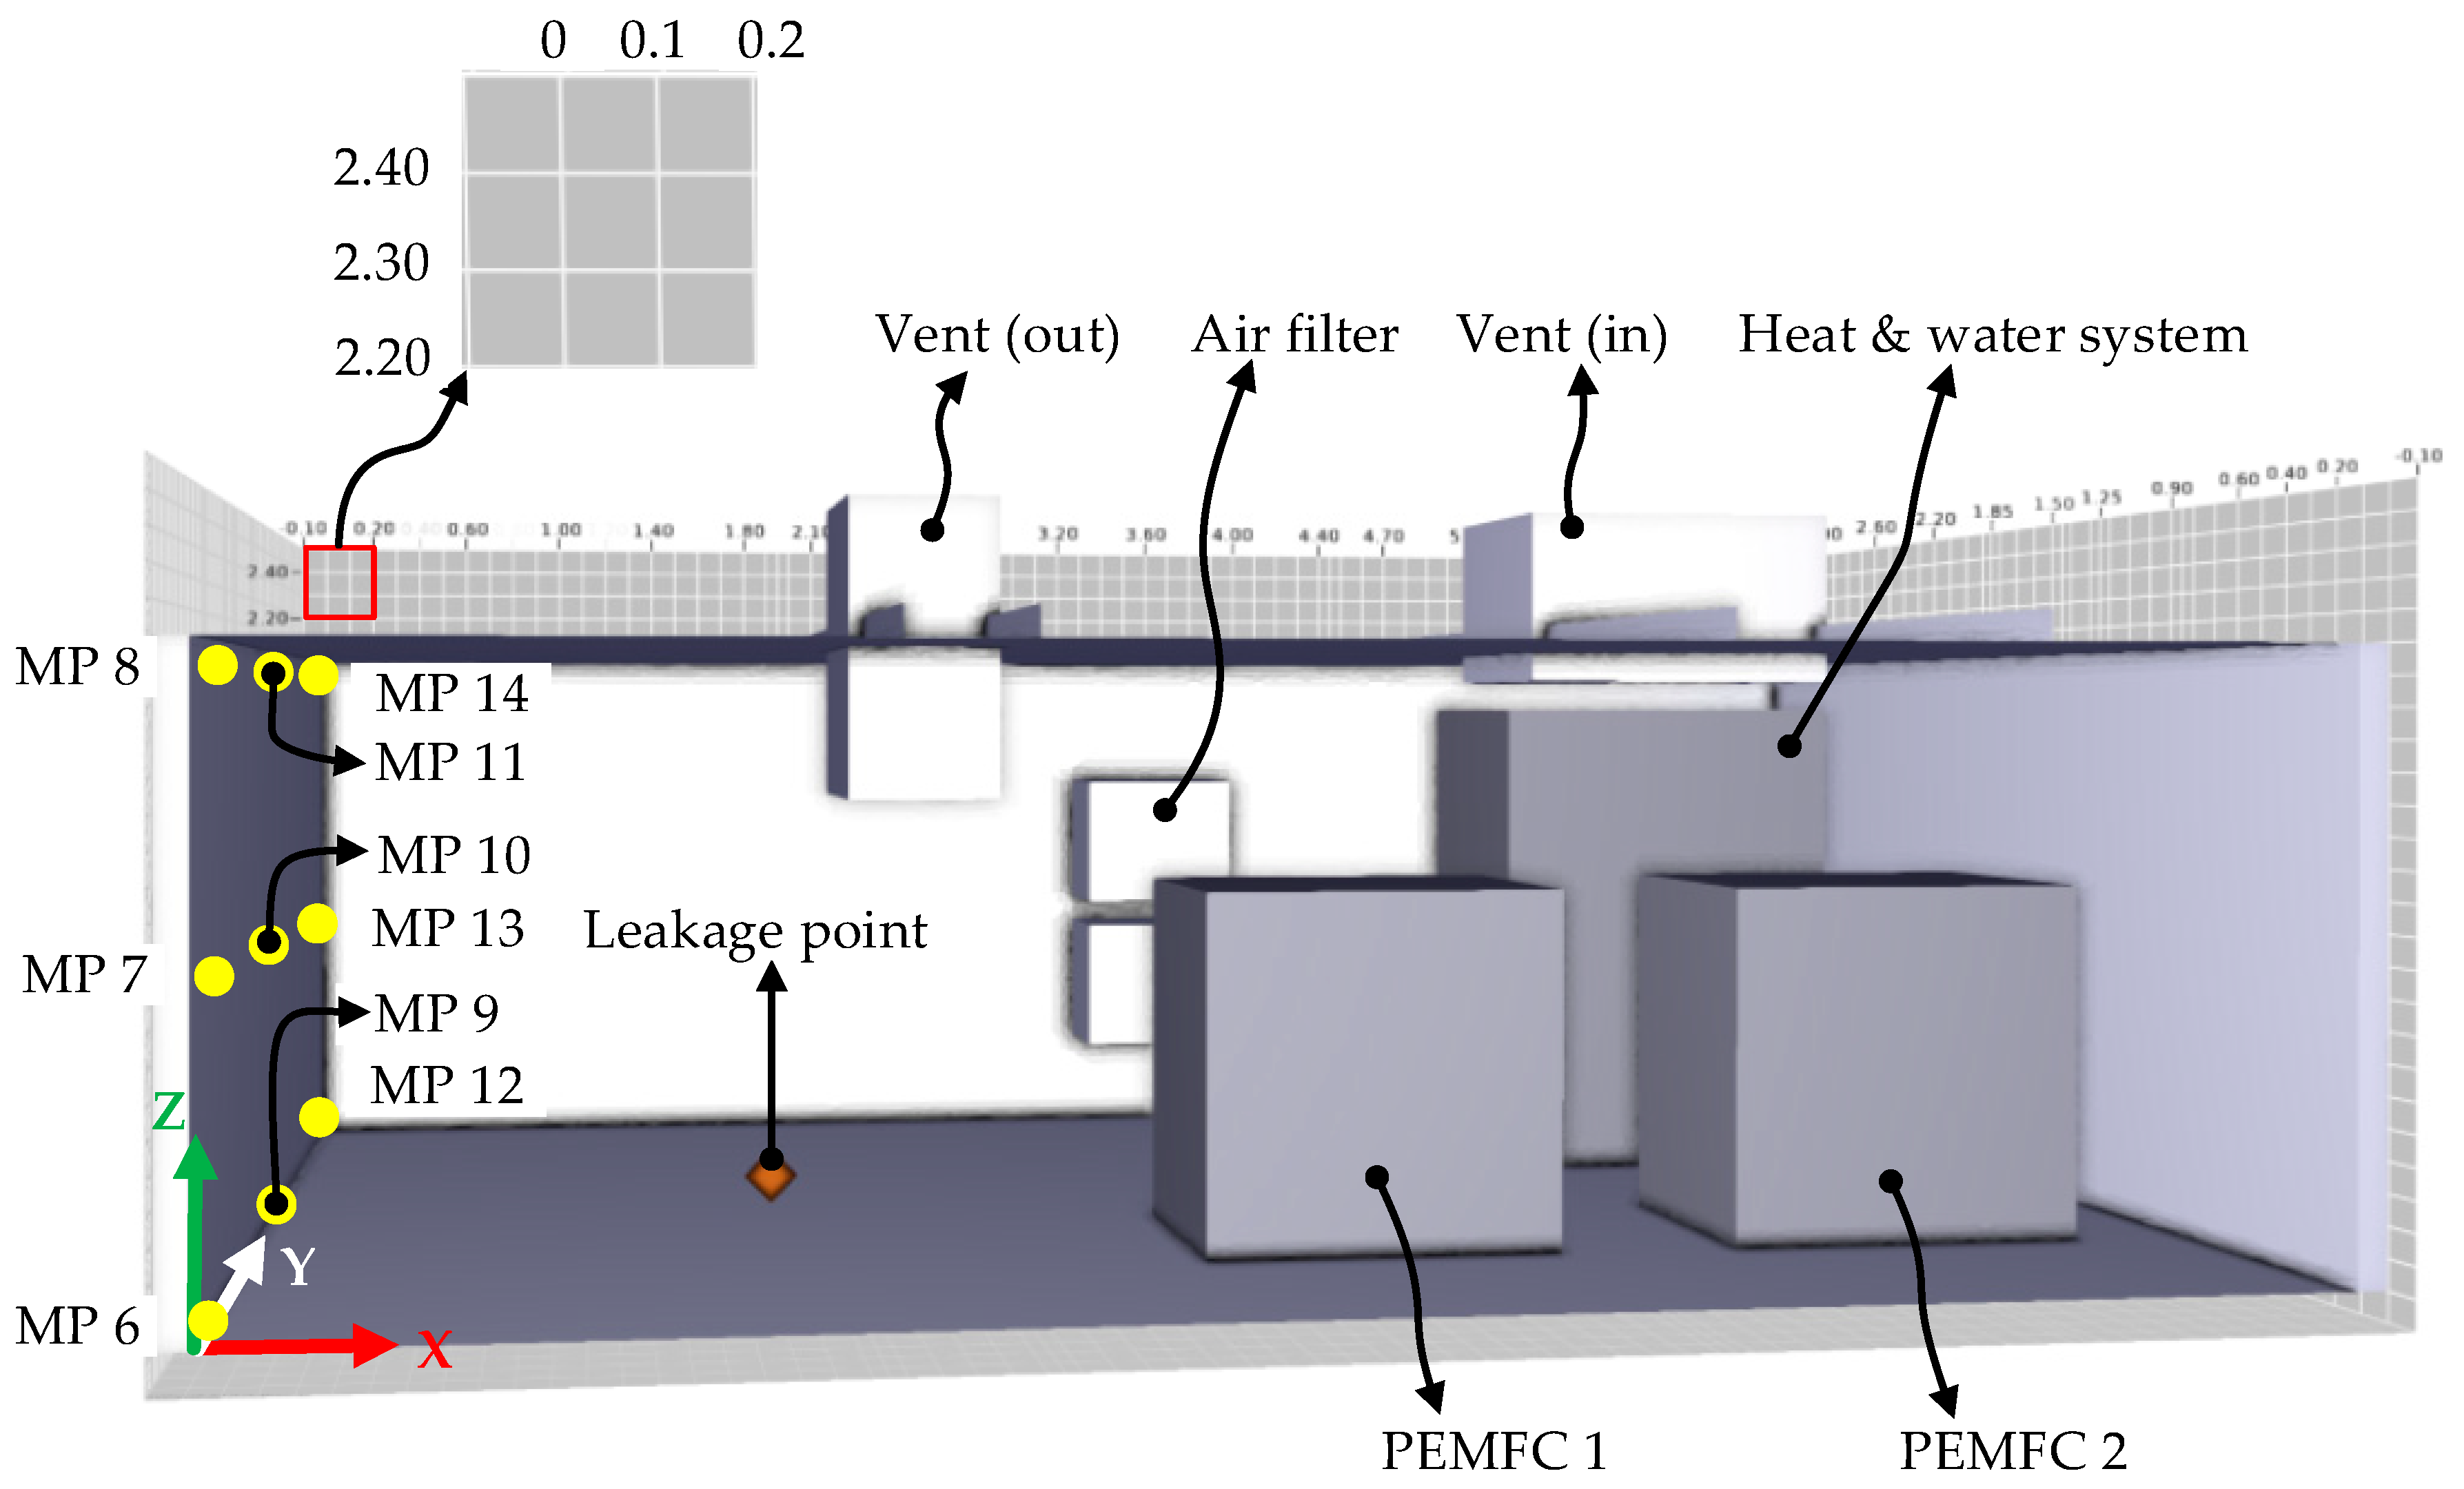
There are 32 gas monitoring points in the CFD model. These monitoring points are located at the ventilation inlet and outlet, equipment vertices, endpoints, and midpoints of each side of the room, and the centre positions of the wall surfaces except the bottom surface. Table 6 shows the coordinates of these monitoring points.

4.1. Hydrogen Gas Dispersion within the Fuel Cell Room

This section analyses the impact of different leakage hole sizes on hydrogen gas concentration within the FCR, focusing on scenarios 1 to 4 (with specific parameters outlined in 
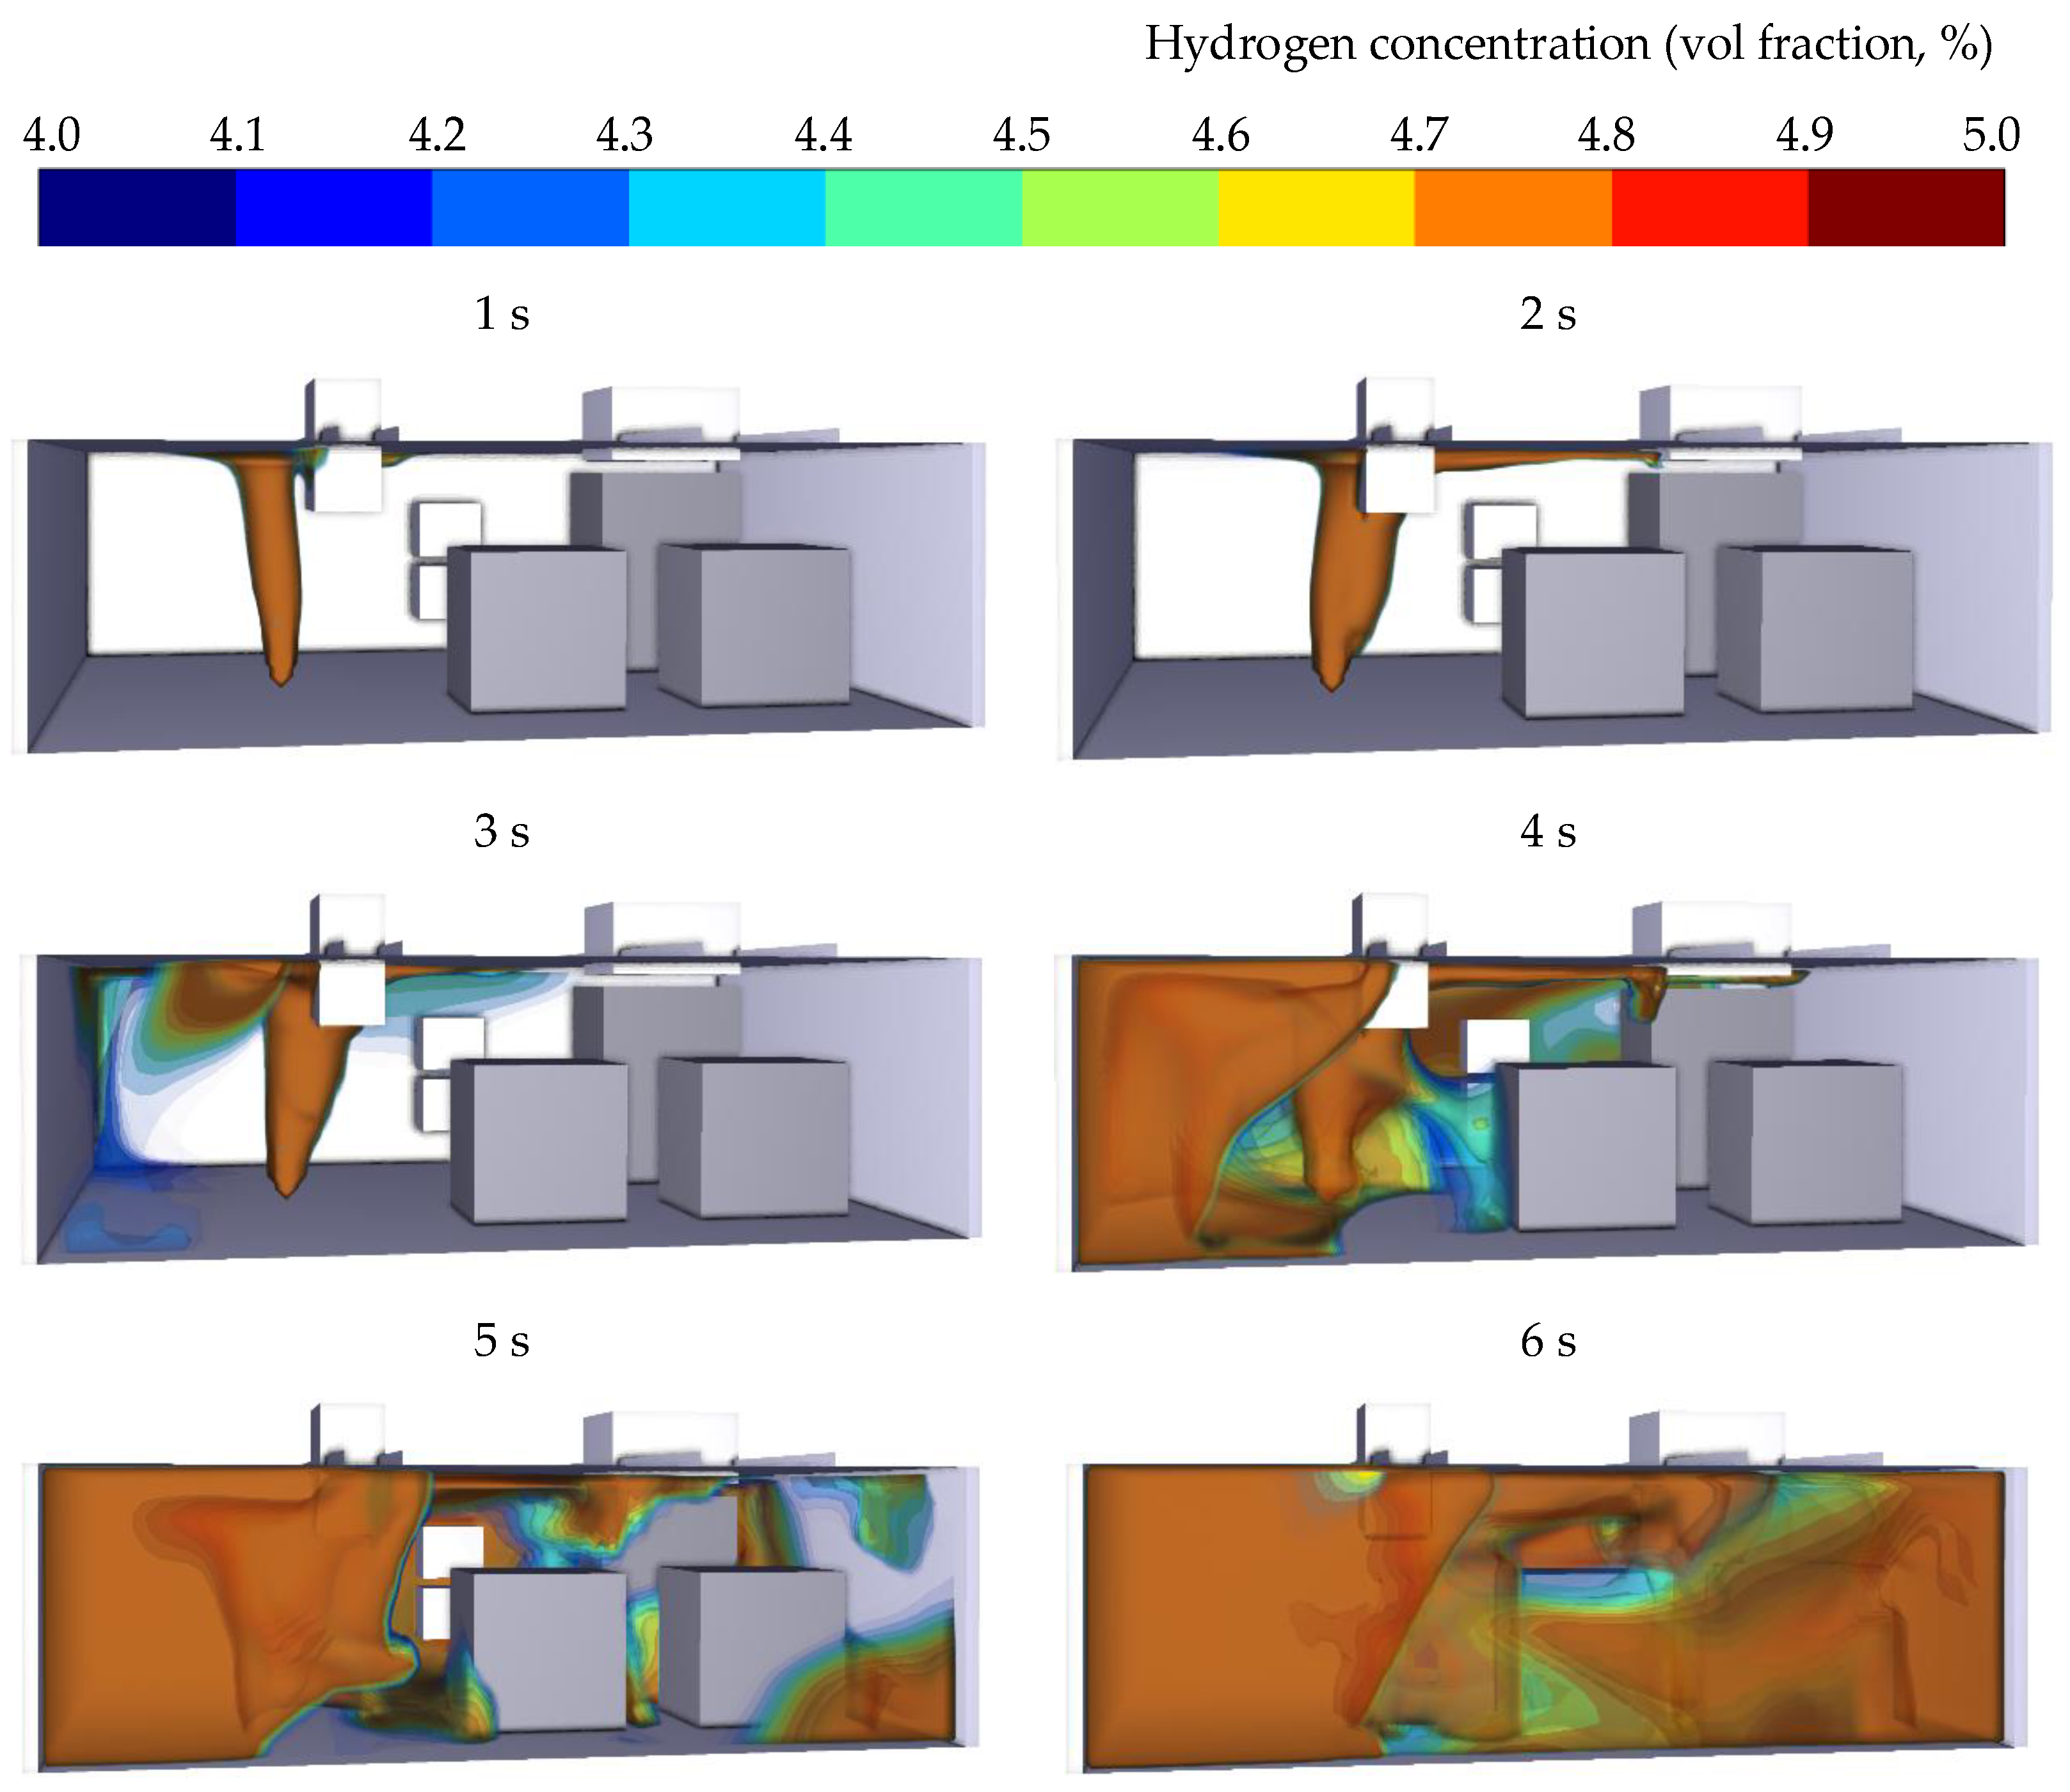
Section 2.2.2). Taking scenario 4 as an example, Figure 8 shows a 3D view of hydrogen gas dispersion, while Figure 9 presents 2D slice views of the XZ and XY planes. In the calculations, hydrogen gas leakage begins from the 20th second to ensure sufficient time to establish a stable negative pressure airflow within the FCR.
From the above figures, it can be seen that when hydrogen leaks upward, a large amount of flammable hydrogen cloud accumulates in the space below the roof of the FCR in a very short time. In less than 1 s, the hydrogen reaches the roof, and then it spreads and flows along the roof. At around the third second, the hydrogen starts to disperse on the rear bulkhead (XZ section), and at this time the hydrogen cloud still has considerable momentum. A clear eddy is formed (XZ section at third second) when the cloud encounters the corner of the bottom of the room. This is consistent with the finding of [65]. According to the XY slice views in Figure 9, after 3 s, the thickness of the hydrogen cloud on the top of the room rapidly increases. At the fifth second, the flammable gas cloud is about to fill the area near the top of the FCR. After 6 s, the concentration of the gas cloud tends to be stable. At this time, except for the ventilation inlet and outlet, the hydrogen concentration in almost all positions in the room reaches 4.0% (LFL). At this time, lighting bulbs and water and thermal management equipment inside the room are within the FGC and may become potential ignition sources. Therefore, it is recommended to avoid arranging the equipment, including non-explosion-proof equipment, equipment that is prone to high temperature, and equipment that is prone to generating sparks, which might be ignition sources inside the FCR, as much as possible.
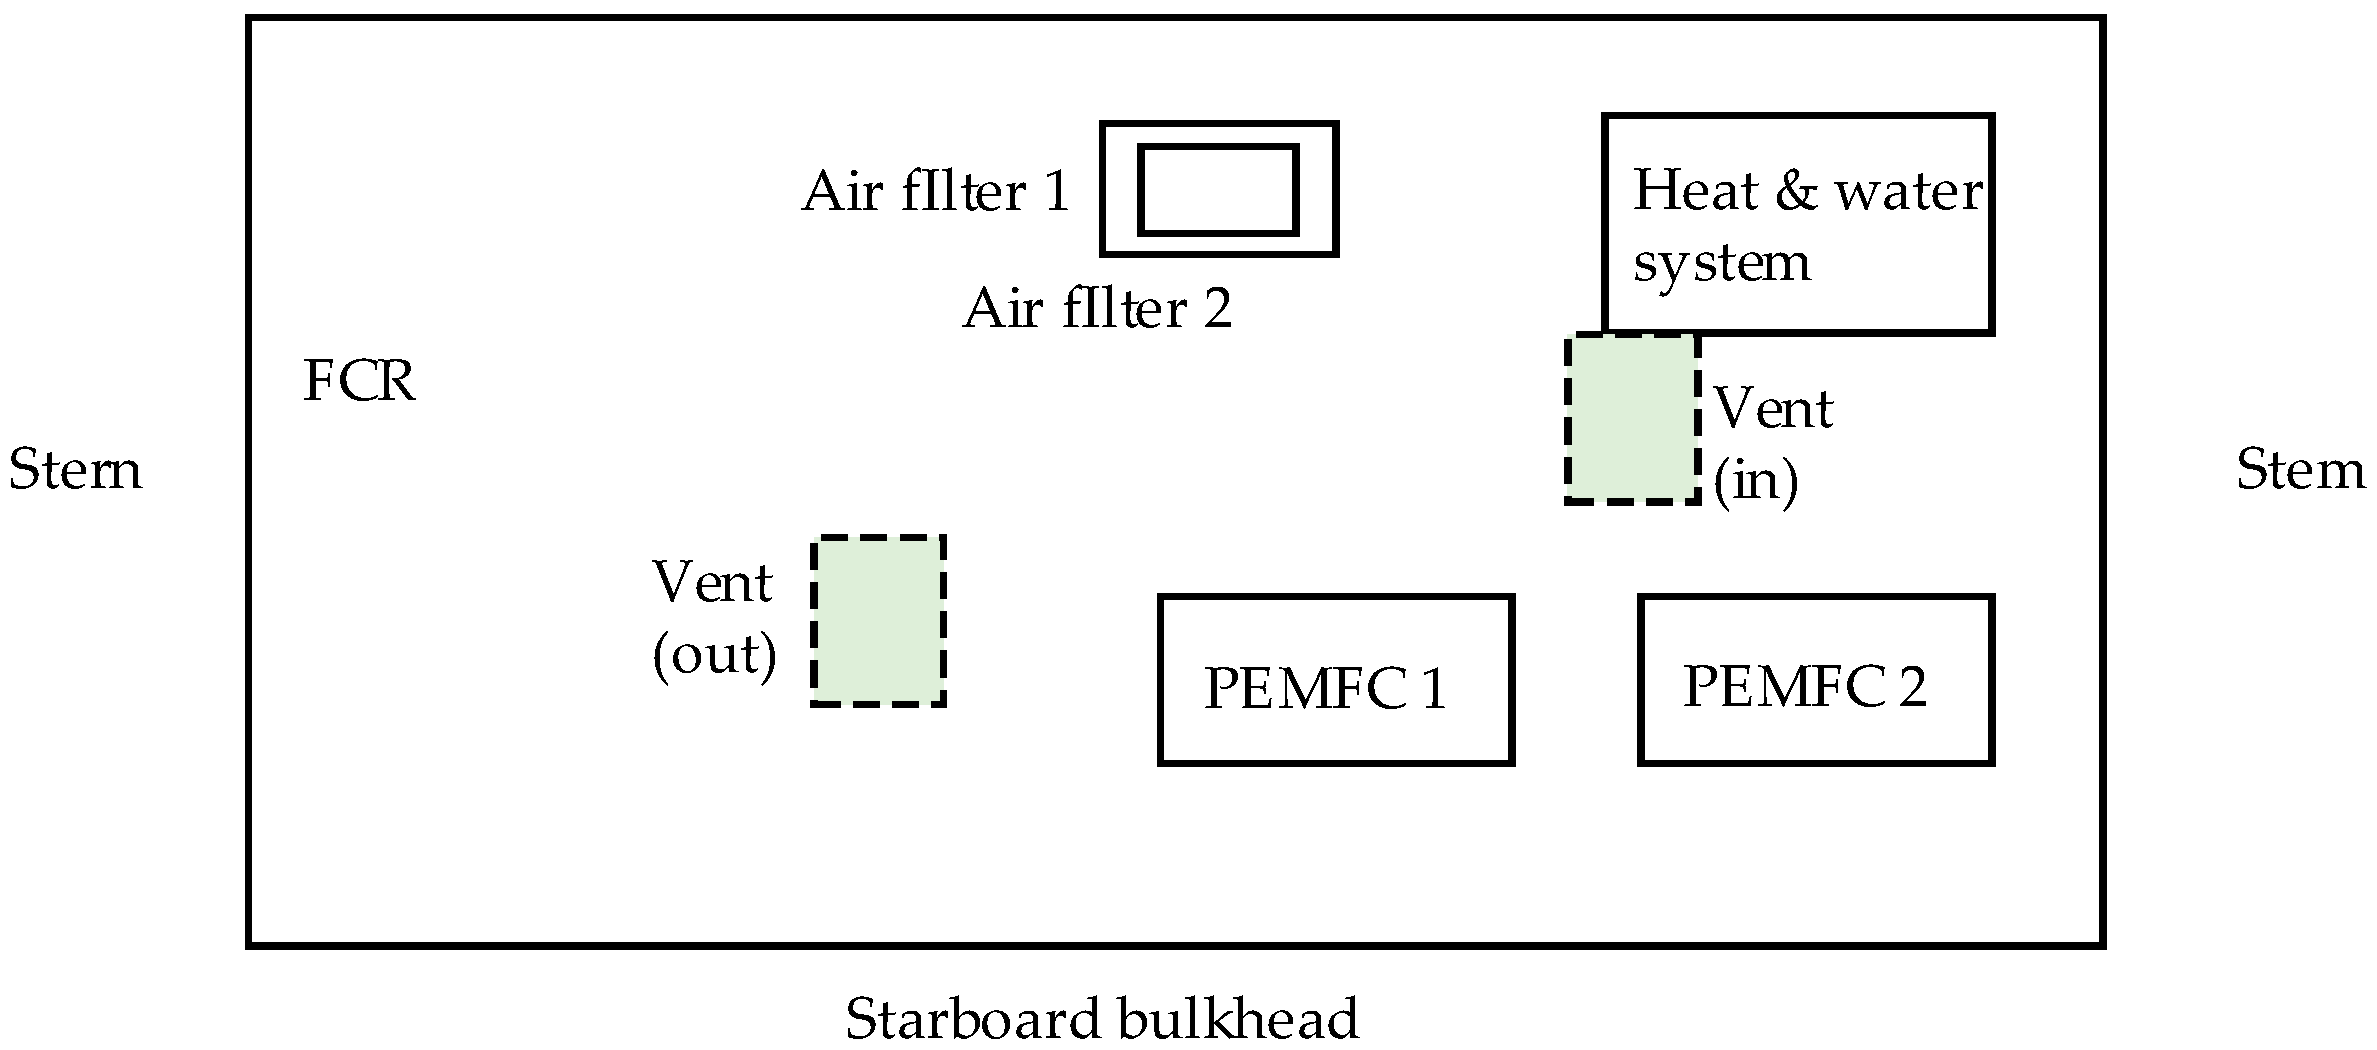
In the time interval between the second and sixth second, the concentration of hydrogen in the area between the room roof ventilation inlet and outlet is consistently higher than that in other locations. This phenomenon is due to the formation of an air trap between the downward extension of the ventilation inlet duct (approximately 400 mm in height, as shown in Figure 7) and the outlet, which impedes hydrogen discharge from the FCR. This phenomenon should be taken into consideration in the design of ventilation systems.

4.2. Influence of Different Leakage Diameters on Hydrogen Concentration

Taking scenarios 1, 2, 3, and 4 as examples, the maximum hydrogen concentrations (Volume %, m3/m3) achieved after continuous leakage are 0.3%, 2.8%, 7.5%, and 24.8%, respectively, with the earliest detection times at 83s, 83s, 88s, and 94s. MP4, MP11, and MP20 firstly detect hydrogen concentrations of 0.8%, 1.6%, and 4.0%. Figure 10 shows the hydrogen concentration for the four scenarios, with MP11 used to show concentration changes in Figure 11.
The hydrogen concentration trend in the FCR is consistent regardless of the leakage diameter, as shown in Figure 10. The maximum hydrogen concentration in the FCR decreased with decreasing leakage diameter, as seen in Figure 11. MP4 and MP20 show fluctuating hydrogen concentrations due to their proximity to the air inlet, which is affected by wind speed (the speed of the air inlet on this vessel is about 6.9 m/s).
The maximum hydrogen concentration of scenarios 1 and 2 is below the hydrogen LFL (4.0%), indicating that FGC explosion accidents will not occur if leaking hydrogen is not immediately ignited. FGC explosion is impossible in the FCR when there is single-point leakage in the hydrogen pipeline with an inner diameter not exceeding 3 mm. Effective mechanical ventilation systems of the extraction type and choosing a small enough inner diameter of the hydrogen pipelines can prevent FGC explosion in the FCR, but they are limited by engineering practicality.
According to Figure 11, in scenarios 3 and 4, the maximum hydrogen concentration exceeds 4.0%, and FGC explosion is possible. The hydrogen concentration increases linearly during the initial leakage stage, indicating the significant impact of the leakage diameter on hydrogen concentration. For example, in scenario 4, reducing the leakage diameter delayed the alarm time (alarm signal at 0.8%), shutdown time (shutdown signal at 1.6%), and the formation of FGC. Reducing the diameter of the hydrogen pipeline can provide more time for emergency rescue during the leakage event.
Despite a high ventilation rate of 5000 m3/h (approximately 90 air changes per h) in the FCR, the hydrogen concentration in the enclosed space remained constant due to continuous hydrogen leakage. However, appropriate mechanical ventilation can effectively control the increase in hydrogen concentration. These findings align with previous research by Lee et al. [62,66]. Apparently, a combination of mechanical ventilation and leak source closure is necessary to reduce hydrogen concentration in enclosed spaces.

4.3. Detection Time at Monitoring Points

To determine the locations of the hydrogen detectors inside the FCR, the time points and corresponding monitoring points when the hydrogen concentration first reached 0.8% and 1.6% were identified from 32 monitoring points in the 20 scenarios above (Table 7). When the diameter of the leakage hole is 1 mm, the maximum hydrogen concentration is 0.3%, which is lower than the LFL. Thus, the effect of this leakage situation on the arrangement of monitoring points is ignored. 
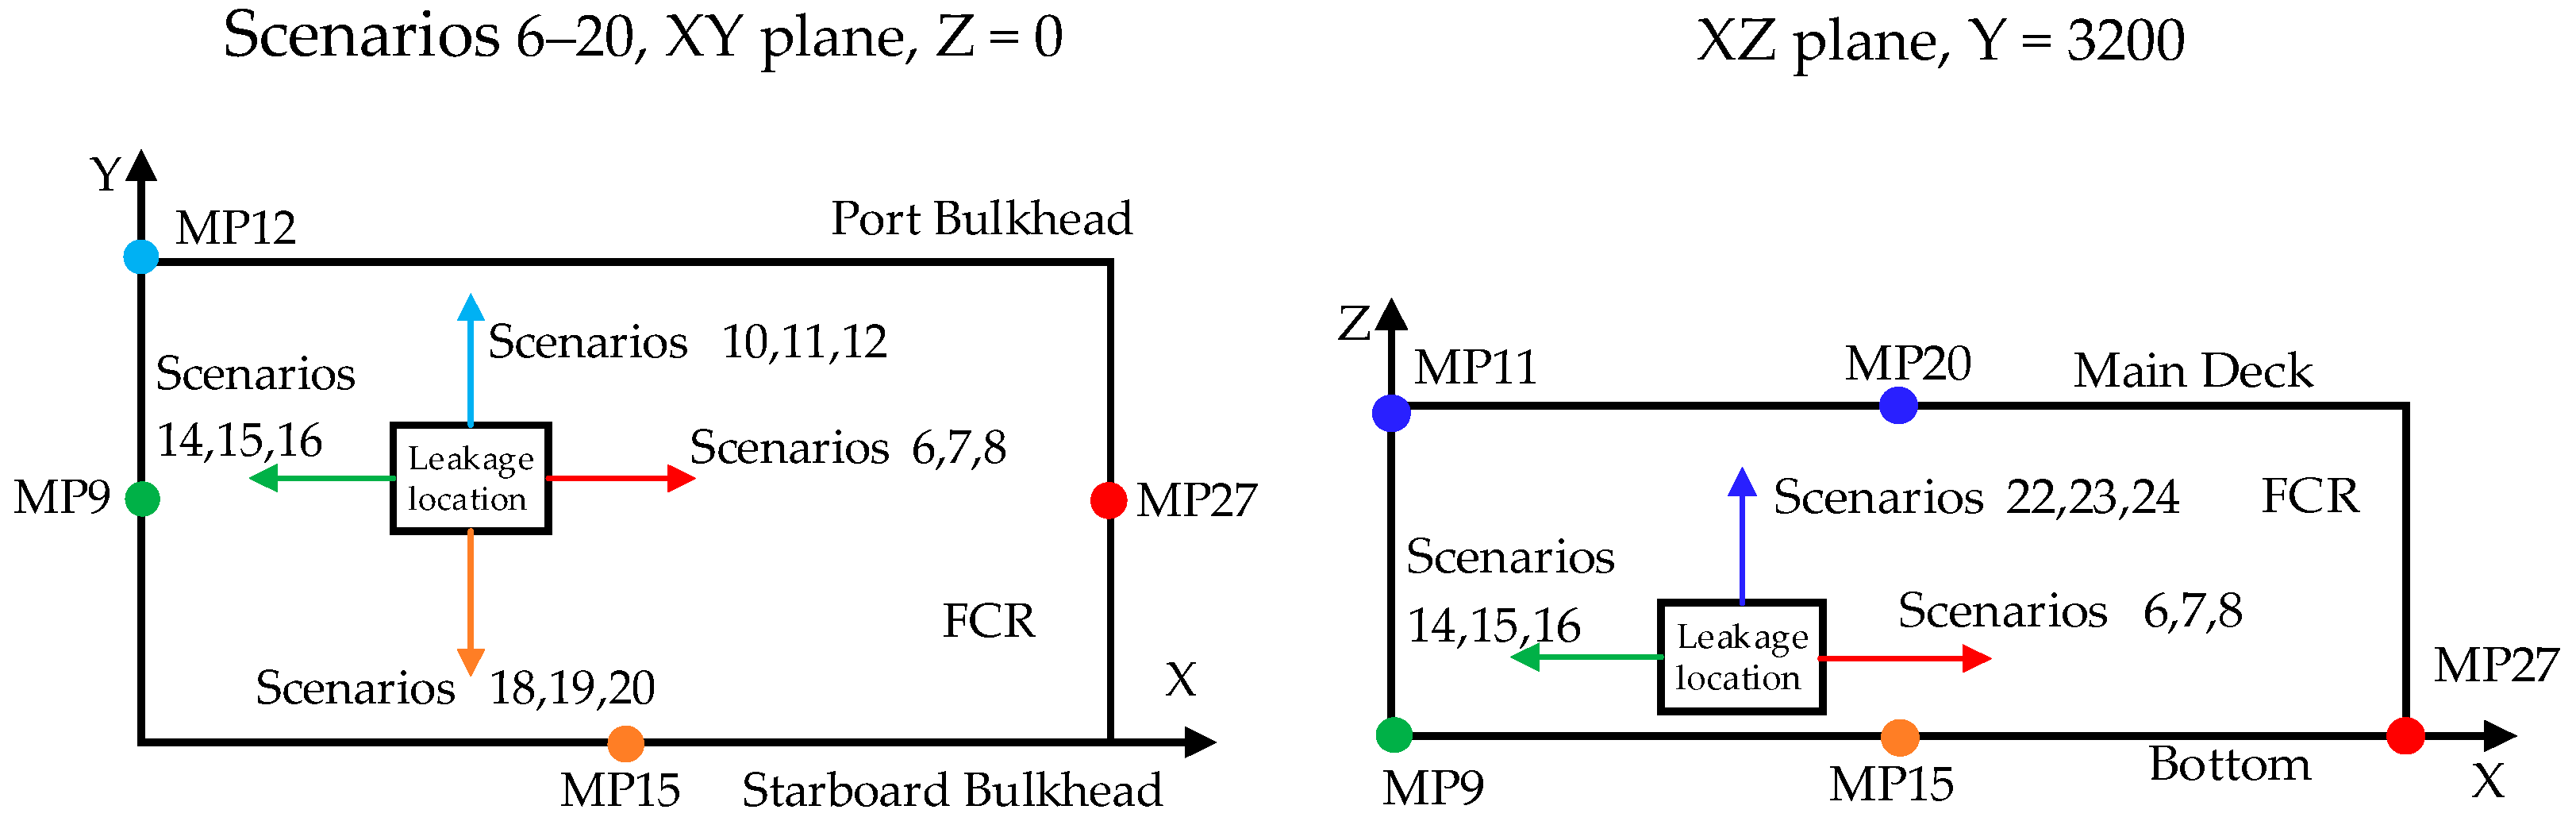
Figure 12 shows the monitoring points identified for different leakage directions. The monitoring points corresponding to scenarios 6–20 are located on the bottom (XY plane), while those corresponding to scenarios 22–24 are located on the portside wall (XZ plane).
In scenarios 6–20, the same monitoring point was identified for the first time when the hydrogen concentration reached 0.8% and 1.6% for the same leakage direction, regardless of the diameters of leakage holes. The identified monitoring points were located near the leakage points’ projection points on the plane facing the leakage direction. This finding provides a basis for the arrangement of hydrogen detectors. It should be noted that the monitoring points in scenarios 10, 11, and 12 were inconsistent with the above finding. The reason is that two air filters (Figure 7) were installed near the point MP21 closest to the leakage source, which hindered the free dispersion of the hydrogen cloud to monitoring point MP21. Therefore, devices that hinder gas dispersion should be avoided when designing the hydrogen detector positions in detailed ship design. In addition, the monitoring points obtained in scenarios 23 and 24 were slightly different from the overall finding mentioned above, but the time difference was less than 0.5 s. From an engineering design perspective, this does not violate the principle of the hydrogen detector arrangement obtained above.

4.4. Safety Design Recommendations

Based on the above analysis, the following design recommendations are proposed:
Hydrogen fuel cell room
  • Potential ignition sources, including non-explosion-proof electrical equipment, equipment prone to generating high temperatures, and equipment that may produce sparks, should be avoided as much as possible inside the room. If unavoidable, it should be placed as far away as possible from the possible hydrogen leak sources.
  • The lowest position of the ventilation duct inside the room should be kept as close to the top plane as possible to avoid forming an air trap.
Hydrogen Gas Supply System
  • The inner diameter of the hydrogen supply pipeline inside the fuel cell room should be reduced as much as possible without affecting the performance of the fuel cell to reduce the diameters of the potential leak holes.
  • The smaller inner diameter of the HGSS in the fuel cell room can significantly decrease the likelihood of FGC, enhancing the overall hydrogen safety of the FCR. Furthermore, if there is a single point of leakage in the hydrogen pipeline with an inner diameter of less than 3 mm, FGC cannot occur within the FCR.
Layout of Hydrogen Detectors
  • Hydrogen detectors should be installed close to potential leak sources such as valves, pipeline joints, and seals. As an alternative, they could be located near the leakage points’ projection points on the plane facing the leakage direction.
  • No obstructions should be present near the hydrogen detectors.

5. Conclusions

This study utilised CFD software to analyse the dispersion behaviour of hydrogen gas after leakage in the FCR of a hydrogen-fuel-cell-powered ship. Based on the findings, safety design recommendations for the ship were proposed, emphasising the importance of paying extra attention to the safe design of the FCR and hydrogen supply system. The safety of the FCR was influenced by factors such as hydrogen pipeline diameter, ventilation, and the presence of hydrogen detectors.
This study found that a smaller leakage diameter can effectively prevent FGC explosions in the FCR. When a hydrogen leak with a diameter of 10 mm occurred, the flammable gas cloud rapidly filled the room, taking only 6 s in this study. It is worth noting that the location of the monitoring point that triggers the hydrogen leak alarm and emergency shutdown of the hydrogen supply is not impacted by the leakage diameter. However, the location is affected by the direction of the leak and the presence of obstructions near the hydrogen detectors.
This study provides quantitative data that can be used to optimise hydrogen safety in hydrogen-fuel-cell-powered ships. However, the investigation did not include the risk associated with high-pressure hydrogen systems with a pressure of 35 MPa; future work will focus on this aspect. Overall, this study provides a reference for the safety design of hydrogen-fuel-cell-powered ships, which is especially relevant given the current early stages of demonstrations for such ships.

Author Contributions

Conceptualization, W.G. and H.F.; methodology, W.G.; validation, W.G., L.C. and J.C. (Jiaolong Cao); formal analysis, W.G., L.C. and H.F.; resources, H.F. and L.C.; data and drawing, W.G., L.C. and J.C. (Ju Chen); writing—original draft preparation, W.G., H.F. and L.C.; writing—review and editing, H.F. and J.C. (Ju Chen); project administration, H.F. and W.G. All authors have read and agreed to the published version of the manuscript.

Funding

This research received no external funding.

Institutional Review Board Statement

Not applicable.

Informed Consent Statement

Not applicable.

Data Availability Statement

The data that support the findings of this study are available from the corresponding author upon reasonable request.

Acknowledgments

The authors would like to express their gratitude to the Wuhan Institute of Marine Electric Propulsion and Jianglong Shipbuilding Co., Ltd. for their assistance.

Conflicts of Interest

The authors declare no conflict of interest.

Abbreviations

CFDComputational fluid dynamics
FCFuel cell
FCRFuel cell room
FGCFlammable gas cloud
FLACSFlame acceleration simulator
HGSSHydrogen gas supply system
HTVHydrogen tank valve
IMOInternational Maritime Organization
LFLLower flammable limit
MPMonitoring point
PEMFCProton exchange membrane fuel cell
PRDPressure Relief Device
Units
kWKilowatt
mmMillimetre
sSecond
Nomenclature
F o , i Flow resistance due to sub-grid obstructions
F w , i Flow resistance due to walls
g Gravity acceleration
G b Buoyancy
G o Sub grid objects
G s Flow shear stress
G w Wall shear stress
h Enthalpy
p Pressure
Q ˙ Heat flow rate
R fuel Fuel reaction rate
u Velocity
VVolume
xSpatial coordinate
ySpatial coordinate
zSpatial coordinate
Y fuel Fuel mass fraction
Greek symbols
β Transformation factor in the model
β j Area porosity in j-direction
β v Volume porosity
k Turbulent kinetic energy
εDissipation of turbulent kinetic energy
μ eff Effective viscosity
ρ Density
σ i j Stress tensor
σ fuel Prandtl–Schmidt number of fuel
Subscripts
i i -direction
j j -direction

References

  1. Lagouvardou, S.; Psaraftis, H.N.; Zis, T. A Literature Survey on Market-Based Measures for the Decarbonization of Shipping. Sustainability 2020, 12, 3953. [Google Scholar] [CrossRef]
  2. Fan, H.; Enshaei, H.; Jayasinghe, S.G. Formation of Dataset for Fuzzy Quantitative Risk Assessment of LNG Bunkering SIMOPs. Data 2022, 7, 60. [Google Scholar] [CrossRef]
  3. Reusser, C.A.; Pérez Osses, J.R. Challenges for Zero-Emissions Ship. J. Mar. Sci. Eng. 2021, 9, 1042. [Google Scholar] [CrossRef]
  4. Xuan, H.; Liu, Q.; Wang, L.; Yang, L. Decision-Making on the Selection of Clean Energy Technology for Green Ships Based on the Rough Set and TOPSIS Method. J. Mar. Sci. Eng. 2022, 10, 579. [Google Scholar] [CrossRef]
  5. Huang, J.; Fan, H.; Xu, X.; Liu, Z. Life Cycle Greenhouse Gas Emission Assessment for Using Alternative Marine Fuels: A Very Large Crude Carrier (VLCC) Case Study. J. Mar. Sci. Eng. 2022, 10, 1969. [Google Scholar] [CrossRef]
  6. Mallouppas, G.; Yfantis, E.A. Decarbonization in Shipping Industry: A Review of Research, Technology Development, and Innovation Proposals. J. Mar. Sci. Eng. 2021, 9, 415. [Google Scholar] [CrossRef]
  7. Kumar, S.; Baalisampang, T.; Arzaghi, E.; Garaniya, V.; Abbassi, R.; Salehi, F. Synergy of green hydrogen sector with offshore industries: Opportunities and challenges for a safe and sustainable hydrogen economy. J. Clean. Prod. 2023, 384, 135545. [Google Scholar] [CrossRef]
  8. Sohani, A.; Naderi, S.; Torabi, F. Comprehensive comparative evaluation of different possible optimization scenarios for a polymer electrolyte membrane fuel cell. Energy Convers. Manag. 2019, 191, 247–260. [Google Scholar] [CrossRef]
  9. Sohani, A.; Naderi, S.; Torabi, F.; Sayyaadi, H.; Golizadeh Akhlaghi, Y.; Zhao, X.; Talukdar, K.; Said, Z. Application based multi-objective performance optimization of a proton exchange membrane fuel cell. J. Clean. Prod. 2020, 252, 119567. [Google Scholar] [CrossRef]
  10. de-Troya, J.J.; Álvarez, C.; Fernández-Garrido, C.; Carral, L. Analysing the possibilities of using fuel cells in ships. Int. J. Hydrogen Energy 2016, 41, 2853–2866. [Google Scholar] [CrossRef]
  11. Micoli, L.; Coppola, T.; Turco, M. A Case Study of a Solid Oxide Fuel Cell Plant on Board a Cruise Ship. J. Mar. Sci. Appl. 2021, 20, 524–533. [Google Scholar] [CrossRef]
  12. van Biert, L.; Godjevac, M.; Visser, K.; Aravind, P.V. A review of fuel cell systems for maritime applications. J. Power Sources 2016, 327, 345–364. [Google Scholar] [CrossRef] [Green Version]
  13. Inal, O.B.; Deniz, C. Assessment of fuel cell types for ships: Based on multi-criteria decision analysis. J. Clean. Prod. 2020, 265, 121734. [Google Scholar] [CrossRef]
  14. Wang, X.; Zhu, J.; Han, M. Industrial Development Status and Prospects of the Marine Fuel Cell: A Review. J. Mar. Sci. Eng. 2023, 11, 238. [Google Scholar] [CrossRef]
  15. Shakeri, N.; Zadeh, M.; Bremnes Nielsen, J. Hydrogen Fuel Cells for Ship Electric Propulsion: Moving Toward Greener Ships. IEEE Electrif. Mag. 2020, 8, 27–43. [Google Scholar] [CrossRef]
  16. Jeon, H.; Park, K.; Kim, J. Comparison and Verification of Reliability Assessment Techniques for Fuel Cell-Based Hybrid Power System for Ships. J. Mar. Sci. Eng. 2020, 8, 74. [Google Scholar] [CrossRef] [Green Version]
  17. Ghenai, C.; Bettayeb, M.; Brdjanin, B.; Hamid, A.K. Hybrid solar PV/PEM fuel Cell/Diesel Generator power system for cruise ship: A case study in Stockholm, Sweden. Case Stud. Therm. Eng. 2019, 14, 100497. [Google Scholar] [CrossRef]
  18. Stark, C.; Xu, Y.; Zhang, M.; Yuan, Z.; Tao, L.; Shi, W. Study on Applicability of Energy-Saving Devices to Hydrogen Fuel Cell-Powered Ships. J. Mar. Sci. Eng. 2022, 10, 388. [Google Scholar] [CrossRef]
  19. Jeon, H.; Kim, S.; Yoon, K. Fuel Cell Application for Investigating the Quality of Electricity from Ship Hybrid Power Sources. J. Mar. Sci. Eng. 2019, 7, 241. [Google Scholar] [CrossRef] [Green Version]
  20. Wu, P.; Partridge, J.; Bucknall, R. Cost-effective reinforcement learning energy management for plug-in hybrid fuel cell and battery ships. Appl. Energy 2020, 275, 115258. [Google Scholar] [CrossRef]
  21. Baldi, F.; Moret, S.; Tammi, K.; Maréchal, F. The role of solid oxide fuel cells in future ship energy systems. Energy 2020, 194, 116811. [Google Scholar] [CrossRef]
  22. Kistner, L.; Bensmann, A.; Hanke-Rauschenbach, R. Optimal Design of a Distributed Ship Power System with Solid Oxide Fuel Cells under the Consideration of Component Malfunctions. Appl. Energy 2022, 316, 119052. [Google Scholar] [CrossRef]
  23. Seyam, S.; Dincer, I.; Agelin-Chaab, M. An innovative study on a hybridized ship powering system with fuel cells using hydrogen and clean fuel blends. Appl. Therm. Eng. 2023, 221, 119893. [Google Scholar] [CrossRef]
  24. Wang, X.; Mi, X.; Lv, X.; Weng, Y. Fast and stable operation approach of ship solid oxide fuel cell-gas turbine hybrid system under uncertain factors. Int. J. Hydrogen Energy 2022, 47, 21472–21491. [Google Scholar] [CrossRef]
  25. Oh, D.; Cho, D.-S.; Kim, T.-W. Design and evaluation of hybrid propulsion ship powered by fuel cell and bottoming cycle. Int. J. Hydrogen Energy 2023, 48, 8273–8285. [Google Scholar] [CrossRef]
  26. Chen, H.; Zhang, Z.; Guan, C.; Gao, H. Optimization of sizing and frequency control in battery/supercapacitor hybrid energy storage system for fuel cell ship. Energy 2020, 197, 117285. [Google Scholar] [CrossRef]
  27. Royle, M.; Willoughby, D. The safety of the future hydrogen economy. Process Saf. Environ. Prot. 2011, 89, 452–462. [Google Scholar] [CrossRef]
  28. Crowl, D.A.; Jo, Y.-D. The hazards and risks of hydrogen. J. Loss Prev. Process Ind. 2007, 20, 158–164. [Google Scholar] [CrossRef]
  29. Mazloomi, K.; Gomes, C. Hydrogen as an energy carrier: Prospects and challenges. Renew. Sustain. Energy Rev. 2012, 16, 3024–3033. [Google Scholar] [CrossRef]
  30. San Marchi, C.; Hecht, E.S.; Ekoto, I.W.; Groth, K.M.; LaFleur, C.; Somerday, B.P.; Mukundan, R.; Rockward, T.; Keller, J.; James, C.W. Overview of the DOE hydrogen safety, codes and standards program, part 3: Advances in research and development to enhance the scientific basis for hydrogen regulations, codes and standards. Int. J. Hydrogen Energy 2017, 42, 7263–7274. [Google Scholar] [CrossRef] [Green Version]
  31. Lacome, J.M.; Jamois, D.; Perrette, L.; Proust, C.H. Large-scale hydrogen release in an isothermal confined area. Int. J. Hydrogen Energy 2011, 36, 2302–2312. [Google Scholar] [CrossRef] [Green Version]
  32. Khalil, Y.F. A probabilistic visual-flowcharting-based model for consequence assessment of fire and explosion events involving leaks of flammable gases. J. Loss Prev. Process Ind. 2017, 50, 190–204. [Google Scholar] [CrossRef]
  33. Chen, P.S.-L.; Fan, H.; Enshaei, H.; Zhang, W.; Shi, W.; Abdussamie, N.; Miwa, T.; Qu, Z.; Yang, Z. A review on ports’ readiness to facilitate international hydrogen trade. Int. J. Hydrogen Energy 2023. [Google Scholar] [CrossRef]
  34. Suzuki, T.; Shiota, K.; Izato, Y.-I.; Komori, M.; Sato, K.; Takai, Y.; Ninomiya, T.; Miyake, A. Quantitative risk assessment using a Japanese hydrogen refueling station model. Int. J. Hydrogen Energy 2021, 46, 8329–8343. [Google Scholar] [CrossRef]
  35. Brzezińska, D. Hydrogen Dispersion and Ventilation Effects in Enclosures under Different Release Conditions. Energies 2021, 14, 4029. [Google Scholar] [CrossRef]
  36. Han, U.; Oh, J.; Lee, H. Safety investigation of hydrogen charging platform package with CFD simulation. Int. J. Hydrogen Energy 2018, 43, 13687–13699. [Google Scholar] [CrossRef]
  37. Kim, S.J.; Lee, H.H.; Park, S.W.; Baeg, D.Y.; Kim, J.H.; Seo, J.K. Blast Loading Profile of Gaseous Hydrogen in Confined Space Under Various Leak Conditions. In Proceedings of the ASME 2022 41st International Conference on Ocean, Offshore and Arctic Engineering, Hamburg, Germany, 5–10 June 2022. [Google Scholar]
  38. Klebanoff, L.E.; Pratt, J.W.; LaFleur, C.B. Comparison of the safety-related physical and combustion properties of liquid hydrogen and liquid natural gas in the context of the SF-BREEZE high-speed fuel-cell ferry. Int. J. Hydrogen Energy 2017, 42, 757–774. [Google Scholar] [CrossRef] [Green Version]
  39. Li, F.; Yuan, Y.; Yan, X.; Malekian, R.; Li, Z. A study on a numerical simulation of the leakage and diffusion of hydrogen in a fuel cell ship. Renew. Sustain. Energy Rev. 2018, 97, 177–185. [Google Scholar] [CrossRef] [Green Version]
  40. Mao, X.; Ying, R.; Yuan, Y.; Li, F.; Shen, B. Simulation and analysis of hydrogen leakage and explosion behaviors in various compartments on a hydrogen fuel cell ship. Int. J. Hydrogen Energy 2021, 46, 6857–6872. [Google Scholar] [CrossRef]
  41. Park, S.W.; Kim, J.H.; Seo, J.K. Explosion Characteristics of Hydrogen Gas in Varying Ship Ventilation Tunnel Geometries: An Experimental Study. J. Mar. Sci. Eng. 2022, 10, 532. [Google Scholar] [CrossRef]
  42. Yuan, Y.; Wu, S.; Shen, B. A numerical simulation of the suppression of hydrogen jet fires on hydrogen fuel cell ships using a fine water mist. Int. J. Hydrogen Energy 2021, 46, 13353–13364. [Google Scholar] [CrossRef]
  43. IMO. Interim Guidelines for the Safety of Ships Using Fuel Cell Power Installations; IMO: London, UK, 2022. [Google Scholar]
  44. Chen, L.; Guan, W. Safety Design and Engineering Solution of Fuel Cell Powered Ship in Inland Waterway of China. World Electr. Veh. J. 2021, 12, 202. [Google Scholar] [CrossRef]
  45. Feng, Y.; Cao, J.; Zhang, Y.; Jin, D. Safety Analysis and Risk Control of Shore-Based Bunkering Operations for Hydrogen Powered Ships. World Electr. Veh. J. 2021, 12, 162. [Google Scholar] [CrossRef]
  46. Zhao, Y.; Liu, Y.; Liu, G.; Yang, Q.; Li, L.; Gao, Z. Air and hydrogen supply systems and equipment for PEM fuel cells: A review. Int. J. Green Energy 2021, 19, 331–348. [Google Scholar] [CrossRef]
  47. Wang, X.; Zhang, C.; Gao, W. Risk assessment of hydrogen leakage in diesel hydrogenation process. Int. J. Hydrogen Energy 2022, 47, 6955–6964. [Google Scholar] [CrossRef]
  48. Saffers, J.B.; Molkov, V.V. Hydrogen safety engineering framework and elementary design safety tools. Int. J. Hydrogen Energy 2014, 39, 6268–6285. [Google Scholar] [CrossRef]
  49. Lach, A.W.; Gaathaug, A.V.; Vaagsaether, K. Pressure peaking phenomena: Unignited hydrogen releases in confined spaces—Large-scale experiments. Int. J. Hydrogen Energy 2020, 45, 32702–32712. [Google Scholar] [CrossRef]
  50. Kobayashi, H.; Naruo, Y.; Maru, Y.; Takesaki, Y.; Miyanabe, K. Experiment of cryo-compressed (90-MPa) hydrogen leakage diffusion. Int. J. Hydrogen Energy 2018, 43, 17928–17937. [Google Scholar] [CrossRef]
  51. Lan, H.; Wang, G.; Zhao, K.; He, Y.; Zheng, T. Review on the Hydrogen Dispersion and the Burning Behavior of Fuel Cell Electric Vehicles. Energies 2022, 15, 7295. [Google Scholar] [CrossRef]
  52. Li, Y.; Hou, X.; Wang, C.; Wang, Q.; Qi, W.; Li, J.; Zhang, X. Modeling and analysis of hydrogen diffusion in an enclosed fuel cell vehicle with obstacles. Int. J. Hydrogen Energy 2022, 47, 5745–5756. [Google Scholar] [CrossRef]
  53. Middha, P.; Hansen, O.R.; Grune, J.; Kotchourko, A. CFD calculations of gas leak dispersion and subsequent gas explosions: Validation against ignited impinging hydrogen jet experiments. J. Hazard. Mater. 2010, 179, 84–94. [Google Scholar] [CrossRef]
  54. Lu, T.; Gong, J. Affecting mechanism of partition boards on hydrogen dispersion in confined space with symmetrical lateral openings. Int. J. Hydrogen Energy 2021, 46, 38944–38958. [Google Scholar] [CrossRef]
  55. Belova, O.V.; Zorina, I.G. Validation study of gas mixture propagation in hydrogen safety applications. In Proceedings of the International Conference on Science and Applied Science (Icsas2020), Omsk, Russia, 26–29 February 2020. [Google Scholar]
  56. Middha, P.; Hansen, O.R.; Storvik, I.E. Validation of CFD-model for hydrogen dispersion. J. Loss Prev. Process Ind. 2009, 22, 1034–1038. [Google Scholar] [CrossRef] [Green Version]
  57. Houf, W.G.; Evans, G.H.; Ekoto, I.W.; Merilo, E.G.; Groethe, M.A. Hydrogen fuel-cell forklift vehicle releases in enclosed spaces. Int. J. Hydrogen Energy 2013, 38, 8179–8189. [Google Scholar] [CrossRef]
  58. Ekoto, I.W.; Houf, W.G.; Evans, G.H.; Merilo, E.G.; Groethe, M.A. Experimental investigation of hydrogen release and ignition from fuel cell powered forklifts in enclosed spaces. Int. J. Hydrogen Energy 2012, 37, 17446–17456. [Google Scholar] [CrossRef]
  59. Moen, A.; Mauri, L.; Narasimhamurthy, V.D. Comparison of k-ε models in gaseous release and dispersion simulations using the CFD code FLACS. Process Saf. Environ. Prot. 2019, 130, 306–316. [Google Scholar] [CrossRef]
  60. Wang, Q.; Zhai, C.; Gong, J.; Wang, Z.; Jiang, J.; Zhou, Y. Analytical and numerical predictions of hydrogen gas flow induced by wall and corner leakages in confined space. Int. J. Hydrogen Energy 2020, 45, 6848–6862. [Google Scholar] [CrossRef]
  61. Wang, Q.; Zhai, C.; Gong, J.; Jiang, J.; Wang, Z.; Zhou, Y. Estimating leaked hydrogen gas flow in confined space through coupling zone model and point source buoyancy plume theory. Int. J. Hydrogen Energy 2019, 44, 15644–15656. [Google Scholar] [CrossRef]
  62. Ji, H.W.; Lee, H.; Hwang, I.; Jang, H. Safe Ventilation Methods against Leaks in Hydrogen Fuel Cell Rooms in Homes. Energies 2022, 15, 5434. [Google Scholar] [CrossRef]
  63. Lv, H.; Shen, Y.; Zheng, T.; Zhou, W.; Ming, P.; Zhang, C. Numerical study of hydrogen leakage, diffusion, and combustion in an outdoor parking space under different parking configurations. Renew. Sustain. Energy Rev. 2023, 173, 113093. [Google Scholar] [CrossRef]
  64. Lucas, M.; Skjold, T.; Hisken, H. Computational fluid dynamics simulations of hydrogen releases and vented deflagrations in large enclosures. J. Loss Prev. Process Ind. 2020, 63, 103999. [Google Scholar] [CrossRef]
  65. Huang, T.; Zhao, M.; Ba, Q.; Christopher, D.M.; Li, X. Modeling of hydrogen dispersion from hydrogen fuel cell vehicles in an underground parking garage. Int. J. Hydrogen Energy 2022, 47, 686–696. [Google Scholar] [CrossRef]
  66. Lee, I.; Lee, M.C. A study on the optimal design of a ventilation system to prevent explosion due to hydrogen gas leakage in a fuel cell power generation facility. Int. J. Hydrogen Energy 2016, 41, 18663–18686. [Google Scholar] [CrossRef]
Figure 1. Hydrogen leakage event tree in enclosed space or confined space.
Jmse 11 00651 g001
Figure 2. Framework of this study.
Jmse 11 00651 g002
Figure 3. General arrangement of the “San Xia Qing Zhou 1”.
Jmse 11 00651 g003
Figure 4. Top view of arrangement in fuel cell room.
Jmse 11 00651 g004
Figure 5. Hydrogen gas supply system.
Jmse 11 00651 g005
Figure 6. Comparison of the simulation results and the experimental results.
Jmse 11 00651 g006
Figure 7. Three-dimensional view of the grid sizes, gas monitoring points on the YZ plane (X = 0.1 m), and internal equipment in the fuel cell room.
Jmse 11 00651 g007
Figure 8. Three-dimensional views of hydrogen gas dispersion in the fuel cell room at different times from 1 s to 6 s. (the times represent the seconds after the start of hydrogen leakage).
Jmse 11 00651 g008
Figure 9. Two-dimensional slice views of hydrogen gas dispersion in the fuel cell room (on the XZ and XY plane) at different times from 1 s to 6 s (the times represent the seconds after the start of hydrogen leakage).
Jmse 11 00651 g009
Figure 10. Changes in hydrogen concentration at MP4, MP11, and MP20 in scenarios 1, 2, 3, and 4. (a) Scenario 1 (leakage diameter = 1 mm); (b) Scenario 2 (leakage diameter = 3 mm); (c) Scenario 3 (leakage diameter = 5 mm); (d) Scenario 4 (leakage diameter = 10 mm).
Jmse 11 00651 g010
Figure 11. Hydrogen concentration at MP11 for different leak diameters.
Jmse 11 00651 g011
Figure 12. Monitoring points identified for different leakage directions.
Jmse 11 00651 g012
Table 1. General arrangement of “San Xia Qing Zhou 1”.
Overall Length49.90 mPropulsionTwo Rudder Propellers
Depth3.2 mPower of FC560 kW
Breadth10.40 mLithium battery packs1806 kWh
Draught1.85 mNominal propeller power2 × 500 kW
Crew and passenger80 PMaximum speed28 km/h (15.12 knots)
Table 2. Reasons for hydrogen leakage in hydrogen gas supply system.
Valve LeakagePipeline Leakage
  • Improper transportation and storage of valves
  • The machining accuracy of pipe joint is too low
  • Valve’s uneven wear during use
  • The surface finish of pipe joint does not meet the requirements
  • Impurities cause scratches on the sealing surface
  • Poor expansion welding technology
  • The symmetry of flange is poor in installation
  • Workers did not follow the installation process
  • Loose fastening sleeve or thread
  • Accidental collision of pipeline
  • Failure of sleeve joints or threaded joints
  • Pipeline safety protection measures are not in place
  • Uneven pre-tightening force on the sleeve or thread
  • Weld cracking
  • Aging of valves filler
  • The pre-tightening force on the sleeve or thread is too small
Table 3. Environmental parameters and ventilation parameters of fuel cell room.
Environmental ParametersVentilation Parameters of FCR
Standard atmospheric pressure101,325 PaMechanical exhaust Air quantity: 5000 m3/h,
Wind pressure: 390 Pa
Heat radiation intensity0 wVentilation Natural inlet
Environment temperature15 °CAtmospheric stabilityF
Table 4. Dimensions and locations of the equipment in the fuel cell room.
Equipment Dimensions (mm)Locations (mm)
LengthWidthHeightXYZ
No. 1 FC1200650120031007000
No. 2 FC1200650120049007000
Heat and water system13007001800470020000
No. 1 air filter60030050032002700400
No. 2 air filter600300500320027001000
Vent (out)400500-20009001500
Vent (in)1000500-450013001900
Note: the lower left corner of the fuel cell room is the origin of coordinates (0, 0, 0), and the space position (X, Y, Z) is the vertex of the equipment near the origin of coordinates.
Table 5. Leakage scenarios and parameters.
ScenariosLeakage Location (mm)Leakage DirectionLeakage Time (s)Leakage Diameter (mm)
XYZ
117001400100Upward1001
217001400100Upward1003
317001400100Upward1005
417001400100Upward10010
527501800500Stem401
627501800500Stem403
727501800500Stem405
827501800500Stem4010
922002150500Port401
1022002150500Port403
1122002150500Port405
1222002150500Port4010
1316501750500Stern401
1416501750500Stern403
1516501750500Stern405
1616501750500Stern4010
1722001350500Starboard401
1822001350500Starboard403
1922001350500Starboard405
2022001350500Starboard4010
2122001750850Upward401
2222001750850Upward403
2322001750850Upward405
2422001750850Upward4010
Table 6. Coordinates of the gas monitoring points.
MPXYZMPXYZ
MP1500015502000MP1732501001900
MP2310013501250MP1832501600100
MP3490013501250MP19325016001000
MP4220011502000MP20325016001900
MP5470020001850MP2132503100100
MP6100100100MP22325031001000
MP71001001000MP23325031001900
MP81001001900MP246400100100
MP91001600100MP2564001001000
MP1010016001000MP2664001001900
MP1110016001900MP2764001600100
MP121003100100MP28640016001000
MP1310031001000MP29640016001900
MP1410031001900MP3064003100100
MP153250100100MP31640031001000
MP1632501001000MP32640031001900
Table 7. Time points and corresponding monitoring points when the hydrogen concentration first reached 0.8% and 1.6% in scenarios 5–24.
ScenariosLeakage Direction Leakage Dimension 0.8% Vol1.6% Vol
Time (s)Monitoring PointTime (s)Monitoring Point
5Stem1 mm----
63 mm6.511MP2718.236MP27
75 mm1.191MP274.055MP27
810 mm0.363MP270.375MP27
9Port1 mm----
103 mm5.442MP1216.88MP12
115 mm0.795MP123.084MP12
1210 mm0.332MP120.344MP12
13Stern1 mm----
143 mm4.811MP916.097MP9
155 mm0.354MP92.487MP9
1610 mm0.172MP90.182MP9
17Starboard1 mm----
183 mm4.791MP1515.44MP15
195 mm0.421MP152.358MP15
2010 mm0.248MP150.253MP15
21Upward1 mm----
223 mm6.486MP1116.853MP11
235 mm1.160MP113.425 (4.024)MP20 (MP11)
2410 mm0.203 (0.356)MP20 (MP11)0.209 (0.368)MP20 (MP11)
Disclaimer/Publisher’s Note: The statements, opinions and data contained in all publications are solely those of the individual author(s) and contributor(s) and not of MDPI and/or the editor(s). MDPI and/or the editor(s) disclaim responsibility for any injury to people or property resulting from any ideas, methods, instructions or products referred to in the content.

